Article

Comparing Social Media Data and Survey Data in Assessing the Attractiveness of Beijing Olympic Forest Park

1
College of Architecture and Landscape Architecture, Peking University, Beijing 100871, China
2
Regal Lloyds International Real Estate Consultants CO., LTD. 19thFl. Tower A, Full-link Plaza, 18 Chaoyangmenwai Ave, Beijing 100020, China
3
Institute of Remote Sensing and Geographical Information Systems, Peking University, Beijing 100871, China
4
Innovation Center for Technology, Beijing Tsinghua Tongheng Urban Planning & Design Institute, 2203 West Tower, No. 1 Qinghe Jiayuan, Qinghe Zhongjie, Haidian, Beijing 100085, China
5
Horticulture and Landscape Architecture Department, Oklahoma State University, Stillwater, OK 74078, USA
*
Author to whom correspondence should be addressed.
Sustainability 2018, 10(2), 382; https://doi.org/10.3390/su10020382
Submission received: 12 December 2017 / Revised: 6 January 2018 / Accepted: 22 January 2018 / Published: 1 February 2018
(This article belongs to the Section Sustainable Urban and Rural Development)

Abstract

:
Together with the emerging popularity of big data in numerous studies, increasing theoretical discussions of the challenges and limitations of such data sources exist. However, there is a clear research gap in the empirical comparison studies on different data sources. The goal of this paper is to use “attractiveness” as a medium to examine the similarity and differences of Social media data (SMD) and survey data in academic research, based on a case study of the Beijing Olympic Forest Park, in Beijing, China. SMD was extracted from two social media platforms and two surveys were conducted to assess the attractiveness of various locations and landscape elements. Data collection, keyword extraction and keyword prioritization were used and compared in the data gathering and analysis process. The findings revealed that SMD and survey data share many similarities. Both data sources confirm that natural ambience is more appreciated than cultural elements, particularly the naturalness of the park. Spaces of practical utility are more appreciated than facilities designed to have cultural meanings and iconic significance. Despite perceived similarities, this study concludes that SMD exhibits exaggerated and aggregated bias. This resulted from the intrinsic character of SMD as volunteered and unstructured data selected through an emotional process rather than from a rational synthesis. Exciting events were reported more often than daily experiences. Reflecting upon the strength and weakness of SMD and survey data, this study would recommend a combined landscape assessment process, which first utilizes SMD to build up an assessment framework, then applies conventional surveys for supplementary and detailed information. This would ultimately result in comprehensive understanding.

1. Introduction

Recently, the emergence of big data has apparently brought new opportunities for landscape research and urban studies. By providing enormous and cost-effective data beyond expensive and labor-intensive on-site observations and surveys, big data have the potential to change the way research is conducted in understanding the surrounding environment and society. Social media data (SMD) is one type of new data source under the umbrella of big data, which is of high volume, variety and velocity [1]. In the United States and Europe, dominant platforms such as Facebook, Twitter, LinkedIn and Pinterest provide the SMD source; while in China the most common SMD platforms include Sina Microblog (www.webo.com), Tencent Wechat (weixin.qq.com), Dazhongdianping (www.dianping.com) and mafengwo (www.mafengwo.cn).
While users can provide comments, share information and communication through these platforms, they also record geo-located information and personal and commutation information, which can be further analyzed. SMD data is often unstructured and can be either textual (direct language and comments) or non-textual (pictures, videos or audio). Capable of reflecting users’ emotion and opinions, SMD has been widely used in a series of studies from different perspectives, such as understanding disasters, demonstrating temporal and spatial patterns of happiness [2], revealing thematic characteristics of places and the meaning of specific locations [3], tracing the patterns of tourists in the city [4] as well as in natural settings [5], depicting urban activities [6] and traffic behaviors [7] and presenting cultural ecosystem services [8]. Photos on Panoramio or other imagery data can be used to visualize environmental perceptions in novel ways [9], including urban perception at a global scale and green urban impressions in Shanghai and Tokyo [10]. The topics and the extent of studies based on SMD have expanded drastically in recent years.
Beyond the popularity of applying SMD and other big data sources in varied research, there are increasing theoretical discussions on the challenges of such data. Scholars from assorted fields have started to ask, “Does big data mean big knowledge?” [11] and “Do the ends justify the means?” [12]. Big data can be “thin data” that only capture the facts but not the context of facts, while small data surveys can provide “thick data” with an assortment of profound information [13]. The interplay of technology, analysis and methodology challenges the use of big data [14]. It is essential to investigate how well SMD can reflect the demands and opinions in the “real world” [15].
Also, despite concerns about personal privacy [16,17,18] and data ownership of social media data [19], how to collect and use social media data in a proper manner relies on further understanding the similarities and differences between social media data and small data from traditional collection procedures including surveys. Big data and small data might just be complementary data sources since they present their own strengths and weaknesses [20]. However, without comparing the research results on the same subjects from distinct data sources, the strengths and weaknesses cannot be fully revealed and understood. Hence, empirical studies focusing on comparisons are urgently needed to fill the gap.
The goal of this paper is to use attractiveness as a medium to examine the strengths and weaknesses of SMD and survey data in understanding park and open space design. Attractiveness has been widely explored based on questionnaire surveys. In general, attractiveness can be considered the capacity of the perceived scene or place to attract people’s attention and appreciation [21,22]. Two groups of studies were found to be precedents of attractiveness research: attractiveness as holistic aspects and attractiveness as composite elements. The former views a place or landscape as a tourist destination and tourism resource. Wu, Xu, & Qiu [23] argued that destination attractiveness refers to the comprehensive aspect of a landscape, including landscape characteristics, infrastructure, services, reputation and perceived temptation to visit a place. In addition, attractiveness also includes facilities, transportation, costs, products and culture [24,25,26,27].
The opposing opinion from landscape research regarded landscape as a collection of attractive components. Many scholars conclude that the physical components of landscape are essential, such as planting [28,29], water [30,31] and terrains [32]. Others infer that participatory activities are critical, including activity characteristics, activity demands and factors influential to behaviors [33,34,35]. Beyond physical factors, some research suggests that personal characteristics and knowledge and familiarity with study sites all affect the evaluation of landscape attractiveness [36,37,38].
Our study utilizes both social media data and survey data to compare their roles in revealing the attractiveness of the Beijing Olympic Forest Park, the largest urban park in Beijing. Three research questions are primarily addressed:
  • What are the most important landscape features and categories that affect the attractiveness of Beijing Olympic Green, based on social media data and traditional survey data respectively?
  • What are the similarities and differences of the results? And why do the differences occur?
  • Is there a framework to better utilize the strength of two different data sources?

2. Materials and Methods

2.1. Study Area

Situated at the northern end of the central historical axis of the city, Beijing Olympic Forest Park is the biggest urban park in Beijing, covering an area of 680 ha (Figure 1). As one of the major projects for the 2008 Beijing Olympic Games, the park design aimed to bridge traditional Chinese landscape arts with contemporary ecological design for a sustainable environment and a multifunctional public park. Culture, ecology and recreation were three key design emphases. A series of themed attractions were designed to carry cultural and historical metaphors, such as Yangshan (Mount Yang), Aohai (Abstruse Sea), the dragon-shaped water system, Tianjing (Haven Environment), Tianyuan (Environment of Superiority) and Linquangaozhi (Terraced Water Symbolizing Forest and Spring).
Ecology and public recreation are encouraged throughout the park to merge people into the midst of nature while preserving nature. A series of service facilities and gathering places exist in the southern portion of the park, including a mountain terrace, artificial wetlands, large water areas, an amphitheater, lawns, jogging trails, camping sites and educational facilities. Landscape experiences are designed to be diverse in this area. The north park is a natural preserve that gives priority to ecological protection and ecological restoration. The regional ecosystems and habitats are regenerated there by creating a gentle sloping terrain, planting selected local species and limiting social disturbance by making few service facilities available. Most social activities of the north park are set at its periphery along main roads. As a major city open space, the park also engages numerous SMD inputs, which are currently available to researchers.

2.2. Research Framework

In order to compare the similarities and differences between SMD and survey data, this study was conducted in three steps: data extraction, keyword extraction and keyword prioritization (Figure 2). First, we explored text responses from SMD using content analysis methods to better understand landscape attractiveness of Beijing Olympic Forest Park. Secondly, questionnaires were distributed during site visits.

2.3. Data Collection

2.3.1. SMD Procedure

Two popular social media platforms in China were selected for the extraction of SMD about Beijing Olympic Forest Park: Dazhongdianping (http://www.dianping.com) and Mafengwo (http://www.mafengwo.cn). Compared with other SMD platforms, these two sites provide opportunities to input long posts. Founded in April 2003 in Shanghai, Dazhongdianping is a website providing independent consumer reviews on local services as well as O2O (online to offline) platform across China. The platform self-reported that as of the third quarter of 2015, it had more than 200 million monthly active users, presented over 100 million user-generated reviews and covered more than 20 million local businesses and sites. Dazhongdianping’s mobile applications have more than 250 million accumulated unique users [39]. Mafengwo was founded in 2006 and focuses on covering information on tourist destinations, which gradually became the leading platform in China for information exchanges of recreation while providing online guided trip and lodging reservations in China. As of February of 2015, Mafengwo had more than 60 million monthly active users, 80% of whom are mobile users [40].
This study used an auto-operation order for a web crawler to collect data from Dazhongdianping and Mafengwo. A total of 5440 posts, covering online comments on Beijing Olympic Forest Park, from April 2013 to October 2015, were extracted for this research. Typical verbal descriptions are shown in Table 1, which transforms user names into user IDs to avoid any intrusion of individual privacy. Our study focused on understanding the attractiveness of Beijing Olympic Forest Park for everyday uses. As SMD included geo-located information, by identifying the locations of SMD, our study excluded all posts outside of Beijing as tourist sight-seeing data.

2.3.2. Survey Procedure

Two surveys were conducted for our study: one preliminary survey and one main survey. The preliminary survey (30 on site and 30 on website) was completed with semi-open questionnaires including a list of at least 20 attractive items in Beijing Forest Olympic Park and personal background information. The goal of the preliminary survey was to identify those keywords/items that were most important for assessing landscape attractiveness of Beijing Forest Olympic Park.
The top 50 most referred-to attractive items identified from the preliminary survey were then used to formulate the detailed questionnaires in our main survey. The question stated, “Here are some features in the Beijing Olympic Park, please rate their attractiveness to you.” Considering most of the SMD analysis is based on texts, the evaluation scale remains minimal in order to be comparative to SMD without any intent for complicated statistical analyses. Participants were asked to rate each item into one of the three categories: attractive, average or not attractive. Two pre-requirements were set for the questionnaire respondents: (1) They must be Beijing residents who have at least visited the park twice; (2) the age range was from 19 to 35. This age group was understood to be representative of social media users in China (about 80%) [41]. we use Surveymonkey (Surveymonkey, San Mateo, CA, USA, https://www.surveymonkey.com/mp/sample-size-calculator/) to calculate our sample size based on following numbers, population size being 200,000,0, confidence Level 90% and margin of error 5%. The calculated sample size is 269. There were 287 questionnaires collected from 10 April to 15 April in 2016, with 243 usable remaining after removing questionnaires from the same IP or those that originated outside Beijing.

2.4. Keyword Extraction

Content analysis was applied to both SMD and survey data in extracting keywords (and also during partial keyword prioritizing), though different techniques were explored for the two different data sources. Content analysis was a common method applied in literature research, which has been used in information science and later was widely promoted in social science. In this study, textual information from SMD and survey data (preliminary survey information) are considered as literature materials ready to be analyzed in terms of their content.

2.4.1. SMD-Based Keyword Extraction

SMD-based keyword extraction starts with the selection of positive texts, given that positive moods are considered fundamental information in acknowledging and inferring landscape attractiveness. This research selects positive text including words like “happy”, “comfortable”, and “beautiful”. Texts with negative emotive responses are excluded, such as “just so-so”, “boring”, “nothing to see”, or other neutral language. Table 2 demonstrates examples of positive, negative and neutral language identified in the study. The total amount of positive texts numbered 3052.
Keywords were extracted from those positive texts by selecting nouns or verbs that recurred frequently. The top 50 most frequently recurring keywords were identified as key elements contributing to park users’ sentimental responses in terms of the landscape attractiveness of Beijing Forest Olympic Park. In the analysis process, we realized that there were some hierarchical relationships among various keywords—for instance some were about physical activities in general but others referred to more detailed information about running and playing. We then construct a hierarchical structure for landscape attractiveness assessment based on manual interpretation and categorization of the top 50 keywords. Table 3 demonstrates the exemplary linkages of textual descriptions to extracted attractive factors and elements.

2.4.2. Keyword Exaction from Survey Data

Our preliminary survey generated keywords directly when participants responded by listing attractive items in Beijing Olympic Park. Similar to SMD, in survey data, the top 50 keywords that recurred more than five times by our 60 participants were extracted. These were primarily verbs and nouns describing park characteristics and activities. These key words were then categorized into attractive factors and elements based on our hierarchical structure for landscape attractiveness assessment.

2.5. Keyword Prioritization

As keywords have been categorized into attractive factors and attractive elements, the keyword prioritization process focuses more on the comparison of attractive factors to generate fundamental similarities and differences in a broader category while avoiding endless listing of different elements. The attractive factors are examined for both their relative importance as well as various “importance clusters”. As there are over 30 elements examined in this study, attractive elements were only examined based on word frequency, a method which has been frequently used in tourism evaluation texts to analyze tourist destination image perception [34,42,43]. The frequency of words represents a tourists’ interests or focus. Similarly, this study analyses word frequency to structure recurring attractive elements, inferring their relative importance. Frequency statistics in COMROST software are explored for SMD and frequency analysis in SPSS is used for survey data.

2.5.1. Factor Prioritization Based on SMD

The attractive factors generated from SMD were further analyzed to prioritize their importance and their relationships based on degree centricity analysis in UNICET software and cluster analysis in SPSS.
Degree centricity is a method of measuring the importance of a node in a complex network, which focuses on the relationship between high frequency words. Zhong [44] has applied this method to reveal tourism destination structures. The framework of landscape attractiveness in a park is not a simple supposition but involves complicated interactions among different factors. The study adopts the concept of degree centricity in network analysis to reflect the importance of various factors in the network. Analysis shows that some factors with high frequency are not important if they are not in contact with the others. To achieve the degree centricity of attractive factors, the following steps were executed: first, organizing the attractiveness factors in texts; second, arranging and counting the factors that have relationship by Bibexcle; third, converting into a relationship matrix of factors; and fourth, obtaining the degree centricity value and generating attractiveness structure by UNICET. After demonstrating the relative importance of different factors from degree centricity analysis, cluster analysis is then executed to classify attractive factors into three levels: core attractive, important attractive and marginal attractive.

2.5.2. Factor Prioritization Based on Survey Data

Data from questionnaire surveys were analyzed using SPSS 19.0. The relative importance of different factors was analyzed by mean ratings based on the questionnaire inquiries which requested three-scales responses to different factors: attractive, average, or not attractive. Next, cluster analysis was again executed for questionnaire data to classify attractive factors into three levels: core attractive, important attractive and marginal attractive.

3. Results

Our study results indicate that Beijing Olympic Forest Park attracts visitors both from Beijing and from outside the city. Based on SMD, 77.8% of online texts (5440) were from Beijing residents and most of them were from the Chaoyang District and Haidian District (Figure 3), areas immediately adjacent to the park. Since this study only focuses on understanding landscape attractiveness based on everyday uses rather than sightseeing, only posts from Beijing residents were further explored and questionnaires were also only distributed to Beijing residents. As there is minimal background information available from SMD, we did not analyze the influence of personal characteristics to attractive assessment in the survey procedure.

3.1. Similarities between SMD and Survey Data

Our study reveals some similar results in both keyword extraction and keyword prioritization for assessing landscape attractiveness based on SMD and survey data. Keyword extraction resulted in a list of 50 keywords that were essentially the same except for a few minor differences—for instance walk vs. walking, fish vs. fishing. In SMD analysis, we selected factors with an eigenvalue centricity higher than 0.1 considering their networked influences on the sentimental feeling people have toward the park. In analyzing the questionnaires, the top 50 most frequently-mentioned keywords are listed. The content and characteristics of these keywords were immensely similar from both analyses. These keywords were then classified into a hierarchical structure. As shown in Table 4, the external components mainly regarded cost (consumption and time cost) and surrounding attractions, while internal components included atmosphere, landscaping, facilities and activities. Time cost means the time the visitors spent on the way from home to the park, which suggests the accessibility of the park. For the 6 attractive components, 15 factors were found to be important: 5 for landscaping (plants, water elements, mountain elements, wetlands and artificial elements), 4 for facilities (physical facilities, recreational facilities and transportation within the park), 2 for activities (physical and recreational), 2 for atmosphere (natural and cultural) and 2 for costs (consumption cost and time cost) and 1 for surroundings. Detailed elements for those factors are also identified. The study reveals a hierarchical structure of landscape attractiveness for public parks.
Keyword prioritization also demonstrates many similar results in the analysis of SMD and conventional surveys (Table 5 and Table 6). Based on frequency and cluster analysis, the natural atmosphere and plants inside were the core attractive factors. Water, recreational activities and cost were also considered important. Facilities, artificial landscaping, grassy mounds and cultural atmosphere held the least attractiveness.
Involvement and exploration in affordable ranges are also essential for park users. In this study, activities, costs and water were consistently expressed as desirable factors. Considering most water landscapes in the park are associated with fish feeding, boat paddling and natural observation activities, it is obvious that explorative and useable factors are more attractive to park users. The attractiveness of activities revealed from the study demonstrates the success of the original design in achieving a multifunctional public park.
In addition, the study reveals that cultural expressions in the original design were not well received by park users. As one of the major projects of the Beijing Olympic Games, the park is endowed with cultural content in design, such as “the harmony between human and nature”, “the axis to nature”, and the “dragon-shaped water system”. These elements seem to enrich the cultural connotation of the design but according to this study, they were not perceivable by the public. SMD analysis reveals few comments about the cultural atmosphere of the park. Likewise, in the survey, users did not consider the cultural atmosphere as an appealing factor in their decision to visit. Cultural atmosphere was the least attractive element in decision-making according to both the SMD and surveys. Many specifically-designed landscape elements are seldom mentioned in either the SMD and survey data, especially those with cultural connotation, such as Tianjing (Heaven Environment), Tianyuan (Environment of Superiority) and Linquangaozhi (Terraced Water Symbolizing Forest and Spring).

3.2. Differences between SMD and Survey Data

Beyond the many similarities, there are some different results demonstrated in our study. There are three factors with noticeable disparity in attractiveness between the two methods, including costs, surroundings and physical activities (Table 6).

3.2.1. Key Differences in Attractive Factors

Costs

In the questionnaire, the appeal of cost factors (consumption cost and time cost) to visitors was promoted with greater importance. The time cost suggests the importance of accessibility in the attractiveness of parks [45]. Consumption cost was the foremost attractiveness element with time cost elements also becoming more important than physical activities in the second class of fair attractive factors based on the surveys. Though cost elements are both located in the second class from the results of SMD, it is obvious that people prefer to share funny, strong-narrative and rich content to attract the attention of others in social media. When mentioned alongside the park itself, information such as tickets and traffic is considered less interesting or attractive than other information. So, it is these “important but boring” factors are easy to ignore, leaving space for other interesting things which are deliberately articulated further.

Surroundings

The rank of surrounding elements and physical activities declines greatly in the questionnaire surveys. In SMD, surroundings such as the Bird’s Nest and the Water Cube were fairly important attractiveness factors but tended to remain marginal in the survey. This might be caused by the limitations of our analyses, as we considered text language with positive emotional inflection to be associated with landscape attractiveness. It is possible that those famous surroundings are merely mentioned as neutral position descriptors regardless of specific emotional response. Another reason for the ranking changes between the two data sources is that—like cost—social media users may deliberately mention famous elements such as the Bird’s Nest and the Water Cube, which improve the “attractiveness” of their blogs on website.

Physical Activities

While both data confirm the importance of physical activities in public parks [46], differences exist. Even though physical activities are first class attractiveness features, they represent second tier responses in questionnaires. Active and physical activities might be part of “showoff” behaviors in social media but may not represent real attractive factors for people planning to visit a park.

3.2.2. Key Differences about Attractive Elements

Of the 41 attractive elements involved in the research, the four elements with the most distinctive differences are discussed here.

Sunflowers vs. Lawn

Sunflowers are much more favorable in SMD than in the survey data (Figure 4). Within the planting factor, lawn and sunflowers are the first two attractiveness elements, followed by ginkgo, cosmos and reeds from both data sources. However, the sequence of lawn and sunflowers were reversed in the survey data and SMD. Lawn was the most popular plant in surveys while the sunflower was first in the SMD. Lawn in the Beijing Olympic Forest Park was frequently mentioned for daily activities such as camping, soccer and children playing all year long. Sunflowers were seemingly more eye-catching, though their blooming period is short lived. This can also be explained by the fact that users tend to describe the most impressive experience or things in social network such as sunflowers in the flower field but not their daily activities.

Running vs. Walking

In SMD, both frequency statistics and degree centricity reveal the attractiveness of physical activities as greater than recreational activities, specifically running activities. This is contrary to evidence gleaned from surveys. In the surveys, more users participated in recreational activities than in physical activities and walking was rated much higher than running. The results also confirmed previous conclusions about portrayal of online persona and blog attractiveness. Compared with common activities, fashionable and popular running activities like marathons are specifically and frequently recorded by social media users. However, when it comes to survey data, where daily activities are better reflected, the common activities like walking, biking and sports are highlighted (Figure 5).

4. Discussion

Our findings generate multifaceted implications based on the analyses of SMD and conventional survey data. The results directly provide design recommendations for public parks in China and work as a pilot effort to compare the similarities and differences of SMD in landscape research.

4.1. Understanding the Similarity between SMD and Survey Data

The high degree of similarity of results drawn from SMD and survey data suggests that the two overlapped greatly in reflecting the attractiveness of grant-size urban parks, such as the Beijing Olympic Green, as assessed by daily users. The similarity between the two confirms the capacity and great promise of SMD in assessing landscapes as there are large volumes of data available online which implicitly demonstrate users’ attitudes and emotions. The value of SMD in landscape assessment can go far beyond attractiveness as texts and images represent a wide variety of social factors such as aesthetics, security, social, health and satisfaction, as suggested by the concept of social sensing in analogue to remote sensing for the purpose of capturing human factors [47].
Both data sources endorsed attractiveness theories, though our findings generated combined results from both landscape and previous tourism research. The external factors identified from our study are similar to those from tourism research [23,24,26] and the internal factors are in the same vein as previous landscape research [28,29,31]. This suggests that large parks are considered both destinations and enjoyable places. Design strategies to enhance the attractiveness of large parks should embark upon both external and internal features.
Natural elements, such as water and plants, are the major draws for everyday uses. In a big city, people come to the parks mainly because of the natural atmosphere and the activities they can perform. The importance of naturalness to attractiveness has been suggested by many previous studies [48,49], though Gobster [50] and Williams and Cary [51] reported no clear relationship and even found negative relationships between naturalness and attractiveness. The context of a high-density city suggested a need for naturalness to balance the artificial landscape to be more attractive.
Two reasons can be tracked for the lower ranking of these elements. First, intangible elements tend to be less attractive. Cultural metaphors that inspired the designs and won the design competition were not reported as attractive, because these ideas were not converted to site-scale environments that could enrich human experiences. People either think cultural elements are not as important as their immersive experiences in the natural atmosphere, or these elements are not perceived as important by park users.
Second, artificial elements are less likely to be considered attractive. These include not only structures and facilities but also artificial programs that use natural elements, such as artificial waterfalls and flower beds. Artificial elements necessitate big financial inputs to build initially and required frequent maintenance. The relative low attractiveness and high inputs may inform park decision-makers about such programs. For a big urban park where citizens may spend longer hours, attractiveness is more associated with specific experiences and activities. Cultural metaphors may still be important in the design process. However, they can be more attractive to citizens if converted into usable spaces. Future park renovation can better represent Chinese culture by adding more tangible components such as theatrical plays, music concerts and culturally relevant activities in open air spaces.

4.2. Understanding the Disparity between SMD and Survey Data

While many scholars suggest the merits of emerging SMD, especially the availability of huge volumes of samples, this study provides a detailed multifaceted view of SMD and survey data on the same study subject—attractiveness. While recognizing SMD can serve as a suitable source as well as an efficient process for landscape social evaluation in much the same way as other data sources [15], we may also see limits based on the disparities. Table 7 summarizes fundamental differences between SMD and conventional survey data as identified by our study and others. Surveys can be considered a small data source as sampling size must exceed 1000 unique data points to be considered large. SMD can easily provide volumes of data exceeding 10,000 data points. However, surveys may contain more profound and detailed information, while SMD has much lower information resolution and highly redundancy. If future “deep learning” can solve the technology, analysis and methodology challenges of using big data [14], two intrinsic characters of SMD that may convey conflicting demands and opinions in the “real world” [15] desire further attention.
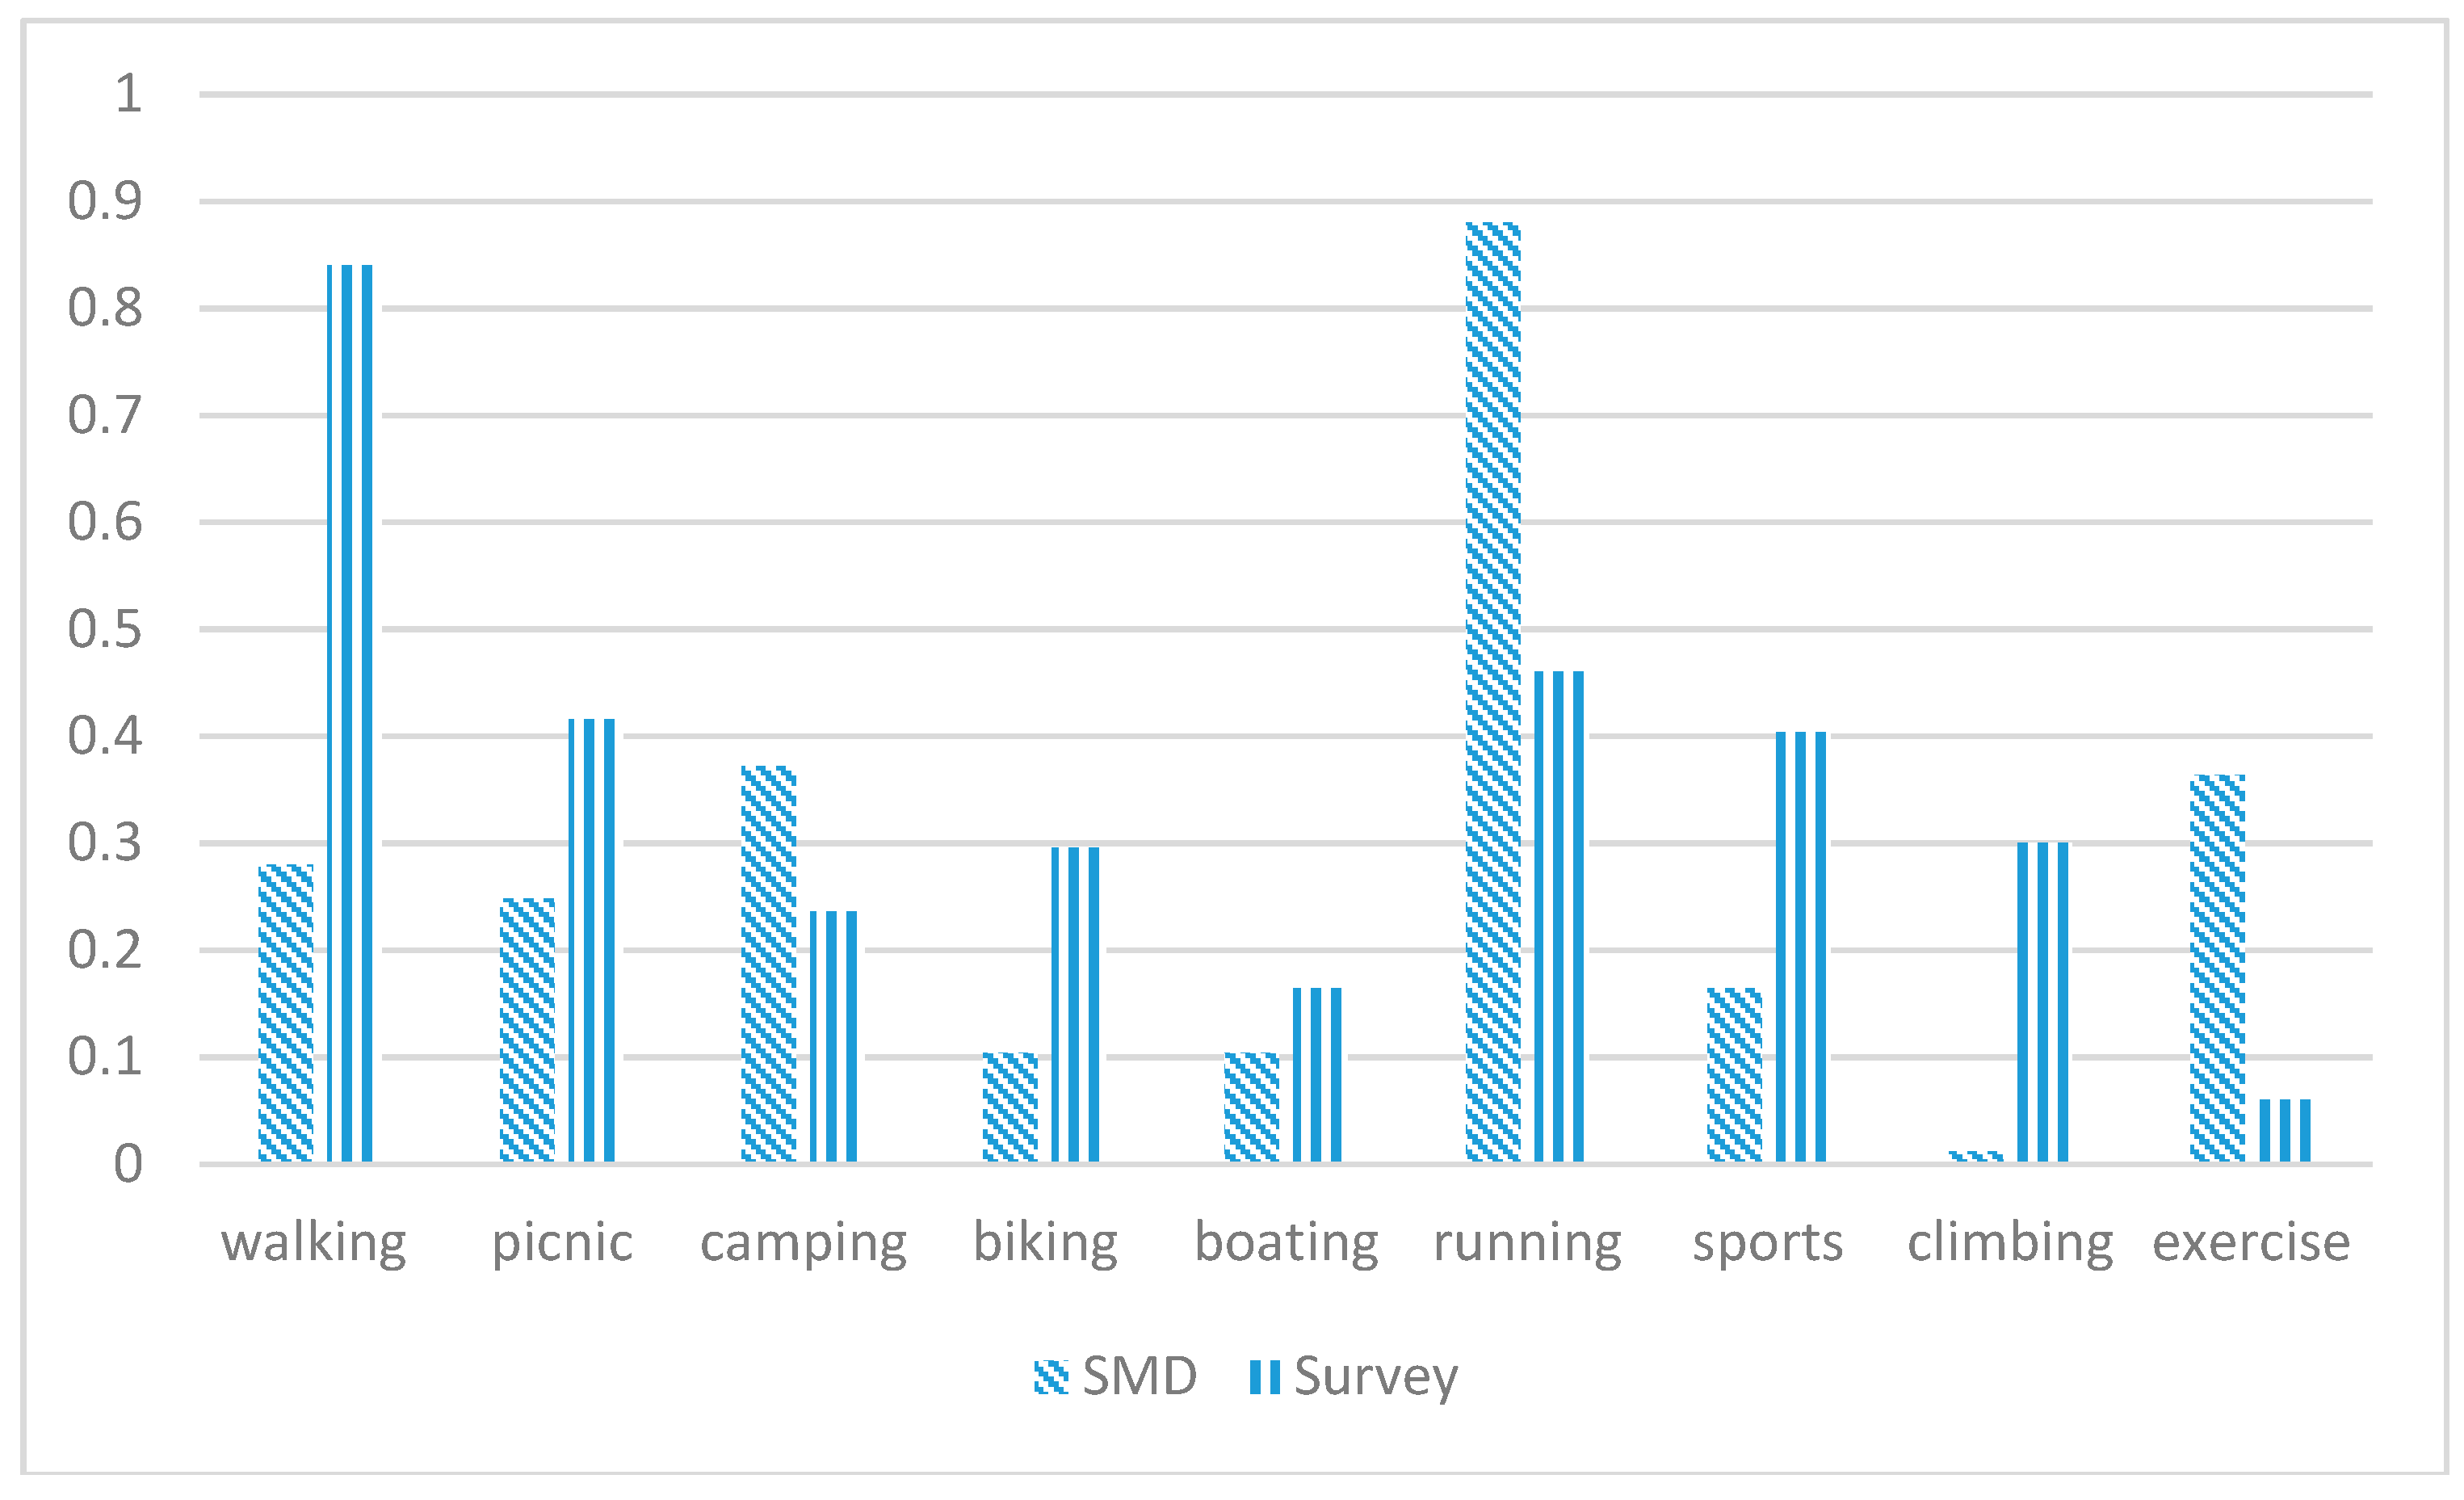
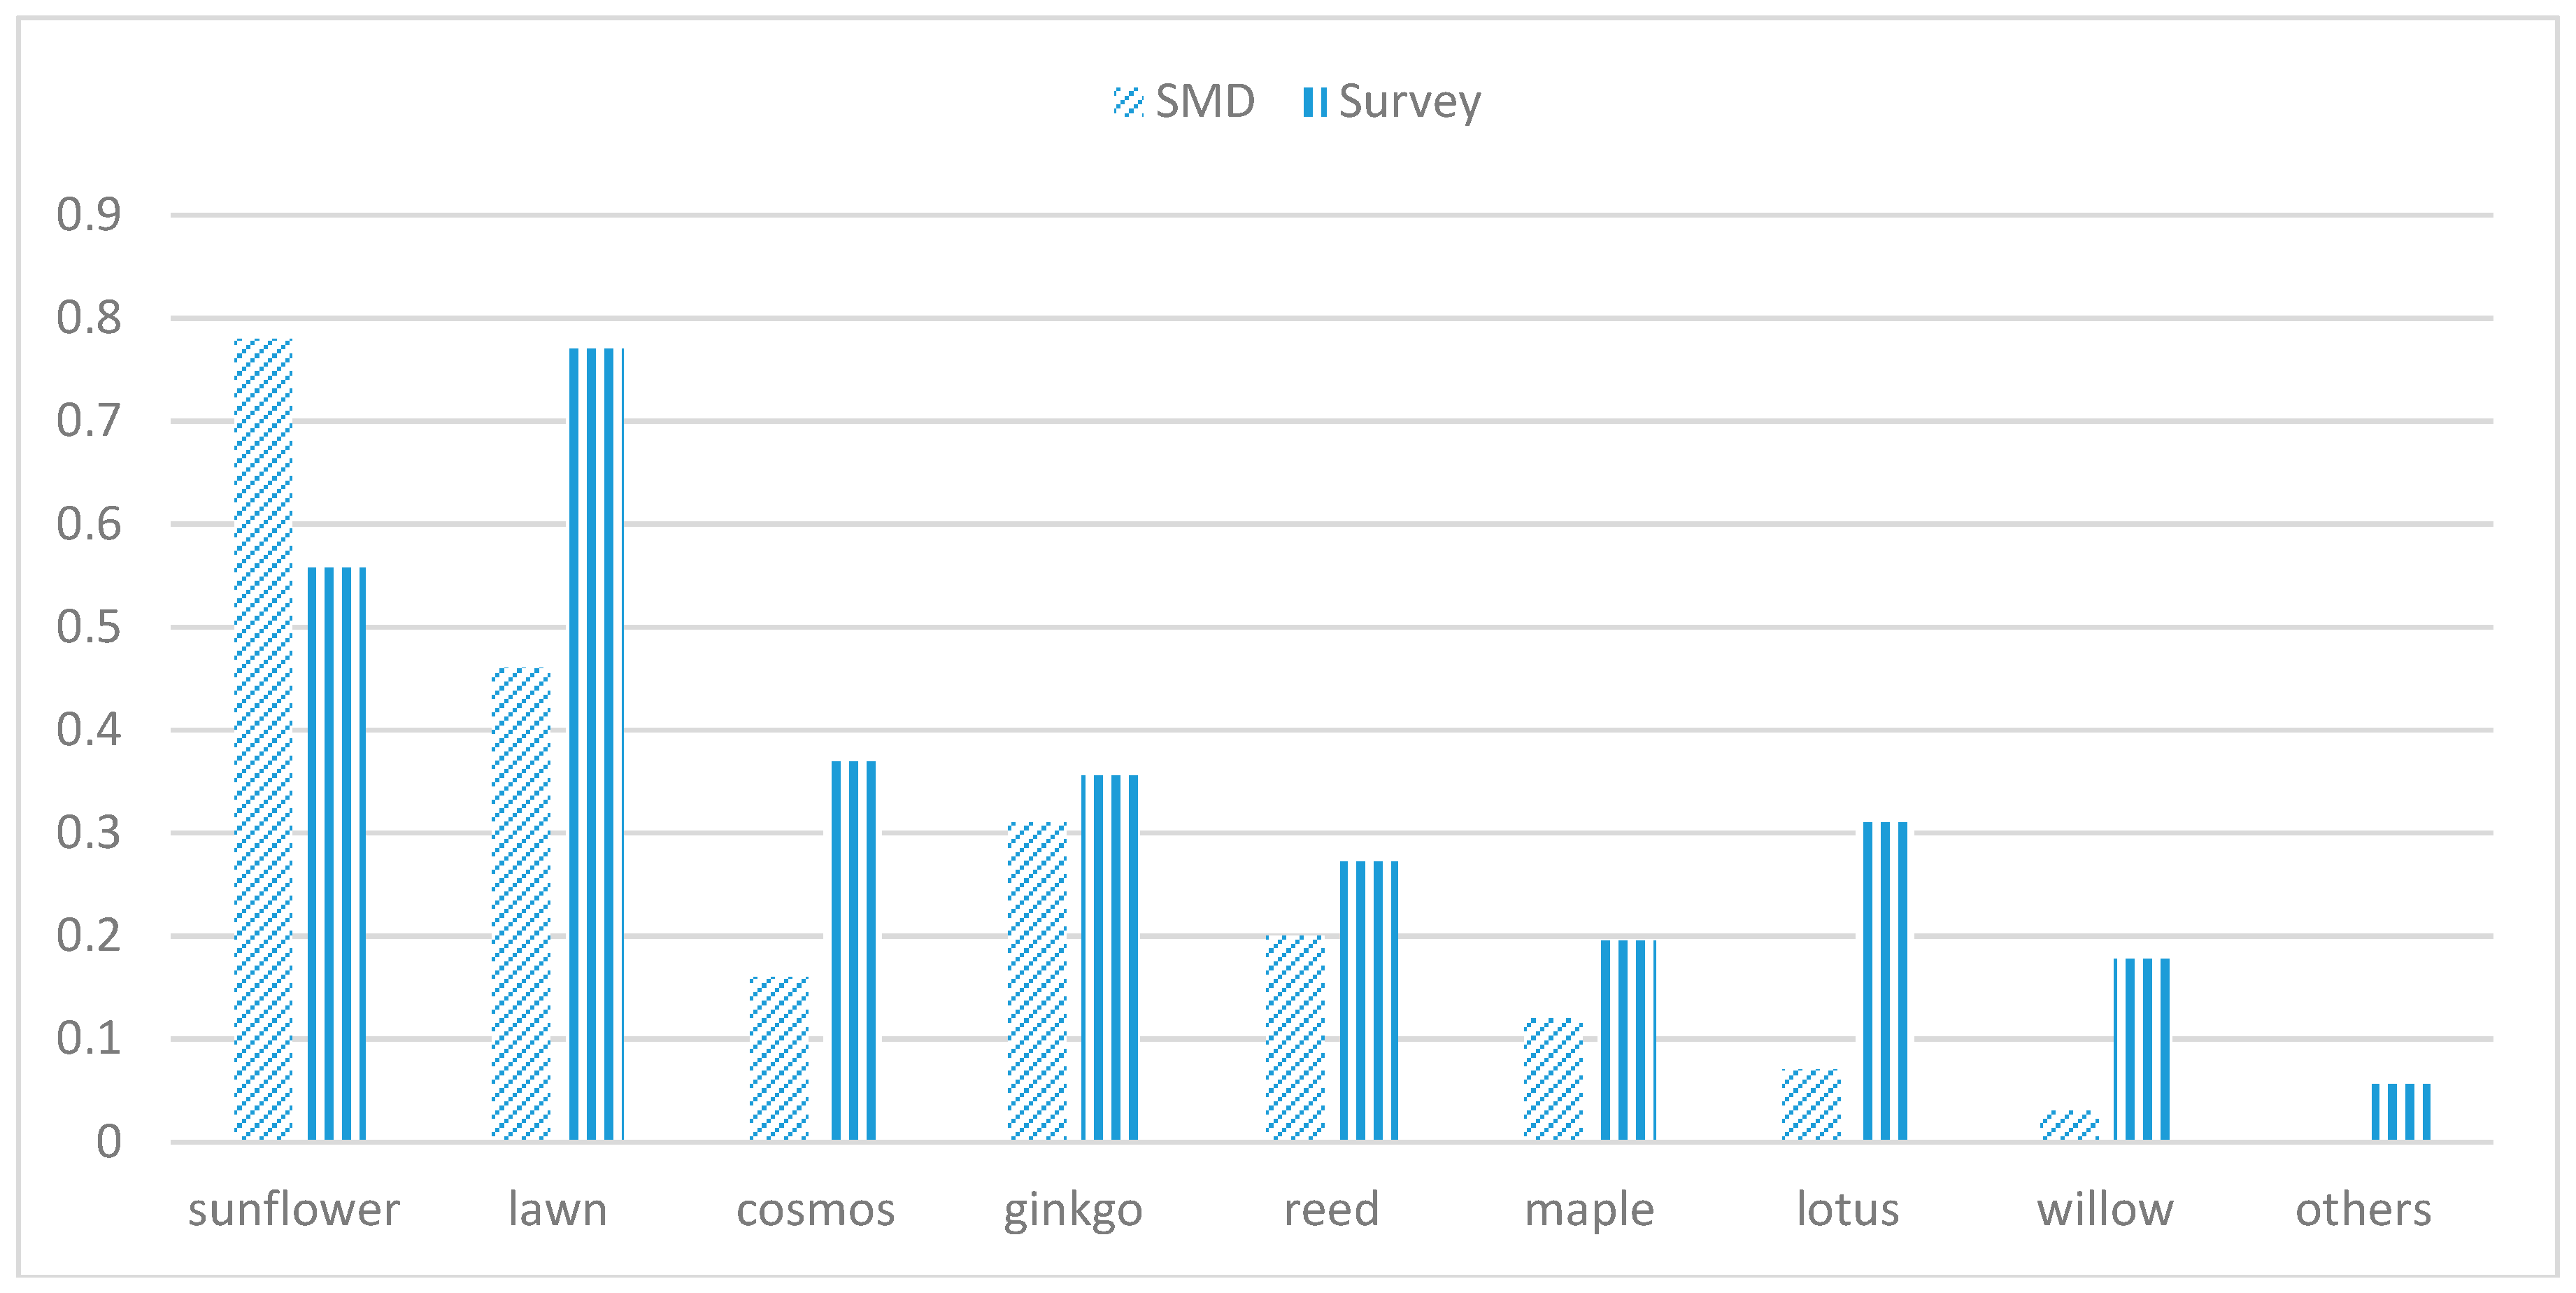
First, SMD is selective data associated with the social media users’ emotions and pride. The massive volume of sampling size of SMD does not change the fact of this data source’s selective generation mechanism. Social media users prefer to input information that is more likely to be read by friends and web viewers. Hence, SMD partially reflects the essence of the phenomenon it records and should never be deemed as a perfect data source. In this study, the fact that that sunflowers were reported with higher attractiveness than lawn from SMD suggests that people might like to share more exciting scenery. Though lawns are suggested as of higher attractiveness from survey data, these “normal” scenes may not stimulate the social media users to mention them in their posts. For the same reason, the activity of running, extracted from SMD, is evaluated as a more attractive factor; while the survey data suggests that walking is a more attractive activity in the park. In this selective process, the true fact of attractiveness is represented by the excitement of particular programs.
At the same time, the emotionally selective process of SMD may conceal important information. In this study, survey participants reported that free admission was a highly attractive factor for a park visit. However, it is barely mentioned in SMD, because it might be considered a little disgraceful to mention free admission as part of communicated information. The degree of excitement constitutes a filter for social media users to unconsciously select from their experiences and put up a post. Hence, more commonly used factors can be underrated when SMD data is extracted and analyzed. The emotional selection process through social media can induce an exaggerated and aggregated bias of SMD.
Second, SMD is unstructured and volunteered data. Compared with a participant who takes a questionnaire survey, the generation process of SMD lacks a method for comparison and reasoning process. The SMD is extracted from the posts freely uploaded by social media users. When posting the information, they do not necessarily compare one activity or program with others.
By contrast, in an organized and categorized formatting, survey participants are always asked to compare and synthesize the given items. For example, in evaluating the attractiveness of running and walking, survey participants realize that walking is an activity more frequently participated in than running, when the questionnaire presents the two items simultaneously. Nevertheless, without a comparison framework provided by the survey, social media users are more likely to create posts about running, which better shows off a healthier life style. In this sense, the appearance of terms in SMD is “isolated” from other terms, because they are not purposefully compared and weighted. When SMD is used as a data source, for example, the importance of running becomes meaningful by itself. In the analysis process, the factors of different “isolated meanings” are forced to be rated equally attractive when frequency is defined to represent attractiveness. Social meanings of SMD are always inferred.
When used in social perception research, SMD is a data source that can be extracted rather than collected. Unlike survey, observation and experiment data, researchers cannot predetermine the format, amount and richness of the data source. SMD features the large sampling size, the ease of acquiring data and no need for interaction with human subjects, all of which suggests the efficiency of acquiring data. However, disregarding the generation mechanisms and the resultant limits can lead to bias, or even errors, which could be risky when trying to draw reliable conclusions. Since SMD is passive, the researcher cannot alter the method of acquiring SMD. Better understanding of their generation process and the research assumptions about the appropriateness of SMD are urgently needed [52]. On the other hand, given its thinness in meaning, thickness in number and lack of control from researchers, SMD can still provide high numbers of profiles of phenomenon, which broadens the scope of other data sources.

4.3. A Combined Evaluation Method

This study investigates characters of SMD as used for academic research. While fully recognizing the opportunities SMD brings out in understanding social phenomena with massive amounts of data, we reconciled possible limits of SMD by analyzing the disparities between results from SMD and survey data. It is worth noting that, despite all these instinct limits of SMD, there are many similarities between the findings from SMD and survey data, particularly in identifying keywords.
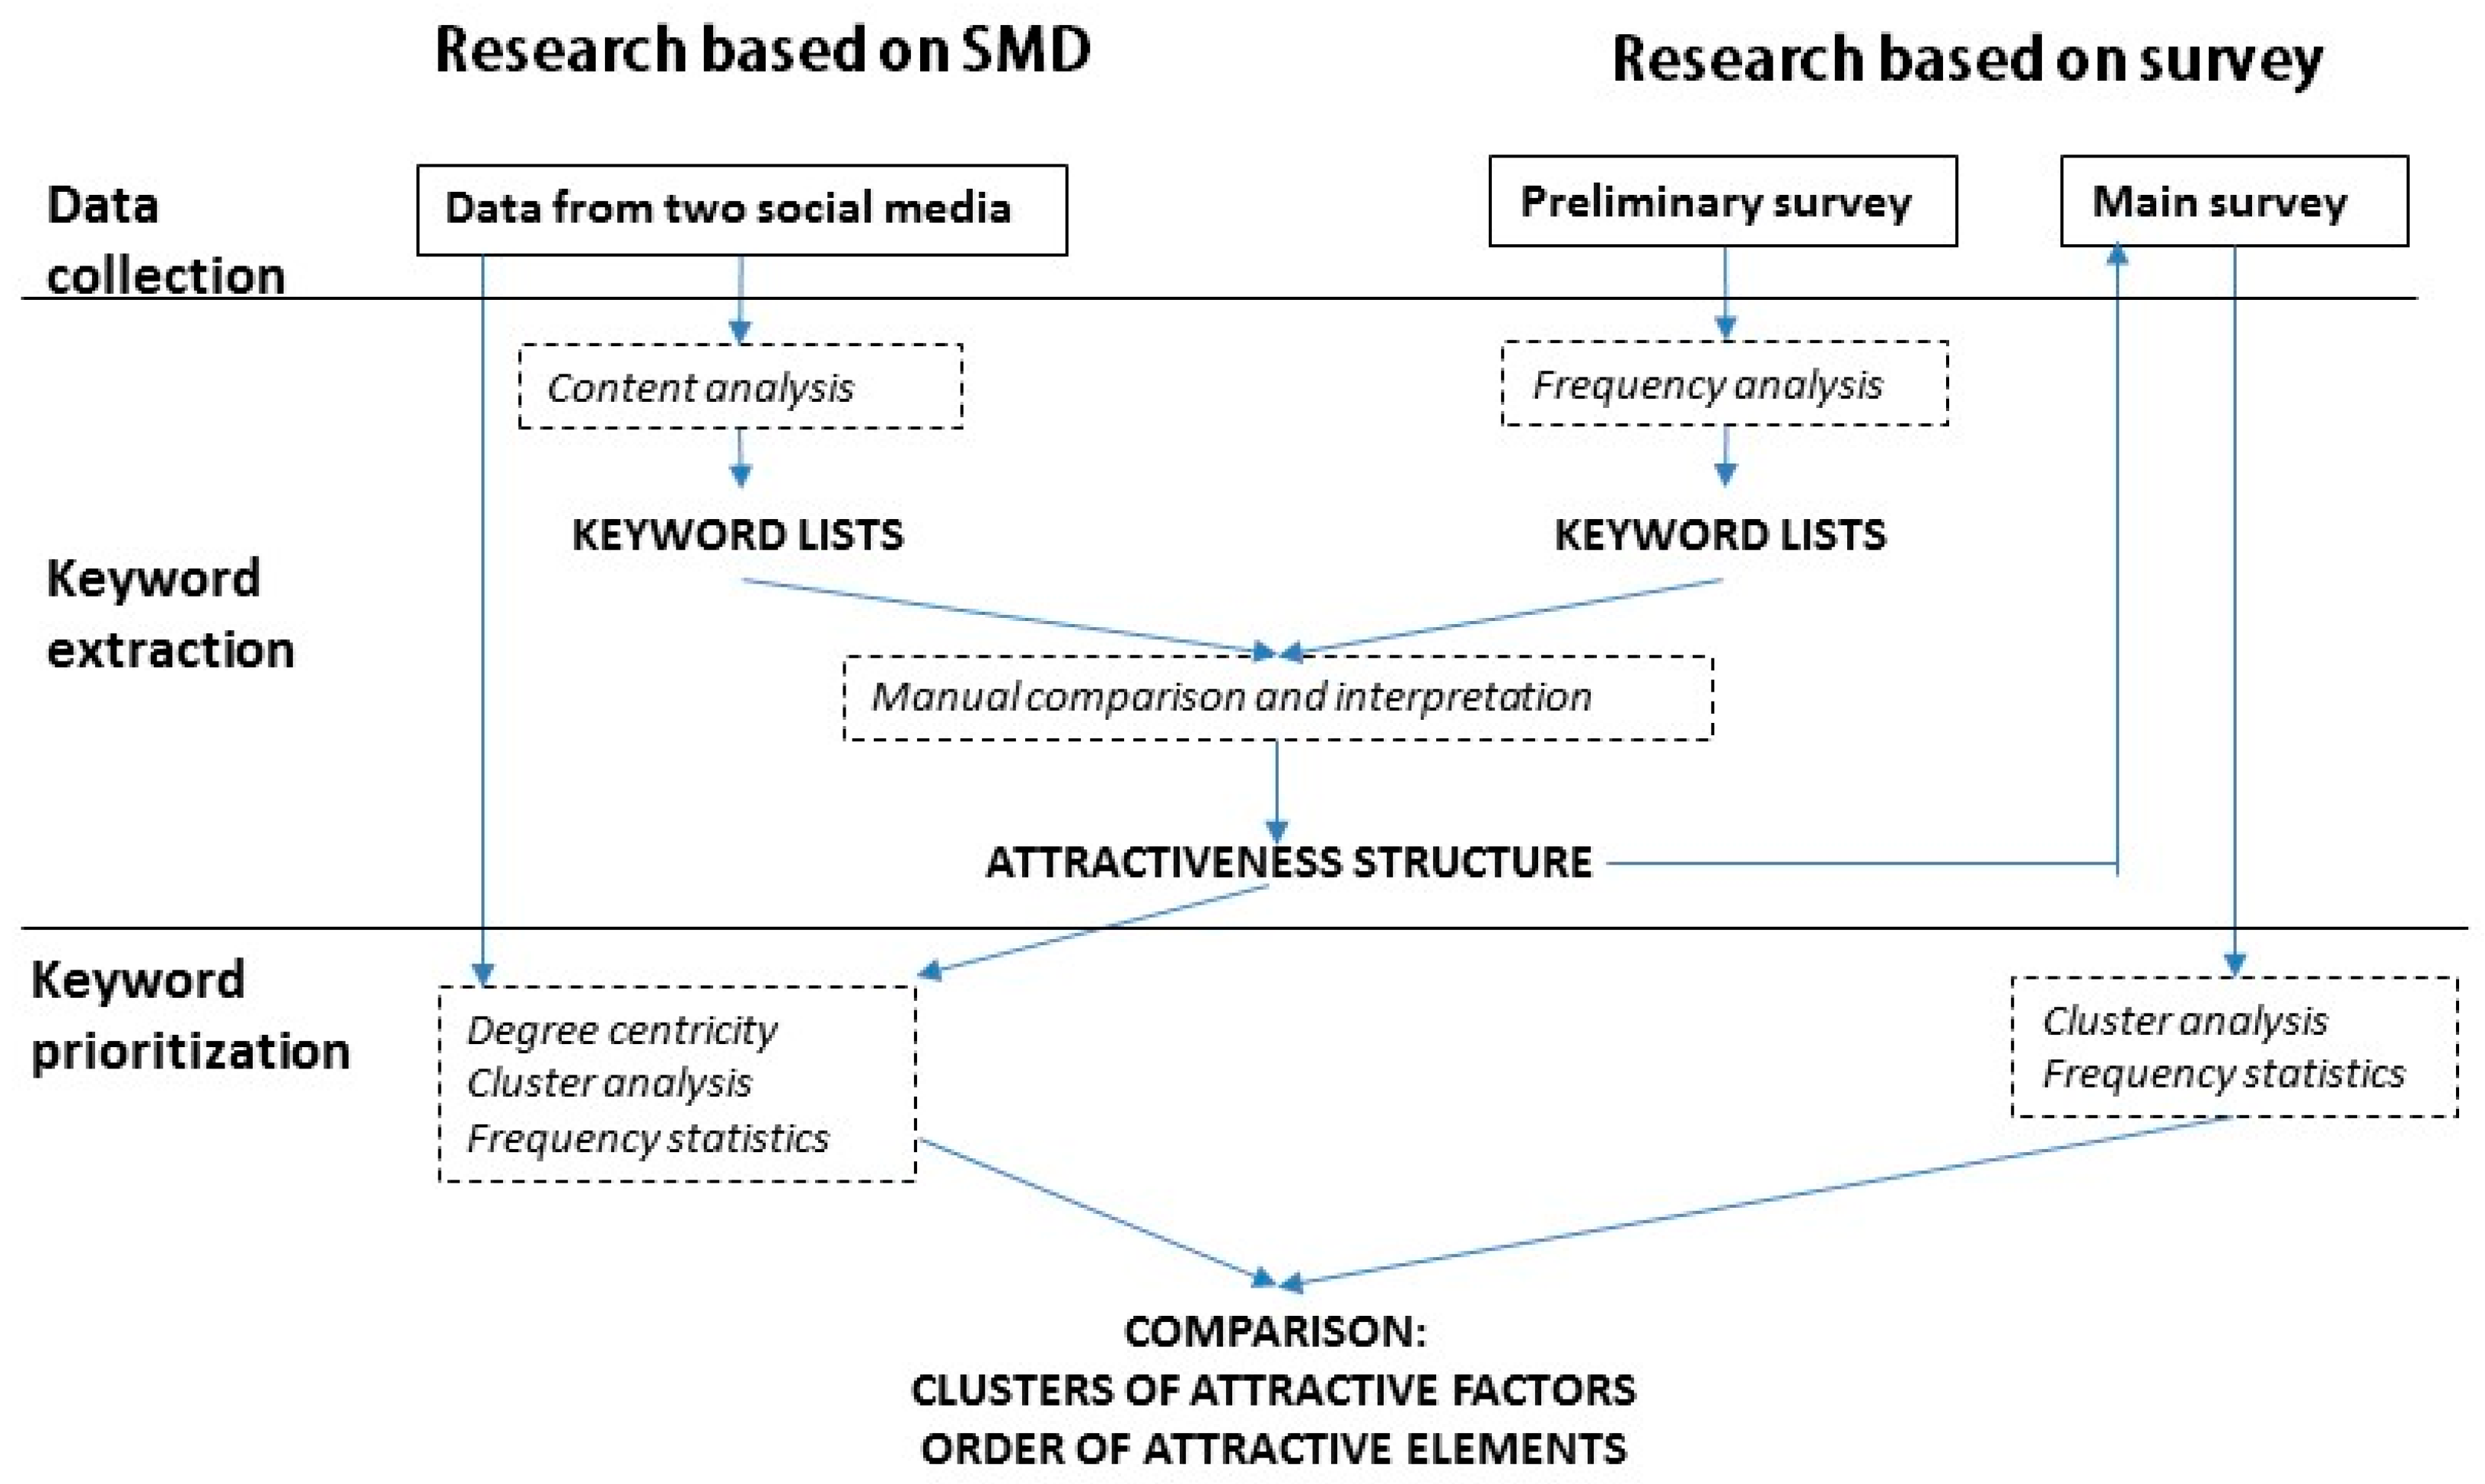
Inspired by the framework to integrate crowd-sourcing data in urban planning [53], this study recommends a landscape assessment framework that combines data sources in places with abundant SMD based upon the strength and weakness of SMD and survey data. This would enable the researcher to: (1) Utilize information from SMD to identify keywords; (2) Build up an assessment structure based on keywords from SMD; (3) Conduct basic landscape assessment based on SMD; (4) Apply conventional surveys for supplementary and detailed information, particularly regarding prosaic yet important factors. Using appropriate techniques, the ease and cost-effective characteristics of SMD can offer relevant and useful information quickly. Supplementing this with a time-consuming survey would solve the lower information resolution, questionable reliability and data dependency of SMD. Both SMD and surveys are suitable and non-replaceable data sources that can offer different user perspectives, yet provide complementary information.
It is also worth mentioning that this article compared the two data sources based on a population aged 19–35. This group constitutes the major users of social media in China. In the combined evaluation method, the lack of any other population in SMD cannot be compensated for even by a traditional survey. Whenever this type of combined evaluation method is used, the limited representativeness of SMD in terms of user population should be noticed.

4.4. Future Research

Though our research is carefully designed, the conclusions are still subject to some limitations that merit further research attention. The first challenge is the selection of appropriate coverage of social media including better representation of stakeholders and primary issues [15]. This study only investigates available and accessible social media networks. There are other social networks, such as Sina blog, not used in this research due to technical challenges in retrieving related data. In the future, comparative studies of SMD from different sources are urgently needed.
Second, the methodology used in analyzing SMD may also need to be further refined. This study assumes texts with positive emotional inflections are indicators of attractiveness, which might be true most of the time, with some biases due to the unlabeled features of SMD. For instance, the area surrounding Bird’s Nest and the Water Cube are mentioned frequently and their mentions are associated with a positive mood. Yet it is difficult to tell whether people mention them because they are attractive or simply use them as a location reference. A stronger unsupervised selection technique is needed to analyze these unlabeled, unstructured and inherently linked datasets online [54]. This study focuses on positive feedbacks only, yet negative responses may provide much more instructive information about on-site problems, users’ unsatisfied desires and thus outline needed changes in renovation or restoration. Negative emotions and descriptions deserve more scrutiny in future research.
Last but not least, due to the challenge of extracting data, only textual data is used in this study. Some may argue that visual information is more representative in recording the perceptions of social media users. And, visual information suggests not only the program names but also the means, angles and the way they are used. Therefore, more advanced extraction tools need to be developed in the future to satisfy this need.

5. Conclusions

This study confirms the capacity of SMD in landscape assessment, using the attractiveness of Beijing Olympic Park as an example. SMD shows great promise in assessing landscapes as there are large volumes of data available online which implicitly demonstrate users’ attitudes and emotions using text. By comparing SMD and survey data, our study produced three significant results. First, it confirms attractiveness theories. By analyzing two distinct sets of data, this study expands the attractiveness of large urban parks to both internal and external features and also to the unique cultural context of China.
Second, this study investigates the quality and limits of SMD for academic research by comparing it with survey data. It is recognized that SMD is emotionally selective data with no structure as compared to rationally structured data from the survey. These characters are not altered when the thickness of SMD increases. When using these data, researchers should be aware of the limits and biases. Also, future researchers may seek to quantify the characteristics of SMD data.
Third, a combined research method is developed using both data sources. While understanding the strength and weakness of both methods, a more comprehensive understanding can be generated by utilizing the strength of two data sources. Online data may prove favorable owing to the quantity of data available and cost-effectiveness of its procurement. Yet scholars need to treat the application of social media data in landscape study rationally and cautiously. Both social media data and survey data are suitable and non-replaceable data sources that can offer unique yet complementary points and perspectives of information.

Acknowledgments

This work was supported by the National Natural Science Foundation of China (No. 41625003).

Author Contributions

Zhifang Wang, Yue Jin, and Bo Zhang conceived and designed the experiments; Yue Jin performed the experiments; Zhifang Wang and Yue Jin analyzed the data; Yu Liu and Dong Li contributed reagents/materials/analysis tools; Zhifang Wang, Yue Jin, Bo Zhang, Yu Liu and Dong Li wrote the paper.

Conflicts of Interest

The authors declare no conflict of interest.

References

  1. Holsapple, C.; Hsiao, S.H.; Pakath, R. Business Social Media Analytics: Definition, Benefits and Challenges. Twentieth Americas Conference on Information Systems, Savannah, United States, 7–9 August 2014. Available online: https://pdfs.semanticscholar.org/d7d7/1ec49476e54a350e9091087345dcd3d7866c.pdf (accessed on 24 January 2018).
  2. Dodds, P.S.; Harris, K.D.; Kloumann, I.M.; Bliss, C.A.; Danforth, C.M. Temporal patterns of happiness and information in a global social network: Hedonometrics and Twitter. PLoS ONE 2011, 6, e26752. [Google Scholar] [CrossRef] [PubMed]
  3. Jenkins, A.; Croitoru, A.; Crooks, A.T.; Stefanidis, A. Crowdsourcing a collective sense of place. PLoS ONE 2016, 11, e0152932. [Google Scholar] [CrossRef] [PubMed]
  4. Yang, L.; Wu, L.; Liu, Y.; Kang, C. Quantifying tourist behavior patterns by travel motifs and geo-tagged photos from Flickr. ISPRS Int. J. Geo-Inf. 2017, 6, 345. [Google Scholar] [CrossRef]
  5. Wood, S.A.; Guerry, A.D.; Silver, J.M.; Lacayo, M. Using social media to quantify nature-based tourism and recreation. Sci. Rep. 2013, 3, 2976. [Google Scholar] [CrossRef] [PubMed]
  6. Crandall, D.; Snavely, N. Modeling people and places with internet photo collections. Commun. ACM 2012, 55, 52–60. [Google Scholar] [CrossRef]
  7. Sakaki, T.; Matsuo, Y.; Yanagihara, T.; Chandrasiri, N.P.; Nawa, K. Real-time event extraction for driving information from social sensors. In Proceedings of the IEEE International Conference on Cyber Technology in Automation, Control and Intelligent Systems (CYBER), Bangkok, Thailand, 27–31 May 2012. [Google Scholar]
  8. Guerrero, P.; Møller, M.S.; Olafsson, A.S.; Snizek, B. Revealing cultural ecosystem services through Instagram images: The potential of social media volunteered geographic information for urban green infrastructure planning and governance. Urban Plan. 2016, 1, 1–17. [Google Scholar] [CrossRef]
  9. Dunkel, A. Visualizing the perceived environment using crowdsourced photo geodata. Landsc. Urban Plan. 2015, 142, 173–186. [Google Scholar] [CrossRef]
  10. Liu, L.; Zhou, B.; Zhao, J.; Ryan, B.D. C-IMAGE: city cognitive mapping through geo-tagged photos. GeoJournal 2016, 81, 817–861. [Google Scholar] [CrossRef]
  11. Pauleen, D.J.; Wang, W.Y.C. Does big data mean big knowledge? KM perspectives on big data and analytics. J. Knowl. Manag. 2017, 21, 1–6. [Google Scholar]
  12. Schofield, P. Big data in mental health research—Do the ends justify the means? Using large data-sets of electronic health records for mental health research. BJPsych Bull. 2017, 41, 129–132. [Google Scholar] [CrossRef] [PubMed]
  13. Krenchel, M.; Madsbjerg, C. Your Big Data Is Worthless If You Don’t Bring It into the Real World. 2014. Available online: https://www.wired.com/2014/04/your-big-data-is-worthless-if-you-dont-bring-it-into-the-real-world/ (accessed on 10 October 2017).
  14. Boyd, D.; Crawford, K. Critical questions for big data: Provocations for a cultural, technological and scholarly phenomenon. Inf. Commun. Soc. 2012, 15, 662–679. [Google Scholar] [CrossRef]
  15. Daume, S.; Albert, M.; von Gadow, K. Forest monitoring and social media—Complementary data sources for ecosystem surveillance? For. Ecol. Manag. 2014, 316, 9–20. [Google Scholar] [CrossRef]
  16. Tene, O.; Polonetsky, J. Big data for all: Privacy and user control in the age of analytics. Northwest. J. Technol. Intell. Prop. 2013, 11, 239–273. [Google Scholar]
  17. Kim, G.-H.; Trimi, S.; Chung, J.H. Big-data applications in the government sector. Commun. ACM 2014, 57, 78–85. [Google Scholar] [CrossRef]
  18. Yiu, C. The Big Data Opportunity; The Policy Exchange: London, UK, 2012. [Google Scholar]
  19. Washington, A.L. Government information policy in the era of big data. Rev. Policy Res. 2014, 31, 319–325. [Google Scholar] [CrossRef]
  20. Liu, Y. Revisiting several basic geographical concepts: A social sensing perspective. Acta Geogr. Sin. 2016, 4, 564–575. [Google Scholar]
  21. Chhetri, P. Modelling the attractiveness potential of scenic views: A case study of the Grampians National Park, Australia. Tour. Recreat. Res. 2006, 31, 101–107. [Google Scholar] [CrossRef]
  22. Liu, B.; Mu, X. The Make-up of attraction of city culture and city landscape. Planners 2004, 2, 5–7. [Google Scholar]
  23. Wu, B.; Xu, B.; Qiu, F. A Systematic Study on Domestic Tourism Market in China; East China Normal University Press: Shanghai, China, 1999. [Google Scholar]
  24. Deng, J.; King, B.; Bauer, T. Evaluating natural attractions for tourism. Ann. Tour. Res. 2002, 29, 422–438. [Google Scholar] [CrossRef]
  25. Ritchie, J.R.B.; Zins, M. Culture as determinant of the attractiveness of a tourism region. Ann. Tour. Res. 1978, 5, 252–267. [Google Scholar] [CrossRef]
  26. Kale, S.H.; Weir, K.M. Marketing third world countries to the Western traveler: The case of India. J. Travel Res. 1986, 25, 2–7. [Google Scholar] [CrossRef]
  27. Hu, Y.; Ritchie, J.R.B. Measuring destination attractiveness: A contextual approach. J. Travel Res. 1993, 32, 25–34. [Google Scholar]
  28. Kuper, R. Preference, complexity and color information entropy values for visual depictions of plant and vegetative growth. HortTechnology 2015, 25, 625–634. [Google Scholar]
  29. Muratet, A.; Pellegrini, P.; Dufour, A.B.; Arrif, T.; Chiron, F. Perception and knowledge of plant diversity among urban park users. Landsc. Urban Plan. 2015, 137, 95–106. [Google Scholar] [CrossRef]
  30. Bulut, Z.; Yilmaz, H. Determination of waterscape beauties through visual quality assessment method. Environ. Monit. Assess. 2009, 154, 459–468. [Google Scholar] [CrossRef] [PubMed]
  31. Nasar, J.L.; Li, M. Landscape mirror: The attractiveness of reflecting water. Landsc. Urban Plan. 2004, 66, 233–238. [Google Scholar] [CrossRef]
  32. Booth, N.K. Basic Elements of Landscape Architectural Design; Elsevier: New York, NY, USA, 1983; p. 315. [Google Scholar]
  33. Giles-Corti, B.; Broomhall, M.H.; Knuiman, M.; Collins, C.; Douglas, K.; Ng, K.; Lange, A.; Donovan, R.J. Increasing walking: How important is distance to, attractiveness and size of public open space? Am. J. Prev. Med. 2005, 28, 169–176. [Google Scholar] [CrossRef] [PubMed]
  34. Zhang, H.; Chen, B.; Sun, Z.; Bao, Z. Landscape perception and recreation needs in urban green space in Fuyang, Hangzhou, China. Urban For. Urban Green. 2013, 12, 44–52. [Google Scholar] [CrossRef]
  35. Cetin, M. Evaluation of the sustainable tourism potential of a protected area for landscape planning: A case study of the ancient city of Pompeipolis in Kastamonu. Int. J. Sustain. Dev. World Ecol. 2015, 22, 490–495. [Google Scholar] [CrossRef]
  36. Sevenant, M.; Antrop, M. Cognitive attributes and aesthetic preferences in assessment and differentiation of landscapes. J. Environ. Manag. 2009, 90, 2889–2899. [Google Scholar] [CrossRef] [PubMed]
  37. Van den Berg, A.E.; Koole, S.L. New wilderness in the Netherlands: An investigation of visual preferences for nature development landscapes. Landsc. Urban Plan. 2006, 78, 362–372. [Google Scholar] [CrossRef]
  38. Cetin, M.; Sevik, H. Evaluating the recreation potential of Ilgaz Mountain National Park in Turkey. Environ. Monit. Assess. 2016, 188, 52. [Google Scholar] [CrossRef] [PubMed]
  39. Dazhongdianping. About Dianping. 2015. Available online: http://www.dianping.com/aboutus (accessed on 15 October 2017).
  40. Baidubaike. Mafengwo. 2015. Available online: https://baike.so.com/doc/5342045-5577488.html (accessed on 15 October 2017).
  41. iResearch. China Social Network User Research Report 2010–2011. 2011. Available online: http://www.iresearch.com.cn/report/1607.html (accessed on 15 October 2017).
  42. Govers, R.; Go, F.M. Projected destination image online: Website content analysis of pictures and text. Inf. Technol. Tour. 2004, 7, 73–89. [Google Scholar] [CrossRef]
  43. Hankinson, G. Destination brand images: A business tourism perspective. J. Serv. Mark. 2005, 19, 24–32. [Google Scholar] [CrossRef]
  44. Zhong, L. A reconstruction of destinations' perception structure based on the context and complex network analysis. Tour. Trib. 2015, 30, 88–95. [Google Scholar]
  45. Cetin, M. Using GIS analysis to assess urban green space in terms of accessibility: Case study in Kutahya. Int. J. Sustain. Dev. World Ecol. 2015, 22, 420–424. [Google Scholar] [CrossRef]
  46. Bedimo-Rung, A.L.; Mowen, A.J.; Cohen, D.A. The significance of parks to physical activity and public health: A conceptual model. Am. J. Prev. Med. 2005, 28, 159–168. [Google Scholar] [CrossRef] [PubMed]
  47. Liu, Y.; Liu, X.; Gao, S.; Gong, L.; Kang, C.; Zhi, Y.; Chi, G.; Shi, L. Social sensing: A new approach to understanding our socioeconomic environments. Ann. Assoc. Am. Geogr. 2015, 105, 512–530. [Google Scholar] [CrossRef]
  48. Purcell, A.T.; Lamb, R.J. Preference and naturalness: An ecological approach. Landsc. Urban Plan. 1998, 42, 57–66. [Google Scholar] [CrossRef]
  49. Junker, B.; Buchecker, M. Aesthetic preferences versus ecological objectives in river restorations. Landsc. Urban Plan. 2008, 85, 141–154. [Google Scholar] [CrossRef]
  50. Gobster, P.H. Aldo Leopold’s ecological esthetic: Integrating esthetic and biodiversity values. J. For. 1995, 93, 6–10. [Google Scholar]
  51. Williams, K.J.H.; Cary, J. Landscape preferences, ecological quality and biodiversity protection. Environ. Behav. 2002, 34, 257–274. [Google Scholar] [CrossRef]
  52. Sangiambut, S.; Sieber, R. The V in VGI: Citizens or civic data sources. Urban Plan. 2016, 1, 141–154. [Google Scholar] [CrossRef]
  53. Li, D.; Long, Y. A crowd-sourcing data based analysis framework for urban planning. China City Plan. Rev. 2015, 24, 49–57. [Google Scholar]
  54. Hoseini, E.; Mansoori, E.G. Selecting discriminative features in social media data: An unsupervised approach. Neurocomputing 2016, 205, 463–471. [Google Scholar] [CrossRef]
Figure 1. Geographic Location of Beijing Olympic Forest Park.
Sustainability 10 00382 g001
Figure 2. Comparison of research framework.
Sustainability 10 00382 g002
Figure 3. Beijing Olympic Forest Park visitors from different districts of Beijing (in percentage).
Sustainability 10 00382 g003
Figure 4. Frequency statistics of different vegetation elements based on SMD and survey data.
Sustainability 10 00382 g004
Figure 5. Frequency statistics for different activities based on SMD and survey.
Sustainability 10 00382 g005
Table 1. Verbal description examples on social media.
User IDsVerbal Descriptions (Translated from Chinese)Location
1Very good park, my favorites are runway and big fishes, ha ha. I come here every day.Chaoyang District, Beijing
2The park is full of beautiful colors and pleasant fragrance. There is a wetland with …Haidian District, Beijing
3The cosmos and sunflowers in summer attract lots of people. The park is a paradise for …Haidian District, Beijing
4A big oxygen bar. I would play with my baby in the park when I have free time.Chaoyang District, Beijing
5Good environment! Many people come here in the evening. I like boating in the lake. It’s …Chaoyang District, Beijing
6Just so-so. As a scenic spot, it is a little boring. Noting works.Shandong Province (excluded)
7Few people in the park. Last Sunday, I had a tour in the park with my wife.Hebei Province (excluded)
8It was built for Beijing Olympic Game, located near the Bird’s Nest and …Chaoyang District, Beijing
9Such a beautiful place! But I couldn’t take my dog here. When I first come to park with …Chaoyang District, Beijing
10We had a class activity there. We stayed in the north park, there were many cosmos …Xicheng District, Beijing
Table 2. Examples of positive, negative and neutral texts.
Text FeaturesMotion Key Words (Translated from Chinese)Example (Translated from Chinese)
Positive textComfortable, beautiful, happy
  • Very good park, my favorite things in park are runway and big fishes, ha ha.
  • The park is full of beautiful colors and pleasant fragrance. There is a wetland with underwater corridor.
Bravo, had a good time, enjoy
Fresh, nice place, relax …
Negative textJust so so, boring, nothing to see, ordinary, no features, desolation, too much in sun …
  • There is no difference with other ordinary parks.
  • As a scenic spot, it is a little boring. Nothing works.
Neutral text-
  • Go to the park with friends on Saturday, there are many people running.
  • It was built for welcoming Beijing Olympic Games, located near the Bird’s Nest and the Water Cube.
Table 3. Extract attractive elements and factors from texts.
Text ExampleAttractive ElementsAttractive Factors
Very good park, my favorite things in park are runway and the big fish, haha. Every time, I will play for a long time. I really like it.RunwayPhysical activities
Big fishWater
PlayRecreational activities
The park is full of beautiful colors and pleasant fragrance. There is a wetland with underwater corridor. The most important thing is free of charge.ColorsPlants
FragrancePlants
UnderwaterWater
WetlandWetlands
Free of chargeConsumption costs
The cosmos and sunflowers in summer attracts lots of people. Park is a paradise for many runners, if you love running, you must like the park.CosmosPlants
SunflowerPlants
RunningPhysical activities
Table 4. Attractive components and attractive factors from keyword extraction.
Landscape AttractivenessAttractive ComponentsAttractive FactorsDetailed Elements
InternalLandscapeWaterSunflower, grass, cosmos, Aohai, Yangshan, fountain, wetland, trees, forests, sculpture
Mountain
Plants
Artifact
FacilitiesPhysical facilitiesRunway, children’s recreation facilities, bike, battery car, boats
Recreational facilities
Transportation facilities
Facilities inside
ActivitiesPhysical activitiesRunning, riding, boating, camping, exercising, fishing
Recreational activities
AtmosphereNatural atmosphereBeautiful, comfortable, natural, ecology, sport, spirit
Cultural atmosphere
ExternalCostConsumption costFree of charge, subway access to the south gate
Time cost
SurroundingsTourism hotspotsThe Bird’s Nest, the Water Cube, the tower, museum
Table 5. Keyword prioritization from SMD and conventional surveys.
Attractive FactorsEigenvalue CentricityRankFrequency StatisticsRank
Natural atmosphere0.33813701
Plant0.33223542
Water0.32931397
Consumption cost0.31241805
Physical activities0.30753283
Recreation activities0.30662454
Time cost0.28771198
Physical facilities0.2878939
Surroundings0.2891776
Wetland0.231104512
Cultural atmosphere0.165114711
Artificial landscape0.138124314
Mountain0.138135210
Transportation inside0.103144413
Recreational facilities0.1151115
Table 6. Keyword prioritization from SMD and conventional surveys. In both cases, users were extremely impressed by the overall natural atmosphere of the Beijing Olympic Forest Park. In texts on social media, users typically described the atmosphere of the park initially as “pure and fresh,” “good environment,” or “forest oxygen bar,” and then proceeded to express interest in related phenomena. Thus, it can be surmised that the ecological goal of the original design is well perceived by the public.
Attractive LevelsFrom SMDFrom Survey
First class (core attractive factors)Natural atmosphereConsumption cost
PlantsNatural atmosphere
Physical activitiesPlants
Second class (fair attractive factors)WaterTime cost
Consumption costWater
Recreational activitiesWetland
SurroundingsPhysical activities
Time costRecreational activities
Third class (marginal attractive factors)Physical facilitiesPhysical facilities
Transportation insideTransportation inside
Recreational facilitiesRecreational facilities
WetlandArtificial landscape
Artificial landscapeMountain
MountainSurroundings
Cultural atmosphereCultural atmosphere
Table 7. Comparative strength and weakness of SMD and survey in landscape assessment.
Comparative ItemsSMDSurvey
Data amountLargeSmall
Data structureUnstructuredStructured
Data coverageGeographical and demographic biasCan be purposely sampled
Data costFreeExpensive
RespondentsInherently linkedCan be purposely sampled
Data gatheringVolunteered dataForced responses
Data contentThin data with low informationThick data
Data focusEvent-oriented or exciting informationBoth exciting and everyday information
Generation ProcessEmotionalRational
Data interpretationRelatively difficultRelatively easy

