Article

Early Forecasting of Rice Blast Disease Using Long Short-Term Memory Recurrent Neural Networks

1
Crop Cultivation & Environment Research Division, National Institute of Crop Science, Suwon 441-853, Korea
2
Department of Financial Engineering, Ajou University, Worldcupro 206, Yeongtong-gu, Suwon 16499, Korea
3
Department of Data Science, Ajou University, Worldcupro 206, Yeongtong-gu, Suwon 16499, Korea
*
Author to whom correspondence should be addressed.
Sustainability 2018, 10(1), 34; https://doi.org/10.3390/su10010034
Submission received: 26 November 2017 / Revised: 21 December 2017 / Accepted: 22 December 2017 / Published: 23 December 2017
(This article belongs to the Section Sustainable Agriculture)

Abstract

:
Among all diseases affecting rice production, rice blast disease has the greatest impact. Thus, monitoring and precise prediction of the occurrence of this disease are important; early prediction of the disease would be especially helpful for prevention. Here, we propose an artificial-intelligence-based model for rice blast disease prediction. Historical data on rice blast occurrence in representative areas of rice production in South Korea and historical climatic data are used to develop a region-specific model for three different regions: Cheolwon, Icheon and Milyang. A rice blast incidence is then predicted a year in advance using long-term memory networks (LSTMs). The predictive performance of the proposed LSTM model is evaluated by varying the input variables (i.e., rice blast disease scores, air temperature, relative humidity and sunshine hours). The most widely cultivated rice varieties are also selected and the prediction results for those varieties are analyzed. Application of the LSTM model to the accumulated rice-blast disease score data confirms successful prediction of rice blast incidence. In all regions, the predictions are most accurate when all four input variables are combined. Rice blast fungus prediction using the proposed LSTM model is variety-based; therefore, this model will be more helpful for rice breeders and rice blast researchers than conventional rice blast prediction models.

1. Introduction

Rice is the most important crop not only in Asia but is also a staple food in many other countries. Currently, approximately 5.6 billion people (80% of the world’s population) have rice as their staple food and according to the World Agricultural Supply and Demand Estimates (WASDE), the annual worldwide rice consumption in 2015 was 4.842 million tons, with rice production being 4.71 million tons. Rice consumption is expected to reach 8 million tons in 2030 owing to population and economic growth. It is predicted that in 2050, 9 billion people will be dependent on rice for food [1]. Rice blast disease (also simply called “blast”), which affects most of the rice-producing countries, has already spread to approximately 85 countries [2], leading to loss of food that could feed 60 million people per year. The rice blast pathogen Magnaporthe oryzae is a fungus that causes disease throughout the rice growth period and develops in the node, leaves, collars, necks, panicles and seed. The phases of the disease are generally divided into leaf blast and panicle blast. However, depending on the onset area and onset time, the blast may progress through leaf, collar and neck node and panicle blast phases.
The rice variety, environmental factors and pathogens influence the occurrence of blast. In particular, when the environmental conditions are favorable to rice blast fungus during harvest season, an extremely large loss of yield can occur. In rice-blast-susceptible varieties, yield reductions of up to 65% have been reported [3]. Environmental factors associated with disease development include weather conditions, fertilizer management and soil and fungicides control. Because recent weather conditions and fertilizer management methods, conditions have not been favorable to the occurrence of rice blast and there has been a decrease in the occurrence of leaf blast. In particular, higher temperatures during the growing season due to global warming and the disappearance of the monsoon in July [4], along with the spread of cultivation techniques using less nitrogen-based fertilizers, are considered to be the main reasons for the decreased leaf blast occurrence. In addition, cultivation and propagation of blast-resistant rice varieties were initiated in the 1960s and this change seems to have made the most significant contribution to the reduction of rice blast [5].
However, despite the ongoing spread of new blast-resistant rice varieties each year, a number of cases have been reported in which resistant varieties were converted into susceptible varieties within a few years [6]. National Institute of Crop Science, Rural Development Administration (RDA), Suwon, Republic of Korea, is continuously monitoring the occurrence of rice blast; in addition, it has been monitoring the responses of both newly bred and existing rice varieties to rice blast in test sites throughout the country. The aim is to develop methods to prevent the outbreak of rice blast. However, as many farmers prefer rice cultivars with superior taste to disease-resistant varieties, it is highly likely that the damage caused by the disease will increase. Therefore, it is desirable to prevent damage by introducing various resistance genes into the cultivars that are primarily distributed in farms [7].
In recent years, use of chemical fertilizers has reduced to meet consumer demand for environmentally friendly agricultural products; however, this can lead to an increase in the occurrence of rice blast. Further, in 2016 and 2017, rice blast disease became a serious problem in Bangladesh and India. Moreover, blast disease affects not only rice but also wheat. Therefore, prevention of blast disease is highly necessary and early prediction of its occurrence will be very helpful in achieving the abovementioned aim.
Most existing studies on rice blast fungus prediction are based on meteorological variables such as the leaf wetness duration, temperature, relative humidity and rainfall associated with blast occurrence and progression; these studies also consider other factors such as the use of host varieties and nitrogen fertilization. The correlations among the considered variables in these researches are then analyzed [8,9,10,11]. In these studies, the most commonly used weather variables are air temperature, relative humidity and rainfall and researches were conducted to construct blast simulation systems based on such weather information [12]. However, those studies were hindered by difficulties in identifying the mathematical relationship between blast disease and environmental factors and the complexity of the mechanism involving the plant, pathogen and environmental factors; thus, practical application of those developed models is difficult.
In addition to mathematical formulations of the mechanism involving blast and environmental factors, attempts are also being made to predict rice blast disease using data-based machine learning methods. Previously, Kaundal et al. used weather variables such as temperature (max, min), relative humidity (max, min), rainfall and the number of rainy days per week for multiple regression, back propagation neural networks, generalized neural networks and support vector machine (SVM) methods, with the aim of predicting blast occurrence in India [13]. The prediction results were compared with the actual blast occurrence; based on the results, the SVM method was found to be the most suitable machine learning method for blast disease prediction. These researchers now provide an SVM-based rice blast prediction web server. However, in the study by Kaundal et al. [13], the historical patterns of the input variables (such as the temperature, relative humidity and rainfall) were not considered in the modeling. In addition, non-meteorological variables were not included.
Malicdem and Fernandez have proposed a blast prediction model for the northern Philippines using an artificial neural network and SVM [14]. Under given weather conditions, models for classifying possible rice blast occurrence in specific rice growth stages and for predicting onset severity were generated. Principal component analysis (PCA) of the effect of weather data on the rice blast disease onset showed that precipitation had the greatest influence (48%), followed by the temperature minimum (31%), temperature maximum (17%) and humidity (3%). In that study, however, no non-weather-related variables were used and the temporal patterns of the weather variables were not considered during modeling. In addition, the developed model predicts blast disease occurrence based on the weather conditions of the same year; thus, the capability for preemptive blast disease prevention is limited.
A potentially effective approach to blast disease prediction involves the use of artificial intelligence techniques. In artificial neural networks, a shallow neural network with one hidden layer is mainly employed, because of data and computational power limitations. Recently, deep-learning-based algorithms called “deep neural networks” have been used for image classification, face recognition and speech recognition and have been attracting attention because of their high accuracy in many fields [15,16,17]. Deep-learning-based models perform feature extraction and classification simultaneously in deep neural networks, unlike traditional machine learning methods that extract hand-crafted features and then input features extracted from simple classifiers such as SVMs. The ability to learn important features from data is their most important advantage; therefore, deep neural network-based algorithms have high performance if provided with sufficient data [18].
Among deep-learning algorithms, recurrent neural networks (RNNs) can effectively learn sequential patterns from data containing temporal or sequential information. In particular, long short-term memory networks (LSTMs), a kind of RNNs, are becoming prominent [17,19]. LSTMs are designed to solve the vanishing gradient/exploding gradient problem of conventional RNNs and can efficiently capture long-term dependencies through memory cells and gates [20]. Many recent studies have shown that LSTMs perform better than basic deep feedforward neural networks for time series data [21,22,23].
In this study, to establish a system for early prediction of rice blast disease occurrence, we apply artificial intelligence techniques to past degree of blast onset data and historical climatic data, unlike previous studies that require climate information in the same year as the forecasting time. A region-specific model that can predict the incidence of rice blast in the target area for the coming year is developed; this is achieved by applying LSTMs to data on the past rice blast disease scores in four representative rice-producing regions in South Korea and to the historical climatic data of the target area. In the proposed model, the data for the year to be predicted is not used as an input, instead, only data for the previous three years are used. In addition, the influences of the LSTM input factors, i.e., rice blast disease scores, air temperature, relative humidity and sunshine hours, on the predictive accuracy are analyzed. Among the various rice cultivars cultivated in Korea, the rice varieties cultivated over the largest area (according to the Korean RDA) are selected for evaluation of the rice blast prediction results.
The Rural Development Administration is conducting inspections and forecasting regarding the occurrence of disease and insect pests, including rice blast in South Korea. The decision of whether or not to control pests is based on the information obtained from these inspections and forecasting. This information is sent to the municipal agricultural technology center to help farmers perform timely pest control. This proposed system for the early prediction of the occurrence of rice blast disease can contribute to the disease management of related administrative departments. The proposed forecasting system is developed based on regions and cultivars and hence a user who simply chooses a cultivar and a region by creating a web-server based system will help the management of an individual rice grower by providing the rice blast prediction result of the selected cultivar of the selected region.
The remainder of this paper is organized as follows. Section 2 describes the data and LSTMs, while Section 3 describes the experimental procedures. In Section 4, we present and discuss the experimental results and draw conclusions.

2. Materials and Methods

2.1. Data

In this study, we used rice blast disease monitoring data and climatic data to generate a rice blast disease early prediction model. Field blotting tests were conducted to monitor rice blast disease occurrence; the method and data are described in Section 2.1.1. Details of the climatic data are given in Section 2.1.2.

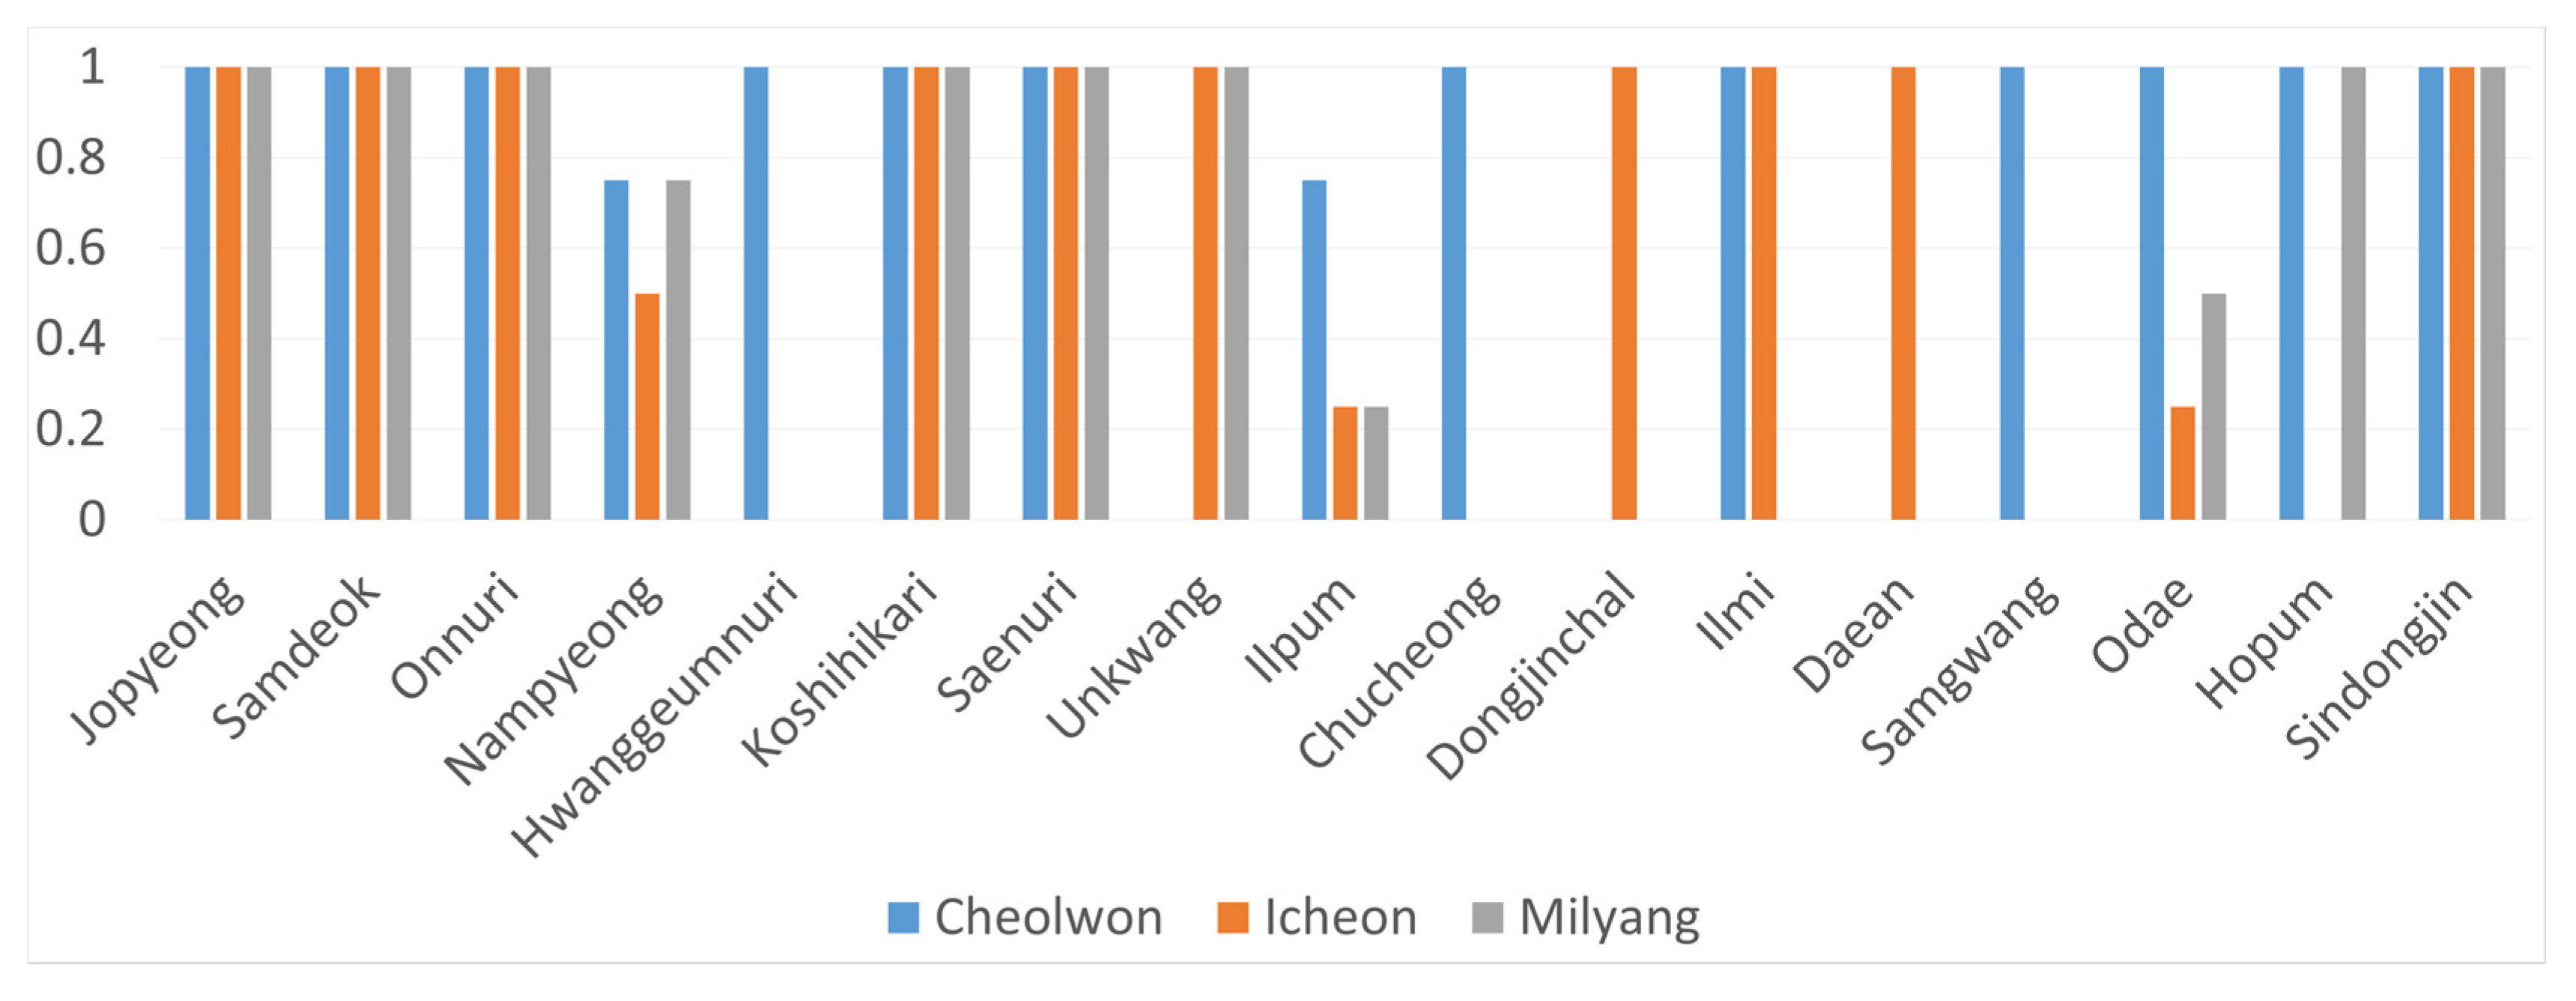
2.1.1. Rice Blast Disease Score Data

The National Institute of Crop Science, RDA, conducted field trials in 12 regions (Icheon, Suwon, Cheolwon, Jinbu, Iksan, Unbong, Gyehwa, Milyang, Sangju, Yeongdeok, Yesan and Naju) of South Korea from 2003 to 2016. In each field trial, 358 kinds of primarily cultivated and reference cultivars were planted. The distances between cultivars were 10 cm (widthwise) and 20 cm (lengthwise) for each variety and sowing was performed at the end of June. In every 10 acres, 24, 9 and 9 kg of nitrogen, phosphoric acid and chlorine chloride were used, respectively. The highly susceptible cultivars (i.e., the Nakdong and Hopyeong cultivars) were sown using a spreader. Thirty days after sowing, the degree of rice blast onset was investigated according to the field test method. The rice blast disease incidence was graded using measures of 0–9, where ratings of 0–3 indicate resistance, 4–6 indicate moderate resistance and 7–9 indicate susceptibility [24]. For each variety, disease scores were awarded based on the incidence of rice blast disease in each year and region. Table 1 presents selected data from 2013, i.e., information on the rice blast incidence for the Nampyung, Ilpum and Dongang cultivars in six provinces subjected to the RDA test. Note that no information is available for the Dongang cultivars in the Sangju region, because this test was not performed.
The purpose of the present study is to develop a model to estimate the blast incidence a year in advance using data from the previous three years in the same area. Therefore, data on the blast disease incidence in the same area and for the same variety for at least four consecutive years were required (where the final-year data are used to evaluate the prediction). However, the data collected through the field blotting tests discussed above indicate that the varieties planted each year and within each region differ. Therefore, it was necessary to reduce the data usage area to allow use of as much data as possible. Tests were conducted in the four major rice-growing regions of South Korea—Cheolwon in the north, Icheon in the center and Milyang and Naju in the south. We constructed an observation system using the rice blast monitoring data for those four areas. Figure 1a,b show the geographical locations of those four areas on the map of South Korea and the latitude and longitude of each region, respectively. Note that a regional prediction model was created in this study. Because there were two southern regions among the four regions, only Milyang was selected for development of this model; thus, the blast-disease predictive model was created for application to three regions, namely, Cheolwon, Icheon and Milyang. The data preparation methods for the LSTM-based rice blast prediction model are described in detail in Section 3.1.1.

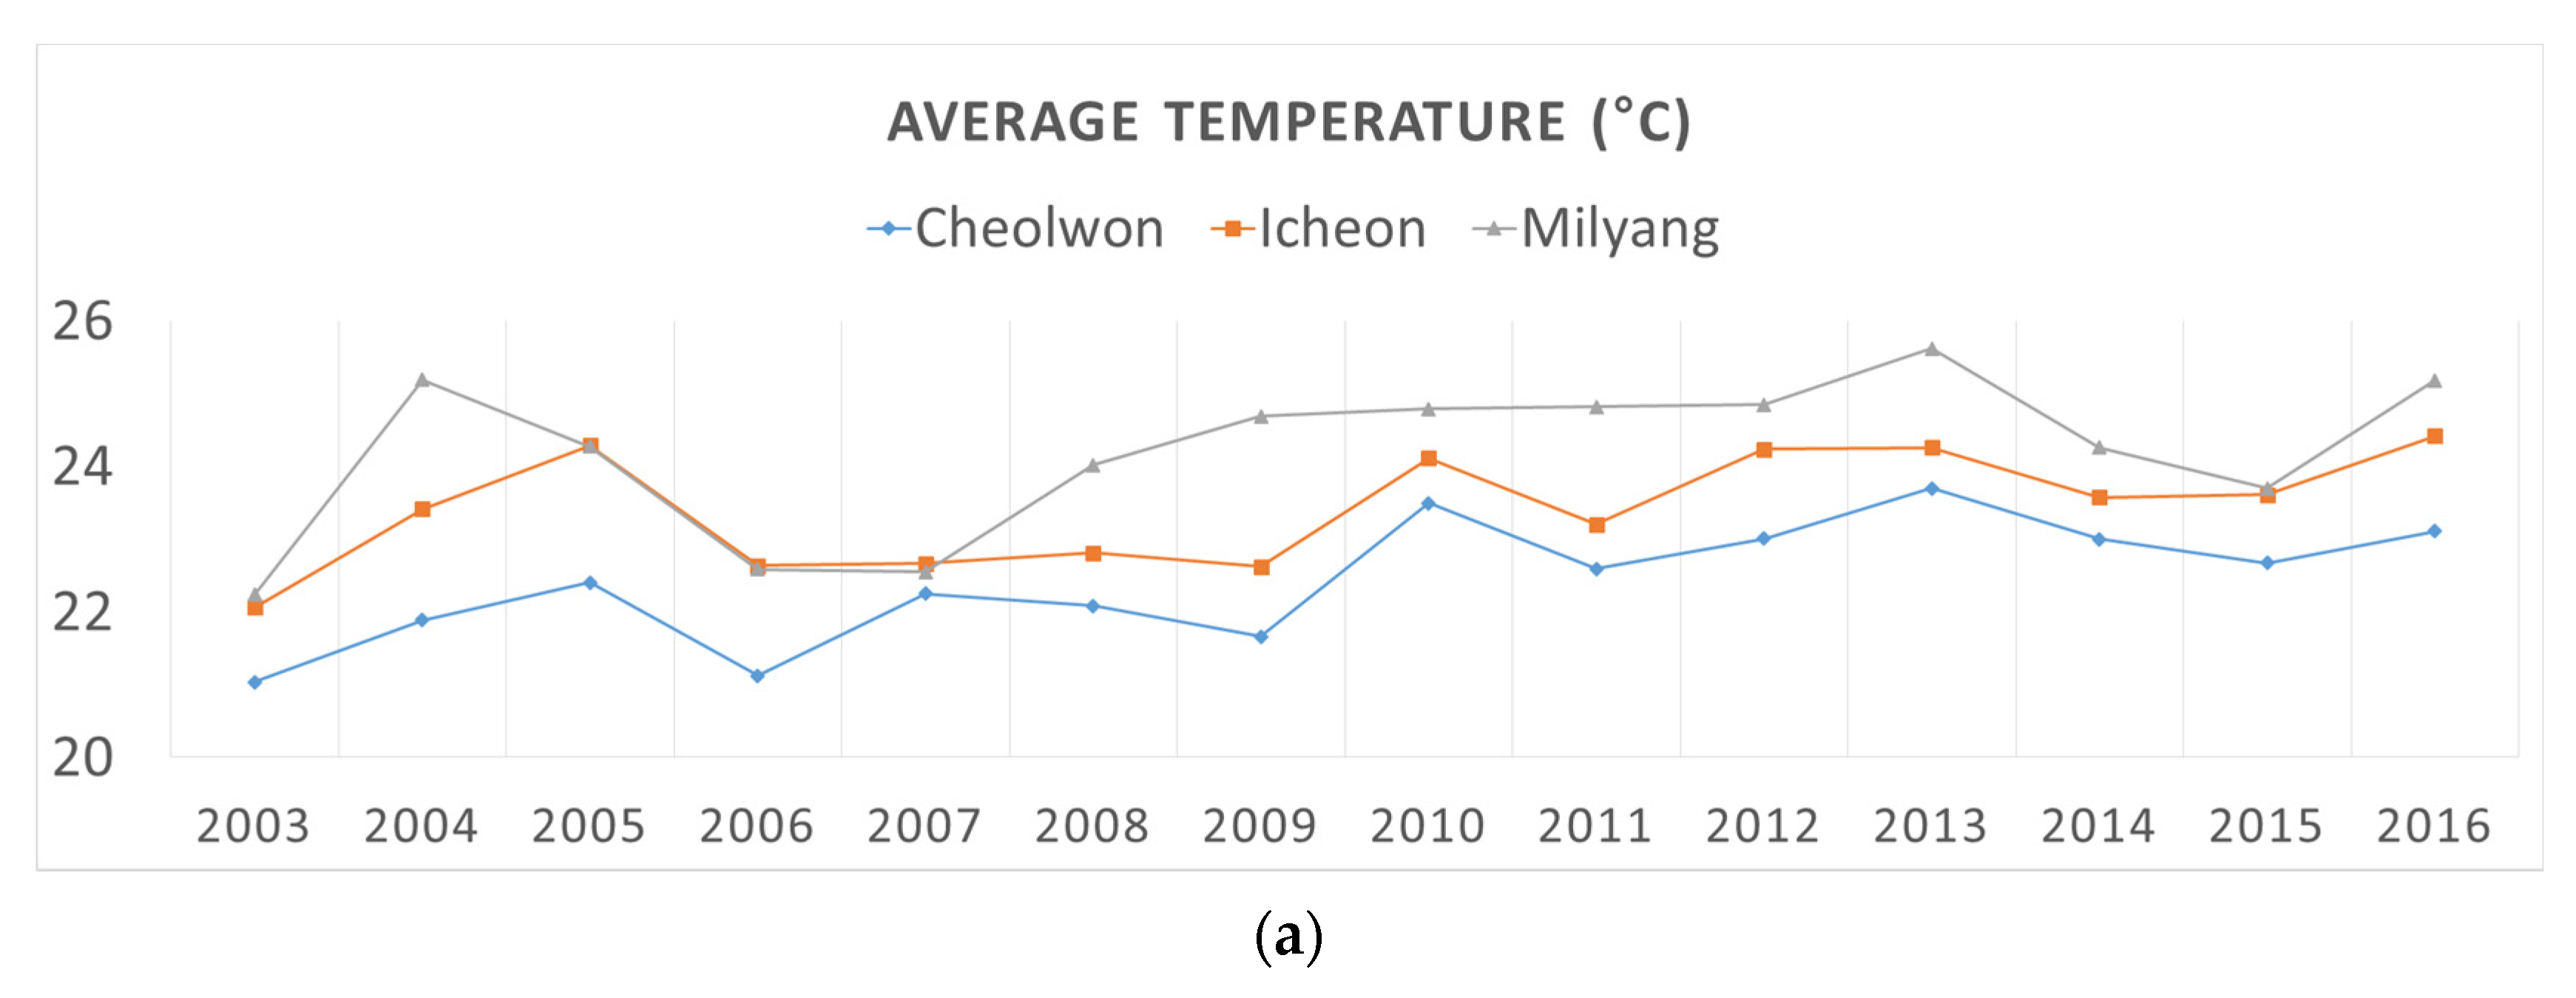
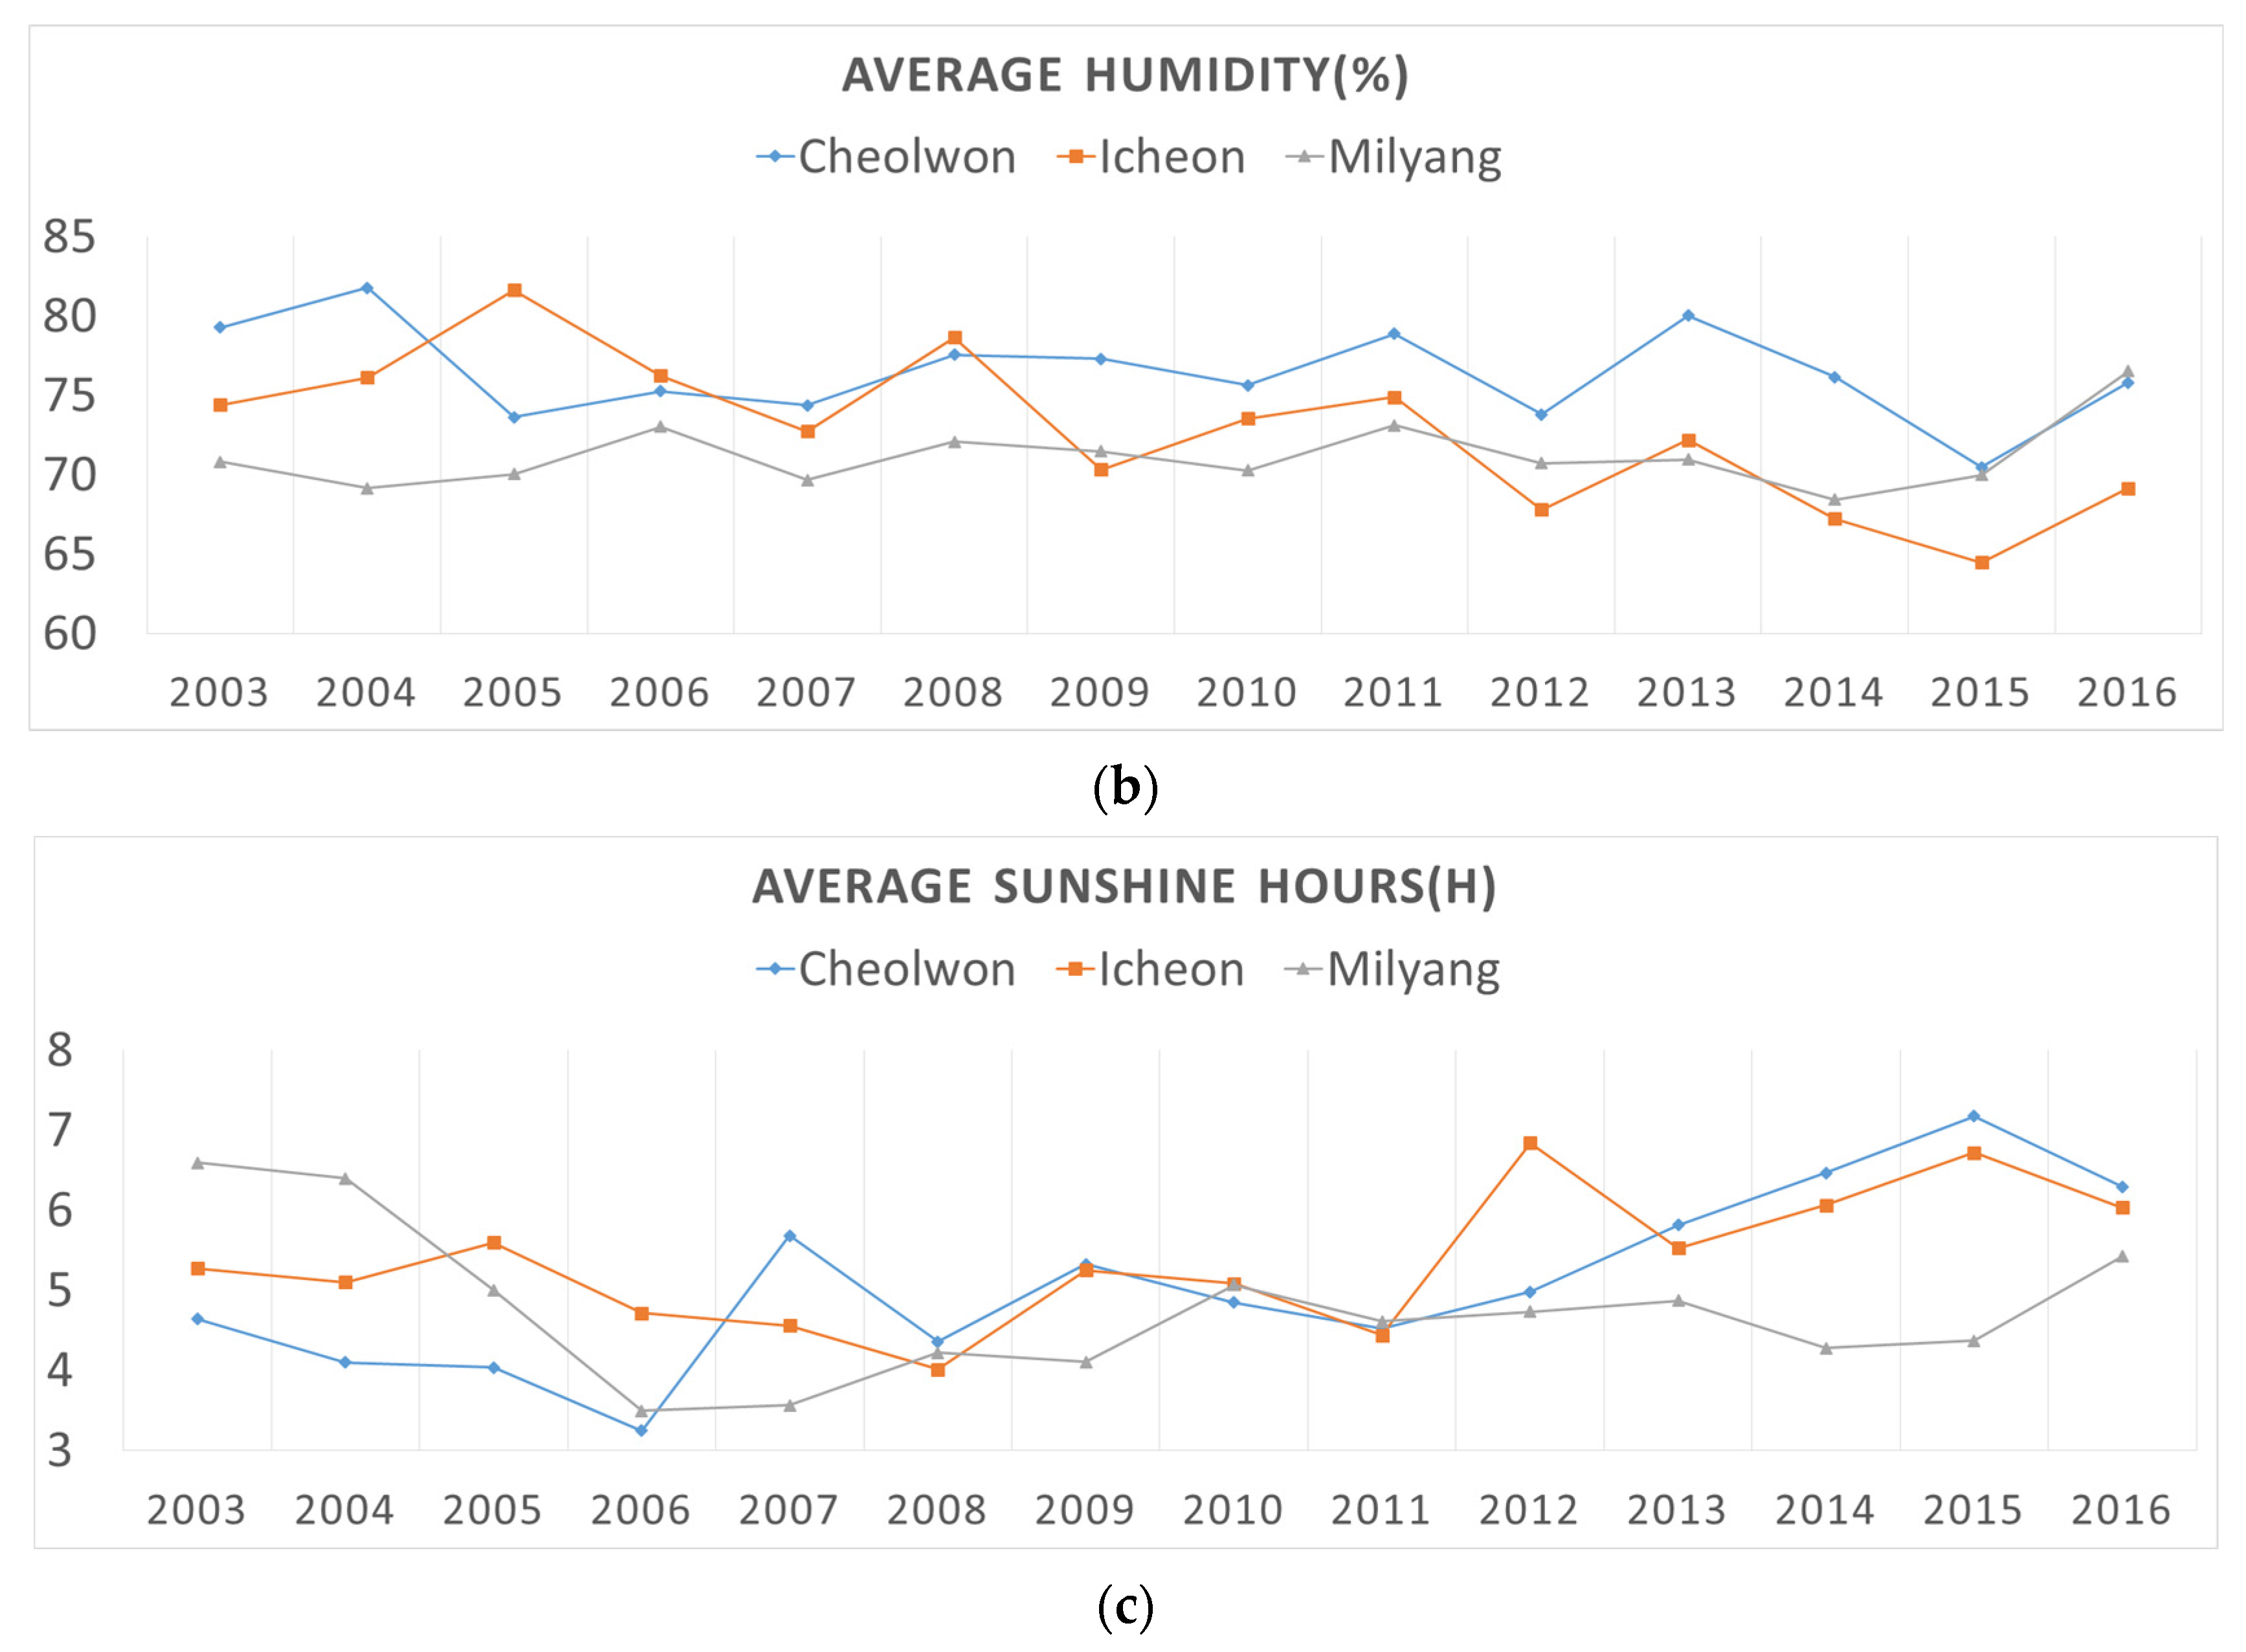
2.1.2. Historical Climatic Data

The rice blast occurrence factors include environmental factors such as climatic and soil conditions, along with fertilizer application methods [25,26]. Therefore, incorporation of information on environmental factors in the prediction model helps improve the prediction accuracy. Data on soil conditions and fertilizer application methods are unavailable; however, past climate data can be obtained from the Korean Meteorological Agency. Therefore, this study considered data on rice blast incidence scores as well as climate from three areas: Cheolwon, Icheon and Milyang. Climatic data were obtained for June and July in the period between 2003 and 2016, which is consistent with the rice-blast data collection period. Among the climate data, various factors influence rice blast disease, such as humidity and rainfall [12,27,28]. Here, three major factors were selected, i.e., average temperature (°C), relative humidity (%) and sunshine hours and the daily data were obtained. Sample results are listed in Table 2. This raw climatic data was subjected to data preprocessing. Further details are given in Section 3.1.2.

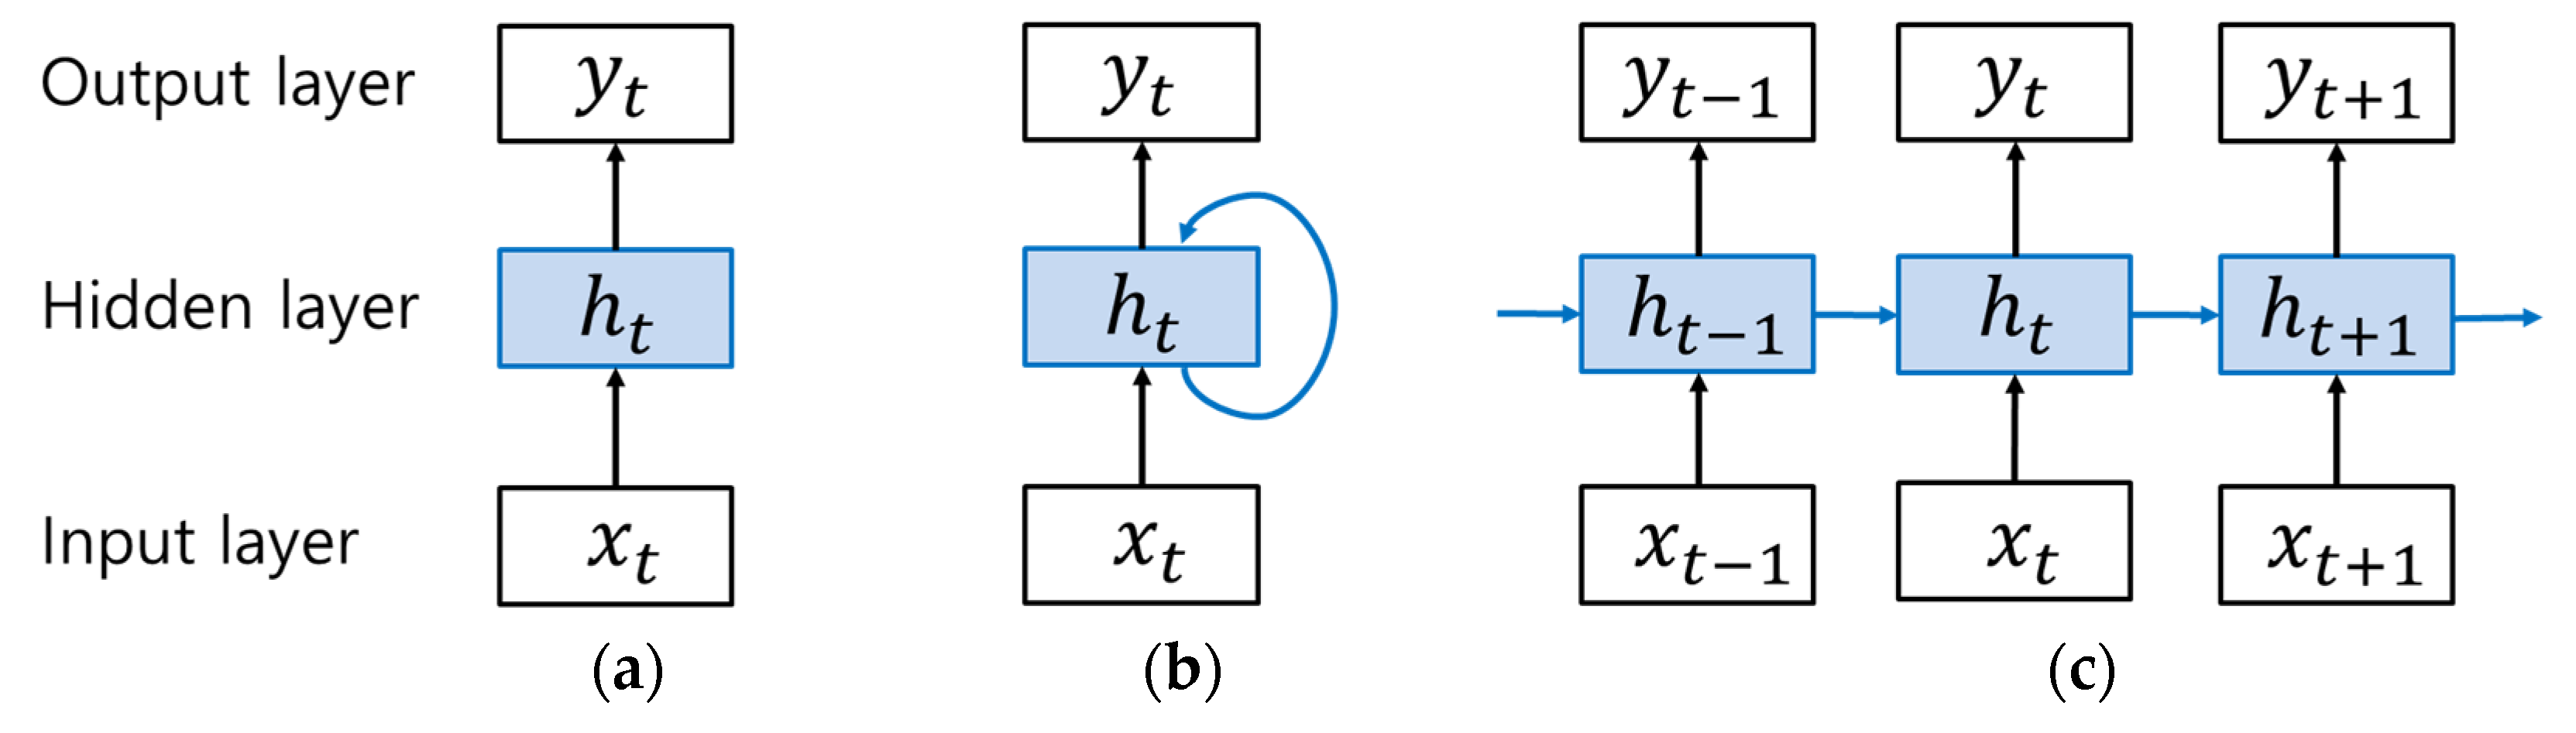
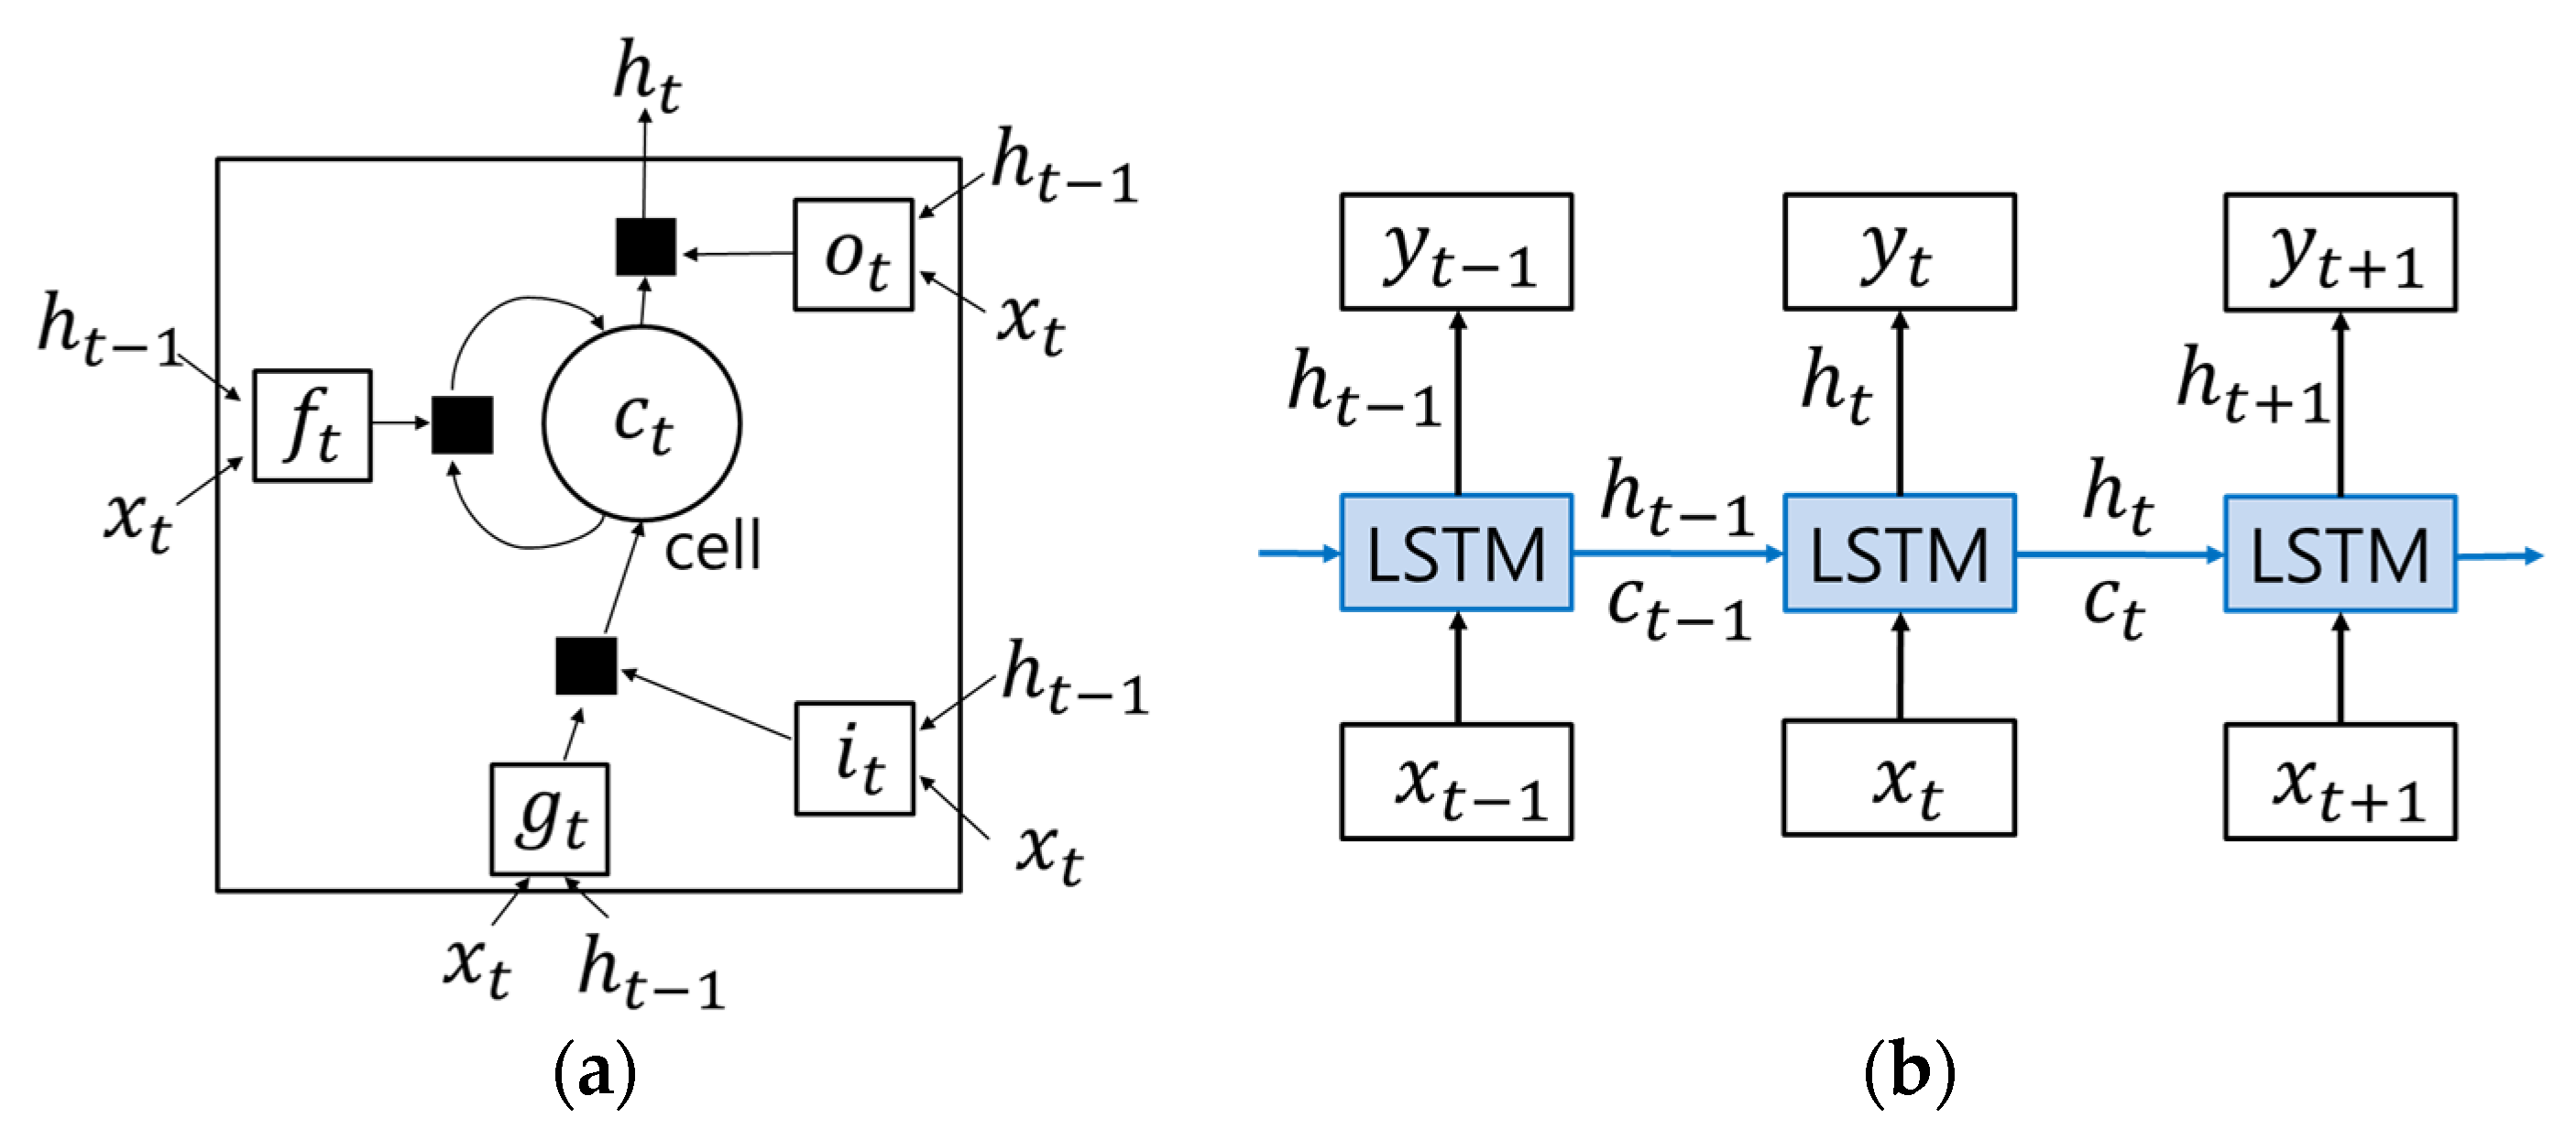
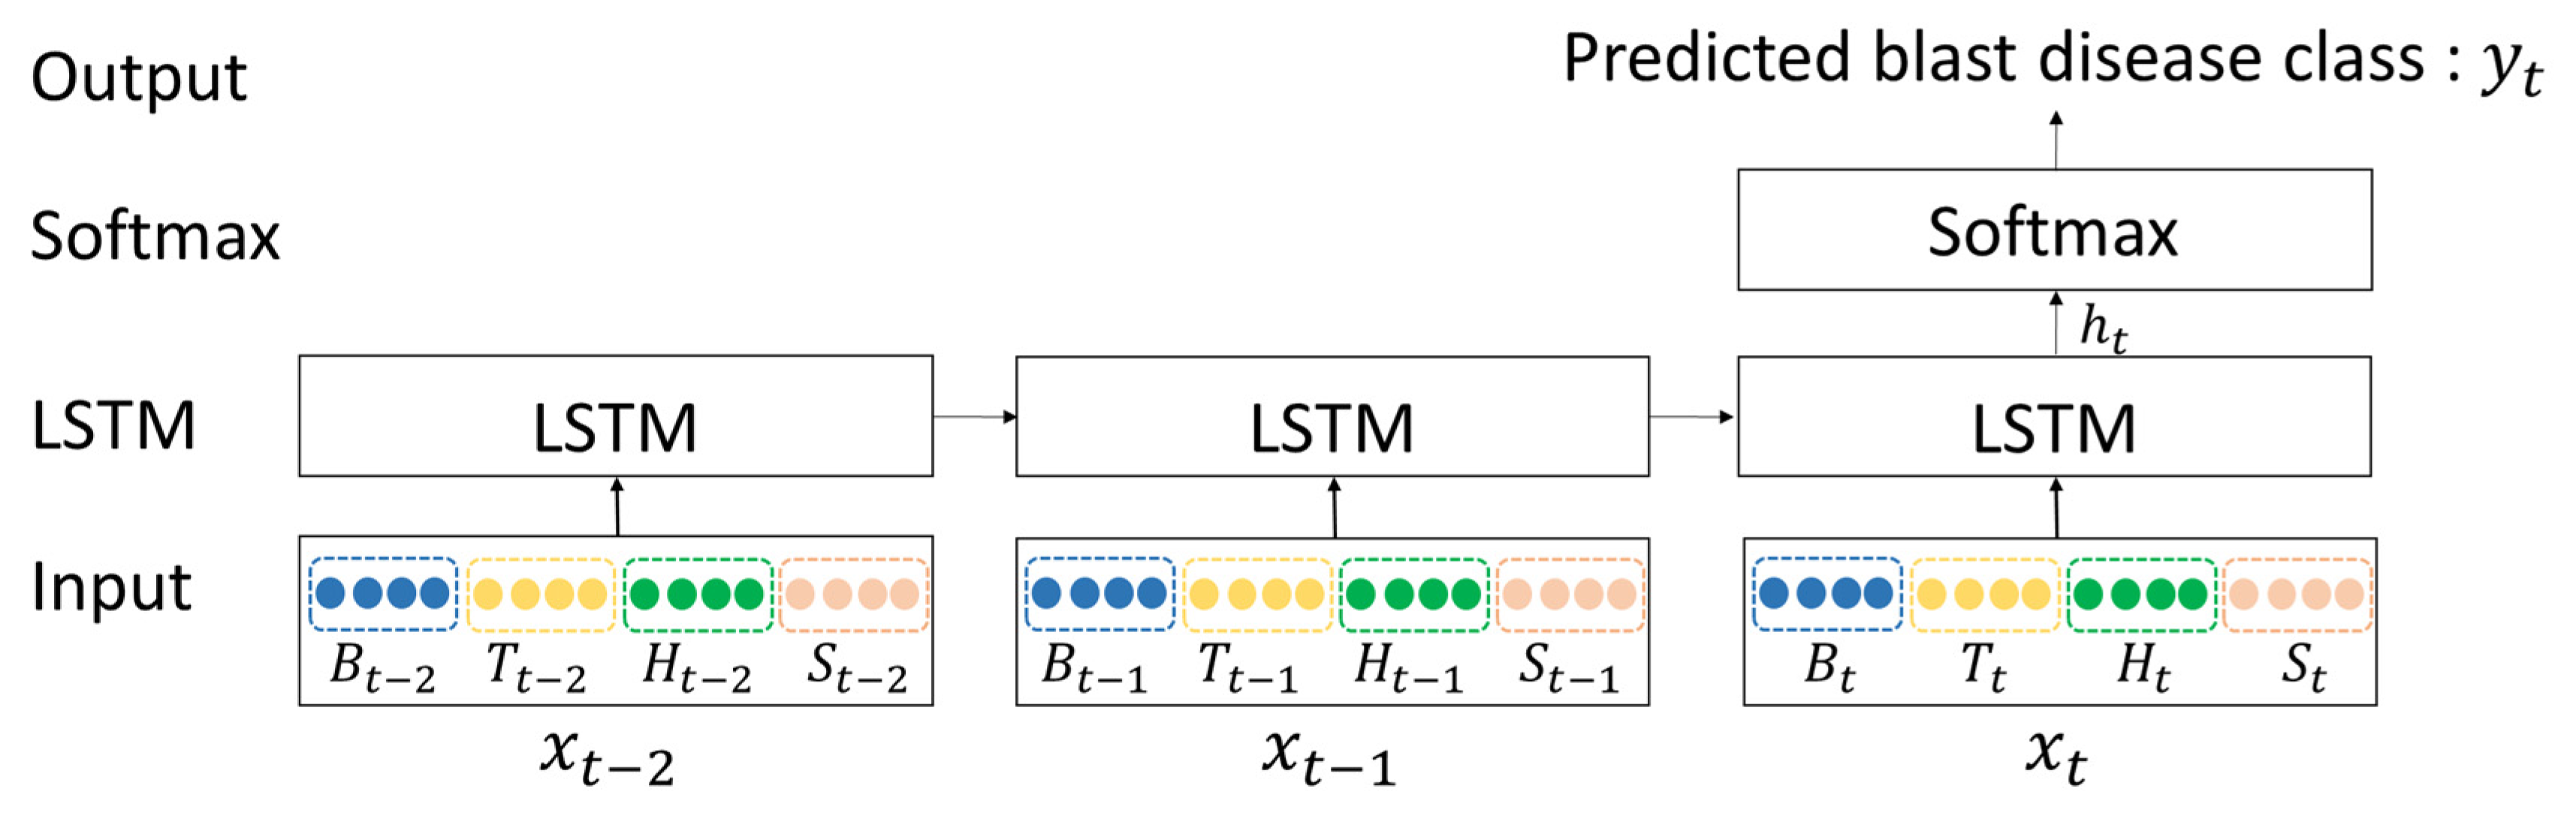
2.2. Long Short-Term Memory (LSTM) Recurrent Neural Networks (RNNs)

To develop a model for rice blast incidence prediction in the following year using past data on climate and rice blast incidence in four regions, we cast this multivariate time-series problem as a three-class classification. Recently, RNN-based methods for learning temporal patterns have been applied to time-series data analysis models rather than deep feed-forward neural networks [21,22,23]. Among the RNN methodologies, a methodology based on LSTM networks, which can prevent vanishing gradient problems [29] and reflect long-term dependency, has been attracting attention [17,19,22]. Therefore, in this study, LSTMs were employed to determine the temporal patterns in the rice blast disease incidence data. In this section, the RNNs and LSTMs used in this study are explained.
For data incorporating time-series or sequences, it should be possible for sequential and temporal patterns to be learned; however, deep feed-forward neural networks are difficult to train. To overcome this drawback, RNNs, which are networks of neurons with recurrent connections, have been developed [30]. These recurrent connections or internal loops (called “feedback connections”) can reflect temporal information during training. The RNN concept is illustrated in detail in Figure 2.
Here, x t   is the input layer, h t is the hidden layer and y t   is the output layer. Figure 2a shows a feedforward neural network with one hidden layer. This neural network is computed in one direction from x t   to h t and finally to y t and can be mathematically expressed as follows:
h t = f 1 ( U x t + b 1 ) ,
y t = f 2 ( V h t + b 2 ) .
Here,   U and V are weight matrices and b 1 and b 2 are bias vectors. Further, f 1 and f 2 are activation functions such as the sigmoid function or hyperbolic tangent function.
Figure 2b shows an RNN structure similar to the feedforward network shown in Figure 2a but with a feedback loop in the hidden layer. In this case, the h t at time t is calculated by receiving input information at time t ( x t ) and using the previous hidden state vector ( h t 1 ) such that
h t = f 1 ( U x t + W h t 1 + b 1 ) .
where W is the weight matrix. The calculated h t value is used to calculate y t value as shown in Equation (2) and, at the same time, to calculate the hidden state h t + 1 at the next time t + 1 . Hence, the temporal pattern can be learned. This RNN can be considered in the unfolded state shown in Figure 2c [31]. As it is spread over time, it is apparent that the hidden state information is continuously reflected in time. In addition, it is apparent that the RNN in the time direction is a very deep neural network. RNNs are mainly trained using backpropagation through time [32]. This is a similar mechanism to standard backpropagation, except that it is back propagated through time rather than through layers.
As described above, as RNNs are very deep neural networks in the time direction, vanishing or exploding gradients can occur [29]. In addition, RNNs can store short-term memory but are vulnerable to long-term dependency in terms of time. To overcome these shortcomings, LSTMs have been designed to hold short-term memory for a longer period. The LSTM network structure is comprised of LSTM memory blocks similar to the hidden neurons in the RNN described above. These LSTM memory blocks are composed of memory cells and gates and play an important role in training long-range dependency, while controlling information storage and flow. Basic vanilla LSTM networks are described here, having LSTM memory blocks with one memory cell ( c t ) and three gates, i.e., the input ( i t ), forget ( f t ) and output gates ( o t ), as shown in Figure 3.
The LSTM layer is calculated using the following equations:
i t = σ ( U i x t + W i h t 1 + b i ) ,
f t = σ ( U f x t + W f h t 1 + b f ) ,
g t = t a n h ( U g x t + W g h t 1 + b g ) ,
c t = f t c t 1 + i t g t ,
o t = σ ( U o x t + W o h t 1 + b o ) ,
h t = o t tan h ( c t ) .
In these equations, U and W are weight matrices and b indicates bias. Further, σ(∙) is the sigmoid function and the symbol indicates element-wise multiplication. Equations (4), (5) and (8) are formulas for calculating the i t , f t and o t gates at time t. The three gates take x t   and h t 1   as inputs, which are multiplied by the weight matrices. The sum of the results is added to the bias term and the sigmoid function of that result is taken. Their outputs range from 0 to 1 and a gate output close to zero indicates gate closure, i.e., the gate does not accept information. Conversely, if the gate output is close to 1, the information is fully entered. Therefore, the information input/output is controlled through these three gates, i.e., these gates are used to calculate c t and h t , which are the main computational components of the LSTM memory blocks. First, c t   is calculated as shown in Equation (7), where the previous cell state ( c t 1 )   is multiplied by f t   and the newly input information ( g t ) is multiplied by i t . Therefore, f t decides the amount of information on c t 1 to be forgotten and i t decides how much newly added information is added to c t . Then, Calculation of h t is performed as shown in Equation (9), where o t is multiplied by taking the activation function in c t   at time t. The h t values are not unconditionally transmitted but are controlled by the o t .
The calculated c t and h t at time t are transmitted in the next time calculation, as shown in Figure 3b. In the h t computation of the basic RNN, only the hidden state of the previous timestep ( h t 1 ) is transmitted. However, in the h t calculation of the LSTM, both c t 1 and h t 1 are transmitted. However, in the output ( y t ) calculation, c t is not transferred and only h t is transmitted.

3. Experiments

To develop early prediction models for rice blast incidence, we conducted experiments to predict the rice blast disease score for the fourth year based on rice blast disease score data and climate data from the previous three years. As described in Section 2.1.1, the rice blast disease scores were divided into three classes to indicate resistance (0–3), moderate resistance (4–6) and susceptibility (7–9). The experimental and analytical procedures were implemented in the order shown in Figure 4.
The experiments and analysis procedure are briefly described here. First, data were generated for training of LSTM models. With this generated data, region-specific models for three regions, Cheolwon, Icheon and Milyang, were developed. Experiments were performed for five combinations of input variables, where the considered input variables were the rice blast disease scores, temperature, relative humidity and sunshine hours. Hence, the input variables important for prediction of blast disease incidence were determined. After training the regional models, the test results yielded by each model were analyzed. In addition, the trained region-specific models were used to predict rice blast disease in the next year using only the three-year rice blast disease scores for any breed. Because the rice blast prediction accuracy for the cultivars, which possess different resistance genes, is also significant, rice varieties popularly cultivated in South Korea were selected. The test results of the region-specific model trained through cultivar-agnostic study were then examined and compared. Details of the data preparation and model training methods are presented in the following Section 3.1 and Section 3.2. The comparative analysis results of the model validation experiment by region and input variable combination are presented in Section 4, along with those for the popularly cultivated varieties.

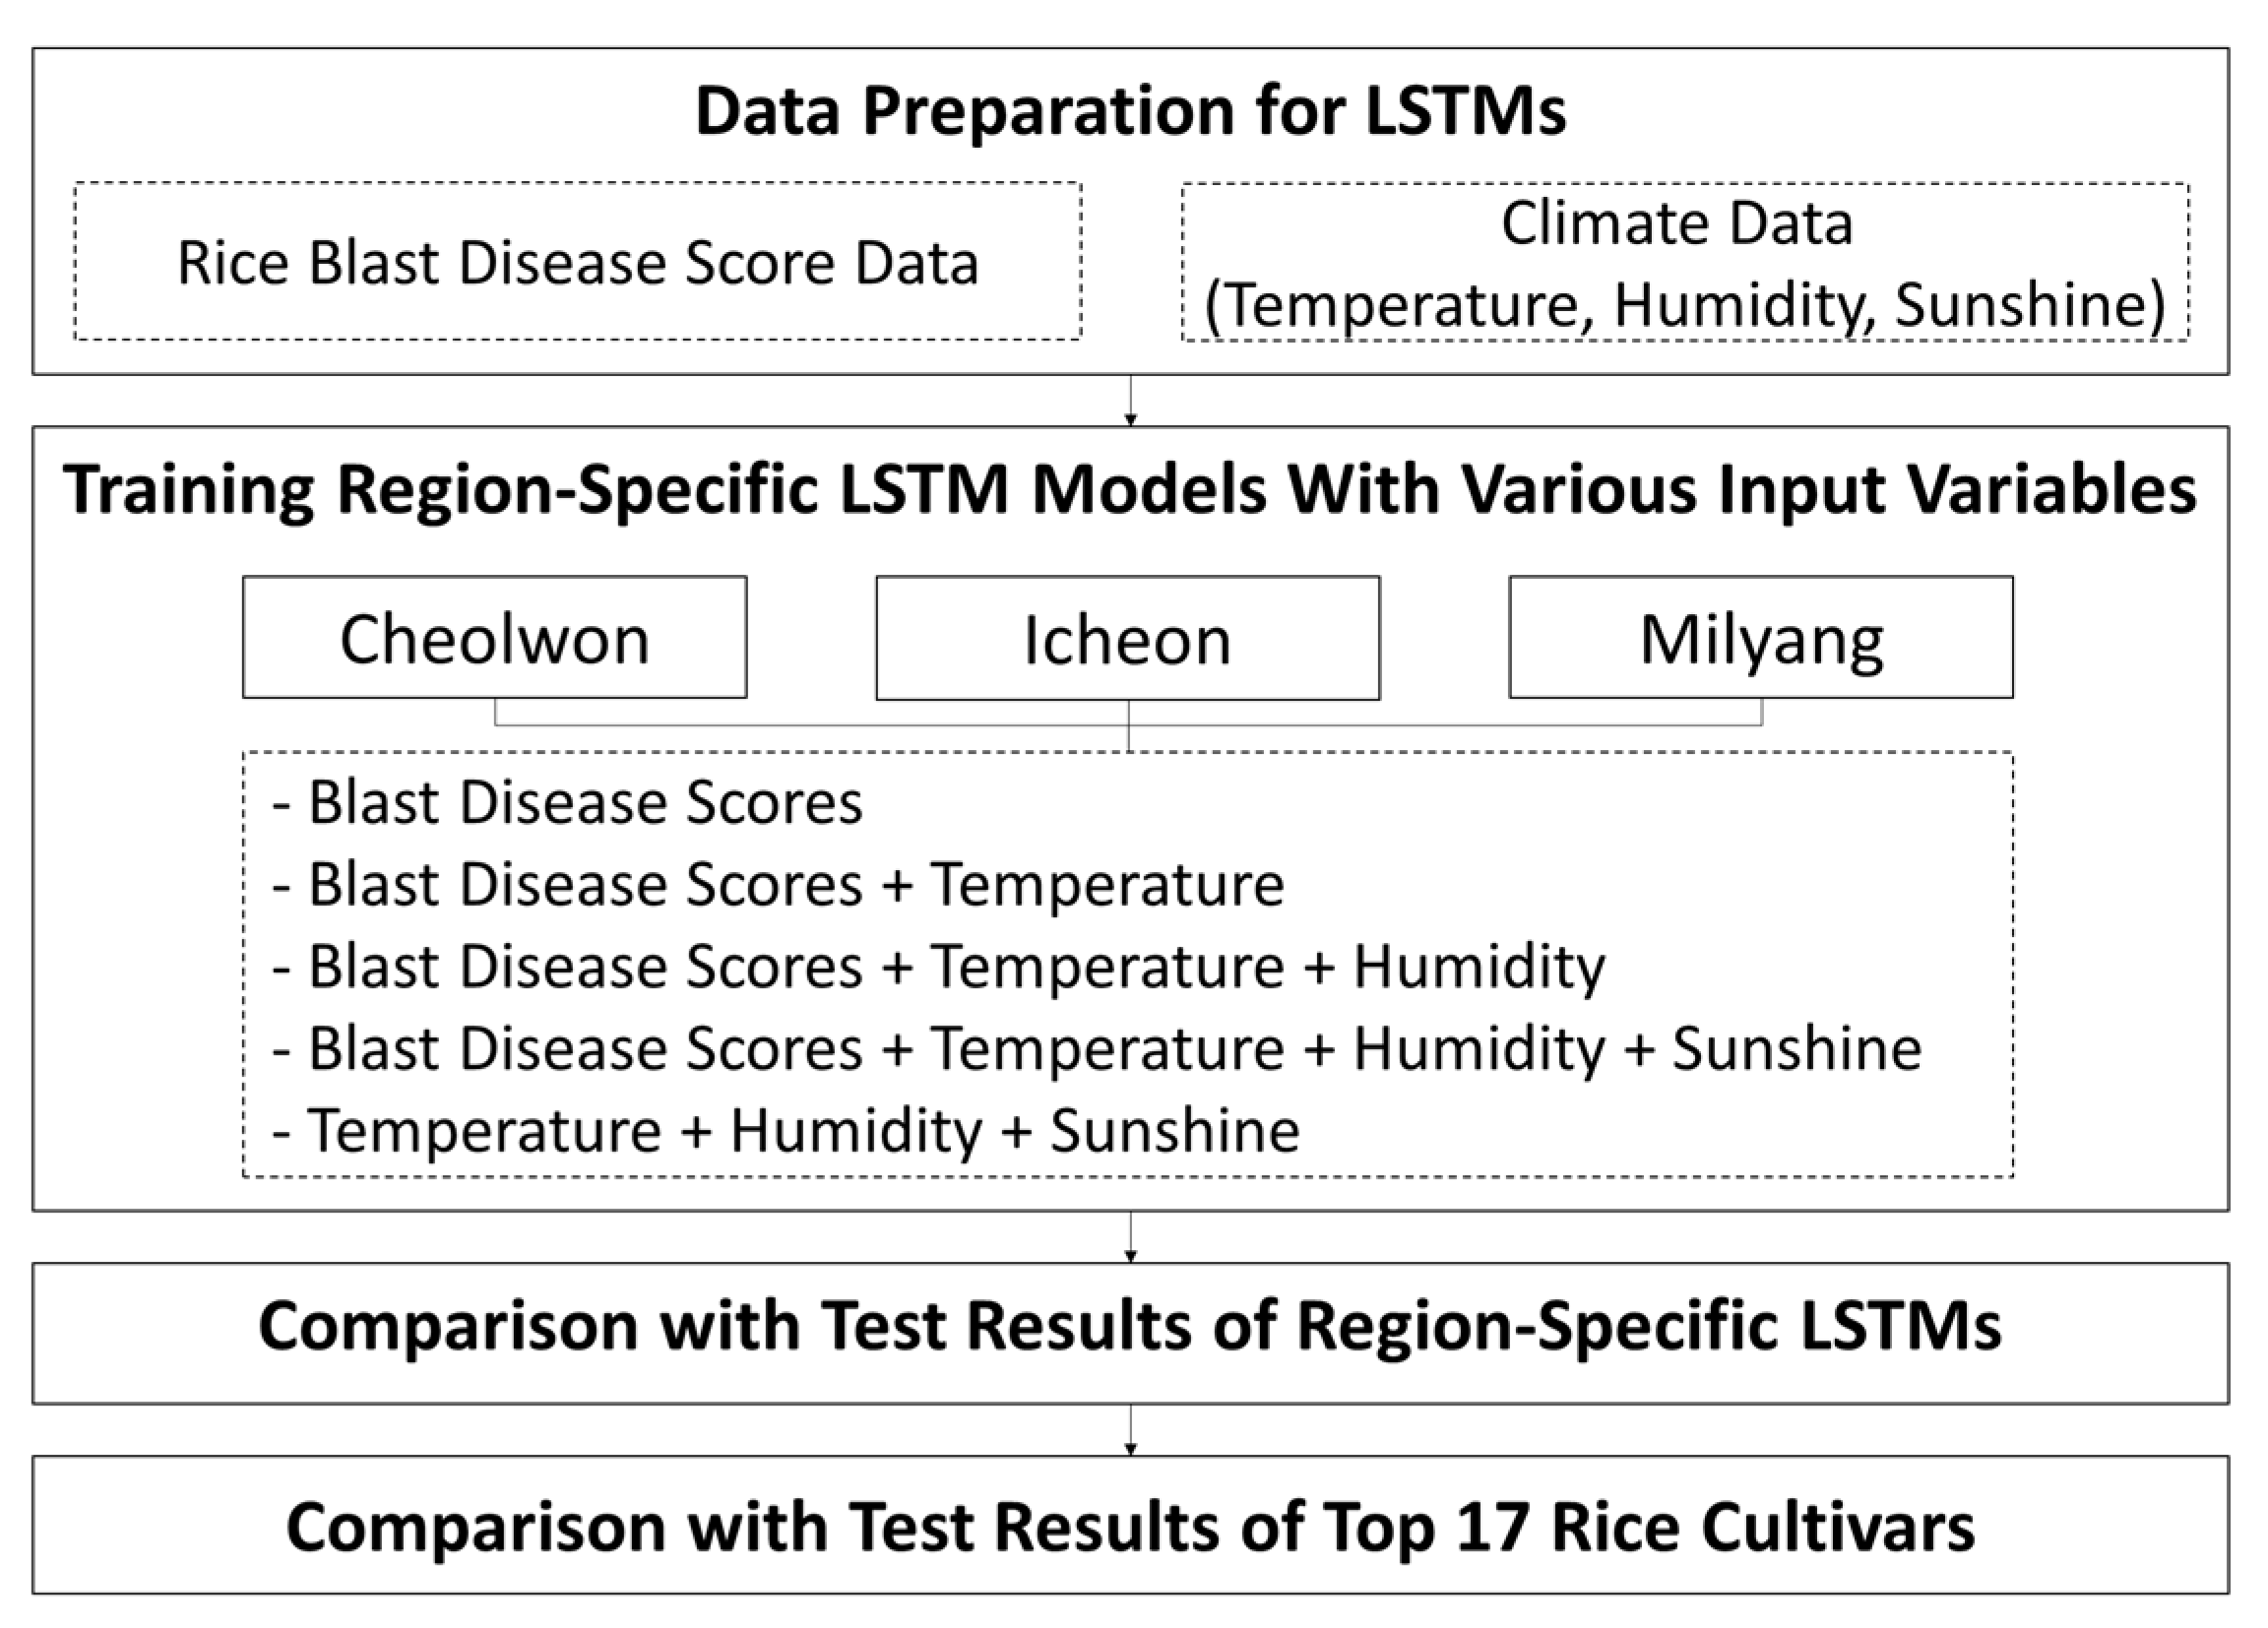
3.1. Data Preparation for LSTMs

The raw data used in this study are described in Section 2.1. To create LSTM models, the model input and output must be defined and data cleansing and preprocessing procedures are required. Therefore, Section 3.1.1 describes the rice blast disease score data preparation for the prediction model generation, while Section 3.1.2 describes the climate data preparation.

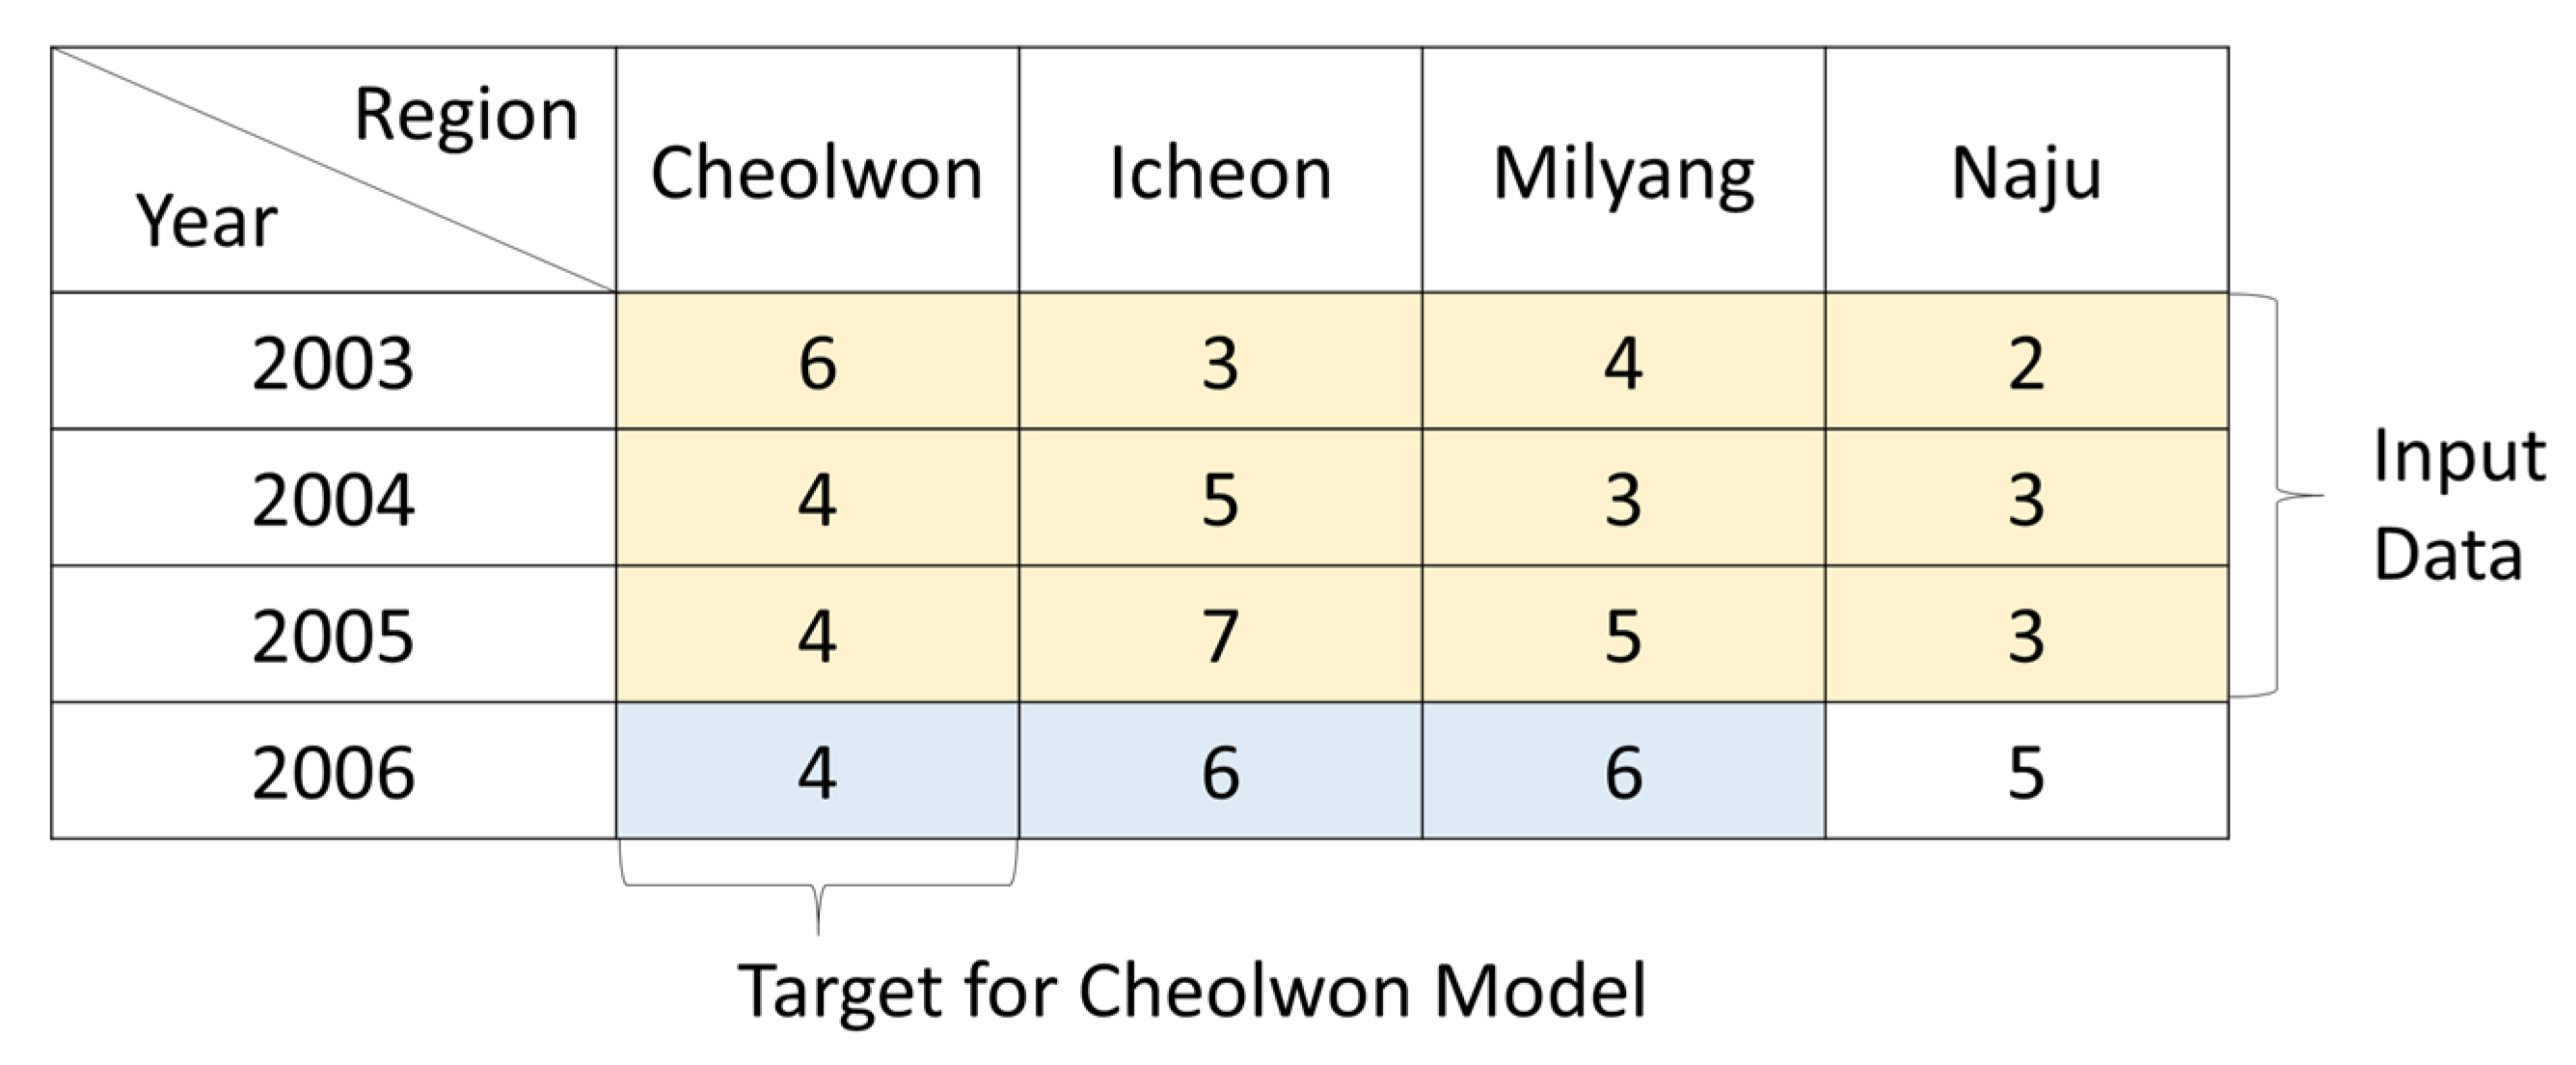
3.1.1. Blast Disease Score Data Preparation

LSTM is a data-driven approach that learns features that are useful in predicting blast disease in the algorithm itself, so the amount of data has a significant impact on algorithm performance [18]. The raw data acquired for the various rice varieties in the 12 Korean regions in the period between 2003 and 2016 include data from Cheolwon, Icheon and Milyang—the regions targeted in this study. However, as the raw data differ among regions and the varieties planted each year also vary, if data from all regions were used, the amount of useable data would be reduced significantly as a result of the many missing values. Therefore, in order to use the maximum possible amount of data and to employ representative data, we narrowed the sample range to data for Cheolwon, Icheon, Milyang and Naju.
As explained above, data for four consecutive years for the same cultivars and each of the four different regions were required. This is because the data for the initial three years are used as the input of the developed model and that for the fourth year is used as the target for the model output value. For example, Figure 5 is an example of the Nampyung cultivar’s 2003–2006 rice blast disease scores for the Cheolwon, Icheon, Milyang and Naju regions. (The score range is set from 0 to 9, as described earlier.) The blast disease scores for each region between 2003 and 2005 were used as inputs and the blast disease scores from 2006 were used as the output values. For example, the 2006 score from Cheolwon was 4, which falls in the middle resistance class.
Using this approach, if any data were missing for a particular variety and for any of the four regions in the four-year period, that dataset was removed from the overall experimental dataset. Hence, a dataset containing a total of 1191 elements was obtained for each region following removal of missing data. Then, 70% of those elements were used as training data (833), 10% as validation data (119) and 20% as test data (239).
The target values of the LSTM model were classified as Classes 0–2, corresponding to resistance (0–3), moderate resistance (4–6) and susceptibility (7–9), respectively. Table 3 lists the number of data elements for the training, validation and test dataset for each region used in the experiment. Note that the total number of training, validation and test data elements listed for each region in Table 3 corresponds to the total number of data elements used for the regional model generation.
Figure 6 shows the class distribution of all data in each region.
The distributions differ from region to region. Cheolwon had a high percentage of Class 0 elements (59%), followed by those for Classes 1 (24%) and 2 (17%). In Icheon, Class 0 was again the most common (44%), with Classes 1 and 2 having smaller and identical proportions (28%). Finally, unlike Cheolwon and Icheon, Class 1 was most common in Milyang (45%), followed by Classes 0 (29%) and 2 (26%).
In addition, the numerical ranges of the data used in this study varied (see Table 1 and Table 2), because different input variables were considered in the model, such as the air temperature, relative humidity and sunshine hours. Therefore, data normalization was required [33]. The rice blast disease incidence values were incorporated into the model as integer data with values between 0 and 9. These values were rescaled to 0 and 1 using the min-max normalization method [34], expressed as
x n o r m = x r a w x m i n x m a x x m i n ,
where x r a w is the original data value, x m i n and x m a x are the minimum and maximum values of the variable, respectively and x n o r m is the normalized value. In the model developed in this study, the blast disease score data as well as the average temperature, relative humidity and sunshine hour values were normalized using Equation (10).

3.1.2. Climate Data Preparation

In order to perform the experiment with additional climatic factors, as described in Section 2.1.2, the daily average temperatures, humidities and sunshine hours of the months of June and July in the period between 2003 and 2016 were obtained for the target regions (Cheolwon, Icheon, Milyang); this was the same period for which the rice blast incidence data were obtained. Therefore, 61 (from 1 June to 31 July) datasets of temperature, humidity and sunshine hour values were obtained for each year. The average temperature, average relative humidity and average sunshine from June to July are graphically shown in Figure 7, to allow identification of climate characteristics and climate change trends by region.
As shown in Figure 7, the average June-to-July temperature in Cheolwon, which is located in the northern part of South Korea, is lower than those of Icheon (center) and Milyang (south). It has been confirmed that the temperatures required for the onset of blast disease are within the range of 22–26 °C. Rice blast is caused by the high humidity occurring after the monsoon season in Korea, i.e., at the end of June. Since 2014, rainfall in Korea has decreased as a result of global climate change and humidity has also been lower than previous years. These meteorological conditions have yielded low blast incidence. The rice blast disease scores used as inputs for the LSTM predictive model in each time step were the four-dimensional data for the Cheolwon, Icheon, Milyang and Naju regions. However, the raw climatic data were 61-dimensional. In that case, model training was difficult, because the rice blast score occupied a very small part of the data. Therefore, the average temperature, relative humidity and sunshine hours were calculated as the averages of 15-day periods (1–15 June, 16–30 June, 1–15 July, 16–31 July) and transformed into four-dimensional data per time step for each climatic variable. These variables were then normalized using Equation (10).

3.2. Model Design

The purpose of this study is to construct an artificial intelligence system that can predict the onset of rice blast based on historical blast disease scores and climatic data. Environmental factors such as climate and soil differ among regions; thus, regional specific models were created, as described above. Three regions, Cheolwon (northern), Icheon (central) and Milyang (southern), which are active rice farming regions in Korea, were set as target prediction regions and localized LSTM model variations were created. To investigate the factors that may contribute to blast disease incidence prediction, various combinations of input variables (rice blast disease score, average air temperature, relative humidity and sunshine hours) were used. Table 4 lists the model variations and input variables used in this study.
In order to determine the usefulness of past rice blast information for predicting blast disease incidence a year ahead, a model variation using only the blast score variable to generate predictions was developed—the first model variation listed in Table 4, Blast_LSTM. Thus, a regional prediction model was developed that uses not only the rice blast scores of the target region but also the characteristics of the target variety regarding the incidence of blast disease in other regions. That is, the blast disease outbreak scores for all four regions (Cheolwon, Icheon, Milyang and Naju) in the first three years were used as the input variables of Blast_LSTM. Thus, for this model variation, the size of the input variable for each time step is 4.
The second through fourth model variations in Table 4 incorporate climate information together with the rice blast disease incidence data for the four regions. In each case, one climate variable is added at a time to analyze the impact of each variable on the rice blast disease incidence prediction accuracy. The second model variation, BlastT_LSTM, incorporates the input variables of Blast_LSTM and the average temperature of the target region. As described in Section 3.1.2, the target regions have very different climatic characteristics; thus, only local information is used for the climate variables. For example, the Cheolwon-area BlastT_LSTM prediction model was created by considering the degree of occurrence of rice blast in the four regions in the past three years and the temperature of the Cheolwon area as the target area. As described in Section 3.1.2, the average data for the two months of June and July in each year, i.e., the average temperature, relative humidity and sunshine hours, were averaged over 15-day periods; thus, these variables have a size of 4 and the size of the input variable for each time step of BlastT_LSTM is 8.
By adding the relative humidity of the target region to BlastT_LSTM, the BlastTH_LSTM model variation was obtained. Similarly, BlastTHS_LSTM was developed by adding the sunshine hour data to BlastTH_LSTM. Therefore, the latter model variation takes the rice blast score information and all the climatic variables considered in this study as input. Finally, in order to analyze the efficacy of blast disease prediction using past climate information only, we created a model variation considering only climatic variables (i.e., excluding the rice blast scores), which we called “Climate_LSTM.” Thus, for the considered input variables, we developed a rice blast prediction model using the LSTM network structure with a single LSTM hidden layer and having a time step of 3, as shown in Figure 8.
In this figure, x t 2 , x t 1 and x t are the rice blast disease scores ( B t ) and average air temperature ( T t ), relative humidity ( H t ) and sunshine hour ( S t ) values for each of the preceding three years. These are the input values comprising the combinations used in the model variations described in Table 4. A given input value passes through the LSTM layer at time t, which is the most recent time, through calculation of the LSTM layer according to Equations (4)–(9). The value ( h t ) passing through the LSTM layer at the last point in time t is the predicted class of the degree of rice blast occurrence in the next year. This prediction is output as y t through the softmax layer. Recall that the output classes are numbered 0–2, as defined above. The value of y t is calculated as follows:
z t = W z h t + b z ,
y t = s o f t m a x ( z t ) = 1 k = 0 2 exp ( z t , i ) [ exp ( z t , 0 ) exp ( z t , 1 ) exp ( z t , 2 ) ] ,
where Wz is the weight matrix, b z is a bias term and z t is a three-dimensional vector from which the softmax function in Equation (12) is obtained. In that equation, z t , i is the i-th unit value of z t , called a “logit.” The final y t value is the probability of each class.
To study this model, we used the following cross-entropy loss function:
( p t , y t ) = 1 N n = 1 N i = 1 3 p t , i , n log ( y t , i , n ) ,
where N is the total number of training data elements, p t is the target value, p t , i , n is the i-th value of the p t of the n-th sample and y t , i , n is the i-th value of the y t of the n-th sample. With this loss function, we trained the proposed LSTM models using the Adam optimizer [35] and implemented them using Tensorflow version 1.3.0 [36], which is one of the leading deep learning platforms.

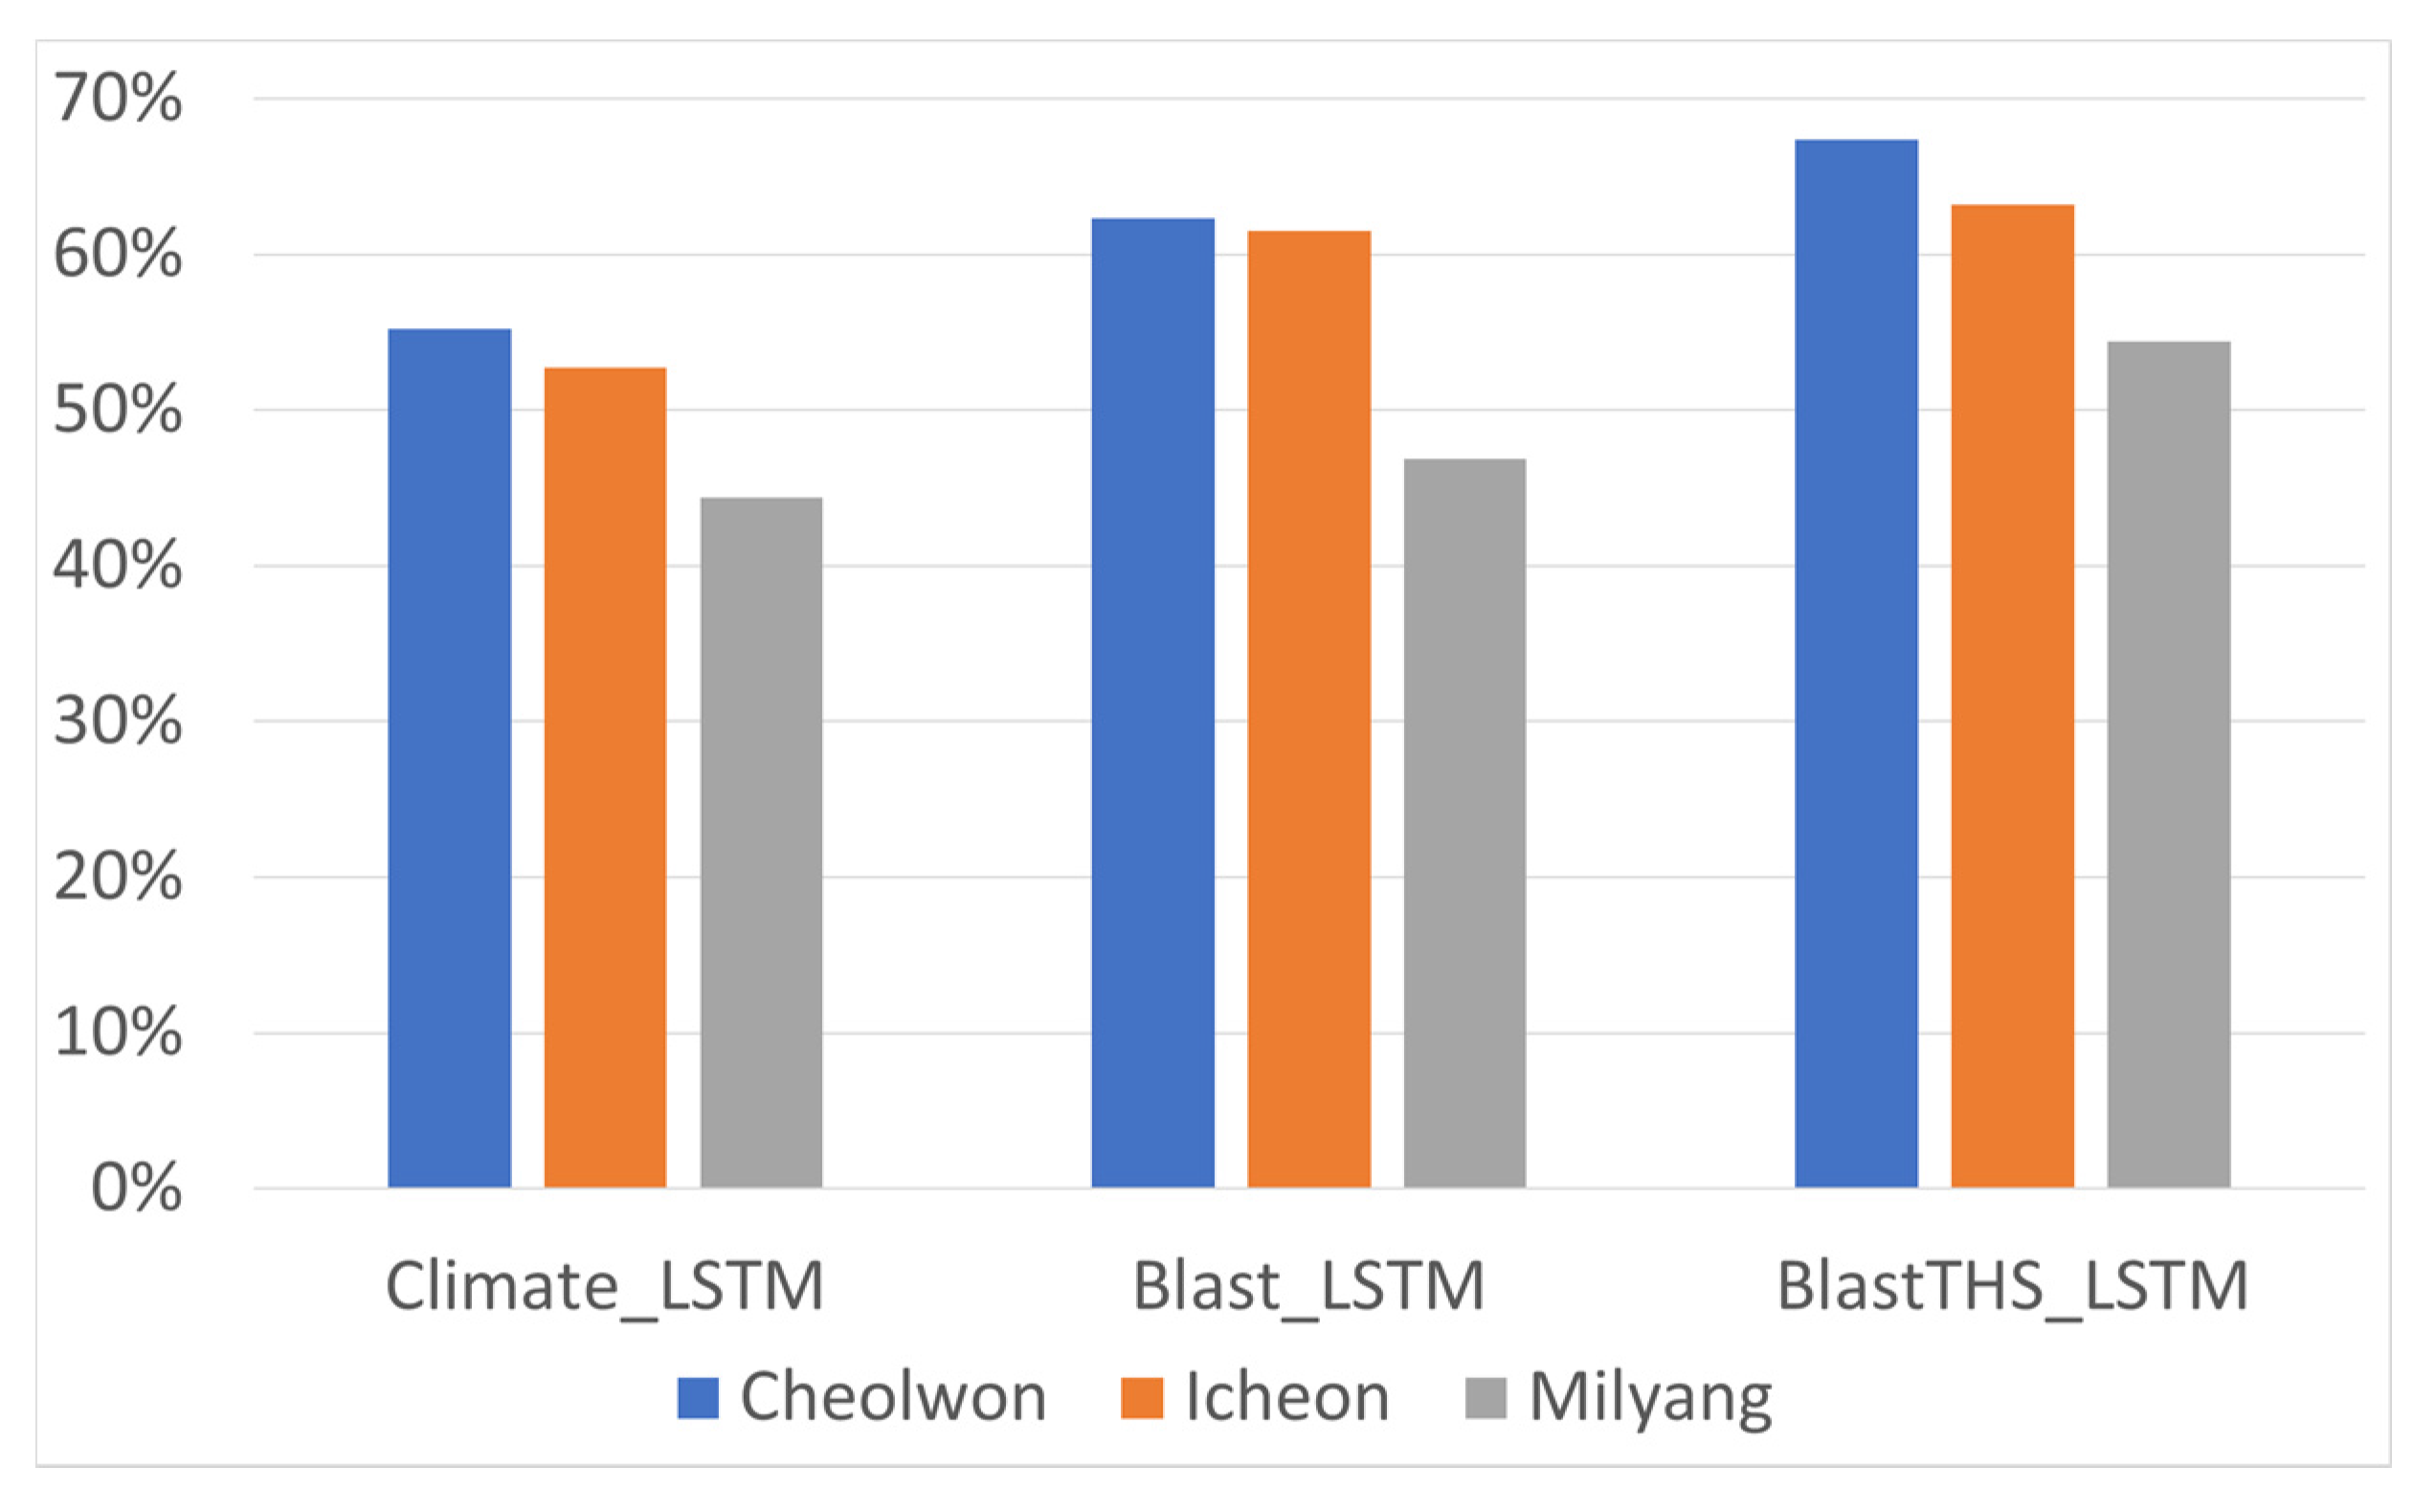
4. Results and Discussion

Through the process described in the paper, a rice blast prediction model applicable to the Cheolwon, Icheon and Milyang areas and facilitating different input variable combinations was developed. Our model that can be adjusted to predict the rice blast occurrence in each region in the next year, based on the rice blast scores for the previous three years in Cheolwon, Icheon, Milyang and Naju and/or the weather, humidity and sunlight hours data for each region. Table 5 lists the prediction performance for rice blast occurrence in the Cheolwon, Icheon and Milyang regions for each of the different model variations (see Table 4). To assess their performance, we used standard performance metrics, i.e., the accuracy and F1-score. Here, the accuracy is defined as the number of correctly classified data elements among the total number of test data elements and the F1-score is the harmonic mean of the precision and recall.
We first discuss the performance of Blast_LSTM with regards to its prediction of the incidence of rice blast one year after the previous rice blast occurrence. Recall that the trained model yields predictions classified into three groups: resistance, middle resistance and susceptible groups. Thus, if the information on past rice blast occurrence did not contribute to the prediction of rice blast occurrence in the following year, the accuracy would be approximately 33%. However, as apparent from Table 5, the Blast_LSTM model yielded 62.3% accuracy (F1-score: 59.6%) for the Cheolwon region and 61.5% (59.8%) and 46.9% (44.9%) accuracies for the Icheon and Milyang regions, respectively, all of which are considerably higher than the threshold accuracy and F1-scores of 33%. In particular, the accuracy for the Cheolwon region was quite high, at 62.3%. Thus, the results indicate that information on past rice blast occurrence helps predict the occurrence of rice blast in the distant future. Based on this finding, the accuracy of Blast_LSTM was used as a base model for comparison with the results of the other model variations.
In comparison with the Blast_LSTM base model, for BlastT_LSTM, in which the past average temperature information is combined with that of past rice blast incidence, the accuracy was improved by 5.5% (from 62.3% to 65.7%) for the Cheolwon region model (with 2.3% improvement in F1-score), by 2.1% (F1-score improvement: 1.5%) for the Icheon area model and by 8.7% (F1-score improvement: 13.8%) for the Milyang model. Therefore, it was found that the average temperature information from the preceding three years is helpful for prediction of rice blast disease occurrence. Note that, for the Milyang area model in particular, the Blast_LSTM accuracy was lower than that for the other regions. For this region, the addition of temperature information in BlastT_LSTM helped improve the prediction performance. As shown in Figure 7a, the average temperatures of Cheolwon, Icheon and Milyang gradually increased from 2003 to 2016 and the temperature gradually changed over several years. Therefore, even without knowledge of the temperature of the next year, the temperature information from the past three years is thought to help improve the accuracy of blast disease occurrence prediction.
Compared with the BlastT_LSTM results, the model variable incorporating the relative humidity input variable as well as the above variables, i.e., BlastTH_LSTM, showed improvements of 3.9%, 1.2% and 2.9% in the F1-score for the Cheolwon, Icheon and Milyang regions. Compared with Blast_LSTM, which is the model having only rice blast disease scores as the input variables, the F1-scores improved by 6.4%, 2.7% and 17.1% for Cheolwon, Icheon and Milyang, respectively. It is not possible to accurately determine the influence of each input variable on the prediction by examining the correlation between input variables. However, as BlastTH_LSTM exhibits superior accuracy to the preceding model variations, it is apparent that the past relative humidity is also an important factor affecting rice blast prediction.
Comparison of the prediction results of BlastTHS_LSTM, the model variation also incorporating the sunshine hours, with those of BlastTH_LSTM indicates that the F1-scores were improved by 0.3%, 1.1% and 1.5% for the Cheolwon, Icheon and Milyang regions, respectively and the accuracy was improved by 0.7%, 0.6% and 4.0%, respectively. For all three regions, BlastTHS_LSTM had the highest accuracy among the examined model variations; this model variation incorporated the rice blast incidence scores and the average temperature, relative humidity and sunshine hour data.
Finally, we discuss the prediction results of Climate_LSTM, which considered the climate data of the previous three years only. This model variation excludes the information on the past rice blast incidence and exhibits the lowest prediction accuracy for all three regions, ranging between 44.4% and 55.2%. However, these results confirm that past climate information can be helpful for prediction of rice blast disease incidence. Note that this approach differs from methods forecasting the rice blast occurrence of the current year based on the previous year’s climate information only [8,9,10,11]. In comparison with the base model, Blast_LSTM, which considers past rice blast disease scores only without climate information, the prediction performance of the Climate_LSTM model was 11.4% for Cheolwon and 14.3% for Icheon. In the case of the Milyang region, the forecast performance was also low, at 5.3% (although the decline is different, the F1-scores were also considerably inferior.)
Figure 9 shows a comparison of the prediction accuracies of the Climate_LSTM, Blast_LSTM and BlastTHS_LSTM model variations by region. From Figure 9 and Table 5, it is apparent the prediction performance of each of these prediction model variations differed from region to region. For all model variations, the highest prediction performance was obtained for the Cheolwon region, followed by the Icheon region, for which the accuracy was 0.8–4.3% lower than that for the Cheolwon region. The lowest prediction performance was obtained for the Milyang region, for all prediction model variations, with the accuracy being lower than that of the Cheolwon area by 10.8–15.4%.
The deep learning model used in this study implements a data-driven approach, in which the learning data is very important because the LSTM model itself learns the features needed for prediction from the learning data. Note that we divided the data from 2003 to 2016 into training (70%), validation (10%) and test (20%) data in order of time. Therefore, the test data were the most recent data and the training data were the most historical data. The Class 0–2 distribution varies with time and Figure 10 shows the class distributions for the training (historical) and test (most recent) data for each region.
From Figure 10, the class distributions of the training and test data are similar for the Cheolwon region but differ significantly for Milyang region. Therefore, the class distribution and characteristics of the training and test data for the Milyang region differ. It is thought that these differences may have caused the significant reduction in the prediction accuracy.
The prediction system proposed in this study was developed cultivar-agnostically. Therefore, regardless of the cultivar, the rice blast incidence in one year can be predicted using data from the past three years and the model developed in this study. To examine this feature, the rice varieties most widely cultivated in Korea were selected and the predictions yielded by the developed model variations were analyzed.
According to the Korean RDA, rice varieties with high yield and superior taste are primarily grown each year. The most popular rice varieties for cultivation in Korea are Jopyeong, Samdeok, Onnuri, Nampyeong, Hwanggeumnuri, Koshihikari, Saenuri, Unkwang, Ilpum, Chucheong, Dongjinchal, Ilmi, Odae, Daean, Samgwang, Hopum, Chilbo, Saeilmi, Wungwang and Sindongjin. Data for 17 of these varieties (excluding Chilbo, Saeilmi and Wungwang) were included in the test dataset. Then, the effectiveness of each proposed prediction model variation was analyzed by examining the rice blast disease incidence prediction results. The average prediction accuracies for each of the 17 varieties cultivated in Cheolwon, Icheon and Milyang are listed in Table 6. Among the three regions, the most accurate results were obtained for Cheolwon. The BlastTHS_LSTM model variation, which is the LSTM model incorporating the past blast occurrence rate, average temperature, relative humidity and sunshine hours as input variables, yielded the highest accuracies among all variations. For this model, accuracies of 79.4%, 64.7% and 55.6% were obtained for the Cheolwon, Icheon and Milyang regions, respectively.
The prediction accuracies for each of the cultivars given by BlastTHS_LSTM are shown in Figure 11. It is apparent that the accuracies for some individual cultivars were better than others. However, the sample size was small for each cultivar, ranging from 1 to 4. These results indicate that rice blast information for cultivars cultivated in Korea for the previous three years, in conjunction with climate information, can be used to predict the occurrence of rice blast a year later. These findings will be helpful for preventing blast disease in the future. If weather conditions such as humidity vary within an area, the blast population in the area is expected to vary also and the response of rice to the blast is also expected to differ. The accuracies of the proposed models are not very high; however, it is a meaningful starting point, being the first attempt of the LSTM-based rice blast prediction model. The performance of the models can be further improved by adding more training data and optimizing the LSTM architecture.
Rice blast fungus is a representative model phytopathogenic fungus for which gene-for-gene interactions with the host are applicable. To date, more than 40 resistance genes have been identified in host rice and among the corresponding pathogen avirulence, 9 genes have been identified through molecular biology and functional genetics [37,38,39,40,41,42]. As a strategy to control rice blast fungus, introduction of a resistance gene through breeding is considered to be most effective. To understand the race or pathotype of rice blast fungus in South Korea and to collect information for introducing resistance genes to rice varieties, the distribution and transposon of nonpathogenic genes of rice blast fungus at the group level have been determined through DNA-fingerprinting studies using molecular biomarkers [43]. According to the results of such studies, the pathogenic race pathotype is becoming more diverse than in the past, despite the decrease of rice blast throughout South Korea [44]. These different types of pathogenesis are presumed to be caused by genetic variation of the rice blast fungus, which may lead to increased affinity strains for resistant cultivars [6]. Resistant reversal of these resistant varieties to become susceptible varieties has been reported for many crops, including rice [45]. The rice blast disease prediction system presented in this study can provide results for specific rice varieties; therefore, it will be of considerable assistance to rice blast researchers, especially in comparison with conventional rice blast predictions. It is possible to suggest the direction to breed as a resistant breed, by providing the data to rice breeders. Rice blast resistance genes are constantly being studied and hence using all this information together will be helpful for resistant breeding.
In this study, we incorporated different combinations of input variables, i.e., the degree of rice blast occurrence scores and the temperature, humidity and sunshine hours data, into the developed model variations. For all regions, the predicted results were most accurate when the rice blast occurrence scores, temperature, humidity and sunshine hours data were all considered. Note that other studies involving artificial intelligence have indicated that botanical disease occurrence is related to the combination of pathogens, environmental conditions and host plants.
In addition, we found that early prediction of rice blast occurrence based on climate data for the past three years is possible and that blast disease prevention can be further facilitated by incorporating knowledge of the rice blast occurrence for each of those years. In this study, we developed models for three representative regions in South Korea to analyze the feasibility of the LSTM-based methodology and analyzed the prediction results for 17 varieties. However, in addition to the three regions, there are data for monitoring rice blast disease in 9 regions and 358 varieties of rice in South Korea. Therefore, the framework used in this study can be extended to a prediction system for the remaining regions and all varieties. The utility of the proposed LSTM models is expected to be high. In addition, because the deep learning method used in this study is capable of transfer learning, it can easily be applied to data from other countries or regions. Thus, although this study was based on data from South Korea, the findings and developed system will be helpful for the various countries in which rice is grown as a primary crop.

Acknowledgments

We thank the National Institute of Crop Science for providing data. This research was supported by a grant (17CTAP-C129782-01) from the Technology Advancement Research Program funded by the Korean Ministry of Land, Infrastructure and Transport.

Author Contributions

Yangseon Kim, Jae-Hwan Roh and Ha Young Kim developed the topics and designed the experiments; Ha Young Kim performed the experiments; Ha Young Kim and Yangseon Kim analyzed the data; Ha Young Kim and Yangseon Kim wrote the paper.

Conflicts of Interest

The authors declare no conflict of interest. The funding sponsors had no role in the design of the study; in the collection, analyses, or interpretation of data; in the writing of the manuscript, or in the decision to publish the results.

References

  1. Wang, G.-L.; Valent, B. Durable resistance to rice blast. Science 2017, 355, 906–907. [Google Scholar] [CrossRef] [PubMed]
  2. Kato, H. Rice blast disease. Pestic. Outlook 2001, 12, 23–25. [Google Scholar] [CrossRef]
  3. Li, Y.B.; Wu, C.J.; Jiang, G.H.; Wang, L.Q.; He, Y.Q. Dynamic analyses of rice blast resistance for the assessment of genetic and environmental effects. Plant Breed. 2007, 126, 541–547. [Google Scholar] [CrossRef]
  4. Lee, Y.-H.; Ra, D.-S.; Yeh, W.-H.; Choi, H.-W.; Myung, I.-S.; Lee, S.-W.; Lee, Y.-H.; Han, S.-S.; Shim, H.-S. Survey of major disease incidence of rice in Korea during 1999–2008. Res. Plant Dis. 2010, 16, 183–190. [Google Scholar] [CrossRef]
  5. Cho, Y.C.; Kwon, S.W.; Choi, I.S.; Lee, S.K.; Jeon, J.S.; Oh, M.G.; Roh, J.H.; Hwang, H.G.; Kim, Y.G. Identification of major blast resistance genes in Korean rice varieties (Oryza sativa L.) using molecular markers. J. Crop Sci. Biotechnol. 2007, 10, 265–276. [Google Scholar]
  6. Han, S.S.; Ryu, J.D.; Shim, H.S.; Lee, S.W.; Hong, Y.K.; Cha, K.H. Breakdown of resistant cultivars by new race KI-1117a and race distribution of rice blast fungus during 1999–2000 in Korea. Res. Plant Dis. 2001, 7, 86–92. [Google Scholar]
  7. Huhn-Pal, M. Genetic diversity of high-quality rice cultivars based on SSR markers linked to blast resistance genes. Korean J. Crop Sci. 2004, 49, 251–255. [Google Scholar]
  8. Ishiguro, K.; Hashimoto, A. Recent advances in forecasting of rice blast epidemics using computers in Japan. In Tropical Agriculture Research Series, Proceedings of the 23rd International Symposium on Tropical Agriculture Research, Tsu, Japan, 20–22 September 1989; The Agriculture, Forestry and Fisheries Research Information Technology Center: Ibaraki, Japan, 1989. [Google Scholar]
  9. Teng, P.S.; Klein-Gebbinck, H.W.; Pinnschmidt, H. An analysis of the blast pathosystem to guide modeling and forecasting. In Rice Blast Modeling and Forecasting, Proceedings of the International Rice Research Conference, Seoul, Korea, 27–31 August 1990; International Rice Research Institute (IRRI): Los Baños, Philippines, 1991. [Google Scholar]
  10. Kim, C.-K.; Choong, H.K. The rice leaf blast simulation model EPIBLAST. In Systems Approaches for Agricultural Development; Penning de Vries, F., Teng, P., Metselaar, K., Eds.; Springer: Dordrecht, The Netherlands, 1993; pp. 309–321. [Google Scholar]
  11. Calvero, S.B., Jr.; Coakley, S.M.; Teng, P.S. Development of empirical forecasting models for rice blast based on weather factors. Plant Pathol. 1996, 45, 667–678. [Google Scholar] [CrossRef]
  12. Katsantonis, D.; Kadoglidou, K.; Dramalis, C.; Puigdollers, P. Rice blast forecasting models and their practical value: A review. Phytopathol. Mediterr. 2017, 56, 187–216. [Google Scholar] [CrossRef]
  13. Kaundal, R.; Kapoor, A.S.; Raghava, G.P.S. Machine learning techniques in disease forecasting: A case study on rice blast prediction. BMC Bioinform. 2006, 7, 485. [Google Scholar] [CrossRef] [PubMed]
  14. Malicdem, A.R.; Fernandez, P.L. Rice blast disease forecasting for northern Philippines. WSEAS Trans. Inf. Sci. Appl. 2015, 12, 120–129. [Google Scholar]
  15. He, K.; Zhang, X.; Ren, S.; Sun, J. Deep residual learning for image recognition. In Proceedings of the IEEE Conference on Computer Vision and Pattern Recognition, Las Vegas, NV, USA, 27–30 June 2016; IEEE: Piscataway, NJ, USA, 2016. [Google Scholar] [CrossRef]
  16. Taigman, Y.; Yang, M.; Ranzato, M.A.; Wolf, L. Deepface: Closing the gap to human-level performance in face verification. In Proceedings of the IEEE Conference on Computer Vision and Pattern Recognition, Columbus, OH, USA, 23–28 June 2014; IEEE: Piscataway, NJ, USA, 2014. [Google Scholar] [CrossRef]
  17. Graves, A.; Mohamed, A.; Hinton, G. Speech recognition with deep recurrent neural networks. In Proceedings of the 2013 IEEE International Conference on Acoustics, Speech and Signal Processing (ICASSP), Vancouver, BC, Canada, 26–31 May 2013; IEEE: Piscataway, NJ, USA, 2013. [Google Scholar] [CrossRef]
  18. Dauphin, Y.N.; Bengio, Y. Big neural networks waste capacity. arXiv, 2013; arXiv:1301.3583. [Google Scholar]
  19. Sutskever, I.; Vinyals, O.; Le, Q.V. Sequence to sequence learning with neural networks. In Proceedings of the 27th International Conference on Neural Information Processing Systems, Montreal, QC, Canada, 8–13 December 2014; MIT Press: Cambridge, MA, USA, 2014; Volume 2, pp. 3104–3112. [Google Scholar]
  20. Hochreiter, S.; Schmidhuber, J. Long short-term memory. Neural Comput. 1997, 9, 1735–1780. [Google Scholar] [CrossRef] [PubMed]
  21. Sak, H.; Senior, A.; Beaufays, F. Long short-term memory recurrent neural network architectures for large scale acoustic modeling. In Proceedings of the Fifteenth Annual Conference of the International Speech Communication Association, Singapore, 14–18 September 2014. [Google Scholar]
  22. Greff, K.; Srivastava, R.K.; Koutník, J.; Steunebrink, B.R.; Schmidhuber, J. LSTM: A search space odyssey. IEEE Trans. Neural Netw. Learn. Syst. 2017, 28, 2222–2232. [Google Scholar] [CrossRef] [PubMed]
  23. Wei, B.; Yue, J.; Rao, Y. A deep learning framework for financial time series using stacked autoencoders and long-short term memory. PLoS ONE 2017, 12, e0180944. [Google Scholar] [CrossRef]
  24. International Rice Research Institute (IRRI). Standard Evaluation System for Rice (SES); International Rice Research Institute: Los Banos, Philippines, 1988. [Google Scholar]
  25. Asuyama, H. Morphology, taxonomy, host range, and life cycle of Pyricularia oryzae. In The Rice Blast Disease, Proceedings of a Symposium at the International Rice Research Institute, Los Banos, Philippines, 4–8 February 1963; IRRI, Ed.; Johns Hopkins Press: Baltimore, ML, USA, 1965; pp. 9–22. [Google Scholar]
  26. Ou, S.H. Rice Diseases; International Rice Research Institute: Los Baños, Philippines, 1985. [Google Scholar]
  27. Alizadeh, A.; Mousanejad, S.; Safaie, N. Effect of weather factors on sporulation of rice blast disease causal agent in Guilan Province. J. Water Soil Sci. 2009, 13, 315–326. Available online: http://jstnar.iut.ac.ir/article-1-1009-en.html (accessed on 23 December 2017).
  28. Chetri, D.K.; Daiho, L.; Upadhyay, D.N. Tentative identification of critical weather factors to circumvent leaf blast with altered dates of sowing of rice in the foot-hills of Nagaland, India. Int. J. Bio-Res. Stress Manag. 2011, 2, 298–301. [Google Scholar]
  29. Bengio, Y.; Simard, P.; Frasconi, P. Learning long-term dependencies with gradient descent is difficult. IEEE Trans. Neural Netw. 1994, 5, 157–166. [Google Scholar] [CrossRef] [PubMed]
  30. Fausett, L. Fundamentals of Neural Networks: Architectures, Algorithms, and Applications; Prentice-Hall: Upper Saddle River, NJ, USA, 1994. [Google Scholar]
  31. LeCun, Y.; Bengio, Y.; Hinton, G. Deep learning. Nature 2015, 521, 436–444. [Google Scholar] [CrossRef] [PubMed]
  32. Werbos, P.J. Backpropagation through time: What it does and how to do it. Proc. IEEE 1990, 78, 1550–1560. [Google Scholar] [CrossRef]
  33. Yu, L.; Wang, S.; Lai, K.K. An integrated data preparation scheme for neural network data analysis. IEEE Trans. Knowl. Data Eng. 2006, 18, 217–230. [Google Scholar] [CrossRef]
  34. Priddy, K.L.; Keller, P.E. Artificial Neural Networks: An Introduction; SPIE Press: Bellingham, WA, USA, 2005; Volume 68. [Google Scholar]
  35. Kingma, D.; Ba, J. Adam: A method for stochastic optimization. arXiv, 2014; arXiv:1412.6980. [Google Scholar]
  36. Abadi, M.; Agarwal, A.; Barham, P.; Brevdo, E.; Chen, Z.; Citro, C.; Corrado, G.S.; Davis, A.; Dean, J.; Devin, M.; et al. Tensorflow: Large-scale machine learning on heterogeneous distributed systems. arXiv, 2016; arXiv:1603.04467. [Google Scholar]
  37. Bohnert, H.U.; Fudal, I.; Dioh, W.; Tharreau, D.; Notteghem, J.L.; Lebrun, M.H. A putative polyketide synthase/peptide synthetase from Magnaporthe grisea signals pathogen attack to resistant rice. Plant Cell 2004, 16, 2499–2513. [Google Scholar] [CrossRef] [PubMed]
  38. Farman, M.L.; Eto, Y.; Nakao, T.; Tosa, Y.; Nakayashi, H.; Mayama, S.; Leong, S.A. Analysis of the structure of the AVR1-CO39 avirulence locus in virulent rice-infecting isolates of Magnaporthe grisea. Mol. Plant-Microbe Interact. 2002, 15, 6–16. [Google Scholar] [CrossRef] [PubMed]
  39. Jia, Y.; McAdams, S.A.; Bryan, G.T.; Hershey, H.P.; Valent, B. Direct interaction of resistance gene and avirulene gene products confers rice blast resistance. EMBO J. 2000, 37, 554–565. [Google Scholar] [CrossRef]
  40. Kang, S.; Sweigard, J.A.; Valent, B. The PWL host specificity gene family in the blast fungus Magnaporthe grisea. Mol. Plant-Microbe Interact. 1995, 8, 939–948. [Google Scholar] [CrossRef] [PubMed]
  41. Li, W.; Wang, B.; Wu, J.; Lu, G.; Hu, Y.; Zhang, X.; Zhang, Z.; Zhao, Q.; Feng, Q.; Zhang, H.; et al. The Magnaporthe oryzae avirulence gene AvrPiz-t encodes a predicted secreted protein that triggers the immunity in rice mediated by the blast resistance gene Piz-t. Mol. Plant-Microbe Interact. 2009, 22, 411–420. [Google Scholar] [CrossRef] [PubMed]
  42. Orbah, M.J.; Farrall, L.; Sweigard, J.A.; Chrmley, F.G.; Valent, B. A telomeric avirulence gene determines efficacy for the rice blast resistance gene Pi-ta. Plant Cell 2000, 12, 2019–2032. [Google Scholar] [CrossRef]
  43. Park, S.Y.; Milgroom, M.G.; Han, S.S.; Kang, S.; Lee, Y.H. Genetic differentiation of Magnaporthe oryzae populations from scouting plots and commercial rice fields in Korea. Phytopathology 2008, 98, 436–442. [Google Scholar] [CrossRef] [PubMed]
  44. Kim, Y.; Go, J.; Kang, I.J.; Shim, H.-W.; Shin, D.B.; Heu, S.; Roh, J.-H. Distribution of rice blast disease and pathotype analysis in 2014 and 2015 in Korea. Res. Plant Dis. 2016, 22, 264–268. [Google Scholar] [CrossRef]
  45. Mundt, C.C. Durable resistance: A key to sustainable management of pathogens and pest. Infect. Genet. Evol. 2014, 27, 446–455. [Google Scholar] [CrossRef] [PubMed]
Figure 1. Four major rice-growing regions in South Korea. (a) Map of South Korea showing four regions used in this study; (b) Latitudes and longitudes of four selected regions.
Sustainability 10 00034 g001
Figure 2. Neural network architectures. (a) Feedforward neural network architecture; (b) Basic RNN architecture; (c) Basic RNN architecture unfolded in time.
Sustainability 10 00034 g002
Figure 3. LSTM architecture. (a) LSTM memory block; (b) Basic LSTM architecture with one hidden LSTM layer unfolded in time.
Sustainability 10 00034 g003
Figure 4. Flowchart of procedures employed in this study.
Sustainability 10 00034 g004
Figure 5. Sample dataset for Nampyung rice cultivar case.
Sustainability 10 00034 g005
Figure 6. Class distributions in three areas: (a) Cheolwon; (b) Icheon; (c) Milyang.
Sustainability 10 00034 g006
Figure 7. Average climate trends for target areas from June to July and from 2003 to 2016: (a) Average temperature; (b) Average relative temperature; (c) Average sunshine hours.
Sustainability 10 00034 g007aSustainability 10 00034 g007b
Figure 8. LSTM architecture of blast disease score prediction model.
Sustainability 10 00034 g008
Figure 9. Comparison of prediction accuracies of selected LSTM model variations by region.
Sustainability 10 00034 g009
Figure 10. Class distributions of training (historical) and test (most recent) data by region.
Sustainability 10 00034 g010
Figure 11. Prediction results for 17 most popular cultivars yielded by BlastTHS_LSTM model.
Sustainability 10 00034 g011
Table 1. Rice blast disease monitoring data example from 2013.
CultivarIcheonSuwonCheolwonMilyangSangjuNaju
Nampyung913372
Ilpum315780
Dongang0135NA2
Table 2. Sample of daily climatic data for 2003 from Cheolwon region.
Date (YYYY-MM-DD)Average Temperature (°C)Relative Humidity (%)Sunshine Hours (h)
2003-06-0120.45711.9
2003-06-0219.74612
2016-07-3126.1895.7
Table 3. Data elements by training, validation and test class for each region. There are 1191 elements for each region, with 833 (70%), 119 (10%) and 239 (20%) elements in the training, validation and test classes, respectively.
RegionClassTrainValidationTest
CheolwonClass 0518 (62%)55 (46%)129 (54%)
Class 1182 (22%)38 (32%)72 (30%)
Class 2133 (16%)26 (22%)38 (16%)
IcheonClass 0332 (40%)64 (54%)122 (51%)
Class 1238 (29%)26 (22%)71 (30%)
Class 2263 (32%)29 (24%)46 (19%)
MilyangClass 0192 (23%)46 (39%)103 (43%)
Class 1407 (49%)49 (41%)81 (34%)
Class 2234 (28%)24 (20%)55 (23%)
Table 4. LSTM model variations developed in this study and used in experiment, with input variable lists.
Model Variation Input Variables (size)Input Size per Time Step
Blast_LSTMBlast disease scores for four regions (4) 4
BlastT_LSTMBlast disease scores for four regions (4) + Target region temperature (4)8
BlastTH_LSTMBlast disease scores for four regions (4) + Target region temperature (4) + Target region humidity(4)12
BlastTHS_LSTMBlast disease scores for four regions (4) + Target region temperature (4) + Target region humidity (4) + Target region sunshine hours (4)16
Climate_LSTMTarget region temperature (4) + Target region humidity (4) + Target region sunshine hours (4)12
Table 5. Prediction results of proposed model variations for Cheolwon, Icheon and Milyang regions.
Model NameCheolwonIcheonMilyang
AccuracyF1-ScoreAccuracyF1-ScoreAccuracyF1-Score
Blast_LSTM62.3%59.6%61.5%59.8%46.9%44.9%
BlastT_LSTM65.7%61.0%62.8%60.7%51.0%51.1%
BlastTH_LSTM66.9%63.4%62.8%61.4%52.3%52.6%
BlastTHS_LSTM67.4%63.6%63.2%62.1%54.4%53.4%
Climate_LSTM55.2%49.7%52.7%46.1%44.4%38.0%
Table 6. Average model prediction accuracies for 17 most popular cultivars.
ModelCheolwonIcheonMilyang
Blast_LSTM69.1%60.3%44.4%
BlastT_LSTM72.1%60.3%48.1%
BlastTH_LSTM77.9%61.8%48.1%
BlastTHS_LSTM79.4%64.7%55.6%
Climate_LSTM45.6%54.4%40.7%

