Article

Economic, Energetic, and Environmental Impact Evaluation of the Water Discharge Networks from Mining Works

by
Andrei Cristian Rada
1,*,
Sabina Irimie
2 and
Sabin Ioan Irimie
2
1
Department of Mechanical Engineering, Industrial Engineering and Transportation, Faculty of Mechanical and Electrical Engineering, University of Petrosani, Street Institutului, No. 20, 332006 Petrosani, Romania
2
Department Management and Industrial Engineering, Faculty of Mining, University of Petrosani, Street Institutului, No. 20, 332006 Petrosani, Romania
*
Author to whom correspondence should be addressed.
Sustainability 2018, 10(1), 240; https://doi.org/10.3390/su10010240
Submission received: 8 November 2017 / Revised: 9 January 2018 / Accepted: 10 January 2018 / Published: 18 January 2018

Abstract

:
Sustainable development represents an optimistic scenario for the evolution of contemporary civilization. The object of this paper is to define certain evaluation criteria regarding the performances of water discharge networks from mining works, and propose a method for aggregating the specific indicators for monetary costs, energetic costs, and environmental impact-related costs. The global pollution index (GPI) represents a method for assessing environment health status or pollution levels. The GPI quantitatively expresses this status based on its index, which results from a ratio between the ideal value and the given value of certain quality indices that are considered specific for the analyzed environmental factors at certain moments. The proposed method in this paper tries to perform a synergistic aggregation of the balance sheet of harmfulness and classic balance sheets for matter and energy for an industrial process.

1. Introduction

The sustainable development postulates refer to economic efficiency, social solidarity, and ecological responsibility. The pursuit of the three postulates ensures the harmonization of the basic components of human community: natural capital, built capital, and social capital.
Economic efficiency, energetic efficiency, and reduced environmental impact are the desired results of the three principles. In the general economic and energetic context regarding environmental issues, optimization of the water transport systems for the purpose of reducing power consumption has become, currently, a very big problem. Besides the functional and energy optimization of the hydraulic system, the problem requires the elaboration of top-notch algorithms that are capable of solving complex problems regarding water transport and distribution networks.
Starting from Le Goff and Giuletti’s question, “Thermodynamics and Economics—Is there a conflict?” [1], we aim in this paper to develop the CAREC diagram (energy–cost characteristic) and demonstrate the correlation between economic and energy efficiency as a basis for the sustainable development of the energy field. In this respect, we add a third axis to the CAREC diagram—pollution—as a dimension that will integrate the economic point of view (profit driven) with an energetic point of view (efficiency driven) and an environmental impact point of view (social responsibility). The algorithm proposed in this paper will provide a way to assess the sustainability of new development projects in mining (specifically for water networks). Based on our approach, various industries can determine their appropriate values for this algorithm in order to adapt it to their specific needs. Our paper expands the concerns of the two authors to the ecological component, introducing the GPI method for the adequate quantification of the environmental impact.

2. About Energy and Sustainable Development

In the context of today’s world—characterized by continuous changes in the economic, social, and natural environment (fierce competition, resource crisis, conflict at the level of the individual, the self against armed conflicts, natural disasters)—a complex approach to sustainable energy production and use is required.
In over 30 years, sustainable development has evolved from a mere concept to a widespread change in attitude, behaviors, and mentalities. What was once extrapolated only in theory, academic reports, diplomatic conventions, norms, and scientific works has turned into practical, everyday realities of life [2,3,4,5,6,7,8,9,10,11,12]. This is an important topic that addresses life from the perspective of future generations. The concept of sustainability has become a strategic part of the economy, social endeavors, and environmental projects, as well as an intrinsic part of local and regional policies [13].
The evolution of this “process”—as Rosalie Gardiner (2002) described it—turned to a steep ascent curve in recent years. The process concerned the heads of state and governments, as well specialists from different domains or non-profit organizations, who were all trying to incorporate in the development policies the definition of sustainable development: “meets the needs of present generations without compromising the ability of future generations to meet their own needs” [14].
Thus, the “Europe 2030” project [15] has energy efficiency as one of its main objectives, transposed into a series of national documents, such as: the National Sustainable Development Strategy of Romania 2013–2020–2030 [16], and the Romanian Energy Strategy 2016–2030, with perspectives for 2050 [17] (Figure 1).
“The energy’s trilemma”—as energy problems have been called lately—represents a challenge for the development of energy supply that must be solved in close interdependence and correlation (Figure 2) [18]. We consider that in some industrial areas—such as mining, for instance—improvements can be made.

3. Specific Costs and Energetic Indices for the Execution of Hydraulic Networks
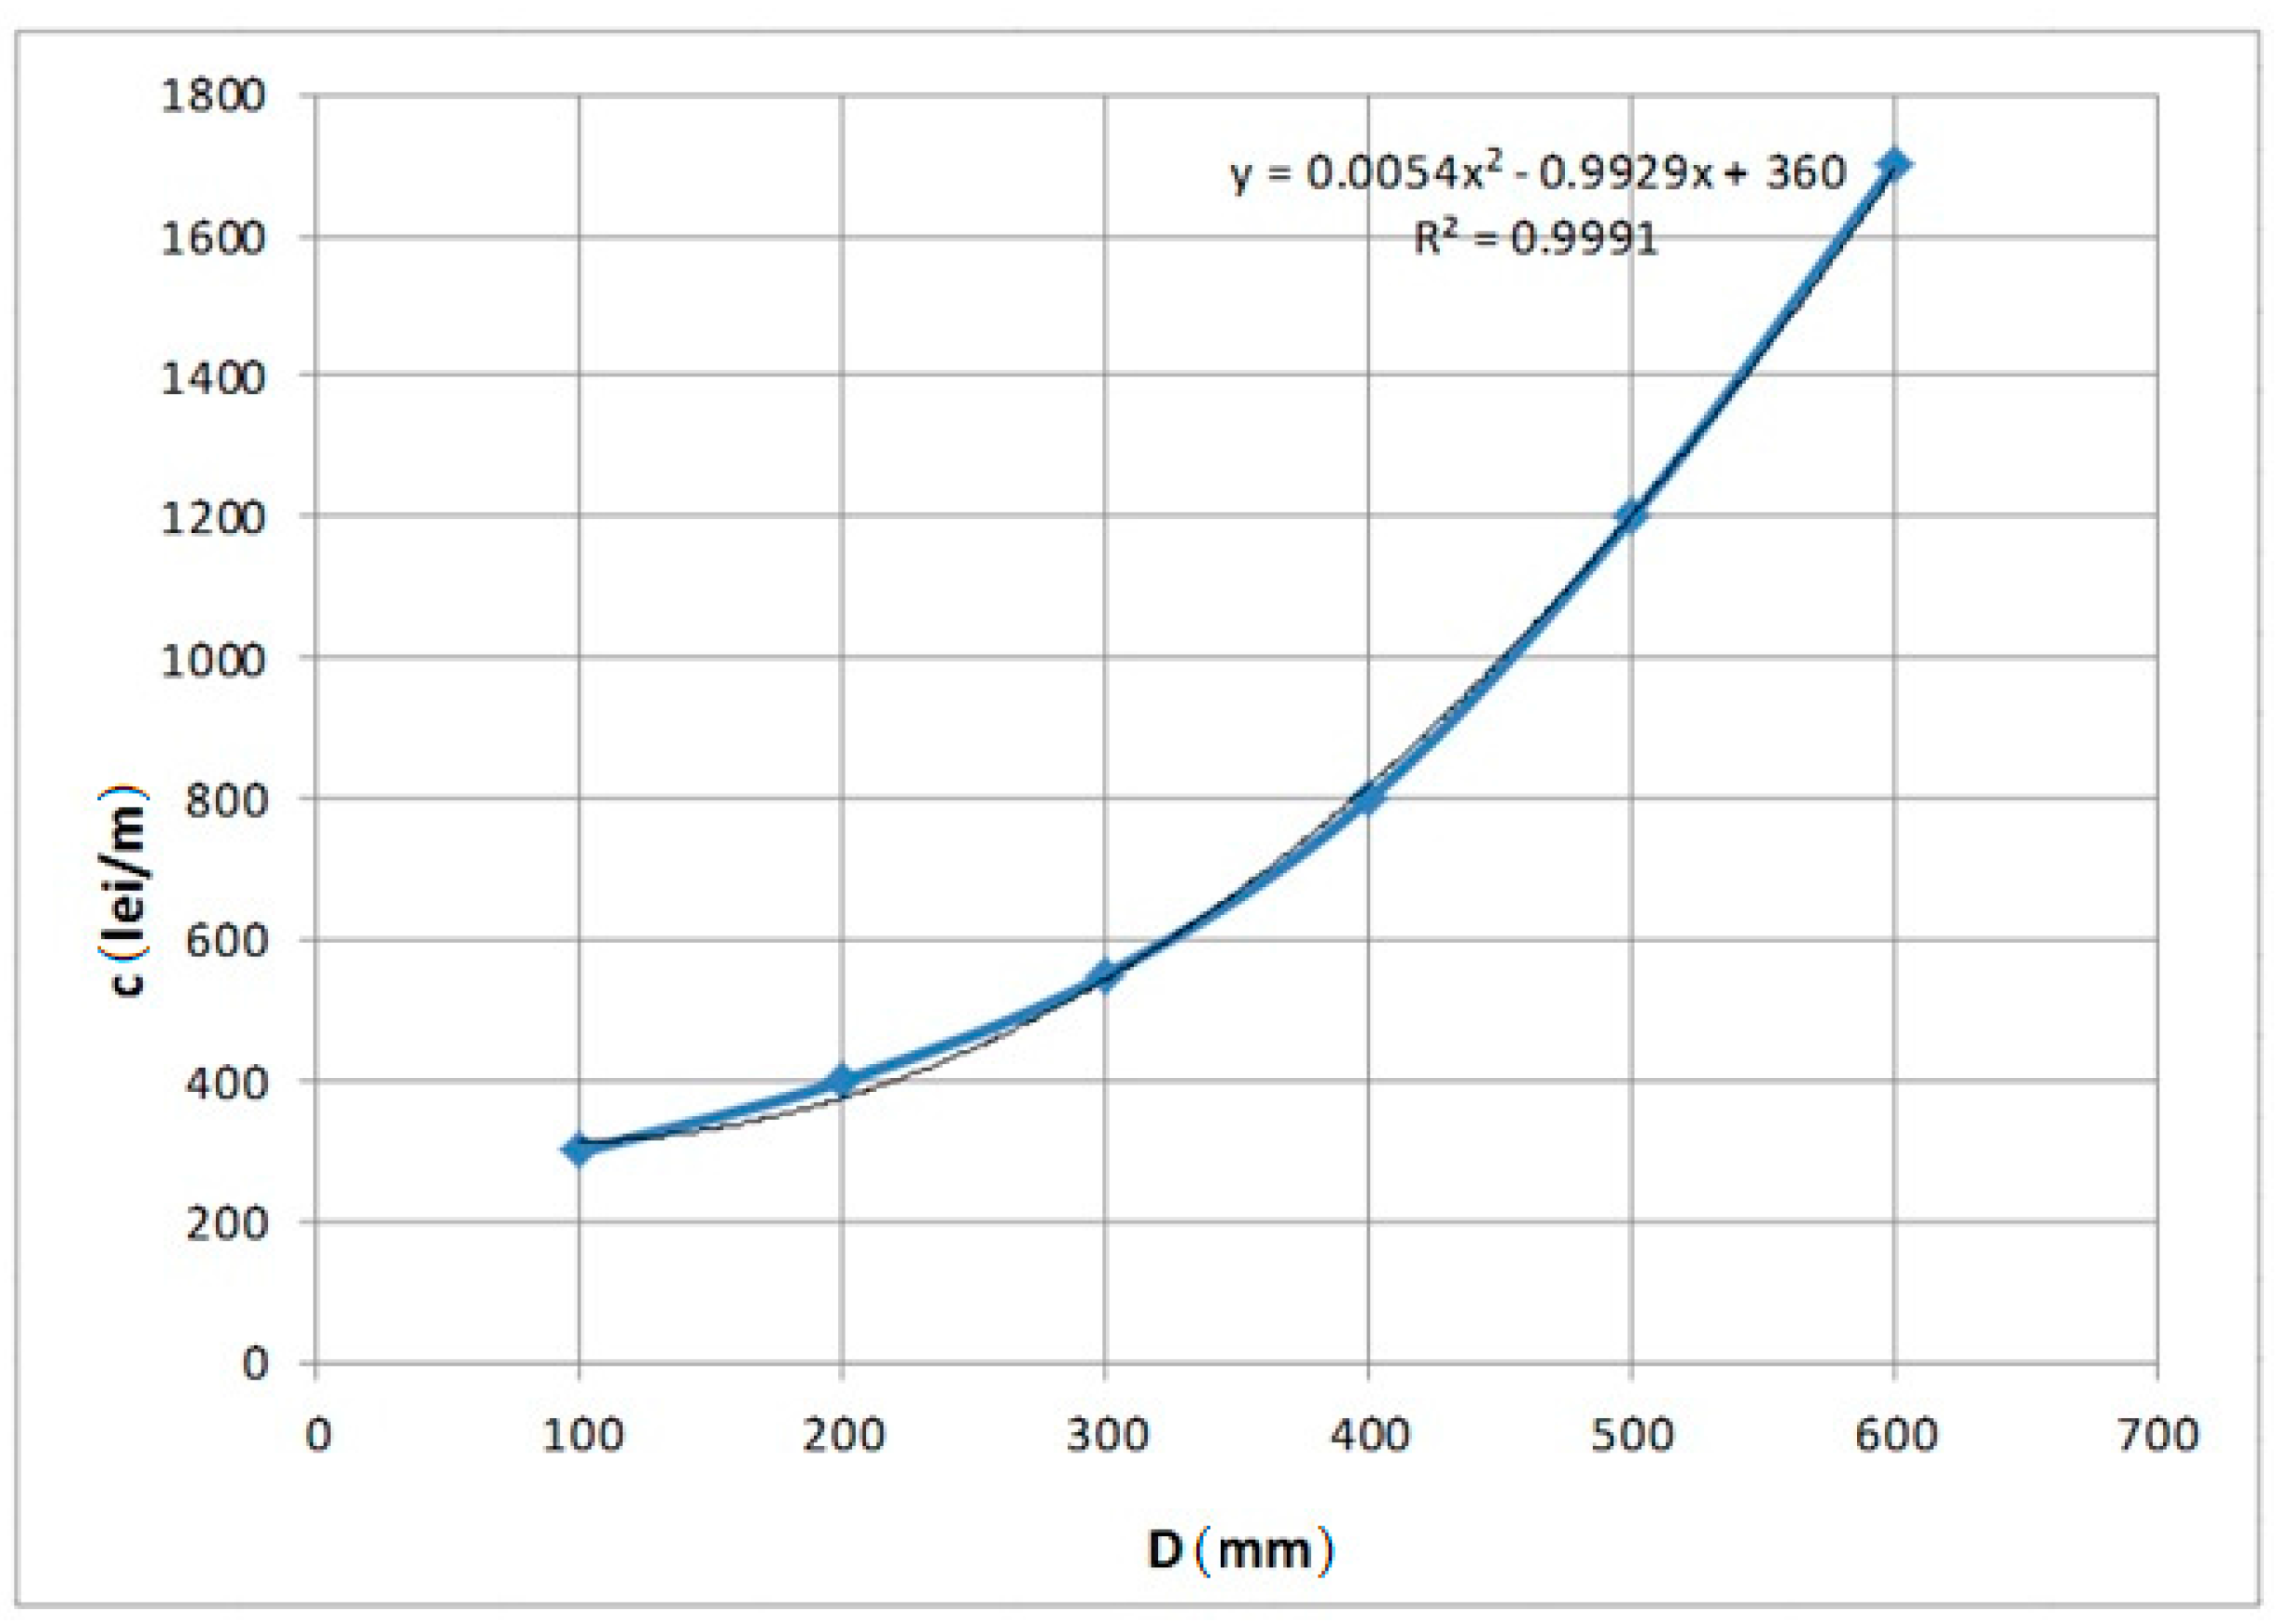
First, we must take into account that hydraulic networks use materials and technologies that require a significant quantity of energy, and for the entire duration of the exploitation of the network, energy is required for the pumping of water. As a result of the conditions of current energy penury and its extremely high cost, the optimum network solution cannot be obtained unless optimization criteria are met, within which a significant role is held by the specific cost and energy indices for the execution and exploitation of these networks. The experimental base was constituted by the mine evacuation networks in Jiu Valley, which consists of networks of different sizes and different ages. Experimental determinations have been achieved with the help of specific devices applied to hydraulics: an ultrasonic flowmeter, manometric sensors, and environmental quality monitoring systems. The research method was based on analytical relations, experimental measurements, and the use of qualitative performance indicators, according to the latest information from the literature of the analyzed domain.

3.1. Cost Index

Based on statistical data and the comparative situation of the cost indices obtained during the execution of water discharge networks from mining works, the average values were determined for the specific investment costs in the networks’ pipes, whose variation with diameter is graphically presented in Figure 3.
Steel pipes were taken into account, as they have the highest level of operational safety. However, they also have the disadvantages of a shorter lifespan and additional cost: with the internal and external corrosion protections these pipes require, they are not cheaper than cast iron pipes.
Using the integral rational regression method, based on the chart, a general relationship results for the establishment of an average value for the specific investment cost for a certain diameter:
c = 0.0054·D2 − 0.9929·D + 360

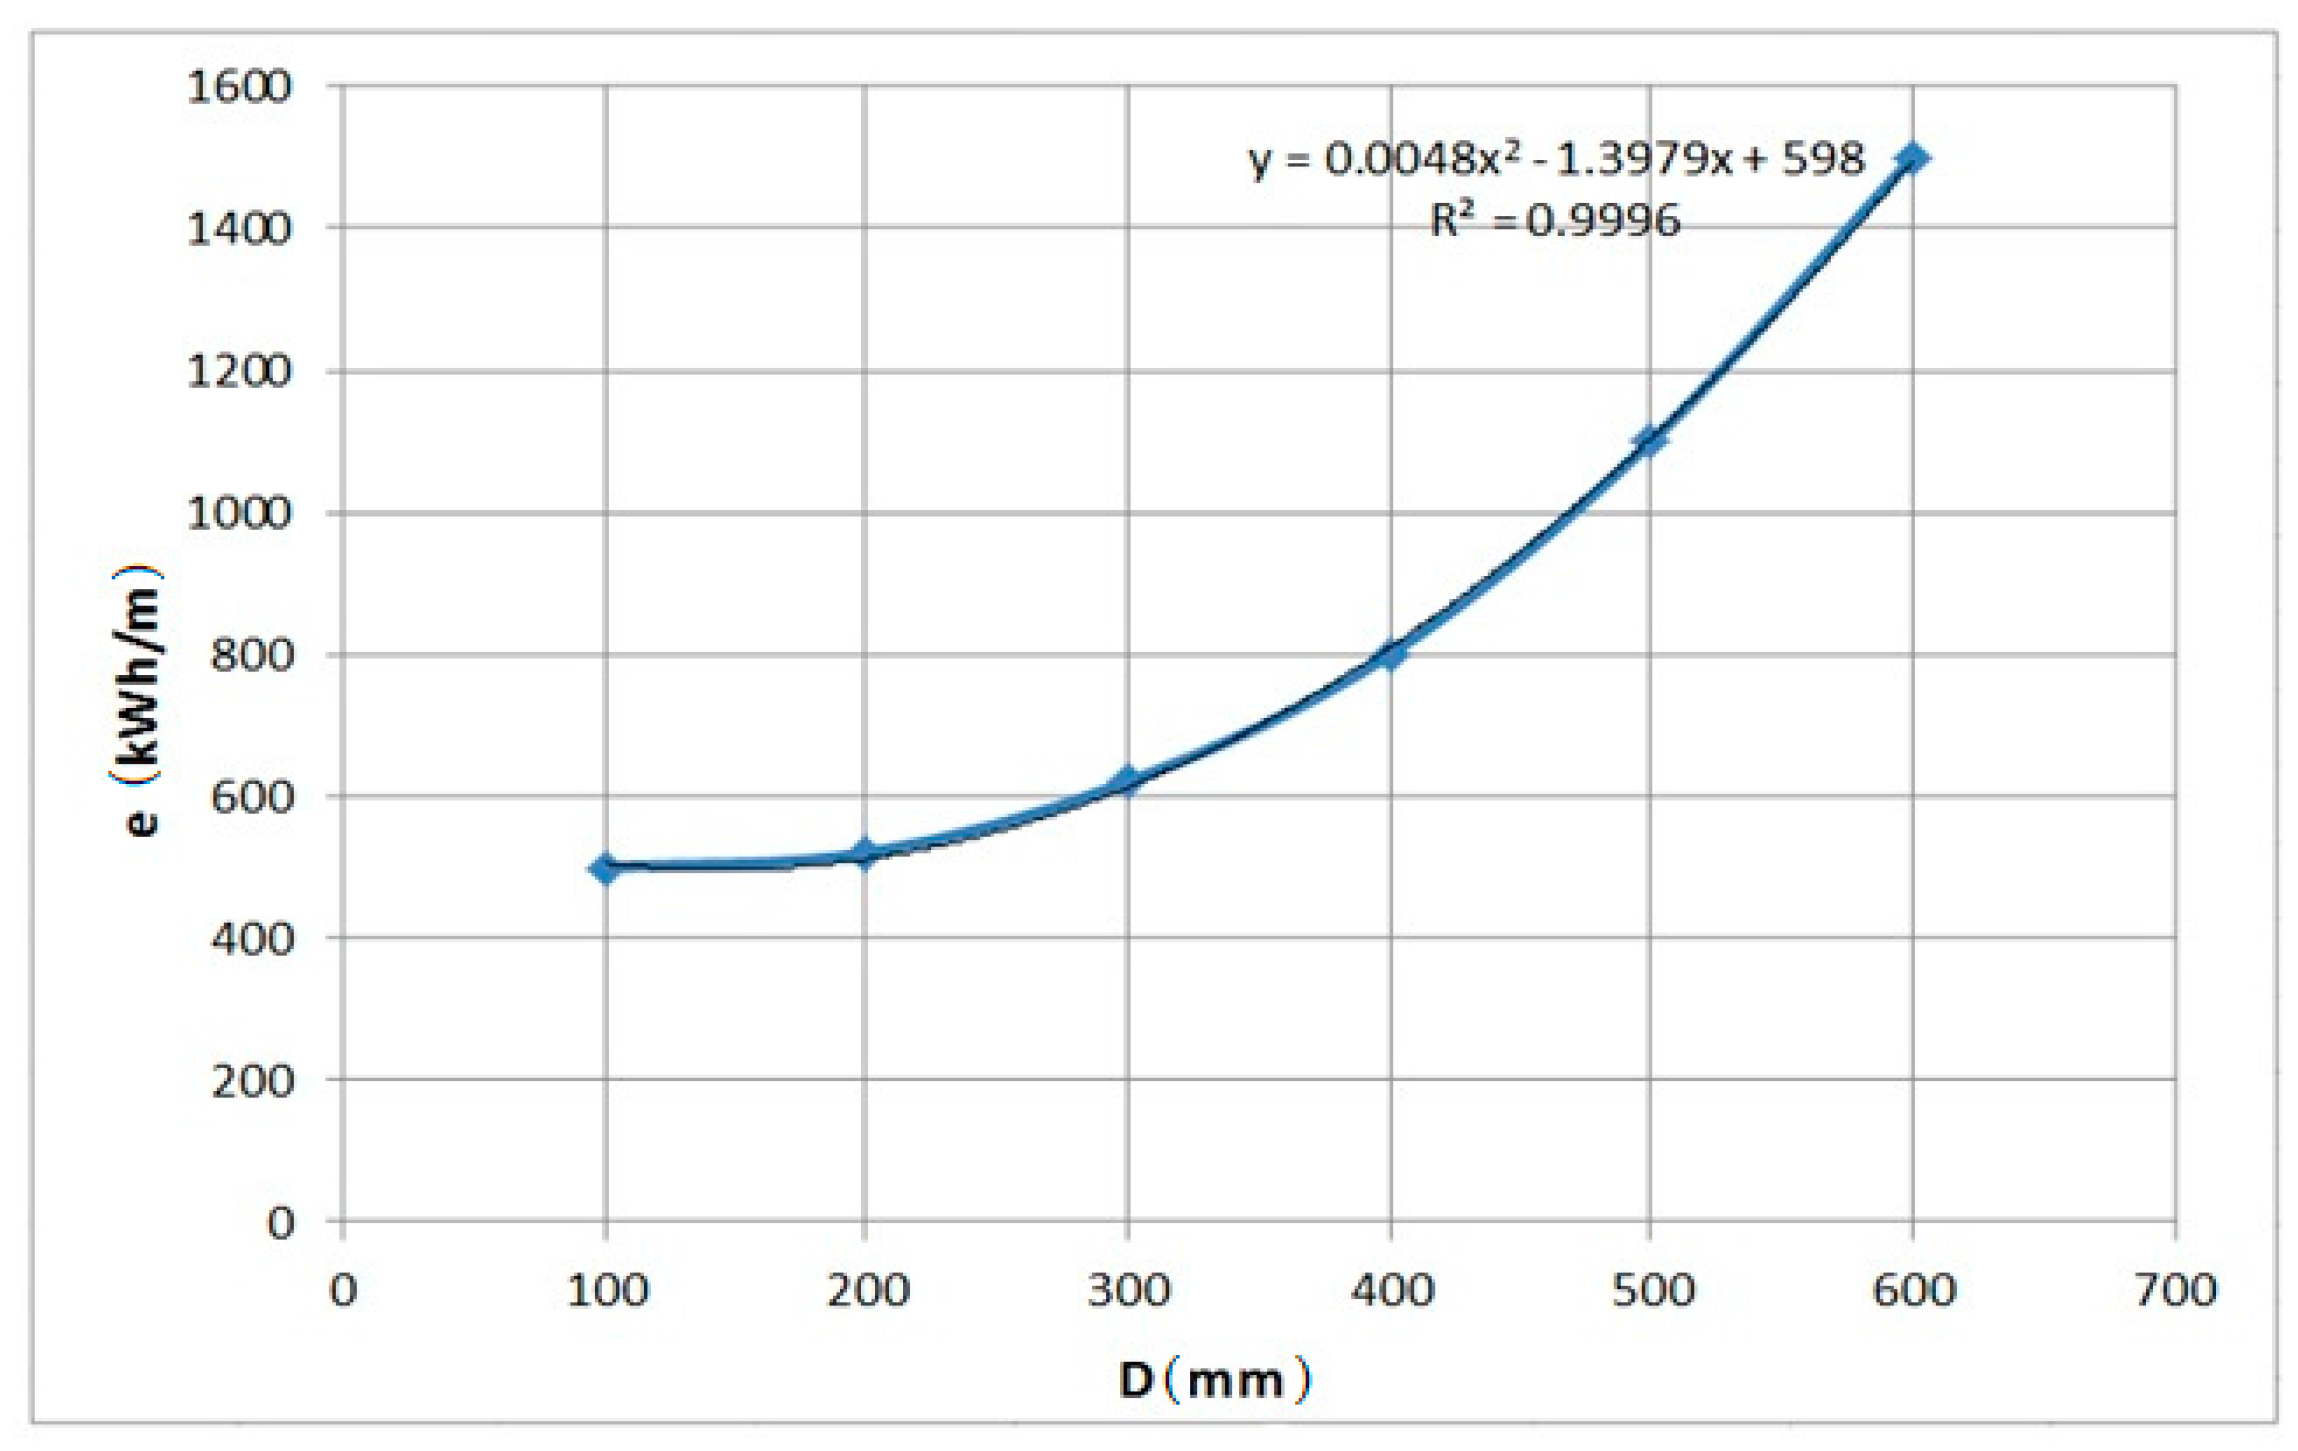
3.2. Energy Index for the Included Energy (Energy)

The water discharge networks imply important consumptions of fuel and other forms of energy, on one hand for the production and mounting of pipes, and on the other hand, for the operation of the pumping installations for water circulation in the pipes.
That is why it is necessary to both rationalize and reduce the power consumption within the existing water discharge systems—especially in the new ones, by design—as well as the power that is consumed for their execution.
The chart in Figure 4 compares the data of specific equivalent average power and fuel consumptions that occur during the manufacturing and mounting of steel pipes used for the water discharge, in accordance with their diameter.
The specific value for embedded energy “e”, in relation with the pipes diameter “D”, can be approximated using the integral rational regression, in a function with the following form:
e = 0.0048·D2 − 1.3979·D + 598

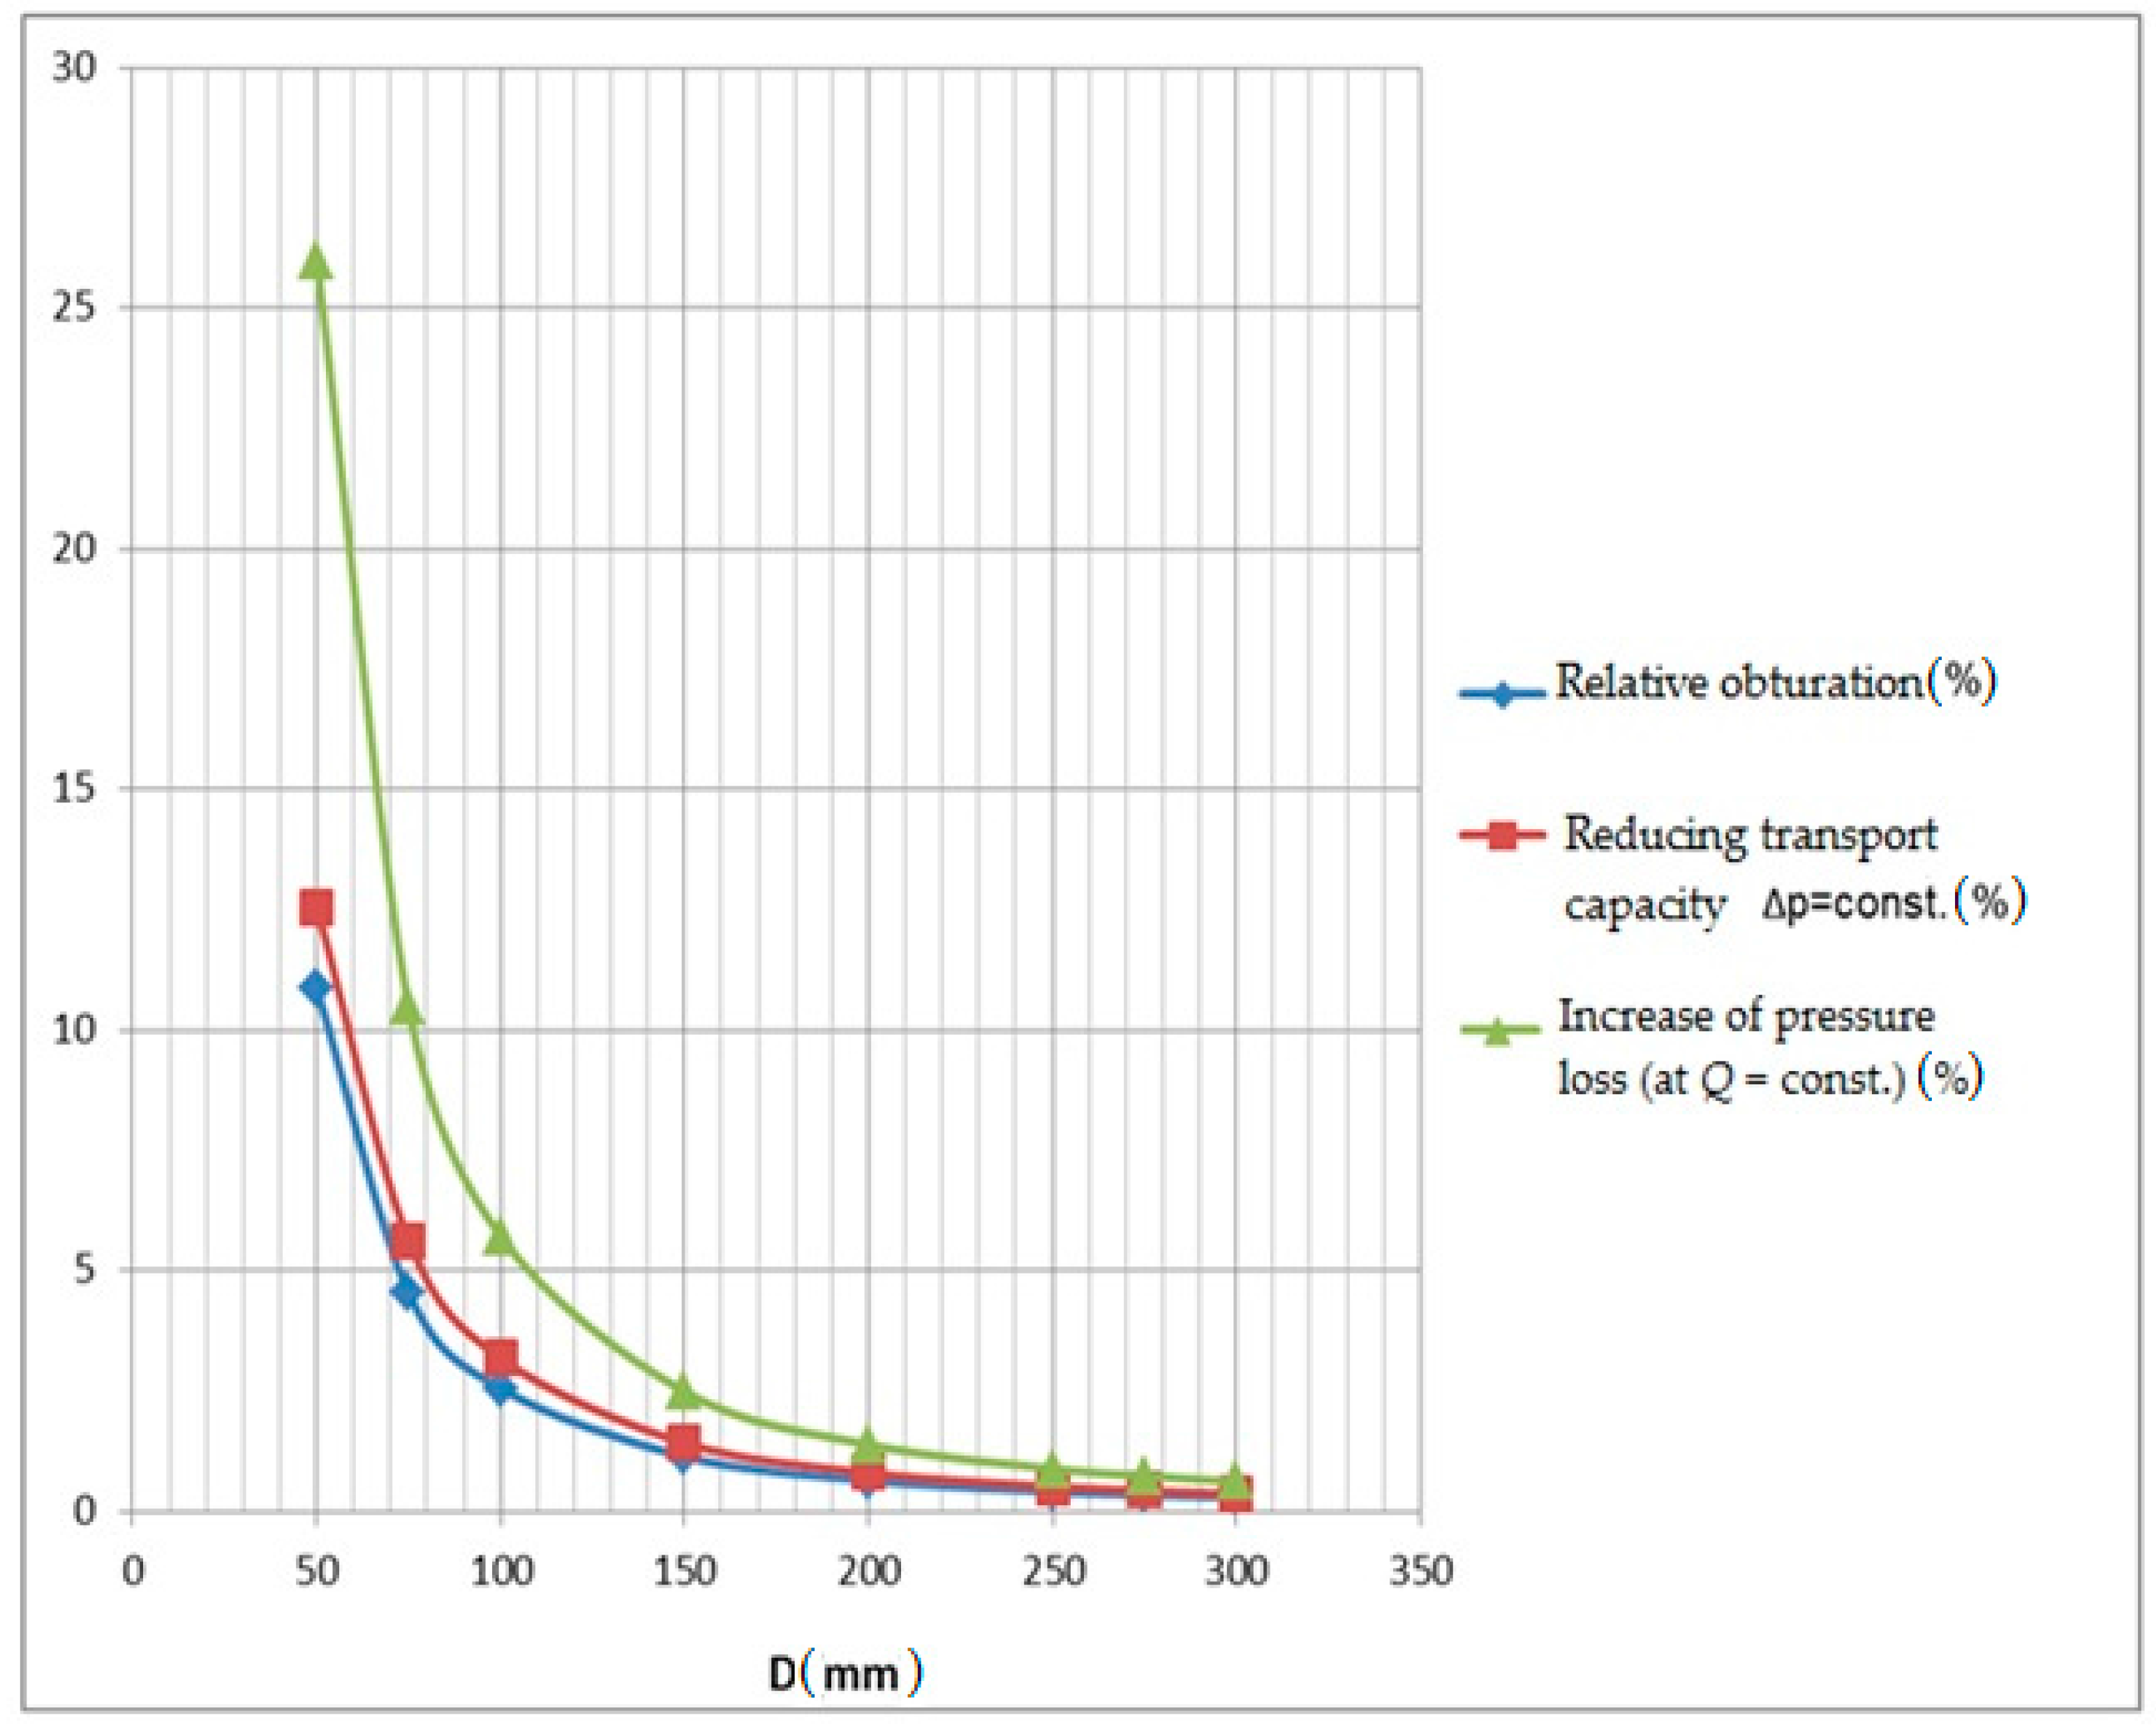
3.3. The Effect of Partial Obstruction of the Flow Section on the Pressure Losses and of the Pipe’s Transport Capacity Reduction

Operational energy losses in the water pipes are calculated based on the pressure losses.
The following are included in the total pressure losses (Δpf): linear losses (Δpl), and local losses (Δpξ):
Δpf = Δpl + Δpξ,
The linear (longitudinal) losses are determined with the Weisbach–Darcy equation:
Δ p l = λ ρ w 2 2 L D ( N / m 2 )
where:
  • λ represents the fluid dynamics resistance coefficient (Table 1);
  • ρ—water density (kg/m3);
  • w—water velocity (m/s);
  • L—section length (m);
  • D—section diameter (m).
For the calculation of local losses the Borda–Carnot-type equations are used:
Δ p ξ = ξ ρ w 2 2 ( N / m 2 ) ,
where ξ is the coefficient for local loss.
Pressure losses are influenced by the impurities deposited on the pipes’ walls.
By disconnecting certain pipes on sections of various diameters, the obstructed areas were measured (deposits of a mixture of water, oil, dust, and rust on a pipe wall).
For the purpose of introducing the obstruction effect on the longitudinal pressure losses, we propose to use a new term in the Weisbach–Darcy equation called “the thickness of the uniform obstruction”, which is defined by the equation:
δ = 1 2 [ D i 4 π ( S tot S obt ) ]
where:
  • Di is the pipe’s interior diameter, (m);
  • Stot is the area of the flow’s cross-section to the new pipe (m2);
  • Sobt is the area of the area obstructed by sediments (m2).
Although the space of water and obstructing deposits are in the shape of a circular section in the pipe’s cross-section, in order to allow a quantitative assessment of the pipe’s diameter reduction due to obstruction, the obstructed section shall be considered an annular shape, with the obstruction material being uniformly located on the pipe’s wall and having the thickness δ.
The values of the uniform obstruction’s thickness for various relative obstructions are given in Table 2.
The obstructed area was calculated based on experimental measurements using the equation:
S obt = 1 2 r 2 [ π ϕ 180 sin ϕ ]
where r is the pipe radius (m), and υ is the angle in the centre (degrees).
For regular quality steel pipes, the status of the material in accordance with the k retardance is:
  • 0.05–0.1—the material is considered to be new;
  • 0.15–0.2—the material is considered to be technically appropriate;
  • 0.4–0.5—cleaning after long-term use;
  • 0.6–1—the material is moderately rusted with slight incrustations;
  • 1.1–1.5—after 15 years of operation with incrustations;
  • 2–2.5—after 20 years of operation with incrustations and deposits;
  • 3—the material presents strong incrustations.
The effect of the section reduction increases parabolically along with the decrease of the diameter. In the case of mining water discharge networks that have been in operation for five years, an absolute obstruction is found between 100–300 mm2, as shown in Figure 5.
Experiments highlight that an equal degree of pipe obstruction is translated into a relative percentage decrease, differentially, of the pipe’s transport capacity, and respectively, in a relative variable increase of the pressure loss determined by the relative differential obstruction of the section for a series of diameters. The values obtained for an absolute obstruction of 200 mm2 are presented in Figure 4, and centralized in Table 3.
Based on Figure 5 and Table 3, and after considering several real cases of water discharge pipes, and calculating the weighted averages according to the length of the majority of the pressure losses and transport capacity reduction due to partial obstruction of the flow section, I noticed that the operational energy loss due to pipe obstruction represented 3.5–5.5 % of the energy used for water circulation.

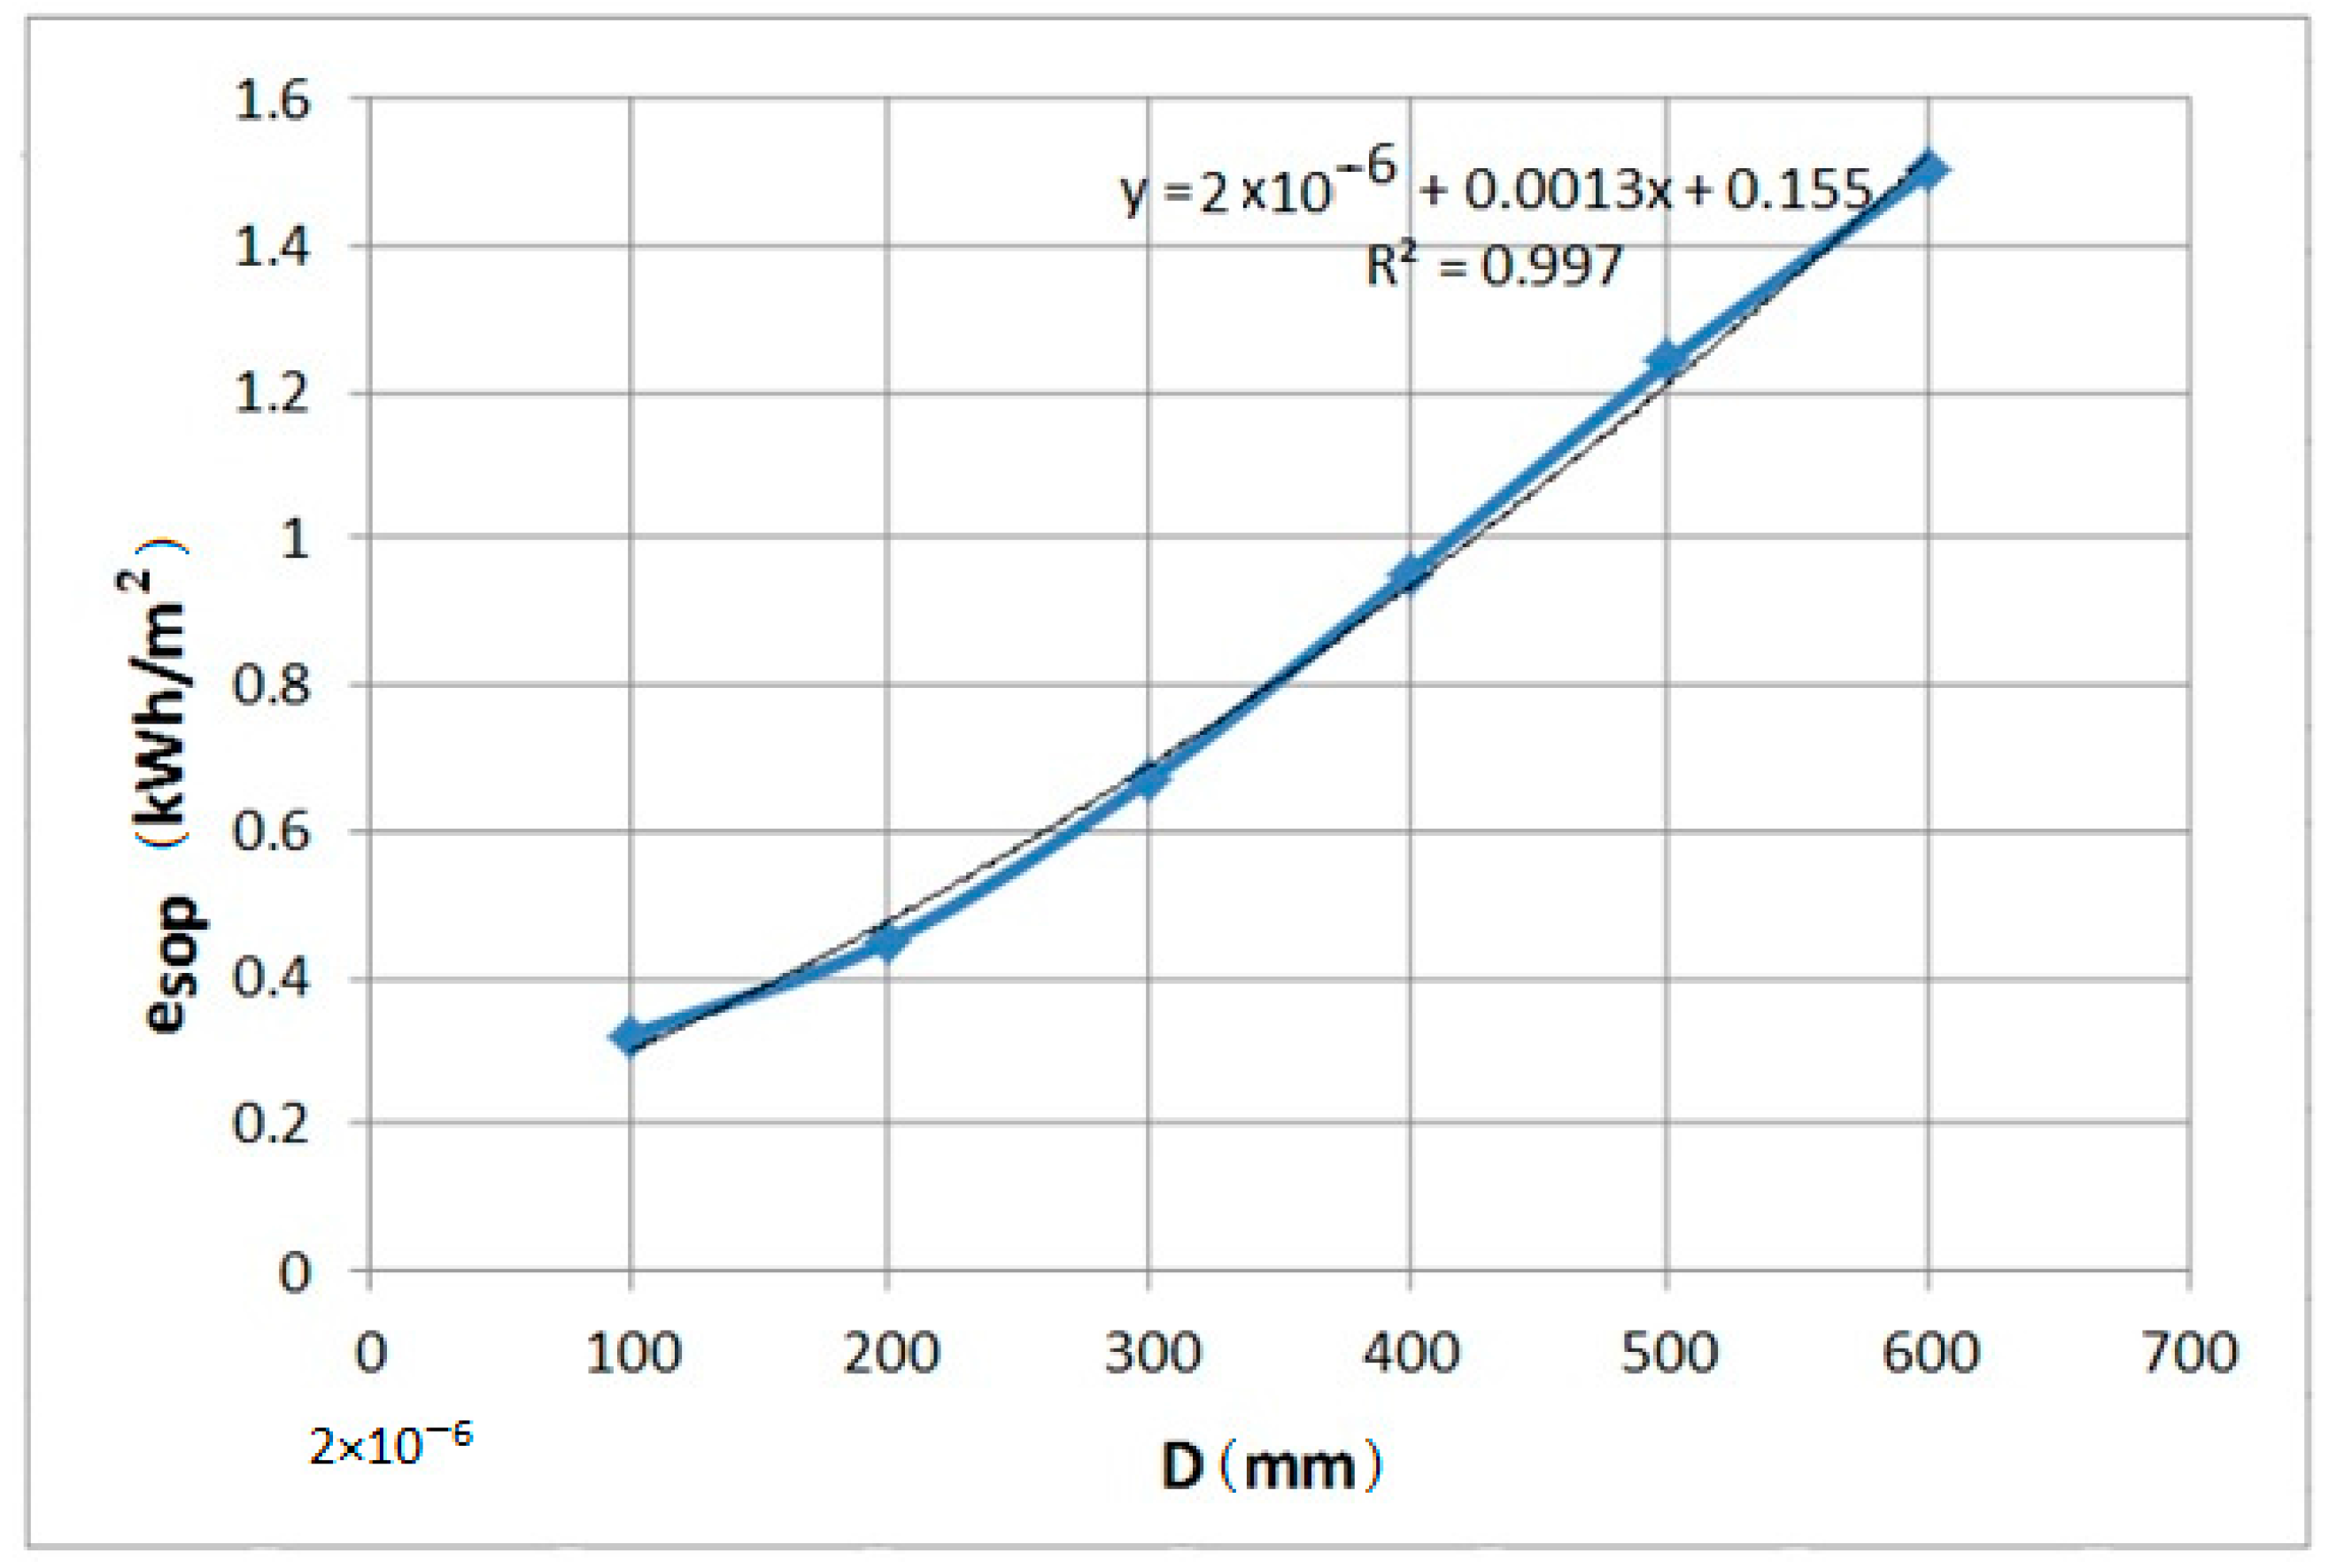
3.4. Energy Index for Operational Energy

The following are included under the name operational energy: the energy used from the power network, energy losses, and energy capitalization at the end user. In the case of water discharge networks from mining works, the operational energy represents the sum of the energy of discharged water (current), longitudinal and local energy losses in the network, additional losses due to obstruction, pump losses, drive engine losses, and losses on the power line that supplies the drive engine.
Taking into account the components mentioned previously, and correlating the experimental data with information in the literature in this field, an average estimated value was calculated for the specific operational energy consumption esop (kWh/m2) (Figure 6).
The specific operational energy curve esop, in relation with the pipes’ D diameter, can be approximated using integral rational regression, in a function of the form:
e = 0.000002 D 2 + 0.0013 D + 0.155

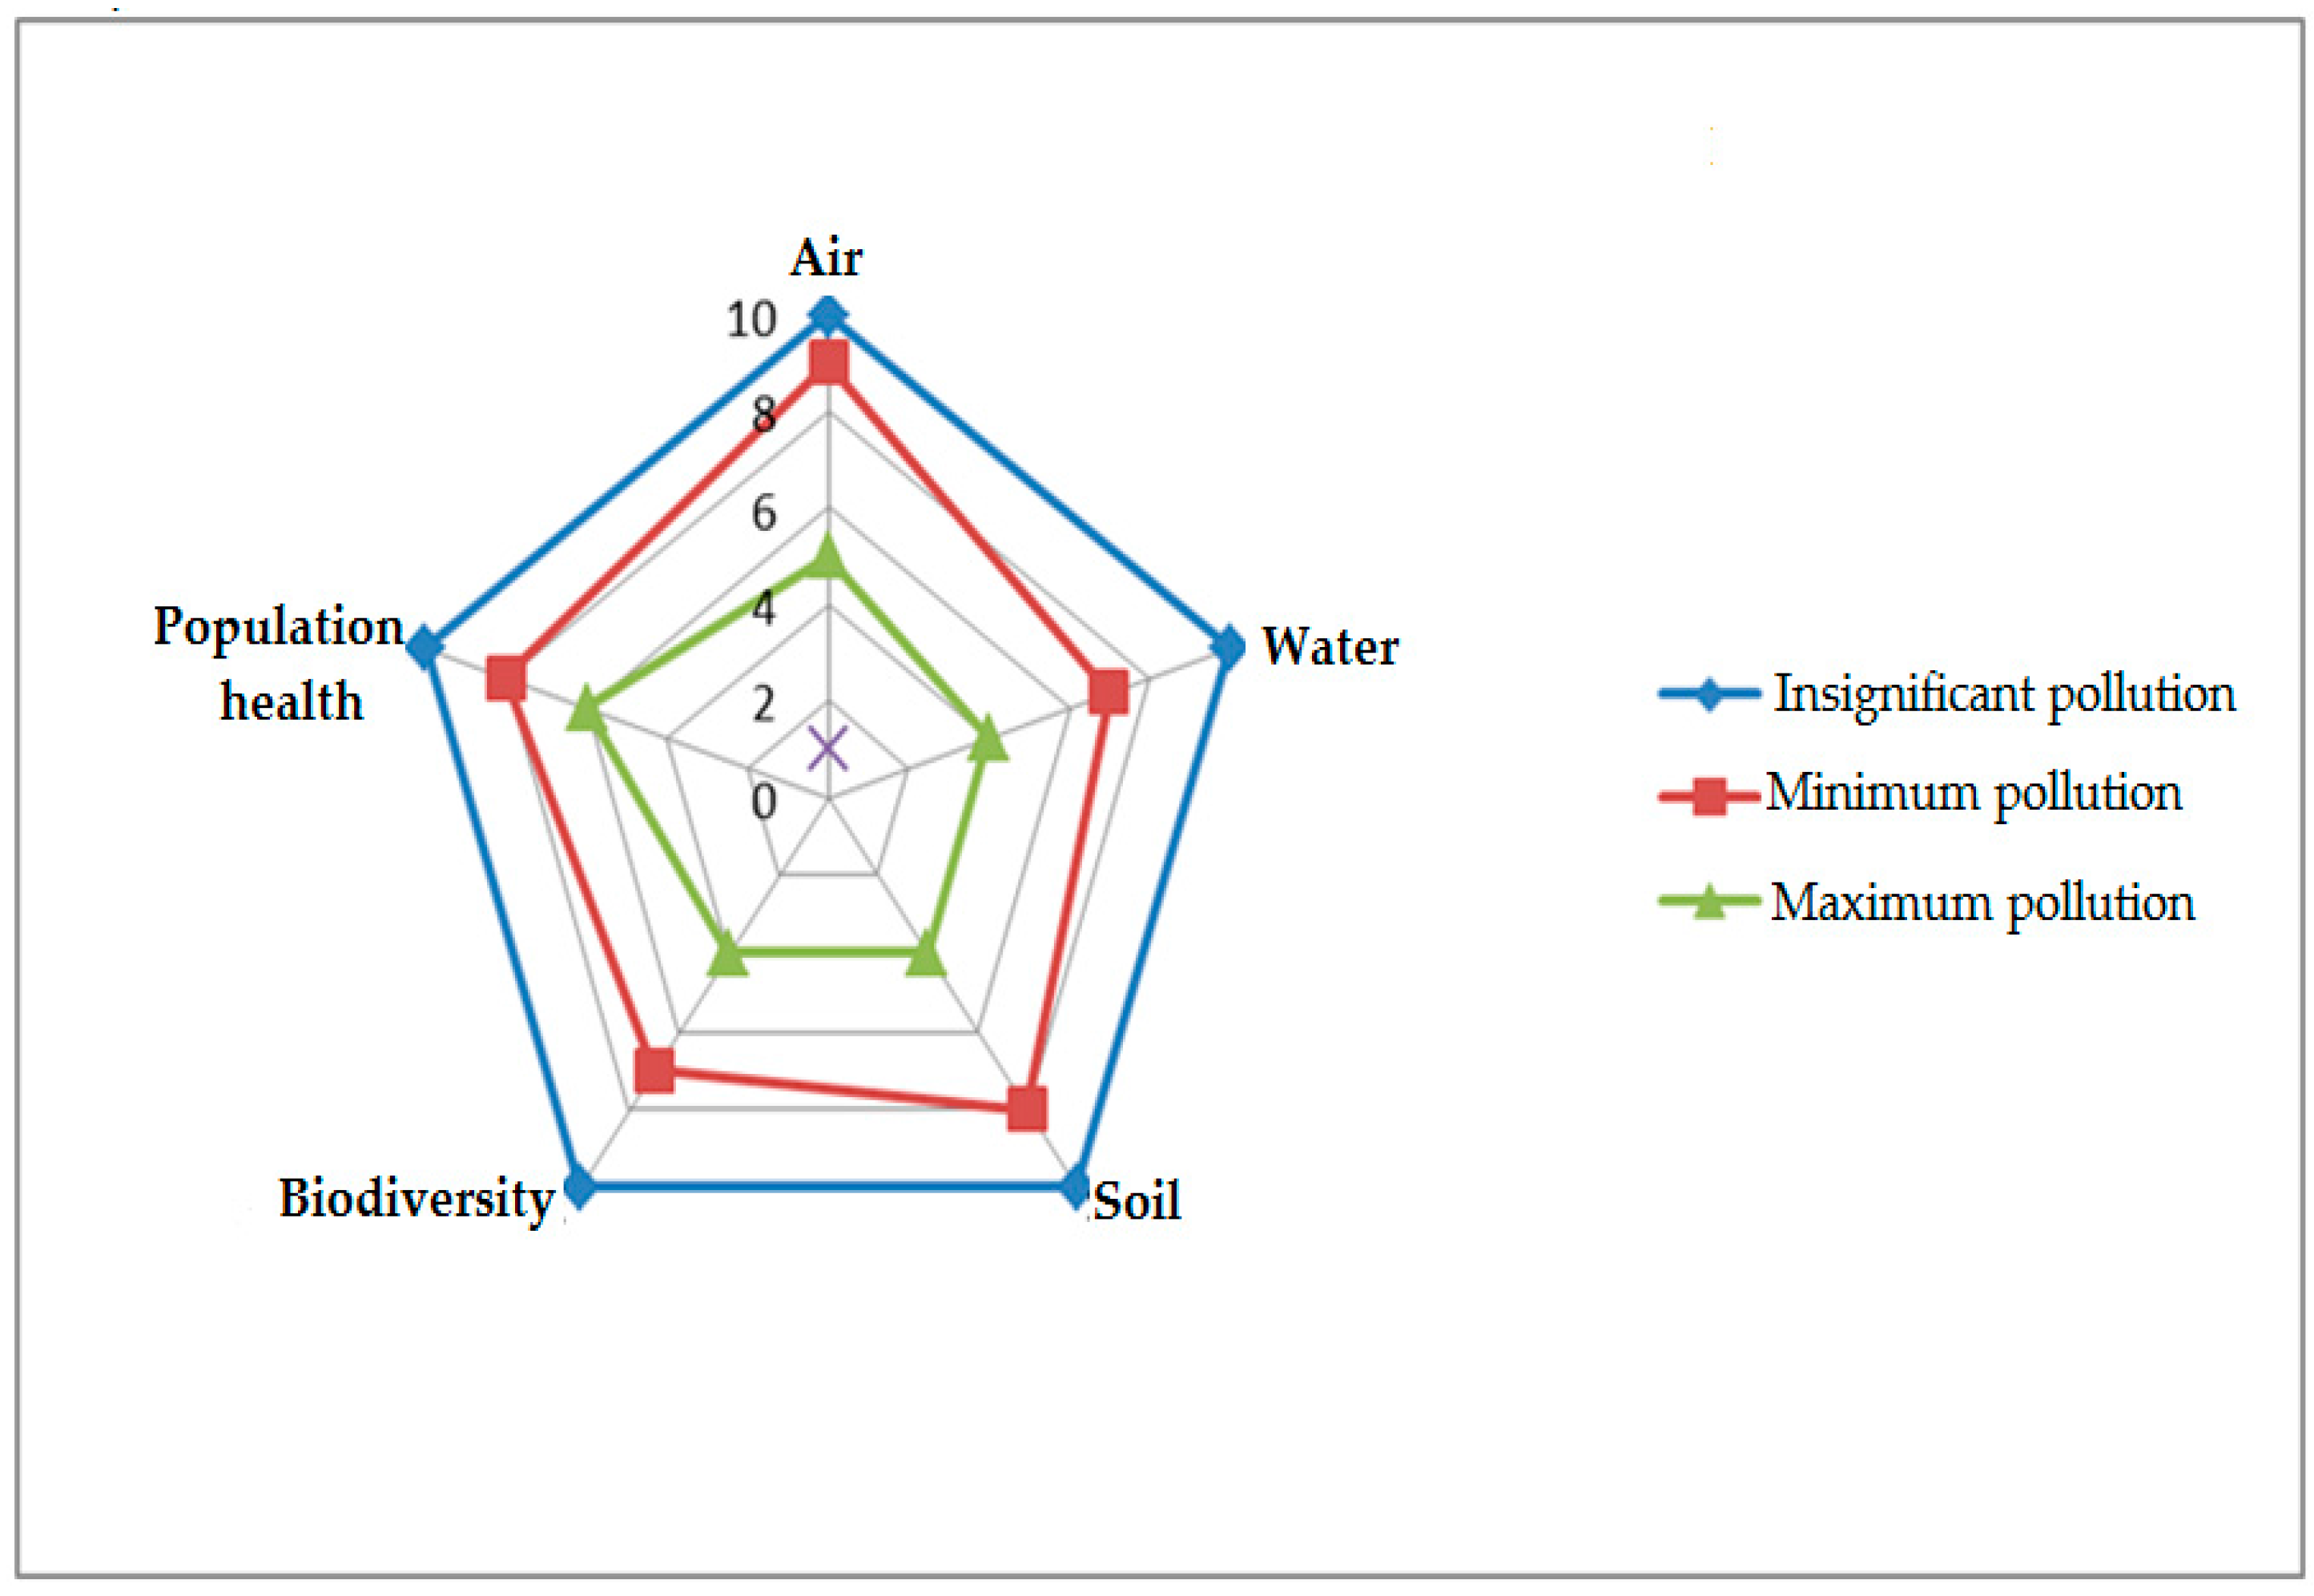
4. Environment Quality Index

The global pollution index represents a method of assessing the environment’s health, or pollution status. It expresses this status from the quantity point of view, which is based on an index that has resulted from a ratio between the ideal value and the given value—at a specific moment—of certain quality indices that are considered specific for the analyzed environmental factors.
The GPI method involves going through several stages of synthetic assessment based on quality indices that might reflect the general status of one of the analyzed environmental factors, and then their correlation using a graphic method.
In this respect, it is proposed to enlist quality at a given moment of every environmental factor in a reliability scale, by granting marks that would express its closeness to, or distance from, the ideal status.
The reliability scale is expressed in grades from 1 to 10, with 10 representing a natural status unaltered by human activity, and 1 representing an irreversible and extremely serious deteriorated situation of the analyzed environmental factor.
Generally, it is considered that it is possible to assess the environment health in a certain area and at a certain given moment by:
  • Air quality;
  • Water quality;
  • Soil quality;
  • Population’s health status;
  • Recorded deficit of species, plants, and animals (biodiversity).
Each of these factors can be characterized by several qualitative indices that are representative of the assessment of the pollution degree, and for which admissible limits are established. A reliability grade is granted according to the inclusion within the specified limits. The ideal status is graphically represented by a regular geometrical shape with radiuses equal to each other, and with the grade 10 of the reliability unity. By joining the points that resulted from the location of the values expressing the real status, an irregular geometrical shape is obtained with a smaller surface, inscribed in the regular geometrical shape of the ideal status.
The index of a global pollution status of an ecosystem—GPI—results from the ratio between the surfaces representing the ideal status; SI—and the surface representing the real status—SR.
GPI = S I S R
When there are no changes in the quality of the environmental factors—i.e., when there is no pollution—this index is 1. Graphically, the geometrical shape illustrating the real status of the environment overlaps, and the figure illustrates the ideal status. When there are changes in the quality of the environmental factors, the index shall get higher, and show higher over unity values as the surface of the real triangle, square, or pentagon diminishes.
The reliability grades that are obtained for every environmental factor in the analyzed area contribute to the graphic execution of a chart as a method to simulate the synergic effect. The geometrical shape is an equilateral triangle when the three environmental factors are analyzed, a square when we have data for four environmental factors, and it can be a regular pentagon when five environmental factors are considered.
The alternative approach in this paper—the evaluation of impact on the environment—is carried out using a matrix method (quality indices) and the V. Rojanschi method (global pollution index) [21].
Applying the correlations between the quality indices and the reliability grades [21], the following values are obtained for the targeted environmental factors:
  • The value of the reliability grade for maximum air pollution (reliability grade 5), for water (reliability grade 4), for soil (reliability grade 4), for biodiversity (reliability grade 4), for population health (reliability grade 6);
  • The value of the reliability grade for minimum air pollution (reliability grade 9), for water (reliability grade 7), for soil–subsoil (reliability grade 8), for biodiversity (reliability grade 7), and for population health (reliability grade 8).
Based on the reliability grades granted to the considered environmental factors, a global pollution index chart was built where the following are represented: ideal status, minimum pollution status, and maximum pollution status (Figure 7).
Calculating the afferent areas to the environment’s status, the following values are obtained:
  • Area afferent to ideal status—SI = 240 cm2;
  • Area afferent to maximum pollution status—Spol.max = 46.07 cm2;
  • Area afferent to minimum pollution status—Spol.min = 136.965 cm2.
The value of the global pollution index for the two statuses overlapping the comparison:
  • Global pollution index for maximum pollution status;
    G P I pol max = S I S pol max = 240 46.07 = 5.2
  • Global pollution index for minimum pollution status;
    G P I pol min = S I S pol min = 240 136.965 = 1.75

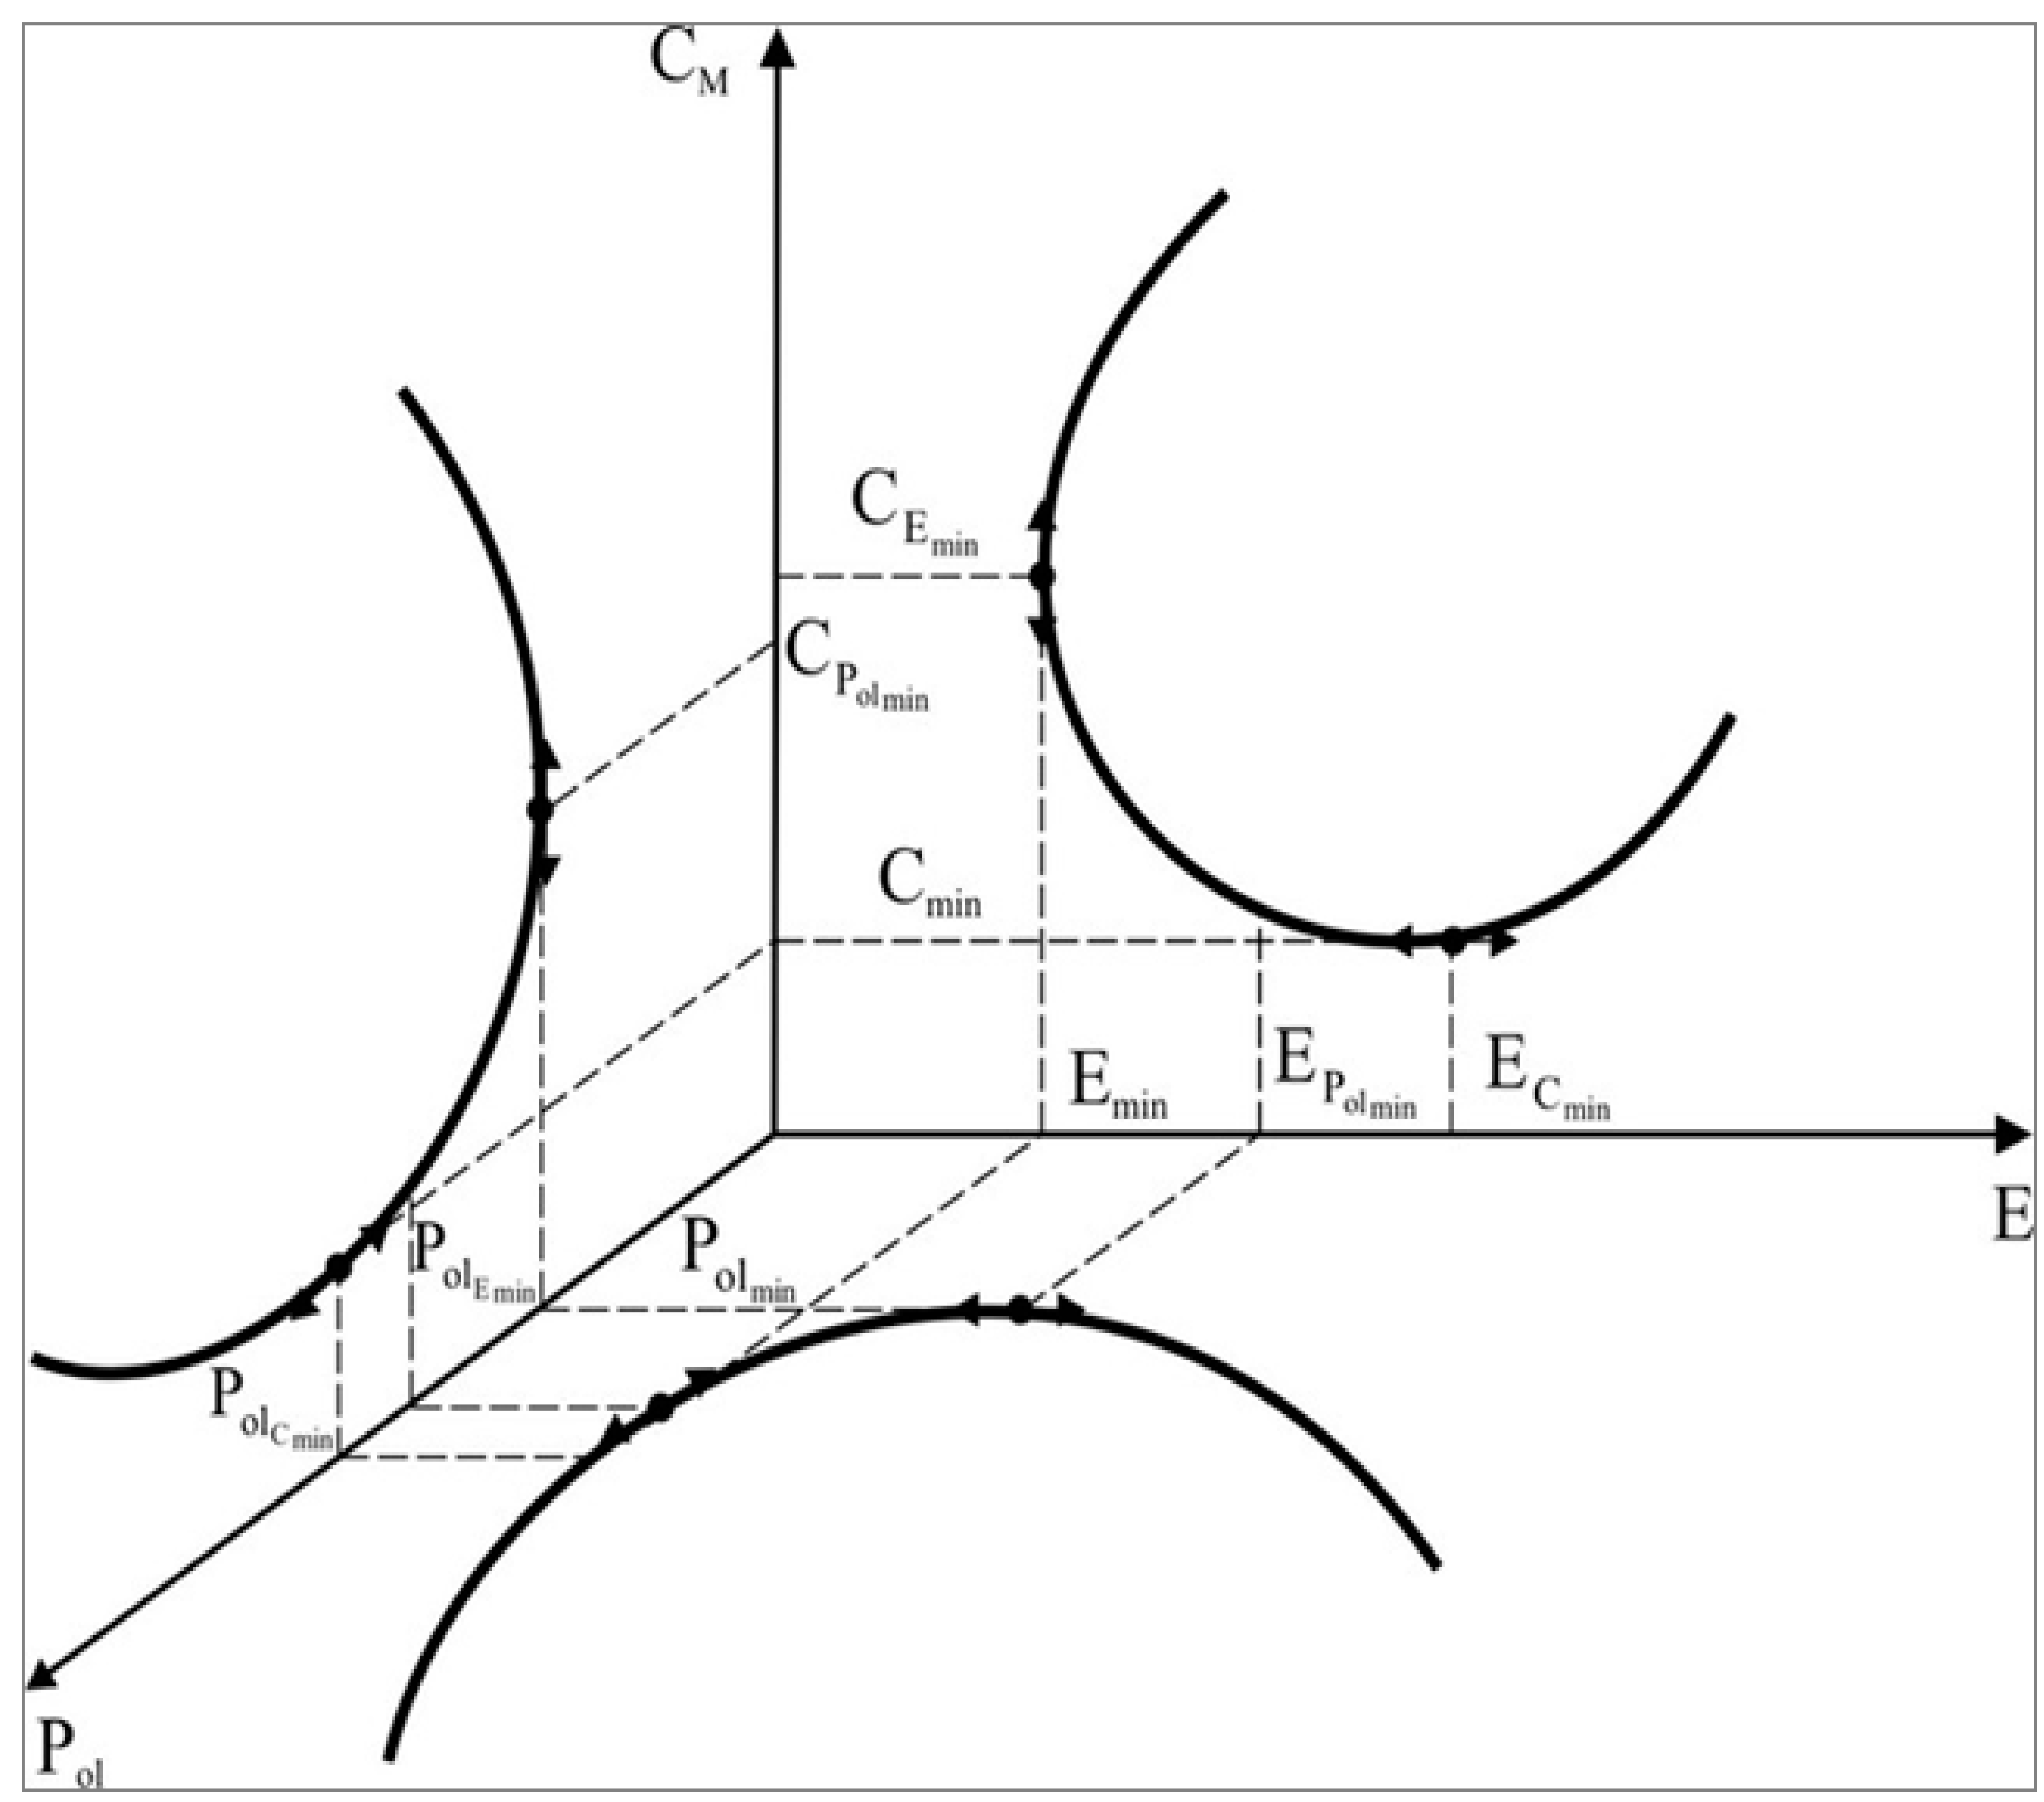
5. Aggregation Method for the Economic, Energy and Ecologic Indices

In order to have the synergistic image of the economic, energy, and ecologic effects afferent to an industrial objective, the specialty literature uses various aggregation methods for performance indices.
Based on the CAREC chart (energy–cost characteristic) [23], which we adapted to the studied case, processed, and completed with the component regarding the environmental impact, we built the three-dimensional CAREEC chart (energy–ecology–cost characteristic), as shown in Figure 8.
The coordinates of the proposed chart are represented by: CM–monetary cost; E–total energy used; and Pol–environmental impact. The values of the specific costs, which correspond to coordinates, were expressed as a percentage of the maximum value in order to have a common measurement unit.
The values ECmin, CEmin, and PolCmin correspond to 100%.
The CAREEC chart enables the highlighting of various costs that are afferent to optimization measures based on economical, energy, and ecological criteria.
As can be observed in Figure 8, the following correlations can be done:
  • The difference between ECmin–Emin shows the additional energy costs in order to reduce monetary costs;
  • The difference between EPolmin–Emin shows the additional energy costs in order to reduce environmental costs (afferent to pollution);
  • The difference between CEmin–Cmin shows the additional monetary costs in order to reduce energy costs;
  • The difference between CPolmin–Cmin shows the additional monetary costs in order to reduce environmental costs;
  • The difference between PolEmin–Polmin shows the additional environmental costs in order to reduce energy costs;
  • The difference between PolCmin–Polmin shows the additional environmental costs in order to reduce monetary costs.
Analyzing the water discharge networks from three mines, the following average percentage values were obtained:
  • To achieve an energy saving of ECmin − Emin = 60%, the monetary costs are increased by 65%, and the environmental costs are increased by 35%;
  • To achieve an energy saving of Epolmin − Emin = 31%, the monetary costs are increased by 42%, and the environmental costs are increased by 28%;
  • To reduce environmental costs by PolCmin − Polmin = 46.5%, the monetary costs are increased by 49%, and the energy costs are increased by 31%.

6. Conclusions

Our proposed method is a synergistic aggregation of the harmfulness balance sheet and the classic balance sheets for matter and energy for an industrial procedure.
The difficulty of the method resides in the:
  • Collection of experimental data;
  • Definition of the system frontier to which the balance sheet applies. The conclusions differed for the analysis of an objective when the location is in a depression, a hilly area or a field area;
  • Definition of maximum allowed harmfulness;
  • Consideration of local environmental characteristics;
  • Harmonization of national and international regulations;
  • Achieving a compromise between regional and global interest.
The advantages offered by this approach are materialized via:
  • Using concepts and analytical tools from exergetic balance sheets;
  • Obtaining synthetic values that represent the global ecological load exercised by the analyzed system on its own environment;
  • The method allowing the comparison of different solutions regarding the execution of a product;
  • Providing information regarding the ecological carrying capacity of an ecosystem and attaining certain alarm thresholds;
  • With significant additions, it can be fitted into an analytical–experimental apparatus designed for the operationalizing of the sustainable development concept;
  • It provides the possibility of a periodical control of the real measurements’ results regarding environmental protection, economic efficiency, and energy efficiency, which also facilitate their quantification.
The mining industry is also a primary energy producer (coal) and a large energy consumer of various types of energy, including: primary (hydraulic) and secondary (electric energy, compressed air). Therefore, for the sustainable development of this industry, various measures and interventions are necessary that use methods and tools to reduce and rationalize the consumption and minimize environmental impact.

Author Contributions

All authors contributed equally to the research presented in this paper and to the preparation of the final manuscript.

Conflicts of Interest

The authors declare no conflict of interest.

References

  1. Le Goff, P.; Giuletti, M. Is the “Value” of a source of energy based on enthalpy, entropy, economy or ecology? An example of application: the optimisation of a heat exchange. In Energy: Money, Materials and Engineering, Institution of Chemical Engineers Symposium Series; T1 Thermodynamics and Economics Is There a Conflict? Zhou, Y., Ed.; Elsevier: New York, NY, USA, 2013. [Google Scholar]
  2. The World Commission on Environment and Development. Our Common Future. In Report of the World Commission on Environment and Development; WCED: Geneva, Switzerland, 1987; Available online: http://www.un-documents.net/wced-ocf.htm (accessed on 2 July 2017).
  3. United Nations Conference on Environment and Development (UNCED). Rio de Janeiro, Brazil, 3–14 June 1992. Available online: https://sustainabledevelopment.un.org/ (accessed on 15 June 2017).
  4. United Nations (UN). Earth Summit +5, Meeting in New York, 1997. Available online: http://www.un.org/esa/earthsummit/ (accessed on 10 June 2017).
  5. World Summit on Sustainable Development (WSSD), Johannesburg, 2002. Available online: https://joburg.org.za/pdfs/johannesburgdeclaration.pdf (accessed on 10 June 2017).
  6. United Nations Conference on Sustainable Development (UNCSD). In Proceedings of the Rio+20, Rio de Janeiro, Brazil, 20–22 June 2012; Available online: https://sustainabledevelopment.un.org/rio20 (accessed on 10 June 2017).
  7. Atkinson, G.; Dubourg, R.; Hamilton, K.; Munasinghe, M.; Pearce, D.; Young, C. Measuring Sustainable Development: Macroeconomics and the Environment; Edward Elgar Publishing Limited: Cheltenham, UK, 1997. [Google Scholar]
  8. Berke, P.R.; Conroy, M. Are We Planning for Sustainable Development? J. Am. Plan. Assoc. 2001, 66, 21–34. [Google Scholar] [CrossRef]
  9. Hopwood, B.; Mellor, M.; O’Brien, G. Sustainable development: Mapping different approaches. Sustain. Dev. 2005, 13, 38–52. [Google Scholar] [CrossRef]
  10. Blackburn, W. The Sustainability Handbook; Environmental Law Institute: Washington, DC, USA, 2008. [Google Scholar]
  11. Bell, S.; Morse, S. Sustainability Indicators: Measuring the Immeasurable? 2nd ed.; TJ International Ltd.: Padstow, UK, 2008. [Google Scholar]
  12. Cioca, L.I.; Ivascu, L.; Rada, E.C.; Torretta, V.; Ionescu, G. The study of sustainable development andtechnological impact on CO2 reducing conditions: Case study of Romania. Sustainability 2015, 7, 1637–1650. [Google Scholar] [CrossRef]
  13. Irimie, I.S. Management of the Sustainable Development of a Community Energy System—Whit Referances to Jiu Valley; Politehnica University Publisher: Timisoara, Romania, 2014. [Google Scholar]
  14. Gardiner, R. Earth Summit 2002 Explained. Stakeholder Forum’s “Towards Earth Summit 2002 Project”. 2002. Available online: http://www.earthsummit2002.org/Es2002.pdf (accessed on 6 September 2017).
  15. European Union, 2010-Europa Project 2030, Challenges and Opportunities. Report to the European Council of the Reflection Group on the Future of the EU 2030, May 2010. Available online: http://www.consilium.europa.eu/en/documents-publications/publications/2010/project-europe-2030-challenges-opportunities/ (accessed on 5 September 2017).
  16. Romanian Government. National Sustainable Development Strategy Romania 2013–2020–2030. Available online: http://www.mmediu.ro/beta/domenii/dezvoltare-durabila/strategia-nationala-a-romaniei-2013-2020-2030/ (accessed on 3 October 2017).
  17. The Ministry of Energy. Romanian Energy Strategy 2016–2030, with perspectives for 2050, 15 november 2016. Available online: http://www.ropepca.ro/en/articole/romanian-energy-strategy-2016-2030-with-perspectives-for-2050/385/ (accessed on 15 April 2017).
  18. Irimie, I.S.; Petrilean, D.C.; Dumitrescu, C.D. Aspects of Consumers’ Rights Protection for the Centralised Urban Heating Services. In Proceedings of the 21st IBIMA Conference, Vienna, Austria, 27–28 June 2013; pp. 756–767. [Google Scholar]
  19. Sârbu, I. Energetic Optimisation of Water Distribution Systems; Romanian Academy Publishing House: Bucharest, Romania, 1997. [Google Scholar]
  20. Irimie, I.I.; Matei, I. Gas Dynamics of Pneumatic Networks; Technical Publishing House: Bucharest, Romania, 1994. [Google Scholar]
  21. Godeanu, S. Elements of Ecological/Integrated Monitorin; Bucura Mond Publishing House: Bucharest, Romania, 1997. [Google Scholar]
  22. Irimie, S.I.; Gal, J.; Dumitrescu, C.D. Analysis of a dynamic regional system for the operationalizing of the sustainable development concept. Procedia Soc. Behav. Sci. 2014, 124, 331–338. Available online: http://www.sciencedirect.com/science/article/pii/S1877042814020412 (accessed on 12 May 2017). [CrossRef]
  23. Le Goff, P.; Giuletti, M. Optimisation économique et énergétique comparées d’un échangeur de chaleur. Entropie 1980, 93, 19–21. [Google Scholar]
Figure 1. Elements defining the Energy Strategy of Romania for 2016–2030, with an outlook to 2050 [17].
Sustainability 10 00240 g001
Figure 2. The energy trilemma [18].
Sustainability 10 00240 g002
Figure 3. Variation of specific average investment costs expressed in national currency (lei/m) according to the diameter of the water discharge network [19].
Sustainability 10 00240 g003
Figure 4. The influence of the diameter on the variation of the specific energy consumption included in the water discharge network’s pipes [19].
Sustainability 10 00240 g004
Figure 5. Variation of flow and of pressure loss for various degrees of relative obstruction of pipes. Adapted from Irimie & Matei [20] (p. 202).
Sustainability 10 00240 g005
Figure 6. The influence of diameter on the variation of specific operational energy consumption in the water discharge network’s pipes.
Sustainability 10 00240 g006
Figure 7. Calculation chart for the global pollution index. Adapted from Irimie, Gal & Dumitrescu [22] (p. 337).
Sustainability 10 00240 g007
Figure 8. CAREEC chart (energy–ecology–cost characteristic).
Sustainability 10 00240 g008
Table 1. Fluid dynamics resistance coefficient λ for various equivalent retardances [20] (p. 143).
No.Interior Diameter Di (mm)Fluid Dynamics Resistance Coefficient λ for Various Equivalent Retardances k (mm)
k = 0.05k = 0.1k = 0.15k = 0.2k = 0.4k = 0.6k = 0.8k = 1k = 1.5k = 2k = 3
1500.01960.02340.02610.03510.02610.04030.04460.04850.05710.6450.0778
2750.01780.02110.02340.02530.03090.03510.03870.04180.04850.05440.0645
31000.01670.01960.02170.02340.02840.03210.03510.03780.04360.04850.0571
41500.01520.01780.01960.02110.02530.02840.03090.03310.03780.04180.0485
52000.01440.01670.01830.01960.02340.02610.02840.03030.03440.03780.0436
62500.01370.01580.01740.01860.02210.02460.02660.02840.03210.03640.0403
73000.01320.01530.01670.01780.02110.02340.02530.02690.03030.03310.0378
84000.01250.01440.01560.01670.01960.02170.02340.02480.02780.03030.0344
Table 2. Values of the uniform obstruction thickness for various relative obstructions retardances [20].
No.Interior Diameter Di (m)Total Area Stot (m2)Obstructed Area Sobt (m2)Thickness of Uniform Obstruction δ (m)Relative Obstruction (%)Relative Obstruction 15%Relative Obstruction 20%Relative Obstruction 30%
Sobt (m2)Δ (m)Sobt (m2)Δ (m)Sobt (m2)Δ (m)
10.4000.12560.0121260.00999.6540.018840.015650.025120.021160.037680.03271
20.3000.07070.0006820.00749.6460.01060.01170.01410.01580.02120.0245
30.2500.04910.004740.00629.6530.007360.009730.009820.01320.01470.203
40.2000.03140.003030.00499.6490.004710.007830.006280.01060.009420.0163
50.1500.01770.001710.00369.6600.002650.005780.003540.007860.005310.0122
60.1000.007850.000760.00259.6800.001180.003920.001570.005290.002350.0816
70.0750.004410.0004260.00199.6590.0006610.002950.0003820.003990.001320.00614
80.0500.0019630.0001890.00129.6490.0002940.001950.0003920.002630.0005890.00406
Table 3. Values obtained for an absolute obstruction of 200 mm2 retardances [20] (p. 144).
For Di (m)Relative Obstruction (%)Reduction of Transport Capacity (at Δp = const.) (%)Increase of Pressure Loss (at Q = const.) (%)
5010.8612.56626.00
754.5275.62510.47
1002.5463.1745.71
1501.321.4142.48
2000.6360.7951.38
2500.4070.5090.88
2750.3360.4210.73
3000.2830.3530.61

