Two Scenarios for Landfills Design in Special Conditions Using the HELP Model: A Case Study in Babylon Governorate, Iraq


 ,
,
Abstract
:1. Introduction
2. Background Information
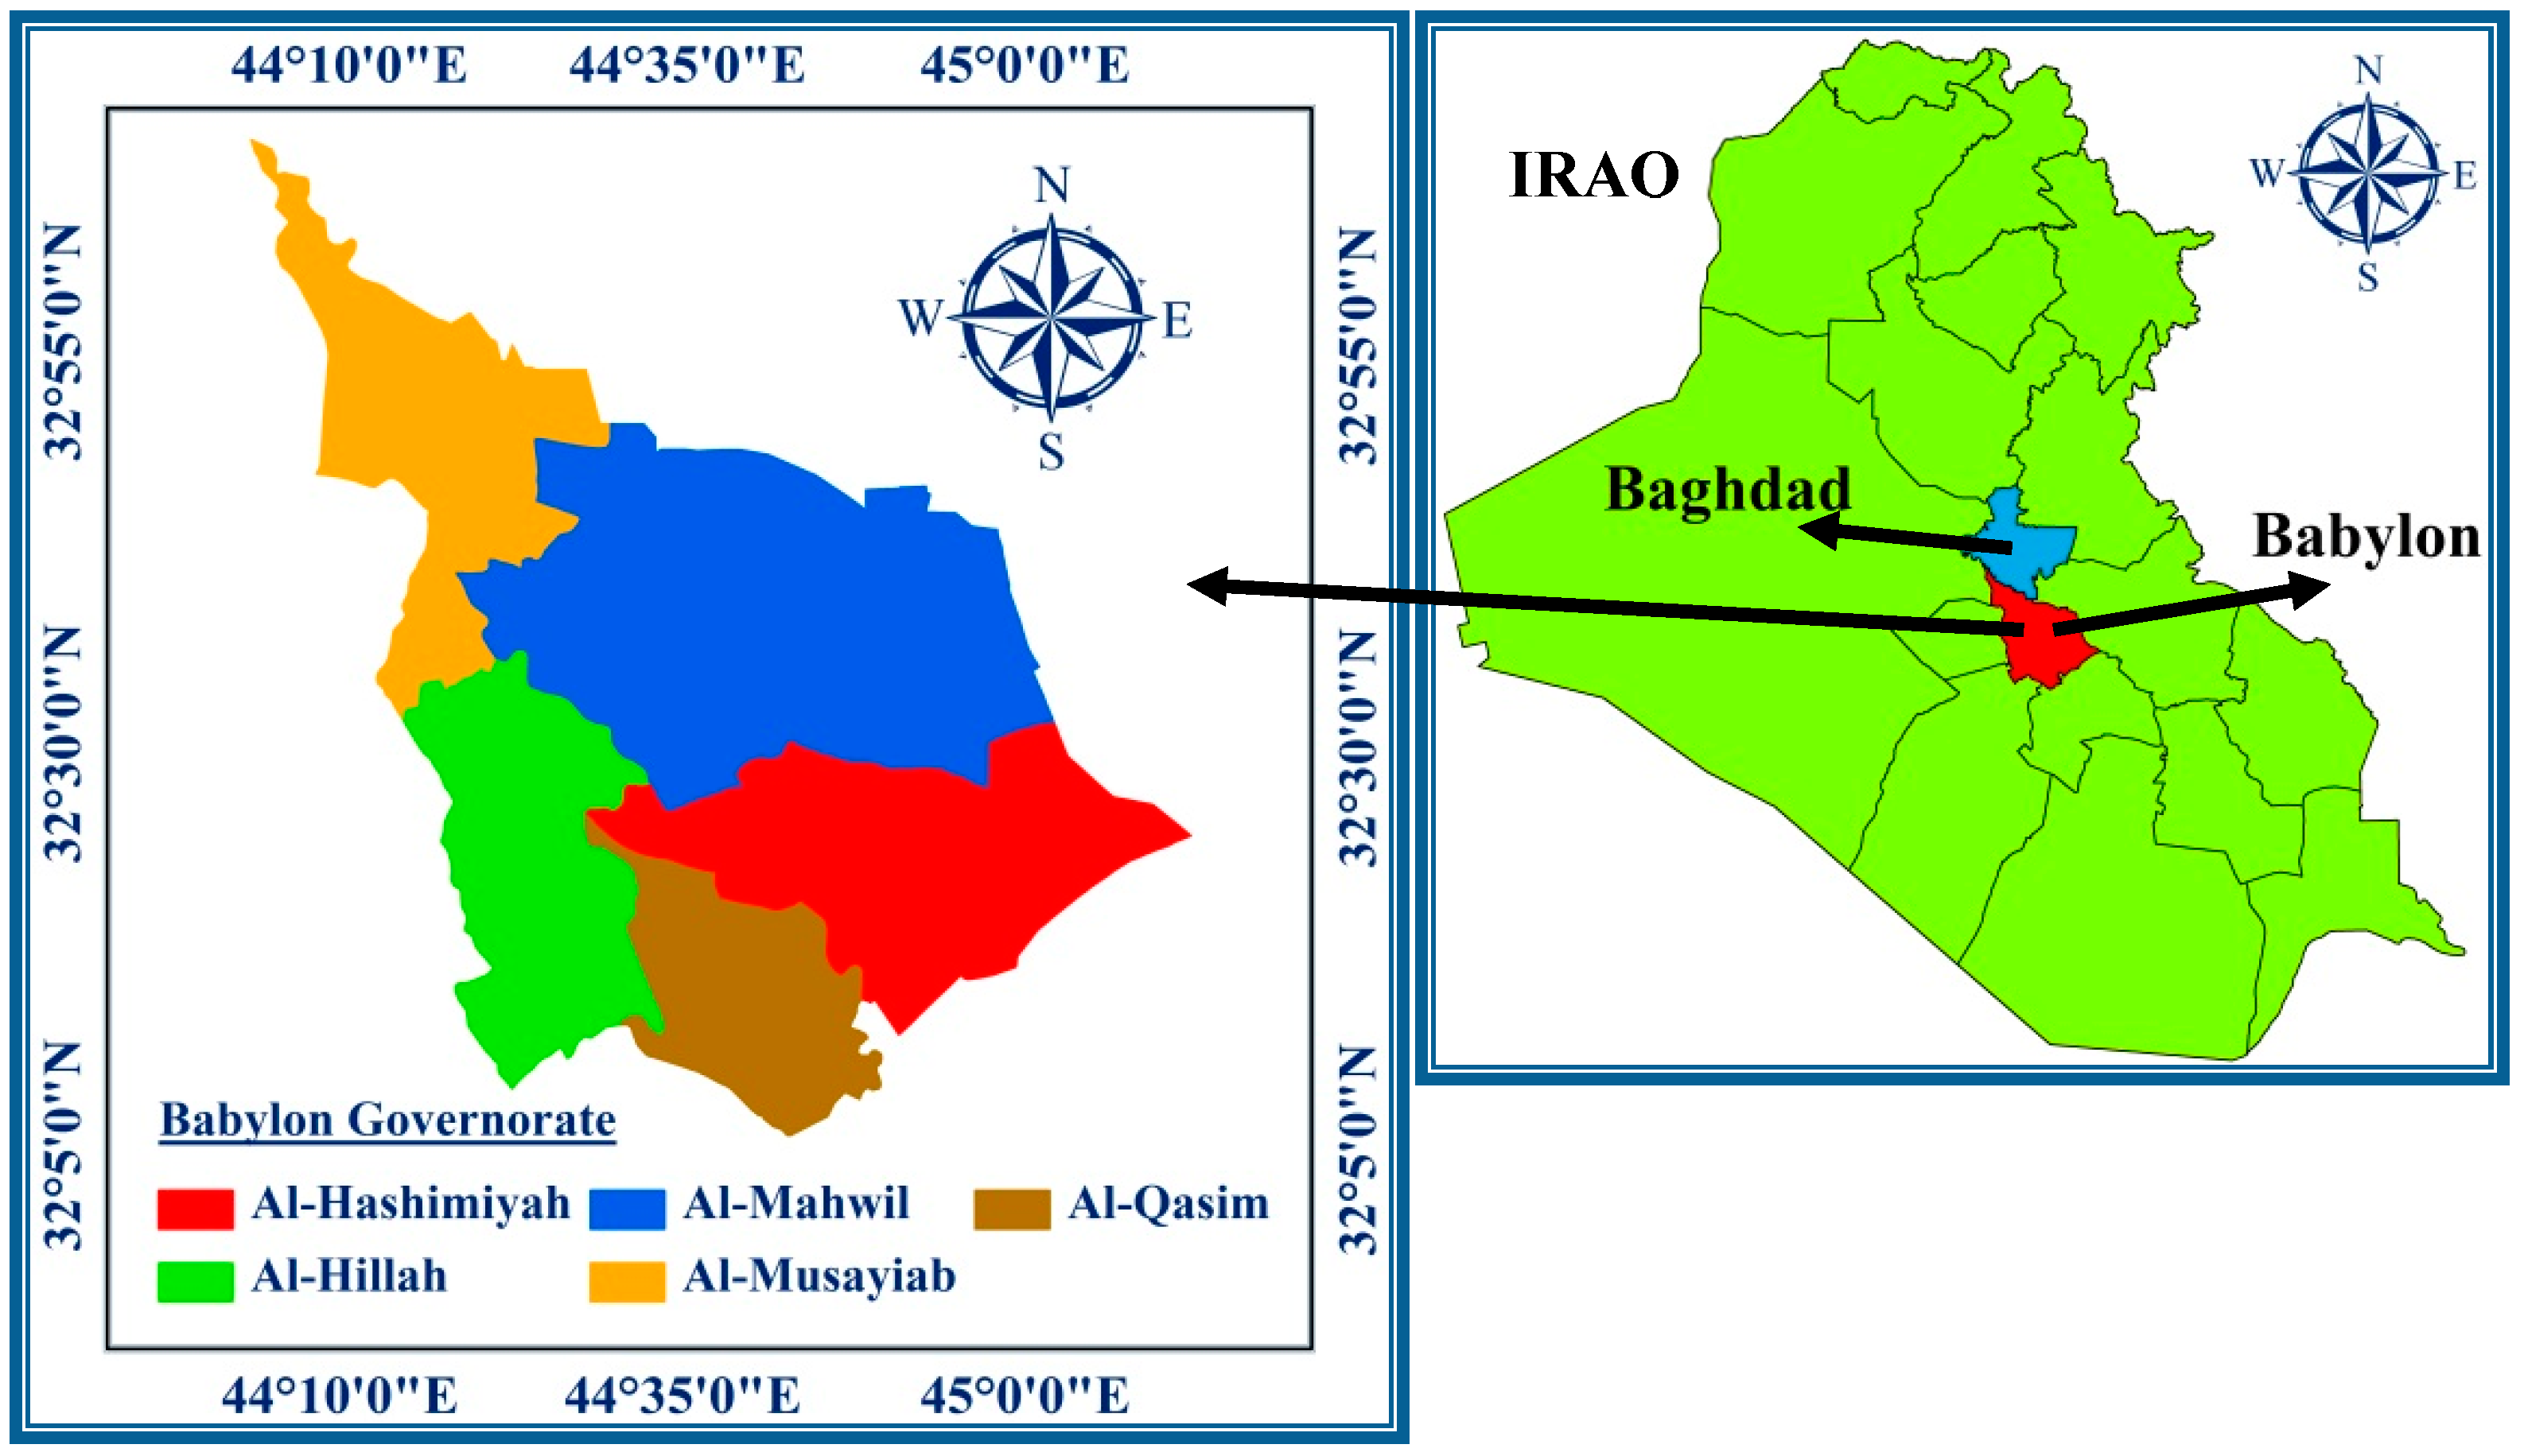
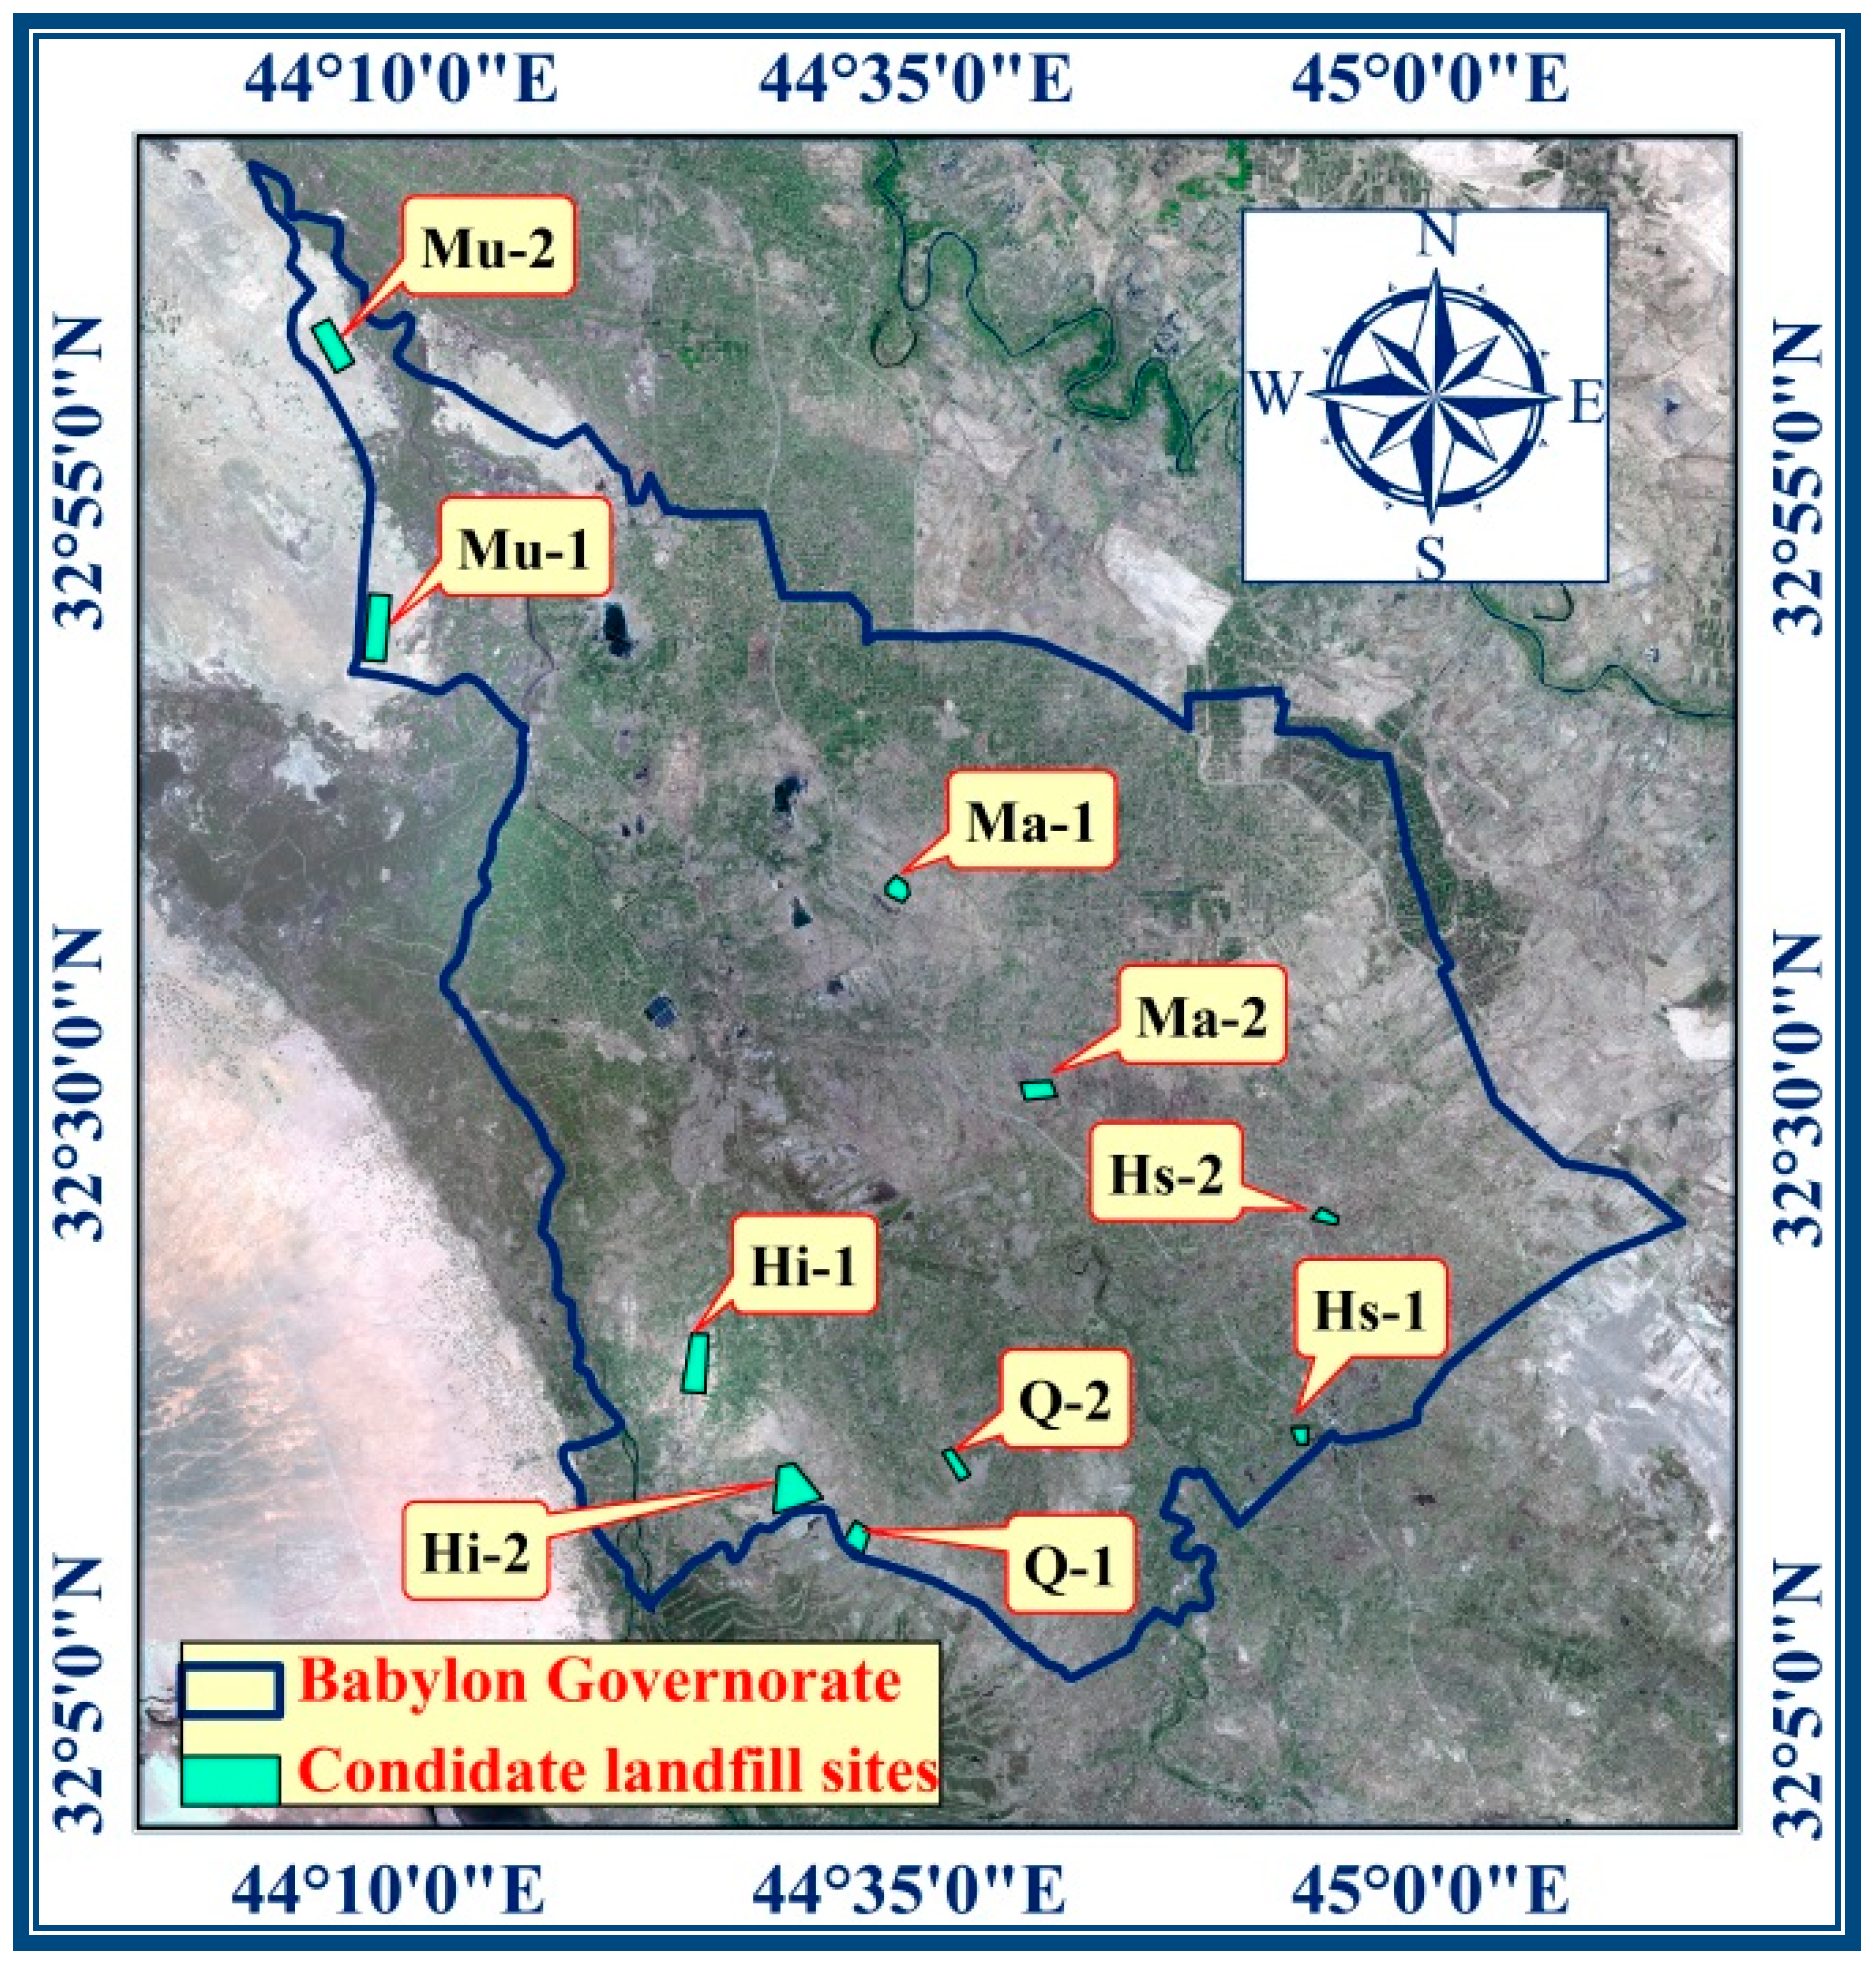
2.1. Study Area
2.2. Climate
2.3. Selecting and Assessing the Candidate Sites for Landfill
3. Methodology
3.1. The HELP 3.95D Model
3.2. The Required Input Data for the Model
3.2.1. Daily Weather Data of Study Area
3.2.2. Estimating Daily Runoff and Runoff Curve Number
3.2.3. Potential and Actual Evapotranspiration Date
- ❖
- In the study area, the depth of the evaporative zone is 50 cm, depending on the field tests.
- ❖
- The maximum index value of the leaf area (area/area) for the study area is (1), because the kind of vegetation in the selected sites was poor strands of grass [29].
- ❖
- The date for the start day of the growing season over the 12-year period in Babylon Governorate is 10 January, while the date for the last day of the growing season is 15 December, 350 days later [42].
- ❖
- ❖
- Normal average quarterly relative humidity. Each quarter consists of the average value of three months, where the four quarters of a year are (January to March), (April to June), (July to September) and (October to December) [29]. Therefore, the average values of relative humidity in Babylon Governorate are: for the first quarter (64.2%), the second quarter (39.03%), third quarter (34.24%), and fourth quarter (60.95%) [41].
3.2.4. Soil and Design Data
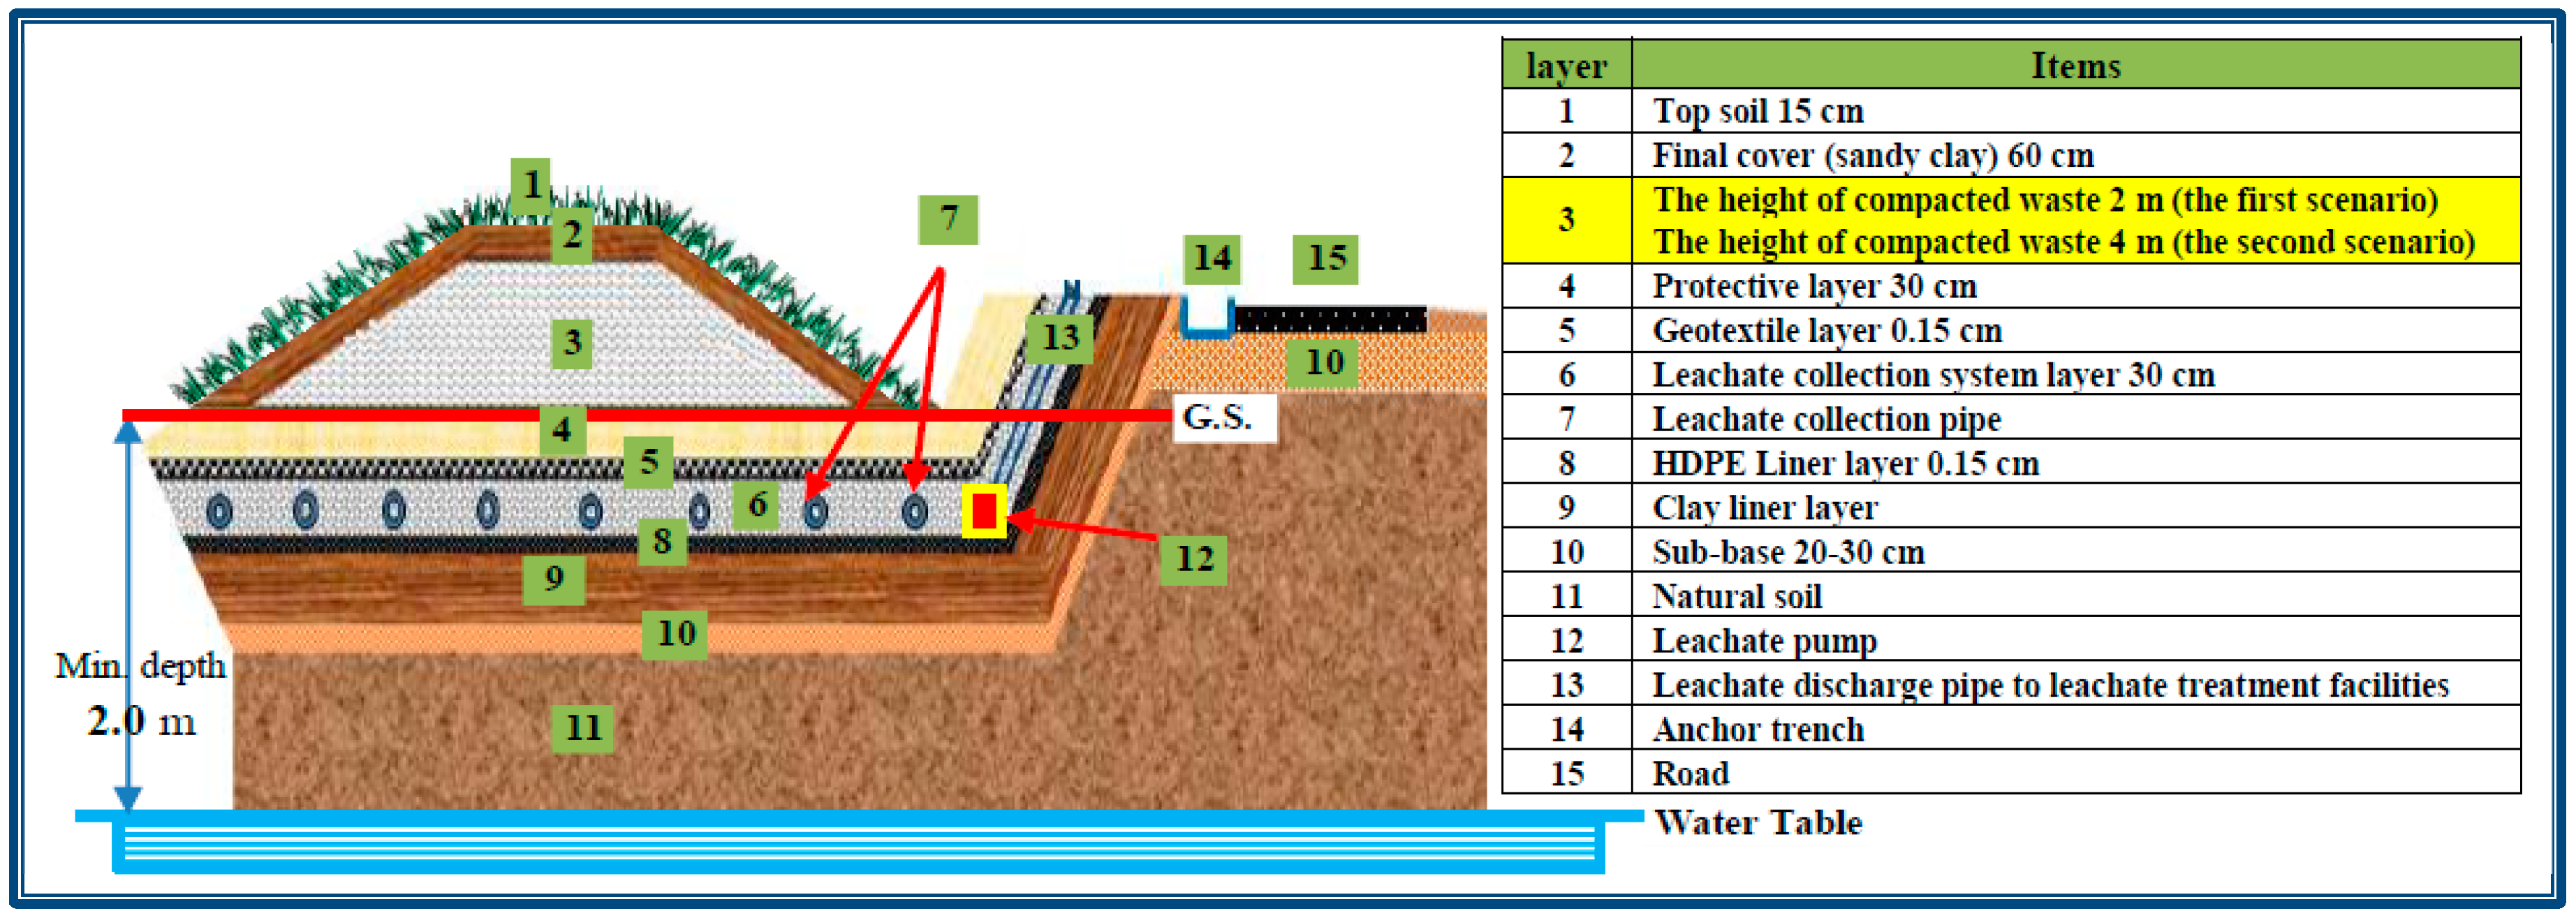
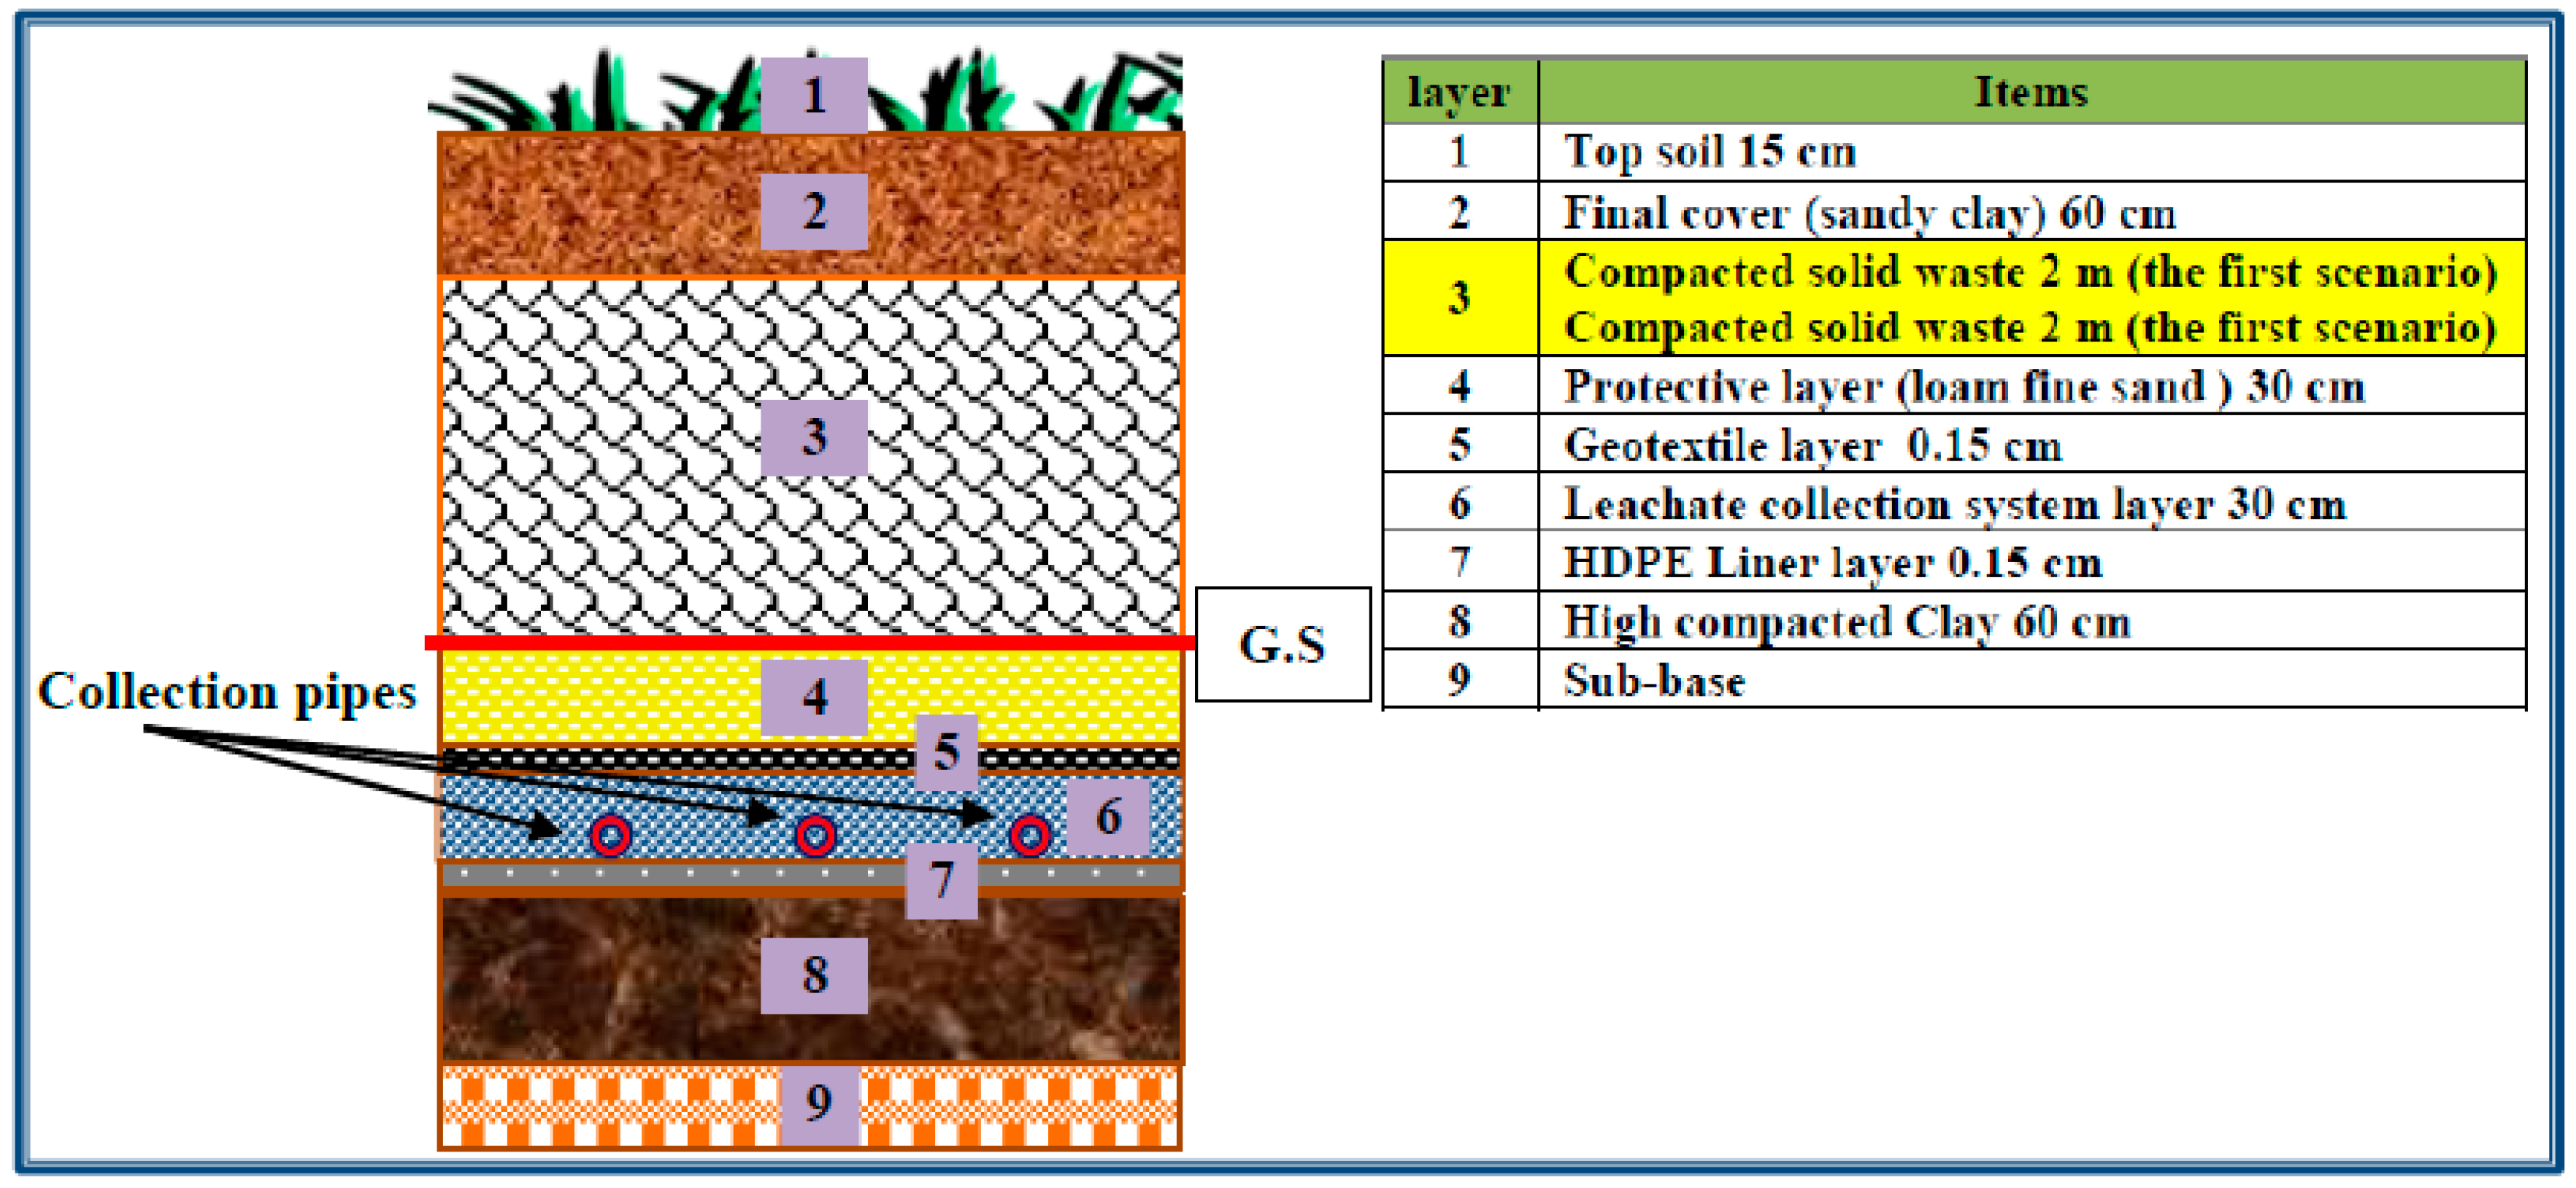
3.2.5. Suggested Soils Layers’ Data
- The volume of waste was calculated by dividing the quantity of waste (Qs) produced each year until the year 2030 by the waste density (450 kg m−3) at the waste disposal sites in Babylon Governorate and its Qadhaas [35].
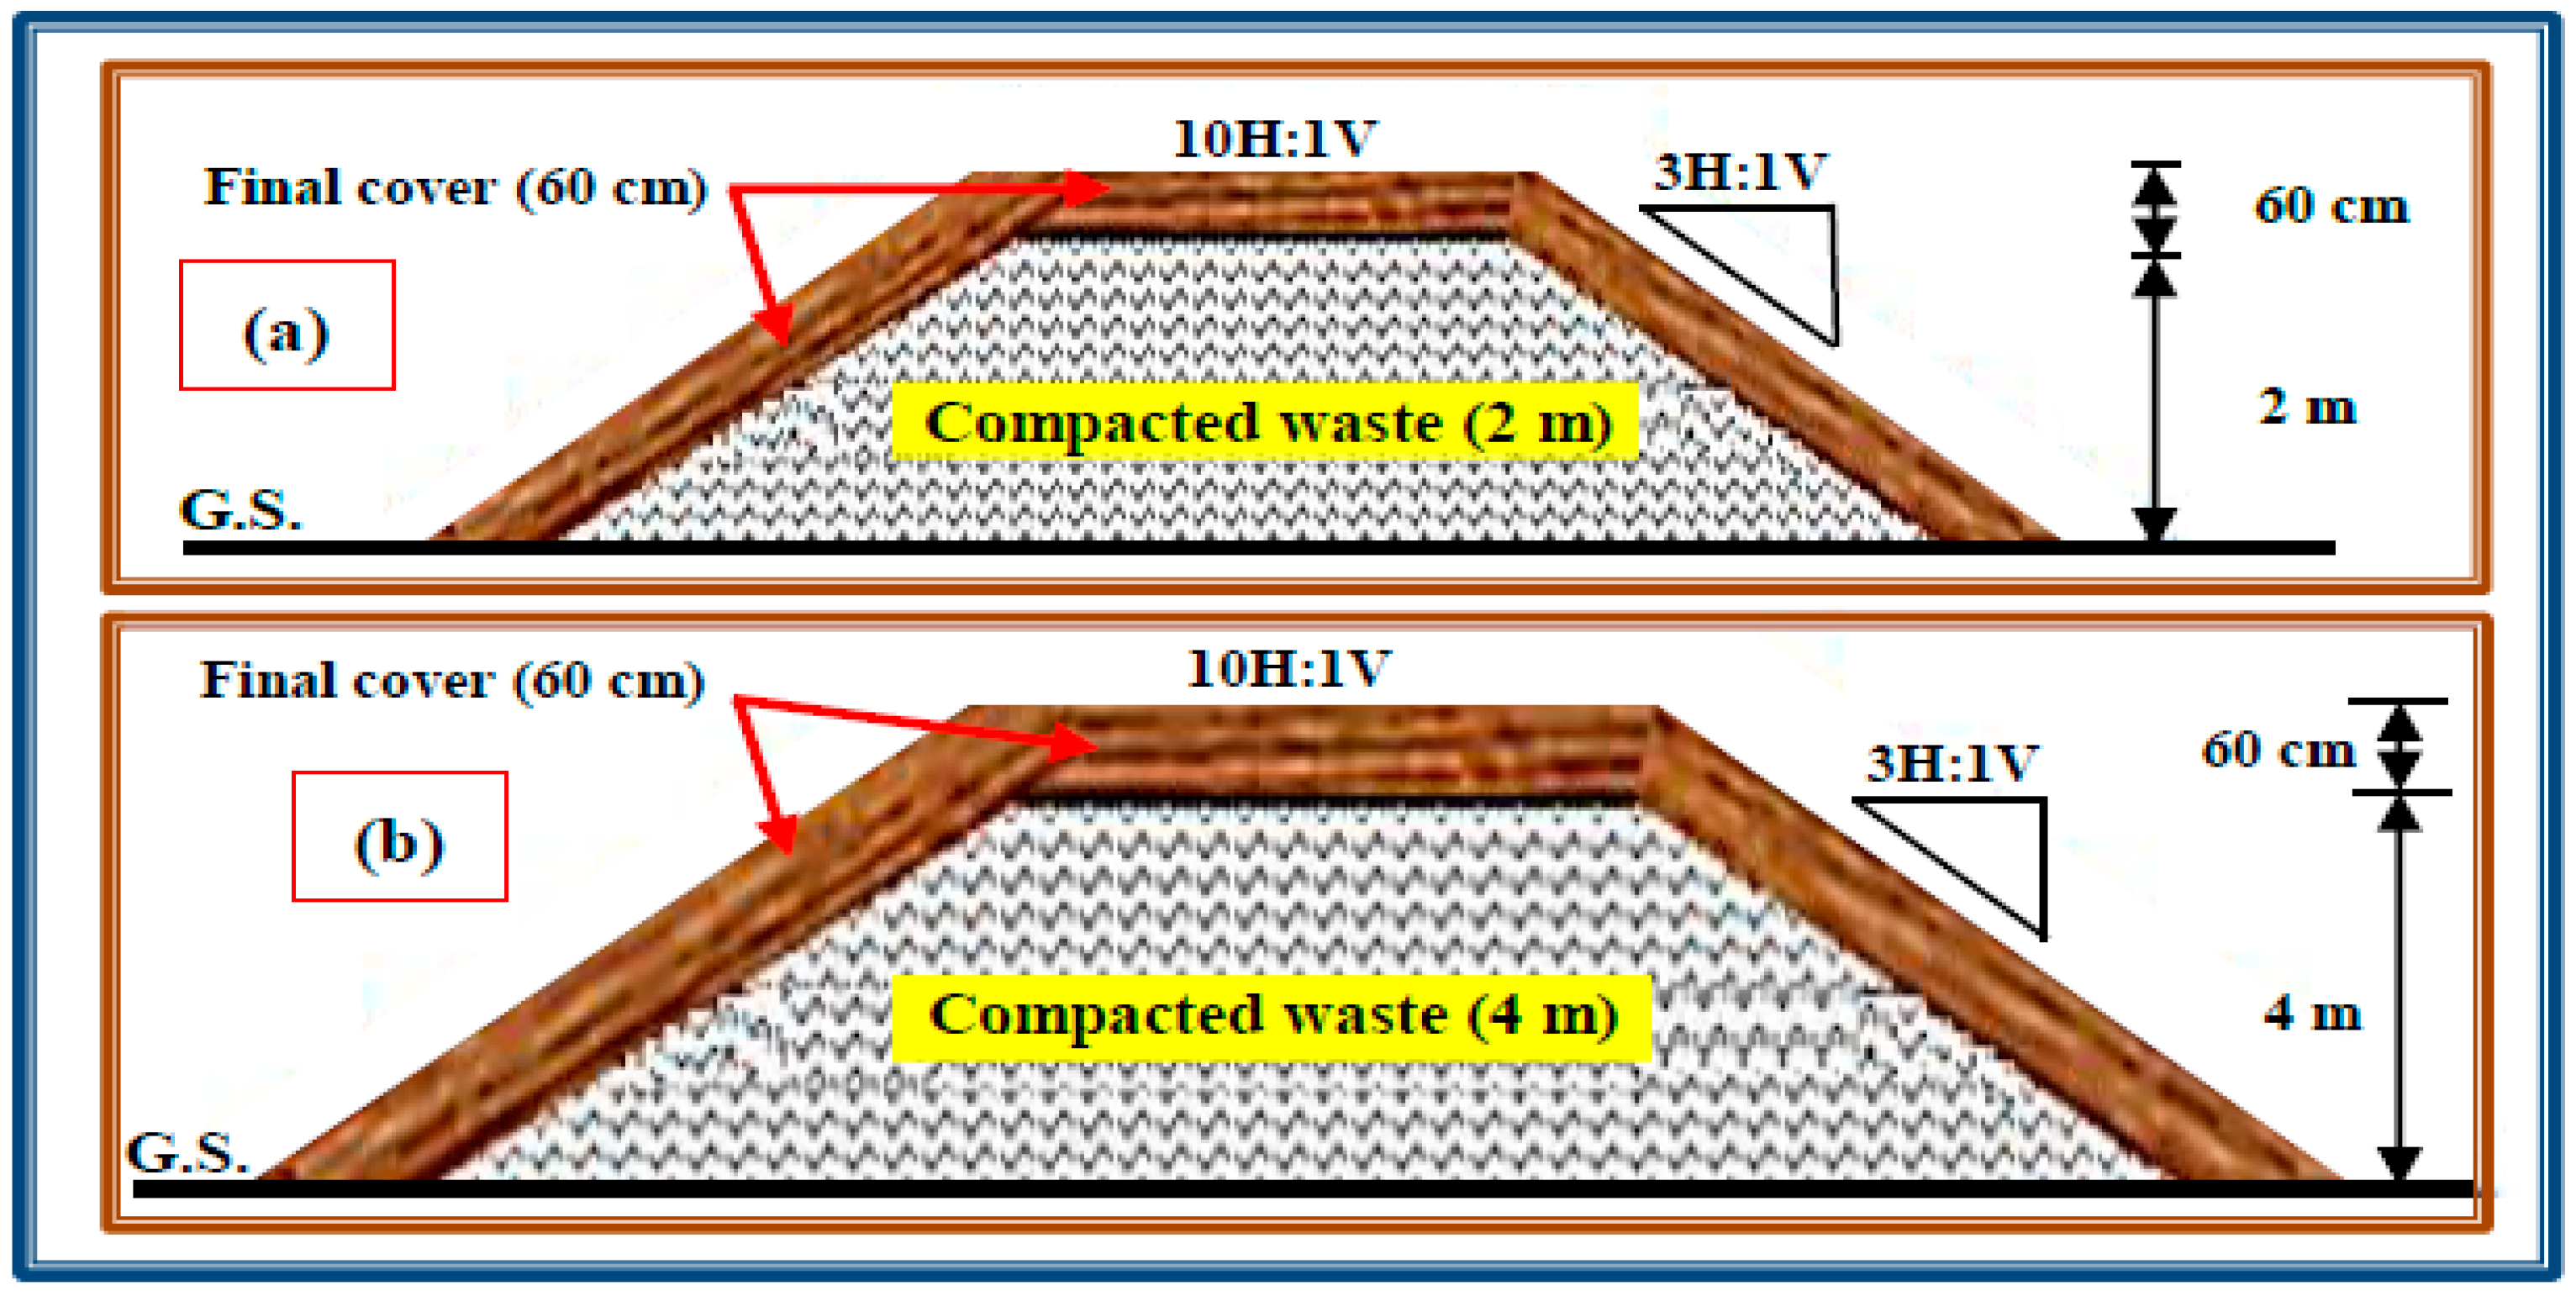
- The required areas of the candidate sites that emerged as a result of the previous studies was calculated by dividing by 2 m, which represents the height of municipal solid waste that will be placed on the surface since the groundwater depth in the study areas is shallow, and in order to reduce the cost of constructing a perimeter berm around the site.
- GIS and multi-criteria decision making methods were used to determine the best sites for landfill, and the location and dimension for these sites for design purposes was determined.
- ➢
- ➢
- ➢
- ➢
- The space between each lateral pipe is 2 m [54].
- ➢
- The maximum length of the drainage is 50 m [52].
- ➢
- ➢
- ➢
- The minimum lateral slope toward the direction of the main leachate collection pipes (transverse direction) should be at least 1% [25].
- ➢
- The vertical leachate collection pipes are installed in the landfill site, and the lower end of the vertical pipes are joined to the bottom (horizontal) of the leachate collection pipes so that they can operate as a gas vent [62].
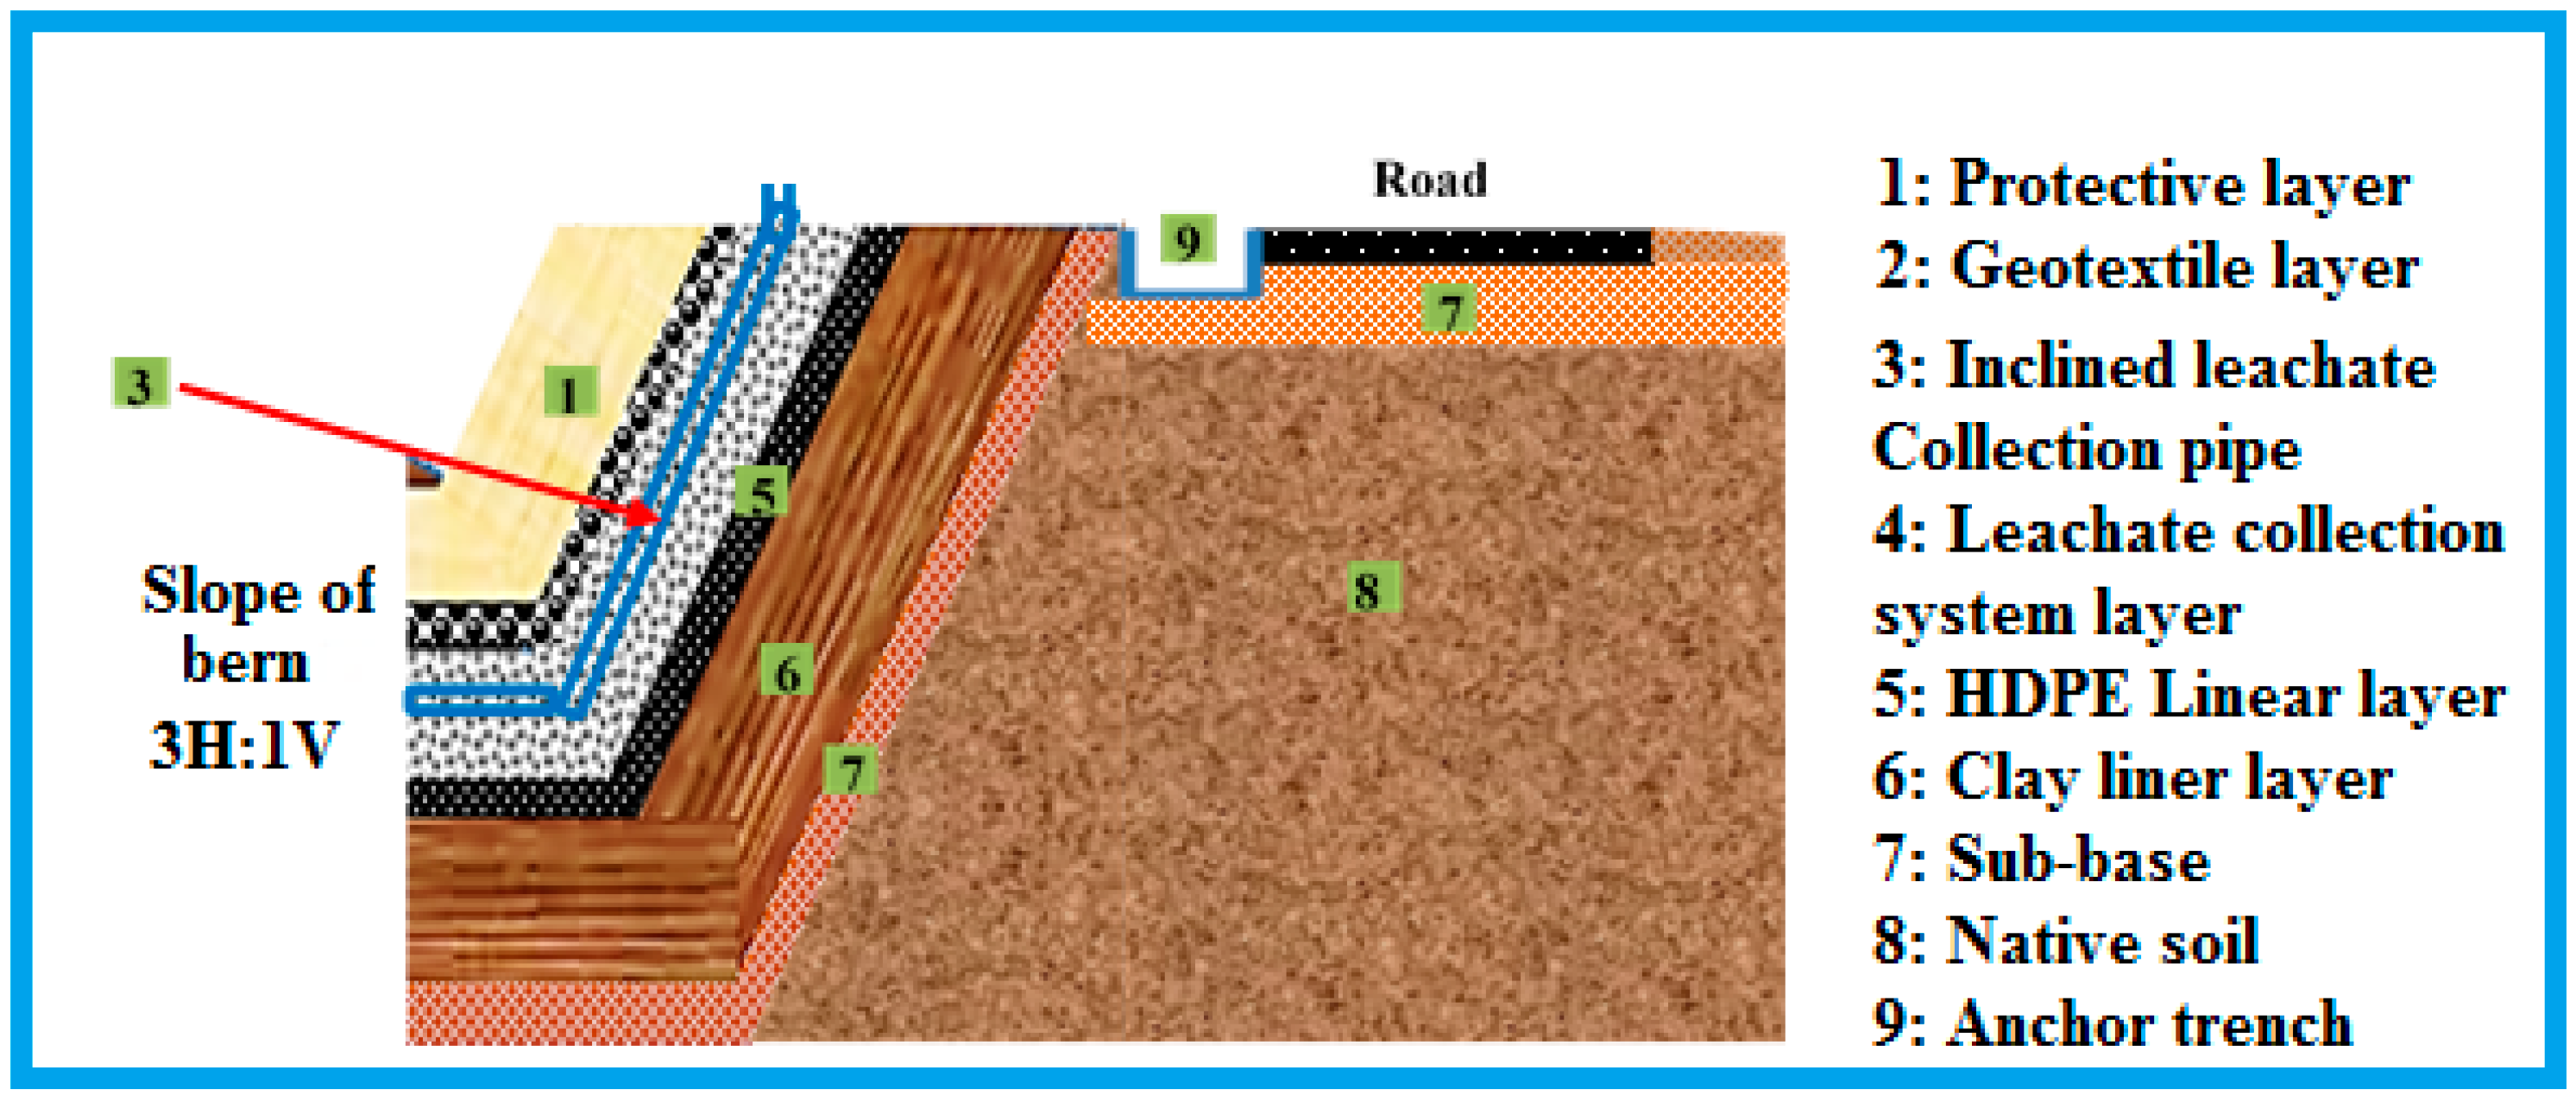
- ➢
- The inclined leachate collection pipes are distributed along the berm slope and used as a gas vent. These pipes are joined to the bottom of the leachate collection pipes [62].
- ➢
- ➢
- An operating pump should be used to remove and lift leachate from the pits to the required head [25].
- ➢
- The collected leachate should be removed and sent to a treatment facility [13].
3.2.6. Perimeter Berm
3.2.7. The Suggested Soil Layers that Entered into the HELP 3.95D Model
4. Results
4.1. General Design and Evaporative Zone Data (Valid for 12 Years)
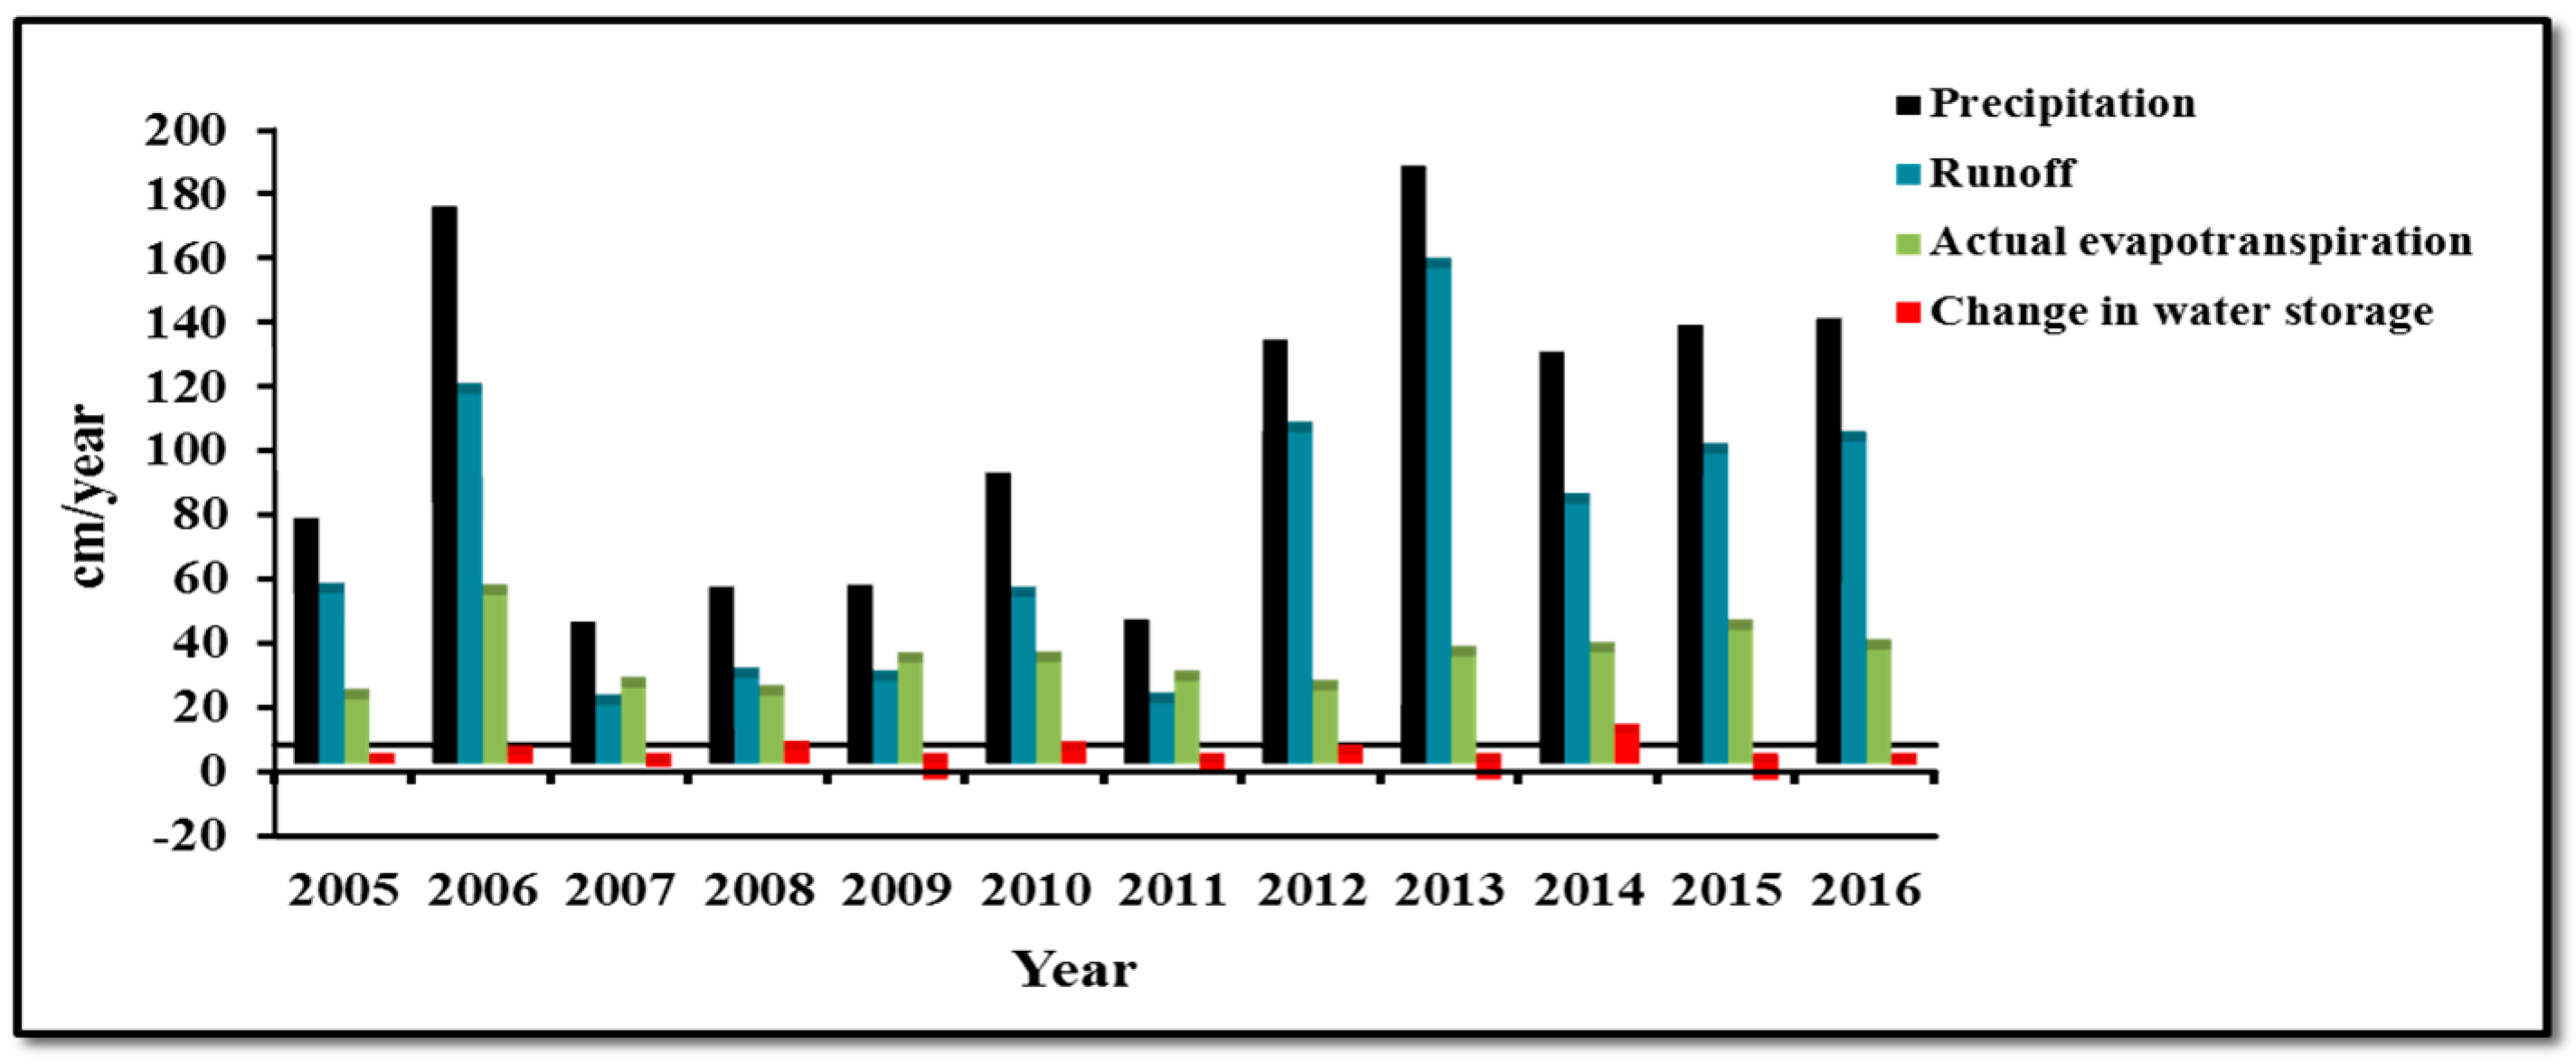
4.2. Annual Data from 2005 to 2016
- ❖
- The amount of collected water from lateral drainage layer (6) was zero.
- ❖
- The values of the average head of water on top of the geotextile and the HDPE layers (4 and 7) were equal to zero.
- ❖
- The values of water leakage through the geotextile and clay liner layers (4 and 8) were zero.
- ❖
- The value of the interception water in the first and final year for the years 2005–2016 was zero.
4.3. Peak Daily Values from 2005 to 2016
4.4. Average Monthly Values for the Years 2005–2016
- ❖
- The lateral drainage amount that collected water from layer (6) was zero.
- ❖
- The values of water percolation through the geotextile and clay liner layers (4) and (8) were equal to zero.
- ❖
- The values of the daily average head of water on top of layers (4) and (7) were zero.
4.5. Average Annual Values for the Years 2005–2016
4.6. Final Water Storage of Layers at the End of 2016
5. Conclusions
Acknowledgments
Author Contributions
Conflicts of Interest
References
- Scott, J.; Beydoun, D.; Amal, R.; Low, G.; Cattle, J. Landfill management, leachate generation, and leach testing of solid wastes in Australia and overseas. Crit. Rev. Environ. Sci. Technol. 2005, 35, 239–332. [Google Scholar] [CrossRef]
- Hart, J. Geophysical Investigation of the Clay Cap at a Closed Landfill in Southwestern Ontario, Canada. Master’s Thesis, Department of Earth and Environmental Sciences, University of Windsor, Windsor, ON, Canada, 2013; p. 81. [Google Scholar]
- Asefi, H.; Lim, S. A novel multi-dimensional modeling approach to integrated municipal solid waste management. J. Clean. Prod. 2017, 166, 1131–1143. [Google Scholar] [CrossRef]
- Aird, J. Challenges at MSW landfill sites: From daily cover to drainage. Erosion Control 2017, 24, 16–21. [Google Scholar]
- Ragazzi, M.; Catellani, R.; Rada, E.C.; Torretta, V.; Salazar-Valenzuela, X. Management of urban wastewater on one of the Galapagos Islands. Sustainability 2016, 8, 208. [Google Scholar] [CrossRef]
- Meegoda, J.N.; Hettiarachchi, H.; Hettiaratchi, P. Landfill design and operation. In Sustainable Solid Waste Management; American Society of Civil Engineers: Reston, VA, USA, 2016; pp. 577–604. [Google Scholar]
- Renou, S.; Givaudan, J.G.; Poulain, S.; Dirassouyan, F.; Moulin, P. Landfill leachate treatment: Review and opportunity. J. Hazard. Mater. 2008, 150, 468–493. [Google Scholar] [CrossRef] [PubMed]
- Ghiani, G.; Laganà, D.; Manni, E.; Musmanno, R.; Vigo, D. Operations research in solid waste management: A survey of strategic and tactical issues. Comput. Oper. Res. 2014, 44, 22–32. [Google Scholar] [CrossRef]
- Alslaibi, T.M.; Abustan, I.; Mogheir, Y.K.; Afifi, S. Quantification of leachate discharged to groundwater using the water balance method and the Hydrologic Evaluation of Landfill Performance (HELP) model. Waste Manag. Res. 2013, 31, 50–59. [Google Scholar] [CrossRef] [PubMed]
- Brockerhoff, M.P. An Urbanizing World; Population Reference Bureau (PRB): Washington, DC, USA, 2000; Volume 55, pp. 1–48. [Google Scholar]
- Proske, H.; Vlcko, J.; Rosenbaum, M.S.; Dorn, M.; Culshaw, M.; Marker, B. Special purpose mapping for waste disposal sites. Bull. Eng. Geol. Environ. 2005, 64, 1–54. [Google Scholar] [CrossRef]
- Moeinaddini, M.; Khorasani, N.; Danehkar, A.; Darvishsefat, A.A.; Zienalyan, M. Siting MSW Landfill Using Weighted Linear Combination and Analytical Hierarchy Process (AHP) Methodology in GIS Environment (Case Study: Karaj). Waste Manag. 2010, 30, 912–920. [Google Scholar] [CrossRef] [PubMed]
- Munawar, E.; Fellner, J. Guidelines for Design and Operation of Municipal Solid Waste Landfills in Tropical Climates; Technische Universität Wien: Vienna, Austria, 2013; p. 28. [Google Scholar]
- Joseph, K.; Nagendran, R.; Palanivelu, K.; Thanasekaran, K.; Visvanathan, C. Dumpsite Rehabilitation and Landfill Mining; Anna University: Chennai, India, 2004; p. 65. Available online: http://saahas.org/wp-content-saahas/uploads/2015/02/Landfills3.pdf (accessed on 5 October 2017).
- World Health Organization. Protecting Groundwater for Health: Managing the Quality of Drinking-Water Sources; World Health Organization: Geneva, Switzerland, 2006. [Google Scholar]
- Allen, A. Containment Landfills: The myth of sustainability. Eng. Geol. 2001, 60, 3–19. [Google Scholar] [CrossRef]
- Gray, D.A.; Mather, J.D.; Harrison, I.B. Review of groundwater pollution from waste disposal sites in England and Wales, with provisional guidelines for future site selection. Q. J. Eng. Geol. Hydrogeol. 1974, 7, 181–196. [Google Scholar] [CrossRef]
- Bauerle, M. Adapting the Hydrologic Evaluation of Landfill Performance (H.E.L.P.) Model to the Climatic and Soil Characteristics of Queensland. Master Thesis, School of Earth, Environmental and Biological Sciences, Science and Engineering Faculty, Queensland University of Technology, Brisbane, Australia, 2016; p. 217. [Google Scholar]
- O’Leary, P.; Walsh, P. Decision Maker’s Guide to Solid Waste Management; Solid and Hazardous Waste Education Center, University Of Wisconsin: Madison, WI, USA, 1995; Volume II, p. 372. [Google Scholar]
- Alslaibi, T.; Mogheir, Y.; Afifi, S. Analysis of landfill components in estimating the percolated leachate to groundwater using the HELP model. Water Sci. Technol. 2010, 62, 1727–1734. [Google Scholar] [CrossRef] [PubMed]
- Manitoba Sustainable Development, Leachate Management at a Waste Management Facility. Manitoba.ca, Sustainable Development, Environmental Compliance and Enforcement. 2016; p. 6. Available online: https://www.gov.mb.ca/sd/envprograms/swm/pdf/leachate_management_wdg.pdf (accessed on 5 October 2017).
- Inanç, B.; Çalh, B.; Saatçi, A. Characterization and anaerobic treatment of the sanitary landfill leachate in Istanbul. Water Sci. Technol. 2000, 41, 223–230. [Google Scholar] [PubMed]
- Li, R. Management of Landfill Leachate. Master Thesis, TAMK University of Applied Sciences, Tampere, Finland, 2009; p. 45. [Google Scholar]
- Malina, J.F.; Pohland, F.G. Design of anaerobic processes for the treatment of industrial and municipal wastes. Water Qual. Manag. 1996, 7, 169–175. [Google Scholar]
- Ireland Environmental Protection Agency (Ireland EPA). Landfill Manuals Landfill Site Design; Environmental Protection Agency: Limerick, Ireland, 2000; p. 154.
- Hughes, K.; Christy, A.; Heimlich, J. Landfill Types and Liner Systems; Ohio State University Extension Fact Sheet CDFS-138-05; The Ohio State University: Columbus, OH, USA, 2008; p. 4. [Google Scholar]
- Iraqi Ministry of Water Resources. General Commission for Groundwater; Internal Reports; Iraqi Ministry of Water Resources: Baghdad, Iraq, 2015.
- Berger, K.U. On the current state of the Hydrologic Evaluation of Landfill Performance (HELP) model. Waste Manag. 2015, 38, 201–209. [Google Scholar] [CrossRef] [PubMed]
- Berger, K.U.; Schroeder, P.R. The Hydrologic Evaluation of Landfill Performance (HELP) Model, User’s Guide for HELP-D (Version 3.95D), 6th revised edition for version HELP 3.95D; Institute of Soil Science, University of Hamburg: Hamburg, Germany, 2013; p. 74. [Google Scholar]
- Schroeder, P.R.; Dozier, T.S.; Zappi, P.A.; McEnroe, B.M.; Sjostrom, J.W.; Peyton, R.L. The Hydrologic Evaluation of Landfill Performance (HELP) Model; Engineering Documentation for Version 3; U.S. Environmental Protection Agency Office of Research and Development: Washington, DC, USA, 1994; p. 126.
- Al-Taie, L. Performance of Clay Liners in Near-Surface Repositories in Desert Climate. Ph.D. Thesis, Soil Mechanics and Foundation Engineering, Lulea University of Technology, Lulea, Sweden, 2014. [Google Scholar]
- Frikha, Y.; Fellner, J.; Zairi, M. Leachate generation from landfill in a semi-arid climate: A qualitative and quantitative study from Sousse, Tunisia. Waste Manag. Res. 2017, 35, 940–948. [Google Scholar] [CrossRef] [PubMed]
- Iraqi Ministry of Municipalities and Public Works. Structural Plan of Babylon Governorate; The Directorate General of Urban Planning, Information Analysis Report (Revised); Stage 2; Iraqi Ministry of Municipalities and Public Works: Baghdad, Iraq, 2009; p. 223.
- Iraqi Ministry of Planning. Records of Directorate of Census Babylon; Internal Reports; Iraqi Ministry of Planning: Baghdad, Iraq, 2016.
- Chabuk, A.; Al-Ansari, N.; Hussain, H.M.; Knutsson, S.; Pusch, R. Present status of solid waste management at Babylon Governorate, Iraq. Engineering 2015, 7, 408–423. [Google Scholar] [CrossRef]
- Iraqi Ministry of Municipalities and Public Works. Records of Directorate of Babylon Municipalities; Internal Reports; Iraqi Ministry of Municipalities and Public Works: Babylon, Iraq, 2013.
- Iraqi Ministry of Municipalities and Public Works. Babylon Plant for Recycling and Compressing Waste, Records of Directorate of Al-Hillah Municipality, Babylon; Internal Reports; Iraqi Ministry of Municipalities and Public Works: Baghdad, Iraq, 2016.
- Alnajjar, A.Y. Solid Waste Management Scenario in Iraq, Middle East, Solid Waste Management, EcoNENA. 2016. Available online: http://www.ecomena.org/tag/solid-waste-management-in-iraq (accessed on 5 October 2017).
- Iraqi Ministry of Municipalities and Public Works. Records of Directorate of Babylon Municipalities; Internal Reports; Iraqi Ministry of Municipalities and Public Works: Babylon, Iraq, 2015.
- Al Khalidy, K.S.; Chabuk, A.J.; Kadhim, M.M. Measurement of Lead Pollution in the Air of Babylon Governorate, Iraq during Year 2010. World Acad. Sci. Eng. Technol. 2012, 6, 830–833. [Google Scholar]
- Consulting Engineering Bureau College of Engineering. Hydrological Study of Ancient Babylon Site; Final Report; Baghdad University: Baghdad, Iraq, 2012. [Google Scholar]
- Iraqi Ministry of Transportation Constitutions. Iraqi Meteorological Organization & Seismology; Internal Reports; Iraqi Ministry of Transportation Constitutions: Baghdad, Iraq, 2017. [Google Scholar]
- Al-Ansari, N.A.; Abdellatif, M.; Ali, S.; Knutsson, S. Long Term Effect of Climate Change on Rainfall in Northwest Iraq. Cent. Eur. J. Eng. 2014, 4, 250–263. [Google Scholar] [CrossRef]
- Osman, Y.; Abdellatif, M.; Al-Ansari, N.A.; Knutsson, S.; Aljawad, S.B. Climate Change and Future Precipitation in Arid Environment of Middle East: Case study of Iraq. J. Environ. Hydrol. 2017, 25, 1–18. [Google Scholar]
- Chabuk, A.; Al-Ansari, N.; Hussain, H.M.; Kamaleddin, S.; Knutsson, S.; Pusch, R.; Laue, J. Combining GIS Applications and Method of Multi-Criteria Decision-Making (AHP) for Landfill Siting in Al-Hashimiyah Qadhaa, Babylon, Iraq. Sustainability 2017, 9, 1932. [Google Scholar] [CrossRef]
- Iraqi Ministry of Municipalities and Public Works. Directorate of Sewage Babylon; Internal Reports; Iraqi Ministry of Municipalities and Public Works: Baghdad, Iraq, 2013.
- Jassim, S.Z.; Goff, J.C. Geology of Iraq; Dolin, Prague and Moravain Museum: Brno, Czech Republic, 2006; p. 356. [Google Scholar]
- Iraqi Ministry of Housing & Construction. National Center for Construction Laboratories and Research; Internal Report; Iraqi Ministry of Housing & Construction: Babylon, Iraq, 2016.
- Chabuk, A.; Al-Ansari, N.; Hussain, H.M.; Kamaleddin, S.; Knutsson, S.; Pusch, R.; Laue, J. Soil Characteristics in Selected Landfill Sites in the Babylon Governorate, Iraq. J. Civ. Eng. Archit. 2017, 11, 348–363. [Google Scholar] [CrossRef]
- Oni, O.A. An Investigation into the Impact of Sequential Filling on Properties of Emplaced Refuse Lifts and Moisture Stored in a Municipal Solid Waste Landfill. Ph.D. Thesis, Department of Civil and Environmental Engineering, University of Southampton, Southampton, UK, 2000; p. 226. [Google Scholar]
- Chabuk, A.; Al-Ansari, N.; Hussain, H.M.; Kamaleddin, S.; Knutsson, S.; Pusch, R.; Laue, J. Landfills Site Selection in Babylon, Iraq. J. Earth Sci. Geotech. Eng. 2017, 7, 1–15. [Google Scholar]
- British Columbia. Landfill Criteria for Municipal Solid Waste, 2nd ed.; British Columbia Ministry of Environment: Fort St. John, BC, Canada, 2016; p. 76.
- Wihan Visser Jan Palm Consulting Engineers; Thorsten Aab WSP Group Africa. Guidelines to the Design of a Landfill Facility; Landfill Interest Group: Seminar Session 2: Overview of Landfill Facility Design and Associated Infrastructure; IWMSA: Johannesburg, South Africa, 2014. [Google Scholar]
- Bagchi, A. Design of Landfills and Integrated Solid Waste Management, 3rd ed.; John Wiley & Sons: Hoboken, NJ, USA, 2004; p. 696. [Google Scholar]
- Swedish Environmental Protection Agency. Landfilling of Waste, with Guidelines to the Ordinance (2001:512) on the Landfill of Waste and to Chapter 15, 34 § of the Environmental Code (1998:808); Swedish Environmental Protection Agency: Stockholm, Sweden, 2004. [Google Scholar]
- Rowe, R.K.; Sangam, H.P. Durability of HDPE geomembranes. Geotext. Geomembr. 2002, 20, 77–95. [Google Scholar] [CrossRef]
- Joyal, C. New Solid Waste Facility–Preliminary Design Report; Final Report; Department of Public Works and Engineering, Dillon Consulting Limited: Yellowknife, NT, Canada, 2006; p. 77. [Google Scholar]
- SCIP Engineering Group. Conceptual Design of a New Waste Disposal Facility for Lesedi Local Municipality, Heidelberg; Report No. (10612452-12628-7); Golder Associates: Mississauga, ON, USA, 2014; p. 45. [Google Scholar]
- Special Inspector General for Iraq Reconstructive. Baghdad Municipal Solid Waste, Memorandum for Commanding General, Multi-National Forces—Iraq; Report on Project Assessment of the Baghdad Municipal Solid Waste Landfill; Baghdad Municipal Solid Waste Landfill: Baghdad, Iraq, 2006; p. 33. [Google Scholar]
- New South Wales Environment Protection Authority. Environmental Guidelines Solid Waste Landfills, 2nd ed.; New South Wales Environment Protection Authority: Sydney, Australia, 2016; p. 95.
- Abu-Rizaiza, A.S.; Abdul Aziz, H. The Proposed Design and Tendering for the New Phase of Landfill at Southern Makkah Disposal Site: Phase 1; Design Report; Department of Environmental Sciences, King Abdulaziz University: Jeddah, Saudi Arabia; Research Cluster on Waste Management, School of Civil Engineering, Universiti Sains Malaysia: Gelugor, Malaysia, 2011; p. 80. [Google Scholar]
- Japan International Coorperation Agency. The Study on the Safe Closure and Rehabilitation of Landfill Sites in Malaysia. In Technical Guideline for Sanitary Landfill, Design and Operation, Revised Draft; Final Report; Japan International Coorperation Agency: Tokyo, Japan, 2004; Volume 5, p. 126. [Google Scholar]
- Jain, P.; Townsend, T.G.; Tolaymat, T.M. Steady-state design of vertical wells for liquids addition at bioreactor landfills. Waste Manag. 2010, 30, 2022–2029. [Google Scholar] [CrossRef] [PubMed]
- Townsend, T.G. Leachate Recycle at Solid Waste Landfills Using Horizontal Injection. Ph.D. Thesis, University of Florida, Gainesville, FL, USA, 1995. [Google Scholar]
- Jain, P.; Powell, J.; Townsend, T.G.; Reinhart, D.R. Estimating the hydraulic conductivity of landfilled municipal solid waste using the borehole permeameter test. J. Environ. Eng. 2006, 132, 645–652. [Google Scholar] [CrossRef]
- Townsend, T.G.; Miller, W.L.; Earle, J.F.K. Leachate-recycle infiltration ponds. J. Environ. Eng. 1995, 121, 465–471. [Google Scholar] [CrossRef]
- Xu, Q.; Kim, H.; Jain, P.; Townsend, T.G. Hydrologic evaluation of landfill performance (HELP) modeling in bioreactor landfill design and permitting. J. Mater. Cycles Waste Manag. 2012, 14, 38–46. [Google Scholar] [CrossRef]
- The World Bank. Guidance Fact Sheet: Landfill Design. p. 6. Available online: http://siteresources.worldbank.org/INTCARBONFINANCE/Resources/MSW_SCS_FactSheet_Landfill_Design_Final.pdf (accessed on 8 August 2017).
- Soil Water Content. Chapter 3. Available online: http://www.cfr.washington.edu/Classes.esrm.410/Moisture.htm (accessed on 10 July 2017).
- McEnroe, B.M. Maximum Saturated Depth over Landfill Liner. University of Kansas ASCE. J. Environ. Eng. 1993, 119, 262–270. [Google Scholar] [CrossRef]


| No. | Layers | Classification | Total Porosity (vol./vol.) | Field Capacity (vol./vol.) | Wilting Point (vol./vol.) | Hydraulic Conductivity (cm/sec) | Thick (m) | GW | |
|---|---|---|---|---|---|---|---|---|---|
| USDA | USCS | ||||||||
| Al-Hillah City–Al-Hillah Qadhaa (Hi-1) | |||||||||
| 1 | fill material | SiC | CH | 0.479 | 0.371 | 0.251 | 2.5 × 10⁻⁵ | 0.5 | 2 |
| 2 | silty clay + gypsum | SiC | CH | 0.479 | 0.371 | 0.251 | 2.5 × 10⁻⁵ | 2 | |
| 3 | clayey sandy silt | CL | CL | 0.464 | 0.310 | 0.187 | 6.4 × 10⁻⁵ | 0.5 | |
| 4 | silty clay | SiC | CH | 0.479 | 0.371 | 0.251 | 2.5 × 10⁻⁵ | 6 | |
| 5 | silty sand | LS | SM | 0.437 | 0.105 | 0.047 | 1.7 × 10⁻³ | 1 | |
| Al-Kifil City–Al-Hillah Qadhaa & Al-Talyaah city–Al-Qasim Qadhaa (Hi-2 & Q-1) | |||||||||
| 1 | sandy silty clay | SiC | CH | 0.479 | 0.371 | 0.251 | 2.5 × 10⁻⁵ | 7.5 | 4 |
| 2 | clayey silty sand | SL | SM | 0.453 | 0.190 | 0.085 | 7.2 × 10⁻⁴ | 0.5 | |
| 3 | silty clayey sand | LS | SM | 0.447 | 0.118 | 0.065 | 1.4 × 10⁻³ | 2.5 | |
| Al-Qasim City–Al-Qasim Qadhaa (Q-2) | |||||||||
| 1 | fill material | SiC | CH | 0.479 | 0.371 | 0.251 | 2.5 × 10⁻⁵ | 1 | 2.5 |
| 2 | silty clay | SiC | CH | 0.479 | 0.371 | 0.251 | 2.5 × 10⁻⁵ | 0.5 | |
| 3 | clayey silty sand | SL | SM | 0.453 | 0.190 | 0.085 | 7.2 × 10⁻⁴ | 0.5 | |
| 4 | sandy silty clay & silty clay | SiC | CH | 0.479 | 0.371 | 0.251 | 2.5 × 10⁻⁵ | 8 | |
| Al-Imam City–Al-Mahawil Qadhaa (Ma-1) | |||||||||
| 1 | fill material | L | ML | 0.419 | 0.307 | 0.180 | 1.9 × 10⁻³ | 0.5 | 2.7 |
| 2 | clay | C | CH | 0.378 | 0.371 | 0.265 | 1.7 × 10⁻⁵ | 9 | |
| 3 | sandy clayey silt | SiCL | SC | 0.471 | 0.342 | 0.210 | 4.2 × 10⁻⁵ | 0.5 | |
| Al-Neel City–Al-Mahawil Qadhaa (Ma-2) | |||||||||
| 1 | silty clay + sandy silty clay | SiC | CH | 0.479 | 0.371 | 0.251 | 2.5 × 10⁻⁵ | 10 | 2.1 |
| SiC | CH | 0.479 | 0.371 | 0.251 | 2.5 × 10⁻⁵ | ||||
| Al-Medhatyah City-Al-Hashimiyah Qadhaa (Hs-2) | |||||||||
| 1 | fill material | SC | SC | 0.430 | 0.321 | 0.221 | 3.3 × 10⁻⁵ | 1.2 | 3.8 |
| 2 | sandy silty clay | SiC | CH | 0.479 | 0.371 | 0.251 | 2.5 × 10⁻⁵ | 0.5 | |
| 3 | sandy clayey silt | SiCL | SC | 0.471 | 0.342 | 0.210 | 4.2 × 10⁻⁵ | 6.3 | |
| 4 | sandy silty clay | SiC | CH | 0.479 | 0.371 | 0.251 | 2.5 × 10⁻⁵ | 2 | |
| Al-Shomaly City–Al-Hashimiyah Qadhaa (Hs-1) | |||||||||
| 1 | fill material | SiL | ML | 0.501 | 0.284 | 0.135 | 1.9 × 10⁻⁴ | 0.7 | 4 |
| 2 | silty clay | SiC | CH | 0.479 | 0.371 | 0.251 | 2.5 × 10⁻⁵ | 6 | |
| 3 | sandy clayey silt | SiCL | SC | 0.471 | 0.342 | 0.210 | 4.2 × 10⁻⁵ | 1 | |
| 4 | silty clayey sand | LS | SM | 0.447 | 0.118 | 0.065 | 1.4 × 10⁻³ | 1.3 | |
| 5 | clay | C | CH | 0.378 | 0.371 | 0.265 | 1.7 × 10⁻⁵ | 1 | |
| Jurf Al-Sakhar City–Al-Musayiab Qadhaa (Mu-1 & Mu-2) | |||||||||
| 1 | silty sand | SL | SM | 0.453 | 0.190 | 0.085 | 7.2 × 10⁻⁴ | 2 | 10 |
| 2 | sandy silty clay | SiC | CH | 0.479 | 0.371 | 0.251 | 2.5 × 10⁻⁵ | 7 | |
| 3 | dense silty sand | LS | SM | 0.437 | 0.105 | 0.047 | 1.7 × 10⁻³ | 1 | |
| Parameters | 2005 | 2006 | 2007 | 2008 | 2009 | 2010 | 2011 | 2012 | 2013 | 2014 | 2015 | 2016 |
|---|---|---|---|---|---|---|---|---|---|---|---|---|
| Precipitation mm (daily depth) | 73.2 | 170.3 | 41 | 51.8 | 52.4 | 87.3 | 41.7 | 128.8 | 182.9 | 125 | 133.4 | 135.4 |
| Temperature °C (daily mean) | 23.1 | 23.5 | 23.5 | 23.6 | 23.9 | 23.6 | 23.2 | 24.1 | 23.3 | 24.2 | 24.6 | 24.5 |
| Solar radiation MJ/m2 (daily sum) | 5630 | 5638 | 5636 | 5673 | 5643 | 5628 | 5628 | 5702 | 5647 | 5639 | 5736 | 5729 |
| Qadhaa | Requited Area (km2) | Area of Candidate Sites | Location | Available Area for Design (km2) | |
|---|---|---|---|---|---|
| Site Symbol | Area (km2) | ||||
| Al-Hillah | 4.778 | Hi-1 | 4.45 × 1.52 | Latitude 32°18′45″N | 3.4 × 1.5 |
| (6.768) | Longitude 44°24′40″E | (5.1) | |||
| Hi-2 | 3.24 × 2.53 | Latitude 32°13′43″N | 2.5 × 2 | ||
| (8.204) | Longitude 44°29′15″E | (5) | |||
| Al-Qasim | 0.772 | Q-1 | 1.73 × 1.6 | Latitude 32°11′43″N | 1.2 × 1 |
| (2.766) | Longitude 44°32′26″E | (1.2) | |||
| Q-2 | 2.5 × 0.822 | Latitude 32°14′38″N | 1.5 × 0.8 | ||
| (2.055) | Longitude 44°37′10″E | (1.2) | |||
| Al-Hashimiyah | 1.013 | Hs-2 | 1.69 × 0.813 | Latitude 32°24′51″N | 1.3 × 1 |
| (1.374) | Longitude 44°54′41″E | (1.3) | |||
| Hs-1 | 1.24 × 1.038 | Latitude 32°15′54″N | 1.2 × 1.1 | ||
| (1.288) | Longitude 44°53′38″E | (1.32) | |||
| Al-Mahawil | 0.975 | Ma-2 | 1.543 × 1.438 | Latitude 32°38′12″N | 1.1 × 1.1 |
| (2.218) | Longitude 44°34′9″E | (1.21) | |||
| Ma-1 | 2.23 × 1.323 | Latitude 32°29′59″N | 1.1 × 1.1 | ||
| (2.950) | Longitude 44°41′2″E | (1.2) | |||
| Al-Musayiab | 2.080 | Mu-1 | 4.9 × 1.626 | Latitude 32°48′39″N | 1.5 × 1.5 |
| (7.965) | Longitude 44°8′59″E | (2.25) | |||
| Mu-2 | 3.76 × 1.583 | Latitude 33°0′14″N | 1.5 × 1.5 | ||
| (5.952) | Longitude 44°6′46″E | (2.25) | |||
| Year | Hillah | Qasim | Mahawil | Hashimiyah | Musayiab | |||||
|---|---|---|---|---|---|---|---|---|---|---|
| Waste (T 1) | Z.A. 2 (ha 3) | Waste (T) | Z.A. (ha) | Waste (T) | Z.A. (ha) | Waste (T) | Z.A. (ha) | Waste (T) | Z.A. (ha) | |
| 2020 | 318,576 | 35.4 | 51,497 | 5.7 | 64,993 | 7.2 | 67,532 | 7.5 | 138,760 | 15.4 |
| 2021 | 331,383 | 36.8 | 53,567 | 6.0 | 67,605 | 7.5 | 70,246 | 7.8 | 144,338 | 16.0 |
| 2022 | 344,704 | 38.3 | 55,720 | 6.2 | 70,323 | 7.8 | 73,070 | 8.1 | 150,140 | 16.7 |
| 2023 | 358,561 | 39.8 | 57,960 | 6.4 | 73,150 | 8.1 | 76,008 | 8.4 | 156,176 | 17.4 |
| 2024 | 372,974 | 41.4 | 60,290 | 6.7 | 76,090 | 8.5 | 79,063 | 8.8 | 162,454 | 18.1 |
| 2025 | 387,968 | 43.1 | 62,714 | 7.0 | 79,149 | 8.8 | 82,241 | 9.1 | 168,984 | 18.8 |
| 2026 | 403,563 | 44.9 | 65,235 | 7.2 | 82,331 | 9.1 | 85,547 | 9.5 | 175,777 | 19.5 |
| 2027 | 419,786 | 46.6 | 67,857 | 7.5 | 85,641 | 9.5 | 88,986 | 9.9 | 182,843 | 20.3 |
| 2028 | 436,661 | 48.5 | 70,585 | 7.8 | 89,083 | 9.9 | 92,563 | 10.3 | 190,193 | 21.1 |
| 2029 | 454,215 | 50.5 | 73,422 | 8.2 | 92,664 | 10.3 | 96,284 | 10.7 | 197,839 | 22.0 |
| 2030 | 472,474 | 52.5 | 76,374 | 8.5 | 96,389 | 10.7 | 100,155 | 11.2 | 205,792 | 22.9 |
| No. | Type | Texture Number in HELP | Material | Thick (cm) | Porosity (vol./vol.) | Field Capacity (vol./vol.) | Wilting Point (vol./vol.) | Initial Soil Water Content (vol./vol.) | Hydraulic Conductivity (cm/sec) |
|---|---|---|---|---|---|---|---|---|---|
| 1 | VPL 1 | 27 | Moderate compacted Sandy Clay | 60 | 0.400 | 0.366 | 0.288 | 0.290 | 7.8 × 10⁻⁷ |
| 2 | VPL | 18 | Municipal Waste | 200 (first scenario) | 0.671 | 0.292 | 0.077 | 0.292 | 1.0 × 10⁻⁵ |
| VPL | 18 | Municipal Waste | 400 (second scenario) | 0.671 | 0.292 | 0.077 | 0.292 | 1.0 × 10⁻⁵ | |
| 3 | VPL | 5 | Loam Fine Sand | 30 | 0.457 | 0.131 | 0.058 | 0.131 | 1.0 × 10⁻³ |
| 4 | GL 2 (FML 3) | 38 | Butyl Rubber | 0.15 | Pinhole Density = 0.40 Holes/Hectare; Installation Defects = 4.0 Holes/Hectare; Placement Quality = 3–Good; Drainage slope 3%; Drainage length 30 m | 1.0 × 10⁻¹² | |||
| 5 | LDL 4 | 21 | Gravel | 30 | 0.397 | 0.032 | 0.013 | 0.032 | 3.0 × 10⁻¹ |
| 6 | LDL | 20 | Drain net | 0.5 | 0.850 | 0.010 | 0.005 | 0.010 | 1.0 × 10+1 |
| 7 | GM 5 (FML) | 35 | HDPE 6 | 0.15 | Pinhole density = 0.40 Holes/Hectare; Installation defects = 4.0 Holes/Hectare; Placement Quality = 3–Good; Drainage; slope 3%; Drainage length 30 m | 2.0 × 10⁻¹³ | |||
| 8 | BSL 7 | 16 | High compacted Clay | 60 | 0.427 | 0.418 | 0.367 | 0.427 | 1.0 × 10⁻⁷ |
| Items | Data | |
|---|---|---|
| First Scenario | Second Scenario | |
| Run-off curve number | 93.80 | 93.80 |
| Fraction of area allowing run-off | 100% | 100% |
| Soil evaporative zone depth | 50 cm | 50 cm |
| Initial water in evaporative zone | 14.50 cm | 14.50 cm |
| Upper limit of evaporative storage | 20.0 cm | 20.0 cm |
| Field capacity of evaporative zone | 18.3 cm | 18.3 cm |
| Lower limit of evaporative storage | 14.40 cm | 14.40 cm |
| Initial interception water | 0.0 cm | 0.0 cm |
| Initial water in all layers | 107.075 cm | 165.475 cm |
| Total subsurface inflow | 0.0 mm/year | 0.0 mm/year |
| Items | 2005 | 2006 | 2007 | |||
| mm | % | mm | % | mm | % | |
| Precipitation | 73.20 | 100 | 170.30 | 100 | 41.00 | 100 |
| Run-off | 53.11 | 72.55 | 115.25 | 67.67 | 18.31 | 44.67 |
| Potential evapotranspiration | 1694.86 | 1712.47 | 1715.04 | |||
| Actual evapotranspiration | 20.05 | 27.39 | 52.62 | 30.90 | 23.73 | 57.87 |
| 2008 | 2009 | 2010 | ||||
| Precipitation | 51.80 | 100 | 52.40 | 100 | 87.30 | 100 |
| Run-off | 26.68 | 51.51 | 25.74 | 49.12 | 51.93 | 59.49 |
| Potential evapotranspiration | 1728.97 | 1723.69 | 1712.94 | |||
| Actual evapotranspiration | 21.25 | 41.02 | 31.47 | 60.05 | 31.70 | 36.31 |
| 2011 | 2012 | 2013 | ||||
| Precipitation | 41.70 | 100 | 128.80 | 100 | 182.90 | 100 |
| Run-off | 18.87 | 45.25 | 103.21 | 80.13 | 154.30 | 84.36 |
| Potential evapotranspiration | 1705.54 | 1741.87 | 1701.86 | |||
| Actual evapotranspiration | 25.83 | 61.94 | 22.89 | 17.77 | 33.40 | 18.26 |
| 2014 | 2015 | 2016 | ||||
| Precipitation | 125.00 | 100 | 133.40 | 100 | 135.40 | 100 |
| Run-off | 81.04 | 64.83 | 96.59 | 72.41 | 100.27 | 74.06 |
| Potential evapotranspiration | 1741.96 | 1766.09 | 1761.22 | |||
| Actual evapotranspiration | 34.71 | 27.77 | 41.75 | 31.29 | 35.48 | 26.20 |
| First Scenario | ||||||||
| Items | 2005 | 2006 | 2007 | 2008 | ||||
| mm | % | mm | % | mm | % | mm | % | |
| Change in water storage | 0.04 | 0.06 | 2.43 | 1.43 | −1.04 | −2.54 | 3.87 | 7.47 |
| * Soil water at start of year | 1110.05 1 | 1110.09 | 1112.52 | 1111.48 | ||||
| Soil water at end of year | 1110.09 | 1112.52 | 1111.48 | 1115.35 | ||||
| 2009 | 2010 | 2011 | 2012 | |||||
| Change in water storage | −4.81 | −9.17 | 3.67 | 4.20 | −3.0 | −7.19 | 2.7 | 2.10 |
| Soil water at start of year | 1115.35 | 1110.54 | 1114.21 | 1111.21 | ||||
| Soil water at end of year | 1110.54 | 1114.21 | 1111.21 | 1113.91 | ||||
| 2013 | 2014 | 2015 | 2016 | |||||
| Change in water storage | −4.8 | −2.62 | 9.25 | 7.40 | −4.94 | −3.70 | −0.35 | −0.26 |
| Soil water at start of year | 1113.91 | 1109.11 | 1118.36 | 1113.42 | ||||
| Soil water at end of year | 1109.11 | 1118.36 | 1113.42 | 1113.07 | ||||
| Second Scenario | ||||||||
| Items | 2005 | 2006 | 2007 | 2008 | ||||
| mm | % | mm | % | mm | % | mm | % | |
| Change in water storage | 0.04 | 0.06 | 2.43 | 1.43 | −1.04 | −2.54 | 3.87 | 7.47 |
| * Soil water at start of year | 1694.05 1 | 1694.09 | 1696.52 | 1695.48 | ||||
| Soil water at end of year | 1694.09 | 1696.52 | 1695.48 | 1699.35 | ||||
| 2009 | 2010 | 2011 | 2012 | |||||
| Change in water storage | −4.81 | −9.17 | 3.67 | 4.20 | −3.0 | −7.19 | 2.7 | 2.10 |
| Soil water at start of year | 1699.35 | 1694.54 | 1698.21 | 1695.21 | ||||
| Soil water at end of year | 1694.54 | 1698.21 | 1695.21 | 1697.91 | ||||
| 2013 | 2014 | 2015 | 2016 | |||||
| Change in water storage | −4.8 | −2.62 | 9.25 | 7.40 | −4.94 | −3.70 | −0.35 | −0.26 |
| Soil water at start of year | 1697.91 | 1693.11 | 1702.36 | 1697.42 | ||||
| Soil water at end of year | 1693.11 | 1702.36 | 1697.42 | 1697.07 | ||||
| Items | 2005 | 2006 | 2007 | |||
| m | m3 | mm | m3 | mm | m3 | |
| Precipitation | 73.2 × 10⁻³ | 65,880 | 170.3 × 10⁻³ | 153,270 | 41 × 10−3 | 36,899 |
| Run-off | 53.11 × 10⁻³ | 47,802 | 115.25 × 10⁻³ | 103,721 | 18.31 × 10⁻³ | 16,483 |
| Actual evapotranspiration | 20.05 × 10⁻³ | 18,039 | 52.62 × 10⁻³ | 47,358 | 23.73 × 10⁻³ | 21,352 |
| 2008 | 2009 | 2010 | ||||
| Precipitation | 51.8 × 10⁻³ | 46,62 | 52.40 × 10⁻³ | 47,160 | 87.30 × 10⁻³ | 78,570 |
| Run-off | 26.68 × 10⁻³ | 24,013 | 25.74 × 10⁻³ | 23,166 | 51.93 × 10⁻³ | 46,742 |
| Actual evapotranspiration | 21.25 × 10⁻³ | 19,121 | 31.47 × 10⁻³ | 28,321 | 31.7 × 10⁻³ | 28,526 |
| 2011 | 2012 | 2013 | ||||
| Precipitation | 41.7 × 10⁻³ | 37,530 | 128.8 × 10⁻³ | 115,920 | 182.9 × 10⁻³ | 164,610 |
| Run-off | 18.87 × 10⁻³ | 16,984 | 103.21 × 10⁻³ | 92,887 | 154.3 × 10⁻³ | 138,868 |
| Actual evapotranspiration | 25.83 × 10⁻³ | 23,250 | 22.89 × 10⁻³ | 20,605 | 33.4 × 10⁻³ | 30,057 |
| 2014 | 2015 | 2016 | ||||
| Precipitation | 125 × 10−3 | 112,500 | 133.4 × 10⁻³ | 120,060 | 135.4 × 10⁻³ | 121,860 |
| Run-off | 81.04 × 10⁻³ | 72,933 | 96.59 × 10⁻³ | 86,930 | 100.27 × 10⁻³ | 90,245 |
| Actual evapotranspiration | 34.71 × 10⁻³ | 31,240 | 41.75 × 10⁻³ | 37,574 | 35.48 × 10⁻³ | 31,931 |
| Items | JAN. | FEB. | MAR. | APR. | MAY. | JUN. |
| Precipitation | 17.17 | 13.38 | 11.27 | 9.20 | 4.06 | 0.0 |
| Run-off | 11.54 | 8.66 | 7.10 | 4.99 | 2.12 | 0.0 |
| Potential evapotranspiration | 52.36 | 66.91 | 107.56 | 164.21 | 204.09 | 230.20 |
| Actual evapotranspiration | 4.5 | 4.72 | 4.25 | 5.55 | 3.44 | 0.62 |
| JUL. | AUG. | SEP. | OCT. | NOV. | DEC. | |
| Precipitation | 0.0 | 0.0 | 0.23 | 6.57 | 21.67 | 18.38 |
| Run-off | 0.0 | 0.0 | 0.02 | 4.22 | 17.16 | 14.57 |
| Potential evapotranspiration | 252.90 | 227.96 | 181.71 | 116.77 | 66.59 | 54.27 |
| Actual evapotranspiration | 0.01 | 0.0 | 0.16 | 0.62 | 2.67 | 3.70 |
| Layer | The First Scenario | The Second Scenario | ||
|---|---|---|---|---|
| Final Water Storage (cm) | Volumetric Content (vol./vol.) | Final Water Storage (cm) | Volumetric Content (vol./vol.) | |
| 1 | 18.462 | 0.308 | 18.462 | 0.308 |
| 2 | 58.400 | 0.292 | 116.800 | 0.292 |
| 3 | 3.930 | 0.131 | 3.930 | 0.131 |
| 4 | 0.0 | 0.0 | 0.0 | 0.0 |
| 5 | 0.005 | 0.010 | 0.005 | 0.010 |
| 6 | 0.960 | 0.032 | 0.960 | 0.032 |
| 7 | 0.0 | 0.0 | 0.0 | 0.0 |
| 8 | 25.620 | 0.427 | 25.620 | 0.427 |
| Total initial water in all layers = 107.075 | Total initial water in all layers = 165.475 | |||
| The difference between the initial and final soil water = 0.302 cm | The difference between the initial and final soil water = 0.302 cm | |||
| Total water in all layers = 107.377 | Total water in all layers = 165.777 | |||
| Interception water = 0.0 | Interception water = 0.0 | |||
| Total subsurface inflow = 0.0 mm/yr. | Total subsurface inflow = 0.0 mm/yr. | |||
© 2018 by the authors. Licensee MDPI, Basel, Switzerland. This article is an open access article distributed under the terms and conditions of the Creative Commons Attribution (CC BY) license (http://creativecommons.org/licenses/by/4.0/).
Share and Cite
Chabuk, A.; Al-Ansari, N.; Ezz-Aldeen, M.; Laue, J.; Pusch, R.; Hussain, H.M.; Knutsson, S. Two Scenarios for Landfills Design in Special Conditions Using the HELP Model: A Case Study in Babylon Governorate, Iraq. Sustainability 2018, 10, 125. https://doi.org/10.3390/su10010125
Chabuk A, Al-Ansari N, Ezz-Aldeen M, Laue J, Pusch R, Hussain HM, Knutsson S. Two Scenarios for Landfills Design in Special Conditions Using the HELP Model: A Case Study in Babylon Governorate, Iraq. Sustainability. 2018; 10(1):125. https://doi.org/10.3390/su10010125
Chicago/Turabian StyleChabuk, Ali, Nadhir Al-Ansari, Mohammad Ezz-Aldeen, Jan Laue, Roland Pusch, Hussain Musa Hussain, and Sven Knutsson. 2018. "Two Scenarios for Landfills Design in Special Conditions Using the HELP Model: A Case Study in Babylon Governorate, Iraq" Sustainability 10, no. 1: 125. https://doi.org/10.3390/su10010125
APA StyleChabuk, A., Al-Ansari, N., Ezz-Aldeen, M., Laue, J., Pusch, R., Hussain, H. M., & Knutsson, S. (2018). Two Scenarios for Landfills Design in Special Conditions Using the HELP Model: A Case Study in Babylon Governorate, Iraq. Sustainability, 10(1), 125. https://doi.org/10.3390/su10010125