Immune Response Failure in Paucisymptomatic Long-Standing SARS-CoV-2 Spreaders


Abstract
1. Introduction
2. Patients
2.1. Case-Report 1
2.2. Case-Report 2
2.3. Case-Report 3
3. Methods
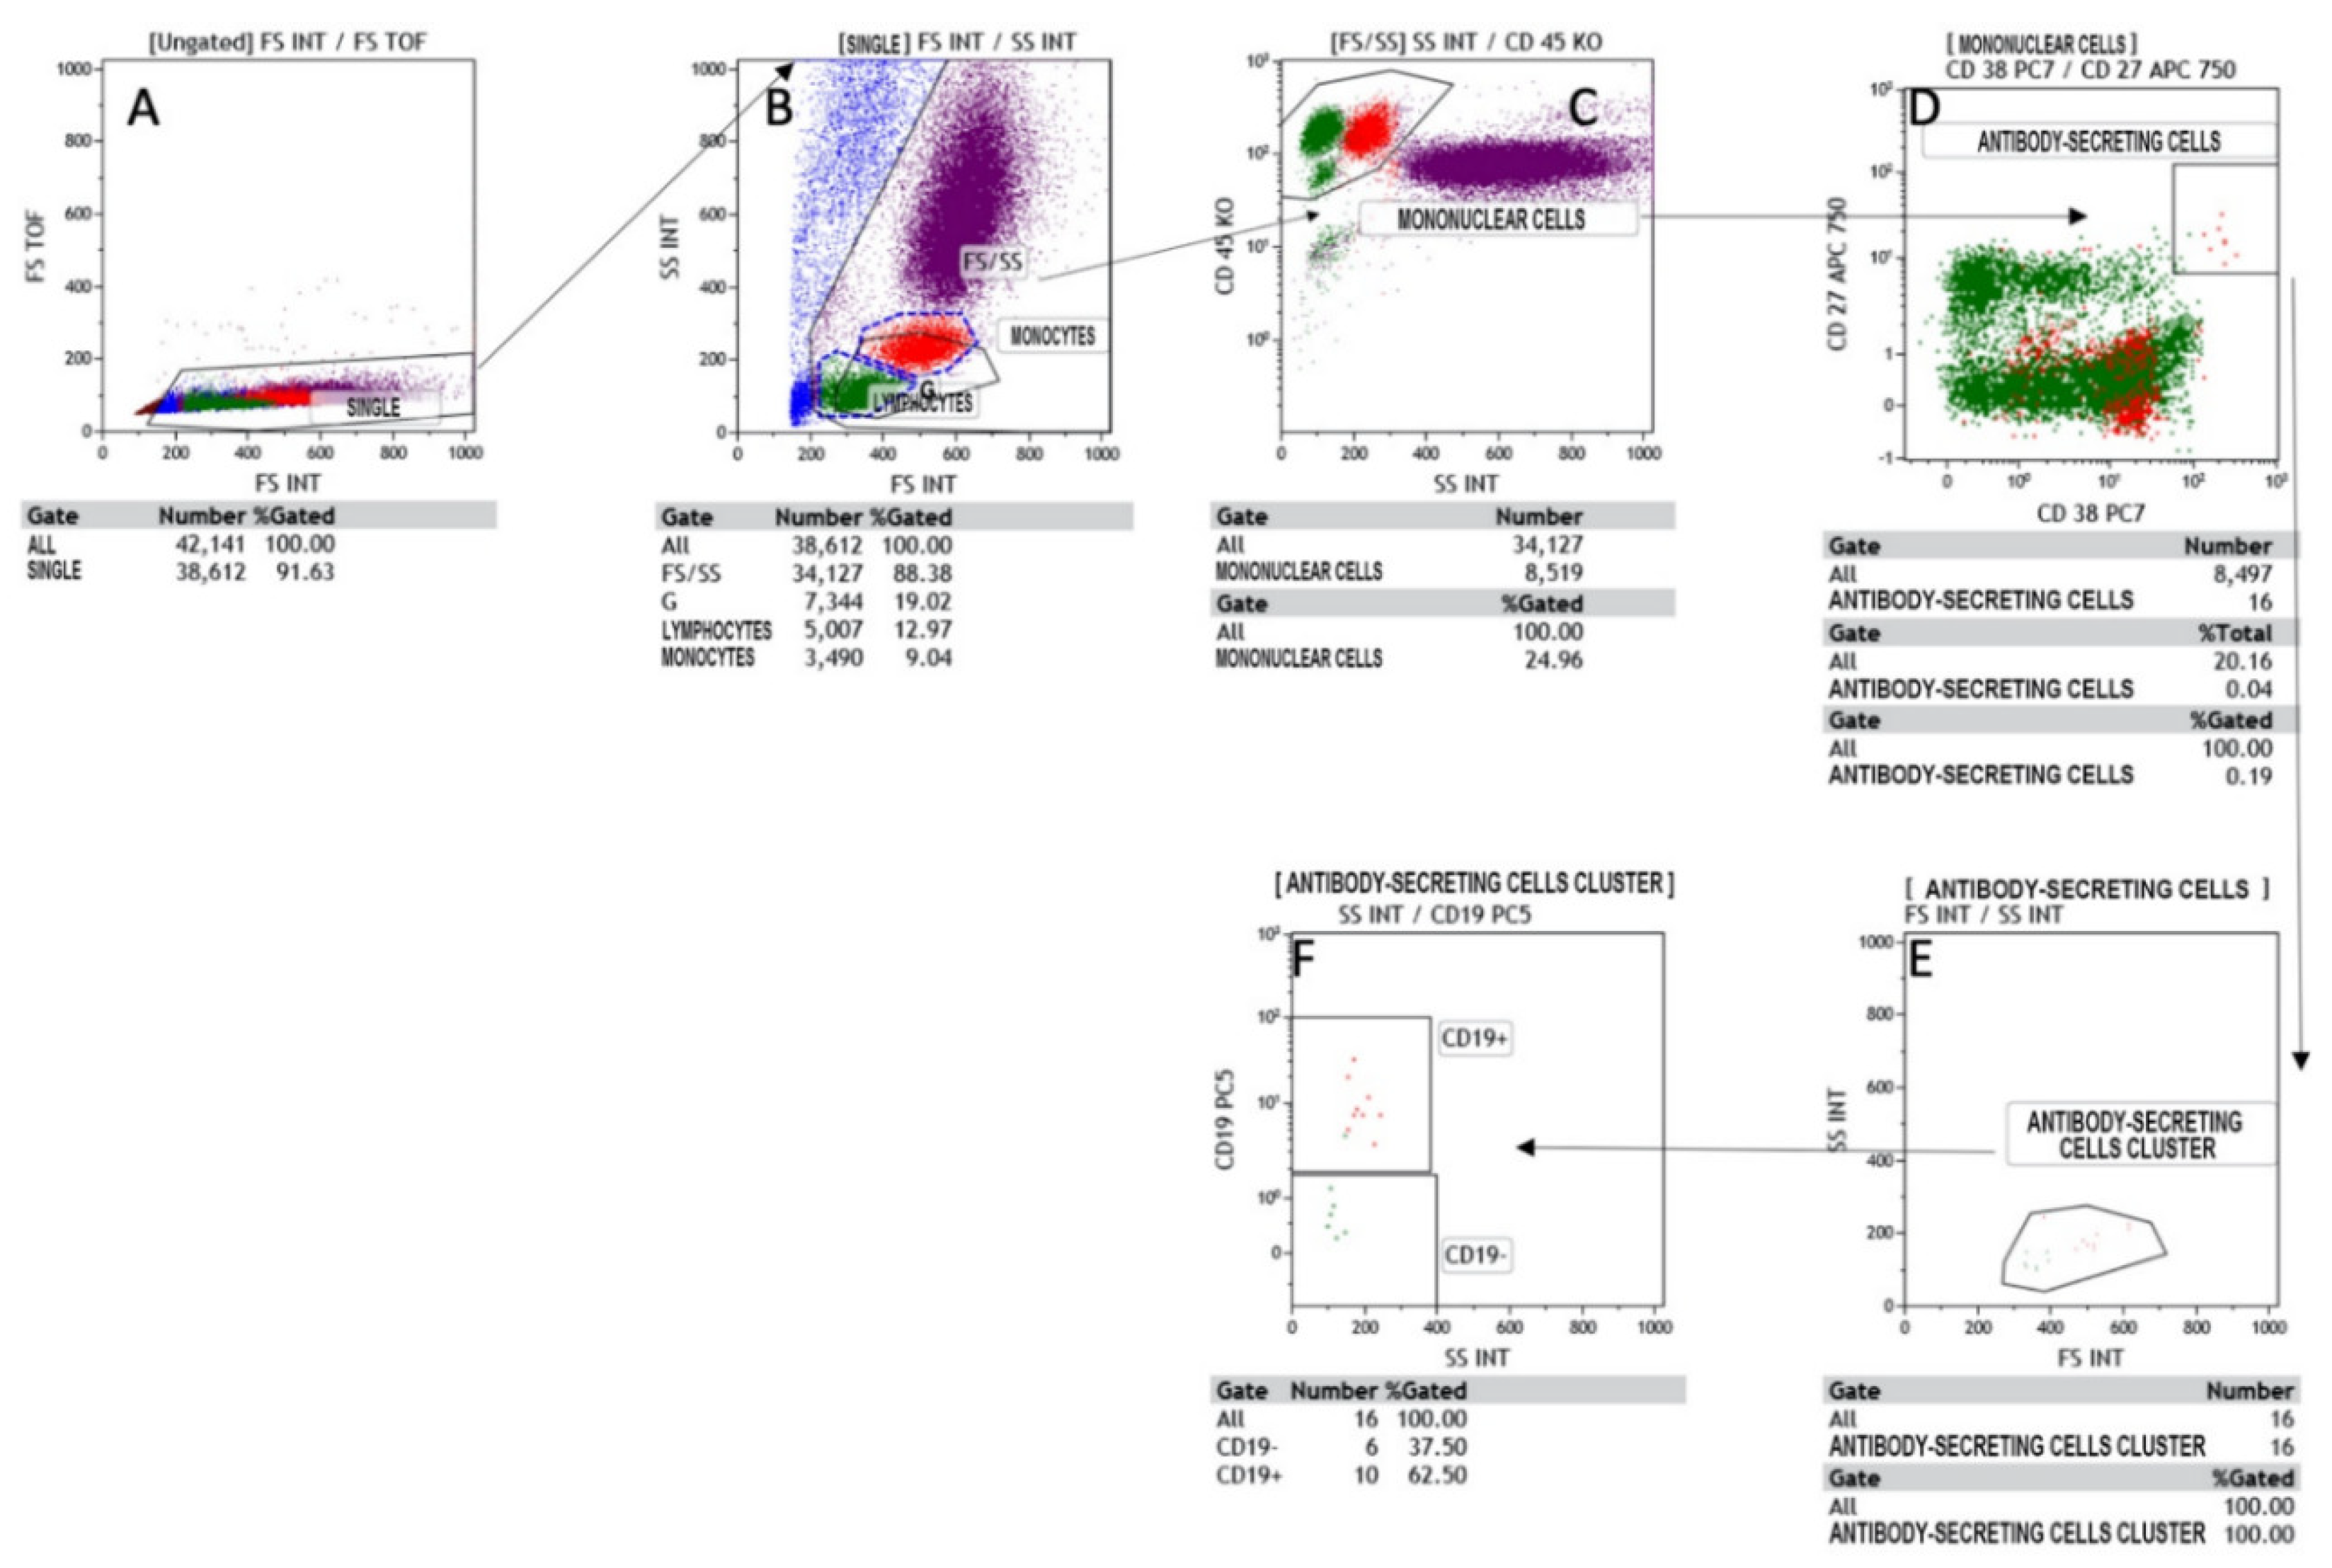
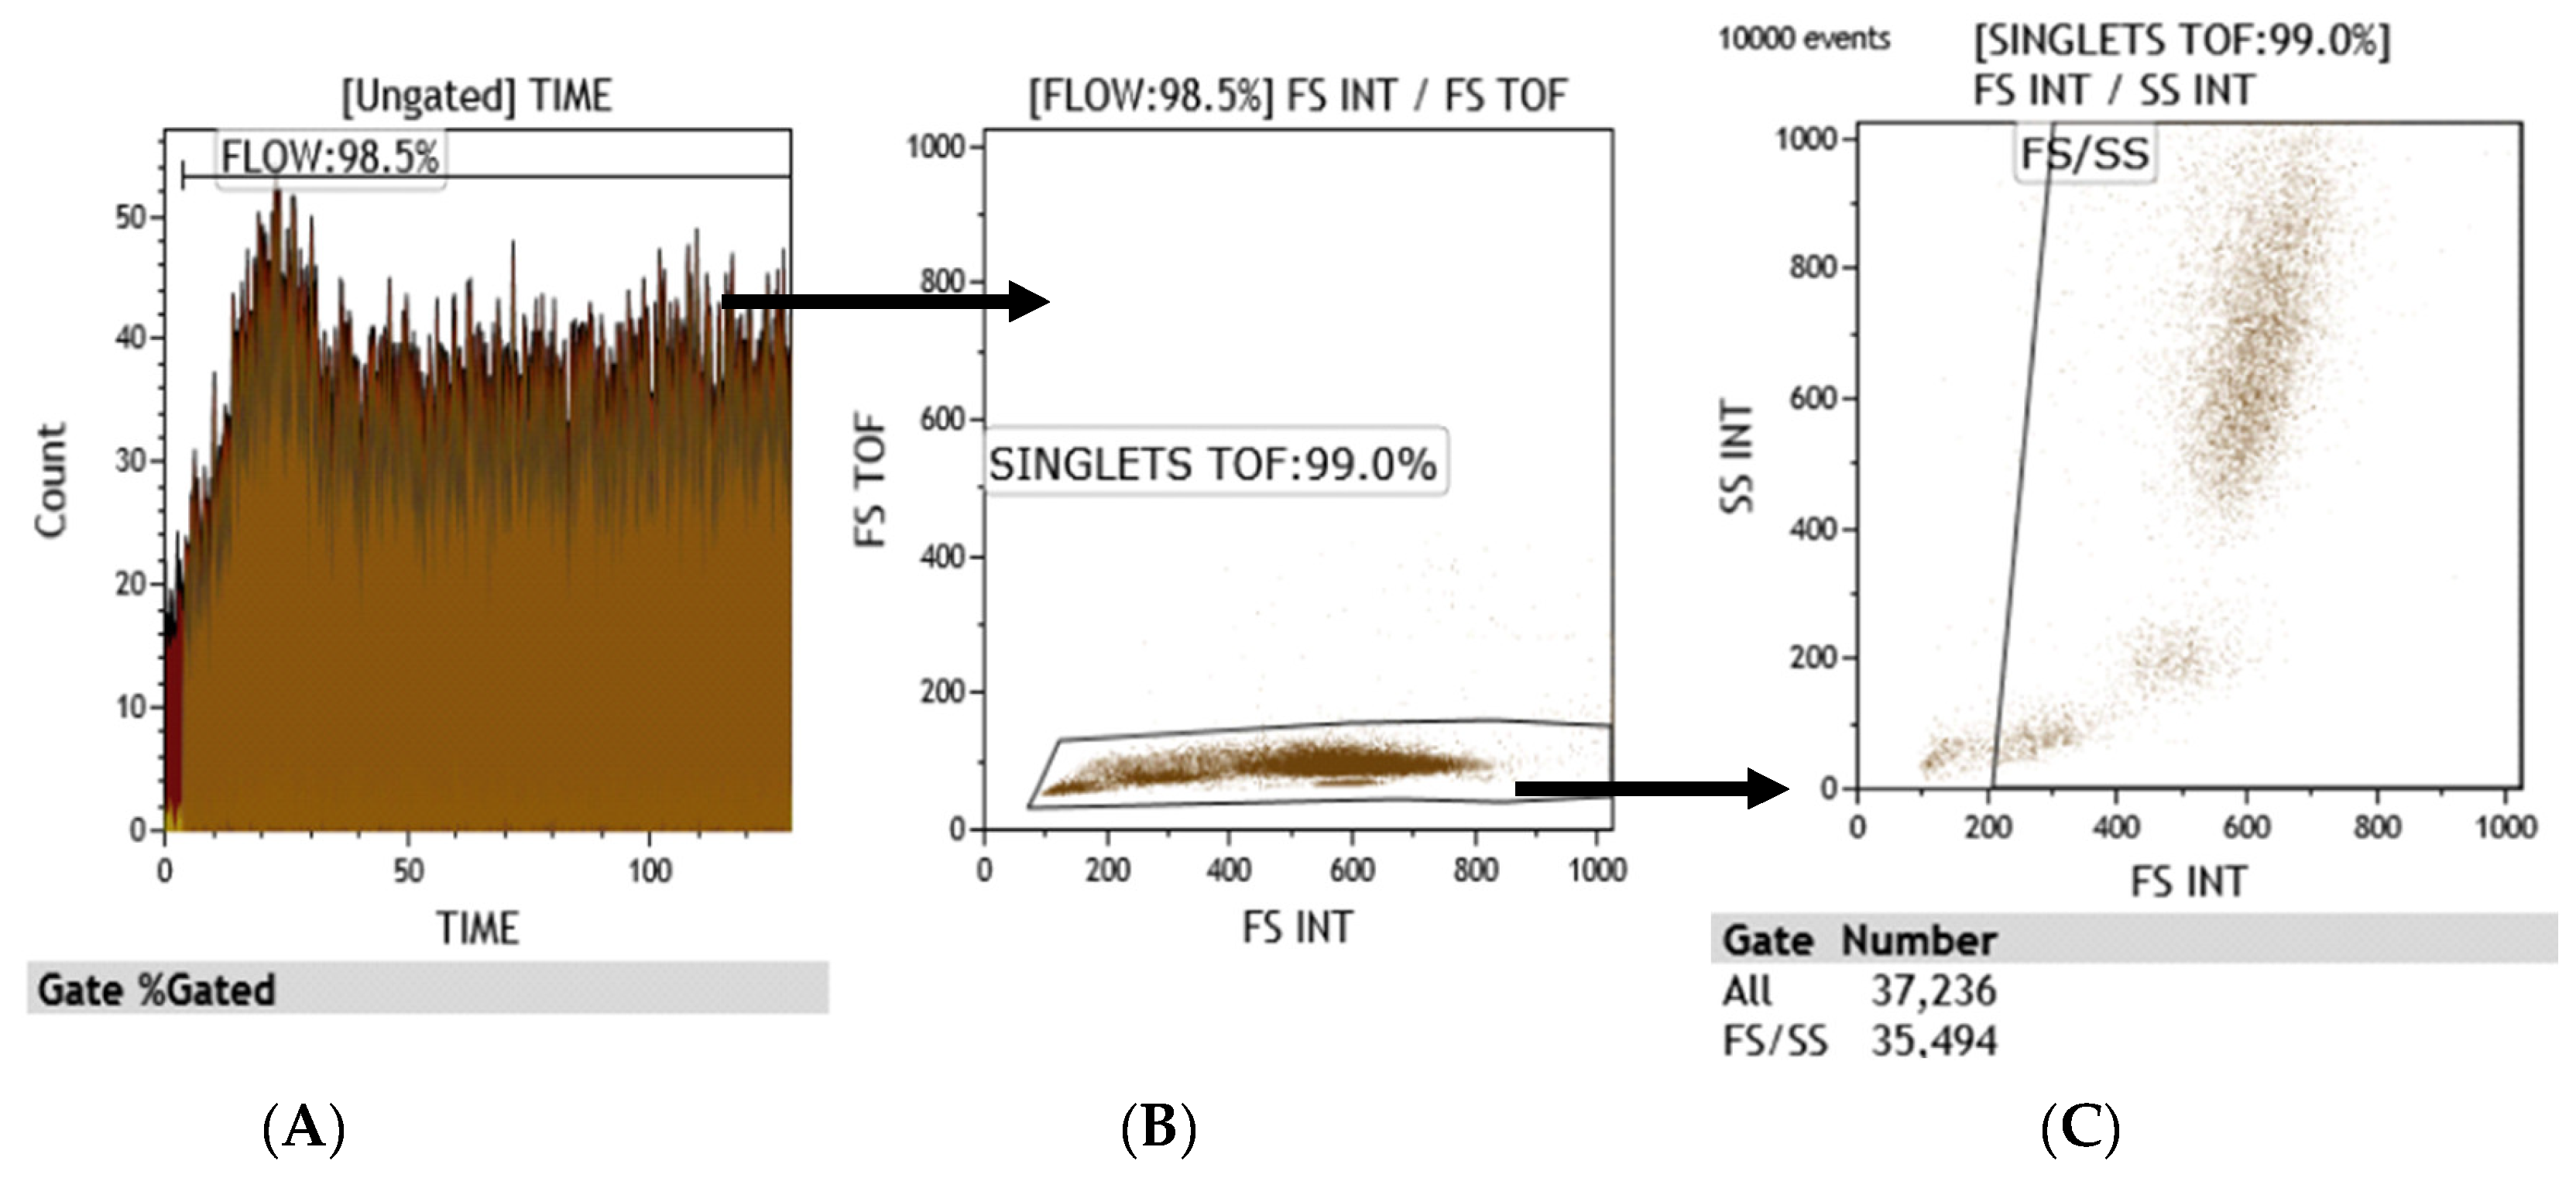
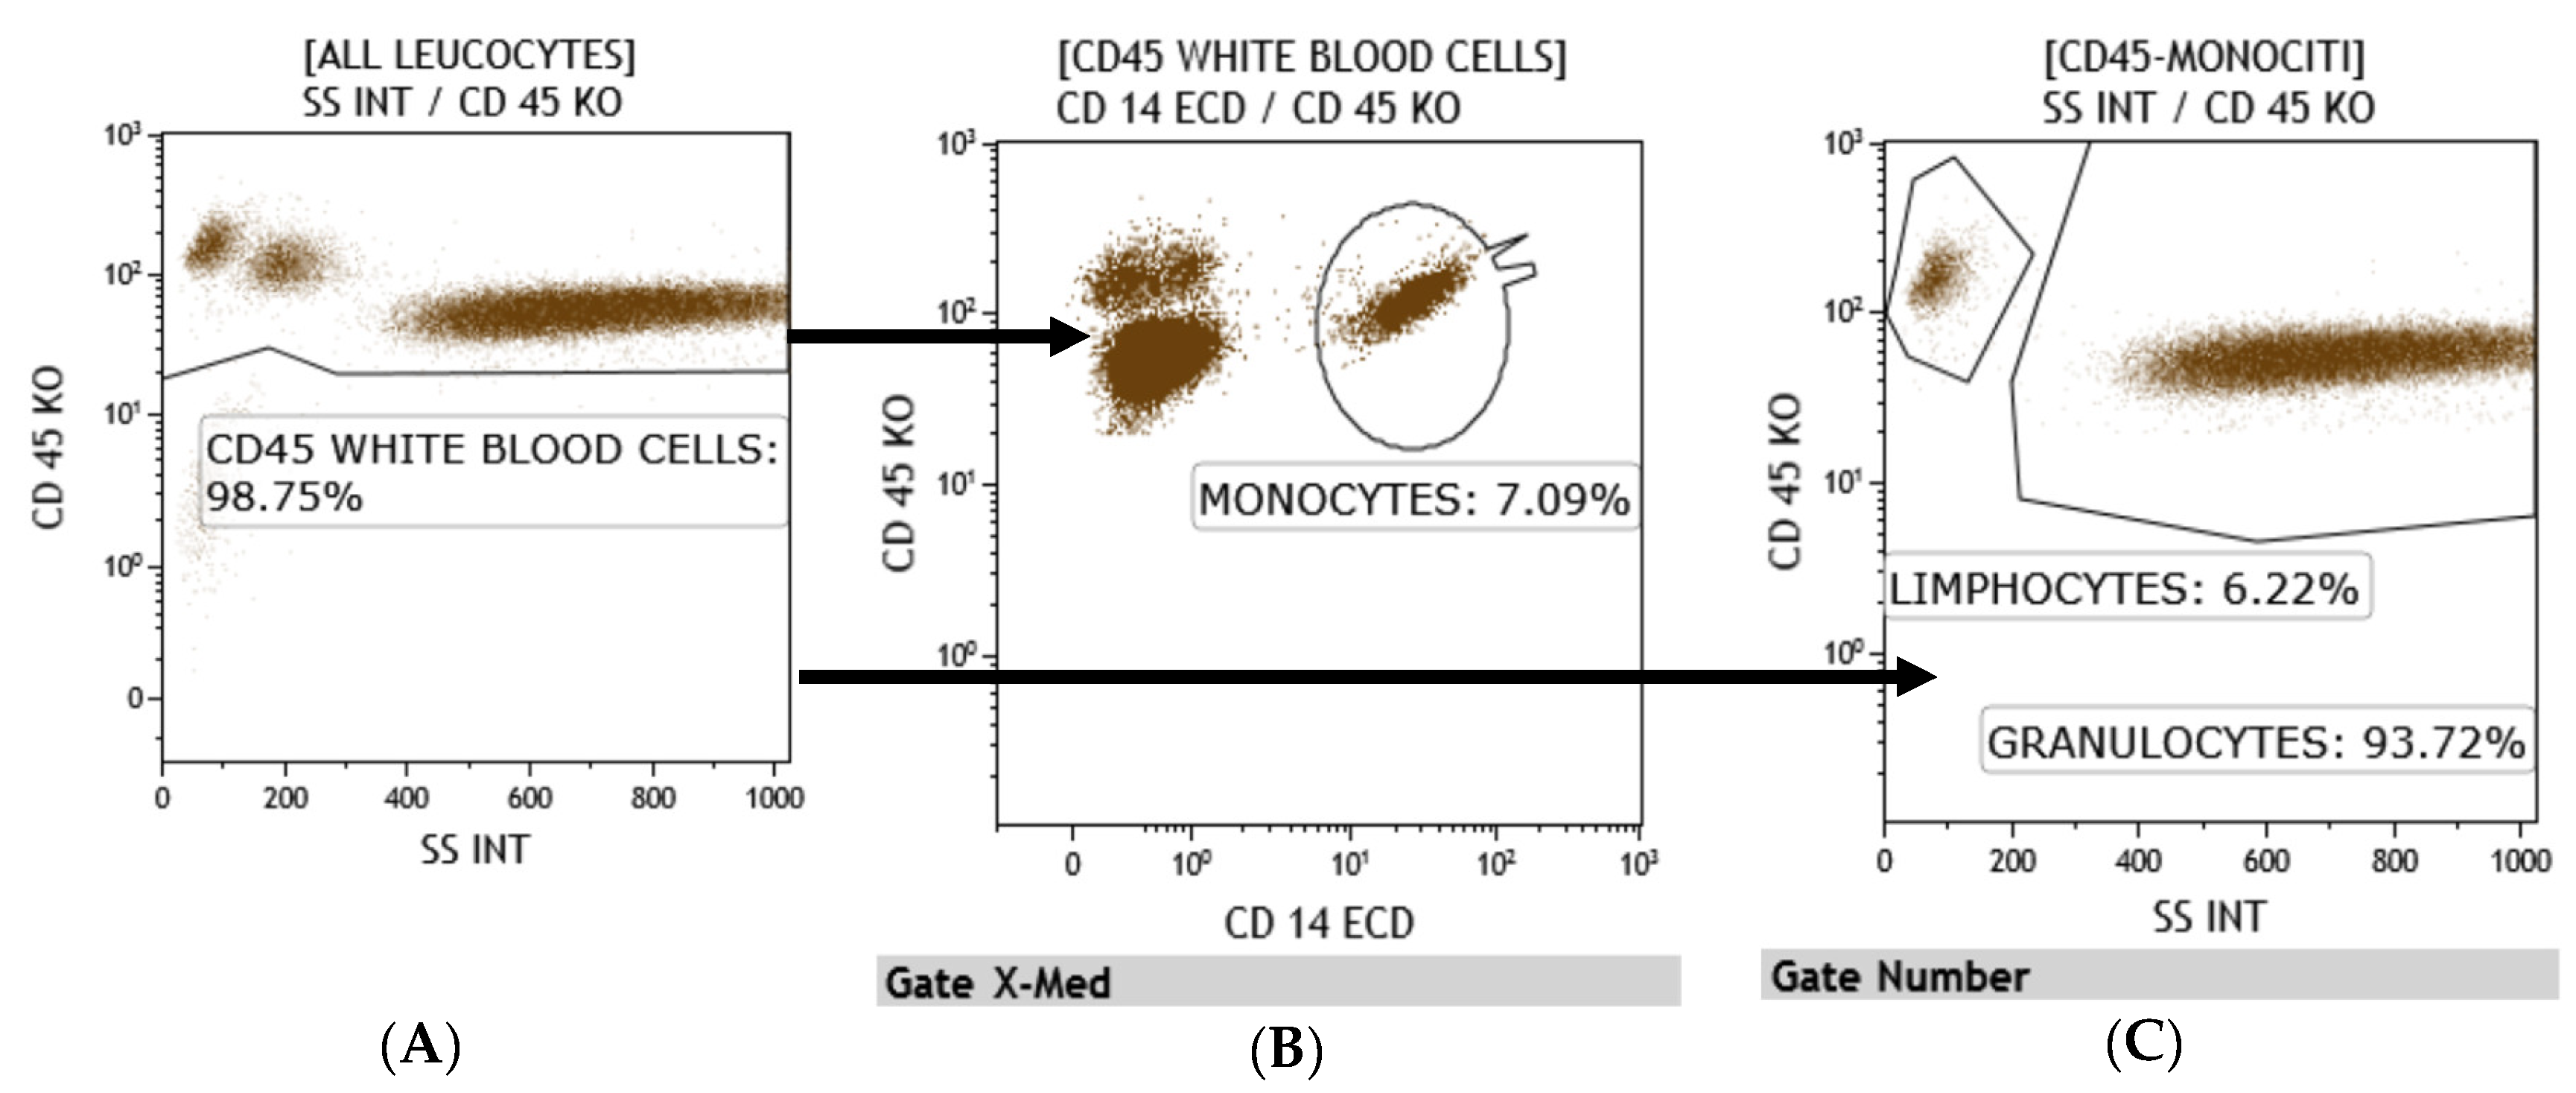
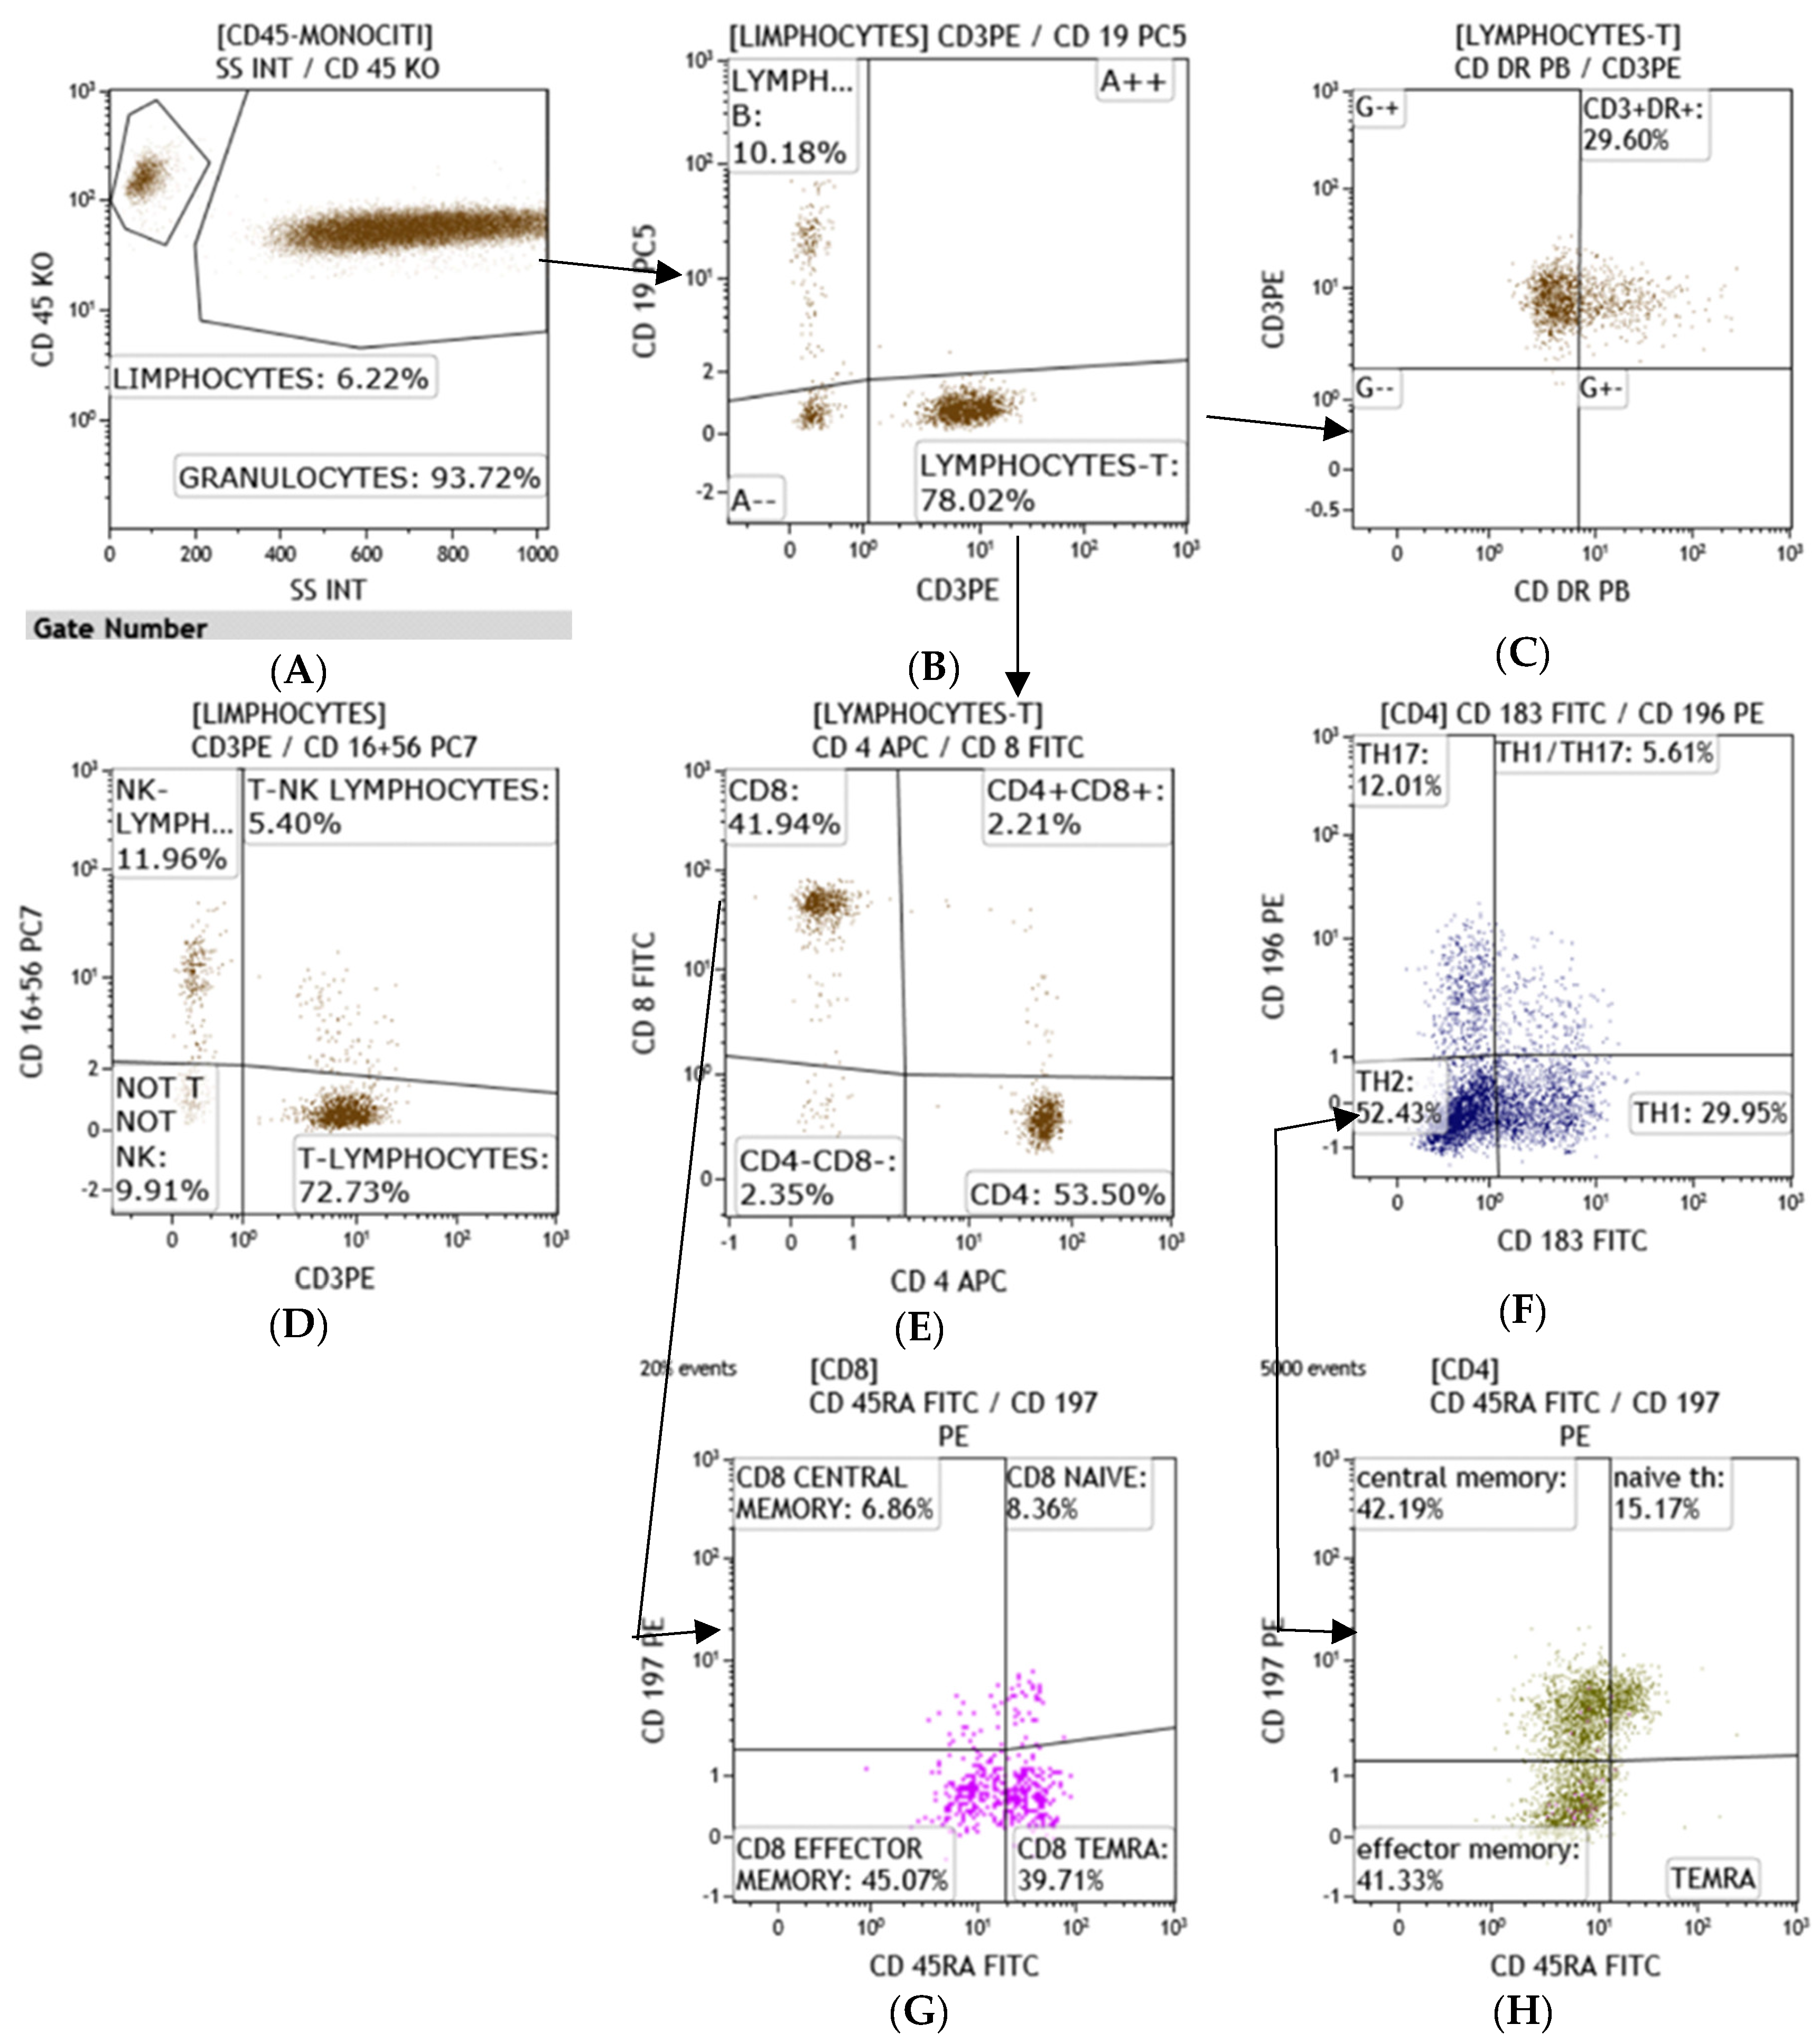
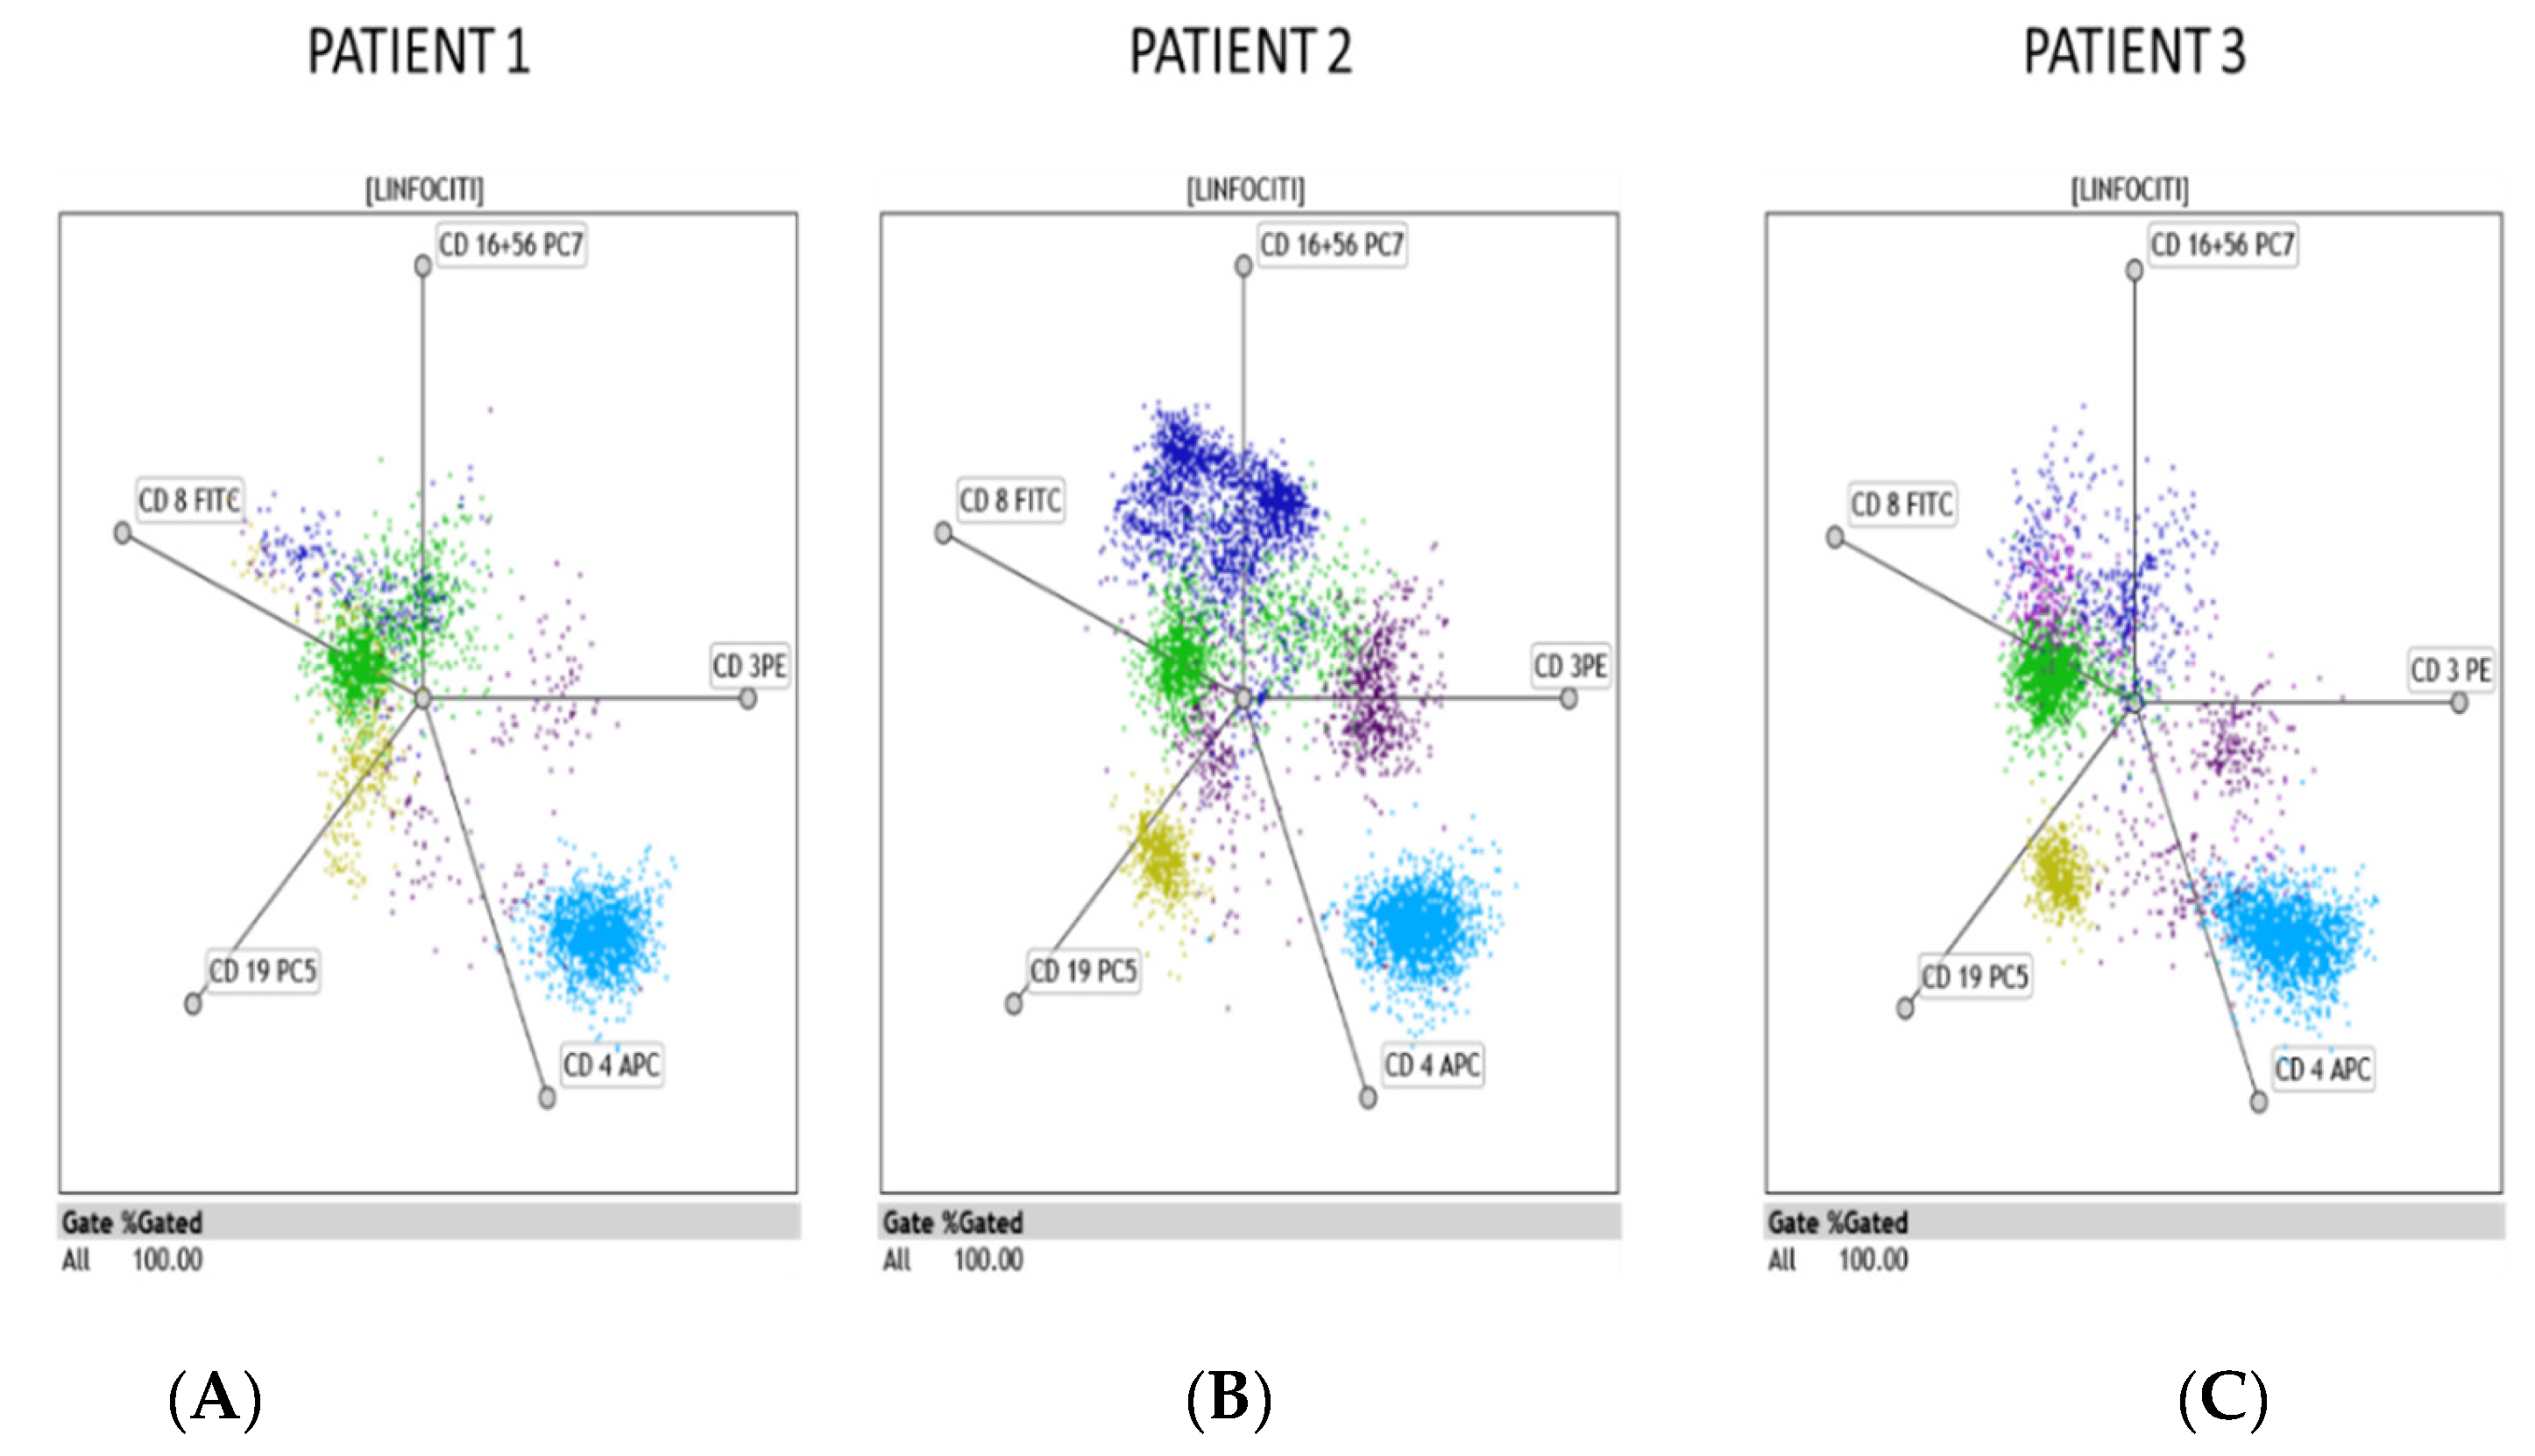
3.1. Flow Cytometry
3.2. Microbiology
3.3. IgM and IgG Detection
4. Results
5. Discussion
6. Concluding Remarks
Author Contributions
Funding
Informed Consent Statement
Conflicts of Interest
References
- Wang, D.; Hu, B.; Hu, C.; Zhu, F.; Liu, X.; Zhang, J.; Wang, B.; Xiang, H.; Cheng, Z.; Xiong, Y.; et al. Clinical Characteristics of 138 Hospitalized Patients With 2019 Novel Coronavirus-Infected Pneumonia in Wuhan, China. JAMA 2020, 323, 1061–1069. [Google Scholar] [CrossRef]
- Dashboard by the Center for Systems Science and Engineering (CSSE) at Johns Hopkins University. 2020. Available online: https://coronavirus.jhu.edu/map.html (accessed on 27 September 2020).
- Thevarajan, I.; Nguyen, T.H.O.; Koutsakos, M.; Druce, J.; Caly, L.; van de Sandt, C.E.; Jia, X.; Nicholson, S.; Catton, M.; Cowie, B.; et al. Breadth of concomitant immune responses prior to patient recovery: A case report of non-severe COVID-19. Nat. Med. 2020, 4, 453–455. [Google Scholar] [CrossRef] [PubMed]
- Heng, H.Y.; Zhang, M.; Yang, C.X.; Zhang, N.; Wang, X.C.; Yang, X.P.; Dong, X.Q.; Zhang, Y.T. Elevated exhaustion levels and reduced functional diversity of T cells in peripheral blood may predict severe progression in COVID-19 patients. Cell. Mol. Immunol. 2020, 17, 541–543. [Google Scholar]
- Zheng, M.; Gao, Y.; Wang, G.; Song, G.; Liu, S.; Sun, D.; Xu, Y.; Tian, Z. Functional exhaustion of antiviral lymphocytes in COVID-19 patients. Cell. Mol. Immunol. 2020, 17, 533–535. [Google Scholar] [CrossRef]
- Rühle, P.F.; Fietkau, R.; Gaipl, U.S.; Frey, B. Development of a Modular Assay for Detailed Immunophenotyping of Peripheral Human Whole Blood Samples by Multicolor Flow Cytometry. Int. J. Mol. Sci. 2016, 17, 1316. [Google Scholar] [CrossRef] [PubMed]
- Bocsi, J.; Melzer, S.; Dahnert, I.; Tarnok, A. OMIP-023:10-colour, 13 antibody panel for in-depth phenotyping of human peripheral blood leukocytes. Custom. Part A 2014, 85, 781–784. [Google Scholar] [CrossRef]
- Maecker, H.T.; McCoy, J.P.; Nussenblatt, R. Standardizing immunophenotyping for the human immunology project. Nat. Rev. Immunol. 2012, 12, 191–200. [Google Scholar] [CrossRef]
- Finak, G.; Langweiler, M.; Jaimes, M.; Malek, M.; Taghiyar, J.; Korin, Y.; Raddassi, K.; Devine, L.; Obermoser, G.; Pekalski, M.L.; et al. Standadizing flow cytometry immunophenotyping analysis from the human immunophetyping consortium. Sci. Rep. 2016, 6, 20686. [Google Scholar] [CrossRef]
- Treitz, M.; Miloud, T.; Kapinsky, M.; Magari, R.; Geissler, E.K.; Hutchinson, J.A.; Cogt, K.; Schlickeiser, S.; Kvenerland, A.H.; Meisel, C.; et al. Standardization of whole blood immune phenotype monitoring for clinical trials: Panels and method from the ONE study. Transplant. Res. 2013, 2, 17. [Google Scholar] [CrossRef] [PubMed]
- Ahmadpoor, P.; Rostaing, L. Why the immune system fails to mount an adaptive immune response to a COVID-19 infection. Transpl. Int. 2020, 33, 824–825. [Google Scholar] [CrossRef]
- Wang, F.; Nie, J.; Wang, H.; Zhao, Q.; Xiong, Y.; Deng, L.; Song, S.; Ma, Z.; Mo, P.; Zhang, Y. Characteristics of Peripheral Lymphocyte Subset Alteration in COVID-19 Pneumonia. J. Infect. Dis. 2020, 21, 1762–1769. [Google Scholar] [CrossRef]
- Diao, B.; Wang, C.; Tan, Y.; Chen, X.; Liu, Y.; Ning, L.; Chen, L.; Li, M.; Liu, Y.; Wang, G.; et al. Reduction and Functional Exhaustion of T Cells in Patients with Coronavirus Disease 2019 (COVID-19). Front. Immunol. 2020, 1, 827. [Google Scholar] [CrossRef]
- Cifaldi, L.; Prencipe, G.; Caiello, I.; Bracaglia, C.; Locatelli, F.; De Benedetti, F.; Strippoli, R. Inhibition of natural killer cell cytotoxicity by interleukin-6: Implications for the pathogenesis of macrophage activation syndrome. Arthritis Rheumatol. 2015, 67, 3037–3046. [Google Scholar] [CrossRef] [PubMed]
- Mazzoni, A.; Salvati, L.; Maggi, L.; Capone, M.; Vanni, A.; Spinicci, M.; Mencarini, J.; Caporale, R.; Peruzzi, B.; Antonelli, A.; et al. Impaired immune cell cytotoxicity in severe COVID-19 is IL-6 dependent. J. Clin. Investig. 2020, 130, 4694–4703. [Google Scholar] [CrossRef]
- Kim, S.E.; Jeong, H.S.; Yu, Y.; Shin, S.U.; Kim, S.; Oh, T.H.; Kim, U.J.; Kang, S.J.; Jang, S.I.; Jung, H.C.; et al. Viral kinetics of SARS-CoV-2 in asymptomatic carriers and presymptomatic patients. Int. J. Infect. Dis. 2020, 95, 441–443. [Google Scholar] [CrossRef] [PubMed]
- Wolfel, R.; Corman, V.M.; Guggemos, W.; Seilmaier, M.; Zange, S.; Muller, M.A.; Niemeyer, D.; Jones, T.C.; Vollmar, P.; Rothe, C.; et al. Virological assessment of hospitalized patients with COVID-2019. Nature 2020, 581, 465–469. [Google Scholar] [CrossRef]
- Park, P.G.; Kim, C.H.; Heo, Y.; Kim, T.S.; Park, C.W.; Kim, C.H. Out-of-Hospital Cohort Treatment of Coronavirus Disease 2019 Patients with Mild Symptoms in Korea: An Experience from a Single Community Treatment Center. J. Korean Med. Sci. 2020, 35, e13. [Google Scholar] [CrossRef]
- McElroy, A.K.; Akondy, R.S.; Davis, C.W.; Ellebedy, A.H.; Mehta, A.K.; Kraft, C.S.; Lyon, G.M.; Ribner, B.S.; Varkey, J.; Sidney, J.; et al. Human Ebola virus infection results in substantial immune activation. Proc. Natl. Acad. Sci. USA 2015, 112, 4719–4724. [Google Scholar] [CrossRef] [PubMed]
- Koutsakos, M.; Wheatley, A.K.; Loh, L.; Clemens, E.B.; Sant, S.; Nüssing, S.; Fox, A.; Chung, A.W.; Laurie, K.L.; Hurt, A.C.; et al. Circulating TFH cells, serological memory, and tissue compartmentalization shape human influenza-specific B cell immunity. Sci. Transl. Med. 2018, 10, 428. [Google Scholar] [CrossRef]
- Xiang, F.; Wang, X.; He, X.; Peng, Z.; Yang, B.; Zhang, J.; Zhou, Q.; Ye, H.; Ma, Y.; Li, H.; et al. Antibody Detection and Dynamic Characteristics in Patients with Coronavirus Disease 2019. Clin. Infect. Dis. 2020, 71, 1930–1934. [Google Scholar] [CrossRef]
- Varnaitė, R.; García, M.; Glans, H.; Maleki, K.T.; Sandberg, J.T.; Tynell, J.; Christ, W.; Lagerqvist, N.; Asgeirsson, H.; Ljunggren, H.G.; et al. Expansion of SARS-CoV-2-Specific Antibody-Secreting Cells and Generation of Neutralizing Antibodies in Hospitalized COVID-19 Patients. J. Immunol. 2020, 205, 2437–2446. [Google Scholar]
- Lee, F.E.H.; Falsey, A.R.; Halliley, J.L.; Sanz, I.; Walsh, E.E. Circulating antibody-secreting cells during acute respiratory syncytial virus infection in adults. J. Infect. Dis. 2010, 202, 1659–1666. [Google Scholar] [CrossRef]
- Hoffmann, M.; Kleine-Weber, H.; Schroeder, S.; Krüger, N.; Herrler, T.; Erichsen, S.; Schiergens, T.S.; Herrler, G.; Wu, N.H.; Nitsche, A.; et al. SARS-CoV-2 Cell Entry Depends on ACE2 and TMPRSS2 and Is Blocked by a Clinically Proven Protease Inhibitor. Cell 2020, 181, 271–280. [Google Scholar] [CrossRef]
- Ulrich, H.; Pillat, M.M. CD147 as a Target for COVID-19 Treatment: Suggested Effects of Azithromycin and Stem Cell Engagement. Stem Cell Rev. Rep. 2020, 16, 434–440. [Google Scholar] [CrossRef]


| Patient-1 | Patient-2 | Patient-3 | |
|---|---|---|---|
| Sex | Woman | Man | Man |
| Age | 81 | 78 | 37 |
| Body Mass Index | 18.3 | 23.8 | 26.1 |
| Temperature | 37.6 | 36.5 | 36.5 |
| Systolic Blood Pressure (mmHg) | 144 | 130 | 160 |
| Diastolic Blood Pressure (mmHg) | 76 | 55 | 100 |
| Heart Rate (bpm) | 76 | 88 | 105 |
| Respiratory Rate (breaths per minute) | 24 | 24 | 22 |
| Oxygen Saturation | 95 | 94 | 95 |
| History of Smoking | - | Yes | - |
| Hypertension | Yes | Yes | Yes |
| Chronic Renal Failure | Yes | Yes | - |
| Heart Failure | - | Yes | - |
| Chronic Ischemic Heart Disease | - | Yes | - |
| Chronic Cerebrovascular Disease | - | Yes | - |
| Atrial Fibrillation | - | Yes | - |
| COPD | - | Yes | - |
| Dyslipidemia | - | Yes | - |
| Hydroxychloroquine | Yes | Yes | Yes |
| Azithromycin | Yes | Yes | Yes |
| LMWH | Yes | Yes | - |
| ACEi | Yes | - | Yes |
| Ca channel blockers | - | Yes | Yes |
| Beta-blockers | Yes | Yes | - |
| Loop diuretics | - | Yes | - |
| Aldosterone antagonists | - | Yes | - |
| Statins | - | Yes | - |
| Corticosteroid | - | - | - |
| DOC | - | - | - |
| Warfarin | - | - | - |
| Hb (gr/dL) | 10.3 | 9.9 | 16.3 |
| PLT (×103/µL) | 318 | 417 | 210 |
| CRP (mg/dL) | 1.48 | 6.28 | 0.07 |
| PCT (µg/L) | 0.24 | 0.17 | 0.05 |
| Fibrinogen (mg/dL) | 626 | 508 | 235 |
| AST (mg/dL) | 11 | 57 | 24 |
| ALT (mg/dL) | 10 | 50 | 40 |
| D-Dimer (ng/mL) | 1950 | 5212 | 433 |
| Creatinine (mg/dL) | 1.40 | 1.73 | 1.03 |
| Blood Urea Nitrogen (mg/dL) | 117 | 59 | 36 |
| Na (mmol/L) | 139 | 139 | 139 |
| K (mmol/L) | 4.50 | 3.79 | 4.02 |
| Fasting Blood Sugar (mg/dL) | 136 | 81 | 76 |
| Patient-1 | Patient-2 | Patient-3 | |
|---|---|---|---|
| Time from positive test and first flow cytometry (days) | 30 | 13 | 52 |
| Lymphocyte T (total n) (microL) (normal range 1200–4000) | 380 | 620 | 1840 |
| Lymphocyte T Helper (n) (normal range 500–2000) | 190 | 400 | 1020 |
| cytotoxic Lymphocyte T (n) (normal range 200–1200) | 150 | 430 | 810 |
| NK (total n) (normal range 100–1200) | 50 | 360 | 220 |
| Granzyme Nk > 50% | 15 | 30 | 42 |
| TNK (normal range 100–500) | 40 | 50 | 140 |
| Lymphocyte B (tot n) (normal range 60–800) | 30 | 120 | 250 |
| Plasma cells (tot n) (normal range 1–11) | 7 | 2 | 5 |
| Plasmacells (tot%) (normal range 0.7–4.8) | 25 | 1.8 | 2.6 |
| Antibody-secreting plasma cells (n) (normal range 1–5) | 0 | 0 | 1 |
| IgM | negative | negative | negative |
| IgG | negative | negative | negative |
| Time from positive test and second flow cytometry (days) | 48 | 38 | |
| Lymphocyte T (total n) (microL) (normal range 1200–4000) | 850 | 740 | |
| Lymphocyte T Helper (n) (normal range 500–2000) | 480 | 400 | |
| cytotoxic Lymphocyte T (n) (normal range 200–1200) | 250 | 210 | |
| NK (total n) (normal range 100–1200) | 9 | 270 | |
| Granzyme Nk > 50% | 82 | 51 | |
| TNK (normal range 100–500) | 9 | 100 | |
| Lymphocyte B (tot n) (normal range 60–800) | 10 | 100 | |
| Plasma cells (tot n) (normal range 1–11) | 1 | 2 | |
| Plasmacells (tot%) (normal range 0.7–4.8) | 1.8 | 1.8 | |
| Antibody-secreting plasma cells (n) (normal range 1–5) | 0 | 1 | |
| Time from positive test and first flow cytometry (days) | 48 | 38 | |
| IgM | negative | positive | |
| IgG | negative | positive |
Publisher’s Note: MDPI stays neutral with regard to jurisdictional claims in published maps and institutional affiliations. |
© 2021 by the authors. Licensee MDPI, Basel, Switzerland. This article is an open access article distributed under the terms and conditions of the Creative Commons Attribution (CC BY) license (http://creativecommons.org/licenses/by/4.0/).
Share and Cite
Corrao, S.; Gervasi, F.; Di Bernardo, F.; Argano, C. Immune Response Failure in Paucisymptomatic Long-Standing SARS-CoV-2 Spreaders. Clin. Pract. 2021, 11, 151-161. https://doi.org/10.3390/clinpract11010021
Corrao S, Gervasi F, Di Bernardo F, Argano C. Immune Response Failure in Paucisymptomatic Long-Standing SARS-CoV-2 Spreaders. Clinics and Practice. 2021; 11(1):151-161. https://doi.org/10.3390/clinpract11010021
Chicago/Turabian StyleCorrao, Salvatore, Francesco Gervasi, Francesca Di Bernardo, and Christiano Argano. 2021. "Immune Response Failure in Paucisymptomatic Long-Standing SARS-CoV-2 Spreaders" Clinics and Practice 11, no. 1: 151-161. https://doi.org/10.3390/clinpract11010021
APA StyleCorrao, S., Gervasi, F., Di Bernardo, F., & Argano, C. (2021). Immune Response Failure in Paucisymptomatic Long-Standing SARS-CoV-2 Spreaders. Clinics and Practice, 11(1), 151-161. https://doi.org/10.3390/clinpract11010021