
Impaired Prosodic Processing but Not Hearing Function Is Associated with an Age-Related Reduction in AI Speech Recognition

Abstract
1. Introduction
2. General Methods
2.1. Participants
2.2. Experimental Setup
2.3. Auditory Setup
2.4. Subjective Hearing Assessment
2.5. Objective Hearing Assessment: Digits-in-Noise Test
2.6. AI Voice Experience
2.7. Data and Statistical Analysis Tools
3. Experiment 1
3.1. Methods
3.1.1. Participants
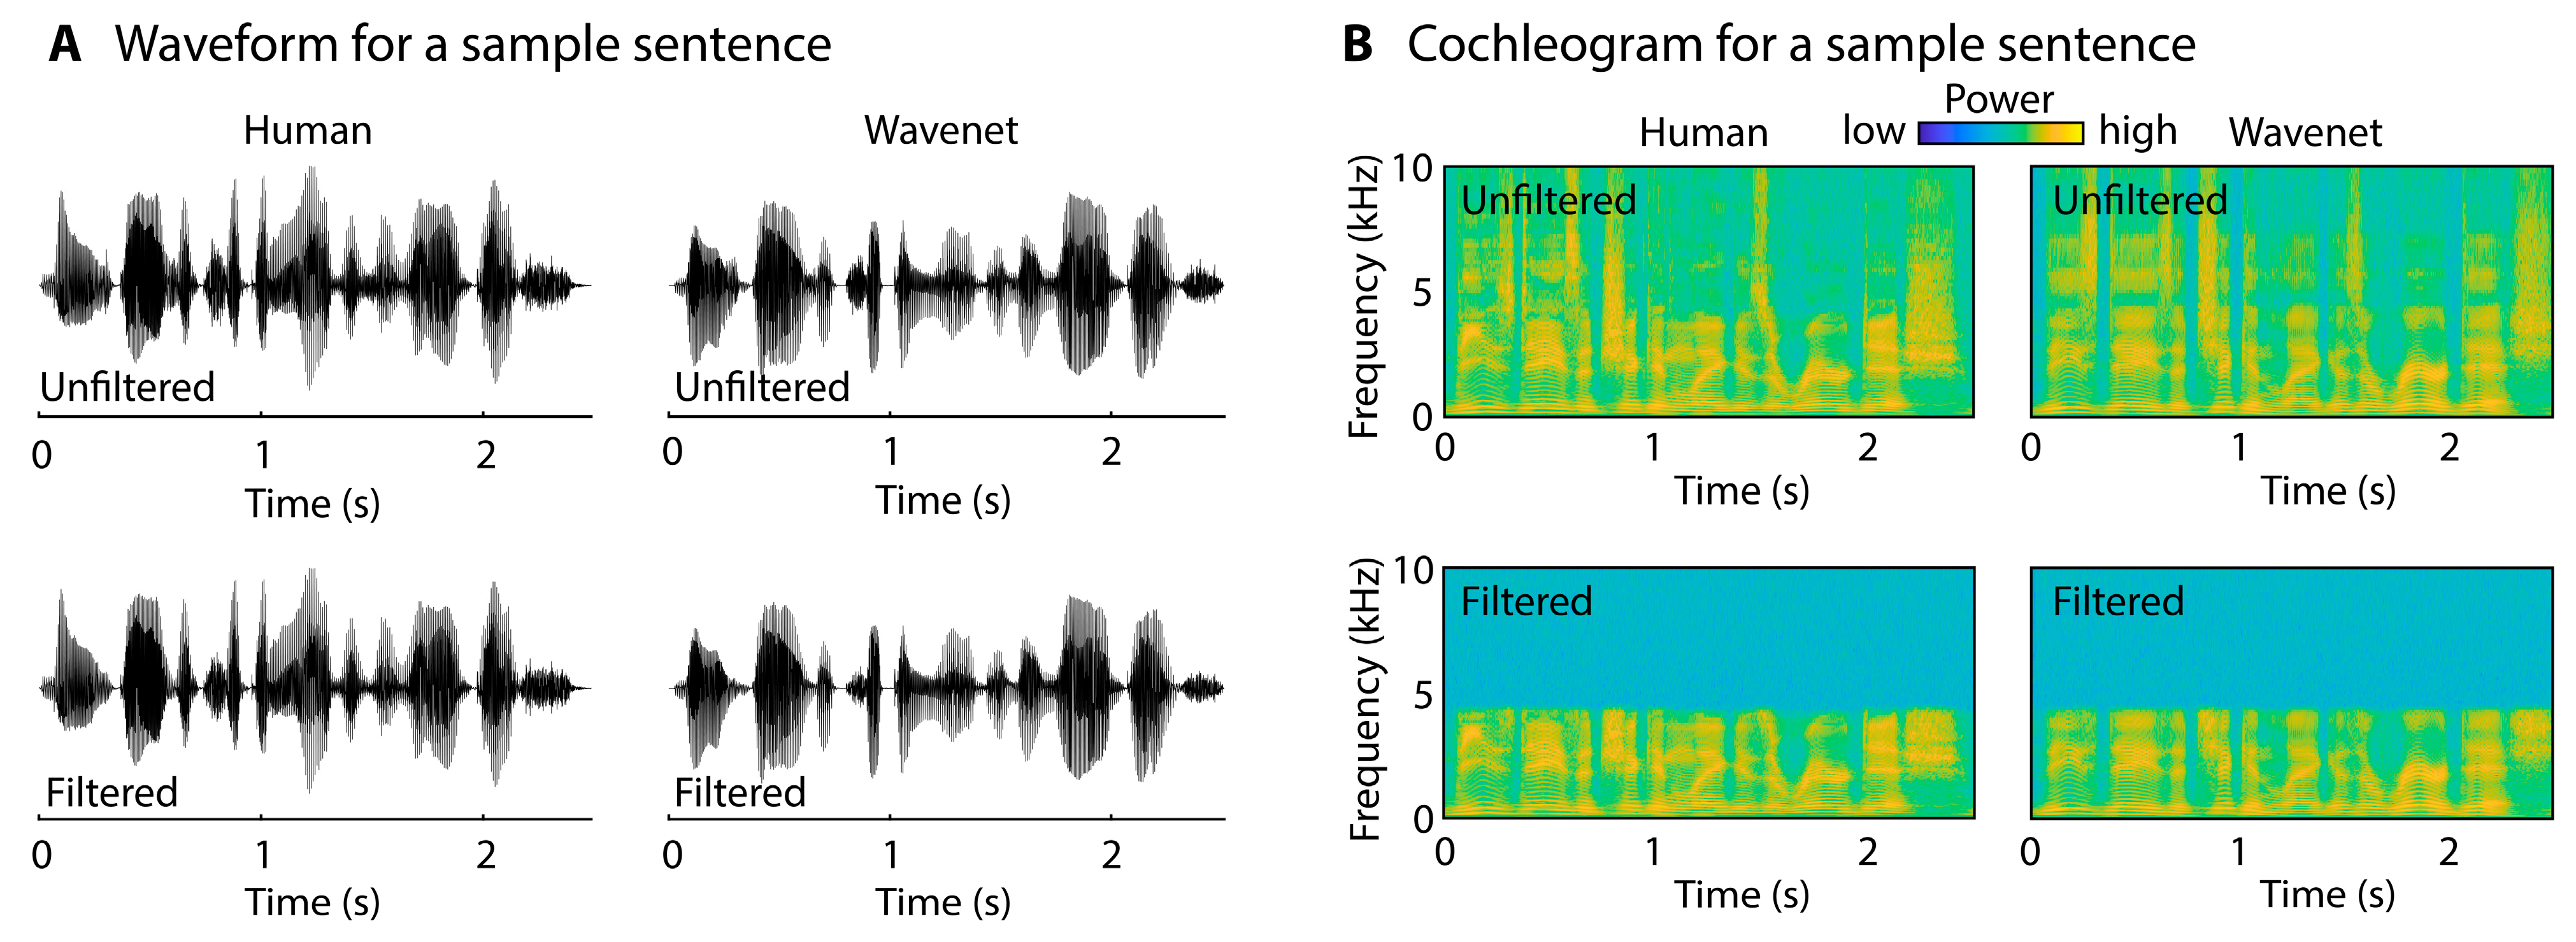
3.1.2. Speech-Type Categorization Task: Stimuli and Procedures
3.1.3. Speech-Type Categorization Task: Data Analysis
3.2. Results
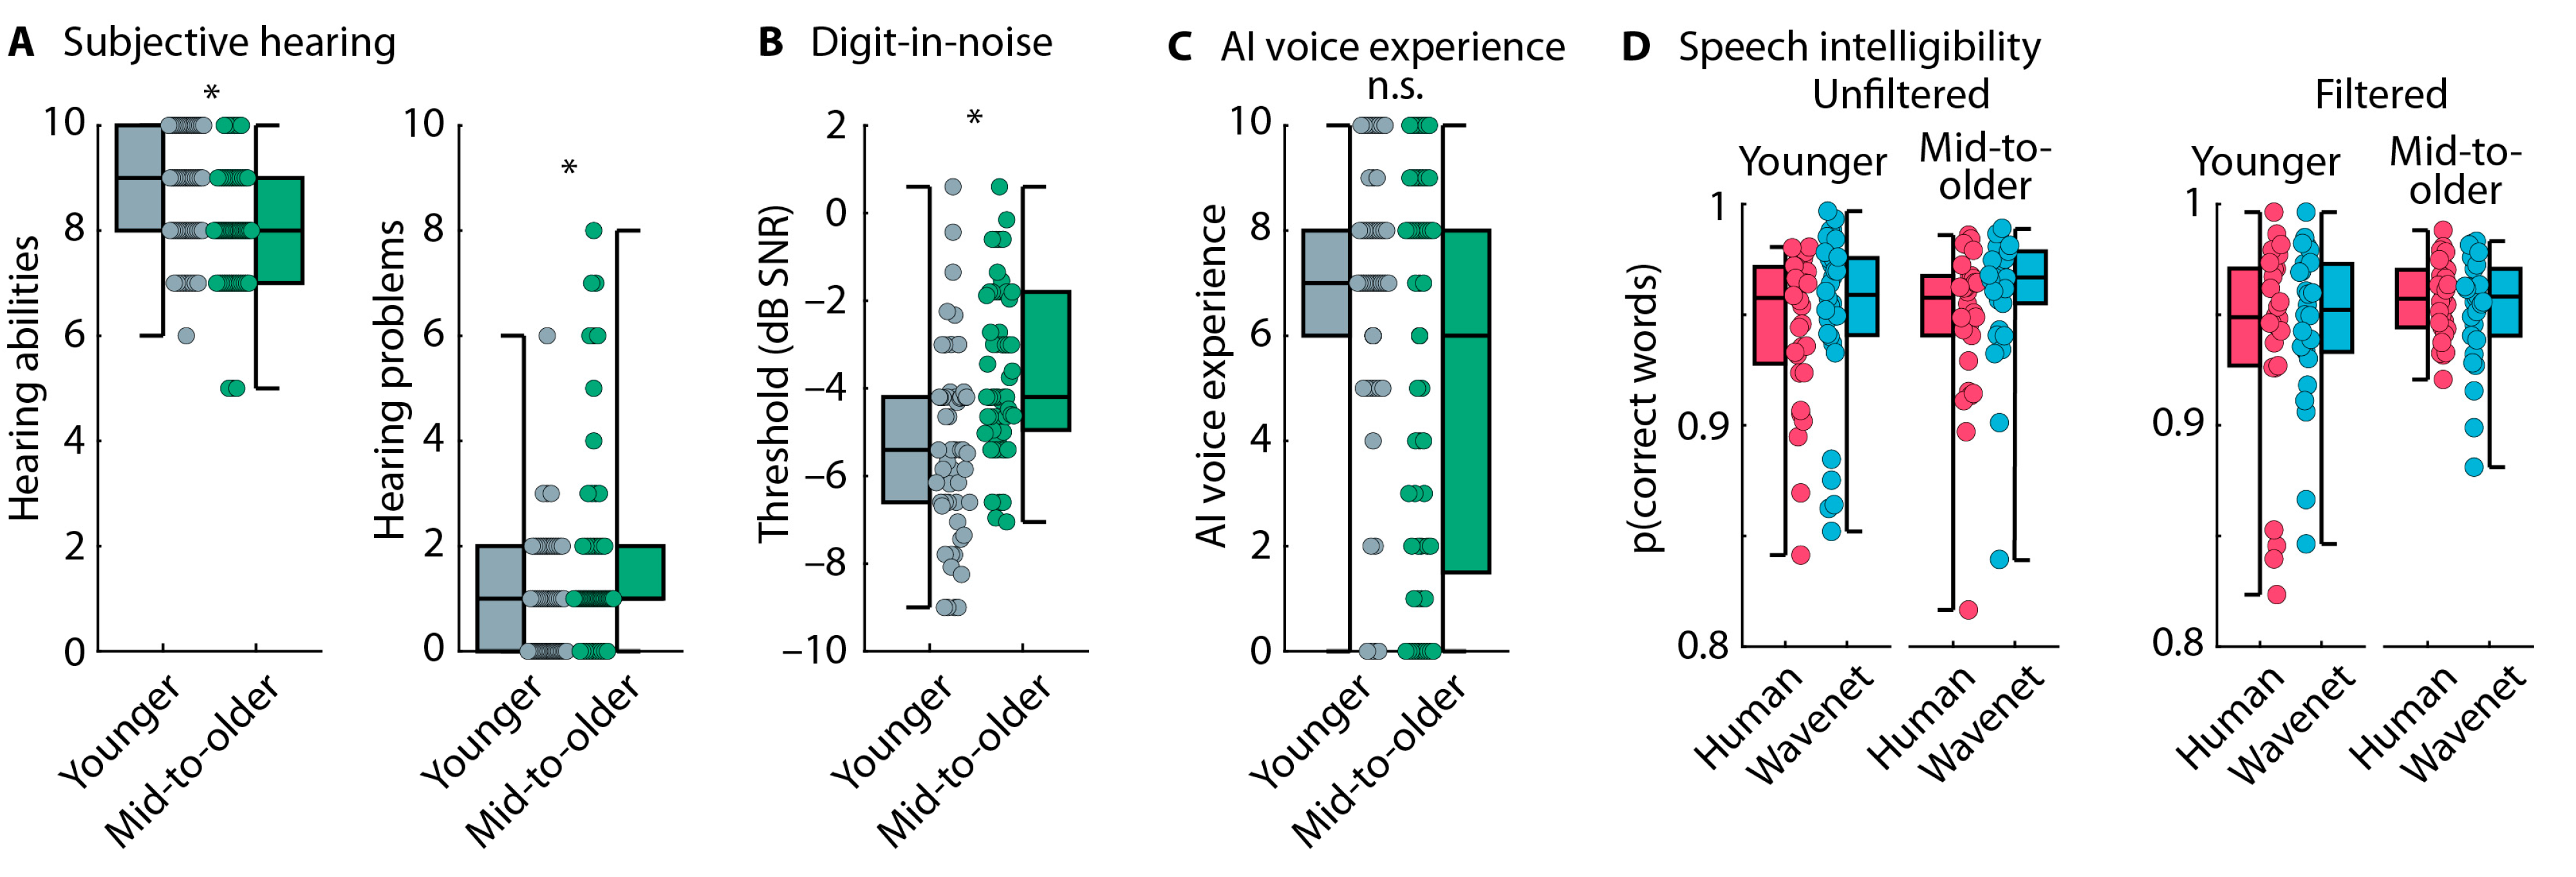
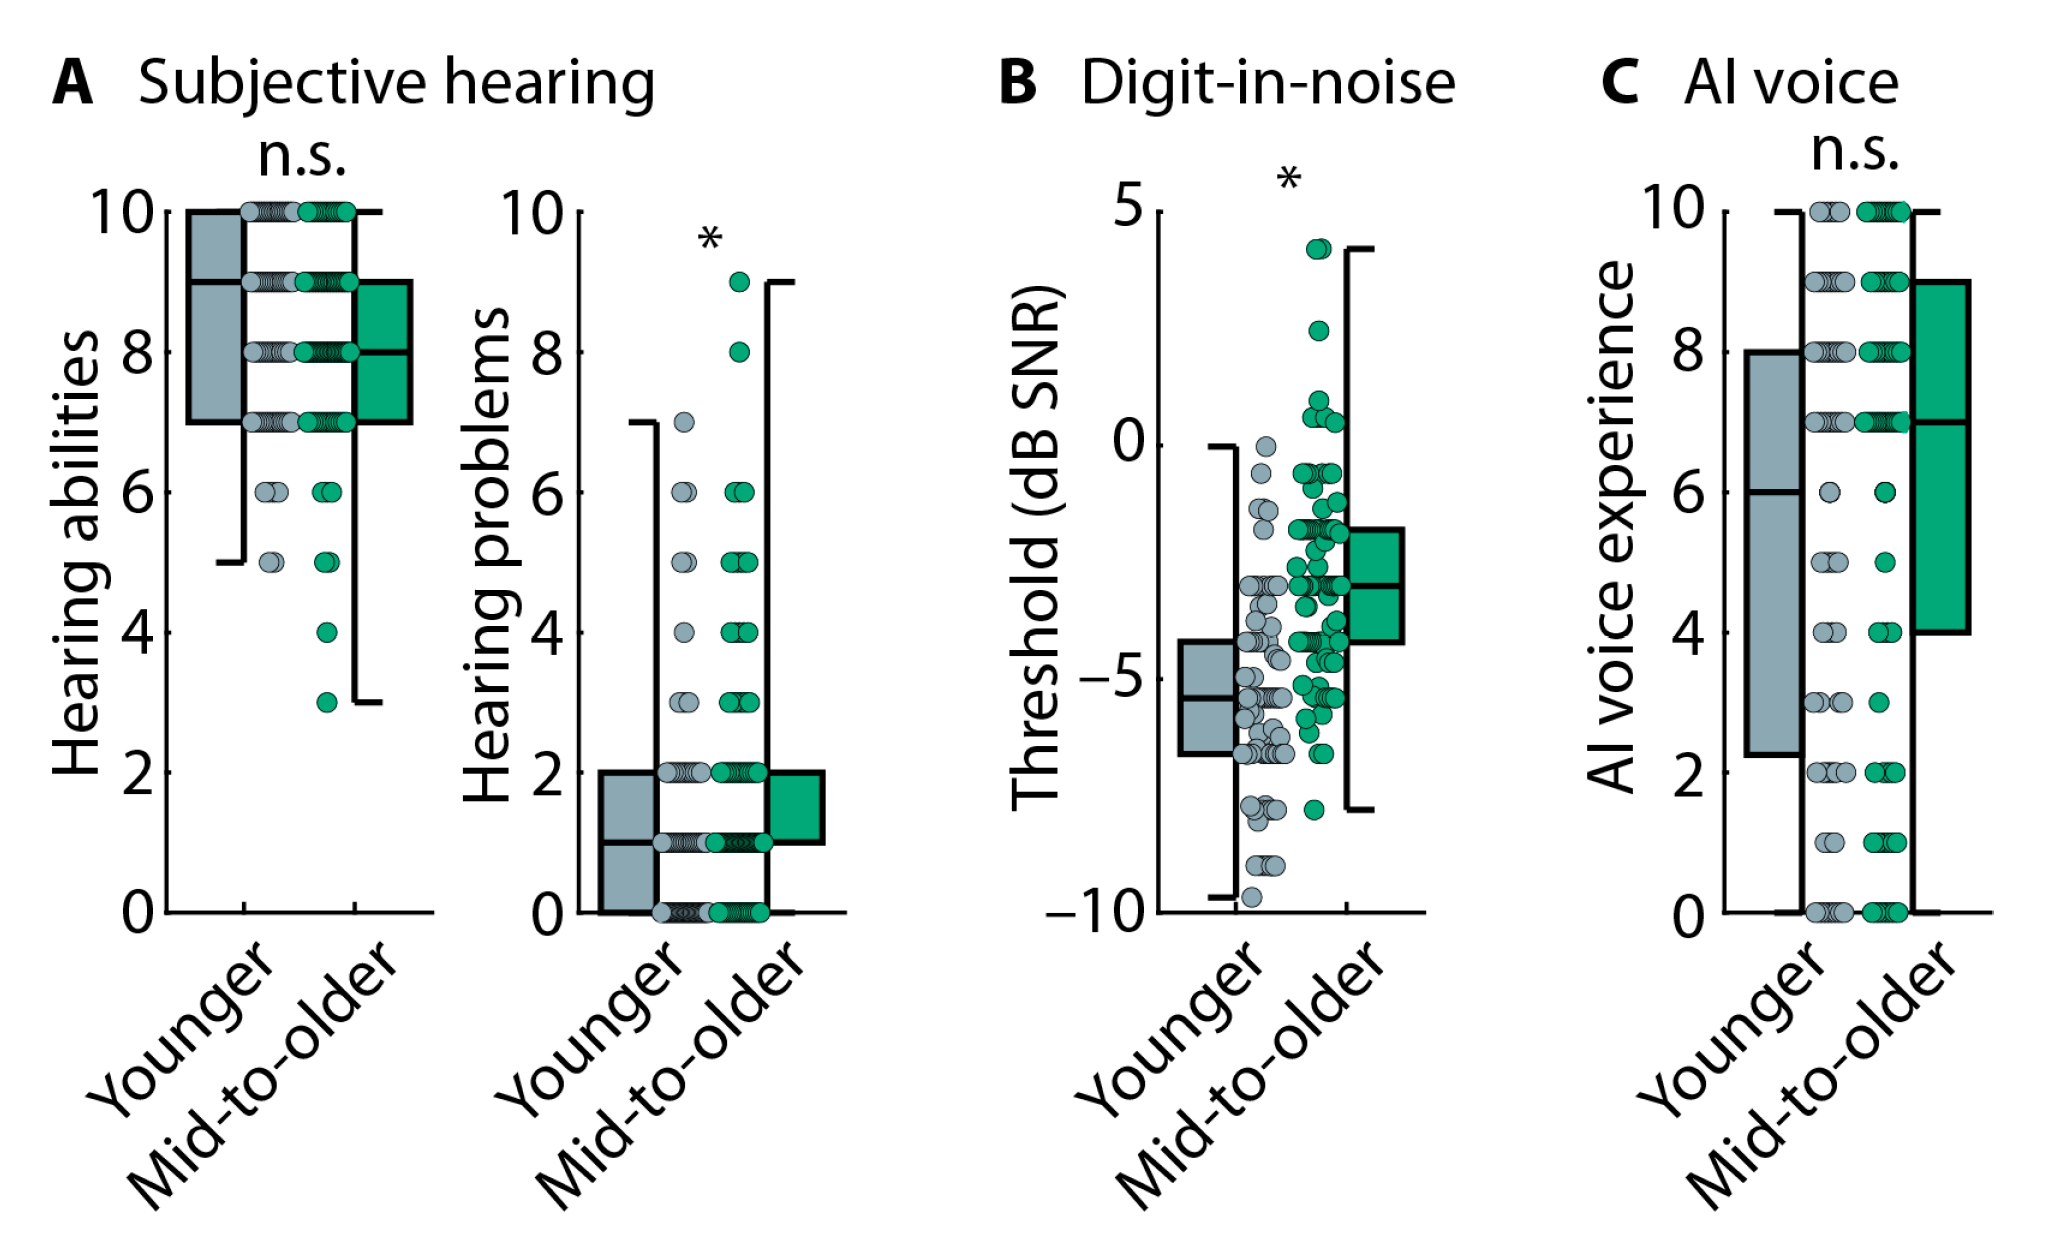
3.2.1. Hearing Abilities and Voice-AI Experience
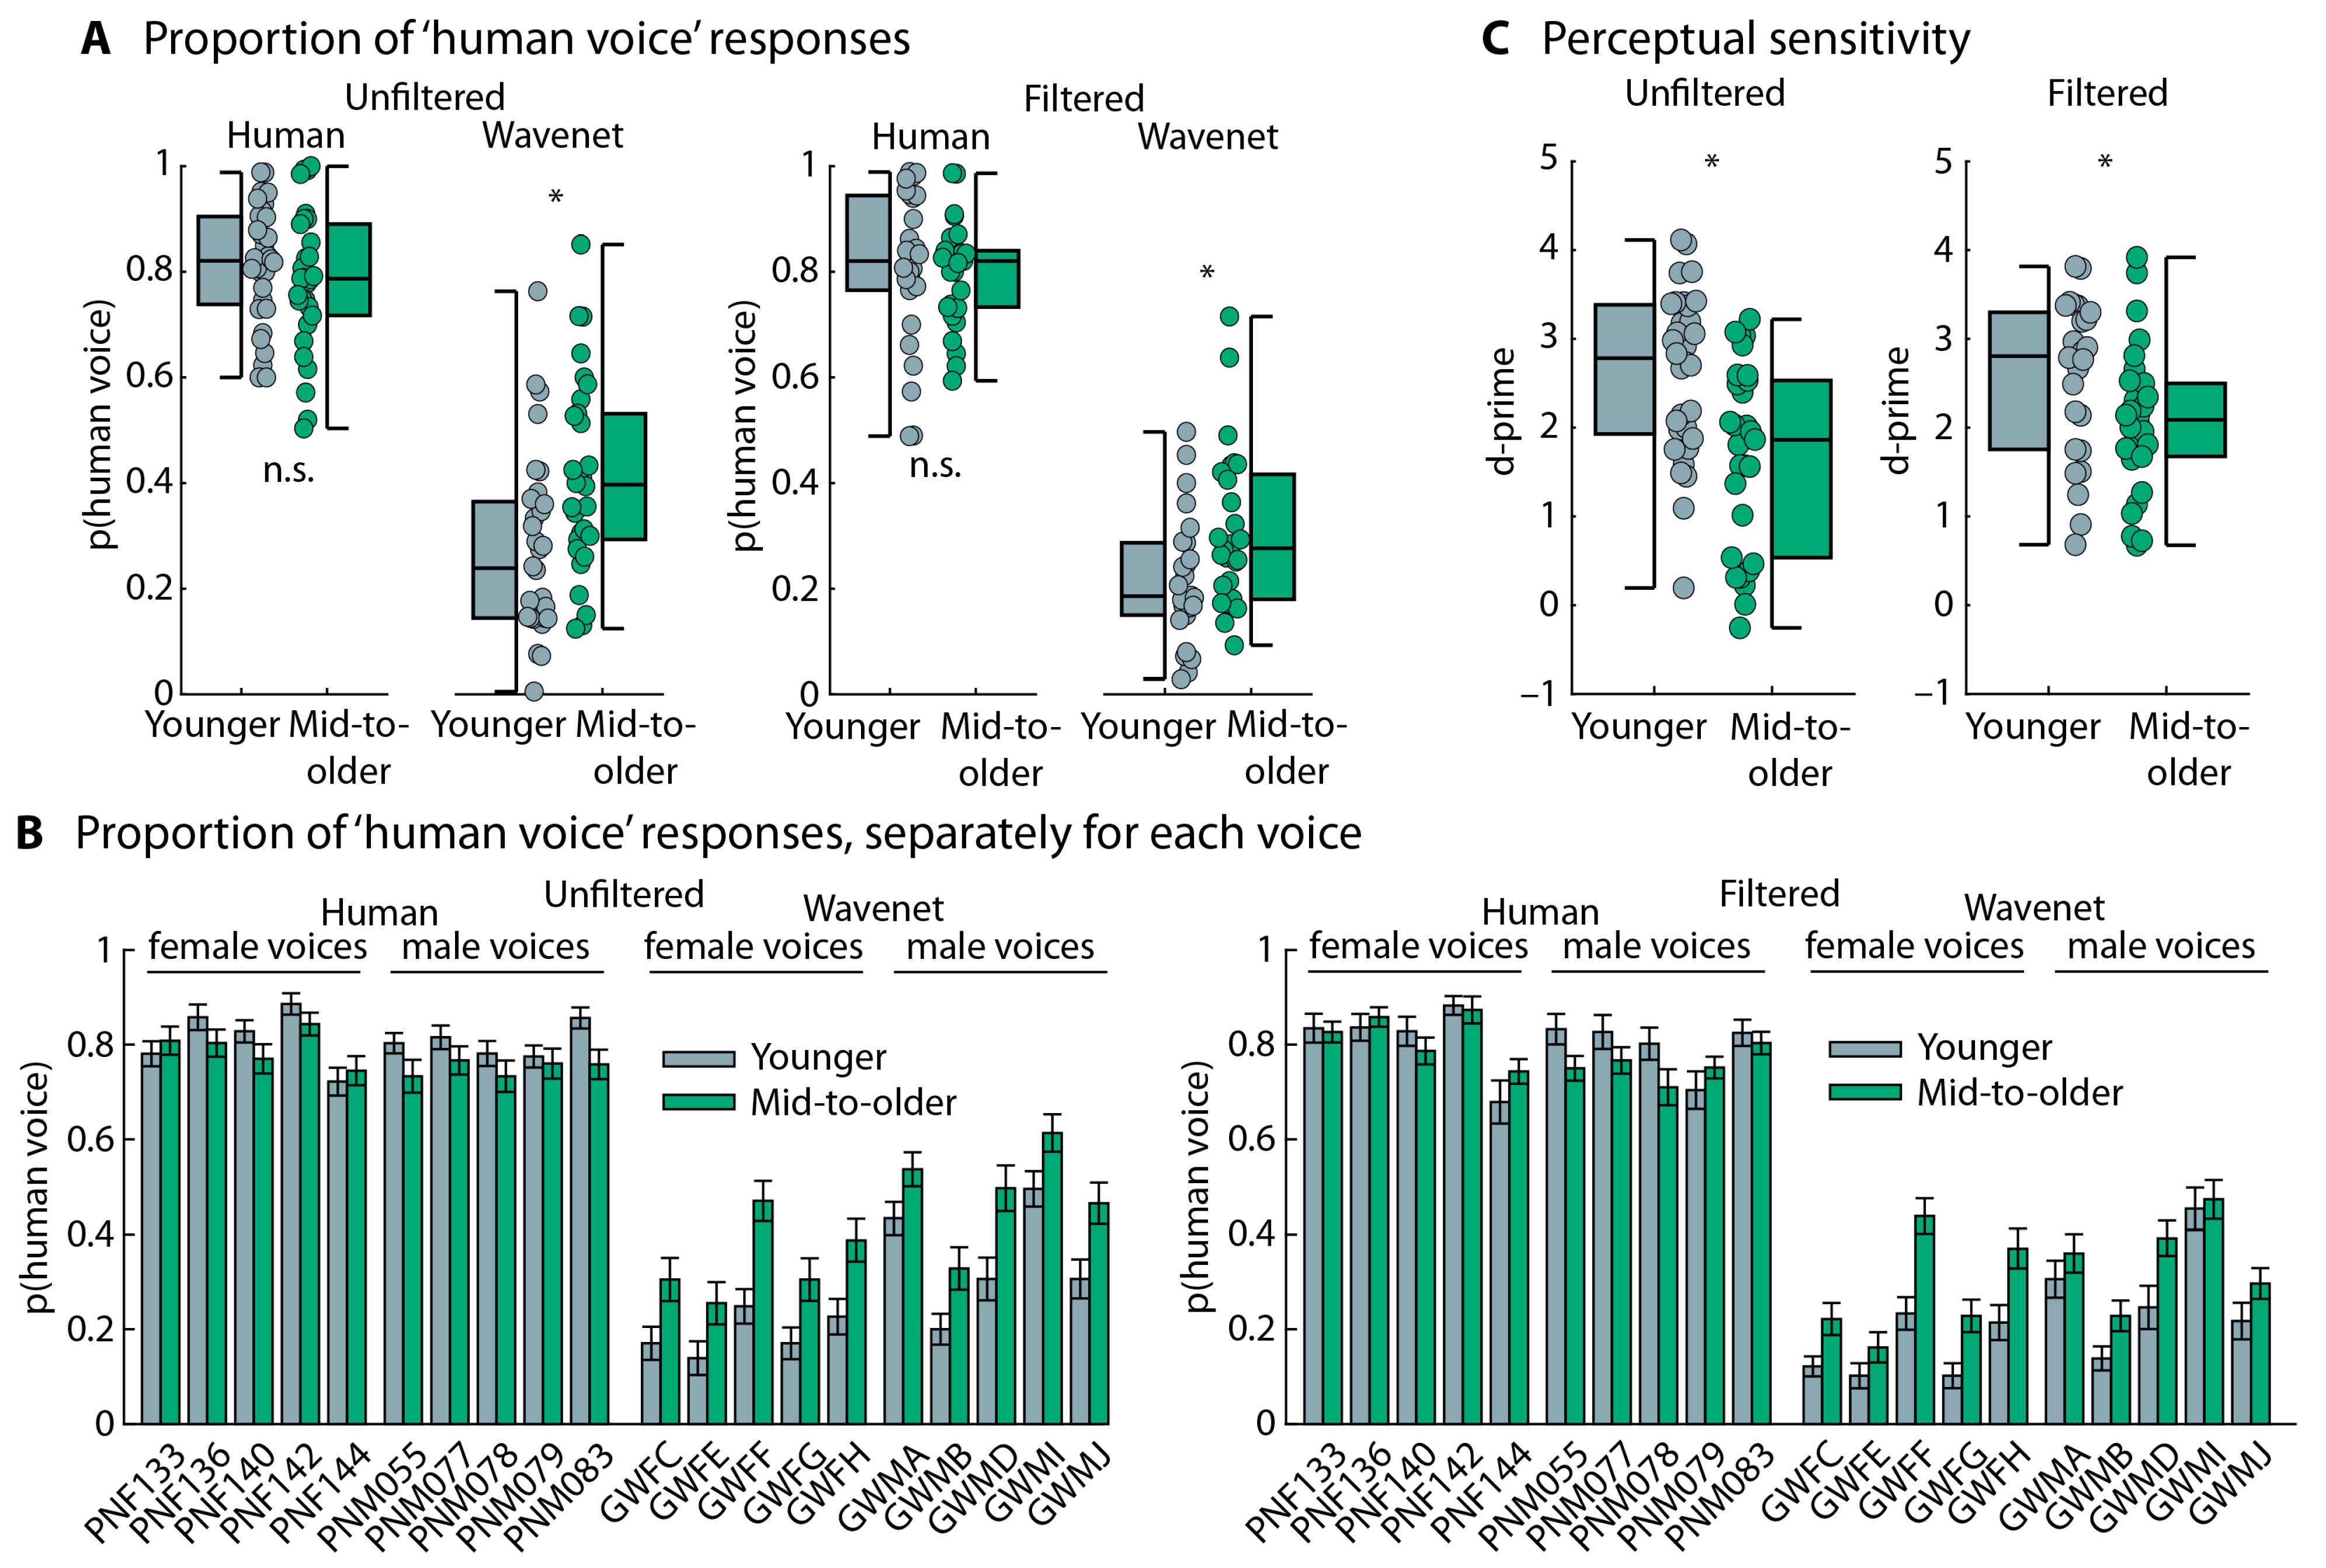
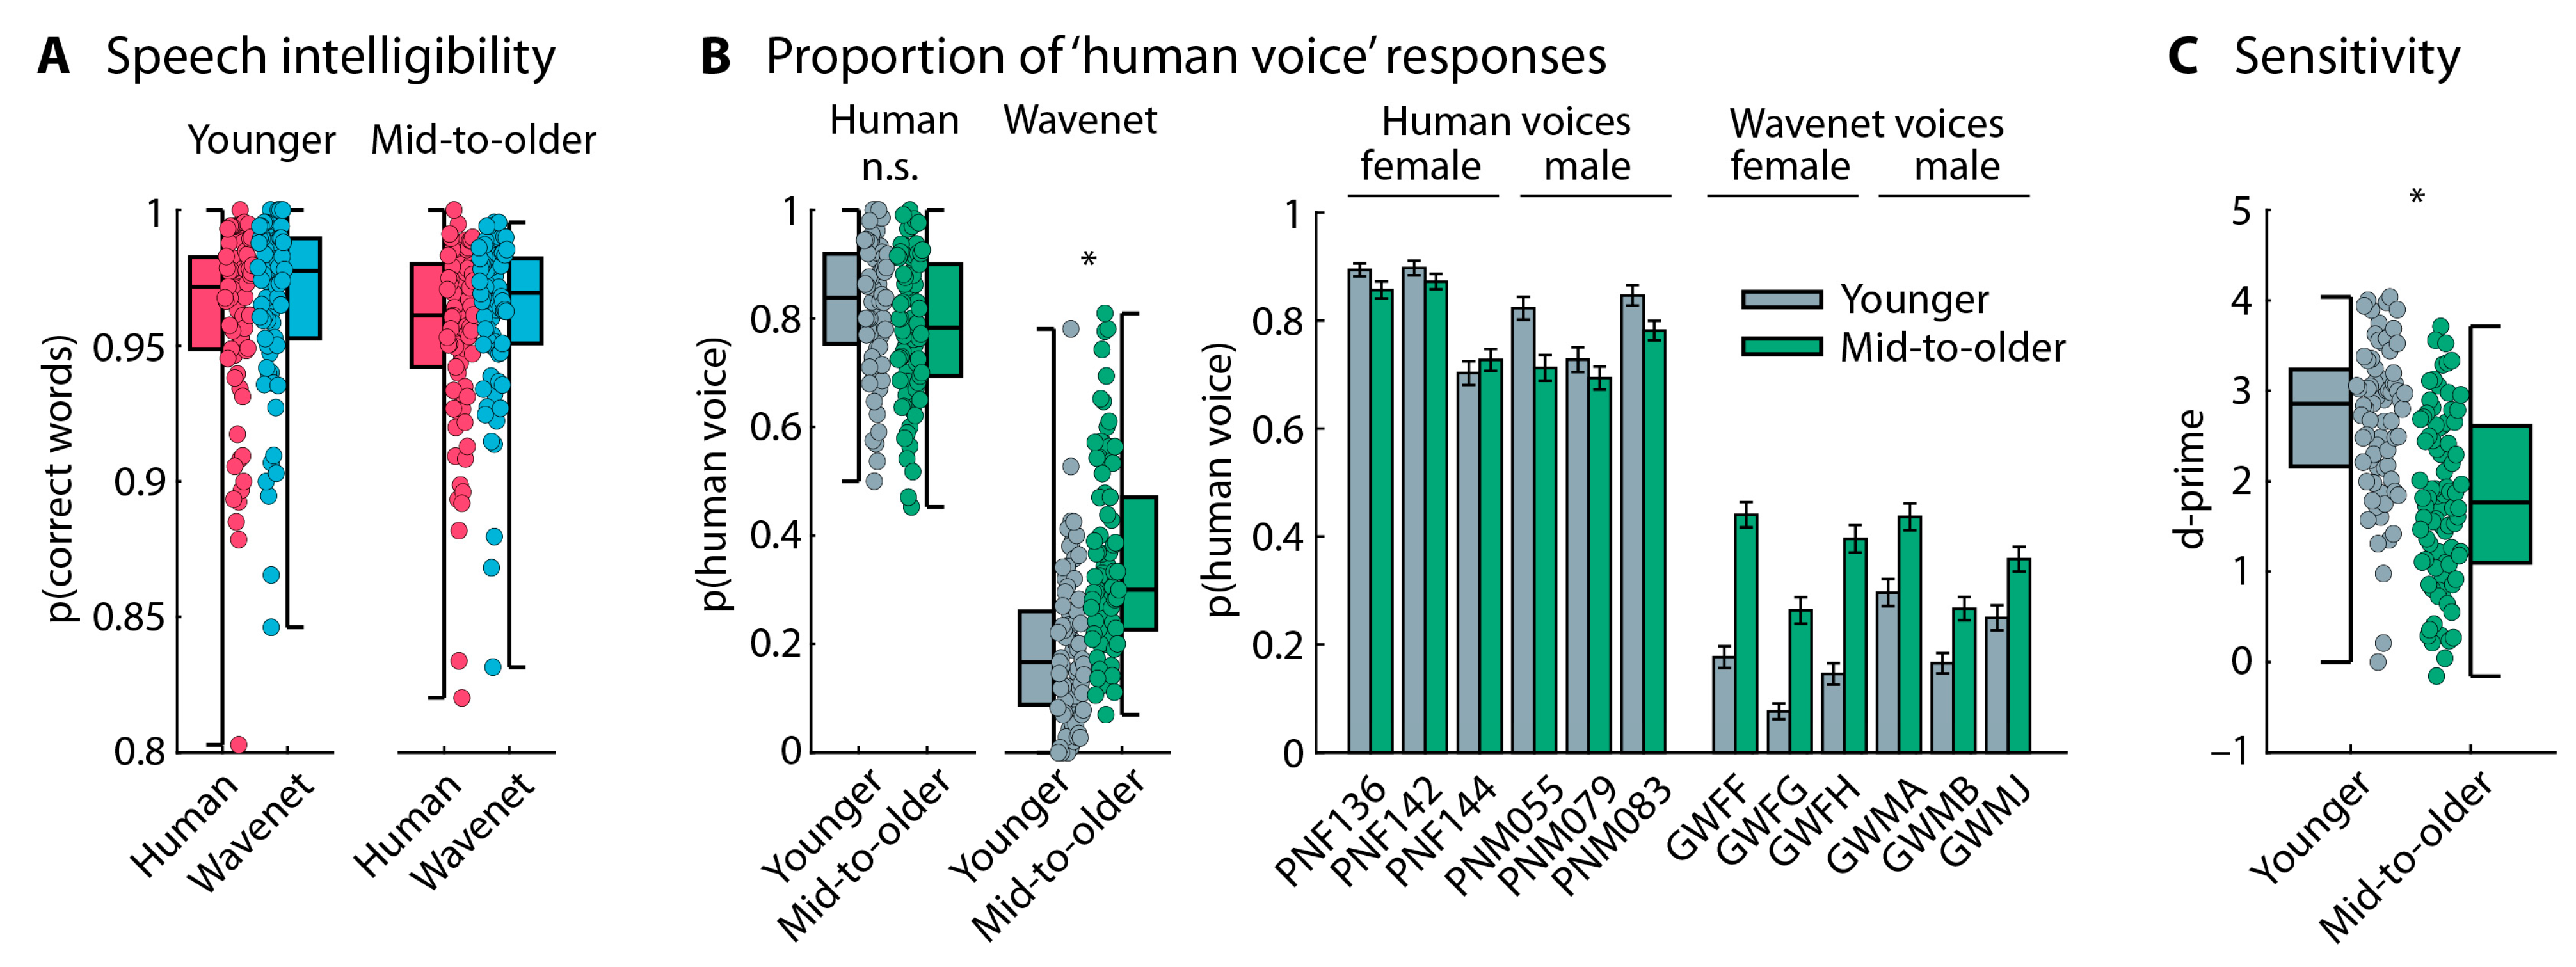
3.2.2. Speech-Type Categorization Task
3.2.3. Summary
4. Experiment 1 Follow-Up
4.1. Methods
4.1.1. Participants
4.1.2. Procedures
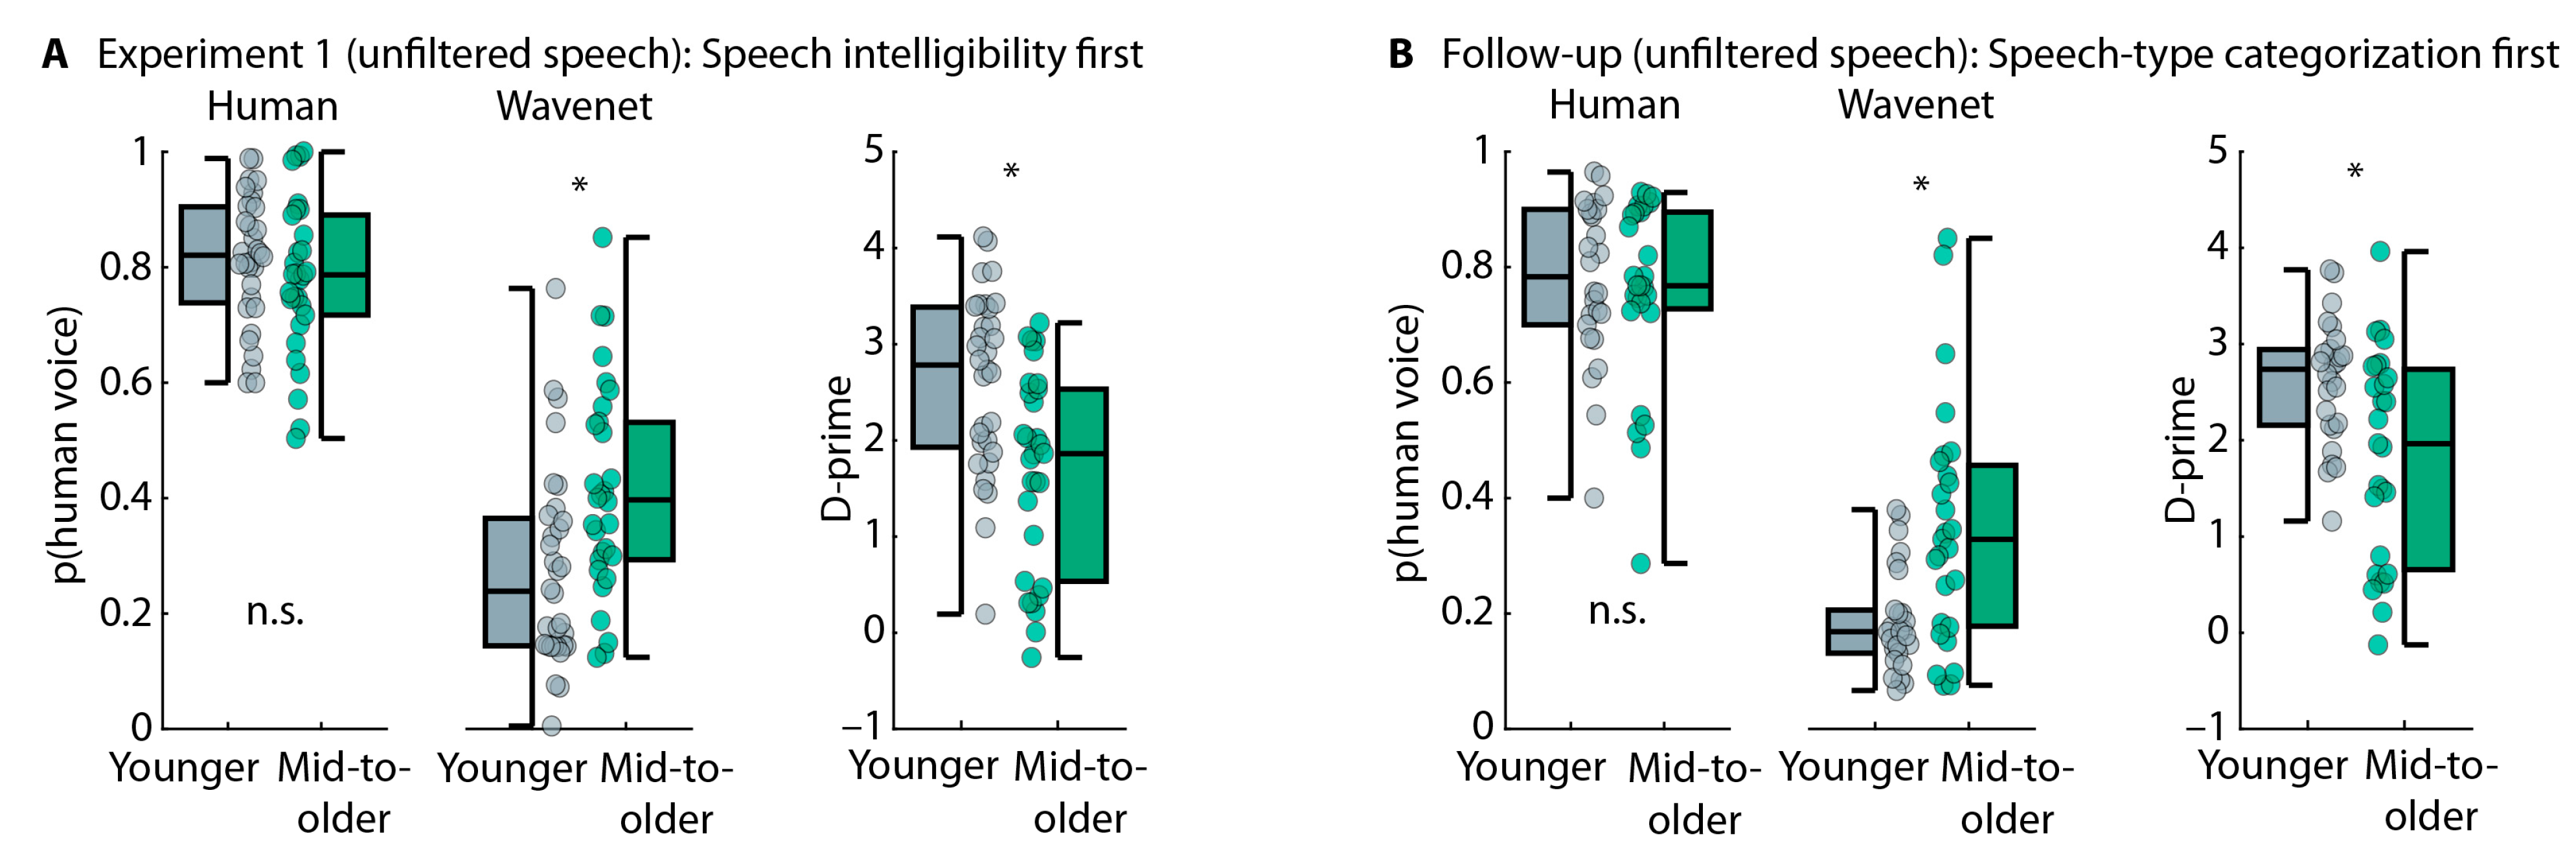
4.2. Results
5. Experiment 2
5.1. Methods
5.1.1. Participants
5.1.2. Speech-Type Categorization Task
5.1.3. Emotion-Categorization Task
5.1.4. Relationship Between Performance in Speech-Type and Emotion Categorization Tasks
5.2. Results
5.2.1. Hearing Abilities and Voice-AI Experience
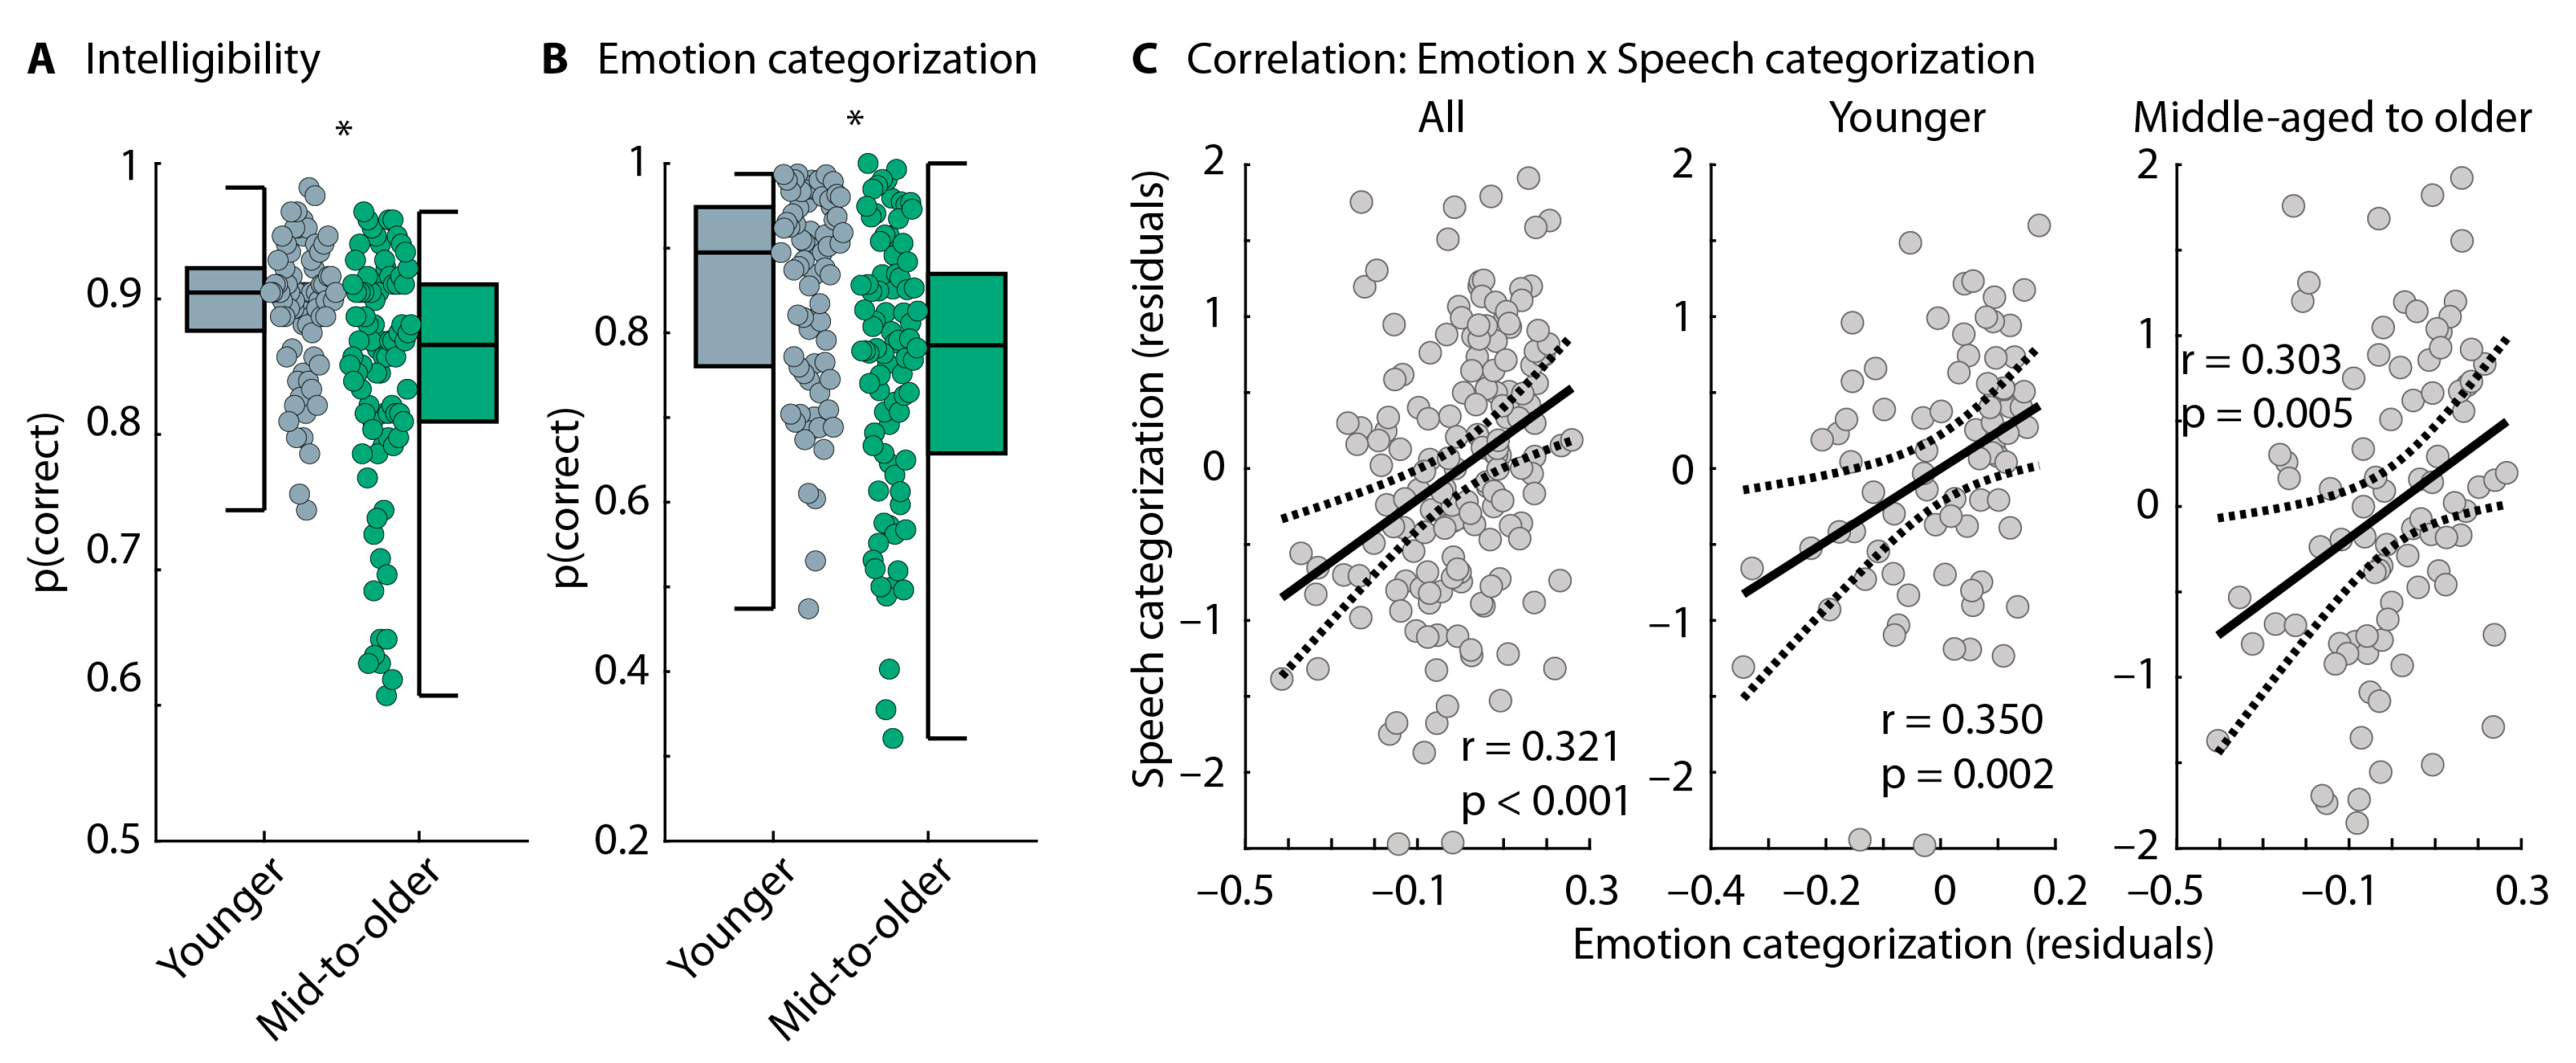
5.2.2. Speech-Categorization Task
5.2.3. Emotion-Categorization Task
5.2.4. Correlation Between Speech-Categorization Performance and Emotion-Categorization Performance
5.2.5. Summary
6. General Discussion
6.1. Older Adults Are Less Able to Identify Modern AI-Based Synthesized Speech
6.2. Hearing Loss Is Unlikely to Explain the Age-Related Reduction in AI Speech Identification
6.3. Age-Related Decline in Prosody Processing Is Associated with Reduced AI Speech Identification
7. Conclusions
Author Contributions
Funding
Institutional Review Board Statement
Informed Consent Statement
Data Availability Statement
Conflicts of Interest
References
- Haefner, N.; Wincent, J.; Parida, V.; Gassmann, O. Artificial intelligence and innovation management: A review, framework, and research agenda✰. Technol. Forecast. Soc. Chang. 2021, 162, 120392. [Google Scholar] [CrossRef]
- Frank, B.; Herbas-Torrico, B.; Schvaneveldt, S.J. The AI-extended consumer: Technology, consumer, country differences in the formation of demand for AI-empowered consumer products. Technol. Forecast. Soc. Chang. 2021, 172, 121018. [Google Scholar] [CrossRef]
- Bahoo, S.; Cucculelli, M.; Qamar, D. Artificial intelligence and corporate innovation: A review and research agenda. Technol. Forecast. Soc. Chang. 2023, 188, 122264. [Google Scholar] [CrossRef]
- Dengel, T. The Sound of the Future: The Coming Age of Voice Technology; Public Affairs: New York, NY, USA, 2023. [Google Scholar]
- van den Oord, A.; Dieleman, S.; Zen, H.; Simonyan, K.; Vinyals, O.; Graves, A.; Kalchbrenner, N.; Senior, A.; Kavukcuoglu, K. WaveNet: A Generative Model for Raw Audio. In Proceedings of the Proc. 9th ISCA Workshop on Speech Synthesis Workshop (SSW 9), Sunnyvale, CA, USA, 25–29 October 2016; p. 125. [Google Scholar]
- Cohn, M.; Zellou, G. Perception of concatenative vs. neural text-to-speech (TTS): Differences in intelligibility in noise and language attitudes. In Proceedings of the Interspeech, Shanghai, China, 25–29 October 2020; pp. 1733–1737. [Google Scholar]
- Cohn, M.; Raveh, E.; Predeck, K.; Gessinger, I.; Möbius, B.; Zellou, G. Differences in Gradient Emotion Perception: Human vs. Alexa Voices. In Proceedings of the Interspeech, Shanghai, China, 25 October 2020; pp. 1818–1822. [Google Scholar]
- Aoki, N.B.; Cohn, M.; Zellou, G. The clear speech intelligibility benefit for text-to-speech voices: Effects of speaking style and visual guise. JASA Express Lett. 2022, 2, 045204. [Google Scholar] [CrossRef] [PubMed]
- Govender, A.; Valentini-Botinhao, C.; King, S. Measuring the contribution to cognitive load of each predicted vocoder speech parameter in DNN-based speech synthesis. In Proceedings of the ISCA Speech Synthesis Workshop, Vienna, Austria, 20–22 September 2019; pp. 121–126. [Google Scholar]
- Govender, A.; Wagner, A.E.; King, S. Using pupil dilation to measure cognitive load when listening to text-to-speech in quiet and in noise. In Proceedings of the Interspeech, Graz, Austria, 15–19 September 2019; pp. 1551–1555. [Google Scholar]
- Dodd, N.; Cohn, M.; Zellou, G. Comparing alignment toward American, British, and Indian English text-to-speech (TTS) voices: Influence of social attitudes and talker guise. Front. Comput. Sci. 2023, 5, 1204211. [Google Scholar] [CrossRef]
- Cohn, M.; Segedin, B.F.; Zellou, G. Acoustic-phonetic properties of Siri- and human-directed speech. J. Phon. 2022, 90, 101123. [Google Scholar] [CrossRef]
- Cohn, M.; Zellou, G. Prosodic Differences in Human- and Alexa-Directed Speech, but Similar Local Intelligibility Adjustments. Front. Commun. 2021, 6, 675704. [Google Scholar] [CrossRef]
- Cohn, M.; Liang, K.-H.; Sarian, M.; Zellou, G.; Yu, Z. Speech Rate Adjustments in Conversations With an Amazon Alexa Socialbot. Front. Commun. 2021, 6, 671429. [Google Scholar] [CrossRef]
- Zellou, G.; Cohn, M.; Ferenc Segedin, B. Age- and Gender-Related Differences in Speech Alignment Toward Humans and Voice-AI. Front. Commun. 2021, 5, 600361. [Google Scholar] [CrossRef]
- Herrmann, B. The perception of artificial-intelligence (AI) based synthesized speech in younger and older adults. Int. J. Speech Technol. 2023, 26, 395–415. [Google Scholar] [CrossRef]
- Feder, K.; Michaud, D.; Ramage-Morin, P.; McNamee, J.; Beauregard, Y. Prevalence of hearing loss among Canadians aged 20 to 79: Audiometric results from the 2012/2013 Canadian Health Measures Survey. Health Rep. 2015, 26, 18–25. [Google Scholar] [PubMed]
- Cruickshanks, K.J.; Wiley, T.L.; Tweed, T.S.; Klein, B.E.K.; Klein, R.; Mares-Perlman, J.A.; Nondahl, D.M. Prevalence of Hearing Loss in Older Adults in Beaver Dam, Wisconsin. Am. J. Epidemiol. 1998, 148, 879–886. [Google Scholar] [CrossRef]
- Goman, A.M.; Lin, F.R. Prevalence of Hearing Loss by Severity in the United States. Am. J. Public Health 2016, 106, 1820–1822. [Google Scholar] [CrossRef] [PubMed]
- Pichora-Fuller, M.K.; Kramer, S.E.; Eckert, M.A.; Edwards, B.; Hornsby, B.W.Y.; Humes, L.E.; Lemke, U.; Lunner, T.; Matthen, M.; Mackersie, C.L.; et al. Hearing Impairment and Cognitive Energy: The Framework for Understanding Effortful Listening (FUEL). Ear Hear. 2016, 37 (Suppl. S1), 5S–27S. [Google Scholar] [CrossRef]
- Pichora-Fuller, M.K.; Schneider, B.A.; Daneman, M. How young and old adults listen to and remember speech in noise. J. Acoust. Soc. Am. 1995, 97, 593–608. [Google Scholar] [CrossRef]
- Herrmann, B.; Johnsrude, I.S. A Model of Listening Engagement (MoLE). Hear. Res. 2020, 397, 108016. [Google Scholar] [CrossRef]
- Arlinger, S. Negative consequences of uncorrected hearing loss—A review. Int. J. Audiol. 2003, 42, 17–20. [Google Scholar] [CrossRef]
- Plack, C.J. The Sense of Hearing; Psychology Press: New York, NY, USA, 2014. [Google Scholar]
- Herrmann, B.; Butler, B.E. Hearing Loss and Brain Plasticity: The Hyperactivity Phenomenon. Brain Struct. Funct. 2021, 226, 2019–2039. [Google Scholar] [CrossRef]
- Pichora-Fuller, M.K. Processing speed and timing in aging adults: Psychoacoustics, speech perception, and comprehension. Int. J. Audiol. 2003, 42, S59–S67. [Google Scholar] [CrossRef]
- Dubno, J.R.; Eckert, M.A.; Lee, F.-S.; Matthews, L.J.; Schmiedt, R.A. Classifying Human Audiometric Phenotypes of Age-Related Hearing Loss from Animal Models. J. Assoc. Res. Otolaryngol. 2013, 14, 687–701. [Google Scholar] [CrossRef] [PubMed]
- Helfer, K.S.; Jesse, A. Hearing and speech processing in midlife. Hear. Res. 2021, 402, 108097. [Google Scholar] [CrossRef]
- Lin, F.R.; Niparko, J.K.; Ferrucci, L. Hearing Loss Prevalence in the United States. Arch. Intern. Med. 2011, 171, 1851–1853. [Google Scholar] [CrossRef] [PubMed]
- Mitchell, R.L.C.; Kingston, R.A. Age-Related Decline in Emotional Prosody Discrimination. Exp. Psychol. 2014, 61, 215–223. [Google Scholar] [CrossRef] [PubMed]
- Ben-David, B.M.; Gal-Rosenblum, S.; van Lieshout, P.H.H.M.; Shakuf, V. Age-Related Differences in the Perception of Emotion in Spoken Language: The Relative Roles of Prosody and Semantics. J. Speech Lang. Hear. Res. 2019, 62, 1188–1202. [Google Scholar] [CrossRef] [PubMed]
- Allen, R.; Brosgole, L. Facial and Auditory Affect Recognition in Senile Geriatrics, the Normal Elderly and Young Adults. Int. J. Neurosci. 1993, 68, 33–42. [Google Scholar] [CrossRef] [PubMed]
- Cohen, E.S.; Brosgole, L. Visual and Auditory Affect Recognition in Senile and Normal Elderly Persons. Int. J. Neurosci. 1988, 43, 89–101. [Google Scholar] [CrossRef]
- Kiss, I.; Ennis, T. Age-Related Decline in Perception of Prosodic Affect. Appl. Neuropsychol. 2001, 8, 251–254. [Google Scholar] [CrossRef] [PubMed]
- Paulmann, S.; Pell, M.D.; Kotz, S.A. How aging affects the recognition of emotional speech. Brain Lang. 2008, 104, 262–269. [Google Scholar] [CrossRef]
- Dupuis, K.; Pichora-Fuller, M.K. Use of affective prosody by young and older adults. Psychol. Aging 2010, 25, 16–29. [Google Scholar] [CrossRef]
- Mitchell, R.L.C.; Kingston, R.A.; Barbosa Bouças, S.L. The specificity of age-related decline in interpretation of emotion cues from prosody. Psychol. Aging 2011, 26, 406–414. [Google Scholar] [CrossRef] [PubMed]
- Mitchell, R.L.C.; Kingston, R.A. Is Age-related Decline in Vocal Emotion Identification an Artefact of Labelling Cognitions? Int. J. Psychol. Stud. 2011, 3, 156–163. [Google Scholar] [CrossRef]
- Martzoukou, M.; Nasios, G.; Kosmidis, M.H.; Papadopoulou, D. Aging and the Perception of Affective and Linguistic Prosody. J. Psycholinguist. Res. 2022, 51, 1001–1021. [Google Scholar] [CrossRef]
- Lambrecht, L.; Kreifelts, B.; Wildgruber, D. Age-related decrease in recognition of emotional facial and prosodic expressions. Emotion 2012, 12, 529–539. [Google Scholar] [CrossRef] [PubMed]
- Lin, Y.; Xu, F.; Ye, X.; Zhang, H.; Ding, H.; Zhang, Y. Age and sex differences in emotion perception are influenced by emotional category and communication channel. Psychol. Aging 2024, 40, 17–31. [Google Scholar] [CrossRef]
- Dupuis, K.; Pichora-Fuller, M.K. Aging Affects Identification of Vocal Emotions in Semantically Neutral Sentences. J. Speech Lang. Hear. Res. 2015, 58, 1061–1076. [Google Scholar] [CrossRef] [PubMed]
- Orbelo, D.M.; Grim, M.A.; Talbott, R.E.; Ross, E.D. Impaired Comprehension of Affective Prosody in Elderly Subjects Is Not Predicted by Age-Related Hearing Loss or Age-Related Cognitive Decline. J. Geriatr. Psychiatry Neurol. 2005, 18, 25–32. [Google Scholar] [CrossRef] [PubMed]
- Dor, Y.I.; Algom, D.; Shakuf, V.; Ben-David, B.M. Age-Related Changes in the Perception of Emotions in Speech: Assessing Thresholds of Prosody and Semantics Recognition in Noise for Young and Older Adults. Front. Neurosci. 2022, 16, 846117. [Google Scholar] [CrossRef]
- Irino, T.; Hanatani, Y.; Kishida, K.; Naito, S.; Kawahara, H. Effects of age and hearing loss on speech emotion discrimination. Sci. Rep. 2024, 14, 18328. [Google Scholar] [CrossRef]
- Litman, L.; Robinson, J.; Abberbock, T. TurkPrime.com: A versatile crowdsourcing data acquisition platform for the behavioral sciences. Behav. Res. Methods 2017, 49, 433–442. [Google Scholar] [CrossRef]
- de Leeuw, J.R. jsPsych: A JavaScript library for creating behavioral experiments in a web browser. Behav. Res. Methods 2015, 47, 1–12. [Google Scholar] [CrossRef] [PubMed]
- Rosenthal, R.; Rubin, D.B. requivalent: A Simple Effect Size Indicator. Psychol. Methods 2003, 8, 492–496. [Google Scholar] [CrossRef]
- Smits, C.; Goverts, S.T.; Festen, J.M. The digits-in-noise test: Assessing auditory speech recognition abilities in noise. J. Acoust. Soc. Am. 2013, 133, 1693–1706. [Google Scholar] [CrossRef]
- Smits, C.; Kapteyn, T.S.; Houtgast, T. Development and validation of an automatic speech-in-noise screening test by telephone. Int. J. Audiol. 2004, 43, 15–28. [Google Scholar] [CrossRef]
- Koole, A.; Nagtegaal, A.P.; Homans, N.C.; Hofman, A.; Baatenburg de Jong, R.J.; Goedegebure, A. Using the Digits-In-Noise Test to Estimate Age-Related Hearing Loss. Ear Hear 2016, 37, 508–513. [Google Scholar] [CrossRef] [PubMed]
- Potgieter, J.M.; Swanepoel, W.; Smits, C. Evaluating a smartphone digits-in-noise test as part of the audiometric test battery. S. Afr. J. Commun. Disord. 2018, 65, e1–e6. [Google Scholar] [CrossRef] [PubMed]
- De Sousa, K.C.; Swanepoel, D.W.; Moore, D.R.; Myburgh, H.C.; Smits, C. Improving Sensitivity of the Digits-In-Noise Test Using Antiphasic Stimuli. Ear Hear 2020, 41, 442–450. [Google Scholar] [CrossRef]
- Smits, C.; Kramer, S.E.; Houtgast, T. Speech Reception Thresholds in Noise and Self-Reported Hearing Disability in a General Adult Population. Ear Hear 2006, 27, 538–549. [Google Scholar] [CrossRef] [PubMed]
- Smits, C.; Houtgast, T. Results From the Dutch Speech-in-Noise Screening Test by Telephone. Ear Hear 2005, 26, 89–95. [Google Scholar] [CrossRef]
- Brown, L.; Mahomed-Asmail, F.; De Sousa, K.C.; Swanepoel, D.W. Performance and Reliability of a Smartphone Digits-in-Noise Test in the Sound Field. Am. J. Audiol. 2019, 28, 736–741. [Google Scholar] [CrossRef]
- Herrmann, B. Leveraging Natural Language Processing models to automate speech-intelligibility scoring. Speech Lang. Hear 2025, in press. [Google Scholar] [CrossRef]
- Bilger, R.C. Manual for the Clinical Use of the Revised SPIN Test; The University of Illinois: Champaign, IL, USA, 1984. [Google Scholar]
- Borrie, S.A.; Barrett, T.S.; Yoho, S.E. Autoscore: An open-source automated tool for scoring listener perception of speech. J. Acoust. Soc. Am. 2019, 145, 392–399. [Google Scholar] [CrossRef]
- JASP. JASP [Computer Software], 2023. Available online: https://jasp-stats.org/download/ (accessed on 15 January 2024).
- Herrmann, B.; Maess, B.; Johnsrude, I.S. A Neural Signature of Regularity in Sound is Reduced in Older Adults. Neurobiol. Aging 2022, 109, 1–10. [Google Scholar] [CrossRef]
- Presacco, A.; Simon, J.Z.; Anderson, S. Effect of informational content of noise on speech representation in the aging midbrain and cortex. J. Neurophysiol. 2016, 116, 2356–2367. [Google Scholar] [CrossRef] [PubMed]
- Eyal, P.; David, R.; Andrew, G.; Zak, E.; Ekaterina, D. Data quality of platforms and panels for online behavioral research. Behav. Res. Methods 2021, 54, 1643–1662. [Google Scholar] [CrossRef]
- Kennedy, R.; Clifford, S.; Burleigh, T.; Waggoner, P.D.; Jewell, R.; Winter, N.J.G. The shape of and solutions to the MTurk quality crisis. Political Sci. Res. Methods 2020, 8, 614–629. [Google Scholar] [CrossRef]
- Chmielewski, M.; Kucker, S.C. An MTurk Crisis? Shifts in Data Quality and the Impact on Study Results. Soc. Psychol. Personal. Sci. 2020, 11, 464–473. [Google Scholar] [CrossRef]
- Agley, J.; Xiao, Y.; Nolan, R.; Golzarri-Arroyo, L. Quality control questions on Amazon’s Mechanical Turk (MTurk): A randomized trial of impact on the USAUDIT, PHQ-9, and GAD-7. Behav. Res. Methods 2022, 54, 885–897. [Google Scholar] [CrossRef] [PubMed]
- Thomas, K.A.; Clifford, S. Validity and Mechanical Turk: An assessment of exclusion methods and interactive experiments. Comput. Hum. Behav. 2017, 77, 184–197. [Google Scholar] [CrossRef]
- Berinsky, A.J.; Margolis, M.F.; Sances, M.W. Separating the Shirkers from the Workers? Making Sure Respondents Pay Attention on Self-Administered Surveys. Am. J. Political Sci. 2014, 58, 739–753. [Google Scholar] [CrossRef]
- Buchanan, E.M.; Scofield, J.E. Methods to detect low quality data and its implication for psychological research. Behav. Res. Methods 2018, 50, 2586–2596. [Google Scholar] [CrossRef]
- Gosling, S.D.; Vazire, S.; Srivastava, S.; John, O.P. Should We Trust Web-Based Studies? A Comparative Analysis of Six Preconceptions About Internet Questionnaires. Am. Psychol. 2004, 59, 93–104. [Google Scholar] [CrossRef] [PubMed]
- Rodd, J.M. Moving experimental psychology online: How to obtain high quality data when we can’t see our participants. J. Mem. Lang. 2024, 134, 104472. [Google Scholar] [CrossRef]
- Irsik, V.C.; Johnsrude, I.S.; Herrmann, B. Age-related deficits in dip-listening evident for isolated sentences but not for spoken stories. Sci. Rep. 2022, 12, 5898. [Google Scholar] [CrossRef] [PubMed]
- Panfili, L.M.; Haywood, J.; McCloy, D.R.; Souza, P.E.; Wright, R.A. The UW/NU Corpus, Version 2.0. Available online: https://depts.washington.edu/phonlab/projects/uwnu.php (accessed on 1 May 2022).
- McCloy, D.R.; Panfili, L.; John, C.; Winn, M.; Wright, R.A. Gender, the individual, and intelligibility. In Proceedings of the 176th Meeting of the Acoustical Society of America, Victoria, BC, Canada, 1 September 2018. [Google Scholar]
- Boersma, P. Praat, a system for doing phonetics by computer. Glot Int. 2001, 5, 341–345. [Google Scholar]
- McDermott, J.H.; Simoncelli, E.P. Sound Texture Perception via Statistics of the Auditory Periphery: Evidence from Sound Synthesis. Neuron 2011, 71, 926–940. [Google Scholar] [CrossRef]
- Moore, B.C.J. Cochlear Hearing Loss: Physiological, Psychological and Technical Issues; John Wiley & Sons, Ltd.: West Sussex, UK, 2007. [Google Scholar]
- Macmillan, N.A.; Creelman, C.D. Detection Theory: A User’s Guide; Psychology Press: New York, NJ, USA, 2004. [Google Scholar]
- Clapp, W.C.; Rubens, M.T.; Sabharwal, J.; Gazzaley, A. Deficit in switching between functional brain networks underlies the impact of multitasking on working memory in older adults. Proc. Natl. Acad. Sci. USA 2011, 108, 7212–7217. [Google Scholar] [CrossRef] [PubMed]
- Kray, J.; Lindenberger, U. Adult age differences in task switching. Psychol. Aging 2000, 15, 126–147. [Google Scholar] [CrossRef]
- O’Hanlon, L.; Kemper, S.; Wilcox, K.A. Aging, encoding, and word retrieval: Distinguishing phonological and memory processes. Exp. Aging Res. 2005, 31, 149–171. [Google Scholar] [CrossRef] [PubMed]
- Dupuis, K.; Pichora-Fuller, M.K. Intelligibility of Emotional Speech in Younger and Older Adults. Ear Hear. 2014, 35, 695–707. [Google Scholar] [CrossRef]
- Dupuis, K.; Pichora-Fuller, M.K. Recognition of emotional speech for younger and older talkers: Behavioural findings from the Toronto Emotional Speech Set. Can. Acoust. 2011, 39, 182–183. [Google Scholar]
- Gelfand, S.A. Essentials of Audiology; Thieme: New York, NY, USA, 2009. [Google Scholar]
- Tillman, T.W.; Carhart, R. An expanded test for speech discrimination utilizing CNC monosyllabic words. Northwestern University Auditory Test No. 6. SAM-TR-66-55. Tech. Rep. SAM-TR 1966, 1–12. [Google Scholar] [CrossRef]
- Mai, K.T.; Bray, S.; Davies, T.; Griffin, L.D. Warning: Humans cannot reliably detect speech deepfakes. PLoS ONE 2023, 18, e0285333. [Google Scholar] [CrossRef] [PubMed]
- Herrmann, B.; Buckland, C.; Johnsrude, I.S. Neural signatures of temporal regularity processing in sounds differ between younger and older adults. Neurobiol. Aging 2019, 83, 73–85. [Google Scholar] [CrossRef] [PubMed]
- Harris, K.C.; Mills, J.H.; He, N.-J.; Dubno, J.R. Age-related differences in sensitivity to small changes in frequency assessed with cortical evoked potentials. Hear. Res. 2008, 243, 47–56. [Google Scholar] [CrossRef] [PubMed]
- Larsby, B.; Hällgren, M.; Lyxell, B.; Arlinger, S. Cognitive performance and perceived effort in speech processing tasks: Effects of different noise backgrounds in normal-hearing and hearing-impaired subjects. Int. J. Audiol. 2005, 44, 131–143. [Google Scholar] [CrossRef] [PubMed]
- Presacco, A.; Simon, J.Z.; Anderson, S. Evidence of degraded representation of speech in noise, in the aging midbrain and cortex. J. Neurophysiol. 2016, 116, 2346–2355. [Google Scholar] [CrossRef] [PubMed]
- Masalski, M.; Adamczyk, M.; Morawski, K. Optimization of the Speech Test Material in a Group of Hearing Impaired Subjects: A Feasibility Study for Multilingual Digit Triplet Test Development. Audiol. Res. 2021, 11, 32. [Google Scholar] [CrossRef] [PubMed]
- Cortes, D.S.; Tornberg, C.; Bänziger, T.; Elfenbein, H.A.; Fischer, H.; Laukka, P. Effects of aging on emotion recognition from dynamic multimodal expressions and vocalizations. Sci. Rep. 2021, 11, 2647. [Google Scholar] [CrossRef] [PubMed]
- Lin, Y.; Ye, X.; Zhang, H.; Xu, F.; Zhang, J.; Ding, H.; Zhang, Y. Category-Sensitive Age-Related Shifts Between Prosodic and Semantic Dominance in Emotion Perception Linked to Cognitive Capacities. J. Speech Lang. Hear. Res. 2024, 67, 4829–4849. [Google Scholar] [CrossRef]
- Fan, X.; Tang, E.; Zhang, M.; Lin, Y.; Ding, H.; Zhang, Y. Decline of Affective Prosody Recognition With a Positivity Bias Among Older Adults: A Systematic Review and Meta-Analysis. J. Speech Lang. Hear. Res. 2024, 67, 3862–3879. [Google Scholar] [CrossRef]
- Lausen, A.; Hammerschmidt, K. Emotion recognition and confidence ratings predicted by vocal stimulus type and prosodic parameters. Humanit. Soc. Sci. Commun. 2020, 7, 2. [Google Scholar] [CrossRef]
Disclaimer/Publisher’s Note: The statements, opinions and data contained in all publications are solely those of the individual author(s) and contributor(s) and not of MDPI and/or the editor(s). MDPI and/or the editor(s) disclaim responsibility for any injury to people or property resulting from any ideas, methods, instructions or products referred to in the content. |
© 2025 by the authors. Licensee MDPI, Basel, Switzerland. This article is an open access article distributed under the terms and conditions of the Creative Commons Attribution (CC BY) license (https://creativecommons.org/licenses/by/4.0/).
Share and Cite
Herrmann, B.; Cui, M.E. Impaired Prosodic Processing but Not Hearing Function Is Associated with an Age-Related Reduction in AI Speech Recognition. Audiol. Res. 2025, 15, 14. https://doi.org/10.3390/audiolres15010014
Herrmann B, Cui ME. Impaired Prosodic Processing but Not Hearing Function Is Associated with an Age-Related Reduction in AI Speech Recognition. Audiology Research. 2025; 15(1):14. https://doi.org/10.3390/audiolres15010014
Chicago/Turabian StyleHerrmann, Björn, and Mo Eric Cui. 2025. "Impaired Prosodic Processing but Not Hearing Function Is Associated with an Age-Related Reduction in AI Speech Recognition" Audiology Research 15, no. 1: 14. https://doi.org/10.3390/audiolres15010014
APA StyleHerrmann, B., & Cui, M. E. (2025). Impaired Prosodic Processing but Not Hearing Function Is Associated with an Age-Related Reduction in AI Speech Recognition. Audiology Research, 15(1), 14. https://doi.org/10.3390/audiolres15010014