
Auditory Profile-Based Hearing Aid Fitting: Self-Reported Benefit for First-Time Hearing Aid Users

 ,
,  , , , , and
Abstract
1. Introduction
2. Materials and Methods
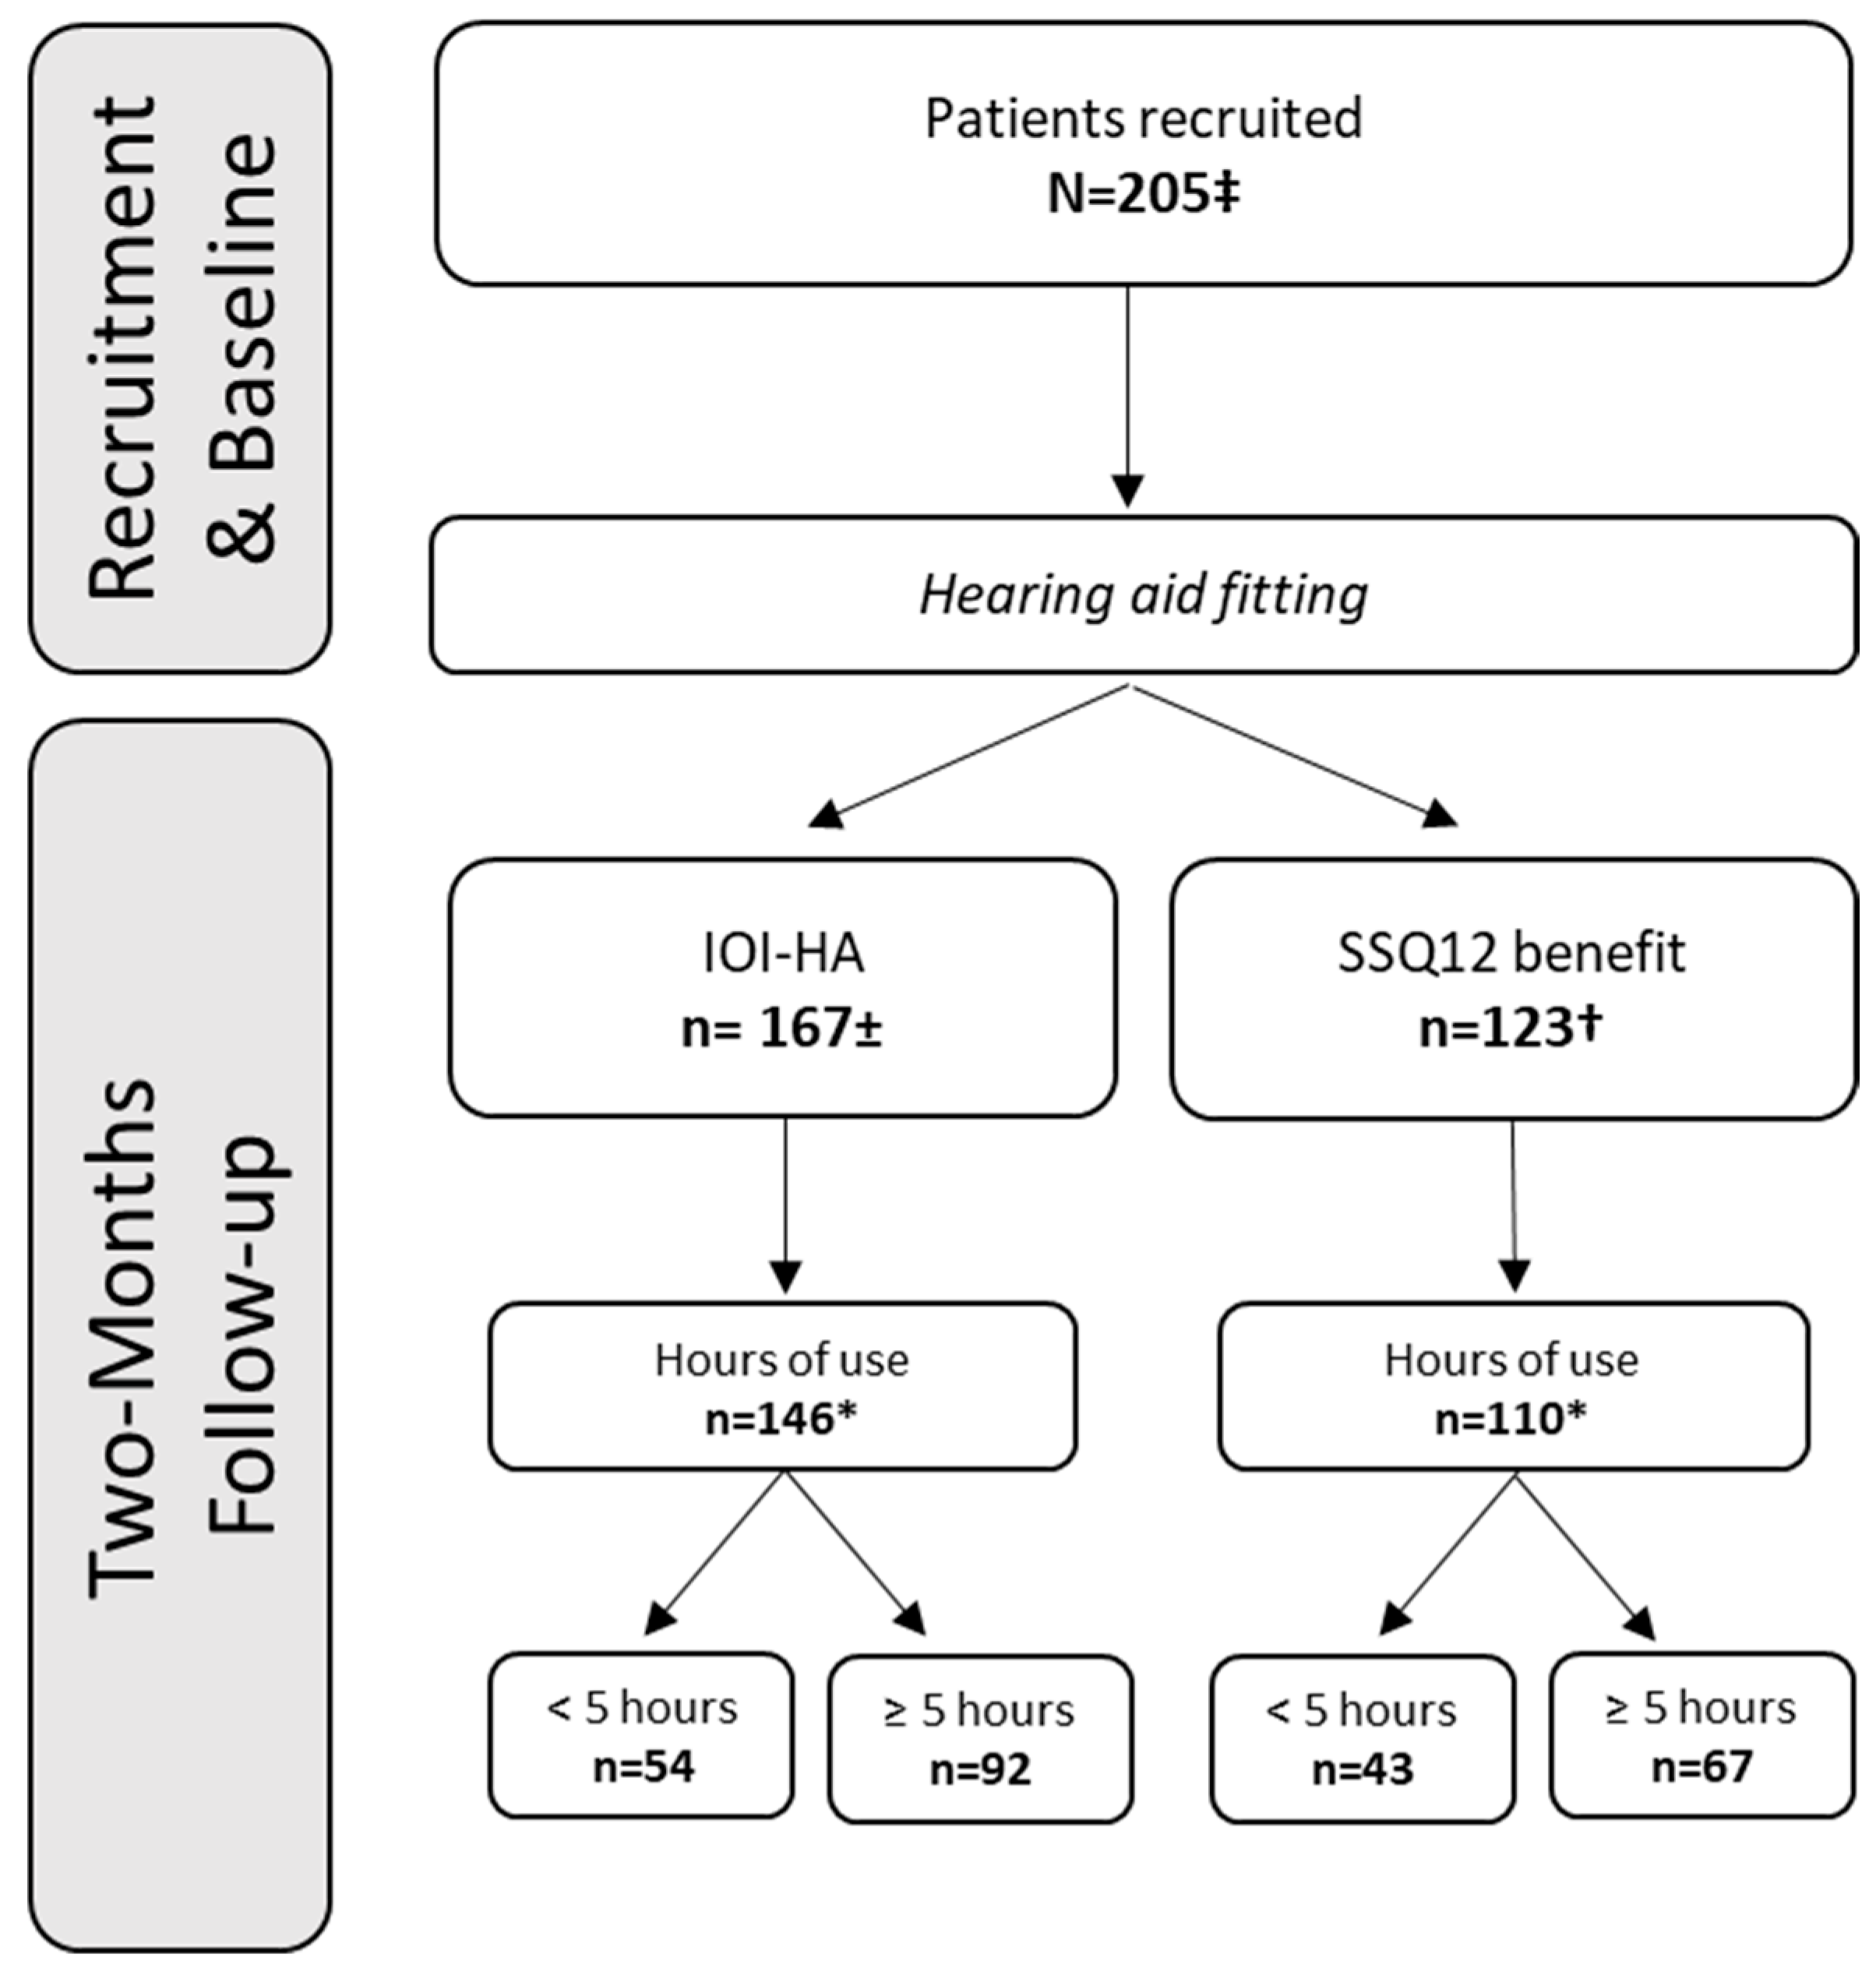
2.1. Participants
2.2. Test Protocol
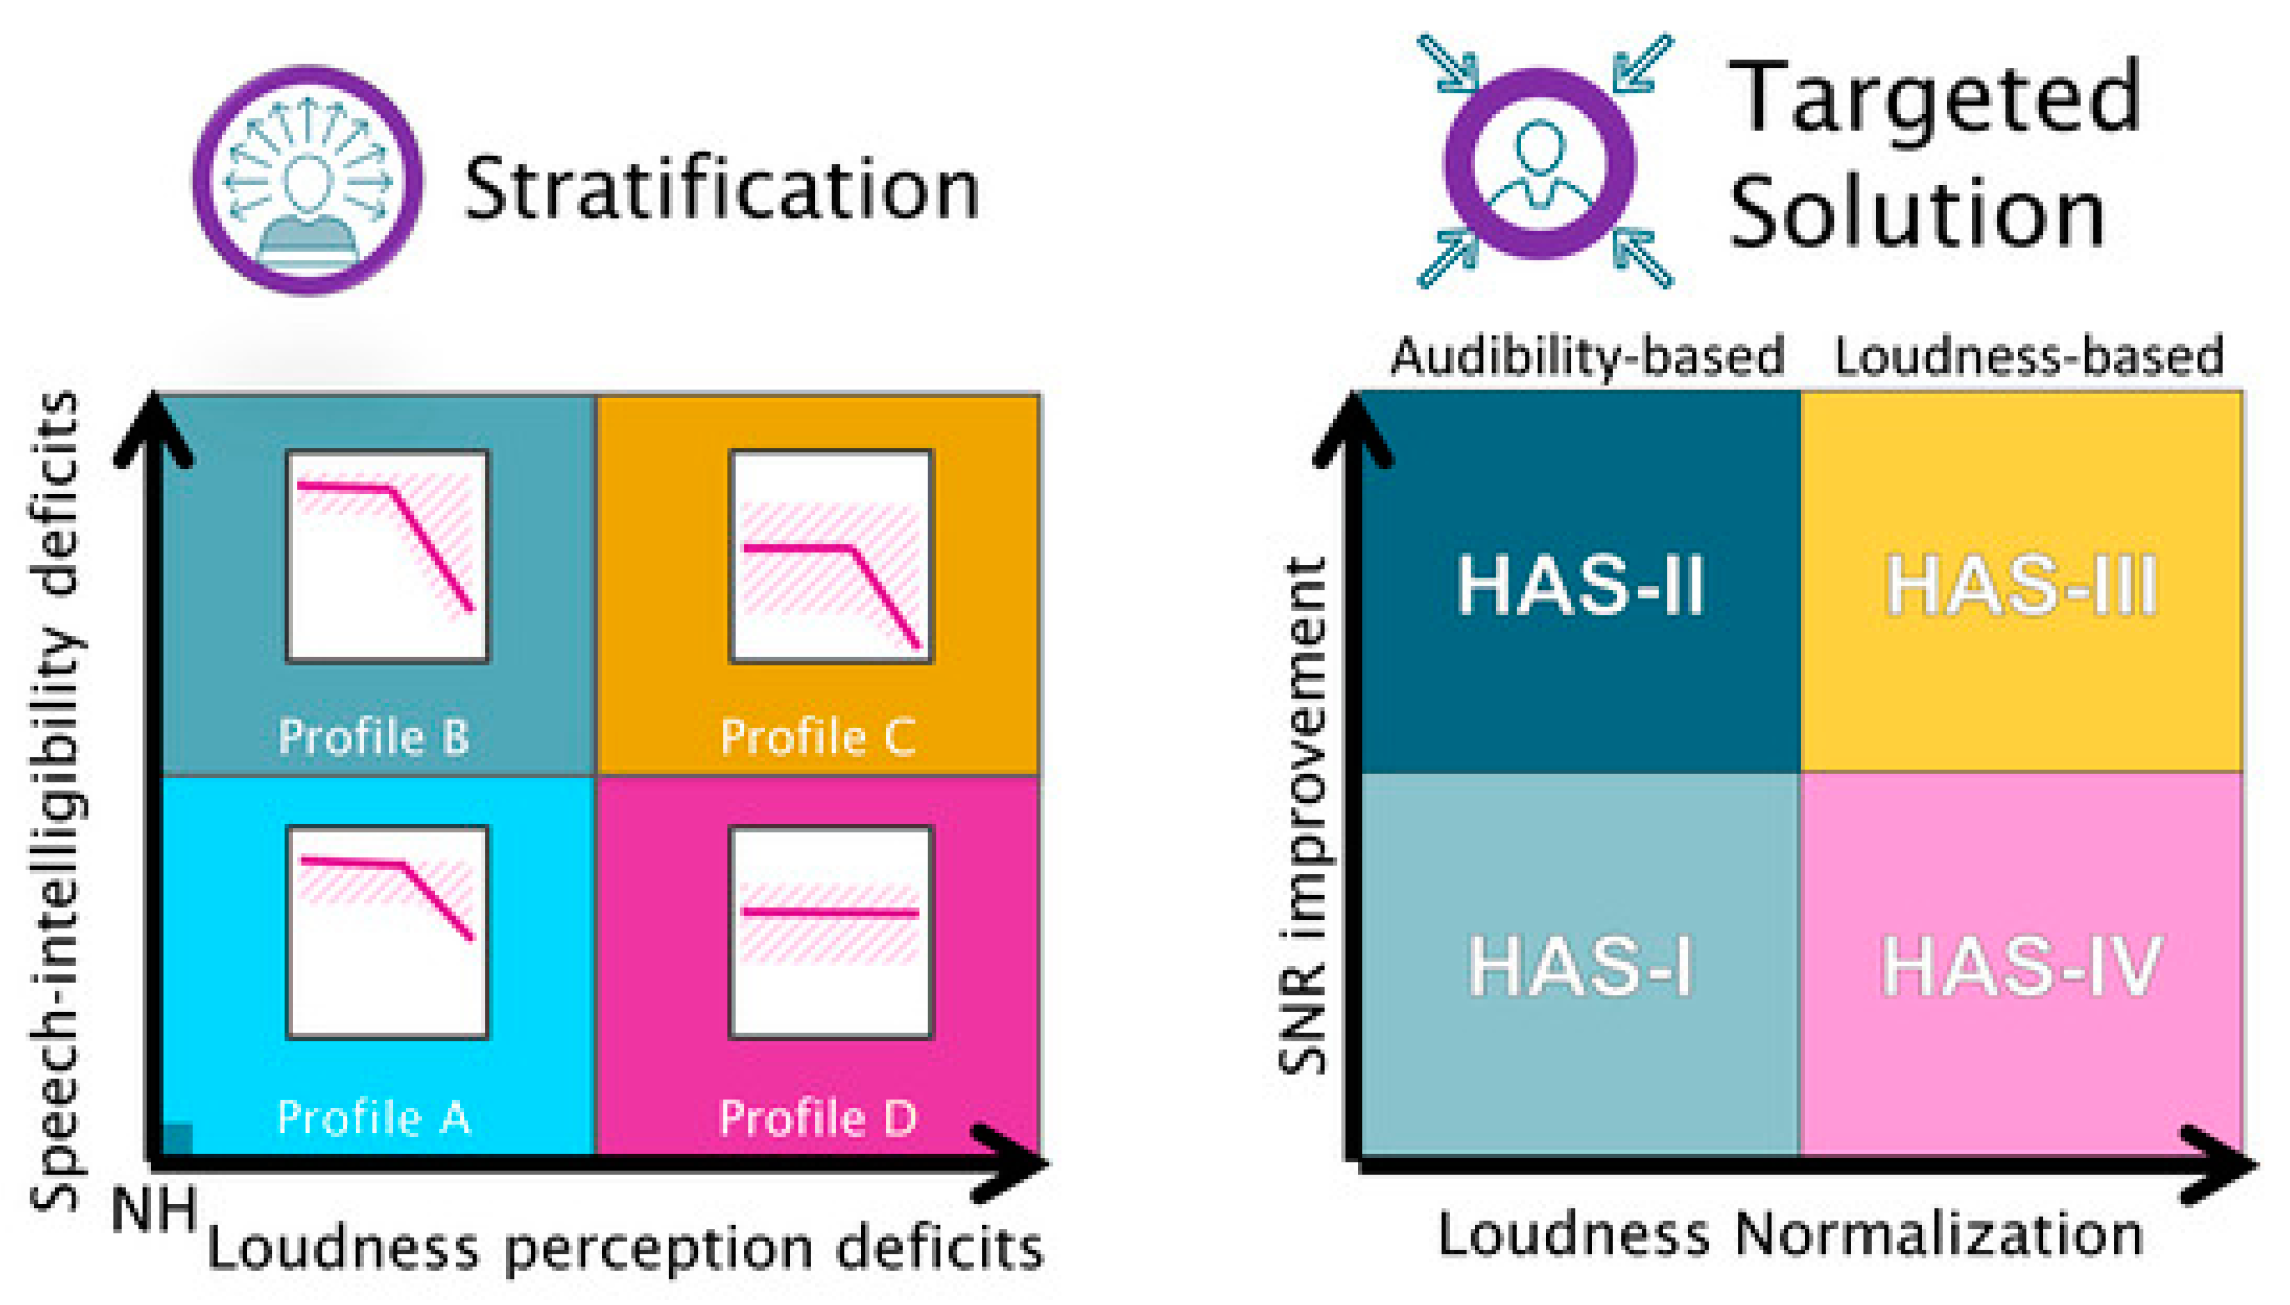
2.3. Auditory Profiling
2.4. HA Fittings
2.5. Self-Report Measures
2.6. Data Analysis
3. Results
3.1. Demographics
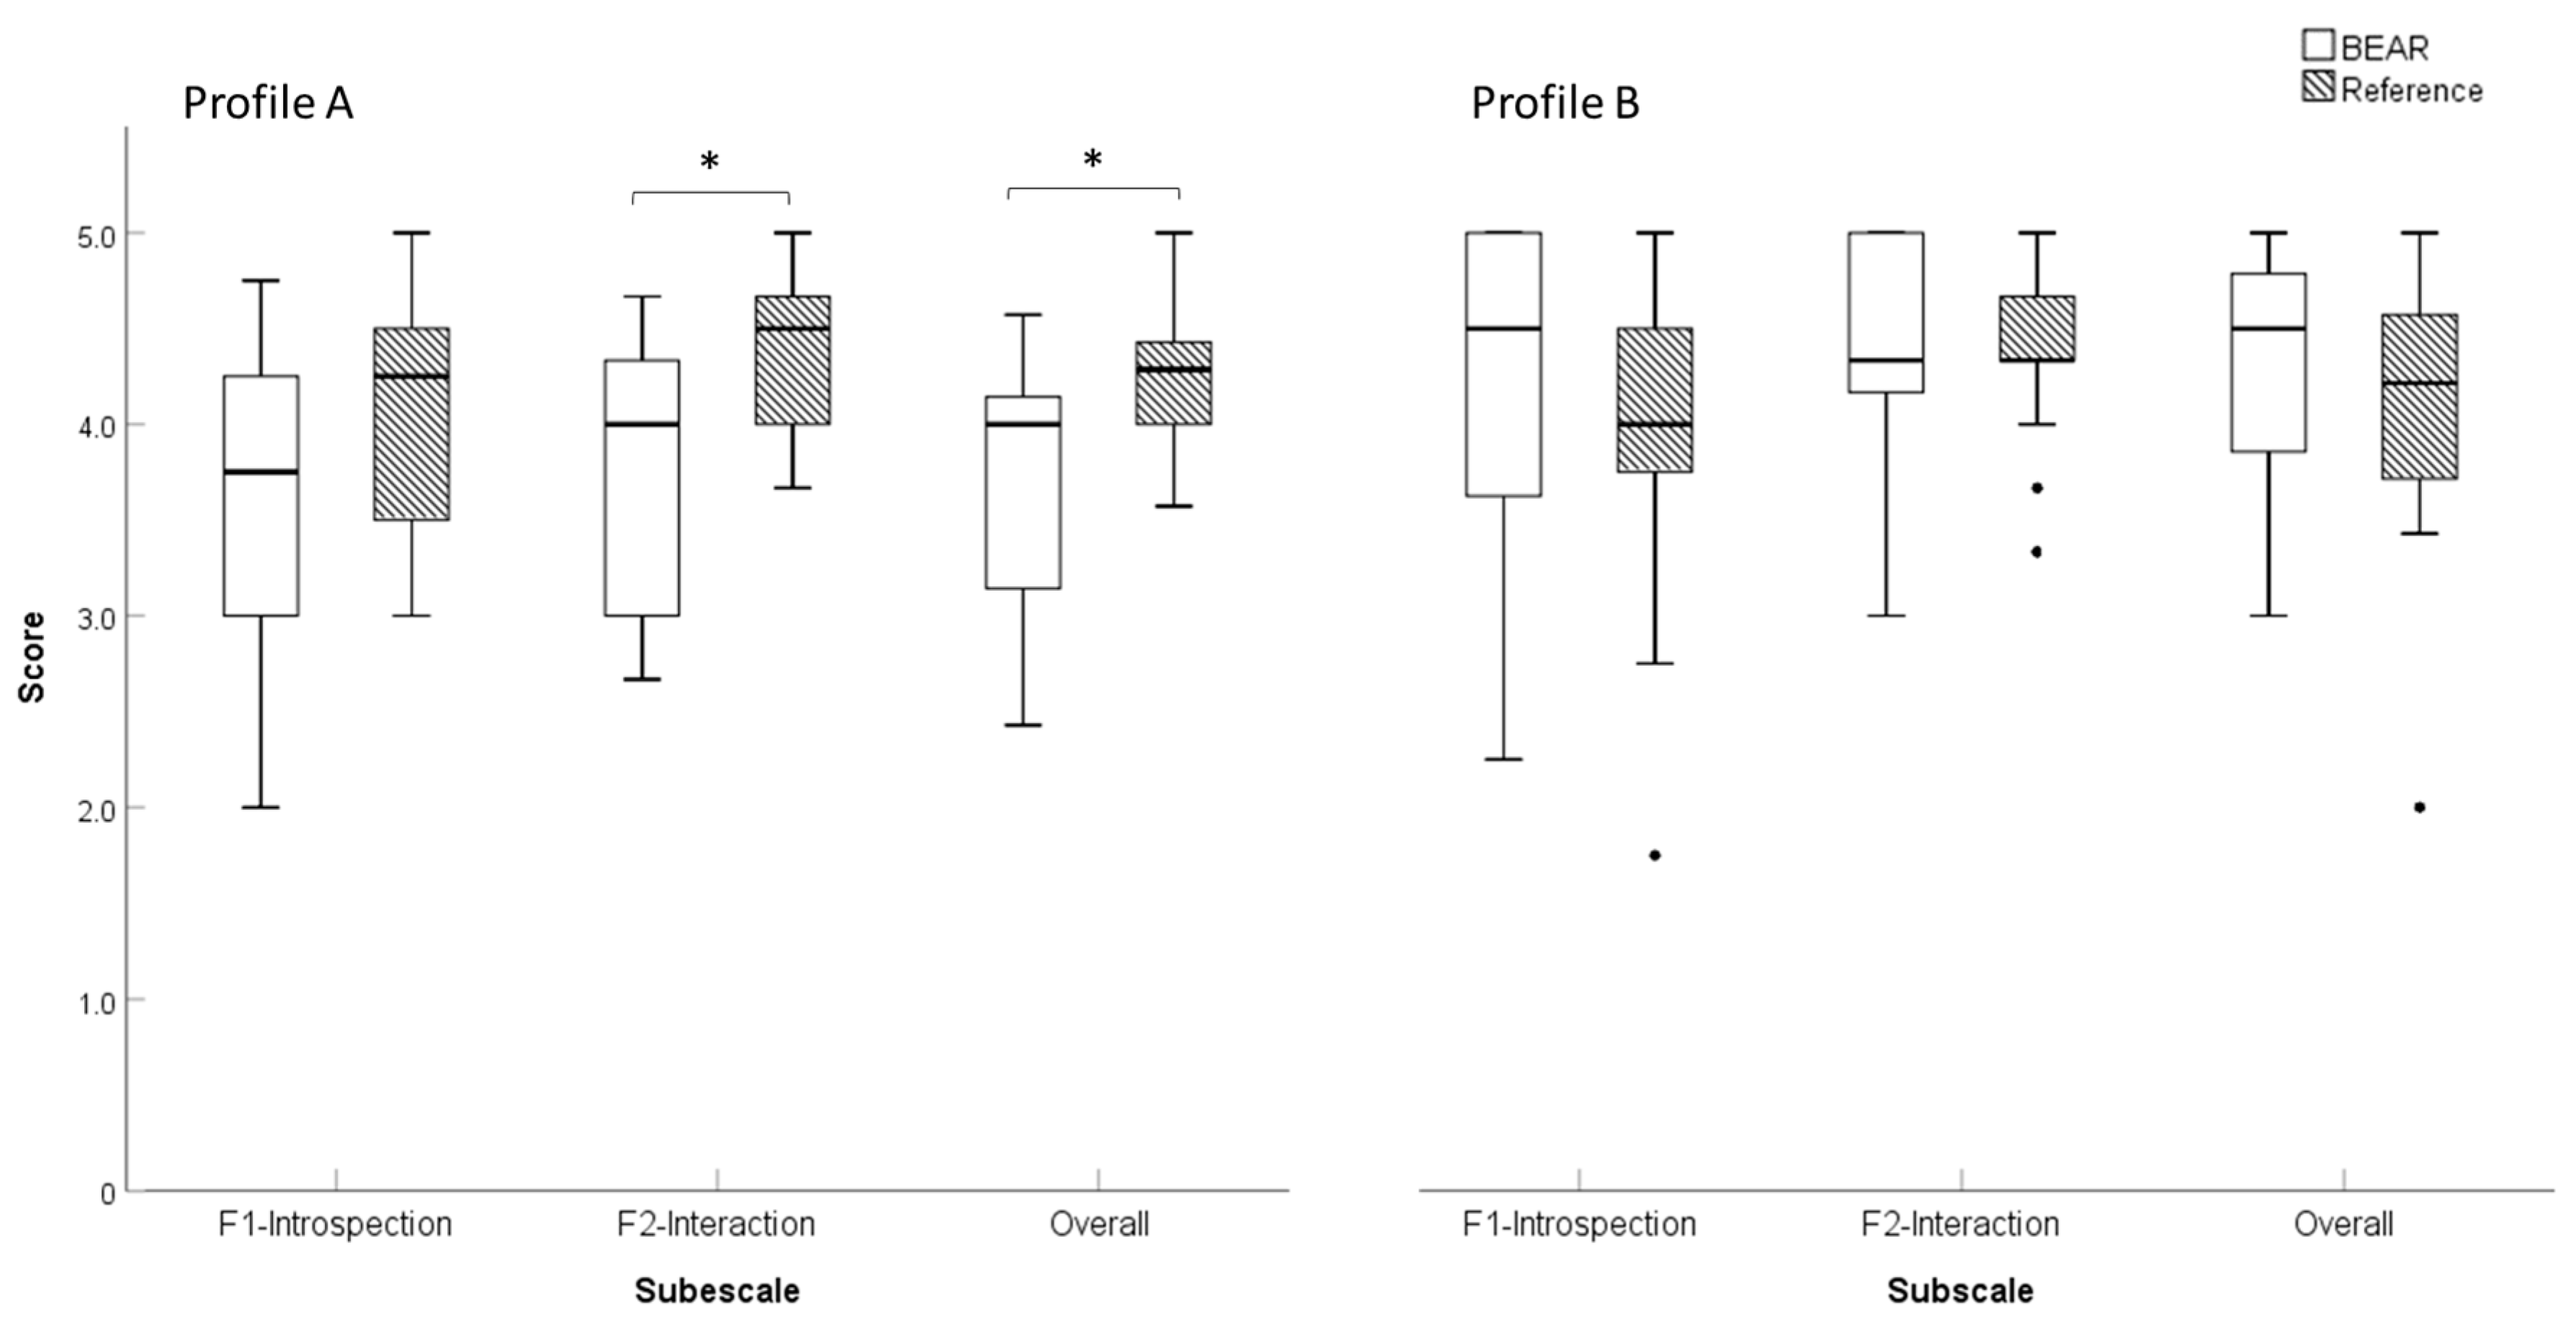
3.2. IOI-HA Scores
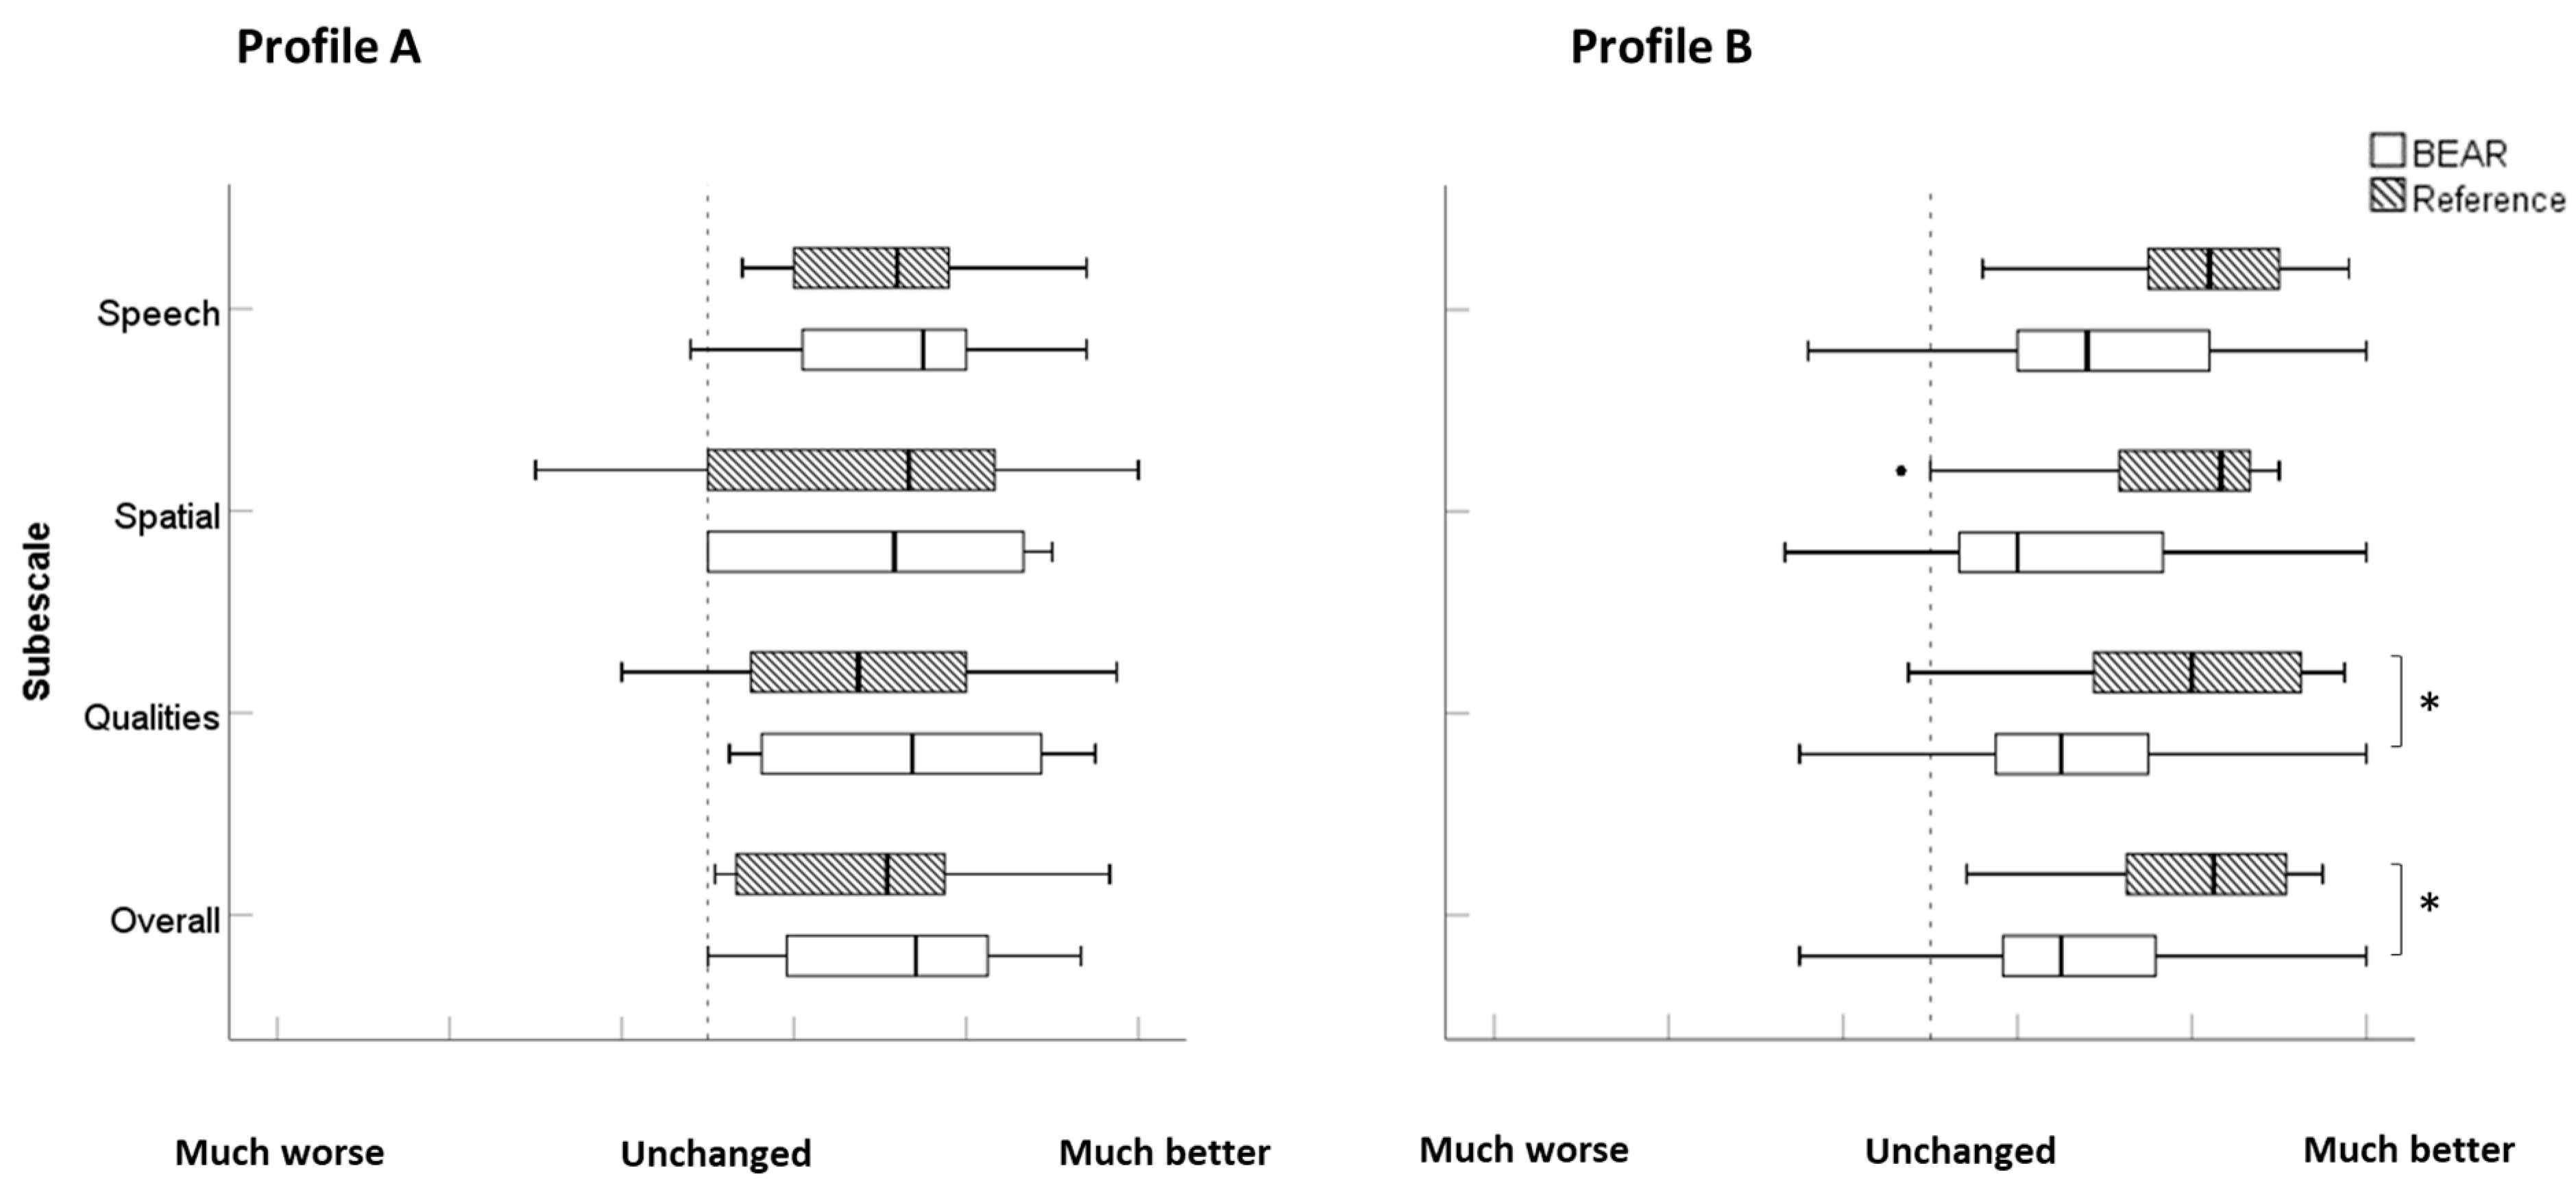
3.3. SSQ12-B Scores
3.4. SSQ12-B Properties
3.4.1. Internal Consistency
3.4.2. Floor Effects, Ceiling Effects, and Missing Data
3.4.3. Readability Analysis
4. Discussion
4.1. Differences across Fitting Strategies
4.2. Differences across Outcome Measures
4.3. Limitations and Further Research
5. Conclusions
Author Contributions
Funding
Institutional Review Board Statement
Informed Consent Statement
Data Availability Statement
Acknowledgments
Conflicts of Interest
References
- Chisolm, T.H.; Johnson, C.E.; Danhauer, J.L.; Portz, L.J.; Abrams, H.B.; Lesner, S.; McCarthy, P.A.; Newman, C.W. A systematic review of health-related quality of life and hearing aids: Final report of the American Academy of Audiology Task Force On the Health-Related Quality of Life Benefits of Amplification in Adults. J. Am. Acad. Audiol. 2007, 18, 151–183. [Google Scholar] [CrossRef] [PubMed]
- Anderson, M.; Arehart, K.; Souza, P. Survey of Current Practice in the Fitting and Fine-Tuning of Common Signal-Processing Features in Hearing Aids for Adults. J. Am. Acad. Audiol. 2018, 29, 118–124. [Google Scholar] [CrossRef] [PubMed]
- Thielemans, T.; Pans, D.; Chenault, M.; Anteunis, L. Hearing aid fine-tuning based on Dutch descriptions. Int. J. Audiol. 2017, 56, 507–515. [Google Scholar] [CrossRef] [PubMed]
- Dillon, H.; Day, J.; Bant, S.; Munro, K.J. Adoption, use and non-use of hearing aids: A robust estimate based on Welsh national survey statistics. Int. J. Audiol. 2020, 59, 567–573. [Google Scholar] [CrossRef]
- Gianopoulos, I.; Stephens, D.; Davis, A. Follow up of people fitted with hearing aids after adult hearing screening: The need for support after fitting. BMJ 2002, 325, 471. [Google Scholar] [CrossRef][Green Version]
- McCormack, A.; Fortnum, H. Why do people fitted with hearing aids not wear them? Int. J. Audiol. 2013, 52, 360–368. [Google Scholar] [CrossRef]
- Oosthuizen, I.; Manchaiah, V.; Launer, S.; Swanepoel, D.W. Hearing aid Experiences of Adult Hearing aid Owners During and After Fitting: A Systematic Review of Qualitative Studies. Trends Hear. 2022, 26, 233121652211305. [Google Scholar] [CrossRef]
- Lopez-Poveda, E.A.; Johannesen, P.T.; Pérez-González, P.; Blanco, J.L.; Kalluri, S.; Edwards, B. Predictors of Hearing-Aid Outcomes. Trends Hear. 2017, 21, 1–28. [Google Scholar] [CrossRef]
- Füllgrabe, C.; Moore, B.C.J.; Stone, M.A. Age-group differences in speech identification despite matched audiometrically normal hearing: Contributions from auditory temporal processing and cognition. Front. Aging Neurosci. 2015, 7, 347. [Google Scholar]
- Perez, E.; McCormack, A.; Edmonds, B.A. Sensitivity to temporal fine structure and hearing-aid outcomes in older adults. Front. Neurosci. 2014, 8, 7. [Google Scholar] [CrossRef]
- Sanchez-Lopez, R.; Fereczkowski, M.; Neher, T.; Santurette, S.; Dau, T. Robust Data-Driven Auditory Profiling Towards Precision Audiology. Trends Hear. 2020, 24, 2331216520973539. [Google Scholar] [CrossRef] [PubMed]
- Sanchez-Lopez, R.; Fereczkowski, M.; Santurette, S.; Dau, T.; Neher, T. Towards Auditory Profile-Based Hearing-Aid Fitting: Fitting Rationale and Pilot Evaluation. Audiol. Res. 2021, 11, 10–21. [Google Scholar] [CrossRef] [PubMed]
- Tharpe, A.M. Who has time for functional auditory assessments? We all do! Volta. Voices 2004, 11, 10–12. [Google Scholar]
- Cox, R.M.; Stephens, D.; Kramer, S.E. Translations of the International Outcome Inventory for Hearing Aids (IOI-HA). Int. J. Audiol. 2002, 41, 3–26. [Google Scholar] [CrossRef] [PubMed]
- Gatehouse, S.; Noble, I. The Speech, Spatial and Qualities of Hearing Scale (SSQ). Int. J. Audiol. 2004, 43, 85–99. [Google Scholar] [CrossRef]
- Perez, E.; Edmonds, B.A. A systematic review of studies measuring and reporting hearing aid usage in older adults since 1999: A descriptive summary of measurement tools. PLoS ONE 2012, 7, e31831. [Google Scholar] [CrossRef]
- Ferguson, M.A.; Kitterick, P.T.; Chong, L.Y.; Edmondson-Jones, M.; Barker, F.; Hoare, D.J. Hearing aids for mild to moderate hearing loss in adults. Cochrane Database Syst. Rev. 2017, 9. [Google Scholar] [CrossRef]
- Noble, W.; Jensen, N.S.S.; Naylor, G.; Bhullar, N.; Akeroyd, M.A. A short form of the Speech, Spatial and Qualities of Hearing scale suitable for clinical use: The SSQ12. Int. J. Audiol. 2013, 52, 409–412. [Google Scholar] [CrossRef]
- Jensen, N.S.; Akeroyd, M.; Noble, W.; Naylor, G. The Speech, Spatial and Qualities of Hearing scale (SSQ) as a benefit measure. In Proceedings of the NCRAR Conference on The Ear-Brain System: Approaches to the Study and Treatment of Hearing Loss, Portland, OR, USA, 9 October 2009; Available online: https://www.researchgate.net/publication/230886727 (accessed on 2 August 2022).
- Haskell, G.B.; Noffsinger, D.; Larson, V.D.; Williams, D.W.; Dobie, R.A.; Rogers, J.L. Subjective measures of hearing aid benefit in the NIDCD/VA clinical trial. Ear Hear. 2002, 23, 301–307. [Google Scholar] [CrossRef]
- Anderson, M.; Rallapalli, V.; Schoof, T.; Souza, P.; Arehart, K. The use of self-report measures to examine changes in perception in response to fittings using different signal processing parameters. Int. J. Audiol. 2018, 57, 809–815. [Google Scholar] [CrossRef]
- Yueh, B.; McDowell, J.A.; Collins, M.; Souza, P.E.; Loovis, C.F.; Deyo, R.A. Development and validation of the effectiveness of the auditory rehabilitation scale. Arch. Otolaryngol. Neck Surg. 2005, 131, 851–856. [Google Scholar] [CrossRef] [PubMed]
- Sanchez-Lopez, R.H.; Nielsen, S.G.; Cañete, O.; Fereczkowski, M.; Wu, M.; Neher, T.; Dau, T.; Santurette, S. A Clinical Test Battery for Better hEAring Rehabilitation (BEAR). Towards the Prediction of Individual Auditory Deficits and Hearing-Aid Benefit. 2019. Available online: https://pub.dega-akustik.de/ICA2019/data/articles/000470.pdf (accessed on 20 August 2022).
- Nielsen, J.B.; Dau, T. The Danish hearing in noise test. Int. J. Audiol. 2011, 50, 202–208. [Google Scholar] [CrossRef]
- Sanchez-Lopez, R.; Nielsen, S.G.; El-Haj-Ali, M.; Bianchi, F.; Fereczkowski, M.; Cañete, O.M.; Wu, M.; Neher, T.; Dau, T.; Santurette, S. Auditory Tests for Characterizing Hearing Deficits in Listeners With Various Hearing Abilities: The BEAR Test Battery. Front. Neurosci. 2021, 15, 24007. [Google Scholar] [CrossRef] [PubMed]
- Keidser, G.; Dillon, H.; Flax, M.; Ching, T.; Brewer, S. The NAL-NL2 Prescription Procedure. Audiol. Res. 2011, 1, 88–90. [Google Scholar] [CrossRef] [PubMed]
- Sanchez-Lopez, R.; Wu, M.; Fereczkowski, M.; Santurette, S.; Baumann, M.; Kowalewski, B.; Piechowiak, T.; Bisgaard, N.; Ravn, G.; Narayanan, S.K.; et al. Towards Auditory Profile-Based Hearing-Aid Fittings: BEAR Rationale and Clinical Implementation. Audiol. Res. 2022, 12, 564–573. [Google Scholar] [CrossRef]
- Jindal, J.; Hawkins, A.M.; Murray, M. BSA Practice Guidance. Guidance on the verification of hearing devices using probe microphone measurements. Br. Soc. Audiol. 2018. [Google Scholar]
- Harris, P.A.; Taylor, R.; Thielke, R.; Payne, J.; Gonzalez, N.; Conde, J.G. A metadata-driven methodology and workflow process for providing translational research informatics support. J. Biomed. Inform. 2009, 42, 377–381. [Google Scholar] [CrossRef]
- Harris, P.A.; Taylor, R.; Minor, B.L.; Elliott, V.; Fernandez, M.; O’Neal, L.; McLeod, L.; Delacqua, G.; Delacqua, F.; Kirby, J.; et al. The REDCap consortium: Building an international community of software platform partners. J. Biomed. Inform. 2019, 95, 103208. [Google Scholar] [CrossRef]
- Cox, R.M.; Alexander, G.C. The International Outcome Inventory for Hearing Aids (IOI-HA): Psychometric properties of the english version. Int. J. Audiol. 2002, 41, 30–35. [Google Scholar] [CrossRef]
- Terwee, C.B.; Bot, S.D.M.; de Boer, M.R.; van der Windt, D.A.W.M.; Knol, D.L.; Dekker, J.; Bouter, L.M.; de Vet, H.C.W. Quality criteria were proposed for measurement properties of health status questionnaires. J. Clin. Epidemiol. 2007, 60, 34–42. [Google Scholar] [CrossRef]
- Bjornsson, C.H. Readability of Newspapers in 11 Languages. Read. Res. Q. 1983, 18, 480. [Google Scholar] [CrossRef]
- Ladegaard Grønkjær, L.; Berg, K.; Søndergaard, R.; Møller, M. Assessment of Written Patient Information Pertaining to Cirrhosis and Its Complications: A Pilot Study. J. Patient Exp. 2020, 7, 499–506. [Google Scholar] [CrossRef] [PubMed]
- Læsbarhedsindex. 2020. Available online: https://tekstr.dk/app/#hvad-betyder-lix (accessed on 15 June 2022).
- Houmøller, S.S.; Wolff, A.; Möller, S.; Narne, V.K.; Narayanan, S.K.; Godballe, C.; Hougaard, D.D.; Loquet, G.; Gaihede, M.; Hammershøi, D.; et al. Prediction of successful hearing aid treatment in first-time and experienced hearing aid users: Using the International Outcome Inventory for Hearing Aids. Int. J. Audiol. 2022, 61, 119–129. [Google Scholar] [CrossRef] [PubMed]
- Narayanan, S.K.; Rye, P.; Piechowiak, T.; Ravn, G.; Wolff, A.; Houmøller, S.S.; Schmidt, J.H.; Hammershøi, D. Can real-ear insertion gain deviations from generic fitting prescriptions predict self-reported outcomes? Int. J. Audiol. 2023, 62, 433–441. [Google Scholar] [CrossRef]
- Cildir, B.; Kilic, S.; Ozkisi, B.; Yilmaz, S.T. The Turkish short version of the Speech, Spatial, and Qualities of Hearing Scale (SSQ) for clinical use: Determining reliability and validity for people with and without hearing loss on the basis of SSQ12-A, SSQ12-B, SSQ12-C. ENT Updates 2021, 11, 127–133. [Google Scholar] [CrossRef]


| Questionnaire | HA Fitting | ||
|---|---|---|---|
| IOI-HA | N = 167/205 (81.6%) | Reference | BEAR |
| A | 52 | 27 | 25 |
| B | 89 | 44 | 45 |
| C | 12 | 7 | 5 |
| D | 7 | 3 | 4 |
| U * | 7 | 7 | |
| SSQ12-B | |||
| Profile | N = 123/205 (60.0%) | ||
| A | 41 | 18 | 23 |
| B | 62 | 31 | 31 |
| C | 10 | 5 | 5 |
| D | 8 | 3 | 5 |
| U * | 5 | 5 | |
| SSQ12-B | IOI-HA | |||||
|---|---|---|---|---|---|---|
| Reference Fitting (N = 30) | BEAR Fitting (N = 37) | p-Value | Reference Fitting (N = 50) | BEAR Fitting (N = 42) | p-Value | |
| Mean age in years (SD) | 66.3 (7.7) | 68.6 (7.2) | 0.269 | 69.1 (7.0) | 66.7 (7.3) | 0.181 |
| Sex | ||||||
| Male | 17 | 22 | 0.179 | 27 | 23 | 0.351 |
| Female | 13 | 15 | 23 | 19 | ||
| Mean PTA4 in dB HL (SD) | 31.5 (5.6) | 32.1 (6.9) | 0.729 | 33.3 (7.0) | 31.0 (5.6) | 0.132 |
| HA Fitting | ||||
|---|---|---|---|---|
| Item | N = 92 | Reference (N = 50) | BEAR (N = 42) | p-Value |
| 1 (F1-Use) | 4.4 (0.8) | 4.3 (0.8) | 4.4 (0.8) | 0.474 |
| 2 (F1-Ben) | 3.9 (1.0) | 3.8 (0.9) | 4.1 (1.1) | 0.081 |
| 3 (F2-RAL) | 3.9 (0.8) | 4.0 (0.7) | 3.8 (1.0) | 0.271 |
| 4 (F1-Sat) | 4.2 (1.0) | 4.2 (1.0) | 4.2 (1.0) | 0.898 |
| 5 (RPR) | 4.3 (0.9) | 4.4 (0.8) | 4.2 (1.0) | 0.568 |
| 6 (F2-Ioth) | 4.7 (0.7) | 4.7 (0.7) | 4.6 (0.6) | 0.086 |
| 7 (F1-Qol) | 3.7 (0.9) | 3.7 (0.9) | 3.7 (1.0) | 0.824 |
| F1–introspection | 4.0 (0.8) | 4.0 (0.8) | 4.1 (0.8) | 0.379 |
| F2–interaction | 4.3 (0.6) | 4.4 (0.5) | 4.2 (0.7) | 0.305 |
| Overall | 4.2 (0.6) | 4.2 (0.6) | 4.1 (0.7) | 0.838 |
| HA Fitting | ||||
|---|---|---|---|---|
| Items | N = 67 | Reference (N = 30) | BEAR (N = 37) | p-Value |
| 1 | 2.6 (1.7) | 2.8 (1.7) | 2.4 (1.8) | 0.264 |
| 2 | 2.1 (1.8) | 2.2 (1.9) | 1.9 (1.8) | 0.376 |
| 3 | 2.5 (1.6) | 2.7 (1.5) | 2.4 (1.6) | 0.309 |
| 4 | 2.5 (1.6) | 2.7 (1.5) | 2.3 (1.8) | 0.321 |
| 5 | 2.6 (1.7) | 2.9 (1.3) | 2.4 (1.9) | 0.307 |
| Speech | 2.4 (1.5) | 2.7 (1.4) | 2.3 (1.6) | 0.300 |
| 6 | 2.1 (1.9) | 2.3 (1.9) | 1.9 (1.8) | 0.202 |
| 7 | 1.9 (1.7) | 2.2 (1.6) | 1.7 (1.8) | 0.319 |
| 8 | 2.1 (1.9) | 2.4 (2.0) | 1.9 (1.9) | 0.285 |
| Spatial | 2.0 (1.7) | 2.3 (1.7) | 1.8 (1.7) | 0.368 |
| 9 | 1.7 (1.9) | 1.9 (2.1) | 1.6 (1.7) | 0.393 |
| 10 | 2.0 (2.0) | 2.4 (2.1) | 1.7 (1.8) | 0.085 |
| 11 | 2.7 (2.0) | 2.9 (2.1) | 2.6 (1.9) | 0.319 |
| 12 | 2.3 (1.9) | 2.7 (1.3) | 2.1 (2.2) | 0.336 |
| Qualities | 2.2 (1.6) | 2.5 (1.6) | 2.0 (1.6) | 0.211 |
| Overall | 2.3 (1.5) | 2.5 (1.5) | 2.1 (1.5) | 0.264 |
Disclaimer/Publisher’s Note: The statements, opinions and data contained in all publications are solely those of the individual author(s) and contributor(s) and not of MDPI and/or the editor(s). MDPI and/or the editor(s) disclaim responsibility for any injury to people or property resulting from any ideas, methods, instructions or products referred to in the content. |
© 2024 by the authors. Licensee MDPI, Basel, Switzerland. This article is an open access article distributed under the terms and conditions of the Creative Commons Attribution (CC BY) license (https://creativecommons.org/licenses/by/4.0/).
Share and Cite
Cañete, O.M.; Loquet, G.; Sánchez-López, R.; Hougaard, D.D.; Schnack-Petersen, R.; Gaihede, M.; Schmidt, J.H.; Hammershøi, D.; Neher, T. Auditory Profile-Based Hearing Aid Fitting: Self-Reported Benefit for First-Time Hearing Aid Users. Audiol. Res. 2024, 14, 183-195. https://doi.org/10.3390/audiolres14010017
Cañete OM, Loquet G, Sánchez-López R, Hougaard DD, Schnack-Petersen R, Gaihede M, Schmidt JH, Hammershøi D, Neher T. Auditory Profile-Based Hearing Aid Fitting: Self-Reported Benefit for First-Time Hearing Aid Users. Audiology Research. 2024; 14(1):183-195. https://doi.org/10.3390/audiolres14010017
Chicago/Turabian StyleCañete, Oscar M., Gérard Loquet, Raul Sánchez-López, Dan Dupont Hougaard, Rikke Schnack-Petersen, Michael Gaihede, Jesper H. Schmidt, Dorte Hammershøi, and Tobias Neher. 2024. "Auditory Profile-Based Hearing Aid Fitting: Self-Reported Benefit for First-Time Hearing Aid Users" Audiology Research 14, no. 1: 183-195. https://doi.org/10.3390/audiolres14010017
APA StyleCañete, O. M., Loquet, G., Sánchez-López, R., Hougaard, D. D., Schnack-Petersen, R., Gaihede, M., Schmidt, J. H., Hammershøi, D., & Neher, T. (2024). Auditory Profile-Based Hearing Aid Fitting: Self-Reported Benefit for First-Time Hearing Aid Users. Audiology Research, 14(1), 183-195. https://doi.org/10.3390/audiolres14010017