Article

Genome-Wide Identification and Functional Prediction of the GRAS Transcription Factor Family in Rice Under Abiotic Stress Conditions

College of Bioscience and Biotechnology, Hunan Agricultural University, Changsha 410128, China
*
Author to whom correspondence should be addressed.
Int. J. Plant Biol. 2025, 16(3), 95; https://doi.org/10.3390/ijpb16030095
Submission received: 4 July 2025 / Revised: 14 August 2025 / Accepted: 15 August 2025 / Published: 19 August 2025

Abstract

GRAS transcription factors play a crucial role in plant response to abiotic stresses. In this study, 61 members of the rice GRAS family, categorized into nine subfamilies, were identified by searching the latest genome sequence of rice. The OsGRAS genes that may respond to abiotic stresses were predicted by analyzing the cis-acting elements of the promoters of the genes and the structural features of the proteins. The results showed that the known OsGRAS drought-tolerant genes and OsGRAS salt-tolerant genes have a special structure in their protein structures, and nine genes that may be related to drought tolerance and six genes that may be related to salt tolerance were predicted in this study based on these special structures. The results of tissue expression profiling showed that OsGRAS family genes were expressed in different degrees during plant growth and development, and the expression of DELLA, PAT1, and HAM subfamily members was generally high. Finally, the analysis of the expression levels of 16 randomly selected OsGRAS genes under drought and salt stress conditions showed significant up-regulation of OsGRAS14 and OsGRAS21 under both stress treatments, and OsGRAS52 was significantly down-regulated under drought stress and up-regulated under salt stress. The present study provides important clues for exploring the molecular basis of the mechanism of rice response to abiotic stress, and also provides new ideas for the improvement of rice germplasm resources.

1. Introduction

Plant growth is constantly affected by abiotic stresses such as drought, high salinity, high osmotic pressure, and changing light conditions, which negatively affect plant growth and productivity. Accordingly, plants have evolved different mechanisms to cope with these challenges. Studies have shown that plants can cope with the negative effects of abiotic stresses by acting through the binding of numerous transcription factors to cis-acting elements in the promoters of specific target genes [1]. In the WRKY transcription factor family, knockdown of OsWRKY63 using CRISPR/Cas9 enhanced rice tolerance [2]. When MbWRKY65 was introduced into tomatoes, it was rapidly induced under cold and drought stress, increasing antioxidant enzyme activity, reducing reactive oxygen species accumulation, activating related downstream genes, and enhancing the resistance of transgenic plants [3]. The bZIP transcription factor family also plays an important role in stress responses. OsbZIP71 was directly activated by ABA-dependent pathways in the face of salt stress and drought stress to enhance rice tolerance to drought and salt stress [4]. Transgenic tobacco plants overexpressing CgbZIP1 exhibit enhanced tolerance, further confirming that the stress response mediated by CgbZIP1 may involve an ABA-dependent pathway [5]. In addition, OsERF101 positively regulates drought response by increasing the expression levels of drought response genes that synthesize proline and eliminate harmful ROS, playing an important role in improving rice grain setting under drought stress [6].
The GRAS transcription factor family, as a large family of transcription factors in plants, plays an important role in responding to abiotic stress. For example, expression of ZmGRAS72 in Arabidopsis significantly improved the plant’s tolerance to drought and salt stress. Under non-biotic stress, it up- or down-regulated the expression levels of abscisic acid biosynthesis genes (NCED3), signal transduction genes (ABI1, ABI2, ABI4, and ABI5), and stress-related genes (RD22, RD29A, and KIN1) [7]. LzSCL9 was found to respond to thermo-stress treatment involving trichothecene in transcriptomic and RT-qPCR analyses. Overexpression of LzSCL9 enhanced the heat tolerance of lilies, while its silencing reduced heat tolerance, indicating the positive role of LzSCL9 in trichothecene-induced heat tolerance [8]. PtrPAT1 regulates glycine betaine biosynthesis by modulating the expression of PtrBADH-1, thereby positively influencing cold tolerance. Compared with the wild type, overexpression of PtrPAT1 increased BADH activity in transgenic tobacco plants, increased glycine betaine accumulation, and conferred strong cold tolerance [9].
The GRAS gene family name is derived from the first three transcription factors identified in the family, gibberellic acid insensitive (GAI), repressor of GAI (RGA) and scarecrow (SCR), which are widely found in plants [10]. The lengths of different GRAS proteins vary, with typical GRAS proteins usually containing 400–770 amino acids, primarily distributed within the cell nucleus. The N-terminal region is variable, while the C-terminal region is highly conserved. The C-terminal region contains five distinct sequence motifs: LHRI (leucine heptapeptide repeat I), VHIID, LHRII (leucine heptapeptide repeat II), PFYRE, and SAW. Among these, the VHIID conserved sequence is the core sequence of the GRAS family proteins, and the conserved C-terminal region plays a crucial role in protein–protein interactions. The function of the N-terminal region is primarily manifested in two aspects: first, as a variable region, it participates in the specific regulation and molecular recognition of proteins during plant development; second, the N-terminal region also contains specific structural MoRFs (molecular recognition features), which can achieve signal transduction by recognizing and binding to specific target proteins. Therefore, the N-terminal sequence plays an important role in enabling GRAS proteins to perform their specific functions [11,12,13].
Previous studies have mainly focused on gene identification and bioinformatics analysis. Although attention has begun to be paid to the role of GRAS genes in abiotic stress, overall functional validation remains insufficient, and comprehensive analysis of cis-acting elements in the promoter region is also lacking [14,15];this study focuses on combining system evolution clustering results, coding protein conserved motif analysis, and cis-acting element distribution to further predict potential new GRAS family members that respond to abiotic stress, and further verifies this through experiments, thereby proposing a hypothesis on the potential mechanism by which genes exert stress tolerance. This study employed bioinformatics methods to conduct a genome-wide identification of OsGRAS genes, analyzing their chromosomal localization, promoter functional elements, evolutionary relationships, and conserved motifs and domains of the encoded proteins. Based on the analysis results, combined with the structural similarity of the encoded proteins, potential new GRAS family members responsive to abiotic stress were further predicted. Additionally, expression analysis of selected OsGRAS genes under salt-tolerant and drought-tolerant conditions was conducted to further confirm gene function. The findings of this study provide theoretical references for further analysis of the biological functions of OsGRAS genes, contributing to a deeper understanding of the molecular mechanisms underlying the response of rice GRAS family members to abiotic stress. Additionally, the study offers genetic resources for rice molecular breeding.

2. Materials and Methods

2.1. Genome-Wide Characterization of Members of the GRAS Gene Family in Rice

In this study, two methods were utilized to identify GRAS family genes in the rice whole genome. The first method was to download the rice whole genome sequence (Oryza sativa v7.0), protein sequence, and GFF gene information files from the phytozome (JGI) database (https://phytozome-next.jgi.doe.gov, accessed on 10 May 2024), the whole genome information is derived from three different Nipponbare individuals [16]. The Hidden Markov Model file (PF03514) for the GRAS gene family was downloaded from the Pfam (http://pfam-legacy.xfam.org, accessed on 10 May 2024) website, and the structural domain search was performed on the rice whole genome sequence using the E-value value of less than 0.015 as a screening criterion, resulting in 61 members. In the second method, the protein sequences of the GRAS gene family of Arabidopsis were downloaded from the TAIR (https://www.arabidopsis.org/, accessed on 16 May 2024) website [17]; a local Blast of the rice protein database was performed by the Blast Compare Two Seqs function of TBtools (https://github.com/CJ-Chen/TBtools/releases, accessed on 8 May 2024) [18]. All parameters were set to default, resulting in 58 candidate members. The results obtained from the above two methods were intersected to obtain 58 candidate gene family members. Further utilization of the MEME website (https://meme-suite.org/meme/, accessed on 19 June 2024) and online website NCBI Batch CD-Search (https://www.ncbi.nlm.nih.gov, accessed on 2 September 2024) eliminated three false negative results, ultimately yielding 61 family members containing at least one GRAS conserved domain [19,20].

2.2. Phylogenetic Tree of the GRAS Gene Family in Rice

The Arabidopsis whole genome sequence (Arabidopsis thaliana Araport11) was downloaded from the phytozome (JGI) database and searched for structural domains with a hidden Markov model file (PF03514) to obtain 34 AtGRAS members. Neighbor Joining (NJ) method in MEGA11 (https://www.megasoftware.net/dload_win_beta, accessed on 13 October 2024, version: 11.0.13) software was applied to perform multiple sequence comparison between OsGRAS and AtGRAS families [21], setting the self-expansion value coefficient (Bootstrap) to 1000 repetitions; the substitution model (substitution model) was p-distance, the subset of data used was partial deletion, and the default values were used for other parameters, and they were classified into nine subfamilies according to previous studies [22,23] and were processed using the ITOL (https://itol.embl.de/, accessed on 18 December 2024) online website.

2.3. Physicochemical Characterization of GRAS Proteins

Information such as the number of amino acids, molecular weight, and theoretical isoelectric point of GRAS proteins were analyzed using the Protein Parameter Calc function of TBtools software (version: 2.105) (Table 1).

2.4. Chromosomal Localization of the GRAS Gene Family in Rice

The GFF gene information files downloaded from the phytozome (JGI) database were submitted to the TBtools software, and the chromosomal localization analysis and visualization of GRAS genes within the rice genome were carried out using the Gene Location function of the TBtools software.

2.5. Analysis of Conserved Motifs and Conserved Domains of GRAS Proteins

The conserved motifs of OsGRAS-encoded proteins were identified using the MEME website (Table 2), and the maximum number of motifs was set to 10. The conserved structural domains of OsGRAS-encoded proteins were identified using the online software NCBI Batch CD-Search, and the conserved motifs and conserved structural domains of OsGRAS family members were visualized using TBtools.

2.6. Analysis of Cis-Acting Elements of Rice GRAS Gene Family Promoters

Sixty-one gene sequences 2000 bp upstream of the CDS of the rice GRAS gene were extracted for characterization and submitted to the PlantCARE (http://bioinformatics.psb.ugent.be/webtools/plantcare/html/, accessed on 4 September 2024) website to analyze cis-acting elements in candidate promoter sequences [24]. The cis-acting elements were later visualized using the Simple BioSequence Gene Viewer function of TBtools software.

2.7. Tissue Expression Profiling

The expression patterns of OsGRAS genes in different tissues of rice were obtained from the ePlant website (http://bar.utoronto.ca/eplant, accessed on 6 February 2025) [25]. Gene expression values were represented by Affymetrix ATH1 array gene expression data, standardized using the MAS5.0 and RMA methods. The average values of three biological replicates were calculated to analyze the specific expression patterns of the OsGRAS family in seedling roots, inflorescence development stages (P1–P6), seed development stages (S1–S5), mature leaves, young leaves, and shoot apical meristem. Using TBtools software, a gene expression pattern heatmap was constructed with log2-transformed fold changes as the scale.

2.8. Expression Level Analysis After Drought and Salt Stress Treatments

Rice test materials (Oryza sativa L.cv. Nipponbare) were provided by Hunan Hybrid Rice Research Center. The seeds were randomly selected to be full of particles and of uniform size, then placed in water to absorb and swell, then germinated in an oven at 37 °C overnight, then transferred to Yoshida nutrient solution (pH 5.80) after germination, and then cultivated in a refining room with 14 h of light/darkness, 30 °C, and humidity of 80% for two weeks.
A 15% solution of PEG6000 was obtained by dissolving 150 g of PEG6000 completely in 1 L Yoshida nutrient solution. Rice seedling roots were immersed in normal culture medium and 15% PEG6000 solution, respectively, for 48 h in the control and experimental groups. For salt stress treatment, the control and experimental groups were immersed in normal culture medium and culture medium containing 150 mmol/L NaCl, respectively, for 48 h. The roots of rice seedlings were collected at six time points, namely 0 h, 2 h, 4 h, 8 h, 24 h, and 48 h, and stored at −80 °C for reserve.
Based on the information of gene family clustering and gene structure, 16 genes were randomly selected from each subfamily and each chromosome, and finally, 16 genes were selected to design specific primers for qRT-PCR (Table 3) for expression level analysis. Total RNA from high salt and drought-treated rice was extracted by the TRNzol method, and the RNA was reverse transcribed into cDNA using StarScript III All-in-one RT Mix with gDNA Remover, and the cDNA was extracted according to the 2× RealStar Fast dye method. RNA was reverse transcribed into cDNA and then subjected to real-time fluorescence quantitative PCR (qRT-PCR) according to the procedure of 2× RealStar Fast SYBR qPCR Mix. The reaction system (10 μL) included the following: Mix 5 μL, ddH2O 4 μL, cDNA template 0.5 μL, upstream and downstream primers 0.25 μL each. Reaction program: 95 °C pre-denaturation for 2 min, 95 °C denaturation for 15 s, 60 °C annealing/extension for 15 s, 40 cycles. Rice Actin was selected as the internal reference gene, and Excel software (Excel, version 2019, Microsoft Corporation, Redmond, WA, USA) were used for statistical analysis of the data. The 2−∆∆Ct method was used to calculate the relative expression levels.

3. Results and Analysis

3.1. Genome-Wide Identification of Rice OsGRAS Gene Family Members and Construction of a Phylogenetic Tree

A total of 61 members were identified in the OsGRAS family (Figure 1), which was divided into nine subfamilies in combination with the Arabidopsis AtGRAS family classification. Among them, LISCL was the largest subfamily in rice OsGRAS with 16 members, accounting for 26.2% of the OsGRAS family. PAT1 and HAM were the second and third largest subfamilies, respectively, and the DLT subfamily had the lowest number of members, with only two OsGRAS proteins accounting for 3.3% of the OsGRAS family. This is consistent with the results in Arabidopsis [23]. It has been reported that some subfamilies play important roles in stress responses. For example, members of the SCL subfamily act as co-activators in response to cold stress in G. hirsutum [10], while members of the DELLA subfamily serve as transcriptional co-activators of GA (gibberellin) signaling in rice in response to abiotic stresses such as salt and drought [11].

3.2. Analysis of Physicochemical Properties of Rice GRAS Proteins

To better understand the properties of this family of proteins, their physicochemical properties were analyzed. The results indicated significant variation for the physicochemical properties of the OsGRAS proteins (Table 1). The length of the proteins encoded by the OsGRAS family genes ranged from 137 to 977 amino acids, corresponding to molecular weights ranging from 15.19 kDa to 108.69 kDa. OsGRAS58 was the longest polypeptide chain with 977 amino acids; the OsGRAS16 protein has the lowest number of amino acids, only 137. The theoretical isoelectric point of OsGRAS proteins ranges from 4.53 to 10.29, suggesting the significant differences in their charge characteristics. However, overall the isoelectric points of the OsGRAS family amino acid sequences were mostly in the acidic range, and the amino acid sequences of OsGRAS proteins with isoelectric points less than 7 were 48, accounting for 78.7% of the total number of amino acids, indicating that the OsGRAS protein molecules are rich in acidic amino acids.

3.3. Chromosomal Localization of Members of the GRAS Gene Family in Rice

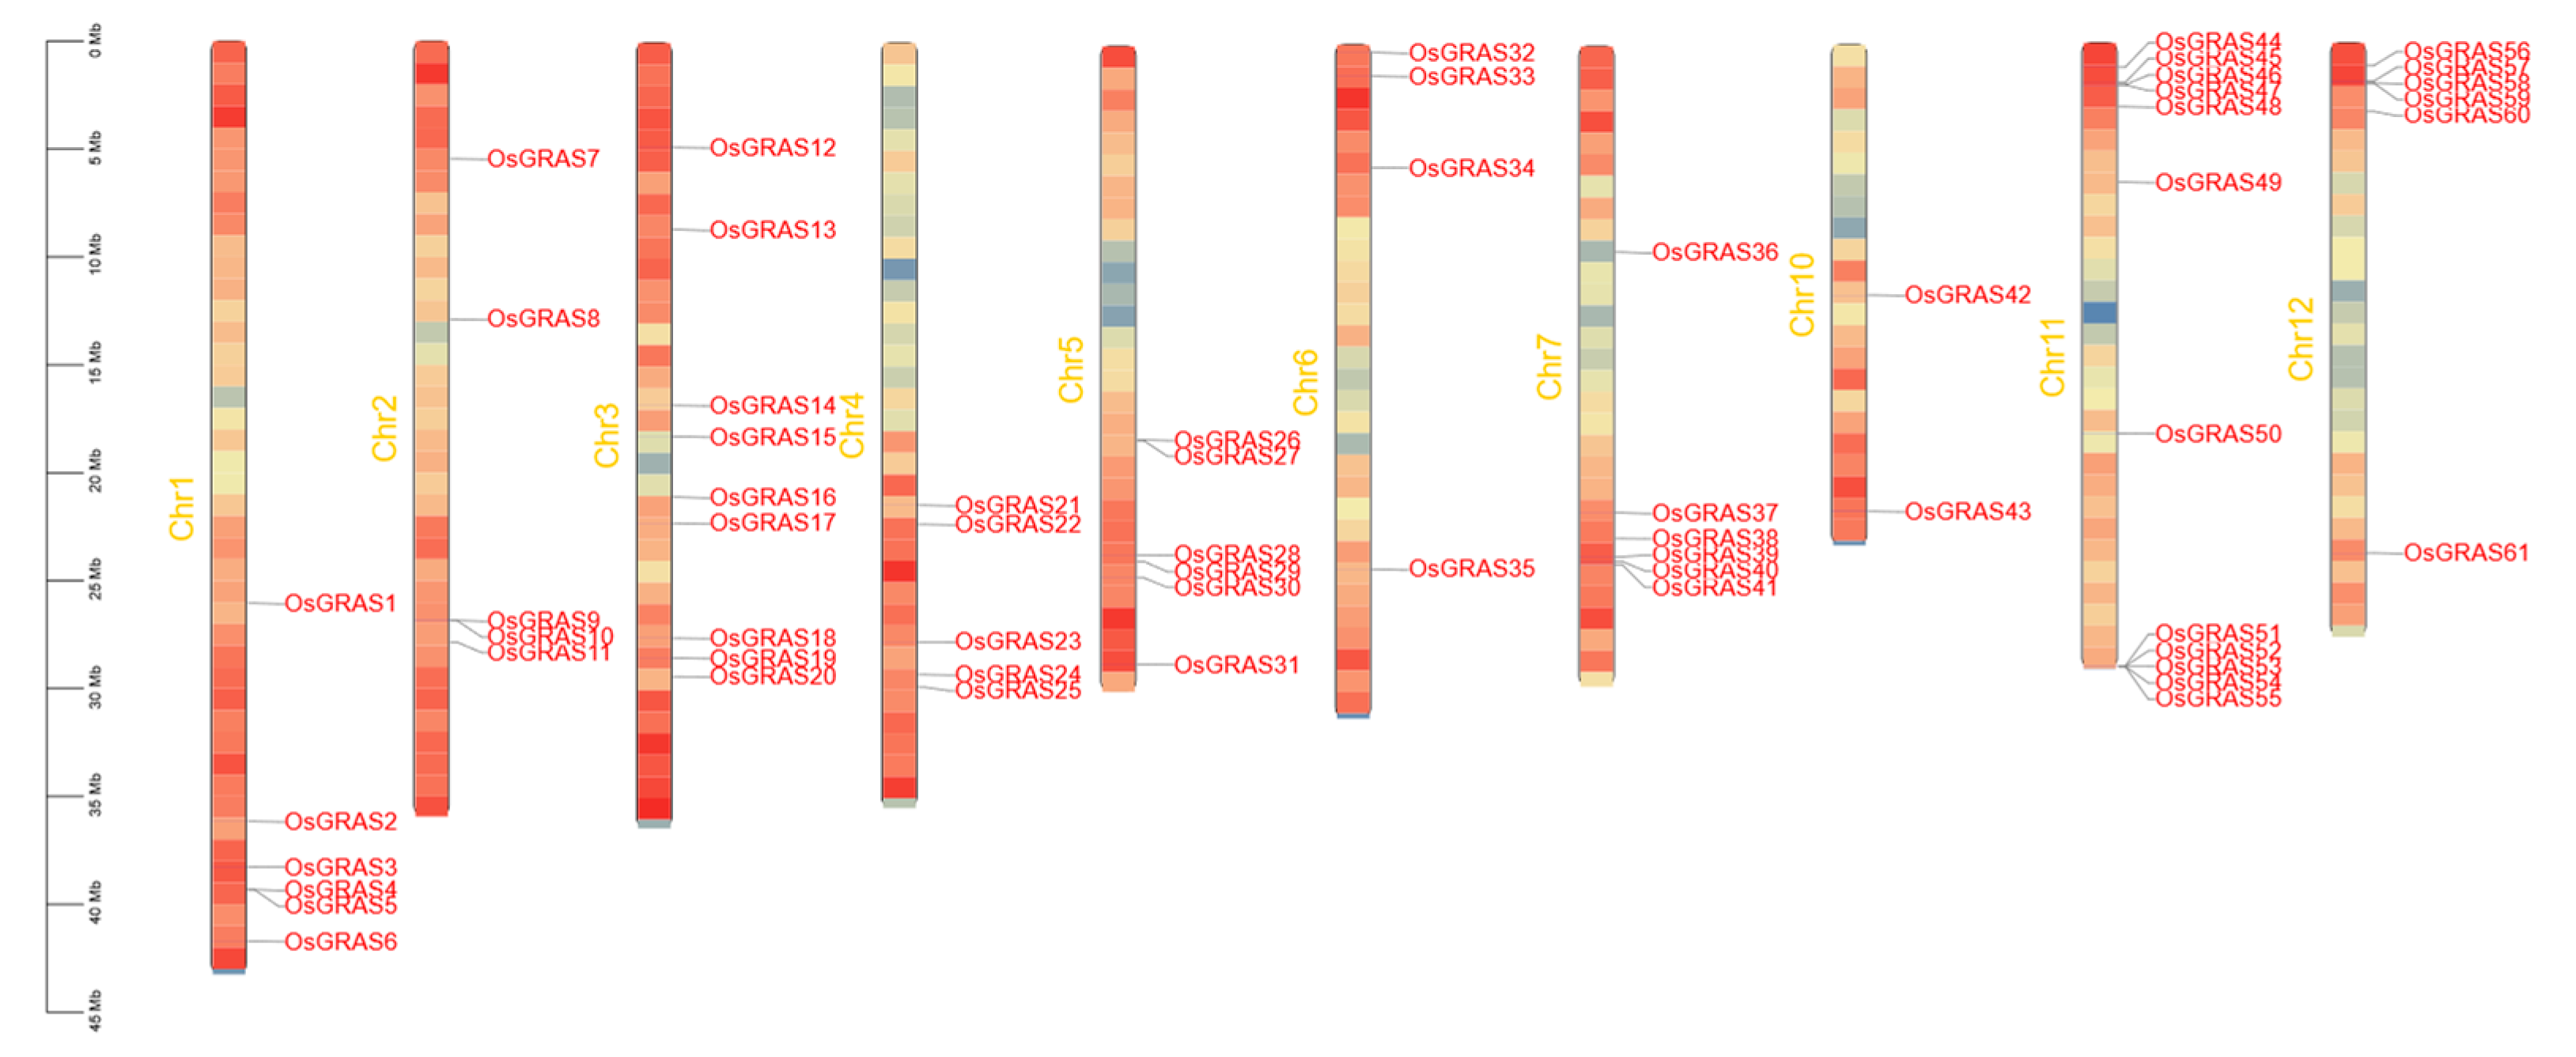
Based on the downloaded GFF3 gene information file, the identified OsGRAS genes were localized to 10 rice chromosomes (Figure 2). According to the order of the genes on the chromosomes, they were named OsGRAS1~OsGRAS61. Among the 12 chromosomes in rice, these 61 genes were unevenly distributed on 10 chromosomes, which might be caused by the segment loss or chromosome translocation during the evolutionary process. Chromosome 11 with the most abundance contained 12 genes, accounting for 19.7%. Chromosome 10 with the least distribution contained only two genes. No gene distribution was found on chromosomes 8 and 9.

3.4. Analysis of Conserved Motifs and Conserved Structural Domains of the Rice OsGRAS Gene Family

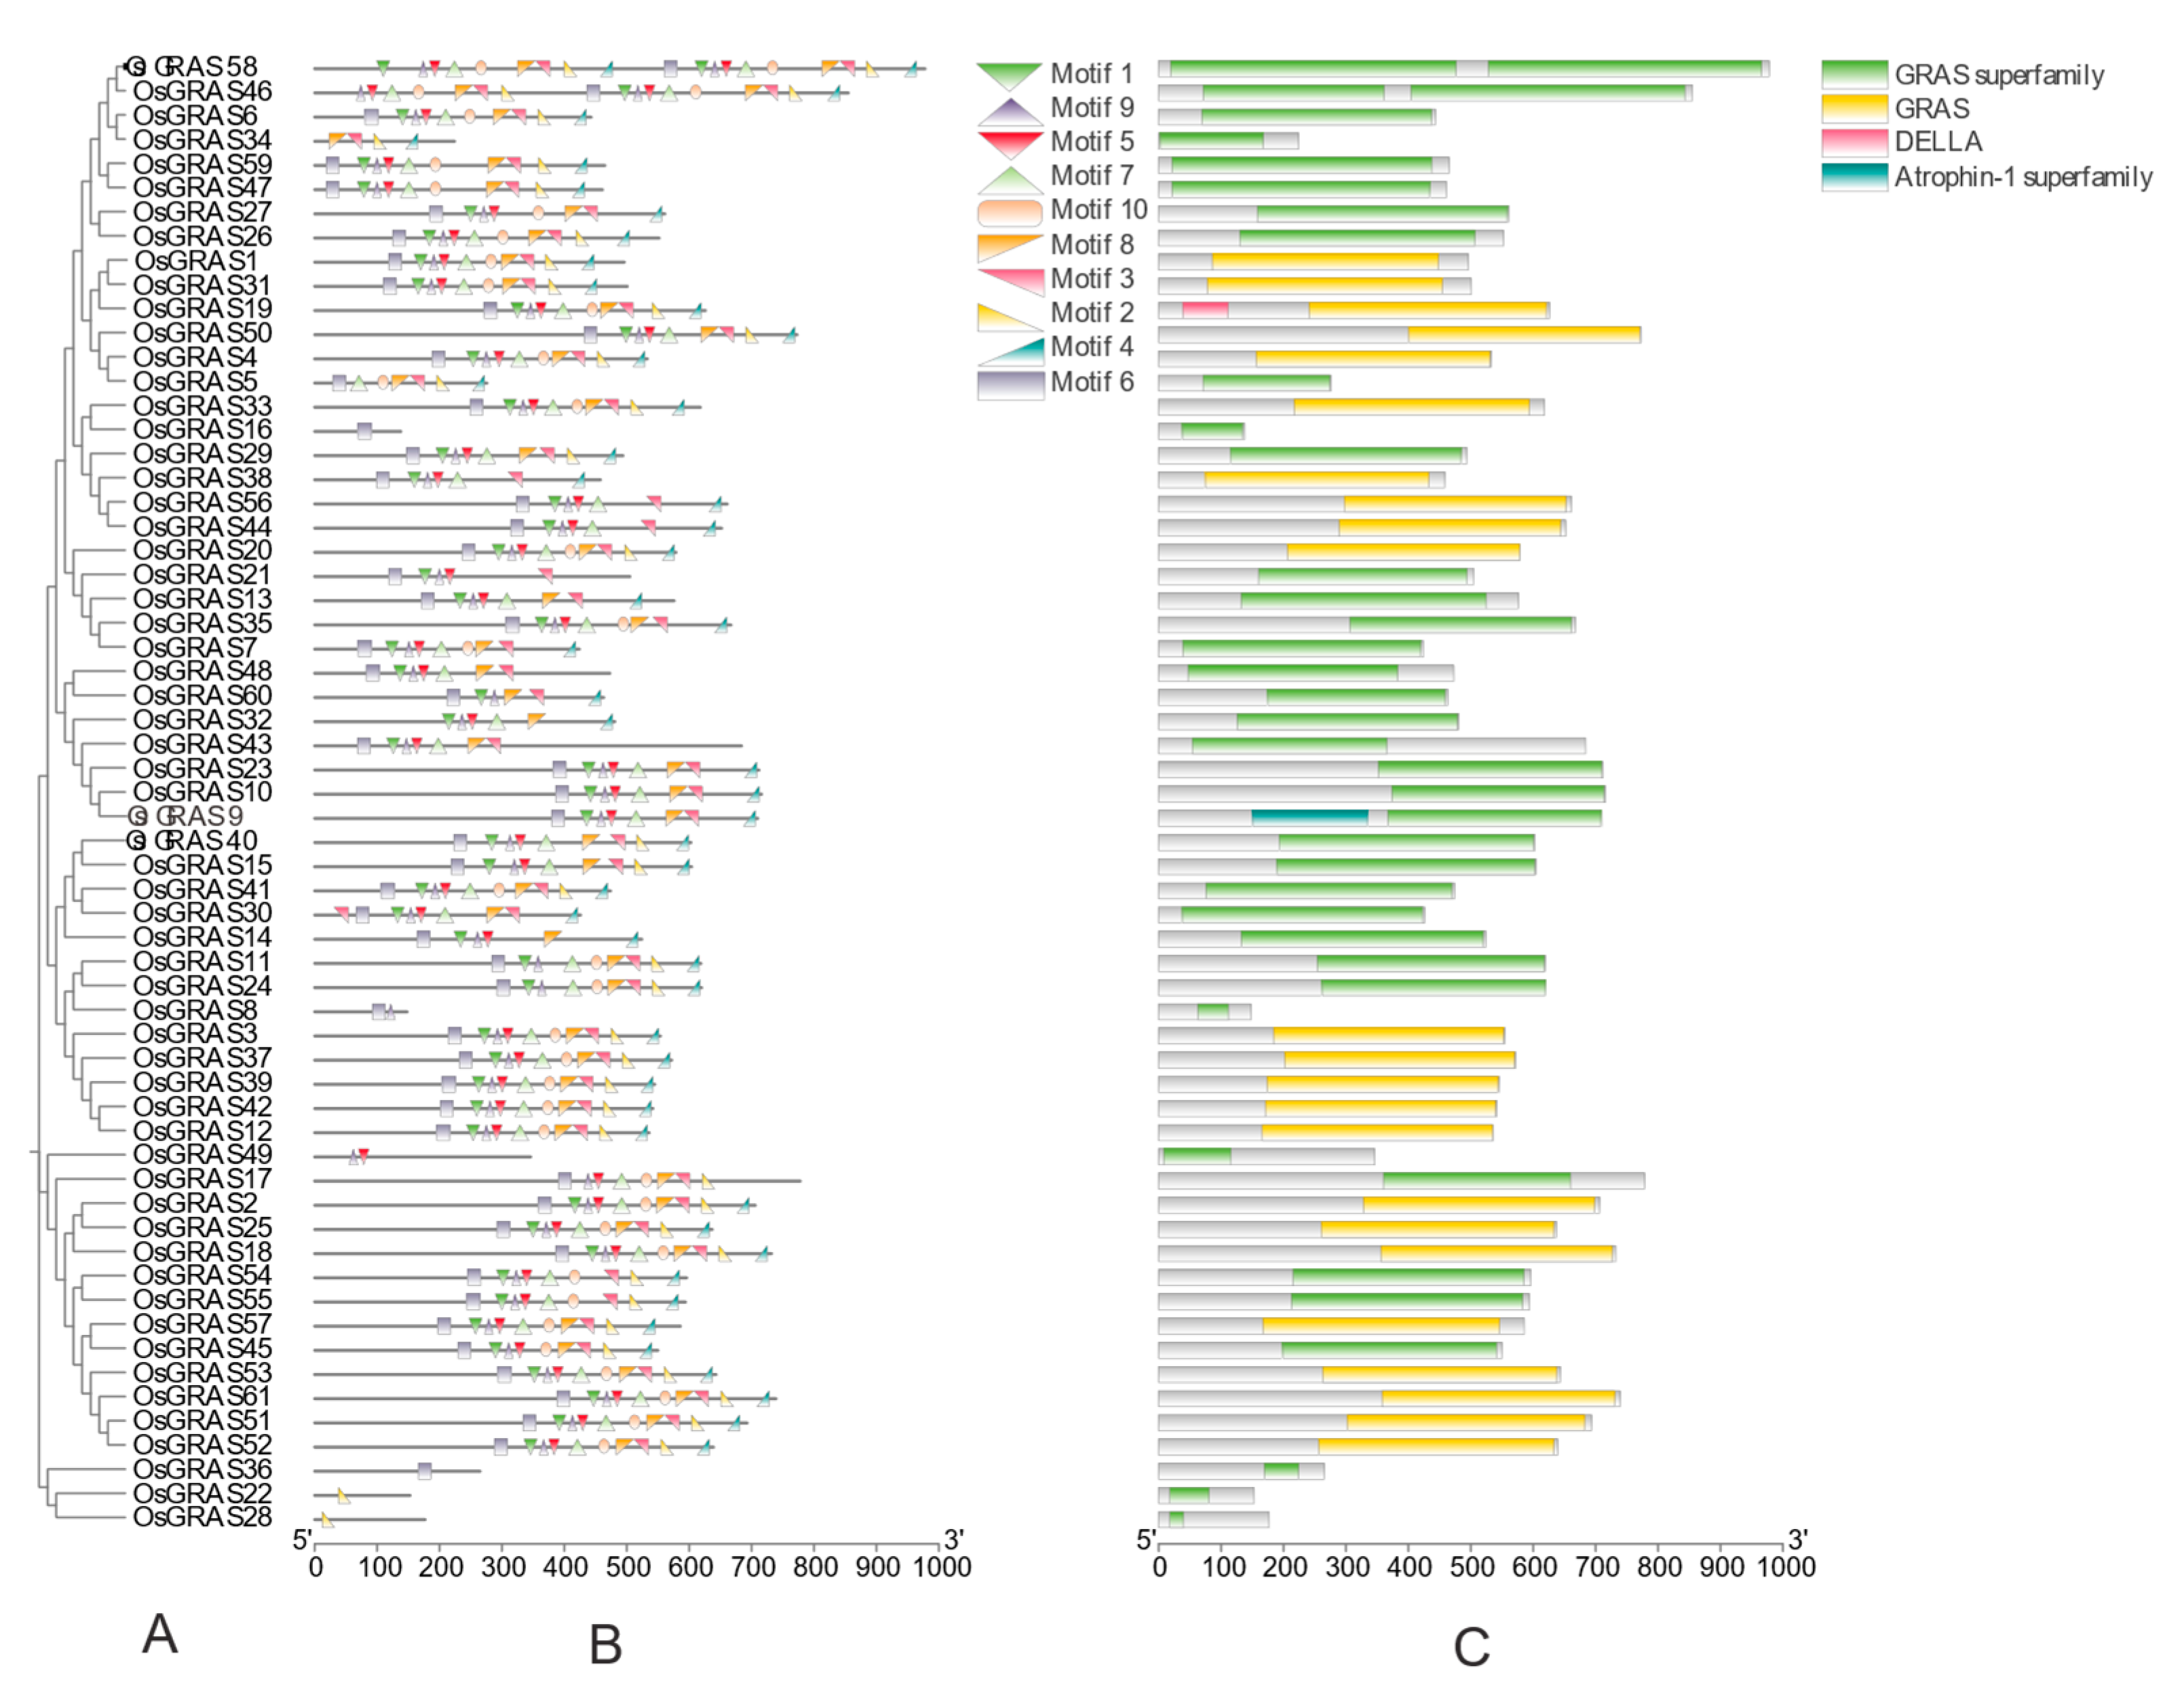
By analyzing the conserved motifs and structural domains of OsGRAS proteins (Figure 3), it was found that all OsGRAS-encoded proteins have at least one typical GRAS structural domain, and most of them are distributed with one conserved structural domain at the C-terminal end, while the N-terminal end is variable. Through the comparative analysis of conserved motifs and conserved structural domains, it was hypothesized that there was a certain correspondence. For example, OsGRAS58 has two GRAS domains, and the distribution of conserved motifs shows two special structures, motif 6, motif 1, motif 9, motif 5, motif 7, motif 10, motif 8, motif 3, motif 2, and motif 4, and it is hypothesized that each particular structure functions as a conserved structural domain. Combined with the distribution of conserved motifs and structural domains of OsGRAS19 and OsGRAS16, it can be hypothesized that motif 6 functions as an independently expressed structure. And the clustered coding proteins realized by phylogenetic analysis showed similar structures in the distribution of conserved motifs (Figure 3), for example, OsGRAS59, OsGRAS47, OsGRAS35, OsGRAS7, OsGRAS51, and OsGRAS52, which will provide an important basis for the prediction of new functional genes responding to abiotic stresses.
Observation of the E-value of conserved motifs reveals that the identified conserved motifs are highly conserved, indicating that they are essential for survival and may play a central role in stress responses. Furthermore, motif 4 contains GW repeat sequences, which can influence protein structure and function by interacting with other proteins and participating in the regulation of plant growth and development and responses to environmental stress [26]. Motif 7 contains RR motifs, which play an important role in plant stress responses and post-transcriptional regulation of gene expression [27].

3.5. Functional Clustering of Cis-Acting Elements in the GRAS Gene Family of Rice

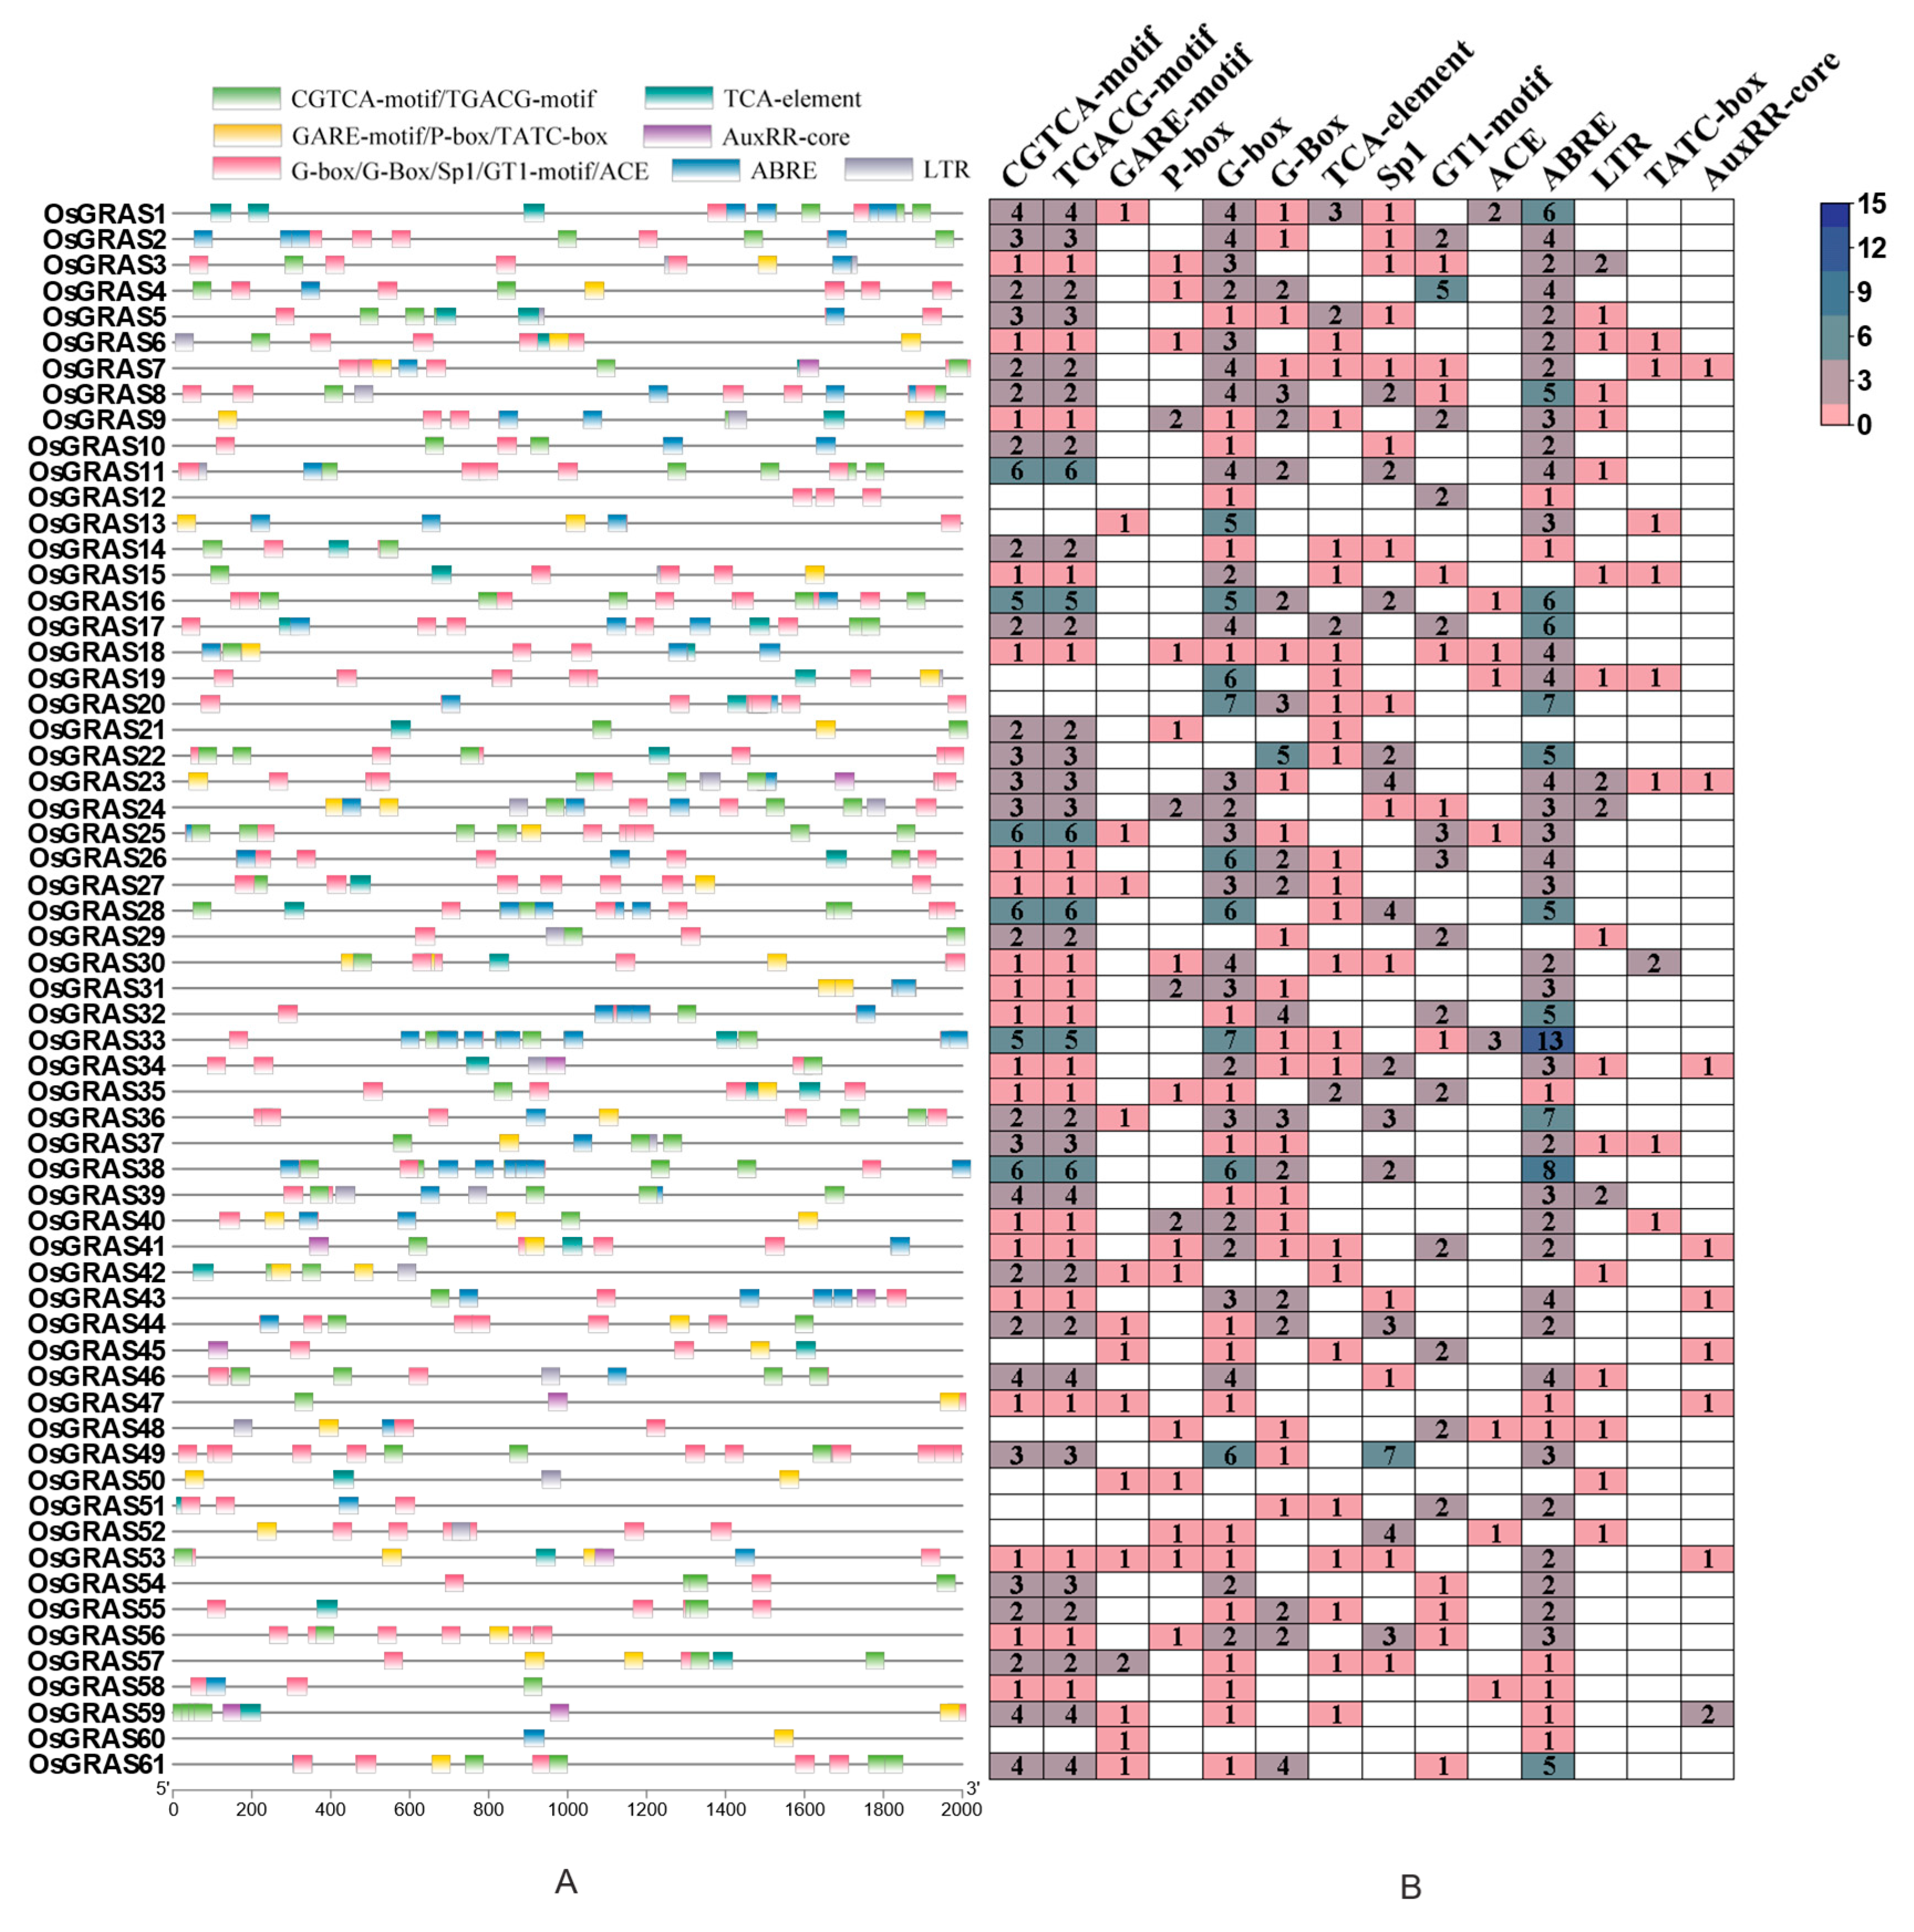
Numerous hormone response elements and stress response elements were obtained by analyzing the promoter cis-acting elements of 61 rice GRAS genes (Figure 4). Among the identified elements, methyl jasmonate response element and abscisic acid response element were the most numerous. There were 246 methyl jasmonate response elements, accounting for 28.6%, and 181 abscisic acid response elements, accounting for 21.1%. The member with the highest number of elements was OsGRAS33, with 36 cis-acting elements; the member with the lowest number of elements was OsGRAS60, with only two elements. Upon comparing the cis-acting elements of OsGRAS genes, it was found that CGTCA-motif and TGACG-motif often appeared in pairs and were identical in number. ABRE often overlapped with CGTCA-motif, TGACG-motif, G-box, G-Box, Sp1, and GT1-motif, and ABRE and G-box, Sp1 and other light-responsive elements mostly showed overlapping occurrences.
OsGRAS13, OsGRAS21, OsGRAS22, OsGRAS27, and OsGRAS29 are known OsGRAS salt-tolerant genes, and OsGRAS25 and OsGRAS55 are known OsGRAS drought-tolerant genes. CGTCA-motif, TGACG-motif, and ABRE are OsGRAS drought-tolerant genes and OsGRAS salt-tolerant genes. GT1-motif, G-box, and G-Box also have a certain role in OsGRAS drought-tolerant genes and OsGRAS salt-tolerant genes, and the distribution pattern of the above elements is similar, so it can be seen that the drought-tolerant genes and salt-tolerant genes have a certain similarity in the distribution of cis-acting elements. Research on rice has confirmed the stress response of the above elements, and similar effects have been observed in other plants. A total of 23 highly overexpressed rice genes were identified under cold, drought, salt, and heat stress conditions. Trans-regulatory analysis results indicated that 15 cis-acting elements, including ABRE, CGTCA-motif, GARE-motif, TGACG-motif, G-box, GA-motif, TCT-motif, Sp1, and MBS, contribute to the tolerance mechanism against abiotic stress [28]. Transcriptome analysis revealed that the expression of PwuWRKY48 was significantly enhanced under drought stress. Analysis of the promoter region revealed that it contained multiple cis-acting elements related to stress, such as ABRE and MYB binding sites (MBS) [29]. Comparing the number of methyl jasmonate-responsive elements and abscisic acid-responsive elements, we suspect that abscisic acid-responsive elements play a more significant role in the OsGRAS family in response to abiotic stresses.

3.6. Tissue Expression Analysis of OsGRAS Gene

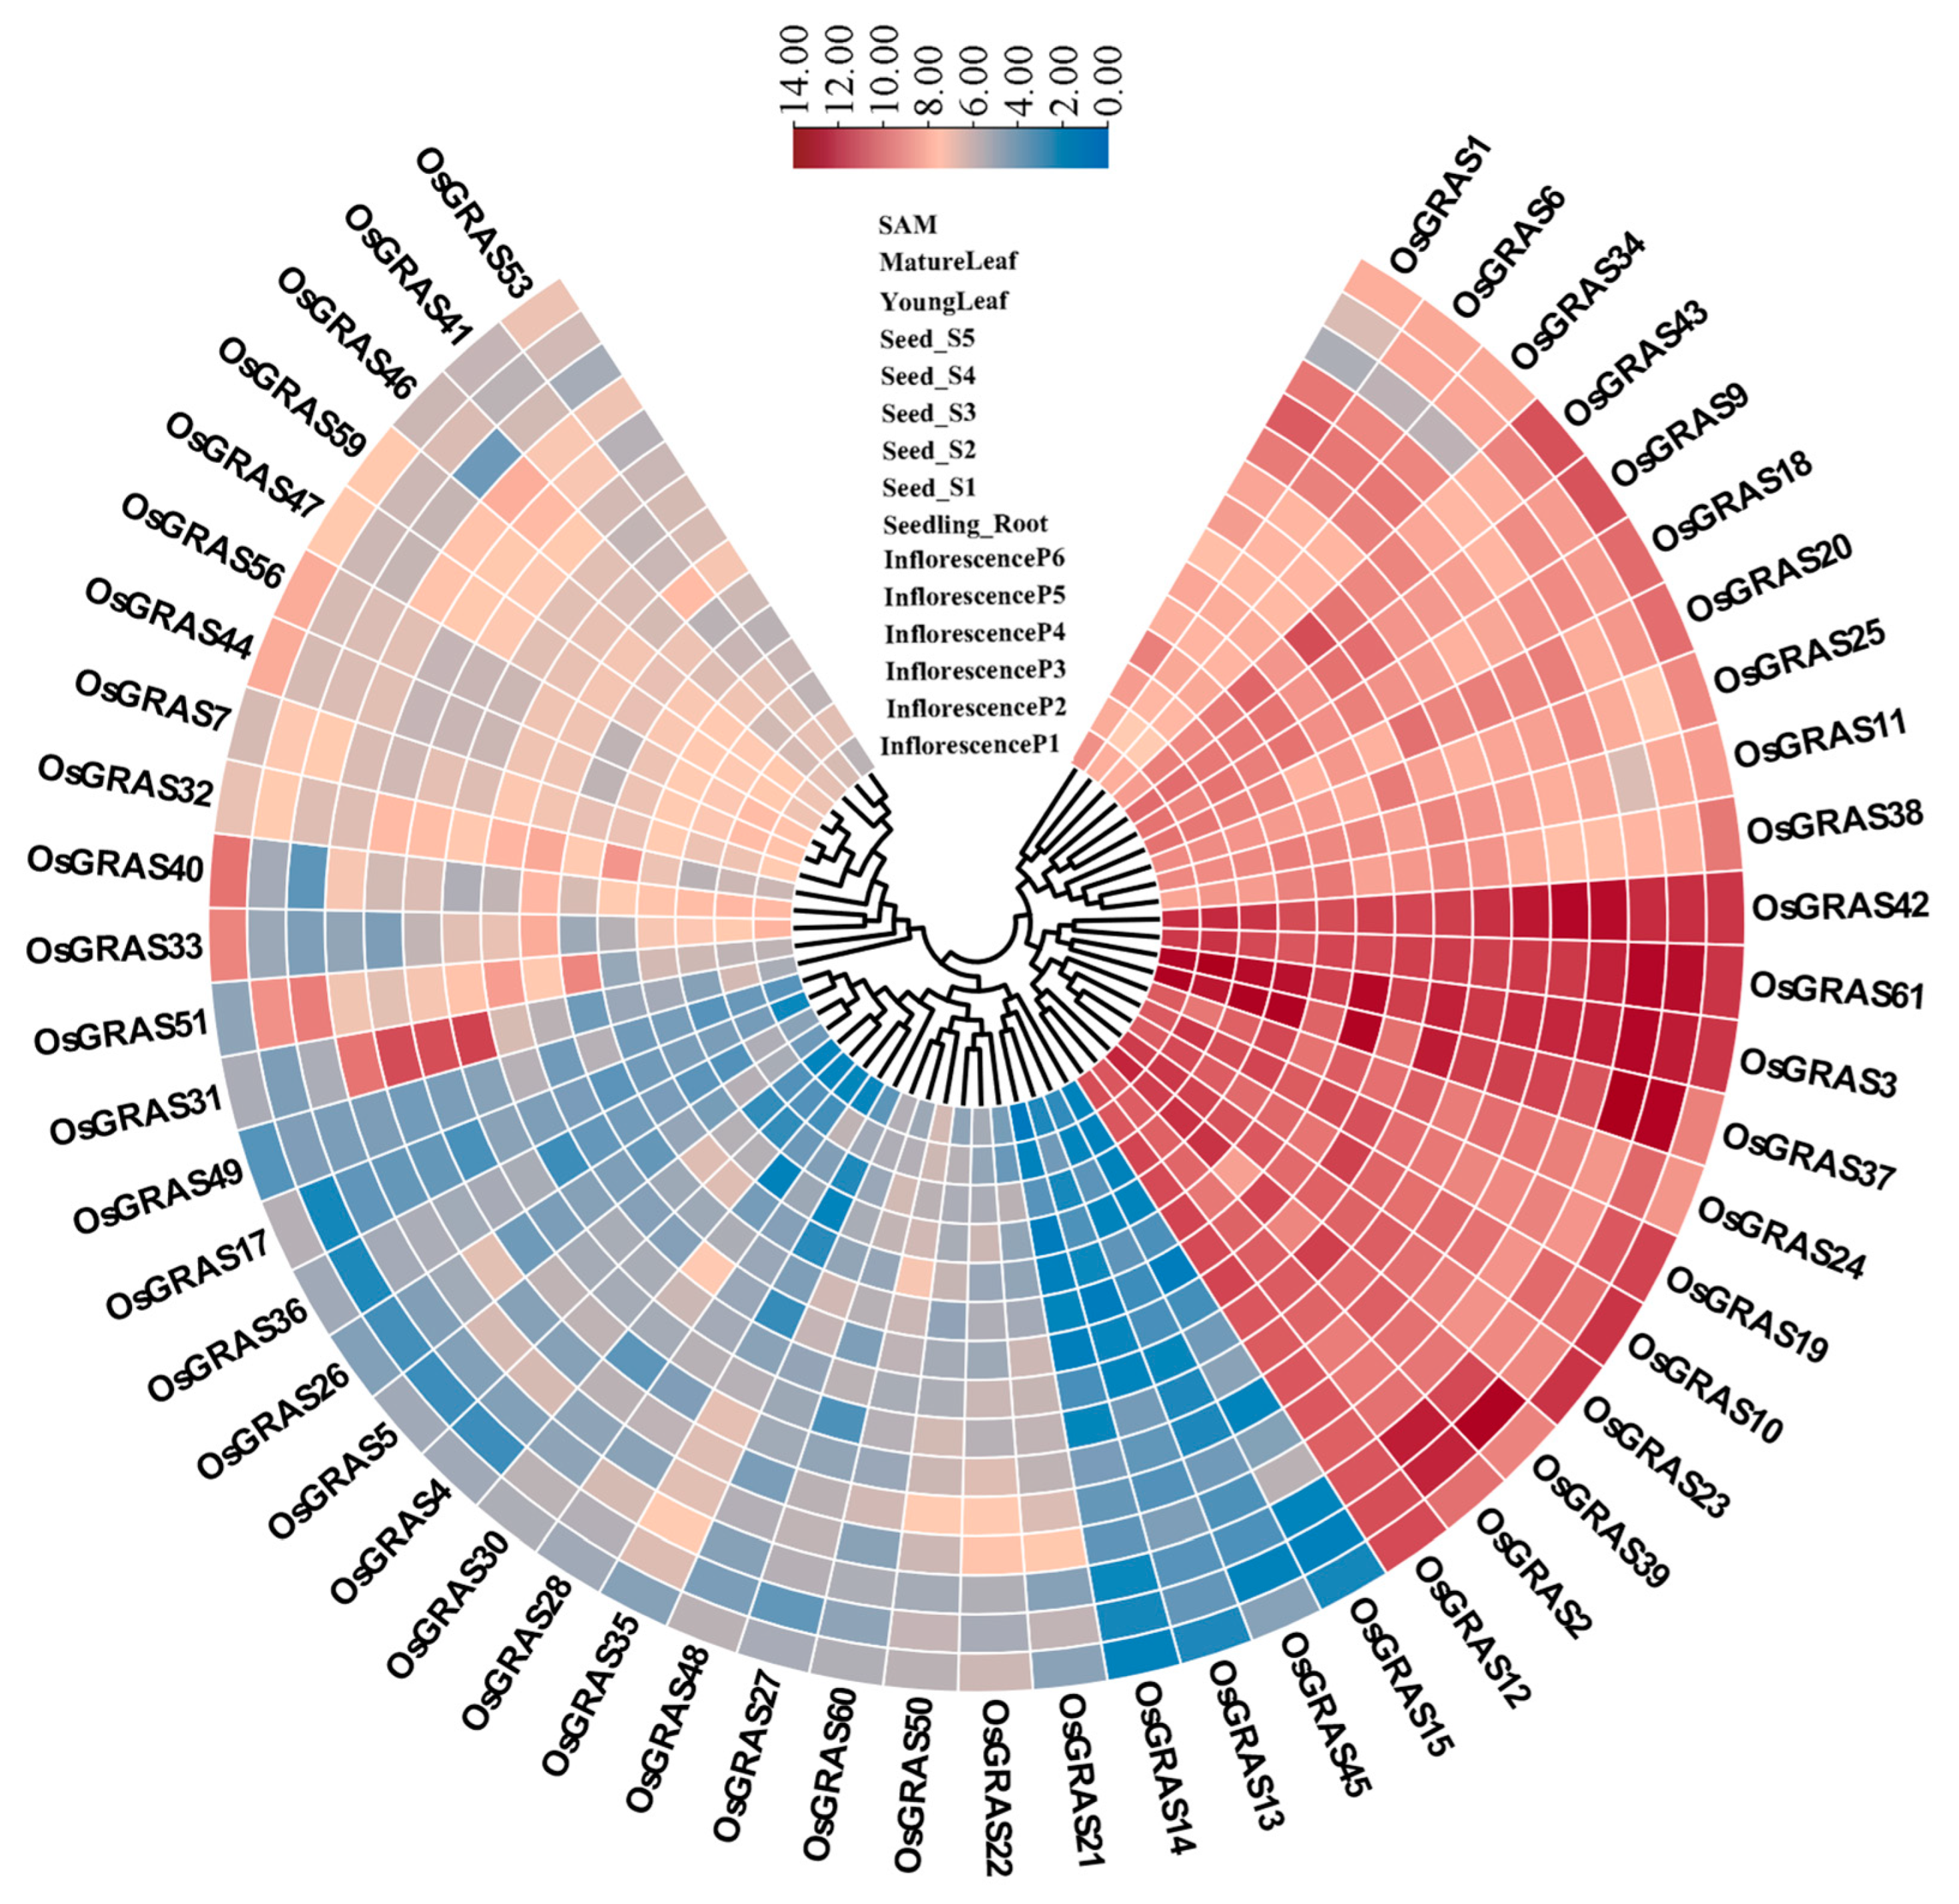
An analysis of the expression of OsGRAS genes in different tissues of rice revealed that OsGRAS3 was highly expressed at all stages of seed development (expression values: 3800–6000), possibly playing a leading role in seed maturation or storage substance accumulation. OsGRAS23 (InflorescenceP1-P3, SAM, expression values: 3100–4200), OsGRAS42 (Seed S2-S4, expression values: 4500–10,000) and OsGRAS61 (YoungLeaf, expression value: 9857.44) were significantly active at specific stages, suggesting that they regulate plant development in stages. OsGRAS37 and OsGRAS2 exhibit high expression levels during leaf development (expression values: 5700–13,000), suggesting their involvement in leaf development. OsGRAS10, OsGRAS3, and OsGRAS43 show prominent expression in roots (expression values: 2500–3500), potentially related to root development, nutrient absorption, or stress responses. OsGRAS11 (expression value: 383.32) and OsGRAS39 (expression value: 11,039.30) exhibit extremely high expression levels in mature leaves compared to the young leaf stage, suggesting their important role during the leaf maturation stage. OsGRAS10 (expression value: 4133.52), OsGRAS23 (expression value: 4130.86), and OsGRAS61 (expression value: 4131.47) exhibit high expression levels in shoot apical meristems, suggesting potential involvement in meristem differentiation or hormone signal transduction. OsGRAS13, OsGRAS14, and OsGRAS45 exhibit extremely low expression levels in all tissues (expression values: 1–20), suggesting they may only be activated under specific stress conditions or developmental stages (Figure 5).

3.7. Analysis of the Expression Level of the GRAS Gene Family in Rice

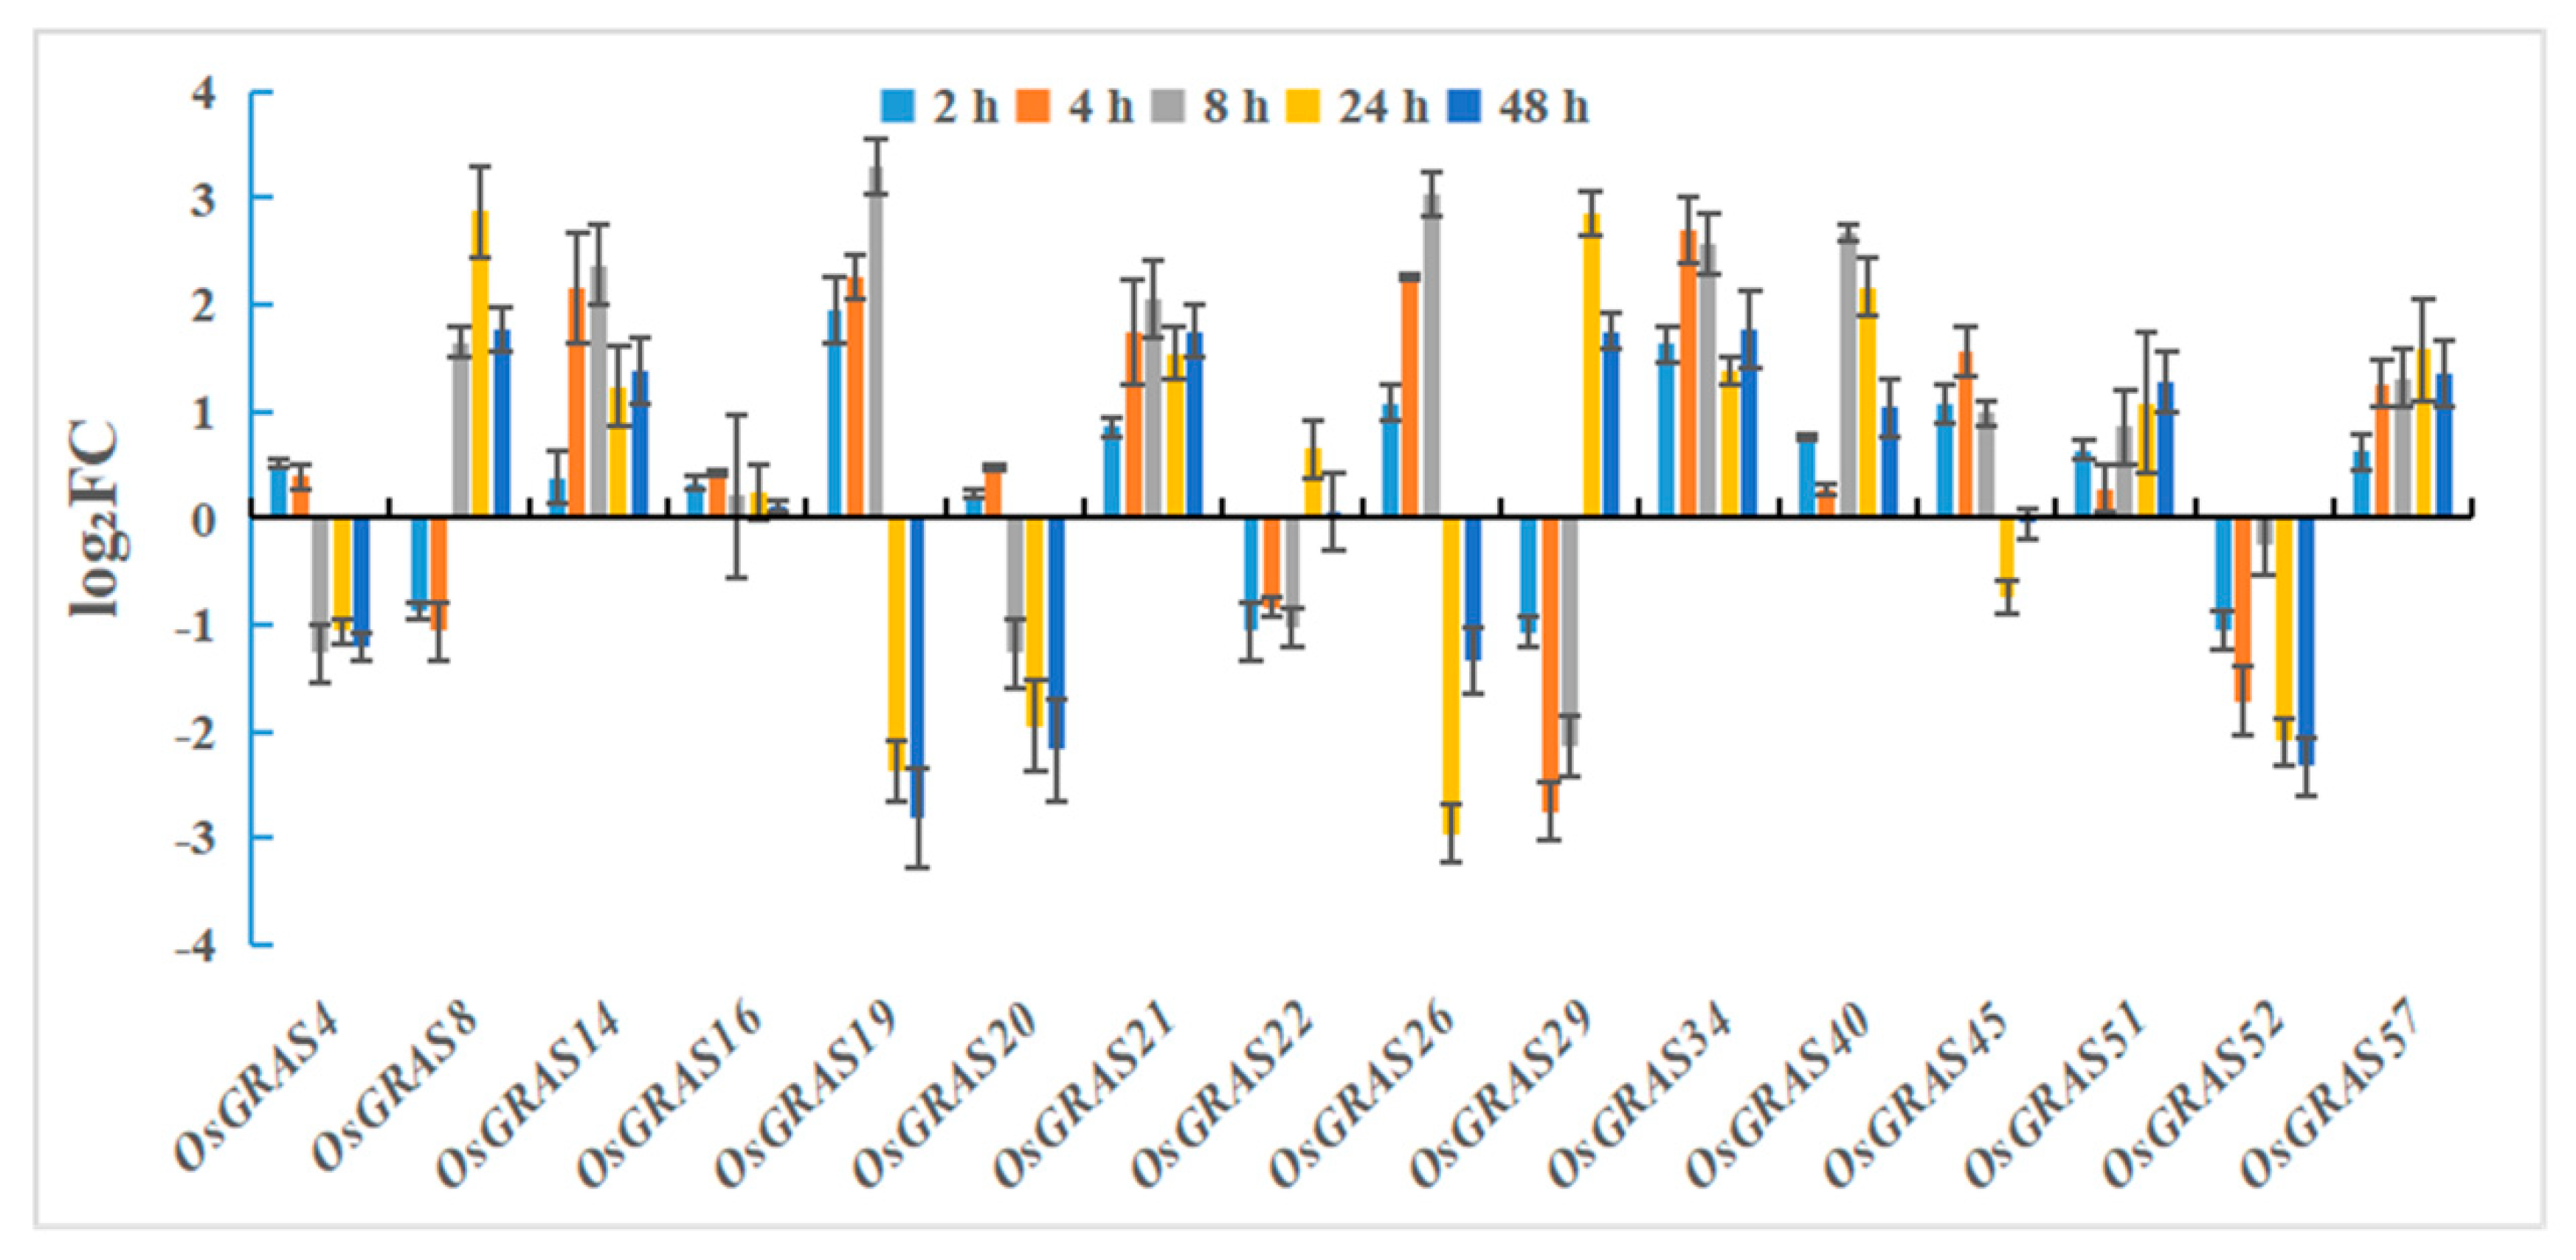
A total of 16 genes were randomly selected to design specific primers for qRT-PCR (Table 3) for expression-level analysis. The results showed that under drought stress treatment, the expression of OsGRAS19 (log2FC = 3.29), OsGRAS26 (log2FC = 3.04), and OsGRAS40 (log2FC = 2.68) peaked at 8 h, and OsGRAS14 was significantly up-regulated at 4 h (log2FC = 2.15) and 8 h (log2FC = 2.37), respectively, suggesting the important role in early stress signaling. The expression of OsGRAS8 reached the highest value at 24 h (log2FC = 2.87) and maintained for 48 h (log2FC = 1.76), suggesting that it may be involved in the regulation of long-term drought tolerance. On the contrary, the expression of OsGRAS19 (24 h: log2FC = −2.37; 48 h: log2FC = −2.82), OsGRAS20 (24 h: log2FC = −1.95; 48 h: log2FC = −2.17), OsGRAS26 (24 h: log2FC = −2.96; 48 h: log2FC = −1.34), and OsGRAS52 (24 h: log2FC = −2.09; 48 h: log2FC = −2.33) decreased sharply at 24 h, suggesting that the expression of these genes may be regulated by a negative feedback mechanism or related to the stage-specific stress response [30], while the expression of OsGRAS14 (4 h: log2FC = 2.15; 8 h: log2FC = 2.37), OsGRAS21 (8 h: log2FC = 2.06; 48 h: log2FC = 1.75), OsGRAS34 (4 h: log2FC = 2.69; 8 h: log2FC = 2.57), and OsGRAS57 (24 h: log2FC = 1.58; 48 h: log2FC = 1.36) was consistently up-regulated at multiple time points, suggesting a sustained role in drought stress adaptation in rice (Figure 6).
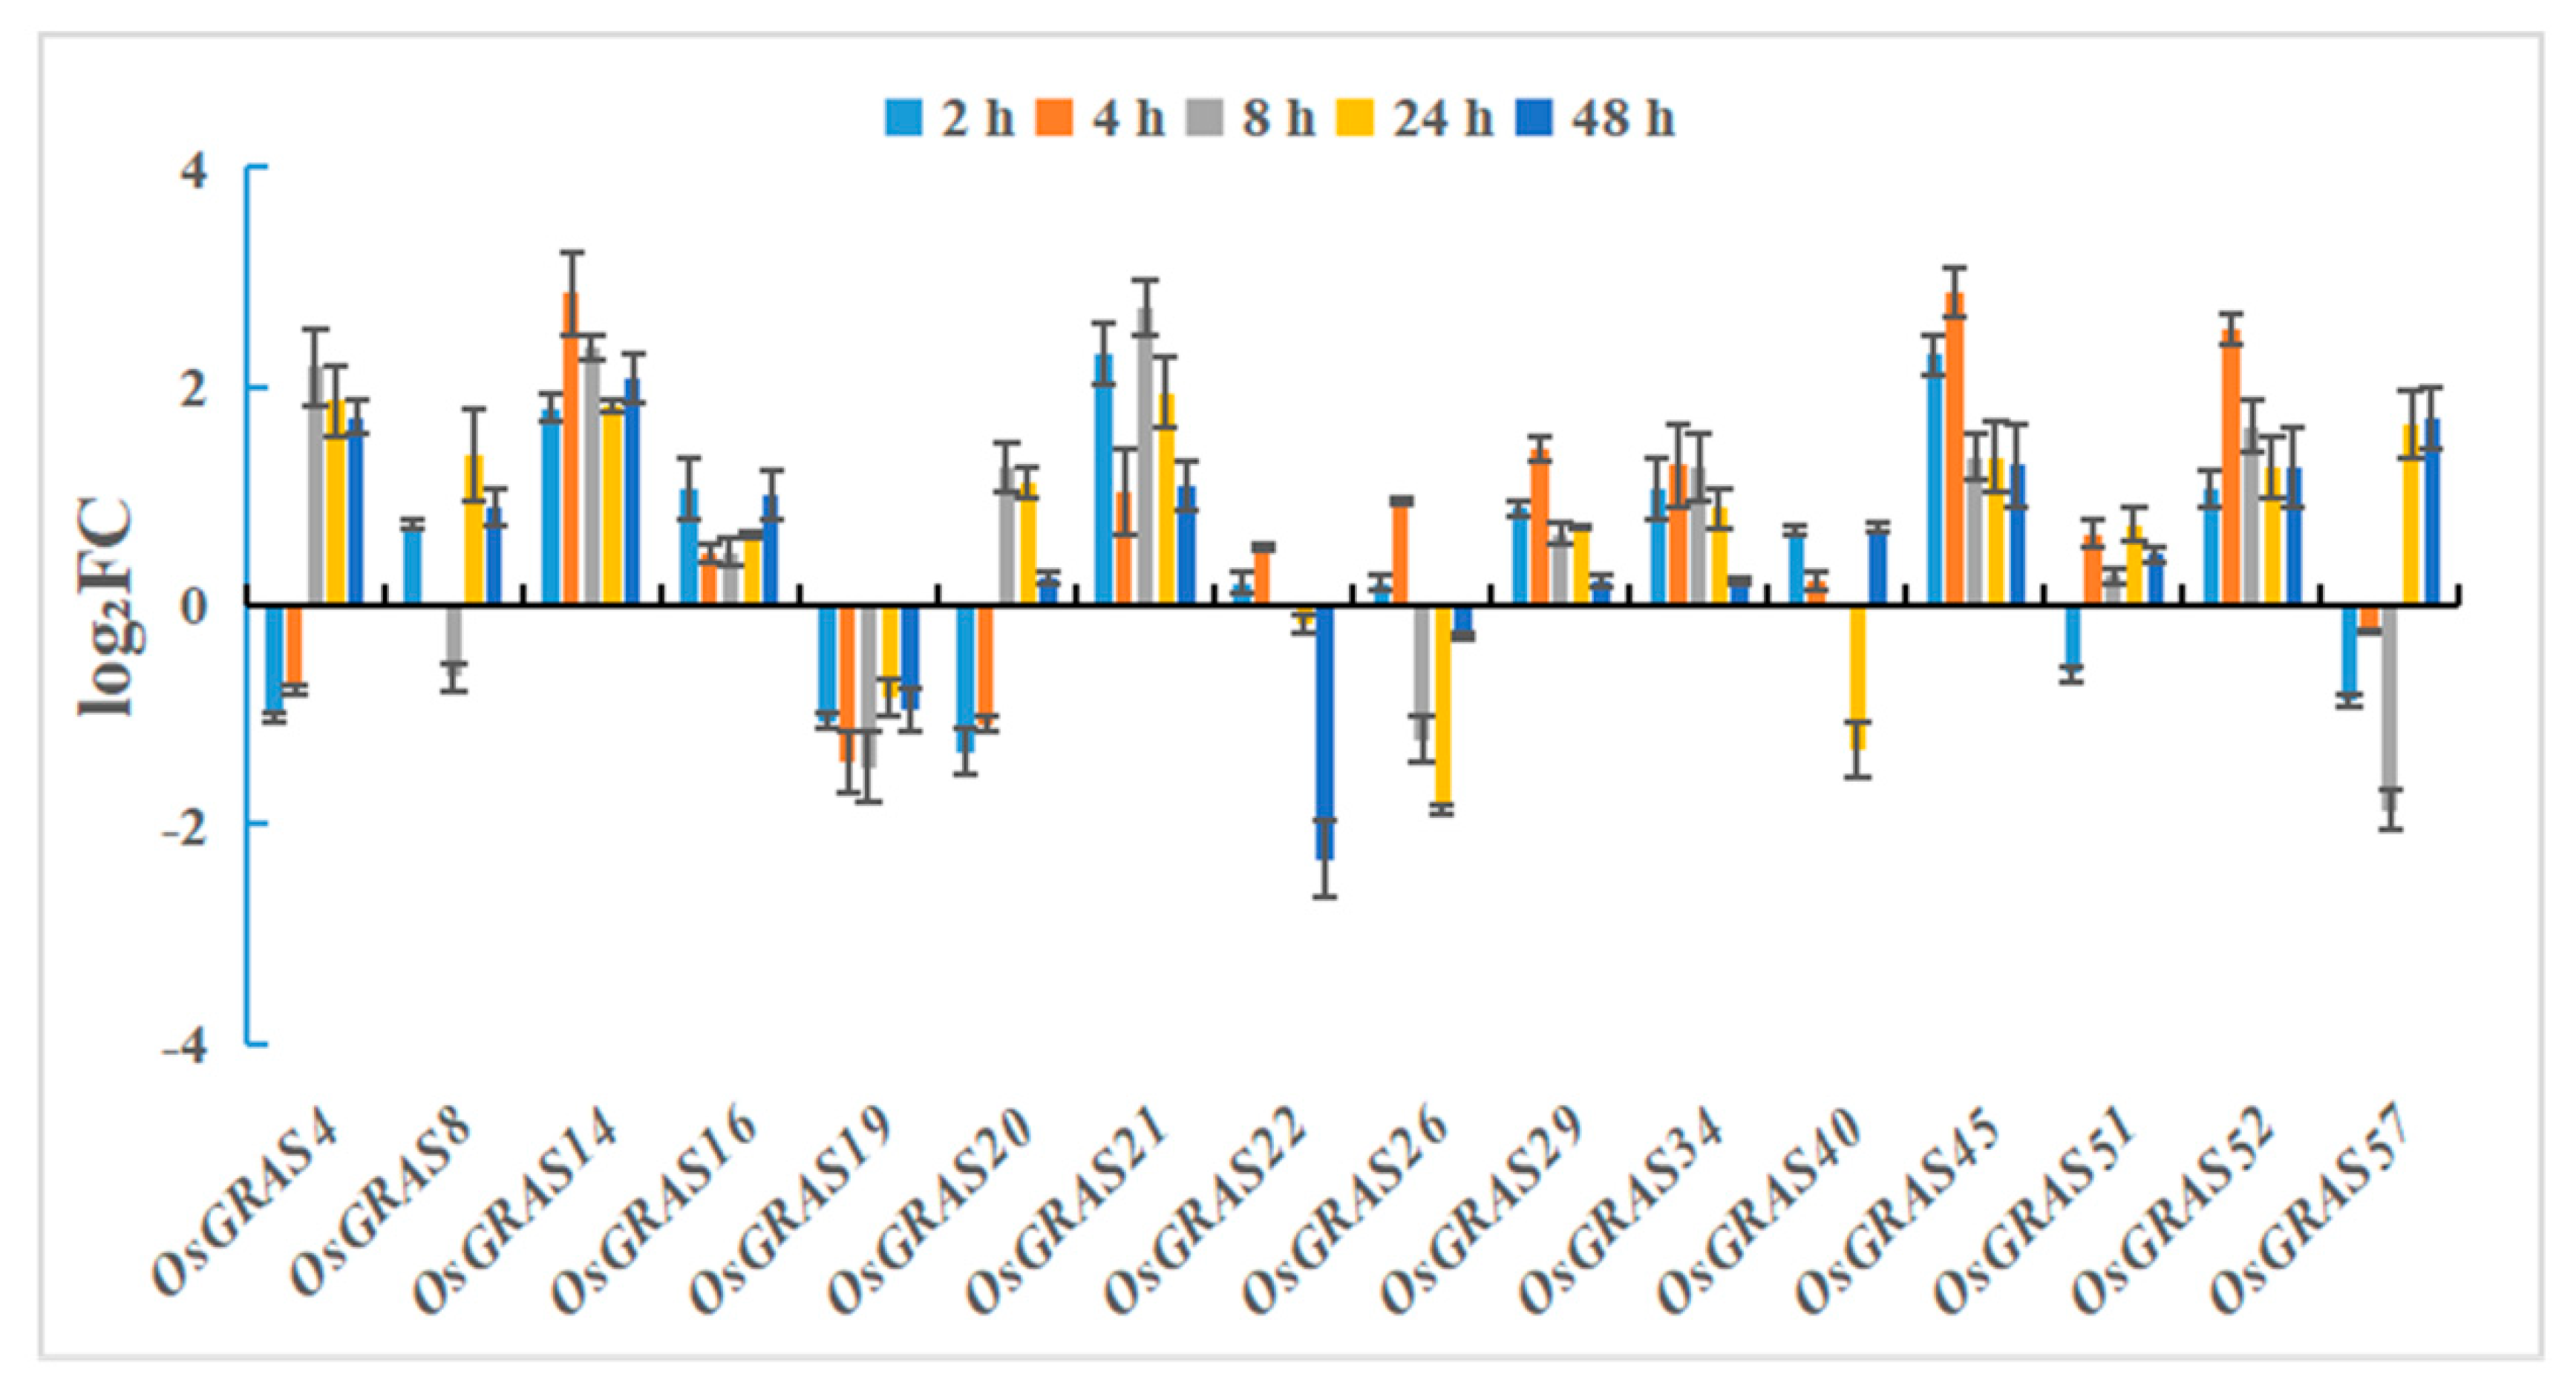
Under salt stress treatment, OsGRAS14 showed significant up-regulation at all detected time points (log2FC: 1.81–2.85), especially peaking at 4 h (log2FC = 2.85), suggesting a sustained regulatory role in salt stress response. Similarly, OsGRAS45 responded rapidly at 2 h (log2FC = 2.29) and maintained high expression at 48 h (log2FC = 1.28), suggesting the involvement in early signaling and long-term tolerance. OsGRAS4 was significantly up-regulated at 8 h (log2FC = 2.18), whereas it gradually declined in the early (2 h: log2FC = −1.02) and late stages (24 h: log2FC = 1.87; 48 h: log2FC = 1.72). OsGRAS21 showed a bimodal response, with two peaks of expression at 2 h (log2FC = 2.31) and 8 h (log2FC = 2.72), suggesting that it may play a possible role in the stress perception and adaptive reestablishment in a staged manner. OsGRAS57 showed dramatic up-regulation at 24–48 h (24 h: log2FC = 1.65; 48 h: log2FC = 1.71) and significant suppression at the early stage (2 h: log2FC = −0.86; 8 h: log2FC = −1.87), suggesting a time-dependent function. OsGRAS19 was significantly down-regulated at all time points, with log2FC values ranging from −0.84 to −1.47, and the deepest suppression occurred at 4–8 h (4 h: log2FC = −1.43; 8 h: log2FC = −1.47), suggesting that this gene may be negatively regulated by salt stress. OsGRAS22 showed a dramatic decrease in expression at 48 h (log2FC = −2.32), while OsGRAS26 showed the lowest value at 24 h (log2FC = −1.86), speculating that these genes may be involved in the salt-sensitive pathway (Figure 7).

4. Discussion

Conservative motifs play an important role in stress responses. Under stress conditions, GW repeat sequences may exert their effects by influencing the transcription and translation of related genes. For example, WD40 proteins (a type of protein containing GW repeat sequences) may regulate gene expression by affecting the activity of transcription factors or the stability of mRNA, thereby enhancing the stress resistance of plants [31]. GW repeat sequences may also participate in plant signal transduction pathways. Some proteins containing GW repeat sequences may act as calcium-binding proteins, regulating intracellular calcium ion concentrations [32]. In this way, GW repeat sequences can integrate different stress signals and coordinate the physiological and metabolic processes of plants [33]. Phosphorylation is an important modification in cellular signal transduction that regulates protein activity, stability, and localization. The RR motif may serve as a recognition site for protein kinases, thereby influencing the phosphorylation level of proteins [34]. Under stress conditions, cells need to transport certain proteins to specific locations to respond to stress. Studies have shown that RR motifs can function as part of signal peptides, guiding proteins into organelles such as the endoplasmic reticulum or mitochondria [35]. In plant cells, many stress response processes require the coordinated action of multiple proteins to be completed. RR motifs may serve as domains for protein–protein interactions, mediating interactions between proteins [36].
Previous studies have reported two OsGRAS genes with drought tolerance functions, namely OsGRAS25 and OsGRAS55 [37,38], as well as five OsGRAS genes that respond to salt stress (OsGRAS13, OsGRAS21, OsGRAS22, OsGRAS27, and OsGRAS29) [14]. Based on the results of systematic evolutionary clustering of the OsGRAS family and analysis of conserved motifs in the encoded proteins, it was found that the nine genes OsGRAS2, OsGRAS18, OsGRAS54, OsGRAS57, OsGRAS45, OsGRAS53, OsGRAS61, OsGRAS51, and OsGRAS52 belong to the LISCL subfamily, along with the known drought-tolerant functional genes OsGRAS25 and OsGRAS55, and they share similar conserved motif arrangements with OsGRAS25 and OsGRAS55, specifically motif 6, motif 1, motif 9, motif 5, motif 7, motif 10, motif 8, motif 3, motif 2, and motif 4. Additionally, we found that OsGRAS6, OsGRAS59, OsGRAS47, OsGRAS26, and OsGRAS27 belong to the SCL3 subfamily and share a similar conserved motif arrangement structure with OsGRAS27. OsGRAS35 and OsGRAS7 belong to the MOC subfamily and share a similar conserved motif arrangement structure with OsGRAS13. Therefore, this study predicted nine new genes potentially associated with drought tolerance (OsGRAS2, OsGRAS18, OsGRAS54, OsGRAS57, OsGRAS45, OsGRAS53, OsGRAS61, OsGRAS51, and OsGRAS52) and six new genes potentially associated with salt tolerance (OsGRAS6, OsGRAS59, OsGRAS47, OsGRAS26, OsGRAS35, and OsGRAS7). These genes may play important roles in the stress response process of rice.
Phytohormone responses in drought-stressed environments are usually realized in multiple ways. On the one hand, drought leads to an imbalance in plant water status, which in turn induces the synthesis of abscisic acid and promotes stomatal closure. This process is regarded as an adaptive response of plants to drought. In addition, auxin, cytokinins, jasmonates, and salicylic acid are also involved in the regulation of stomatal aperture. ABA (abscisic acid), JAs (jasmonates), BRs (brassinosteroids), and SA (salicylic acid) act as positive regulators of stomatal closure, whereas auxin and cytokinins usually act as positive regulators of stomatal opening [39]. On the other hand, jasmonates (JAs), a class of lipid-derived compounds produced in plants, act as signaling molecules involved in the regulation of abiotic stresses such as drought, low temperature, and high salt, etc. [40]. The main signaling molecular forms of JAs include jasmonic acid, methyl jasmonate (MeJA), and jasmonic acid–isoleucine complexes [41], which function in the alleviation of drought stresses of various crops. Studies have shown that exogenous MeJA treatment can increase the photosynthetic rate of plants under drought stress conditions. When leaves were sprayed with exogenous MeJA or steam treated, the stomatal conductance of the leaves was reduced, thus weakening the transpiration of plants [42]. Therefore, the methyl jasmonate response elements (CGTCA-motif, TGACG-motif) and abscisic acid response elements (ABRE) of OsGRAS25 and OsGRAS55 all exhibit high levels. Based on the distribution levels of these three types of elements (CGTCA-motif, TGACG-motif, and ABRE), drought-tolerant genes were predicted (OsGRAS1, OsGRAS11, OsGRAS16, OsGRAS28, OsGRAS33, OsGRAS38, OsGRAS46, OsGRAS61).
The main mechanism of plant adaptation to high salt concentrations is the maintenance of intracellular ion homeostasis by regulating the influx and efflux of excess sodium and chloride ions across the plasma membrane and vesicular ion sequestration [43]. It has been shown that many genes responsive to hyperosmotic and hypertonic stresses are regulated by ABRE (ABA-responsive element) and DRE/CRT (dehydration-responsive element/C-repeat element) [44]. Abscisic acid acts as a central regulator of stress acclimation and growth retardation, mediating key processes in seed germination, development, and plant stress response that are regulated by ABA synthesis and ABA-dependent signaling pathways [45,46,47]. Research has found that some transcription factors can promote ABA accumulation by binding to the G-box element in the ABA biosynthesis gene promoter, and this binding is further enhanced after treatment with 200 mM NaCl [48]. Under dehydration conditions such as drought and high salinity, ABA activates SnRK2 family protein kinases (e.g., Arabidopsis OST1/SRK2E, fava bean AAPK), which phosphorylate the conserved regions of AREB/ABF (such as the C1–C4 domains), thereby activating them and enabling them to bind to ABRE, which in turn initiates downstream gene transcription and participates in the endogenous and exogenous regulation of plant cell water homeostasis [49]. When observing the response of OsGRAS genes to salt stress, it was found that the ABREs of OsGRAS22, OsGRAS27, and OsGRAS13 exhibited high expression levels, and the expression levels of G-box and G-Box were also elevated. Based on this pattern, genes such as OsGRAS1, OsGRAS2, OsGRAS8, OsGRAS11, OsGRAS16, OsGRAS17, OsGRAS28, and OsGRAS49 were identified, suggesting that they may participate in similar stress response processes.
Analysis of the expression patterns of OsGRAS genes in different tissues revealed that the expression of DELLA subfamily members was generally high, especially during seed development, a phenomenon that may be closely related to the key role of the DELLA subfamily in plant growth and development [50]. In addition, the highly expressed OsGRAS genes were mainly concentrated in the PAT1 and HAM subfamilies. PAT1 is a specific member of the GRAS family that regulates the plant development process by interacting with light signals through the photosensitive pigment a [51], and HAM maintains the stem cell activity of the meristem by emitting non-cell-autonomous signals from differentiated tissues and synergizing with endogenous factors (such as WUS and STM), thereby ensuring the continuous growth and organogenesis of plants [52], both of which are important subfamilies in the plant development process.
Experimental verification revealed that some OsGRAS genes showed significant differences in expression. According to research, ABA is an important signaling molecule in plants’ response to drought and salt stress [53]. In this study, the expression levels of OsGRAS14 and OsGRAS21 were significantly up-regulated under both stress treatments. Observation of the distribution of their cis-acting elements revealed that the methyl jasmonate response elements of OsGRAS14 and OsGRAS21 were distributed more widely. MeJA may indirectly influence the expression of downstream genes by regulating ABA synthesis or signal transduction under abiotic stress, inducing plants to synthesize defense compounds and activating gene expression related to systemic acquired resistance (SAR) and local resistance [54,55]. This indicates that these genes may be promoted by MeJA and actively respond to abiotic stress. This study also found that OsGRAS52 was significantly suppressed under drought stress and significantly up-regulated under salt stress. It is speculated that the two stresses affect gene expression through different signaling pathways, which is one of the reasons for the differential expression. Drought stress typically activates ABA-dependent signaling pathways, while salt stress may rely more on non-ABA pathways such as osmotic regulation and ion balance [56]. For example, salt stress may activate calmodulin-dependent protein kinases to regulate the activity of ion channels and transporters, thereby maintaining intracellular ion balance [57]. Therefore, differences in the upstream signaling pathways activated by drought and salt stress lead to different downstream gene expression patterns. In addition, the complex cross-regulation between drought and salt stress is another reason. For example, the ABA signaling pathway plays a role in both drought and salt stress, but its mode of action and regulatory targets may differ [53].
Based on the above discussion, this study proposes a hypothesis regarding the potential mechanisms underlying the stress tolerance of OsGRAS14 and OsGRAS21: OsGRAS14 and OsGRAS21 promote increased MeJA synthesis. Once the MeJA signal is detected, it triggers downstream signaling pathways, activating transcription factors [58], or OsGRAS14 and OsGRAS21 act as transcription factors by binding to the G-box elements in the promoters of ABA biosynthetic genes, thereby promoting ABA accumulation. ABA activates SnRK2 family protein kinases, which phosphorylate the conserved regions of AREB/ABF, activating them to bind to ABRE and subsequently initiate downstream gene transcription, thereby resisting external stress.

5. Conclusions

Compared with previous studies, this study conducted a bioinformatic analysis of the GRAS family in rice based on the latest rice genome sequence. According to information such as promoter element distribution and protein structure, new GRAS family members that may respond to abiotic stress were identified. The functions of some of these genes were further verified through tissue expression profiling and real-time fluorescent quantitative PCR; for example, the expression levels of OsGRAS14 and OsGRAS21 were significantly up-regulated under both stress treatments, while OsGRAS52 showed completely opposite expression levels under both stress treatments, leading to the hypothesis that these genes may play a role in stress tolerance mechanisms. However, genes such as OsGRAS1, OsGRAS11, OsGRAS28, OsGRAS33, and OsGRAS38 have not yet been experimentally validated for their functions, which warrants further attention in future studies. Overall, this study contributes to a deeper understanding of the molecular basis of rice stress response mechanisms and provides new insights and approaches for genetic improvement of rice.

Supplementary Materials

The supporting information can be downloaded at: https://www.mdpi.com/article/10.3390/ijpb16030095/s1.

Author Contributions

Conceptualization, M.Z. and Y.P.; methodology, Y.Z.; software, D.L.; validation, M.Z., Y.P. and Y.Z.; formal analysis, M.Z.; investigation, D.L.; resources, M.Z.; data curation, D.L.; writing—original draft preparation, M.Z.; writing—review and editing, Y.P.; visualization, D.L.; supervision, Y.P.; project administration, Y.Z.; funding acquisition, M.Z. All authors have read and agreed to the published version of the manuscript.

Funding

This research was funded by National Natural Science Foundation of China, grant number 31000125; the Natural Science Foundation of Hunan Province, grant number 2019JJ40117; National College Students Innovation and Entrepreneurship Training Program, grant number s202410537016, s202410537017.

Data Availability Statement

The data is included in the Supplementary Materials, and the original contributions presented in this study are included in the Supplementary Materials. Further inquiries can be directed to the corresponding author.

Conflicts of Interest

The authors declare no conflicts of interest.

References

  1. Kilian, J.; Peschke, F.; Berendzen, K.W.; Harter, K.; Wanke, D. Prerequisites, performance and profits of transcriptional profiling the abiotic stress response. Biochim. Biophys. Acta (BBA)—Gene Regul. Mech. 2012, 1819, 166–175. [Google Scholar] [CrossRef]
  2. Zhang, M.; Zhao, R.; Huang, K.; Huang, S.; Wang, H.; Wei, Z.; Li, Z.; Bian, M.; Jiang, W.; Wu, T.; et al. The OsWRKY63–OsWRKY76–OsDREB1B module regulates chilling tolerance in rice. Plant J. 2022, 112, 383–398. [Google Scholar] [CrossRef] [PubMed]
  3. Yu, C.; Yao, A.; Li, X.; Li, W.; Gao, R.; Feng, Y.; Li, Z.; Guo, X.; Zhang, L.; Han, D. Overexpression of a Malus baccata (L.) Borkh WRKY transcription factor gene MbWRKY65 increased the tolerance to cold and drought in transgenic tomato. Vitr. Cell. Dev. Biol.—Plant 2024, 60, 620–633. [Google Scholar] [CrossRef]
  4. Liu, C.; Mao, B.; Ou, S.; Wang, W.; Liu, L.; Wu, Y.; Chu, C.; Wang, X. OsbZIP71, a bZIP transcription factor, confers salinity and drought tolerance in rice. Plant Mol. Biol. 2013, 84, 19–36. [Google Scholar] [CrossRef]
  5. Liu, Y.; Wang, L.; Liu, C.; Yin, H.; Liu, H.; Luo, H.; He, M.; Zhou, Y. CgbZIP1: A bZIP Transcription Factor from Chrysanthemum Grandiflora Confers Plant Tolerance to Salinity and Drought Stress. Agronomy 2022, 12, 556. [Google Scholar] [CrossRef]
  6. Jin, Y.; Pan, W.; Zheng, X.; Cheng, X.; Liu, M.; Ma, H.; Ge, X. OsERF101, an ERF family transcription factor, regulates drought stress response in reproductive tissues. Plant Mol. Biol. 2018, 98, 51–65. [Google Scholar] [CrossRef]
  7. She, M.; Zheng, D.; Zhang, S.; Ke, Z.; Wu, Z.; Zou, H.; Zhang, Z. Functional analysis of maize GRAS transcription factor gene ZmGRAS72 in response to drought and salt stresses. Agric. Commun. 2024, 2, 100054. [Google Scholar] [CrossRef]
  8. Cao, X.; Ding, L.; Liang, J.; Zhou, Y.; Chen, X.; Li, H.; Liu, T.; Yue, W.; Sui, J.; Jiang, L.; et al. LzSCL9, a Novel GRAS Transcription Factor in Lanzhou Lily (Lilium davidii var. unicolor), Participates in Regulation of Trichokonins-Primed Heat Stress Tolerance. Plants 2024, 13, 2330. [Google Scholar] [CrossRef]
  9. Ming, R.; Fang, T.; Ling, W.; Geng, J.; Qu, J.; Zhang, Y.; Chen, J.; Yao, S.; Li, L.; Huang, D.; et al. The GRAS transcription factor PtrPAT1 of Poncirus trifoliata functions in cold tolerance and modulates glycine betaine content by regulating the BADH-like gene. Hortic. Res. 2025, 12, uhae296. [Google Scholar] [CrossRef]
  10. Zhang, B.; Liu, J.; Yang, Z.E.; Chen, E.Y.; Zhang, C.J.; Zhang, X.Y.; Li, F.G. Genome-wide analysis of GRAS transcription factor gene family in Gossypium hirsutum L. BMC Genom. 2018, 19, 348. [Google Scholar] [CrossRef] [PubMed]
  11. Bolle, C. The role of GRAS proteins in plant signal transduction and development. Planta 2004, 218, 683–692. [Google Scholar] [CrossRef]
  12. Pysh, L.D.; Wysocka-Diller, J.W.; Camilleri, C.; Bouchez, D.; Benfey, P.N. The GRAS gene family in Arabidopsis: Sequence characterization and basic expression analysis of the SCARECROW-LIKE genes. Plant J. 1999, 18, 111–119. [Google Scholar] [CrossRef]
  13. Sun, X.; Jones, W.T.; Harvey, D.; Edwards, P.J.B.; Pascal, S.M.; Kirk, C.; Considine, T.; Sheerin, D.J.; Rakonjac, J.; Oldfield, C.J.; et al. N-terminal Domains of DELLA Proteins Are Intrinsically Unstructured in the Absence of Interaction with GID1/Gibberellic Acid Receptors. J. Biol. Chem. 2010, 285, 11557–11571. [Google Scholar] [CrossRef]
  14. Dutta, M.; Saha, A.; Moin, M.; Kirti, P.B. Genome-Wide Identification, Transcript Profiling and Bioinformatic Analyses of GRAS Transcription Factor Genes in Rice. Front. Plant Sci. 2021, 12, 777285. [Google Scholar] [CrossRef]
  15. Tian, C.; Wan, P.; Sun, S.; Li, J.; Chen, M. Genome-Wide Analysis of the GRAS Gene Family in Rice and Arabidopsis. Plant Mol. Biol. 2004, 54, 519–532. [Google Scholar] [CrossRef]
  16. Kawahara, Y.; de la Bastide, M.; Hamilton, J.P.; Kanamori, H.; McCombie, W.R.; Ouyang, S.; Schwartz, D.C.; Tanaka, T.; Wu, J.; Zhou, S.; et al. Improvement of the Oryza sativa Nipponbare reference genome using next generation sequence and optical map data. Rice 2013, 6, 4. [Google Scholar] [CrossRef] [PubMed]
  17. Swarbreck, D.; Wilks, C.; Lamesch, P.; Berardini, T.Z.; Garcia-Hernandez, M.; Foerster, H.; Li, D.; Meyer, T.; Muller, R.; Ploetz, L.; et al. The Arabidopsis Information Resource (TAIR): Gene structure and function annotation. Nucleic Acids Res. 2008, 36, D1009–D1014. [Google Scholar] [CrossRef] [PubMed]
  18. Chen, C.J.; Wu, Y.; Li, J.W.; Wang, X.; Zeng, Z.H.; Xu, J.; Liu, Y.L.; Feng, J.T.; Chen, H.; He, Y.H.; et al. TBtools-II: A “one for all, all for one” bioinformatics platform for biological big-data mining. Mol. Plant 2023, 16, 1733–1742. [Google Scholar] [CrossRef] [PubMed]
  19. Bailey, T.L.; Johnson, J.; Grant, C.E.; Noble, W.S. The MEME Suite. Nucleic Acids Res. 2015, 43, W39–W49. [Google Scholar] [CrossRef]
  20. Marchler-Bauer, A.; Anderson, J.B.; Chitsaz, F.; Derbyshire, M.K.; DeWeese-Scott, C.; Fong, J.H.; Geer, L.Y.; Geer, R.C.; Gonzales, N.R.; Gwadz, M.; et al. CDD: Specific functional annotation with the Conserved Domain Database. Nucleic Acids Res. 2009, 37, D205–D210. [Google Scholar] [CrossRef]
  21. Tamura, K.; Stecher, G.; Kumar, S. MEGA11: Molecular Evolutionary Genetics Analysis Version 11. Mol. Biol. Evol. 2021, 38, 3022–3027. [Google Scholar] [CrossRef] [PubMed]
  22. Cenci, A.; Rouard, M. Evolutionary Analyses of GRAS Transcription Factors in Angiosperms. Front. Plant Sci. 2017, 8, 273. [Google Scholar] [CrossRef] [PubMed]
  23. Liu, X.; Widmer, A. Genome-wide Comparative Analysis of the GRAS Gene Family in Populus, Arabidopsis and Rice. Plant Mol. Biol. Report. 2014, 32, 1129–1145. [Google Scholar] [CrossRef]
  24. Lescot, M.; Déhais, P.; Thijs, G.; Marchal, K.; Moreau, Y.; Van de Peer, Y.; Rouzé, P.; Rombauts, S. PlantCARE, a database of plant cis-acting regulatory elements and a portal to tools for in silico analysis of promoter sequences. Nucleic Acids Res. 2002, 30, 325–327. [Google Scholar] [CrossRef]
  25. Waese, J.; Fan, J.; Pasha, A.; Yu, H.; Fucile, G.; Shi, R.; Cumming, M.; Kelley, L.A.; Sternberg, M.J.; Krishnakumar, V.; et al. ePlant: Visualizing and Exploring Multiple Levels of Data for Hypothesis Generation in Plant Biology. Plant Cell 2017, 29, 1806–1821. [Google Scholar] [CrossRef] [PubMed]
  26. Zhang, H.; Yao, T.; Wang, J.; Ji, G.; Cui, C.; Song, J.; Sun, N.; Qi, S.; Xu, N.; Zhang, H. Genome-wide identification of R2R3-MYB transcription factors in Betula platyphylla and functional analysis of BpMYB95 in salt tolerance. Int. J. Biol. Macromol. 2024, 279, 135193. [Google Scholar] [CrossRef]
  27. Jang, J.-C. Arginine-rich motif-tandem CCCH zinc finger proteins in plant stress responses and post-transcriptional regulation of gene expression. Plant Sci. 2016, 252, 118–124. [Google Scholar] [CrossRef]
  28. Shariatipour, N.; Heidari, B. Meta-Analysis of Expression of the Stress Tolerance Associated Genes and Uncover their Cis-Regulatory Elements in Rice (Oryza sativa L.). Open Bioinform. J. 2020, 13, 39–49. [Google Scholar] [CrossRef]
  29. Wang, Y.; Li, M.; Mu, Y.; Guan, L.; Wu, F.; Liu, K.; Li, M.; Wang, N.; Zhuang, Z.; Zhao, Y.; et al. PwuWRKY48 Confers Drought Tolerance in Populus wulianensis. Forests 2024, 15, 302. [Google Scholar] [CrossRef]
  30. Yang, G.; Zhang, C.; Dong, H.; Liu, X.; Guo, H.; Tong, B.; Fang, F.; Zhao, Y.; Yu, Y.; Liu, Y.; et al. Activation and negative feedback regulation of SlHY5 transcription by the SlBBX20/21–SlHY5 transcription factor module in UV-B signaling. Plant Cell 2022, 34, 2038–2055. [Google Scholar] [CrossRef]
  31. Wu, Z.; Zhang, T.; Li, J.; Chen, S.; Grin, I.R.; Zharkov, D.O.; Yu, B.; Li, H. Genome-wide analysis of WD40 protein family and functional characterization of BvWD40-82 in sugar beet. Front. Plant Sci. 2023, 14, 1185440. [Google Scholar] [CrossRef] [PubMed]
  32. Suzuki, T.; Nakajima, S.; Morikami, A.; Nakamura, K. An Arabidopsis Protein with a Novel Calcium-binding Repeat Sequence Interacts with TONSOKU/MGOUN3/BRUSHY1 Involved in Meristem Maintenance. Plant Cell Physiol. 2005, 46, 1452–1461. [Google Scholar] [CrossRef]
  33. Qian, Z.; He, L.; Li, F. Understanding cold stress response mechanisms in plants: An overview. Front. Plant Sci. 2024, 15, 1443317. [Google Scholar] [CrossRef]
  34. Heidarzadeh, A. Role of amino acids in plant growth, development, and stress responses: A comprehensive review. Discov. Plants 2025, 2, 237. [Google Scholar] [CrossRef]
  35. Liu, X.; Wu, Y.; Gong, Q. Mechanism of NRP-mediated plant stress responses. Sci. Sin. Vitae 2019, 49, 1125–1132. [Google Scholar] [CrossRef]
  36. Ali, M.R.M.; Uemura, T.; Ramadan, A.; Adachi, K.; Nemoto, K.; Nozawa, A.; Hoshino, R.; Abe, H.; Sawasaki, T.; Arimura, G.-i. The Ring-Type E3 Ubiquitin Ligase JUL1 Targets the VQ-Motif Protein JAV1 to Coordinate Jasmonate Signaling. Plant Physiol. 2019, 179, 1273–1284. [Google Scholar] [CrossRef] [PubMed]
  37. Xu, K.; Chen, S.; Li, T.; Ma, X.; Liang, X.; Ding, X.; Liu, H.; Luo, L. OsGRAS23, a rice GRAS transcription factor gene, is involved in drought stress response through regulating expression of stress-responsive genes. BMC Plant Biol. 2015, 15, 141. [Google Scholar] [CrossRef] [PubMed]
  38. Zinati, Z. Identification of novel genes potentially involved in rice (Oryza sativa L.) drought tolerance. BioTechnologia 2018, 98, 195–208. [Google Scholar] [CrossRef]
  39. Acharya, B.R.; Assmann, S.M. Hormone interactions in stomatal function. Plant Mol. Biol. 2009, 69, 451–462. [Google Scholar] [CrossRef]
  40. Cheong, J.-J.; Choi, Y.D. Methyl jasmonate as a vital substance in plants. Trends Genet. 2003, 19, 409–413. [Google Scholar] [CrossRef]
  41. Wasternack, C. Action of jasmonates in plant stress responses and development—Applied aspects. Biotechnol. Adv. 2014, 32, 31–39. [Google Scholar] [CrossRef] [PubMed]
  42. Ma, C.; Wang, Z.Q.; Zhang, L.T.; Sun, M.M.; Lin, T.B. Photosynthetic responses of wheat (Triticum aestivum L.) to combined effects of drought and exogenous methyl jasmonate. Photosynthetica 2014, 52, 377–385. [Google Scholar] [CrossRef]
  43. Dreyer, I.; Uozumi, N. Potassium channels in plant cells. FEBS J. 2011, 278, 4293–4303. [Google Scholar] [CrossRef]
  44. Yamaguchi-Shinozaki, K.; Shinozaki, K. Organization of cis-acting regulatory elements in osmotic- and cold-stress-responsive promoters. Trends Plant Sci. 2005, 10, 88–94. [Google Scholar] [CrossRef]
  45. Cutler, S.R.; Rodriguez, P.L.; Finkelstein, R.R.; Abrams, S.R. Abscisic Acid: Emergence of a Core Signaling Network. Annu. Rev. Plant Biol. 2010, 61, 651–679. [Google Scholar] [CrossRef]
  46. Raghavendra, A.S.; Gonugunta, V.K.; Christmann, A.; Grill, E. ABA perception and signalling. Trends Plant Sci. 2010, 15, 395–401. [Google Scholar] [CrossRef]
  47. Weiner, J.J.; Peterson, F.C.; Volkman, B.F.; Cutler, S.R. Structural and functional insights into core ABA signaling. Curr. Opin. Plant Biol. 2010, 13, 495–502. [Google Scholar] [CrossRef] [PubMed]
  48. Yang, R.; Yang, Z.; Xing, M.; Jing, Y.; Zhang, Y.; Zhang, K.; Zhou, Y.; Zhao, H.; Qiao, W.; Sun, J. TaBZR1 enhances wheat salt tolerance via promoting ABA biosynthesis and ROS scavenging. J. Genet. Genom. 2023, 50, 861–871. [Google Scholar] [CrossRef]
  49. Yamaguchi-Shinozaki, K.; Shinozaki, K. Transcriptional Regulatory Networks in Cellular Responses and Tolerance to Dehydration and Cold Stresses. Annu. Rev. Plant Biol. 2006, 57, 781–803. [Google Scholar] [CrossRef]
  50. Hirsch, S.; Oldroyd, G.E.D. GRAS-domain transcription factors that regulate plant development. Plant Signal. Behav. 2009, 4, 698–700. [Google Scholar] [CrossRef]
  51. Bolle, C.; Koncz, C.; Chua, N.H. PAT1, a new member of the GRAS family, is involved in phytochrome A signal transduction. Genes Dev 2000, 14, 1269–1278. [Google Scholar] [CrossRef]
  52. Stuurman, J.; Jäggi, F.; Kuhlemeier, C. Shoot meristem maintenance is controlled by a GRAS-gene mediated signal from differentiating cells. Genes Dev. 2002, 16, 2213–2218. [Google Scholar] [CrossRef]
  53. Soma, F.; Takahashi, F.; Yamaguchi-Shinozaki, K.; Shinozaki, K. Cellular Phosphorylation Signaling and Gene Expression in Drought Stress Responses: ABA-Dependent and ABA-Independent Regulatory Systems. Plants 2021, 10, 756. [Google Scholar] [CrossRef] [PubMed]
  54. Yan, M.; Li, M.; Ding, Z.; Qiao, F.; Jiang, X. Plant Hormone Signals Mediate Melatonin Synthesis to Enhance Osmotic Stress Tolerance in Watermelon Cells. Horticulturae 2023, 9, 927. [Google Scholar] [CrossRef]
  55. Yu, X.; Zhang, W.; Zhang, Y.; Zhang, X.; Lang, D.; Zhang, X. The roles of methyl jasmonate to stress in plants. Funct. Plant Biol. 2019, 46, 197. [Google Scholar] [CrossRef] [PubMed]
  56. Kaura, V.; Malhotra, P.K.; Mittal, A.; Sanghera, G.S.; Kaur, N.; Bhardwaj, R.D.; Cheema, R.S.; Kaur, G. Physiological, Biochemical, and Gene Expression Responses of Sugarcane Under Cold, Drought and Salt Stresses. J. Plant Growth Regul. 2022, 42, 6367–6376. [Google Scholar] [CrossRef]
  57. Atif, R.M.; Shahid, L.; Waqas, M.; Ali, B.; Rashid, M.A.R.; Azeem, F.; Nawaz, M.A.; Wani, S.H.; Chung, G. Insights on Calcium-Dependent Protein Kinases (CPKs) Signaling for Abiotic Stress Tolerance in Plants. Int. J. Mol. Sci. 2019, 20, 5298. [Google Scholar] [CrossRef] [PubMed]
  58. Shang, X.; Xie, N.; Li, Y.; Zhao, Z.; Luo, P.; Cui, Y.; Rao, X.; Chen, W. Mediator Subunit RhMED15a Regulates Drought Tolerance in Rose. Horticulturae 2024, 10, 84. [Google Scholar] [CrossRef]
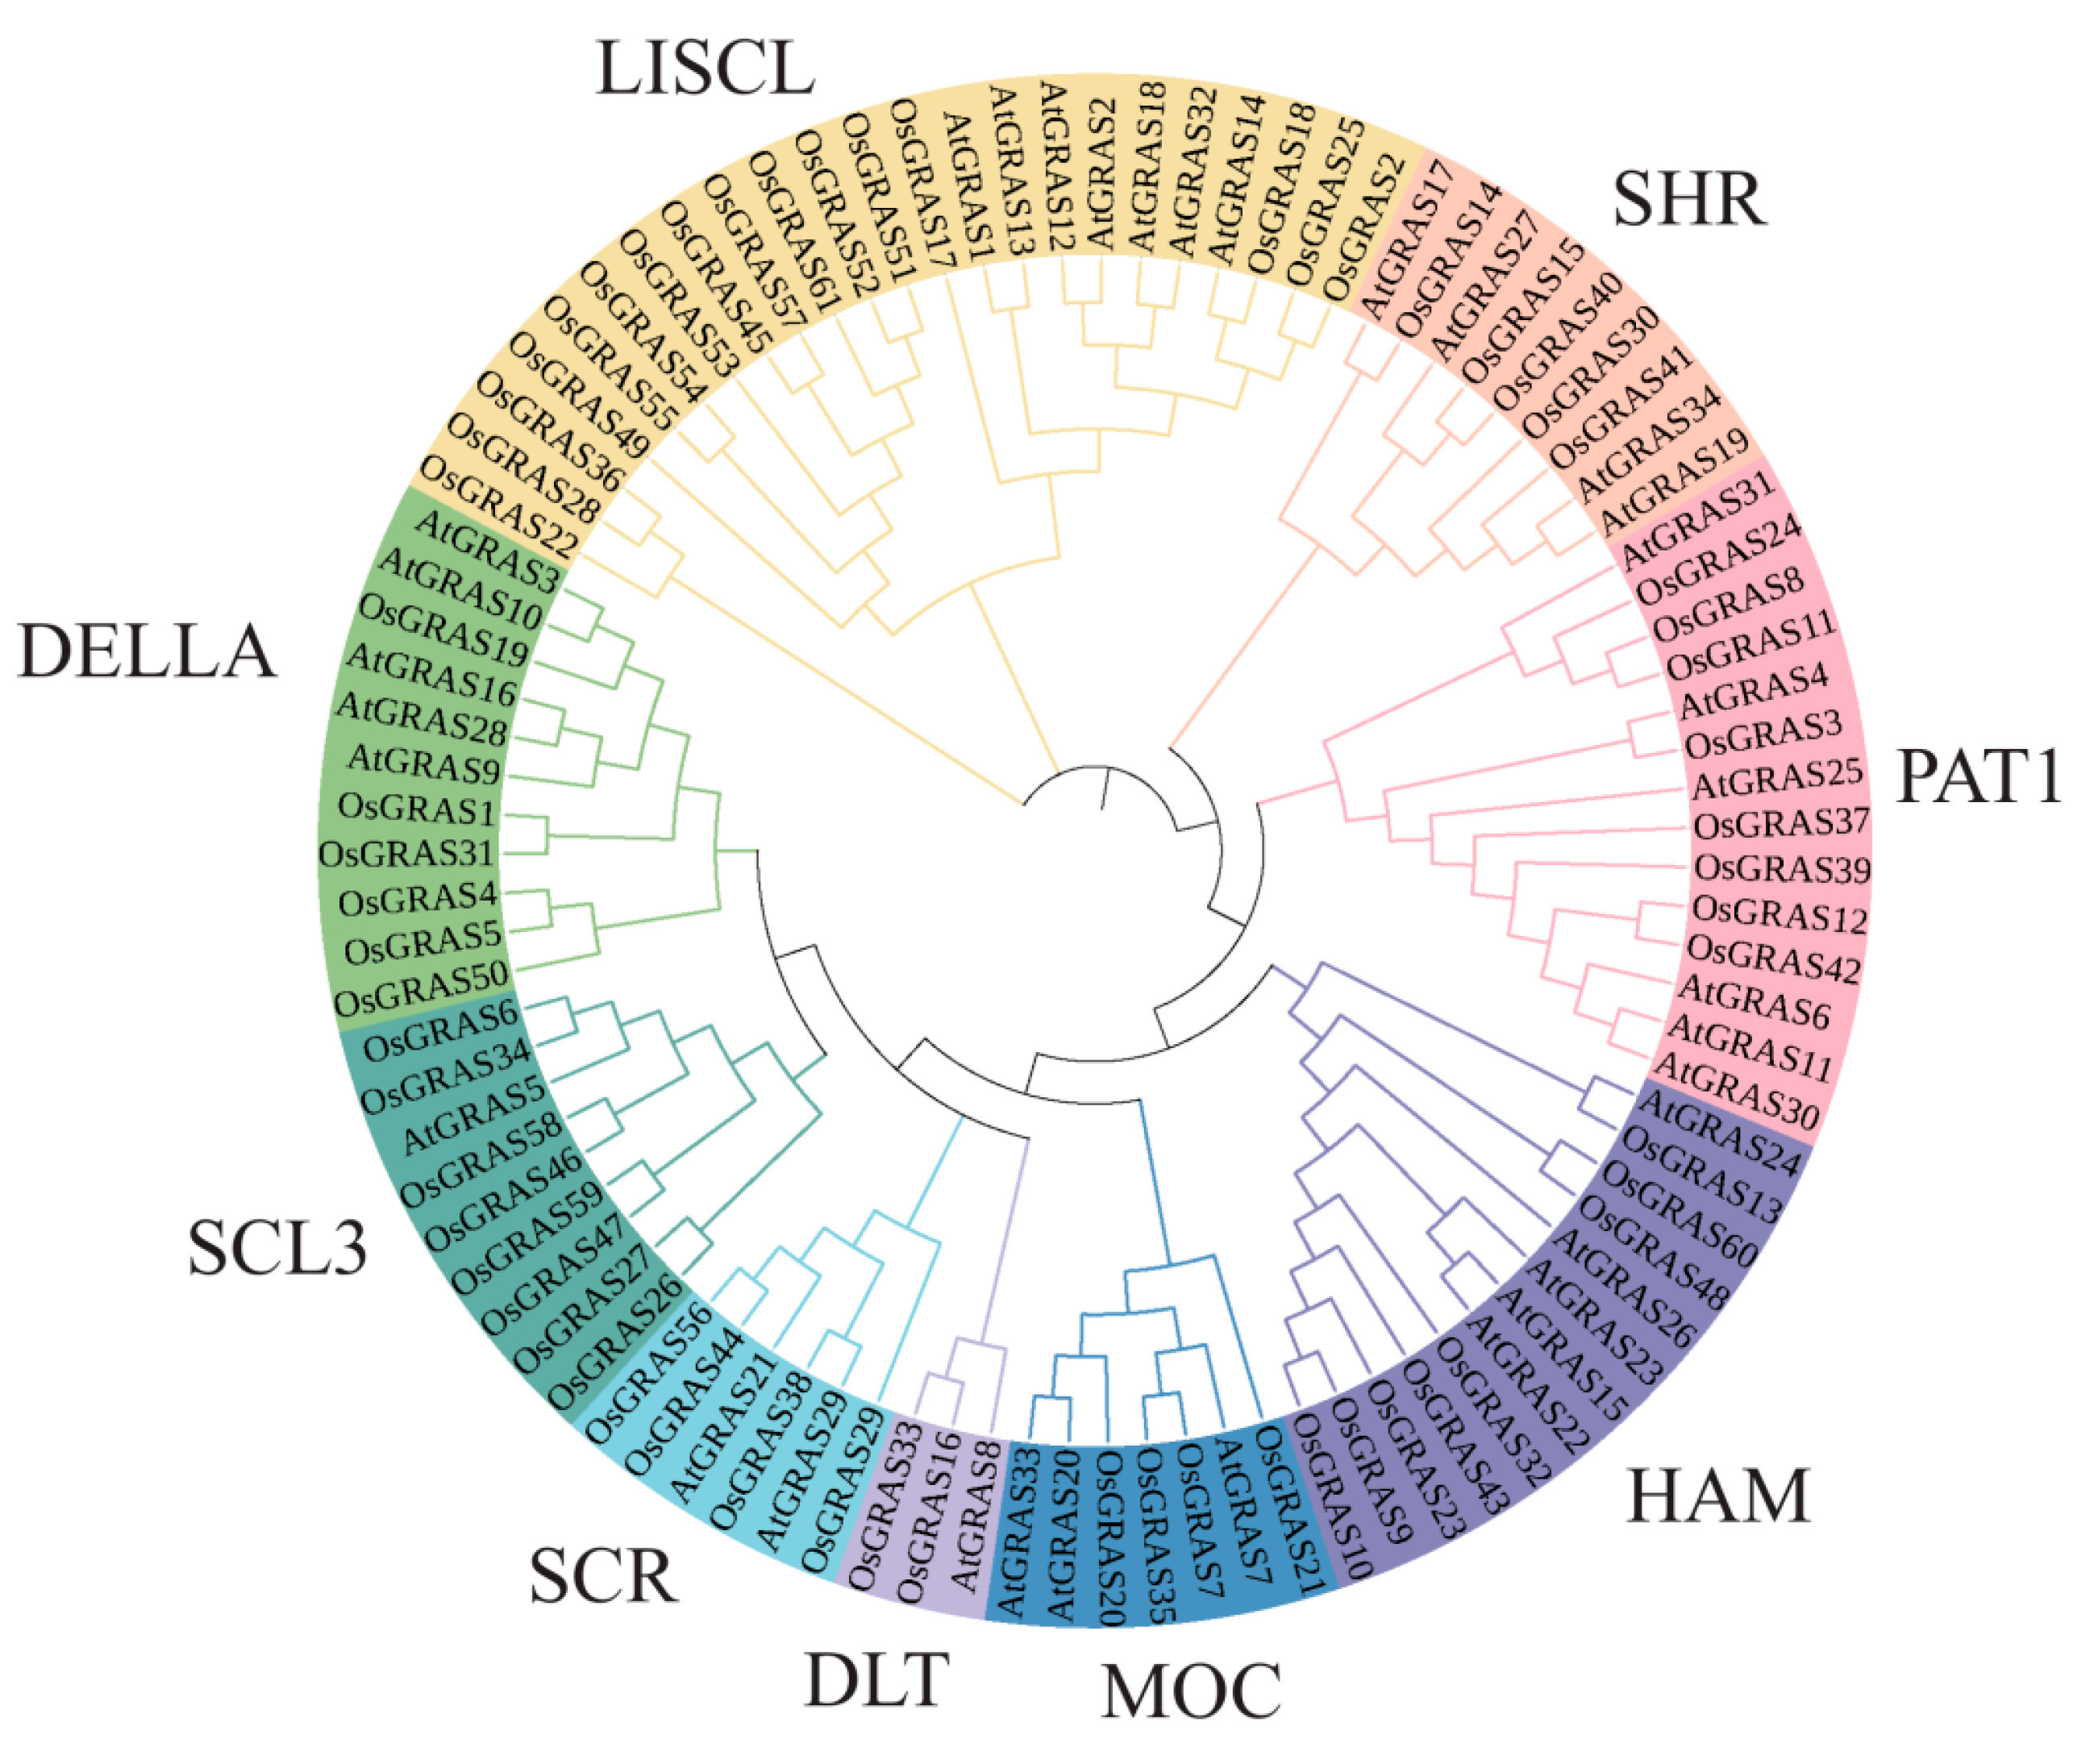
Figure 1. Evolutionary tree analysis of GRAS family members in rice and Arabidopsis thaliana.
Ijpb 16 00095 g001
Figure 2. Distribution of rice GRAS gene family members on chromosomes.
Ijpb 16 00095 g002
Figure 3. Analysis of phylogeny (A), conserved motifs (B), and conserved structural domains (C) of rice GRAS family proteins.
Ijpb 16 00095 g003
Figure 4. Analysis of upstream cis-acting elements of the rice OsGRAS gene family. Note: (A) Distribution of 2000 bp promoters upstream of OsGRAS gene; (B) heat map of promoters of OsGRAS gene; numbers represent the number of this promoter in this gene; CGTCA-motif/TGACG-motif: methyl jasmonate response element; GARE-motif/P- box/TATC-box: gibberellin response element; TCA-element: salicylic acid response element; ABRE: abscisic acid response element; AuxRR-core: auxin response element; G-box/G-Box/Sp1/GT1-motif/ACE: light response element; LTR: low temperature response element.
Ijpb 16 00095 g004
Figure 5. Expression profile of OsGRAS gene in different tissues of rice. Data expression is processed using log2, with color scales representing expression levels from high (red) to low (blue).
Ijpb 16 00095 g005
Figure 6. Comparative analysis of 16 OsGRAS genes in response to drought stress by qPCR. The x-axis shows the names of members of the OsGRAS gene family in rice, and the y-axis shows the gene expression change multiples (range −4 to 4) after log2FC conversion. The error bars indicate the standard deviation of three biological replicates.
Ijpb 16 00095 g006
Figure 7. Comparative analysis of 16 OsGRAS genes in response to salt stress by qPCR. The x-axis shows the names of members of the OsGRAS gene family in rice, and the y-axis shows the gene expression change multiples (range −4 to 4) after log2FC conversion. The error bars indicate the standard deviation of three biological replicates.
Ijpb 16 00095 g007
Table 1. Physicochemical properties of proteins of rice GRAS gene family.
Sequence IDProtein NameNumber of Amino AcidMolecular WeightTheoretical pI
LOC_Os01g45860OsGRAS149552,067.355.06
LOC_Os01g62460OsGRAS270578,998.086.1
LOC_Os01g65900OsGRAS355361,798.494.8
LOC_Os01g67650OsGRAS453257,449.176.09
LOC_Os01g67670OsGRAS527530,461.646.46
LOC_Os01g71970OsGRAS644248,023.776.15
LOC_Os02g10360OsGRAS742344,138.745.56
LOC_Os02g21685OsGRAS814715,305.119.18
LOC_Os02g44360OsGRAS970974,248.235.65
LOC_Os02g44370OsGRAS1071574,131.935.82
LOC_Os02g45760OsGRAS1161864,200.529.27
LOC_Os03g09280OsGRAS1253559,647.915.86
LOC_Os03g15680OsGRAS1357560,848.25.04
LOC_Os03g29480OsGRAS1452354,077.655.99
LOC_Os03g31880OsGRAS1560364,247.775.93
LOC_Os03g37900OsGRAS1613715,192.77.87
LOC_Os03g40080OsGRAS1777788,331.495.53
LOC_Os03g48450OsGRAS1873182,218.826.44
LOC_Os03g49990OsGRAS1962565406.245.14
LOC_Os03g51330OsGRAS2057862,477.535.63
LOC_Os04g35250OsGRAS2150452,579.878.67
LOC_Os04g37440OsGRAS2215216,672.189.43
LOC_Os04g46860OsGRAS2371174,007.885.57
LOC_Os04g49110OsGRAS2461964,918.257.2
LOC_Os04g50060OsGRAS2563671,655.985.51
LOC_Os05g31380OsGRAS2655156,280.975.41
LOC_Os05g31420OsGRAS2756058,183.567.85
LOC_Os05g40130OsGRAS2817619,069.2910.29
LOC_Os05g40710OsGRAS2949351,644.415.75
LOC_Os05g42130OsGRAS3042545,430.825.81
LOC_Os05g49930OsGRAS3150052,994.995.91
LOC_Os06g01620OsGRAS3248051,017.015.46
LOC_Os06g03710OsGRAS3361765,846.846.02
LOC_Os06g10900OsGRAS3422325,058.868.88
LOC_Os06g40780OsGRAS3566669,779.115.76
LOC_Os07g16330OsGRAS3626429,803.3710.07
LOC_Os07g36170OsGRAS3757164,602.195.87
LOC_Os07g38030OsGRAS3845749,096.595.51
LOC_Os07g39470OsGRAS3954460,108.166
LOC_Os07g39820OsGRAS4060264,709.335.61
LOC_Os07g40020OsGRAS4147350,596.455.31
LOC_Os10g22430OsGRAS4254159,930.595.79
LOC_Os10g40390OsGRAS4368374,280.48.85
LOC_Os11g03110OsGRAS4465169,918.235.91
LOC_Os11g04400OsGRAS4554959,950.364.98
LOC_Os11g04570OsGRAS4685494,267.737.45
LOC_Os11g04590OsGRAS4746050,420.426.92
LOC_Os11g06180OsGRAS4847252,312.554.78
LOC_Os11g11600OsGRAS4934537,286.4710.13
LOC_Os11g31100OsGRAS5077281,094.366.18
LOC_Os11g47870OsGRAS5169277,442.345.01
LOC_Os11g47890OsGRAS5263871,485.865.27
LOC_Os11g47900OsGRAS5364272,083.576.26
LOC_Os11g47910OsGRAS5459566,666.15.99
LOC_Os11g47920OsGRAS5559366,636.955.98
LOC_Os12g02870OsGRAS5666070,394.725.91
LOC_Os12g04200OsGRAS5758563,953.195.23
LOC_Os12g04370OsGRAS58977108,691.386.55
LOC_Os12g04380OsGRAS5946450,674.55.99
LOC_Os12g06540OsGRAS6046250,587.654.53
LOC_Os12g38490OsGRAS6173881,365.045.17
Table 2. Conservative motif information.
Conserved MotifsAmino Acid SequenceLengthE-ValueNsites
Motif 1EACPFLKFAHFTANQAILEAVE222.8 × 10−36848
Motif 2NVVACEGAERVERHETYGQWR211.4 × 10−35540
Motif 3FLTRFREALHYYSALFDSLDATLP242.8 × 10−40149
Motif 4DGGWLLLGWKGRPLYAASAW203.7 × 10−30242
Motif 5LQWPSLLQALAARPGGPP181.0 × 10−26648
Motif 6PAGDAMQRLAAYFAEALAARL211.2 × 10−28955
Motif 7APADELEETGRRLSDFARSLGVPFEFRAV298.1 × 10−31846
Motif 8RDAVLRTVRSLSPKVVVLVEQEADHNAPF292.1 × 10−33846
Motif 9GERRVHIVDFGISYG151.5 × 10−24056
Motif 10PGEALVVNCVLQLHRLLDESV215.6 × 10−18934
Table 3. Primers for fluorescence quantitative PCR of OsGRAS differentially expressed genes.
Sequence IDGene NameForward PrimerReverse Primer
LOC_Os01g67650OsGRAS4ACTACCGATTCTACGACGTGCTCTCAAGAACGTCCCAGAA
LOC_Os02g21685OsGRAS8CCTCTTCATCCACGGCTTCAAATGTTGAGACGGGCTTGTG
LOC_Os03g29480OsGRAS14TGGACTGGTTCGAGGAGTCCGTAGAACAGGTGCTGCAC
LOC_Os03g37900OsGRAS16ATACGCACTACAGCACGTGTTGGCTGATGTTGAACATGTGTG
LOC_Os03g49990OsGRAS19ATACGCACATACGCACTACAGCGTTGAGCTCTGGAAAGCAT
LOC_Os03g51330OsGRAS20TTTCATGCTGCAGCTGTACCAGAGCAAAAGATCAGCCTGG
LOC_Os04g35250OsGRAS21GCTTACATCAATACGCACACTCTTAAAATCACCGACATCGCCG
LOC_Os04g37440OsGRAS22ATACGCACACTACCTACGGTACGTATGTGCTGTATGTGCGTATC
LOC_Os05g31380OsGRAS26CCTGACGGAGATACGCACATTAAAATCATCCGACCCACCAC
LOC_Os05g40710OsGRAS29ACCAGTATCTATACAGCAGCAGTCCTCGGAGTACACCTCC
LOC_Os06g10900OsGRAS34TCCAGTTCAACCCGGTGGGCAGTACGGATGGAGAGG
LOC_Os07g39820OsGRAS40TTTAGGTTGGTTAGCCTCCAAGAGTCTTCATCCATGTAAAGCTGG
LOC_Os11g04400OsGRAS45ATGTTCTTCTGCCTGTACCCGCATCATCTTCTCCAACATCTC
LOC_Os11g47870OsGRAS51GAAGAAGAGGTGCTCGTGGAGTAGAAGAAGAGCGTCTCC
LOC_Os11g47890OsGRAS52ACAATACGACCAACTCCACCGTGAAGGTGGGTTGAATATCC
LOC_Os12g04200OsGRAS57GCGCTCTTCTTCTTCTCGGGTTGTTACTACTGTGAGCTCTC
Actin TTCCAGCCTTCCTTCATAAACGATGTTGCCATATAGAT
Disclaimer/Publisher’s Note: The statements, opinions and data contained in all publications are solely those of the individual author(s) and contributor(s) and not of MDPI and/or the editor(s). MDPI and/or the editor(s) disclaim responsibility for any injury to people or property resulting from any ideas, methods, instructions or products referred to in the content.