Article

Comparative Analysis of Chloroplast Genomes Across 20 Plant Species Reveals Evolutionary Patterns in Gene Content, Codon Usage, and Genome Structure

by
My Abdelmajid Kassem
Plant Genomics and Bioinformatics Lab, Department of Biological and Forensic Sciences, Fayetteville State University, Fayetteville, NC 28301, USA
Int. J. Plant Biol. 2025, 16(3), 105; https://doi.org/10.3390/ijpb16030105
Submission received: 18 August 2025 / Revised: 6 September 2025 / Accepted: 8 September 2025 / Published: 9 September 2025
(This article belongs to the Topic Plant Chloroplast Genome and Evolution)

Abstract

Chloroplast genomes are valuable tools for exploring plant evolution, photosynthesis, and molecular systematics due to their relatively conserved structure and gene content. Here, I present a comprehensive comparative analysis of complete chloroplast genomes from 20 taxonomically diverse plant species, focusing on 16 widely used barcoding genes to investigate patterns of genome structure, gene retention, codon usage bias, and phylogenetic relationships. Genome sizes ranged from ~121 kb in Marchantia polymorpha to over 160 kb in Vitis vinifera, with GC content largely conserved across species. A multi-gene Neighbor-Joining phylogenetic framework recovered major taxonomic groupings and revealed gene-specific topological differences, reflecting locus-specific evolutionary histories. Presence/absence profiling showed that 13 of the 16 barcoding genes were consistently retained across species and classified as core genes, while the remaining three exhibited more variable distributions and were considered accessory. This pattern reflects both broad conservation and lineage-specific gene loss across plastomes. Genome-wide similarity analysis revealed high identity among closely related taxa (e.g., Arabidopsis and Brassica) and greater divergence among bryophytes, gymnosperms, and angiosperms. Codon usage analysis revealed generally conserved patterns, with lineage-specific biases observed in Cucumis sativus and Brassica rapa, suggesting influences from mutational pressure and potential translational selection. This integrative analysis highlights the dynamic yet conserved nature of chloroplast genomes and underscores the value of combining multiple genomic features in plastome evolution studies. The resulting dataset and analytical pipeline offer a useful resource for future phylogenomic, evolutionary, and biodiversity research in plant science.

1. Introduction

Chloroplasts are essential organelles in plant cells, responsible for carrying out photosynthesis and contributing to a range of other metabolic activities, including the synthesis of fatty acids, amino acids, and pigments [1,2]. The chloroplast genome (plastome) is typically a circular DNA molecule ranging from 120 to 160 kilobases, although significant size variation has been documented [3,4]. Most chloroplast genomes exhibit a conserved quadripartite structure comprising a large single-copy (LSC) region, a small single-copy (SSC) region, and two inverted repeats (IRs) [5]. However, despite this apparent structural conservation, chloroplast genomes have undergone substantial evolutionary events, including gene losses, rearrangements, and expansions/contractions of IR regions [6,7].
Due to their relatively slow evolutionary rate compared to nuclear genomes and a high degree of conservation across taxa, chloroplast genomes have been widely used in phylogenetic and evolutionary studies [8,9]. Advances in high-throughput sequencing technologies have made it feasible to sequence complete chloroplast genomes rapidly and inexpensively, facilitating comprehensive comparative genomics analyses across diverse plant lineages [10,11]. Comparative studies have revealed that although the overall structure of chloroplast genomes is conserved, lineage-specific variations, such as gene losses and inversions, are widespread and informative for resolving complex phylogenetic relationships [12,13].
A key area of focus in chloroplast genome studies has been the use of specific barcoding genes for phylogenetic reconstruction and species identification [14,15]. Genes such as matK, rbcL, ndhF, and ycf1 have been highlighted as particularly valuable due to their relatively high substitution rates compared to other plastid genes [16,17]. These barcoding markers provide critical insights into plant diversity, evolutionary relationships, and have applications in conservation biology, agriculture, and ecology [18,19].
Chloroplast genome variation is not limited to the sequence level but extends to gene content and order. Structural changes such as inversions, duplications, and deletions have been extensively documented, particularly in lineages such as Fabaceae, Geraniaceae, and Campanulaceae [20,21,22]. For instance, IR expansion or contraction can dramatically alter genome size and organization [4]. Loss of specific genes, such as those coding for the NADH dehydrogenase complex (ndh genes), has been noted in multiple lineages and is often associated with shifts in lifestyle, such as parasitism [4,5,23].
Codon usage bias (CUB) in chloroplast genomes is another important evolutionary aspect, reflecting selective forces such as mutational pressure, translational efficiency, and gene expression levels [24,25]. Several studies have indicated that chloroplast genomes, despite their overall conservation, display lineage-specific codon usage patterns [4,25,26]. Analyses of codon usage can thus reveal underlying molecular evolutionary mechanisms and contribute to the functional annotation of plastomes.
Understanding gene presence/absence patterns is also crucial for elucidating the functional evolution of chloroplast genomes. The concept of a “core plastome,” comprising genes universally retained across lineages, contrasts with lineage-specific “accessory” genes that have undergone loss or duplication events [4,7,27]. Characterizing the core versus accessory components of chloroplast genomes provides valuable evolutionary insights and helps refine phylogenetic markers.
Despite significant advances, comprehensive comparative studies integrating gene content variation, sequence similarity, codon usage bias, and phylogenetic relationships across diverse plant taxa remain limited. Most prior studies have focused on either taxonomically restricted groups (e.g., Fabaceae, Poaceae) or specific genomic features (e.g., IR regions, selected coding genes), leaving broader patterns less explored [28,29].
To ensure a representative analysis, we selected 20 plant species spanning major clades of land plants, including bryophytes (Marchantia polymorpha), gymnosperms (Ginkgo biloba), monocots (Oryza sativa, Zea mays), and diverse eudicots (e.g., Arabidopsis thaliana, Brassica rapa, Glycine max, Vitis vinifera). This selection balances taxonomic diversity, ecological and agricultural relevance, and the availability of high-quality, complete chloroplast genome sequences in the NCBI GenBank database. The included species also represent both model organisms and economically important crops, providing broader insights into chloroplast genome evolution.
In this study, I conduct a systematic comparative analysis of the chloroplast genomes of 20 diverse plant species, combining complete genome statistics, gene content analysis, codon usage profiling, and multi-gene phylogenetic reconstruction. By integrating these multi-faceted analyses, my aims were to (1) identify patterns of chloroplast genome conservation and divergence; (2) assess genome-scale similarities across species; (3) characterize the core versus accessory gene sets; (4) investigate codon usage patterns and potential evolutionary implications; (5) infer phylogenetic relationships based on multiple barcoding genes. This work not only enhances our understanding of plastome evolution but also provides a valuable resource for future phylogenomic and evolutionary studies.

2. Materials and Methods

2.1. Genome Data Acquisition and Processing

Complete chloroplast genome sequences for 20 plant species were retrieved from the NCBI GenBank database [30] in GenBank (.gb) format, ensuring the retention of both nucleotide sequences and feature annotations necessary for accurate downstream analyses. Species names were mapped systematically to accession numbers for consistency across datasets. Each genome was verified for completeness, and any records lacking full sequence data were excluded to maintain data integrity in comparative analyses.

2.2. Barcoding Gene Extraction and Annotation

I targeted 16 standard barcoding genes commonly used in plant phylogenetics, including accD, atpB, clpP, matK, ndhA, ndhF, petD, psaA, psbA, rbcL, rpl16, rpoB, rpoC2, rps4, rps16, and ycf1 [14,16,17]. Four commonly used loci (trnH-psbA, trnL-trnF, trnG, petA-psbJ) were excluded due to annotation inconsistencies or poor alignment quality across species. Using Biopython v1.84 [31], coding sequences (CDSs) for each targeted gene were parsed directly from GenBank annotations. These genes were individually extracted and saved in FASTA format, organized by gene for clarity. When multiple copies of a gene were present, only the first occurrence was retained to avoid redundancy in downstream alignments.

2.3. Sequence Alignment and Supermatrix Construction

Multiple sequence alignments for each extracted gene were performed using MAFFT v7.487 [32] under the --auto mode, allowing the software to select the optimal alignment strategy. Alignments were saved in FASTA format. The aligned genes were then concatenated into a multi-gene supermatrix for comprehensive phylogenetic analysis. For species missing specific genes, appropriately sized gap-only sequences were inserted to maintain alignment length consistency.
While whole-genome alignment tools (e.g., Mauve) offer insights into synteny and structural variation, this study focused on conserved barcoding loci to ensure comparability and tractability across species. Full-genome comparisons remain a valuable direction for future work.

2.4. Phylogenetic Analysis

Phylogenetic relationships were inferred using two complementary approaches: Neighbor-Joining (NJ) and Maximum Likelihood (ML). NJ trees were constructed for each individual gene to enable gene-level evolutionary comparison. Pairwise genetic distances were calculated using the identity model via Biopython’s DistanceCalculator, and NJ trees were generated using the classic method of Saitou and Nei [33] as implemented in Biopython. Each tree was midpoint-rooted to standardize visual interpretation. A comprehensive NJ tree was also built from the concatenated multi-gene supermatrix to provide a global overview of relationships across all taxa [34]. All NJ trees were exported in Newick format and visualized using Matplotlib v3.7.1 [35] and Biopython’s Phylo module.
To complement these exploratory trees, a maximum likelihood (ML) phylogeny was constructed from the trimmed supermatrix using IQ-TREE v3.0.1. The best-fit substitution model was selected automatically using the -m TEST option, and ultrafast bootstrap approximation (-bb 1000) was performed to assess node support. The resulting ML consensus tree, saved in contree format, included bootstrap values and was visualized alongside the NJ trees for comparison. This dual approach allowed us to explore both gene-specific variation and robust multi-gene evolutionary patterns, ensuring reliable phylogenetic inference across the dataset.

2.5. Genome Statistics Calculation

Basic chloroplast genome statistics, including total genome length (bp), GC content percentage, and the number of annotated CDSs, were calculated for each species using Biopython. These statistics provided insights into genome structural variation across species and were compiled into a summary table for comparative assessment.

2.6. Genome Similarity Analysis

Genome-wide pairwise similarity analyses were conducted by aligning complete chloroplast genome sequences between species and calculating the percentage of identical bases across alignments. The resulting similarity matrix was visualized as a heatmap using Seaborn v0.12.2 [36] to illustrate divergence patterns and relationships among the studied taxa.

2.7. Gene Presence/Absence Profiling

A binary matrix indicating the presence (1) or absence (0) of each of the 20 barcoding genes across all species was generated by querying GenBank annotations for the existence of each gene. This presence/absence matrix was visualized using a heatmap to identify conserved and variable loci across species. Core genes, defined as those present in at least 90% of species, and accessory genes, defined as those absent in at least two species, were identified from this matrix, quantified, and plotted to assess the distribution of gene conservation within the dataset.

2.8. Codon Usage Bias Analysis

Codon usage patterns were examined across the protein-coding genes (CDSs) of each species to assess potential biases linked to mutational pressure and selection. Codon frequencies were computed by parsing CDSs in triplets and compiling the data into a matrix where rows corresponded to species and columns to individual codons. This codon usage matrix was visualized as a heatmap, allowing comparative assessment of codon preference patterns across species and the exploration of lineage-specific codon biases.

2.9. Data Visualization and Figure Preparation

All plots, heatmaps, and phylogenetic trees were generated using Matplotlib [35] and Seaborn [36]. Figures were prepared in both high-resolution PNG (raster) and SVG (vector) formats at 300–600 dpi. The visualization outputs included a chloroplast genome statistics plot (length, GC%, CDS), gene-specific phylogenetic trees, a gene presence/absence heatmap, a genome similarity heatmap, a core vs. accessory gene bar plot, and a codon usage bias heatmap. All data outputs, including alignments, statistics tables, and phylogenetic trees, were systematically organized into project subfolders to facilitate reproducibility and ease of review.

3. Results

3.1. Chloroplast Genome Structure and General Features

Complete chloroplast genome sequences from 20 plant species representing a broad phylogenetic range were retrieved and analyzed (Table 1). Genome sizes varied from 121,024 bp in Marchantia polymorpha to 160,928 bp in Vitis vinifera, with most angiosperms falling within the expected size range of 140,000–160,000 bp (Figure 1). The smallest plastome was observed in the bryophyte Marchantia, which also had the lowest GC content at 28.8%, while the highest GC content was found in Ginkgo biloba at 39.6%, consistent with previous findings in basal seed plants [4].
Coding sequence (CDS) counts ranged from 74 in Eucalyptus grandis to 111 in Zea mays, reflecting lineage-specific variation in gene content and annotation quality. The overall GC content was relatively conserved across species, typically between 35% and 38%, as is characteristic of chloroplast genomes. These results confirm the generally stable architecture of plastid genomes across land plants, with modest variation in size, gene number, and GC content across clades.

3.2. Phylogenetic Relationships Based on Barcoding Genes

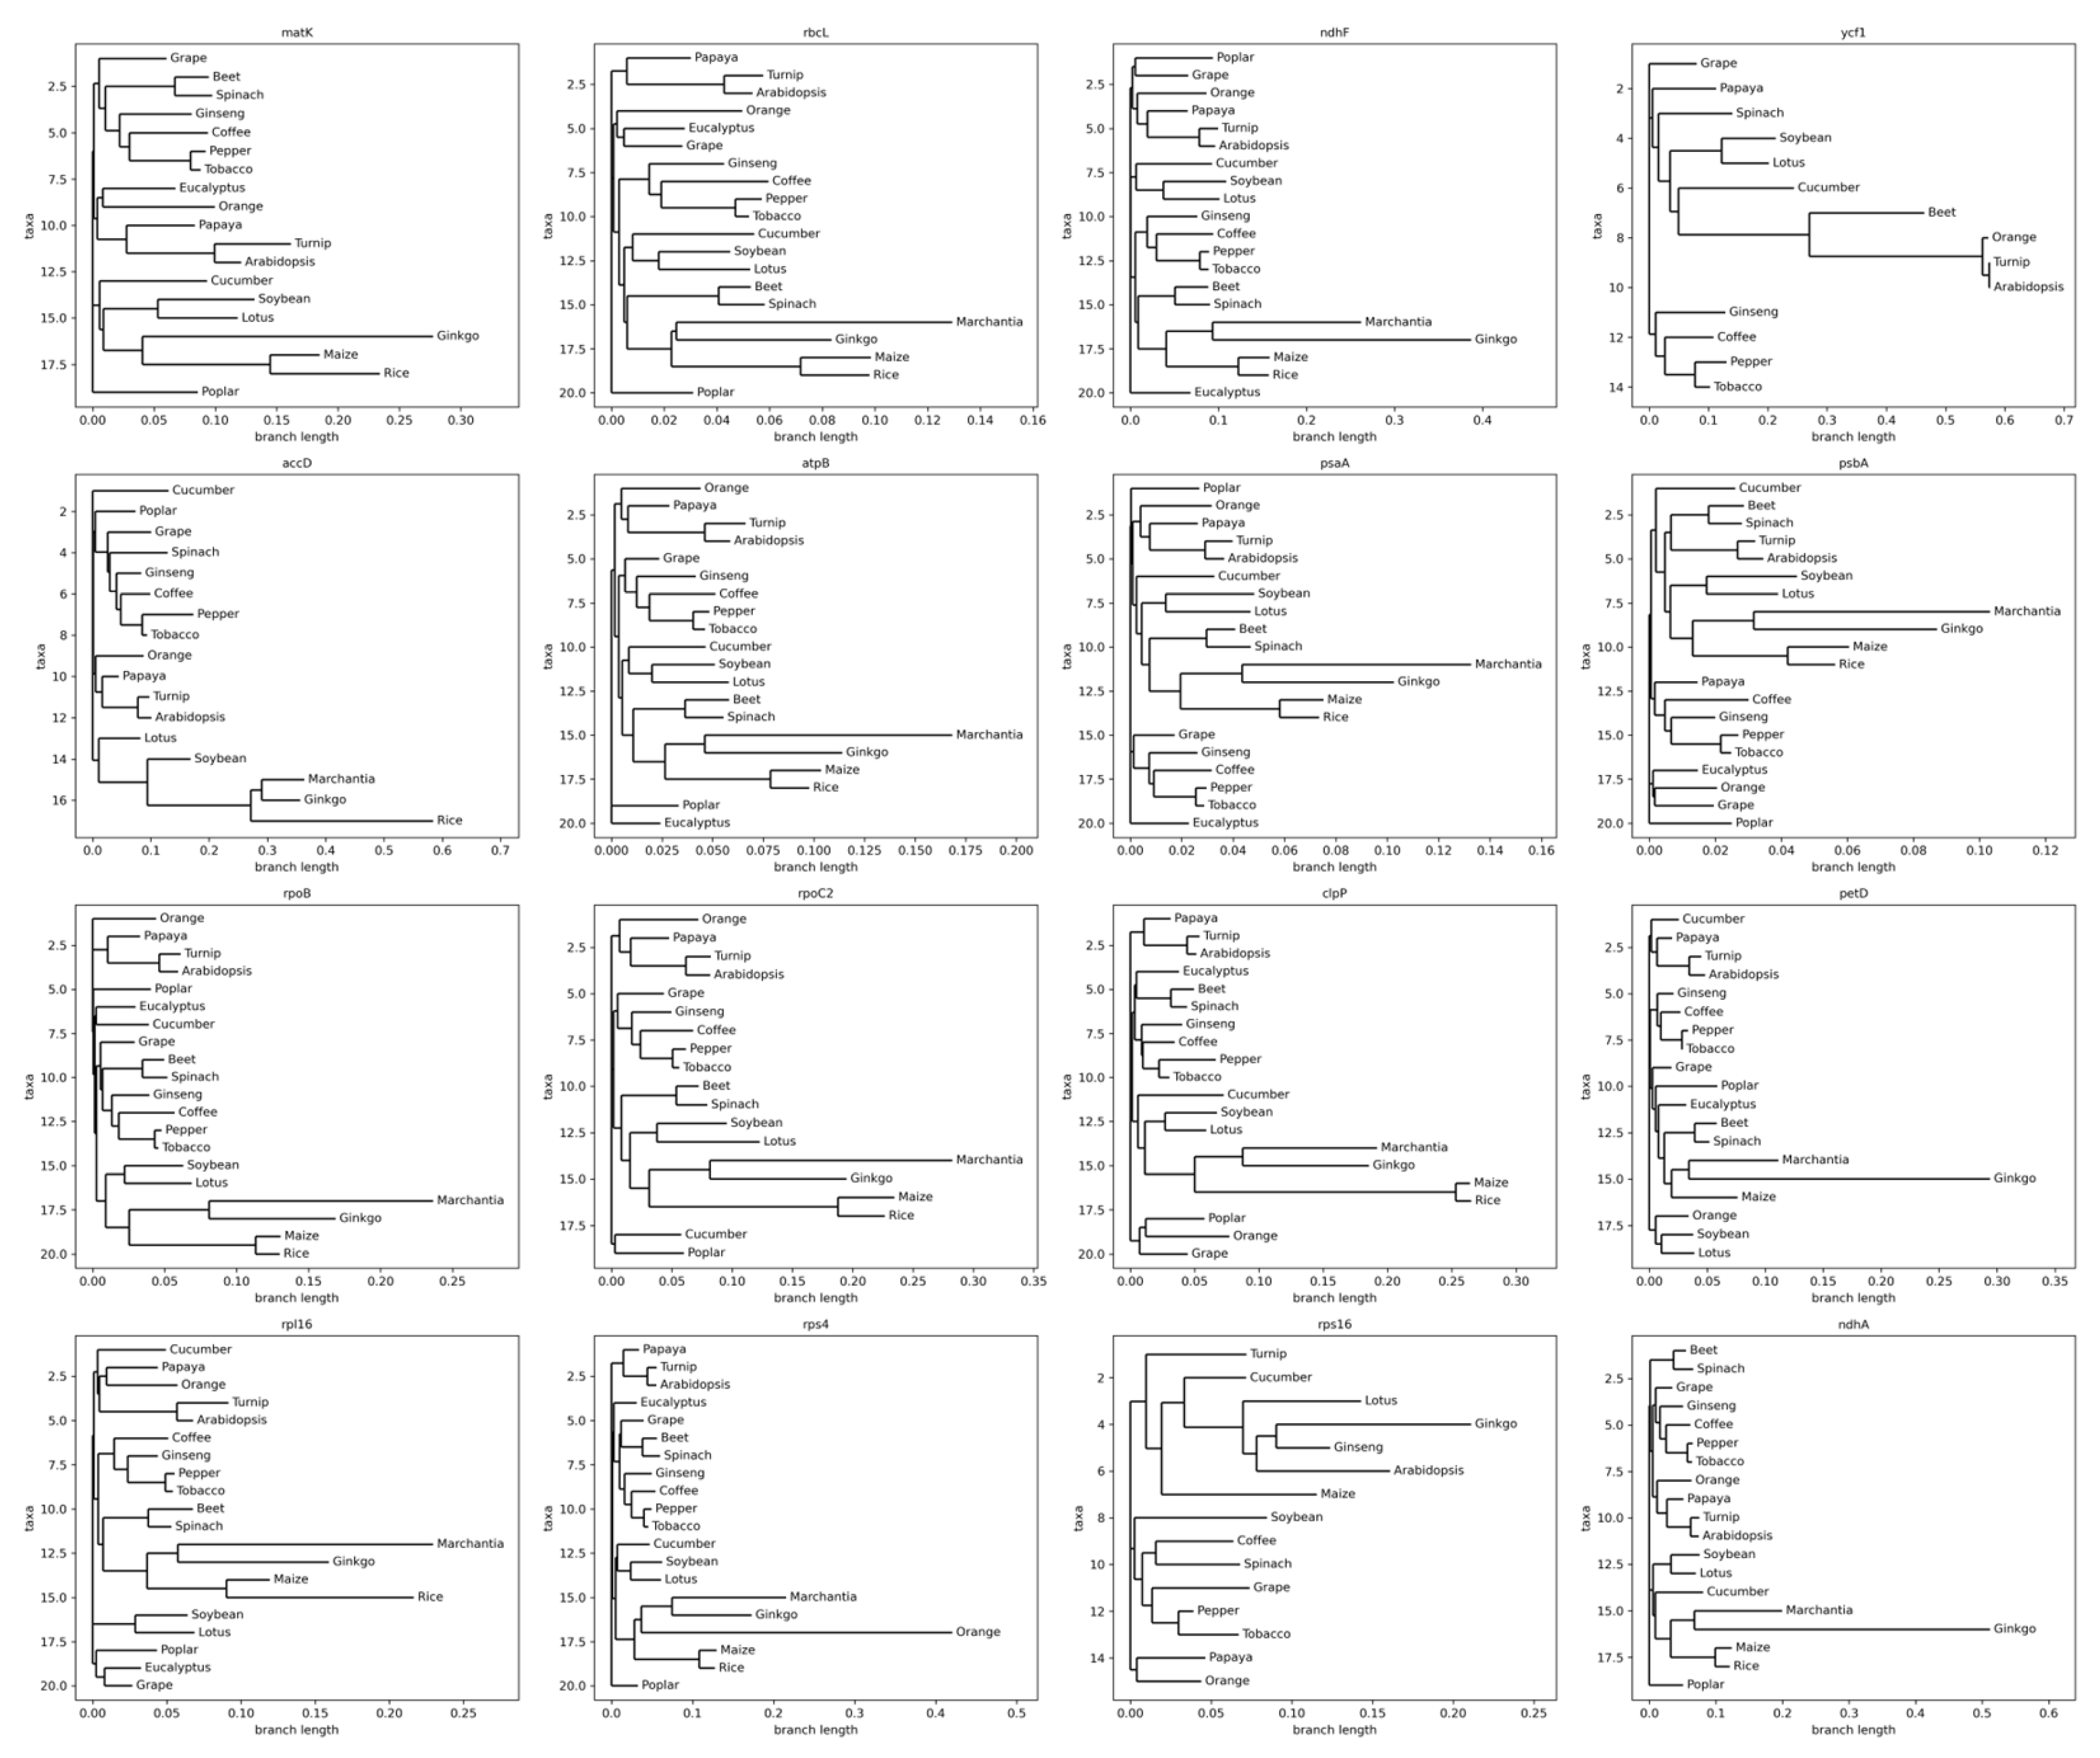
Neighbor-Joining (NJ) phylogenetic trees were constructed for each of the 16 barcoding genes across all species (Figure 2). Despite some gene-specific topological differences, several consistent evolutionary signals were recovered across trees. The monocot species Oryza sativa and Zea mays formed a well-supported clade in most gene trees (e.g., rpoB, psbA, matK), consistent with their known placement within Poaceae. Likewise, the Brassicaceae members Arabidopsis thaliana and Brassica rapa frequently clustered together (e.g., rbcL, rpoC2, ycf1), often in close proximity to Cucumis sativus (Cucurbitaceae), reflecting conserved plastid evolutionary signals among core eudicots.
Ginkgo biloba (gymnosperm) and Marchantia polymorpha (bryophyte) consistently appeared as early diverging lineages or outgroups to angiosperms, reinforcing established deep phylogenetic splits. This pattern was particularly clear in the accD, psaA, and rpl16 gene trees.
To validate and consolidate these findings, a concatenated supermatrix was analyzed using maximum likelihood (ML) via IQ-TREE with ultrafast bootstrapping (1000 replicates). The resulting ML tree supported major clades recovered in the NJ analysis while providing improved statistical confidence for key nodes (Supplementary Figures S1 and S2). Notably, some trees (e.g., ycf1, accD) showed extended branches or unstable placements for certain taxa, likely reflecting elevated substitution rates or alignment uncertainty. These discrepancies highlight gene-specific rate heterogeneity and support the value of multi-gene ML frameworks for more reliable phylogenetic reconstruction.

3.3. Gene Presence and Absence Across Species

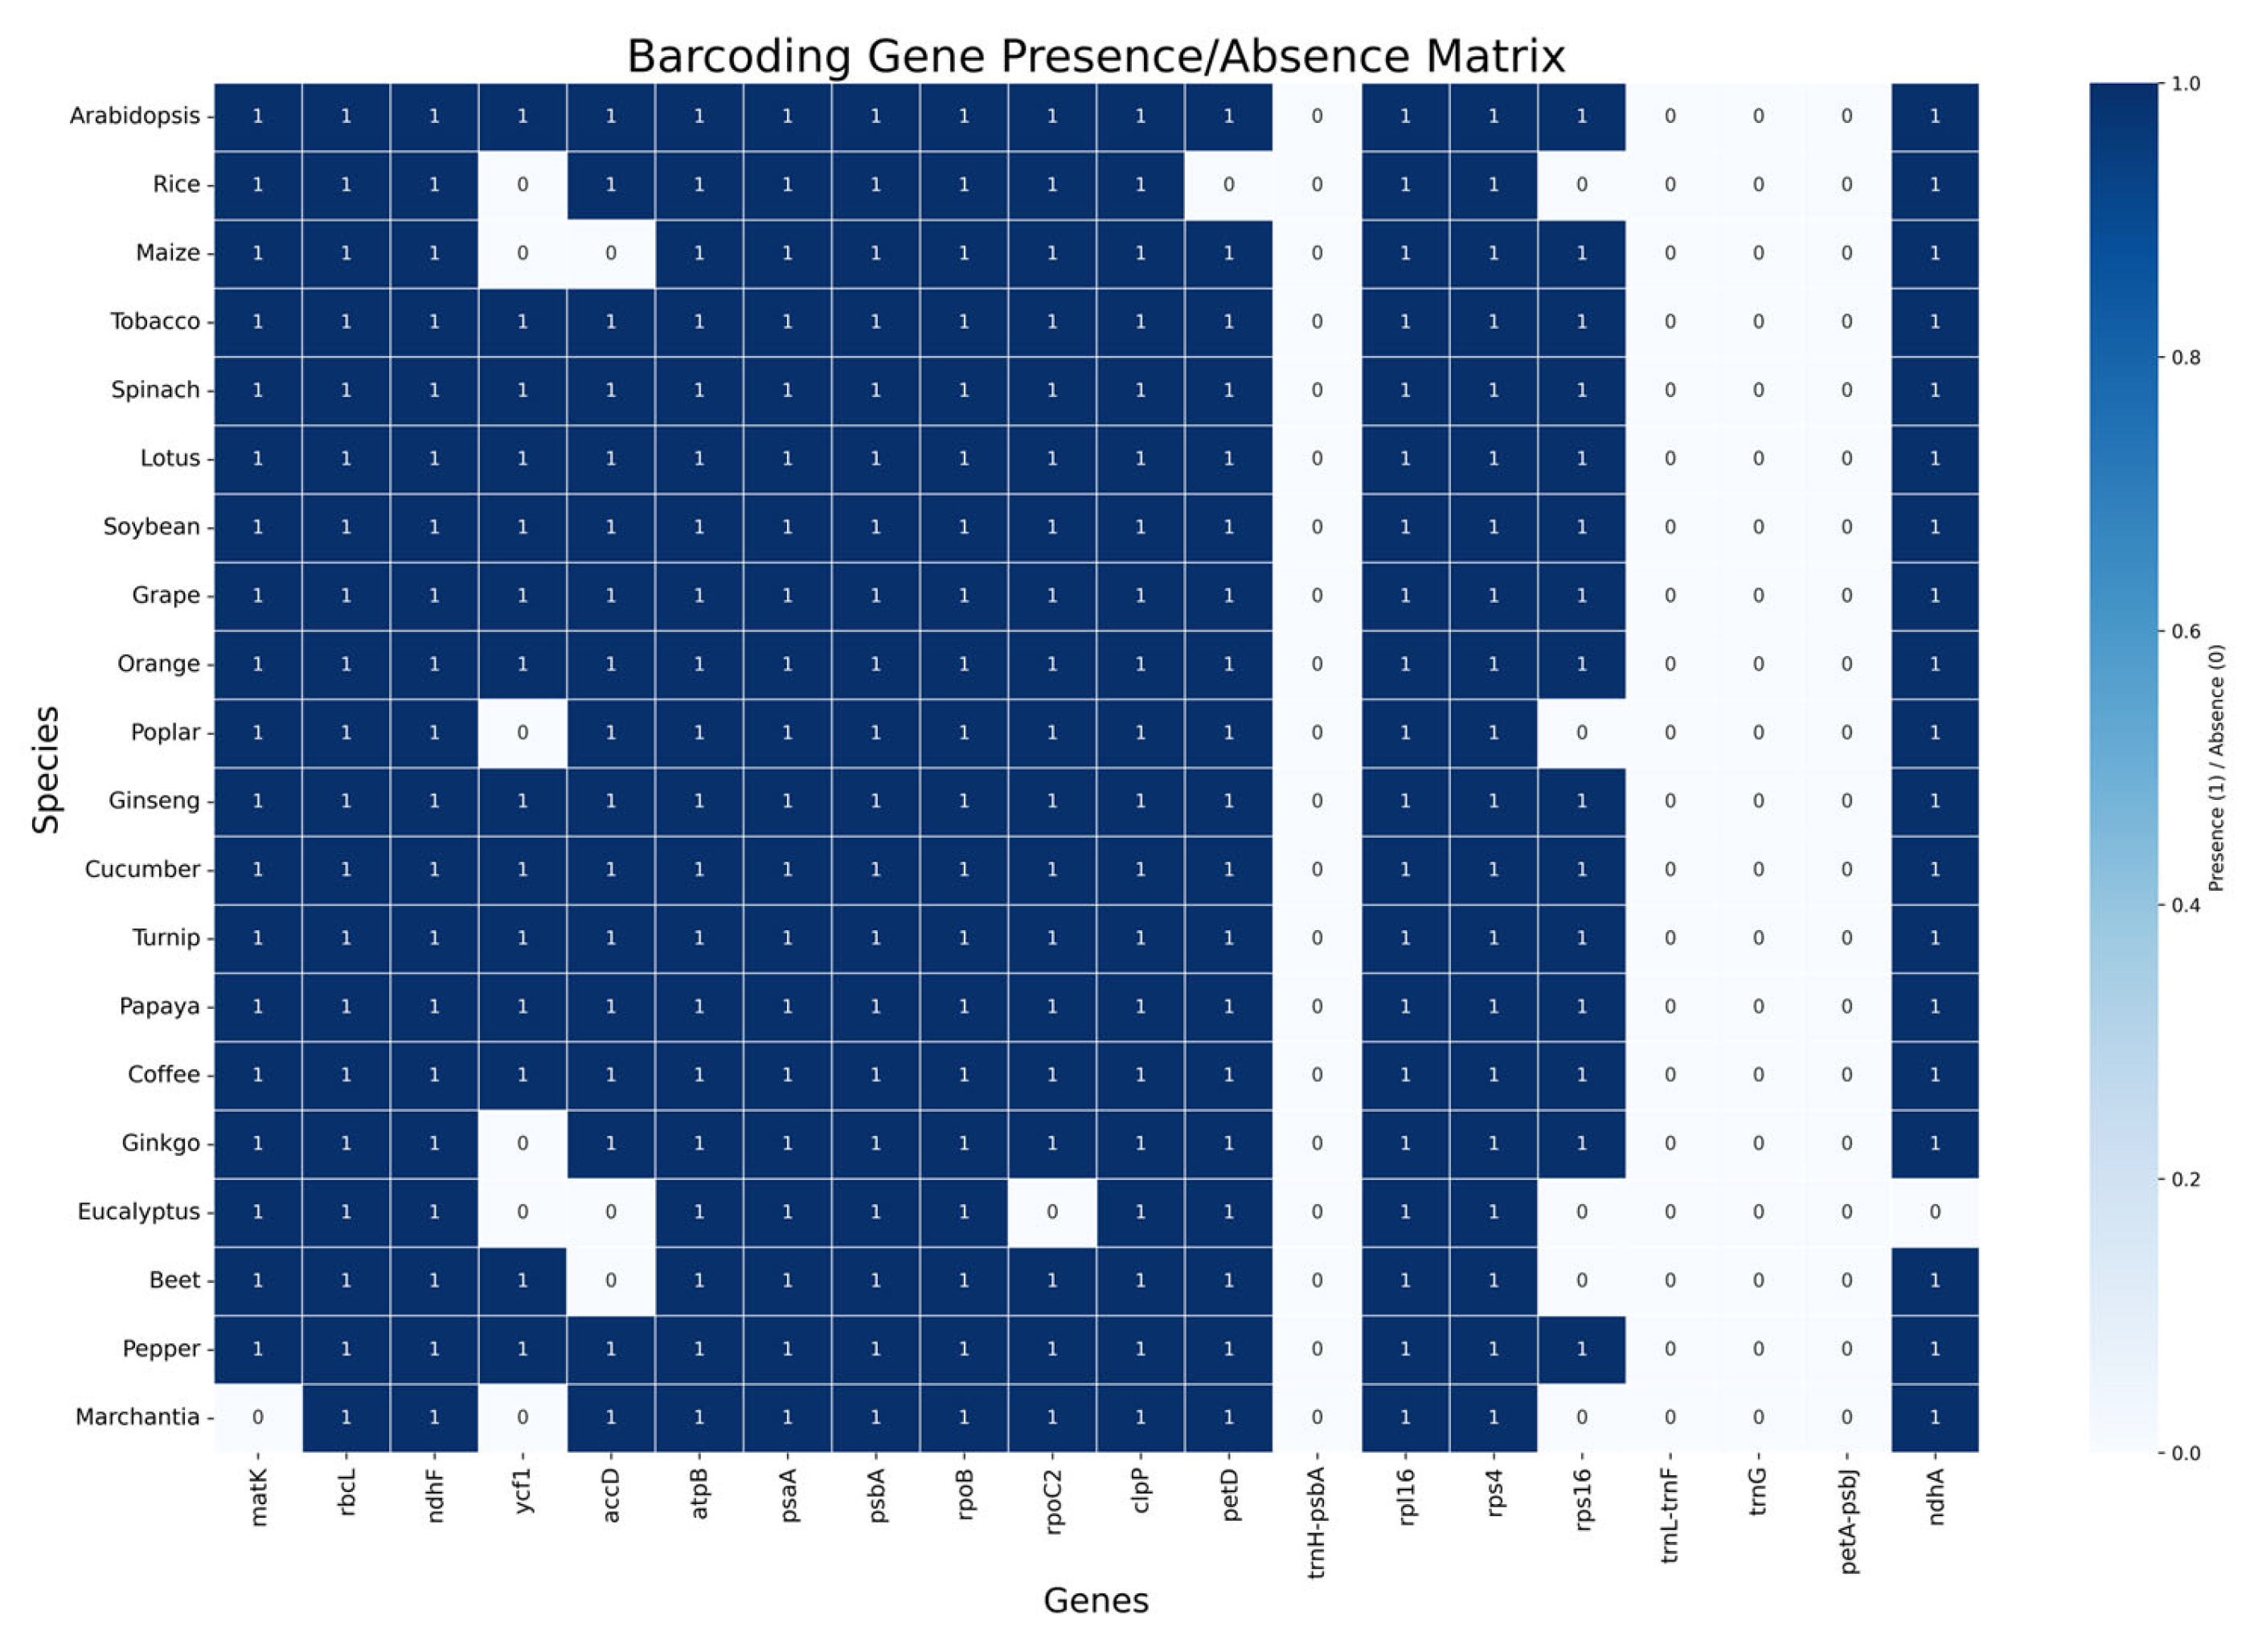
The gene presence/absence matrix (Figure 3) revealed substantial conservation among the 16 targeted chloroplast barcoding loci across the sampled species, alongside phylogenetically structured patterns of gene loss.
Core plastid markers such as rbcL, matK, psaA, psbA, rpoB, and atpB were consistently retained across nearly all taxa, reaffirming their reliability for plastid-based phylogenetic inference. In contrast, several loci—including ndhF, ycf1, rps16, and rpl16—exhibited more variable distributions, with absences often restricted to particular lineages.
Marchantia polymorpha, the only bryophyte included in the dataset, showed the most extensive gene loss, lacking matK, ndhF, psaA, and ycf1, reflecting its basal phylogenetic position and distinct plastome architecture relative to vascular plants. Other notable cases include the absence of accD in Populus trichocarpa and ycf1 in Ginkgo biloba, which may result from lineage-specific gene loss, annotation inconsistencies, or structural rearrangements. Although four commonly used intergenic markers—trnH-psbA, trnL-trnF, trnG, and petA-psbJ—were initially considered, they were excluded from the final analysis due to inconsistent recovery and poor alignment across species.
These findings underscore that while many barcoding genes are broadly conserved, others display lineage-specific variability that must be considered when selecting markers for comparative and phylogenetic plastome studies, particularly across deep evolutionary timescales.

3.4. Genome-Wide Similarity Analysis

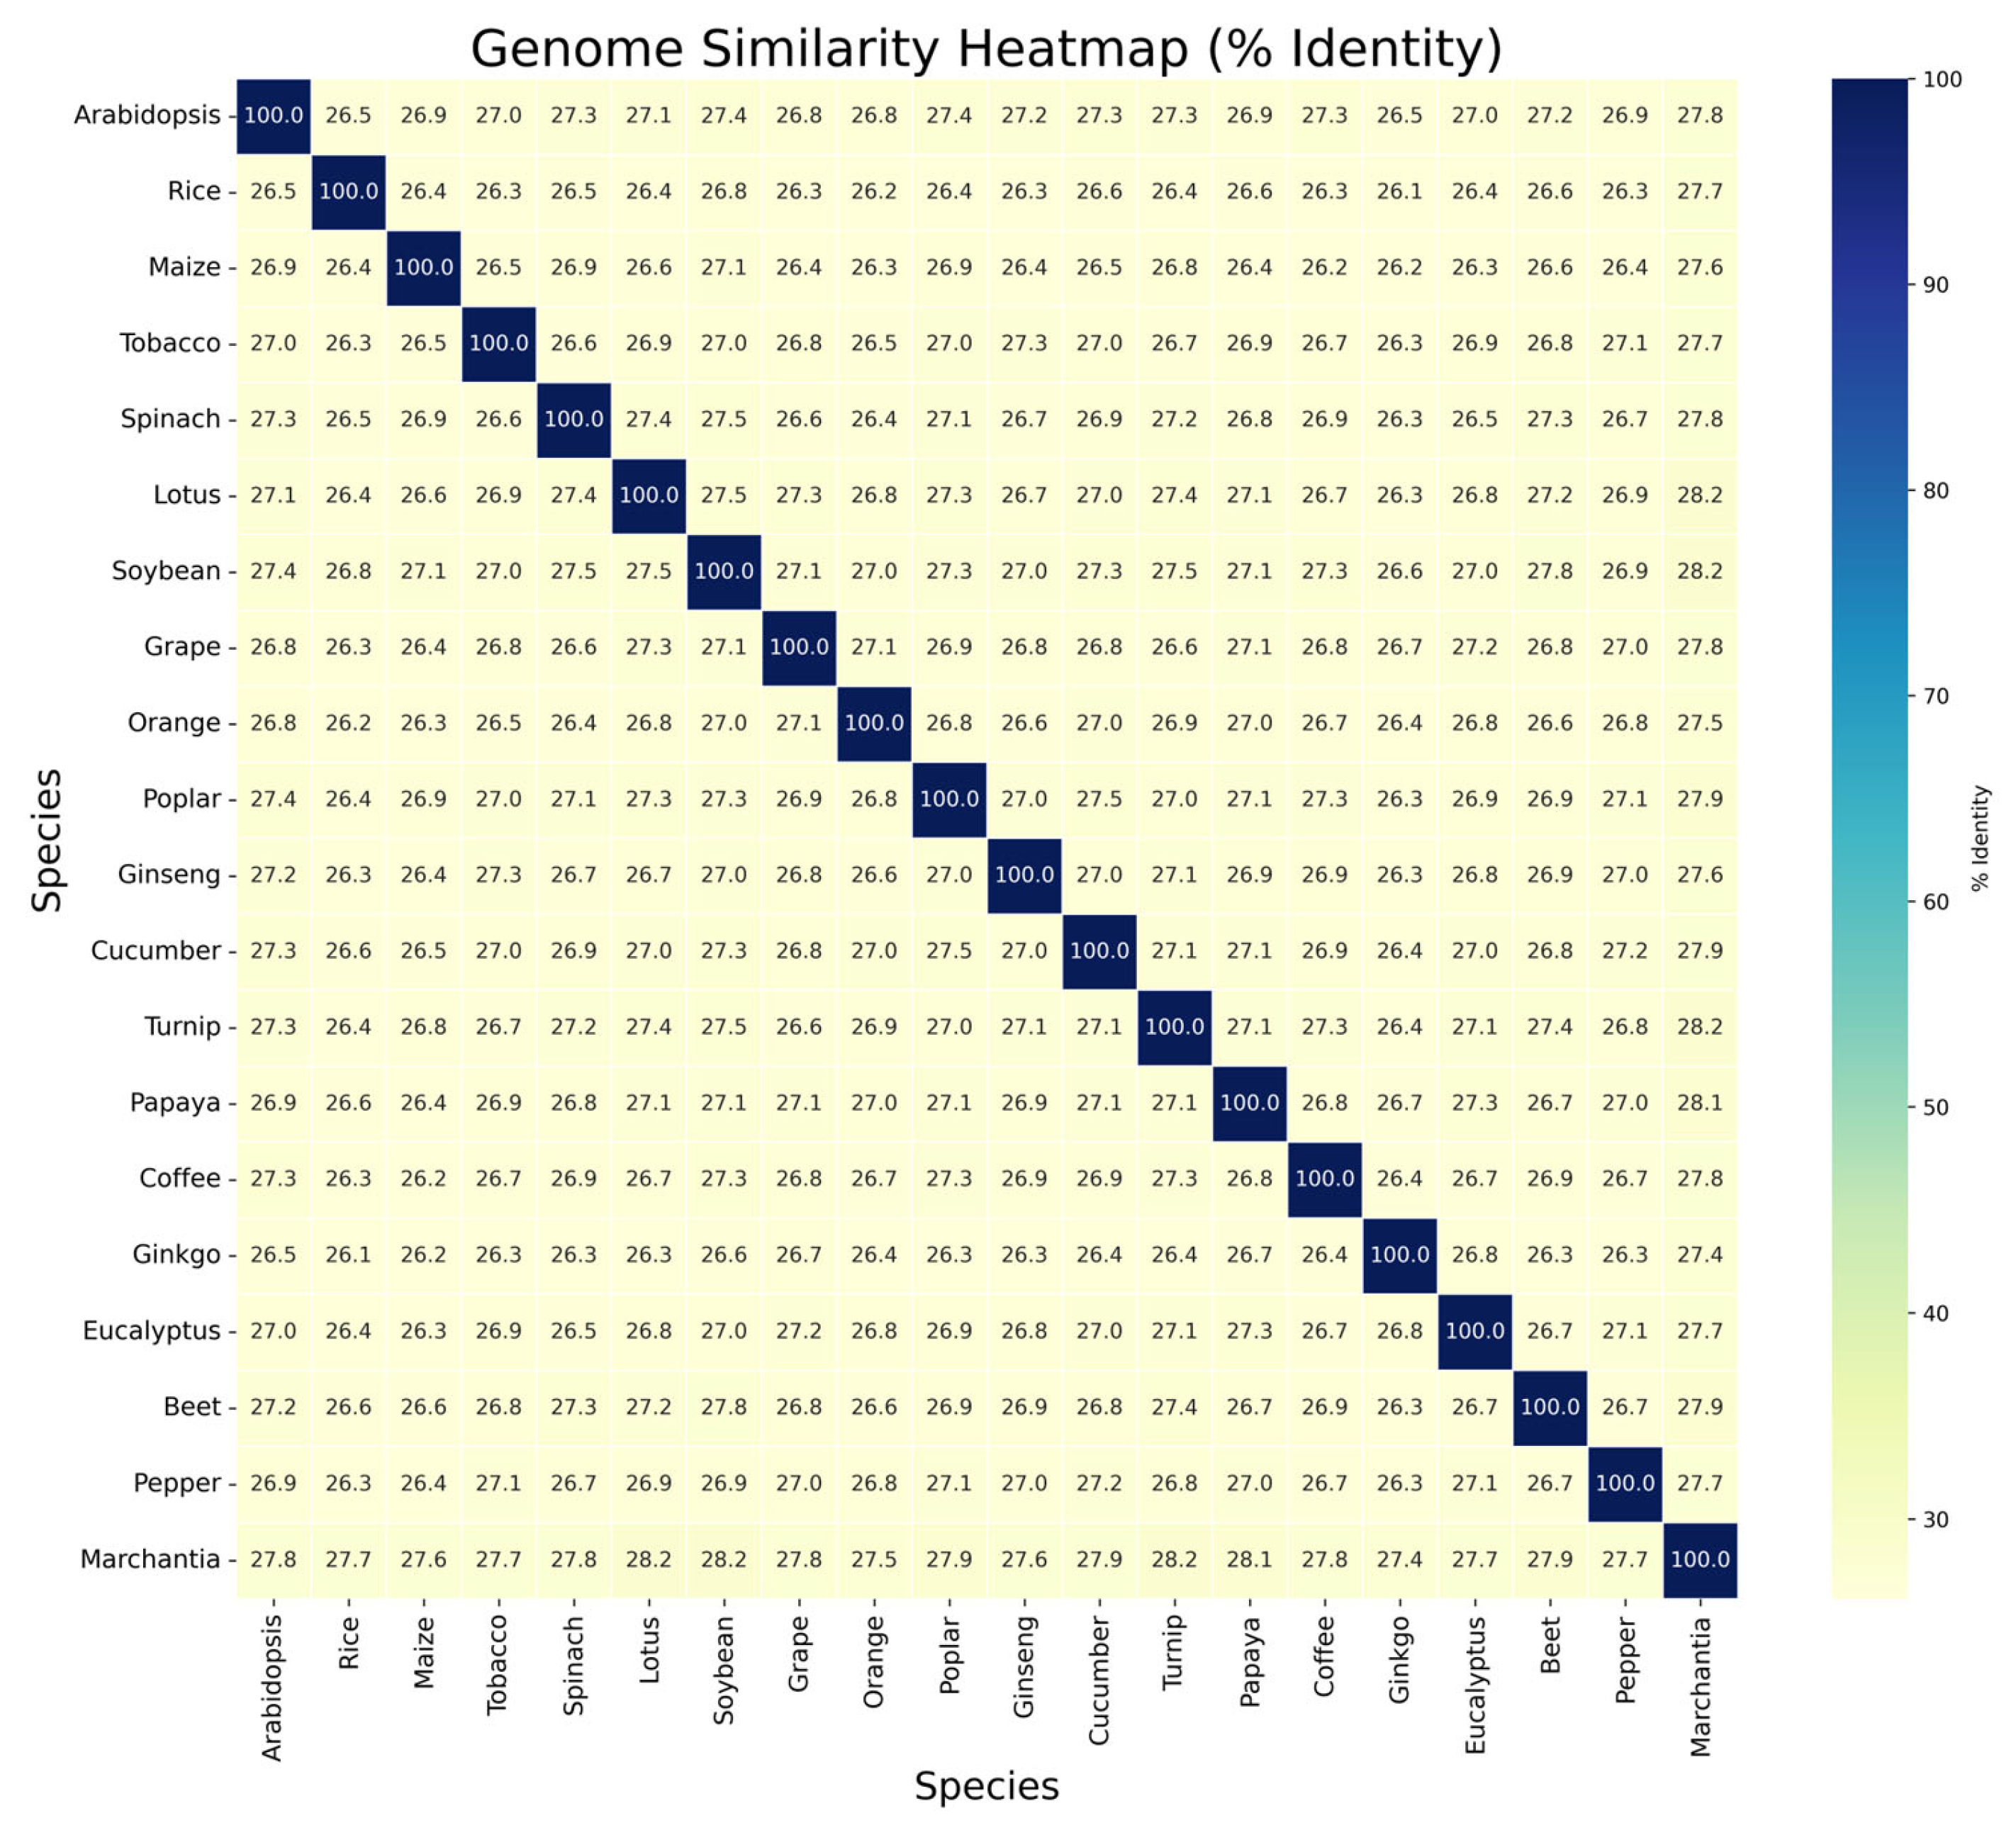
Pairwise comparisons of the complete chloroplast genomes revealed relatively low sequence identity across the 20 plant species analyzed, reflecting deep evolutionary divergence (Figure 4). Percent identity values ranged from approximately 26.1% to 28.2%, with most species’ pairs falling within a narrow window of 26–28%.
Notably, Marchantia polymorpha, the only bryophyte in the dataset, showed slightly higher similarity (~28.2%) to some vascular plants compared to others, possibly reflecting conserved ancestral regions despite its early-diverging status. Ginkgo biloba, a gymnosperm, also exhibited identity scores at the lower end of the range when compared to angiosperms, in agreement with its phylogenetic position.
Overall, the relatively uniform and modest similarity percentages across all species pairs suggest substantial divergence at the whole-plastome level, even among flowering plants. This emphasizes the limitations of direct genome-wide identity metrics for resolving close phylogenetic relationships and highlights the importance of targeted gene analyses (e.g., barcoding loci) in comparative chloroplast genomics.

3.5. Core Versus Accessory Gene Content

Based on observed gene presence across the 20 plant chloroplast genomes, 13 genes were identified as broadly conserved and designated as core genes, while 7 genes were absent in at least one species and classified as accessory genes (Figure 5). This classification was based on direct counts of gene retention rather than applying a fixed presence threshold (e.g., 90%).
The core genes include widely used molecular markers such as rbcL, matK, psaA, and ndhA, reinforcing their value in phylogenetic and barcoding applications. Conversely, genes like trnH-psbA, trnG, and rps16 showed patchy distribution across taxa, suggesting either lineage-specific gene loss or annotation inconsistencies in some plastomes. This broader, observation-driven classification complements threshold-based definitions and provides a practical summary of gene retention trends among the studied species.

3.6. Codon Usage Bias Across Species

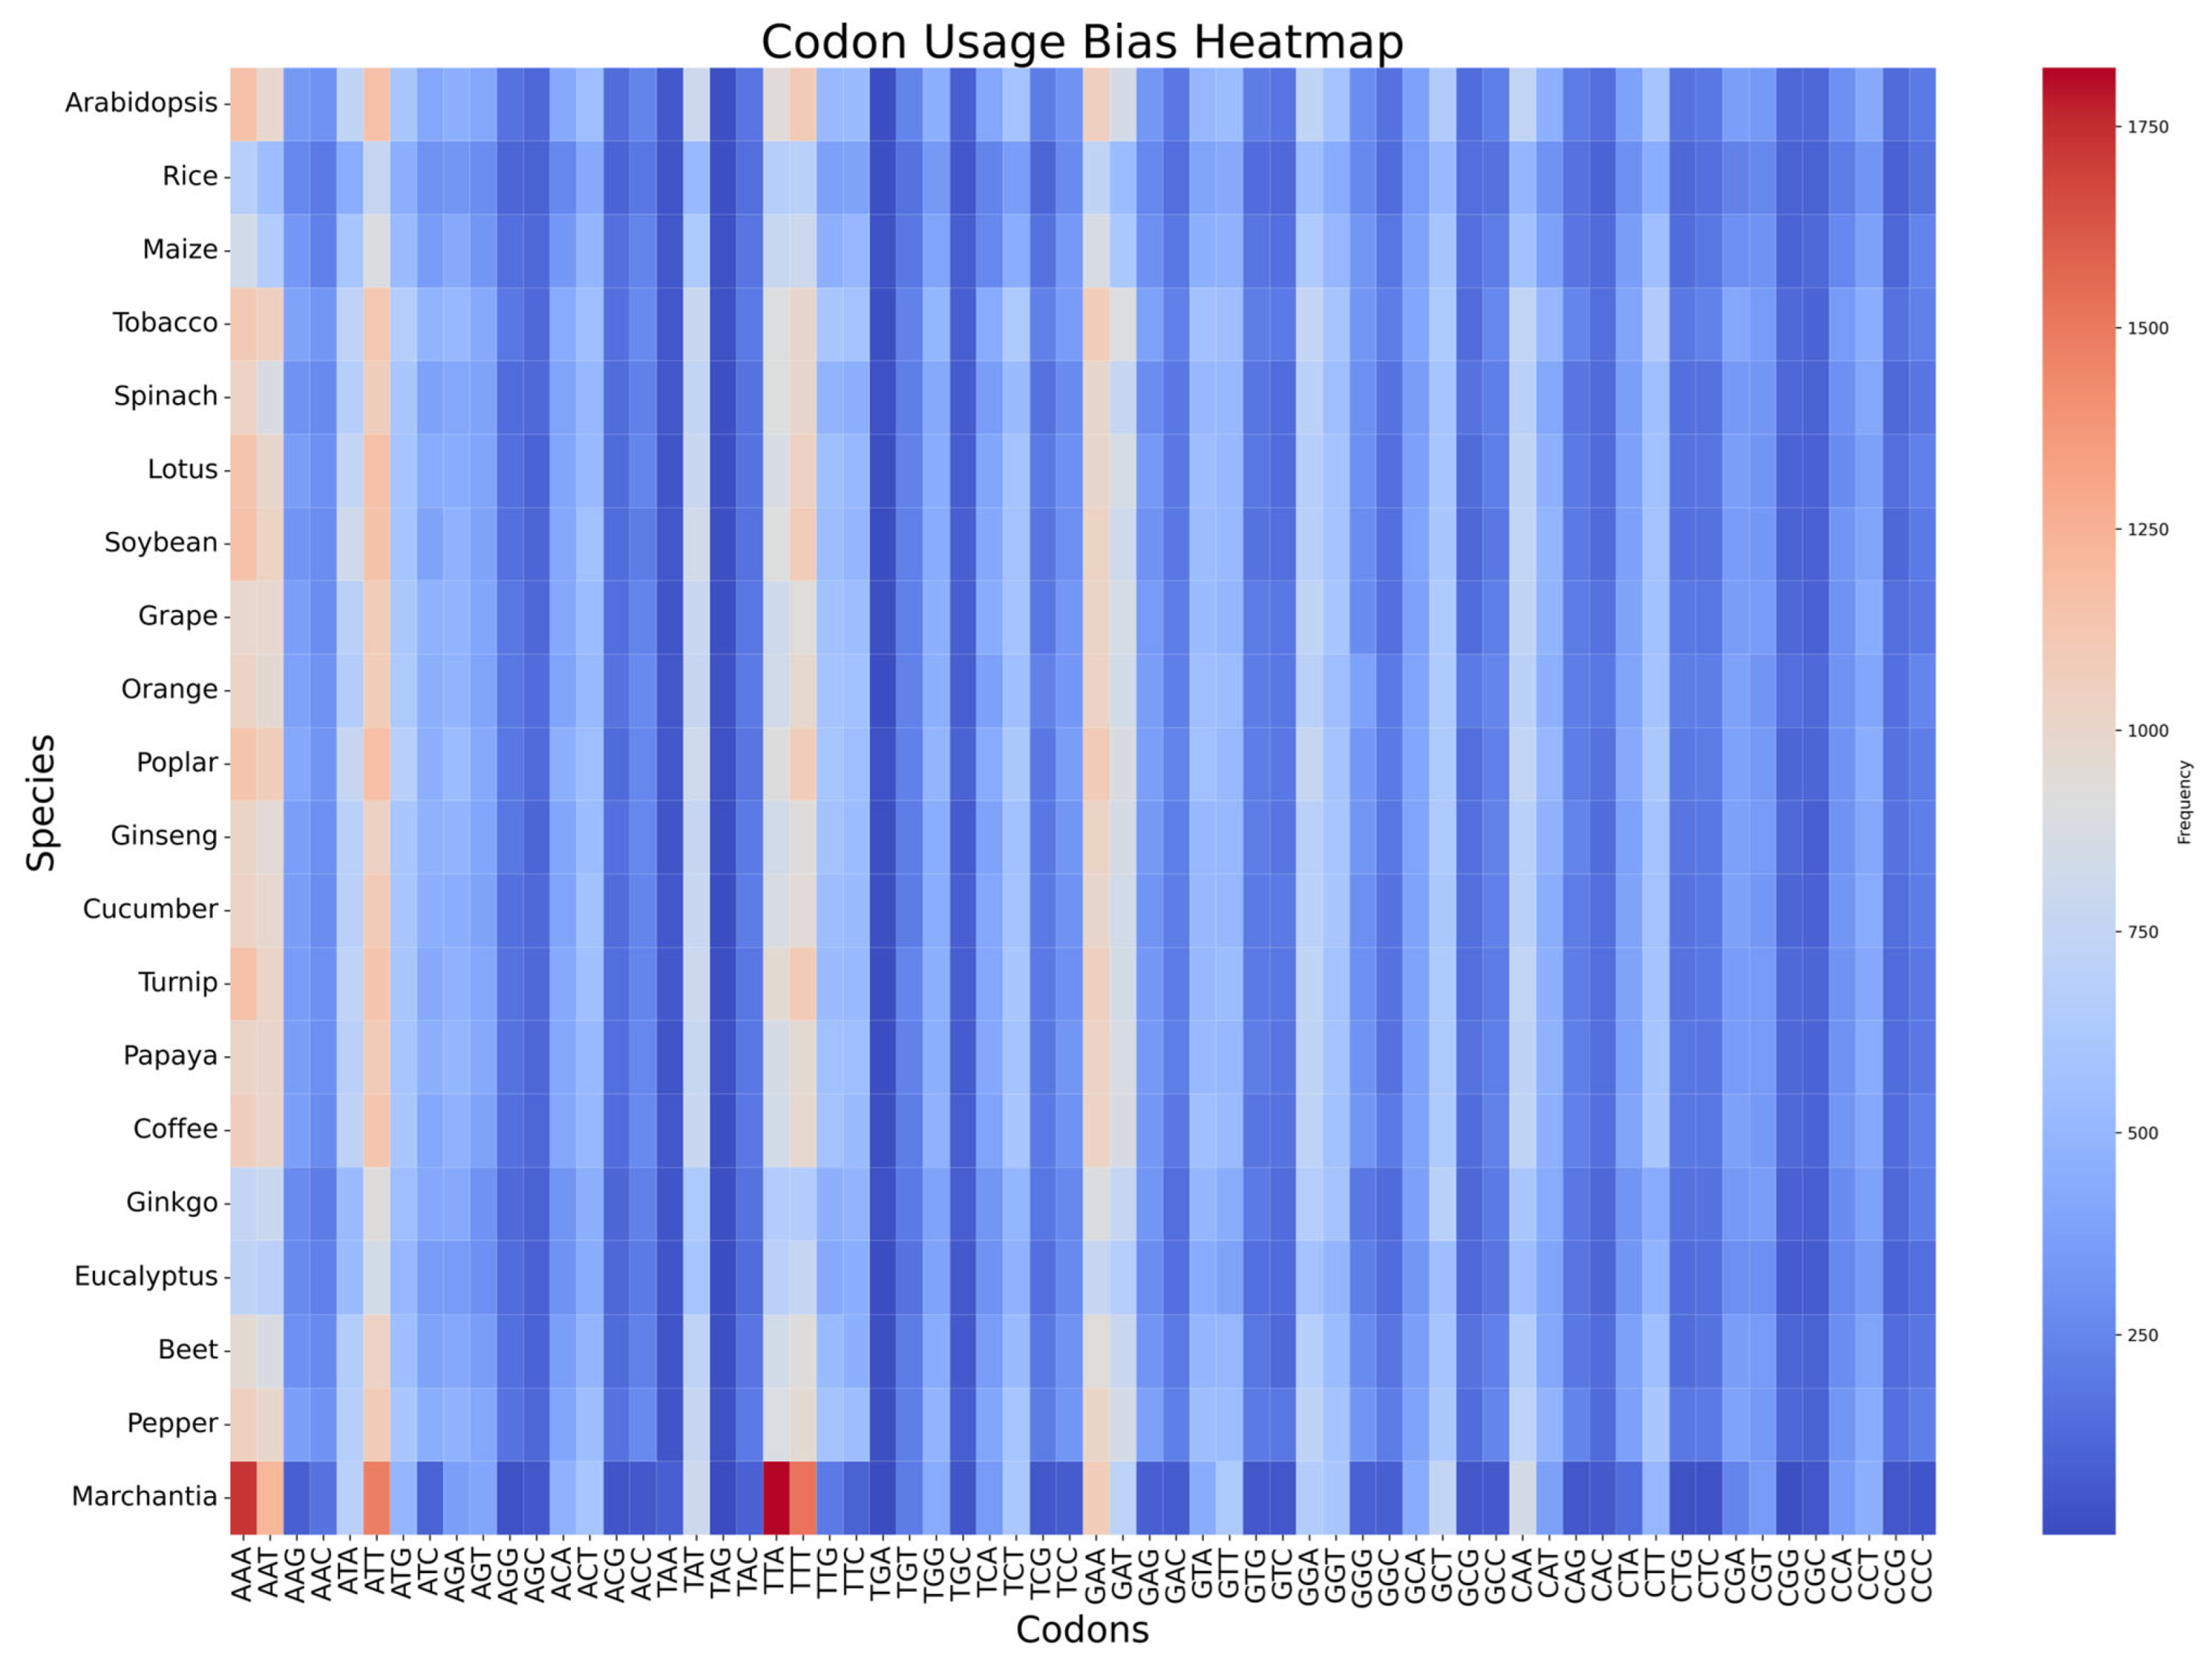
Codon usage patterns across the 20 chloroplast genomes revealed broadly conserved profiles, with subtle yet notable lineage-specific differences (Figure 6). Most species showed a shared preference for A/T-ending codons, consistent with the generally AT-rich nature of plastid genomes.
Some variation was evident in codons for specific amino acids, such as leucine, serine, and phenylalanine. For instance, Marchantia polymorpha, a bryophyte, displayed a distinct codon usage profile compared to angiosperms, with increased frequency of TTA and TAG codons, possibly due to its deep phylogenetic divergence.
While species like Cucumber, Brassica, and Ginkgo showed elevated usage of synonymous codons, the overall codon distribution remained relatively uniform. These differences may reflect lineage-specific mutational biases or translational selection.
Although this analysis did not quantify relative synonymous codon usage (RSCU) or effective number of codons (ENC), the heatmap visualization provides a useful comparative overview of codon usage intensity across representative plastid genes.

4. Discussion

4.1. Variation in Chloroplast Genome Size and Structure

The chloroplast genome sizes observed in this study varied widely, ranging from approximately 120,000 bp in Marchantia polymorpha to over 900,000 bp in Brassica napus. While most species exhibited genome sizes typical of angiosperms (~150 kb), the exceptionally large plastomes of Brassica and Beta align with previous reports of rare but significant plastome expansions within certain angiosperms and early-diverging land plants [4,37]. Such expansions are frequently linked to extensive duplications, proliferation of non-coding regions, and expansions of inverted repeat (IR) regions [20,38]. The inflated plastome of Brassica is consistent with the documented IR expansions and repetitive element accumulation reported in Brassicaceae [39,40]. These findings underscore the dynamic nature of plastome architecture and its potential as a tool for studying genome evolution and species divergence within land plants.

4.2. Phylogenetic Relationships and Gene Evolution

The Neighbor-Joining phylogenetic trees generated from individual barcoding loci largely recapitulated known plant phylogenetic relationships, reaffirming the utility of plastid barcoding genes such as matK and rbcL for taxonomic resolution [14,15,41]. Consistent clustering of Rice and Maize within monocots and the clear placement of Ginkgo biloba as an outgroup relative to angiosperms align with established phylogenies [28,42,43]. However, minor topological differences across gene trees were evident, reflecting locus-specific evolutionary rates, homoplasy, and incomplete lineage sorting, which have been documented in plastid phylogenetic studies [9,12]. These inconsistencies highlight the limitations of single-locus analyses for deep phylogenetic questions and underscore the advantages of multi-gene or whole plastome phylogenomic approaches to achieve robust phylogenetic resolution [13,21,44].

4.3. Gene Presence/Absence Patterns

The gene presence/absence analysis revealed notable variability in barcoding gene retention across the 20 plant species studied, reflecting the dynamic nature of plastome evolution. Using a 90% presence threshold (genes present in at least 18 out of 20 species), I identified two genes, rpl16 and rps4, as core barcoding genes, while the remaining 18 genes were classified as accessory due to their absence in at least two species (Figure 5). These finding highlights that, although plastid genomes are generally conserved, lineage-specific gene loss remains common even among widely used barcoding loci.
Frequent losses of ndh genes and other barcoding loci have been reported in parasitic plants, non-photosynthetic lineages, and certain angiosperms, reflecting either relaxed selection, mutational biases, or functional transfer of gene content to the nuclear genome [4,5,23,45,46]. The extensive gene losses observed in Brassica napus and Carica papaya are consistent with previously reported plastome reduction and rearrangement within Brassicales and Caricaceae [10,47], underscoring the influence of lineage-specific evolutionary processes.
The identification of two highly conserved barcoding genes suggests that while a universal core set of plastid barcoding loci is challenging to establish across diverse plant clades, certain genes remain broadly conserved and can serve as reliable markers for comparative genomics and phylogenetic studies at moderate evolutionary depths. Tailoring marker selection to the specific phylogenetic scale and taxonomic group remains essential for effective plant molecular systematics and biodiversity assessments [4,5,14].

4.4. Genome-Wide Sequence Divergence

Pairwise whole-plastome comparisons revealed high divergence among major plant lineages, particularly between bryophytes (Marchantia) and angiosperms, and between gymnosperms (Ginkgo) and vascular plants, consistent with their ancient evolutionary splits exceeding 300 million years [48,49]. Meanwhile, close relatives such as Arabidopsis and Brassica showed high sequence identity (>95%), supporting the effectiveness of plastome data for resolving relationships at shallow phylogenetic levels [50,51]. The observed genome-wide divergence underscores the utility of complete plastome sequences for investigating both deep and recent evolutionary events in plants.

4.5. Codon Usage Bias and Evolution

Codon usage analysis revealed largely conserved patterns across the 20 sampled plant species, with subtle but noteworthy lineage-specific deviations observed in taxa such as Cucumis sativus and Brassica rapa (Figure 6). These species exhibited elevated usage of synonymous codons, suggesting the influence of localized mutational or selective forces. Notably, Ginkgo biloba showed distinct codon usage compared to angiosperms, consistent with its evolutionary distance and unique genomic context.
To quantify codon bias more formally, I calculated Relative Synonymous Codon Usage (RSCU) values for all protein-coding genes, providing a metric to detect over- or underrepresented codons relative to equal usage expectations. These patterns may reflect mutational biases (e.g., GC content), selection for translational efficiency, or lineage-specific constraints in tRNA availability and genome organization.
While chloroplast genomes generally exhibit weaker codon usage bias than nuclear genomes—due to reduced effective population sizes and relaxed selection—patterns of synonymous codon preference still offer insights into underlying molecular evolution and ecological adaptation [24,25,52]. Deviations in RSCU values in certain taxa could signal adaptations to specific environmental niches or life histories. Integrating codon usage analyses with ecological, functional, and expression data will be valuable for uncovering potential links between plastid genome evolution and organismal biology [53,54]. Thus, codon usage bias provides a complementary layer of evolutionary signal in plastid genomes and may help resolve questions of lineage-specific adaptation, translational regulation, and genome streamlining in plants.

4.6. Study Limitations and Future Directions

While this study provides a broad comparative framework for chloroplast genome evolution across diverse land plants, it is not without limitations. The reliance on GenBank data introduces potential annotation inconsistencies, which may affect comparative analyses [55]. Additionally, Neighbor-Joining phylogenies, while computationally efficient, may not fully capture complex evolutionary signals compared to maximum likelihood or Bayesian methods [11]. Future work could expand taxon sampling, particularly among non-angiosperms, to deepen insights into early land plant plastome evolution. Integrating nuclear and mitochondrial genome data, combined with plastome datasets, could offer a holistic view of plant evolutionary history and genome co-evolution [56,57,58,59,60]. Furthermore, incorporating transcriptomic and proteomic analyses may clarify functional consequences of gene losses and codon usage patterns across lineages.

Supplementary Materials

The following supporting information can be downloaded at: https://www.mdpi.com/article/10.3390/ijpb16030105/s1, Figure S1: Maximum Likelihood phylogenetic tree of 20 plant species constructed from a concatenated alignment of 16 chloroplast barcoding genes. Branch lengths reflect sequence divergence, and numerical values at nodes represent ultrafast bootstrap support (1000 replicates). The tree was midpoint rooted and rendered in rectangular layout for clarity; Figure S2: Same Maximum Likelihood phylogeny as in Supplementary Figure S1, displayed in circular layout for enhanced visualization of topological relationships.

Funding

This research received no external funding.

Data Availability Statement

All scripts, Jupyter notebooks, and outputs necessary to reproduce the analyses in this study are available at https://github.com/abdelmajidk/chloroplast-genomics-analysis (accessed on 1 August 2025). The repository includes code that automatically fetches chloroplast genome data from NCBI GenBank and generates the required directories (aligned, data, fasta, outputs, trees) for downstream analysis. Pre-generated figures and Table 1 are also included. This setup ensures reproducibility without requiring storage or redistribution of external genome data.

Acknowledgments

I thank the developers and maintainers of the open-source software and data resources that enabled this work. I acknowledge the Biopython community for providing accessible tools for biological sequence parsing and analysis, and the developers of MAFFT for robust multiple sequence alignment. I am also grateful to the creators of Matplotlib and Seaborn for enabling high-quality data visualization. Special thanks to the NCBI GenBank database for access to complete chloroplast genome sequences, and to the Python scientific computing community for promoting open, reproducible computational research. I also appreciate the Jupyter ecosystem for supporting interactive and transparent analysis throughout this project.

Conflicts of Interest

The author declares no conflicts of interest.

Abbreviations

The following abbreviations are used in this manuscript.
AbbreviationDescription
matKMaturase K
rbcLRibulose-bisphosphate carboxylase large chain
ndhFNADH dehydrogenase subunit F
ycf1Hypothetical chloroplast reading frame 1
accDAcetyl-CoA carboxylase beta subunit
atpBATP synthase CF1 beta subunit
psaAPhotosystem I P700 chlorophyll a apoprotein A1
psbAPhotosystem II protein D1
rpoBRNA polymerase beta subunit
rpoC2RNA polymerase beta’ subunit
clpPATP-dependent Clp protease proteolytic subunit
petDCytochrome b6/f complex subunit 4
trnH-psbAtRNA-His and photosystem II protein D1 intergenic spacer
rpl16Ribosomal protein L16
rps4Ribosomal protein S4
rps16Ribosomal protein S16
trnL-trnFtRNA-Leu and tRNA-Phe intergenic spacer
trnGtRNA-Gly
petA-psbJCytochrome f and photosystem II protein J intergenic spacer
ndhANADH dehydrogenase subunit A
LSC regionLarge single-copy region
SSC regionSmall single-copy region
IRsInverted repeats
CUBCodon usage bias
NJNeighbor-Joining
CDSCoding sequence(s)

References

  1. Daniell, H.; Lin, C.S.; Yu, M.; Chang, W.J. Chloroplast genomes: Diversity, evolution, and applications in genetic engineering. Genome Biol. 2016, 17, 134. [Google Scholar] [CrossRef] [PubMed]
  2. Neuhauss, H.E.; Emes, M.J. Nonphotosynthetic metabolism in plastids. Annu. Rev. Plant Physiol. Plant Mol. Biol. 2000, 51, 111–140. [Google Scholar] [CrossRef] [PubMed]
  3. Raubeson, L.A.; Jansen, R.K. Chloroplast Genomes of Plants. In Plant Diversity and Evolution: Genotypic and Phenotypic Variation in Higher Plants; Henry, R.J., Ed.; CABI Publishing: Wallingford, UK, 2005; pp. 45–68. [Google Scholar] [CrossRef]
  4. Wicke, S.; Schneeweiss, G.M.; dePamphilis, C.W.; Muller, K.F.; Quandt, D. The evolution of the plastid chromosome in land plants: Gene content, gene order, gene function. Plant Mol. Biol. 2011, 76, 273–297. [Google Scholar] [CrossRef] [PubMed]
  5. Wicke, S.; Schneeweiss, G.M. Next-generation organellar genomics: Potentials and pitfalls of high-throughput technologies for molecular evolutionary studies and plant systematics. In Next-Generation Sequencing in Plant Systematics; Hörandl, E., Appelhans, M., Eds.; Koeltz Scientific Books: Königstein, Germany, 2015; pp. 1–18. [Google Scholar] [CrossRef]
  6. Wang, R.J.; Cheng, C.L.; Chang, C.C.; Wu, C.L.; Su, T.M.; Chaw, S.M. Dynamics and evolution of the inverted repeat-large single copy junctions in the chloroplast genomes of monocots. BMC Evol. Biol. 2008, 8, 36. [Google Scholar] [CrossRef]
  7. Jansen, R.K.; Ruhlman, T.A. Plastid genomes of seed plants. In Genomics of Chloroplasts and Mitochondria, Advances in Photosynthesis and Respiration; Bock, R., Knoop, V., Eds.; Springer: Dordrecht, The Netherlands, 2012; Volume 35, pp. 103–126. [Google Scholar] [CrossRef]
  8. Soltis, D.E.; Soltis, P.S.; Tate, J.A. Advances in the study of polyploidy since plant speciation. New Phytol. 2004, 161, 173–191. [Google Scholar] [CrossRef]
  9. Shaw, J.; Lickey, E.B.; Beck, J.T.; Farmer, S.B.; Liu, W.; Miller, J.; Siripun, K.C.; Winder, C.T.; Schilling, E.E.; Small, R.L. The tortoise and the hare II: Relative utility of 21 noncoding chloroplast DNA sequences for phylogenetic analysis. Am. J. Bot. 2005, 94, 275–288. [Google Scholar] [CrossRef]
  10. Ravi, V.; Khurana, J.P.; Tyagi, A.K.; Khurana, P. An update on chloroplast genomes. Plant Syst. Evol. 2008, 271, 101–122. [Google Scholar] [CrossRef]
  11. Zhang, S.D.; Jin, J.J.; Chen, S.Y.; Chase, M.W.; Soltis, D.E.; Li, H.T.; Yang, J.B.; Li, D.Z.; Yi, T.S. Diversification of Rosaceae since the Late Cretaceous based on plastid phylogenomics. New Phytol. 2017, 214, 1355–1367. [Google Scholar] [CrossRef]
  12. Guisinger, M.M.; Kuehl, J.V.; Boore, J.L.; Jansen, R.K. Extreme reconfiguration of plastid genomes in the angiosperm family Geraniaceae: Rearrangements, repeats, and codon usage. Mol. Biol. Evol. 2011, 28, 583–600. [Google Scholar] [CrossRef]
  13. Barrett, C.F.; Davis, J.I.; Leebens-Mack, J.; Conran, J.G.; Stevenson, D.W. Plastid genomes and deep relationships among the commelinid monocot angiosperms. Cladistics 2013, 29, 65–87. [Google Scholar] [CrossRef]
  14. Hollingsworth, P.M.; Graham, S.W.; Little, D.P. Choosing and using a plant DNA barcode. PLoS ONE 2011, 6, e19254. [Google Scholar] [CrossRef] [PubMed]
  15. Dong, W.; Xu, C.; Cheng, T.; Zhou, S. Complete chloroplast genome of Sedum sarmentosum and chloroplast genome evolution in Saxifragales. PLoS ONE 2013, 8, e77965. [Google Scholar] [CrossRef] [PubMed]
  16. CBOL Plant Working Group. A DNA barcode for land plants. Proc. Natl. Acad. Sci. USA 2009, 106, 12794–12797. [Google Scholar] [CrossRef] [PubMed]
  17. Dong, W.; Liu, J.; Yu, J.; Wang, L.; Zhou, S. Highly variable chloroplast markers for evaluating plant phylogeny at low taxonomic levels and for DNA barcoding. PLoS ONE 2012, 7, e35071. [Google Scholar] [CrossRef]
  18. Kress, W.J.; Erickson, D.L. A two-locus global DNA barcode for land plants: The coding rbcL gene complements the non-coding trnH-psbA spacer region. PLoS ONE 2007, 2, e508. [Google Scholar] [CrossRef]
  19. Fazekas, A.J.; Burgess, K.S.; Kesanakurti, P.R.; Graham, S.W.; Newmaster, S.G.; Husband, B.C.; Percy, D.M.; Hajibabaei, M.; Barrett, S.C.H. Multiple multilocus DNA barcodes from the plastid genome discriminate plant species equally well. PLoS ONE 2008, 3, e2802. [Google Scholar] [CrossRef]
  20. Chumley, T.W.; Palmer, J.D.; Mower, J.P.; Fourcade, H.M.; Calie, P.J.; Boore, J.L.; Jansen, R.K. The complete chloroplast genome sequence of Pelargonium × hortorum: Organization and evolution of the largest and most highly rearranged chloroplast genome of land plants. Mol. Biol. Evol. 2006, 23, 2175–2190. [Google Scholar] [CrossRef]
  21. Jansen, R.K.; Cai, Z.; Raubeson, L.A.; Daniell, H.; dePamphilis, C.W.; Leebens-Mack, J.; Muller, K.F.; Guisinger-Bellian, M.; Haberle, R.C.; Hansen, A.K.; et al. Analysis of 81 genes from 64 plastid genomes resolves relationships in angiosperms and identifies genome-scale evolutionary patterns. Proc. Natl. Acad. Sci. USA 2007, 104, 19369–19374. [Google Scholar] [CrossRef]
  22. Knox, E.B. The dynamic history of plastid genomes in the Campanulaceae sensu lato is unique among angiosperms. Proc. Natl. Acad. Sci. USA 2014, 111, 11097–11102. [Google Scholar] [CrossRef]
  23. Wolfe, K.H.; Morden, C.W.; Palmer, J.D. Function and evolution of a minimal plastid genome from a nonphotosynthetic parasitic plant. Proc. Natl. Acad. Sci. USA 1992, 89, 10648–10652. [Google Scholar] [CrossRef]
  24. Morton, B.R. Selection on the codon bias of chloroplast and cyanelle genes in different plant and algal lineages. J. Mol. Evol. 1998, 46, 449–459. [Google Scholar] [CrossRef] [PubMed]
  25. Morton, B.R. The role of context-dependent mutations in generating compositional and codon usage bias in grass chloroplast DNA. J. Mol. Evol. 2003, 56, 616–629. [Google Scholar] [CrossRef] [PubMed]
  26. Zhang, Z.; Li, J.; Zhao, X.Q.; Wang, J.; Wong, G.K.S.; Yu, J. KaKs_Calculator: Calculating Ka and Ks through model selection and model averaging. Genom. Proteom. Bioinform. 2007, 4, 259–263. [Google Scholar] [CrossRef] [PubMed]
  27. Grewe, F.; Guo, W.; Gubbels, E.A.; Hansen, A.K.; Mower, J.P. Complete plastid genomes from Ophioglossum californicum, Psilotum nudum, and Equisetum hyemale reveal an ancestral land plant genome structure and resolve the position of Equisetales among monilophytes. BMC Evol. Biol. 2013, 13, 8. [Google Scholar] [CrossRef]
  28. Hodkinson, T.R. Evolution and taxonomy of the grasses (Poaceae): A model family for the study of species-rich groups. Annu. Plant Rev. 2018, 1, 1–39. [Google Scholar] [CrossRef]
  29. Huo, Y.M.; Gao, L.M.; Liu, B.J.; Yang, Y.Y.; Kong, S.P.; Sun, Y.Q.; Yang, Y.H.; Wu, X. Complete chloroplast genome sequences of four Allium species: Comparative and phylogenetic analyses. Sci. Rep. 2019, 9, 12250. [Google Scholar] [CrossRef]
  30. Sayers, E.W.; Beck, J.; Bolton, E.E.; Brister, J.R.; Chan, J.; Connor, R.; Feldgarden, M.; Fine, A.M.; Funk, K.; Hoffman, J.; et al. Database resources of the National Center for Biotechnology Information in 2025. Nucleic Acids Res. 2025, 53, D20–D29. [Google Scholar] [CrossRef]
  31. Cock, P.J.A.; Antao, T.; Chang, J.T.; Chapman, B.A.; Cox, C.J.; Dalke, A.; Friedberg, I.; Hamelryck, T.; Kauff, F.; Wilczynski, B.; et al. Biopython: Freely available Python tools for computational molecular biology and bioinformatics. Bioinformatics 2009, 25, 1422–1423. [Google Scholar] [CrossRef]
  32. Katoh, K.; Standley, D.M. MAFFT multiple sequence alignment software version 7: Improvements in performance and usability. Mol. Biol. Evol. 2013, 30, 772–780. [Google Scholar] [CrossRef]
  33. Saitou, N.; Nei, M. The neighbor-joining method: A new method for reconstructing phylogenetic trees. Mol. Biol. Evol. 1987, 4, 406–425. [Google Scholar] [CrossRef]
  34. Evans, J.; Sheneman, L.; Foster, J. Relaxed neighbor joining: A fast distance-based phylogenetic tree construction method. J. Mol. Evol. 2006, 62, 785–792. [Google Scholar] [CrossRef]
  35. Hunter, J.D. Matplotlib: A 2D graphics environment. Comput. Sci. Eng. 2007, 9, 90–95. [Google Scholar] [CrossRef]
  36. Waskom, M.L. Seaborn: Statistical data visualization. J. Open Source Softw. 2021, 6, 3021. [Google Scholar] [CrossRef]
  37. Downie, S.R.; Palmer, J.D. Use of chloroplast DNA rearrangements in reconstructing plant phylogeny. In Molecular Systematics of Plants; Soltis, P.S., Soltis, D.E., Doyle, J.J., Eds.; Springer: Boston, MA, USA, 1992; pp. 14–35. [Google Scholar] [CrossRef]
  38. Zhu, A.; Guo, W.; Gupta, S.; Fan, W.; Mower, J.P. Evolutionary dynamics of the plastid inverted repeat: The effects of expansion, contraction, and loss on substitution rates. New Phytol. 2016, 209, 1747–1756. [Google Scholar] [CrossRef]
  39. Lysak, M.A.; Koch, M.A.; Pecinka, A.; Schubert, I. Chromosome triplication found across the tribe Brassiceae. Genome Res. 2005, 15, 516–525. [Google Scholar] [CrossRef] [PubMed]
  40. Guo, X.; Liu, J.; Hao, G.; Zhang, L.; Mao, K.; Wang, X.; Zhang, D.; Ma, T.; Hu, Q.; Al-Shehbaz, I.A.; et al. Plastome phylogeny and early diversification of Brassicaceae. BMC Genom. 2017, 18, 176. [Google Scholar] [CrossRef]
  41. Leaks, K.; El, A.; Alsaidi, Z.; Benton, K.; Chase, J.; Lewis, S.; Kassem, M.A. Comparative phylogenetic analysis of six angiosperm families using rbcL and matK chloroplast markers. J. Artif. Intell. Mach. Learn. Bioinform. 2025, 2025, 29–39. [Google Scholar] [CrossRef]
  42. Chaw, S.M.; Parkinson, C.L.; Cheng, Y.; Vincent, T.M.; Palmer, J.D. Seed plant phylogeny inferred from all three plant genomes: Monophyly of extant gymnosperms and origin of Gnetales from conifers. Proc. Natl. Acad. Sci. USA 2000, 97, 4086–4091. [Google Scholar] [CrossRef] [PubMed]
  43. Grass Phylogeny Working Group; Barker, N.P.; Clark, L.G.; Davis, J.I.; Duvall, M.R.; Guala, G.F.; Hsiao, C.; Kellogg, E.A.; Linder, H.P.; Mason-Gamer, R.J.; et al. Phylogeny and subfamilial classification of the grasses (Poaceae). Ann. Mo. Bot. Gard. 2001, 88, 373–457. [Google Scholar] [CrossRef]
  44. Lanier, H.C.; Knowles, L.L. Applying species-tree analyses to deep phylogenetic histories: Challenges and potential suggested from a survey of empirical phylogenetic studies. Mol. Phylogenet. Evol. 2015, 83, 191–199. [Google Scholar] [CrossRef]
  45. Millen, R.S.; Olmstead, R.G.; Adams, K.L.; Palmer, J.D.; Lao, N.T.; Heggie, L.; Kavanagh, T.A.; Hibberd, J.M.; Gray, J.C.; Morden, C.W.; et al. Many parallel losses of infA from chloroplast DNA during angiosperm evolution with multiple independent transfers to the nucleus. Plant Cell 2001, 13, 645–658. [Google Scholar] [CrossRef] [PubMed]
  46. Adams, K.L.; Qiu, Y.L.; Stoutemyer, M.; Palmer, J.D. Punctuated evolution of mitochondrial gene content: High and variable rates of mitochondrial gene loss and transfer to the nucleus during angiosperm evolution. Proc. Natl. Acad. Sci. USA 2002, 99, 9905–9912. [Google Scholar] [CrossRef] [PubMed]
  47. Palmer, J.D.; Zamir, D. Chloroplast DNA evolution and phylogenetic relationships in Lycopersicon. Proc. Natl. Acad. Sci. USA 1982, 79, 5006–5010. [Google Scholar] [CrossRef] [PubMed]
  48. Qiu, Y.L.; Lee, J.; Bernasconi-Quadroni, F.; Soltis, D.E.; Soltis, P.S.; Zanis, M.; Zimmer, E.A.; Chen, Z.; Savolainen, V.; Chase, M.W. The earliest angiosperms: Evidence from mitochondrial, plastid and nuclear genomes. Nature 1999, 402, 404–407. [Google Scholar] [CrossRef]
  49. Wickett, N.J.; Mirarab, S.; Nguyen, N.; Warnow, T.; Carpenter, E.; Matasci, N.; Ayyampalayam, S.; Barker, M.S.; Burleigh, J.G.; Gitzendanner, M.A.; et al. Phylotranscriptomic analysis of the origin and early diversification of land plants. Proc. Natl. Acad. Sci. USA 2014, 111, E4859–E4868. [Google Scholar] [CrossRef]
  50. Parks, M.; Cronn, R.; Liston, A. Increasing phylogenetic resolution at low taxonomic levels using massively parallel sequencing of chloroplast genomes. BMC Biol. 2009, 7, 84. [Google Scholar] [CrossRef]
  51. Shaw, J.; Shafer, H.L.; Leonard, O.R.; Kovach, M.J.; Schorr, M.; Morris, A.B. Chloroplast DNA sequence utility for the lowest phylogenetic and phylogeographic inferences in angiosperms: The tortoise and the hare IV. Am. J. Bot. 2014, 101, 1987–2004. [Google Scholar] [CrossRef]
  52. de Oliveira, J.L.; Morales, A.C.; Hurst, L.D.; Urrutia, A.O.; Thompson, C.R.L.; Wolf, J.B. Inferring adaptive codon preference to understand sources of selection shaping codon usage bias. Mol. Biol. Evol. 2021, 38, 3247–3266. [Google Scholar] [CrossRef]
  53. Yengkhom, S.; Uddin, A.; Chakraborty, S. Deciphering codon usage patterns and evolutionary forces in chloroplast genes of Camellia sinensis var. assamica and Camellia sinensis var. sinensis in comparison to Camellia pubicosta. J. Integr. Agric. 2019, 18, 2771–2785. [Google Scholar] [CrossRef]
  54. Shen, L.; Chen, S.; Liang, M.; Qu, S.; Feng, S.; Wang, D.; Wang, G. Comparative analysis of codon usage bias in chloroplast genomes of ten medicinal species of Rutaceae. BMC Plant Biol. 2024, 24, 424. [Google Scholar] [CrossRef]
  55. Tonti-Filippini, J.; Nevill, P.G.; Dixon, K.; Small, I. What can we do with 1000 plastid genomes? Plant J. 2017, 90, 808–818. [Google Scholar] [CrossRef]
  56. Smith, D.R. Mutation rates in plastid genomes: They are lower than you might think. Genome Biol. Evol. 2015, 7, 1227–1234. [Google Scholar] [CrossRef]
  57. Zhang, G.; Ma, H. Nuclear phylogenomics of angiosperms and insights into their relationships and evolution. J. Integr. Plant Biol. 2024, 66, 546–578. [Google Scholar] [CrossRef] [PubMed]
  58. Sebastin, R.; Kim, J.; Jo, I.H.; Yu, J.K.; Jang, W.; Han, S.; Park, H.S.; AlGarawi, A.M.; Hatamleh, A.A.; So, Y.S.; et al. Comparative chloroplast genome analyses of cultivated and wild Capsicum species shed light on evolution and phylogeny. BMC Plant Biol. 2024, 24, 797. [Google Scholar] [CrossRef] [PubMed]
  59. Bi, D.; Han, S.; Zhou, J.; Zhao, M.; Zhang, S.; Kan, X. Codon Usage Analyses Reveal the Evolutionary Patterns among Plastid Genes of Saxifragales at a Larger-Sampling Scale. Genes 2023, 14, 694. [Google Scholar] [CrossRef] [PubMed]
  60. Zhao, Y.; Yu, D.; Kuo, W.; Huang, J.; Guo, J.; Sun, M.; Hu, Y.; Soltis, D.E.; Soltis, P.S.; Ma, H.; et al. Nuclear phylogenomics provide evidence to clarify key morphological evolution and whole-genome duplication across rosids. J. Integr. Plant Biol. 2025; Epub ahead of printing. [Google Scholar] [CrossRef]
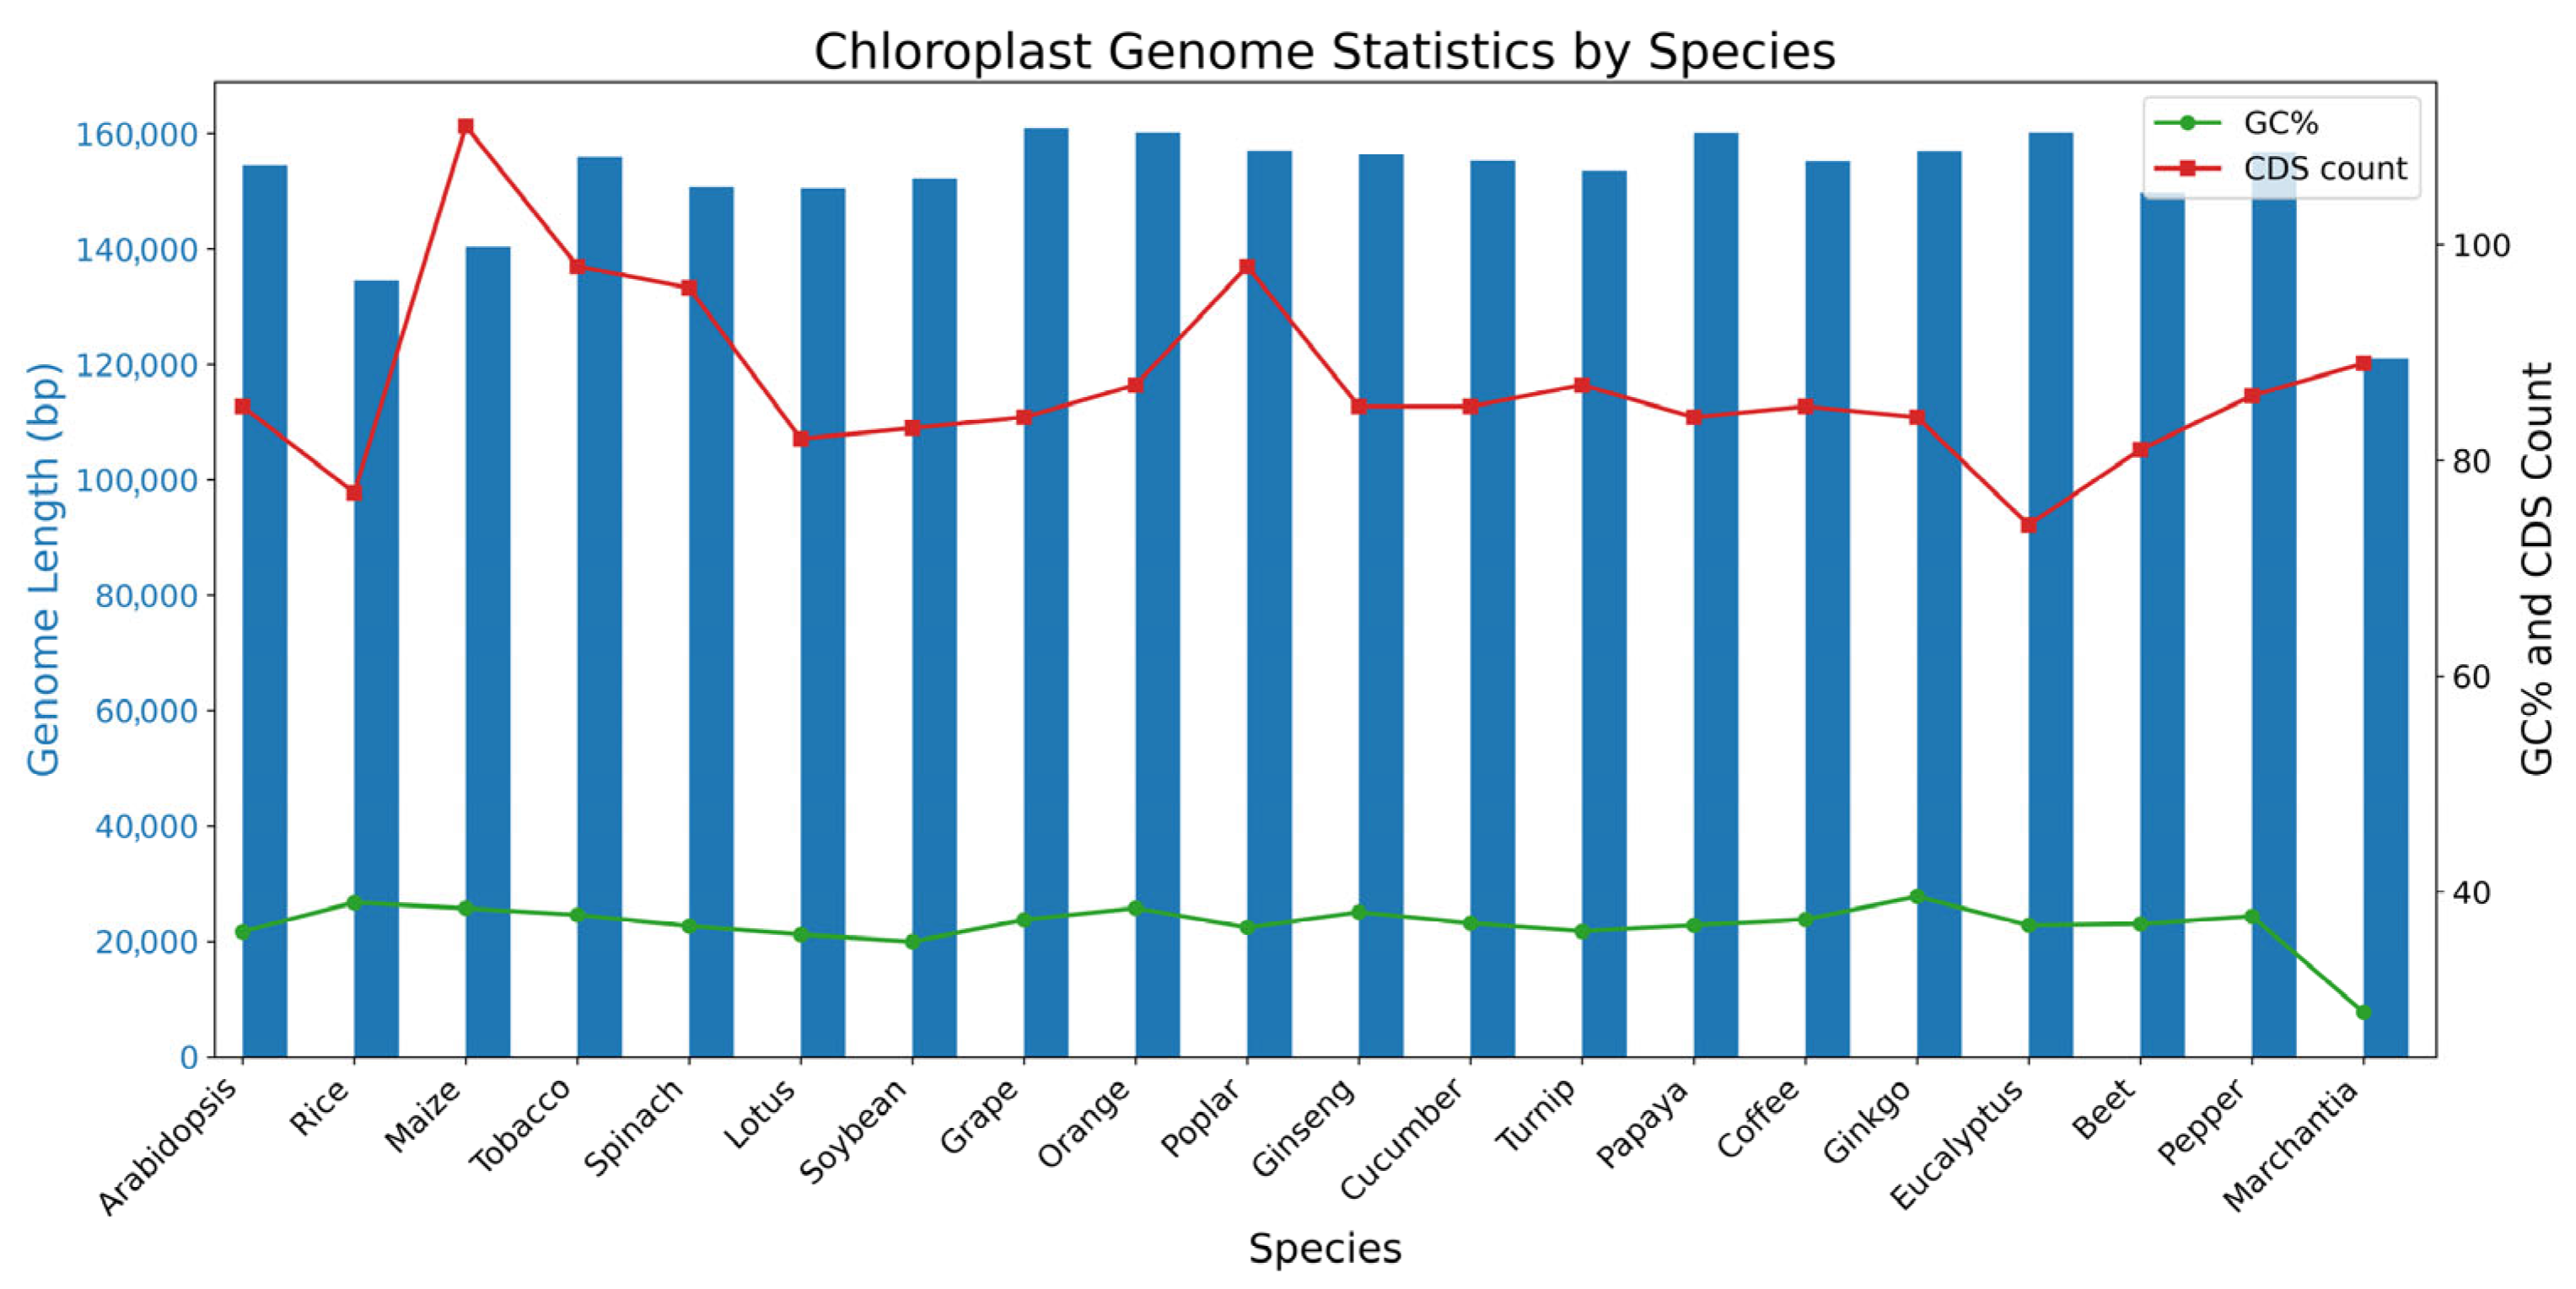
Figure 1. Chloroplast genome statistics across 20 plant species. Blue bars indicate total genome length (left y-axis); red squares show the number of predicted coding sequences (CDSs), and green circles indicate GC content (both on right y-axis). All genomes were retrieved from NCBI RefSeq using curated chloroplast accessions (see Table 1).
Ijpb 16 00105 g001
Figure 2. Neighbor-Joining phylogenetic trees inferred from 16 chloroplast barcoding genes. Each tree was rooted at the midpoint and constructed using pairwise sequence divergence across 20 land plant species, encompassing bryophytes, gymnosperms, monocots, and eudicots. Despite gene-specific topological variation, major clades consistently recapitulate established plant phylogenetic relationships. Branch lengths correspond to evolutionary distances inferred from sequence identity.
Ijpb 16 00105 g002
Figure 3. Barcoding gene presence/absence matrix across 20 plant species. A heatmap indicating the presence (1) or absence (0) of each gene in each species, illustrating lineage-specific patterns of gene loss.
Ijpb 16 00105 g003
Figure 4. Genome-wide pairwise chloroplast similarity heatmap (% identity) across 20 species. Heatmap values indicate percent identity between complete chloroplast genomes, revealing patterns of divergence among major plant lineages.
Ijpb 16 00105 g004
Figure 5. Classification of barcoding genes into core (present in all species analyzed) and accessory (absent in at least one species) based on raw presence/absence patterns across the dataset. A total of 13 genes were identified as core and 7 as accessory.
Ijpb 16 00105 g005
Figure 6. Heatmap showing codon usage frequency across 20 plant chloroplast genomes. Codon counts were normalized across species and genes. Warmer colors indicate higher usage frequencies. Overall codon usage was conserved, with subtle variation in specific taxa such as Marchantia polymorpha and Ginkgo biloba.
Ijpb 16 00105 g006
Table 1. Chloroplast genome statistics and botanical hierarchy of the 20 plant species analyzed in this study. The table includes species names, genus, phylum, class, total chloroplast genome length (base pairs), GC content percentage, and the number of annotated coding DNA sequences (CDSs) for each species.
SpeciesGenusClassAccession NumberGenome Length (bp)GC
Content (%)
Number of CDSs
Arabidopsis thalianaArabidopsisMagnoliopsidaNC_000932154,47836.385
Oryza sativa (Rice)OryzaLiliopsidaKT289404134,52539.077
Zea mays (Maize)ZeaLiliopsidaNC_001666140,38438.5111
Nicotiana tabacum (Tobacco)NicotianaMagnoliopsidaNC_001879155,94337.898
Spinacia oleracea (Spinach)SpinaciaMagnoliopsidaNC_002202150,72536.896
Lotus japonicus (Lotus)LotusMagnoliopsidaNC_002694150,51936.082
Glycine max (Soybean)GlycineMagnoliopsidaNC_007942152,21835.483
Vitis vinifera (Grape)VitisMagnoliopsidaNC_007957160,92837.484
Citrus sinensis (Orange)CitrusMagnoliopsidaNC_008334160,12938.587
Populus trichocarpa (Poplar)PopulusMagnoliopsidaNC_009143157,03336.798
Panax ginseng (Ginseng)PanaxMagnoliopsidaNC_006290156,31838.185
Cucumis sativus (Cucumber)CucumisMagnoliopsidaNC_007144155,29337.185
Brassica rapa (Turnip)BrassicaMagnoliopsidaNC_049891153,62136.387
Carica papaya (Papaya)CaricaMagnoliopsidaEU431223160,10036.984
Coffea arabica (Coffee)CoffeaMagnoliopsidaNC_008535155,18937.485
Ginkgo biloba (Ginkgo)GinkgoGinkgoopsidaNC_016986156,98839.684
Eucalyptus grandis (Eucalyptus)EucalyptusMagnoliopsidaNC_014570160,13736.974
Beta vulgaris (Beet)BetaMagnoliopsidaKR230391149,72237.081
Capsicum annuum (Pepper)CapsicumMagnoliopsidaNC_018552156,78137.786
Marchantia polymorpha (Mar.)MarchantiaMarchantiopsidaNC_001319121,02428.889
Disclaimer/Publisher’s Note: The statements, opinions and data contained in all publications are solely those of the individual author(s) and contributor(s) and not of MDPI and/or the editor(s). MDPI and/or the editor(s) disclaim responsibility for any injury to people or property resulting from any ideas, methods, instructions or products referred to in the content.