Abstract
Wheat is one of the major sources of protein worldwide. Its hexaploidy significantly complicates the identification of genes that may be crucial for improving wheat production to meet the challenges of an increased world population and climate change. Virus-induced gene silencing (VIGS) using Barley stripe mosaic virus (BSMV)-based constructs has proven to be a very useful tool in the analysis of gene function in the hexaploid plant, wheat. However, most published applications of this technique focus on phenotypes that can be observed in the leaves of wheat. A few studies have reported successful VIGS in the spikes of wheat, but this has proven to be more difficult than the seedling leaf assays. This study reports a time course analysis of the movement of BSMV from the site of inoculation into the meristematic region of wheat. It also describes how the photobleaching phenotype resulting from silencing phytoene desaturase (PDS), which is often used as a reporter for VIGS, does not indicate the full extent of where VIGS occurs, and this can mislead scientists as they design silencing studies. These findings provide guidance for more effective VIGS studies to determine the function of genes expressed in the spikes of wheat and may be important for wheat improvement.
1. Introduction
A conserved RNA-based defense mechanism is expressed by almost all eukaryotes [1,2]. Known by various names, including RNA-mediated gene silencing, RNA interference (RNAi), and post-transcriptional gene silencing, this system targets double-stranded RNA sequences for cleavage into small interfering RNAs (siRNAs). One strand of the siRNAs becomes incorporated into the protein, Argonaute, where it acts as a specificity determinate, and directs this complex to degrade any RNAs with a complementary sequence. This system is used for a range of regulatory purposes, but in plants, it is also an effective system for defense against viruses [3,4]. During the early stages of the discovery of RNA-mediated gene silencing it was realized that this could be exploited as a rapid tool for assessing plants’ gene functions. It was shown that fragments of a plant gene can be inserted into the viral genome, and as this engineered virus infects the plant cell, siRNAs will be formed that target the mRNA of the plant gene for degradation. This technique is now widely exploited in plant genetics and is referred to as virus-induced gene silencing (VIGS).
VIGS, using vectors derived from the Barley stripe mosaic virus, is becoming a very important tool for assessing gene function in cereal crops. It is proving particularly useful in wheat, which is an allohexaploid, which makes the application of conventional genetic approaches highly problematic. Additionally, wheat is extremely recalcitrant to transformation [5], so being able to accomplish gene silencing without generating a transgenic plant is highly advantageous. To date, most published wheat-VIGS studies have addressed phenotypes that can be observed in the leaves of seedlings, as BSMV readily infects seedlings and gene silencing is reliably established one week later in the newly emerging leaves [6]. However, as many of the most critical developmental and physiological events for wheat relate to flower and seed development, there is a great need for reliable protocols for establishing BSMV-VIGS in the spikes of wheat and barley. Our laboratory has particular interest in identifying genes with key functions in disease resistance pathways, which defend against pathogens that attack the spike of the developing wheat plant, and so it has been essential for us to adapt BSMV-VIGS protocols for silencing in this tissue.
Several studies have reported that BSMV-VIGS can occur in the spikes of wheat and that it can be observed in the next generation [7,8,9,10] (Gillespie et al., submitted). However, the ability to achieve a consistently high frequency of gene silencing in the spike is more difficult. All published reports of silencing in the spikes of wheat have initiated VIGS by either infecting the seedling or the flag leaf. Either strategy requires the virus to move at a much greater distance than is required in seedling VIGS studies.
Plant viruses move via the cell-to-cell communication network that has evolved to permit development and response to environmental changes [11]. It is now known that a wide range of molecules move through this network to provide water, nutrients, and critical signals and information throughout the plant. Movement is often conceptually divided into cell-to-cell movement and long distance or systemic movement. Cell-to-cell movement is accomplished by passage through plasmodesmata (PD), membranous channels that pass through cell walls and connect the cytoplasm of neighboring plant cells, and the direct selective transport of biomolecules [12]. Virus-encoded movement proteins (MPs) are known to facilitate this process in a variety of ways. Some MPs are able to increase the size exclusion limits of the PD as much as ten-fold [13], while others act to unfold viral RNAs to facilitate cell-to-cell movement [14]. The three movement proteins of BSMV, TBG1, TBG2, and TBG3 are encoded by the triple block of genes (TBG) located on the BSMV beta genomic RNA [15,16,17,18]. A mutational analysis of each movement protein demonstrated that all three are necessary for cell-to-cell movement [19].
Long distance viral movement occurs through the phloem network, which connects all parts of the plant. The transition from cell-to-cell movement to long distance movement occurs in the companion cells that control the entry of biomolecules into the sieve elements that form the phloem. Once biomolecules enter the phloem, they move passively at rates determined by the source–sink relationships within the plant [20,21].
Viruses may have different structural configurations as they move. Viruses differ in the requirements for their coat proteins (CPs) during movement and are classified on this basis. Type I viruses are able to move cell-to-cell without their CP, while CP is essential for type II viruses, and type III viruses must form viral particles for cell-to-cell movement [11]. In this regard, BSMV does not require its CP to move systemically; however, all experiments were performed here with a form of the virus that expresses CPs.
This study was undertaken to define the time course of the extensive viral movement that BSMV must undergo in experiments targeting the silencing of the wheat genes expressed in floral tissue. In this study, we first demonstrate that silencing can be achieved in wheat spikes, then data are presented describing the time lag between virus infection in the wheat flag leaf and the appearance of BSMV in the wheat floral meristematic region. Finally, the limitations of visual markers for VIGS are illustrated and discussed.
2. Materials and Methods
2.1. Plant Growth
Seeds of common wheat, Triticum aestivum, cv Bobwhite, were sown in 4-inch pots containing potting soil and placed under greenhouse conditions: 20 °C to 25 °C with supplemental light to provide day lengths equal to or greater than 16 h and watered as needed. Under these conditions it typically took 8 weeks for the plants to reach Feeke’s stage 9, in which the final leaf, also known as the flag leaf, had fully expanded [22]. Seventy-two plants were grown to Feeke’s stage 9, and the flag leaves of half were inoculated with BSMV constructs and the other half were treated with viral inoculation buffer only and are referred to as mock-inoculated.
2.2. BSMV-VIGS Procedure
The BSMV constructs, preparation of infectious in vitro transcripts, and rub-inoculation were performed as described in Scofield and Brandt (2012) [6].
2.3. Preparation of Wheat Total RNA
For RNA preparations, tissue from the floral meristem was pulverized to fine powder in liquid nitrogen using a mortar and pestle. Total RNA was isolated using 1 mL of TRIZOL reagent (Sigma-Aldrich, St. Louis, MO, USA) per sample according to the manufacturer’s recommendations. RNA was quantified by absorbance at 260 nm using a Nanodrop spectrophotometer (NanoDrop Product, Wilmington, DE, USA).
2.4. Quantitative Real-Time PCR
All RNA samples were digested with DNAse I prior to synthesizing cDNA, using the TURBO DNA-Free kit as recommended by the manufacturer (Ambion, Austin, TX, USA). First-strand cDNA was synthesized using the I-SCRIPT kit (Bio-Rad, Hercules, CA, USA), following the manufacturer’s protocol. Expression of the phytoene desaturase gene (PDS) was performed on RNA prepared from wheat leaves. The measurements were performed in a Stratagene MX3000P QRT-PCR (San Diego, CA, USA) machine using the I-TAQ SYBR reagent kit (Bio-Rad). Leaves from each treatment were pooled and total RNA was prepared as described above. QRT-PCR was performed on each RNA sample/primer combination. The amounts of RNA in each reaction were normalized using primers specific for glyceraldehyde 3-phosphate dehydrogenase (GAPDH). Primers to amplify the cDNA from PDS transcripts were as follows: PDS Forward TGTCTTTAGCGTGCAAG and PDS Reverse GATGATTTCGGTGTCACT. All primer sets were used at an annealing temperature of 60 °C. Each PCR reaction consisted of about 200 ng of cDNA, 5 pmol each of the forward and the reverse primers, 4 μL of H2O, and 10 μL of SYBR Green I reagent (Thermo Fisher, Waltham, MA, USA) in a total volume of 20 μL. The amplification profile used was as follows: 95 °C for 3 min followed by 35 cycles of 95 °C 30 s, annealing for 45 s at 60 °C, and extension at 72 °C for 45 s. Fluorescence measurement was performed at the end of each extension step of every PCR cycle to monitor the increase in the amount of the amplified product. Relative expression levels were calculated using the ΔΔCt method [23].
2.5. Agarose/Formaldehyde RNA Gel Blot Analysis
A 300 mL denaturing agarose gel was prepared using 3 gm agarose in 270 mL water. Following the melting of the agarose in water and cooling to 65 °C, 30 mL 10× MOPS buffer (0.4 M 3-[N-morpholino]propanesulfonic acid), 100 mM Sodium Acetate, 10 mM EDTA, and 60 mL 37% formaldehyde were added, swirled to mix completely, and poured into a casting tray. After the gel had solidified, it was placed into an electrophoresis tank and covered with 1× MOPS buffer and loaded with the RNA samples.
Then, 5 μg RNA was prepared to load into the gel by combining 1 volume of RNA into 3 volumes of denaturing buffer (500 μL deionized formamide, 170 μL 37% formaldehyde, and 100 μL 10× MOPS, which had been autoclaved, and 10 μL ethidium bromide). This does not keep and should be prepared fresh before each use. Following preparation, the samples were heated to 85 °C for 5 min, then briefly centrifuged and loaded into the gel. The RNA gel was photographed and then the RNA was transferred to a positively charged nylon membrane (GE healthcare Limited, Amersham Place, Little Chalfont, Buckinghamshire, UK).
2.6. Polyacrylamide siRNA Gel Blot Analysis
To prepare a 40 mL 15% acrylamide gel the following was used: 19.2 g urea, 15 mL acrylamide (Bio-rad 40% Acrylamide/Bis Solution (19:1), 4 mL 10× TBE (0.89 M Tris, 0.89 M boric acid, 0.02 M EDTA (IBI Scientific, Rochester, NY, USA)). The volume was brought to 40 mL with RNase free water ~6 mL.
After the urea was completely in solution, the following was added: 70 μL ammonium persulfate (30% solution made fresh) and 16 μL TEMED.
The 15 μg RNA samples were prepared by adding 2X invitrogen RNA gel running buffer. The samples were heated to 85 °C for 5 min and loaded into the gel.
After the run, the gel was rinsed with water, stained with ethidium bromide, photographed, and transferred to a positively charged nylon membrane using a semi-dry transfer cell (Bio Rad Trans-Blot® SD, Hercules, CA, USA).
2.7. Preparation of Uniformly Labeled Radioactive DNA Probes
Radio-labeled DNA probes were prepared for detection of viral-derived small RNAs and to provide size standards on northern blots. The 5S RNA probe was generated from a cloned PCR product. The wheat 5S RNA was amplified for Bobwhite cDNA using the primes: 5S Forward: 5′-atgcgatcataccagcactaaag-3′, 5S Reverse: 5′-gggaatgcaacacgaggactt-3′. This sequence was cloned into pGEMTEasy (Promega, Madison, WI, USA) and could be released by NotI digestion. The BSMV γa probe was synthesized from 770 bp NruI-BglII fragment which was gel purified from plasmid pSL038-1 [24]. To generate the probes, 25 ng of each gel-purified fragment was used as the DNA template in a reaction using the DECAprime™ II Random Priming DNA Labeling Kit and following the manufacturer’s protocol. After probe preparation, the labeled sample was heated to 98 °C for 5 min and then added to the membranes and hybridized using PerfectHyb™ Plus hybridization buffer (Sigma-Aldrich, Inc., St. Louis, MO, USA) overnight at either 65 °C or 37 °C depending on RNA size.
2.8. Disclaimer
The use of any trademarked products does not constitute endorsement by the USDA-ARS.
3. Results
3.1. BSMV-VIGS Can Be Achieved in the Spikes of Wheat
To test if BSMV-VIGS could be achieved in the spikes of wheat (Bobwhite), a systematic study was undertaken in which in vitro transcribed RNAs from BSMV constructs that target the wheat phytoene desaturase (PDS) genes for silencing were used to infect wheat plants at different stages of development. PDS has an essential function in the production of carotenoid pigments, which protect chlorophyll from photolysis. The resulting photobleaching phenotype is often used as a reporter to indicate where gene silencing is occurring in VIGS experiments.
The typical protocol for initiating BSMV-VIGS in seedlings is to rub-inoculate in vitro transcripts onto the first or second true leaf of young wheat plants. This results in the appearance of regions of photobleaching in the third and fourth leaves of wheat; however, these almost always fail to appear in fifth or later leaves. The inoculation of leaves above the third leaf results in the appearance of photobleaching in higher leaves. Sometimes, photobleaching also appears in tillers that form as the wheat plant develops. It is only when the newly emerged flag leaf was rub-inoculated that photobleaching was observed in the spikes of wheat plants [22].
Figure 1 shows a wheat spike from a Bobwhite plant infected with a control BSMV construct that carried no plant gene fragment, BSMV:00, compared with four spikes that show extensive photobleaching. Figure 2 presents quantitative real-time PCR data confirming that PDS expression is down-regulated in comparison with its expression in wheat spikes infected with BSMV:00. To conduct this analysis, total RNA was prepared from pooled awn tissue that came from BSMV:PDS-infected plants displaying photobleaching and those infected with BSMV:00. As can be seen, the average PDS expression is reduced by 70% compared with plants infected with the control virus.

Figure 1.
Photobleaching in the spikes of wheat resulting from VIGS of PDS. The first wheat plant (Bobwhite) was infected with BSMV:00 while the remaining four plants were infected with BSMV:PDS and display significant areas of photobleaching.
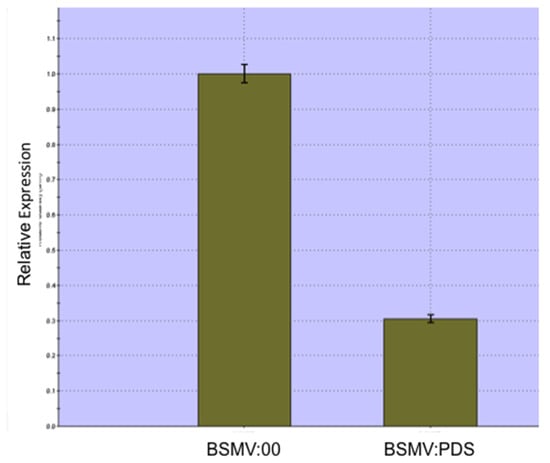
Figure 2.
Comparison of the expression of PDS in the awns of wheat infected with BSMV:00 or BSMV:PDS. PDS expression is significantly down-regulated in the awns of photobleached spikes.
3.2. The Limitations of Phytoene Desaturase as a Reporter for VIGS in Wheat
As mentioned previously, wheat seedlings inoculated on the first or second true leaf with BSMV:PDS will develop photobleached regions on the third and fourth leaves, but rarely is it evident in later leaves. To investigate why this is the case, the expression of PDS in the first five leaves of wheat was measured after infection with BSMV:PDS and compared with the expression of the same leaves from plants infected with BSMV:00. This analysis is presented in Figure 3. It is clear from this analysis that the expression of PDS is knocked down by at least 65% in all the leaves tested in the BSMV:PDS-infected plants, yet photobleaching was not observed in the fourth of fifth leaves of these plants. These data clearly indicate that PDS silencing can occur without giving rise to photobleaching, and so this phenotype is not a reliable reporter for the full extent of PDS silencing.

Figure 3.
(A) Quantitative RT-PCR analysis of PDS expression in different leaves of wheat seedlings after infecting the first true leaf with BSMV:PDS. (B) Photographs of leaves 2–5. Although PDS expression is significantly down-regulated in all leaves tested, photobleaching was only observed in the second and third leaves.
3.3. The Time Course of Virus Movement and Establishment of VIGS in Wheat Spikes
Given the variation observed in the initial efforts to obtain silencing in the spikes of wheat, a more detailed study of this process seemed warranted. Due to the realization that the appearance of a PDS photobleaching phenotype is not an absolute indicator of the occurrence of gene silencing, a different approach was taken to define the movement of BSMV into the wheat spike and initiate gene silencing in this tissue. Rather than monitoring the appearance of photobleaching in wheat spikes after inoculation, we chose to monitor the movement of the virus by detecting viral RNA and the initiation of silencing by probing for siRNAs derived from the viral genome.
The flag leaves of wheat plants of the variety “Bobwhite”, grown to Feeke’s stage 9.0 [22,25], were inoculated with BSMV:00. At this developmental stage, the apical meristem has already made the transition to being a floral meristem and has physically risen to the same level as the flag leaf. This construct was used rather than BSMV:PDS because previous work has shown that it gives rise to more abundant virus-derived siRNAs (Scofield lab, unpublished observation).
Floral meristematic tissue was collected from three replicate plants on each day after viral infection for a period of eleven days. Total RNA was prepared individually from each replicate sample. The samples were then electrophoresed on 15% polyacrylamide gels that were blotted and hybridized with a uniformly labeled radioactive probed corresponding to a sequence from the BSMV γa open reading frame. Autoradiograms from this analysis are shown in Figure 4A,B. Replicate samples were analyzed on this gel that had been isolated from the floral meristems of plants 4, 5, 9, and 12 days after infection with BSMV:00. Although this gel is optimized for the resolution of siRNA, Figure 4A, it also displays hybridization to the upper portion of this gel where viral RNAs and intermediate degradation products would migrate. It can be seen that no signal, either siRNA or viral genomic RNA, was detected at day 4, while strong signals appeared for both RNA species observed in all replicates at day 5 and all later timepoints. This is interpreted as indicating that BSMV requires 5 days to move systemically from the flag leaf and into the wheat floral meristem. It also indicates that genomic RNA moves systemically as quickly as siRNAs. However, it is likely that the vast majority of the siRNAs detected are produced from the dicing of the genomic RNA that has entered the floral tissue. It then persists throughout the remainder of the 11-day sampling period, although the abundance of viral RNA begins to decrease at day 11 (see also Figure 5). Figure 4B depicts the hybridization of the virus-derived siRNAs. No signal is evident in the mock-inoculated or day-4-infected samples; however, strong signals corresponding to 22 bases in size appear in the day-5 and all the later samples. This indicates that, at 5 days after infection, BSMV viral RNA is beginning to be diced into siRNAs, marking the onset of VIGS.
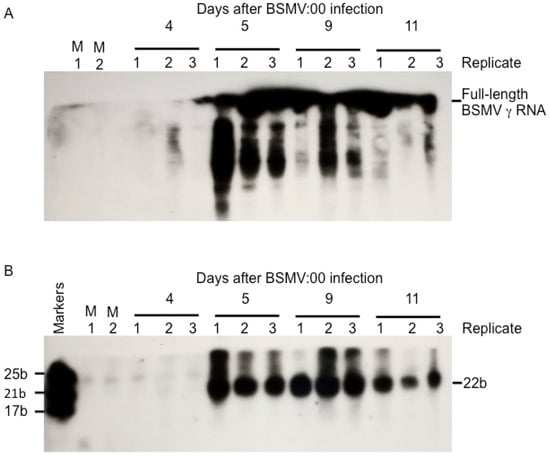
Figure 4.
Time course analysis of the accumulation of BSMV γ RNAs and siRNAs in wheat floral meristems. Total RNAs of BSMV:00 infected wheat meristems were separated on a 15% polyacrylamide gel, transferred to nylon membranes and probed with a radiolabeled fragment from the γa gene of BSMV. The RNAs were prepared from meristematic tissue isolated from 2 mock infected plants (M1 and M2) and virus-infected plants sampled at 4, 5, 9, and 12 days after infection. Three replicate plants were tested at each time point. Viral RNA and siRNAs were first detected in the floral meristem at 5 days after infection. (A) Autoradiogram on the upper segment of this blot. (B) Autoradiogram of the lower portion. RNA size markers of 17, 21, and 25 bases were loaded in the first lane (Marker).

Figure 5.
Time course analysis of the accumulation of full-length BSMV γ RNAs in wheat floral meristems. Total RNAs of BSMV:00-infected wheat meristems were separated on a 1% agarose/formaldehyde gel, transferred to nylon membrane, and probed with a radiolabeled fragment from the γa gene of BSMV. The RNAs shown here were prepared from meristematic tissue isolated from 2 mock-infected plants (M1 and M2) and virus-infected plants sampled at 4, 5, 9, and 12 days after infection. Three replicate plants were tested at each time point. Full-length BSMV γ genomic RNA began to decrease in abundance at 8 days after infection.
Figure 5 shows the hybridization of the same γa probe to total RNAs separated on a 1% agarose/formaldehyde gel. This gel effectively separates the full-length viral RNAs and the hybridization to the 2.83 kb BSMV γ RNA is obvious. Here, the samples span 5 dpi to 12 dpi, so the virus has already reached the floral meristem in the first samples. However, it is clear on this autoradiogram that between days 8 and 9, the accumulation of full-length BSMV γ RNA begins to decrease and degraded RNA begins to appear. This suggests that the silencing process begins to overtake the replication of the virus at later time points.
4. Discussion
Many of the most critical problems for improving wheat productivity relate to characteristics and traits expressed during flowering and seed development. Among the significant traits where VIGS has been employed are disease resistance [25] and seed quality [26]. While gene editing methods are emerging as powerful new tools for the analysis of gene function, VIGS provides unique advantages for researchers. It provides the ability to knock down gene expression without the need to create transgenic plants, which are necessary for gene editing or for the use of transgenic silencing constructs. This is a crucial advantage as wheat remains highly recalcitrant to transformation [5]. However, to utilize BSMV-VIGS to assess the functions of gene-controlling traits expressed in the spikes, improvements need to be made to the protocols for silencing in wheat spikes.
This study was undertaken to provide a better understanding of the time course of BSMV movement that must occur when this functional genomics tool is used to silence genes expressed in wheat spikes. Our data define the time interval necessary for BSMV to replicate in the initially infected flag leaf cells, engage in cell-to-cell movement, enter the vascular system for long distance systemic movement, unload from the vascular tissue, and initiate infection in the cells of the developing spike. Under the greenhouse conditions test in this study, this interval was approximately 5 days. It is likely that other growth conditions and genotypes could affect this timing to some degree, but this information should prove very valuable to those wishing to adopt BSMV-VIGS for their own research questions.
Data are also presented that demonstrate that the commonly used reporter phenotype for VIGS photobleaching, resulting from PDS silencing, has significant limitations. In seedlings inoculated with BSMV:PDS, silencing was shown to occur from the second to the fifth leaves; however, photobleaching was only observed in the second and third leaves. Photobleaching arises because silencing the PDS gene prevents the production of carotenoid pigments and chlorophyll consequently breaks down. However, these pigments are very stable, and once made, protect chlorophyll even if the synthesis of PDS becomes silenced later. Therefore, there is a significant temporal aspect to the creation of photobleached areas. VIGS of PDS is only able to generate photobleaching in the cells that become silenced prior to significant carotenoid biosynthesis. If these pigments are synthesized prior to the establishment of VIGS, the cell will not become photobleached. Very strong support for this model was generated by Guo et al. [27] in experiments utilizing Arabidopsis, which contained a dexamethasone-inducible PDS RNAi hairpin transgene. They observed that if the RNAi transgene was induced with dexamethasone, only the newly formed tissue exhibited photobleaching. Cells which had developed prior to the induction of PDS silencing remained green. This finding is significant because researchers working with various VIGS systems often use the areas where photobleaching is observed as defining the zone where gene silencing is occurring and guide the design of their VIGS experiment. Here, it is shown that the areas of photobleaching do not provide a full indication of where gene silencing is actually occurring.
In conclusion, this short study provides guidance to researchers wishing to utilize BSMV-VIGS to silence genes expressed in the spikes of wheat. Additionally, it identifies a significant temporal limitation of the PDS visual reporter for VIGS that should be considered as silencing studies are undertaken.
Author Contributions
Conceptualization, S.R.S.; methodology, A.G. and A.S.B.; formal analysis, S.R.S., A.G. and A.S.B.; writing—original draft preparation, S.R.S.; writing—review and editing, A.G. and A.S.B. All authors have read and agreed to the published version of the manuscript.
Funding
This project was supported by the USDA-ARS Project #5020-21220-014.
Institutional Review Board Statement
Not applicable.
Informed Consent Statement
Not applicable.
Data Availability Statement
All data is presented in this article.
Acknowledgments
The authors wish to thank the members of the Scofield laboratory for their assistance throughout this project.
Conflicts of Interest
The USDA is an equal opportunity employer.
References
- Abosalha, A.K.; Ahmad, W.; Boyajian, J.; Islam, P.; Ghebretatios, M.; Schaly, S.; Thareja, R.; Arora, K.; Prakash, S. A comprehensive update of siRNA delivery design strategies for targeted and effective gene silencing in gene therapy and other applications. Expert Opin. Drug Discov. 2023, 18, 149–161. [Google Scholar] [CrossRef] [PubMed]
- Meister, G.; Tuschl, T. Mechanisms of gene silencing by double-stranded RNA. Nature 2004, 431, 343–349. [Google Scholar] [CrossRef] [PubMed]
- Baulcombe, D. RNA silencing in plants. Nature 2004, 431, 356–363. [Google Scholar] [CrossRef] [PubMed]
- Baulcombe, D.C. Fast forward genetics based on virus-induced gene silencing. Curr. Opin. Plant Biol. 1999, 2, 109–113. [Google Scholar] [CrossRef] [PubMed]
- Wang, K.; Riaz, B.; Ye, X. Wheat genome editing expedited by efficient transformation techniques: Progress and perspectives. Crop J. 2018, 6, 22–31. [Google Scholar] [CrossRef]
- Scofield, S.R.; Brandt, A.S. Virus-induced gene silencing in hexaploid wheat using barley stripe mosaic virus vectors. Methods Mol. Biol. 2012, 894, 93–112. [Google Scholar] [PubMed]
- Ma, M.; Yan, Y.; Huang, L.; Chen, M.; Zhao, H. Virus-induced gene-silencing in wheat spikes and grains and its application in functional analysis of HMW-GS-encoding genes. BMC Plant Biol. 2012, 12, 141. [Google Scholar] [CrossRef]
- Bennypaul, H.S.; Mutti, J.S.; Rustgi, S.; Kumar, N.; Okubara, P.A.; Gill, K.S. Virus-induced gene silencing (VIGS) of gene expressed in root, leaf, and meiotic tissues of wheat. Funct. Integr. Genom. 2011, 12, 143–156. [Google Scholar] [CrossRef]
- Lee, W.S.; Hammond-Kosak, K.E.; Kanyuka, K. Barley stripe mosaic virus-mediated tools for investigating gene function in cereal plants and their pathogens: VIGS, HIGS and VOX. Plant Physiol. 2012, 160, 582–590. [Google Scholar] [CrossRef]
- Bruun-Rasmussen, M.; Madsen, C.T.; Jessing, S.; Albrechtsen, M. Stability of Barley stripe mosaic virus-induced gene silencing in barley. Mol. Plant Microbe Interact. 2007, 20, 1323–1331. [Google Scholar] [CrossRef]
- Kehr, J.; Buhtz, A. Long distance transport and movementof RNA through the phloem. J. Exp. Bot. 2007, 59, 85–92. [Google Scholar] [CrossRef] [PubMed]
- Ruiz-Medrano, R.; Xoconostle-Cazares, B.; Lucas, W.J. The plasmodesmatal transport pathway for homeotic proteins, silencing signals and viruses. Curr. Opin. Plant Biol. 2004, 7, 641–650. [Google Scholar] [CrossRef] [PubMed]
- Ding, B.; Haudenshield, J.S.; Hull, R.J.; Wolf, S.; Beachy, R.N.; Lucas, W.J. Secondary plasmodesmata are specific sites of localization of the tobacco mosaic virus movement protein in transgenic tobacco plants. Plant Cell 1992, 4, 915–928. [Google Scholar] [PubMed]
- Citovsky, V.; Zambryski, P. How do plant virus nucleic viruses move through intercellular connections? Bioessays 1991, 13, 373–379. [Google Scholar] [CrossRef] [PubMed]
- Zhou, H.; Jackson, A.O. Expression of the barley stripe mosaic virus RNA beta “triple gene block”. Virology 1996, 216, 367–379. [Google Scholar] [CrossRef] [PubMed]
- Petty, I.T.; French, R.; Jones, R.W.; Jackson, A.O. Identification of barley stripe mosaic virus genes involved in viral RNA replication and systemic movement. EMBO J. 1990, 9, 3453–3457. [Google Scholar] [CrossRef] [PubMed]
- Lim, H.S.; Bragg, J.N.; Ganesan, U.; Ruzin, S.; Schichnes, D.; Lee, M.Y.; Vaira, A.M.; Ryu, K.H.; Hammond, J.; Jackson, A.O. Subcellular localization of the barley stripe mosaic virus triple gene block proteins. J. Virol. 2009, 83, 9432–9448. [Google Scholar] [CrossRef]
- Lim, H.S.; Bragg, J.N.; Ganesan, U.; Lawrence, D.M.; Yu, J.; Isogai, M.; Hammond, J.; Jackson, A.O. Triple gene block protein interactions involved in movement of Barley stripe mosaic virus. J. Virol. 2008, 82, 4991–5006. [Google Scholar] [CrossRef]
- Lawrence, D.M.; Jackson, A.O. Requirements for cell-to-cell movement of Barley stripe mosaic virus in monocot and dicot hosts. Mol. Plant Pathol. 2001, 2, 65–75. [Google Scholar] [CrossRef]
- Schneider, I.R. Introduction, translocation and distribution of viruses in plants. Adv. Virus Res. 1965, 11, 163–221. [Google Scholar]
- Santa Cruz, S. Perspective: Phloem transport of viruses and macromolecules—What goes in must come out. Trends Microbiol. 1999, 7, 237–241. [Google Scholar] [CrossRef] [PubMed]
- Feekes, W. De Tarwe en haar milieu. Vers. XVII Tech. Tarwe Comm. Gron. 1941, 560–561. [Google Scholar]
- Bustin, S.A. Real-time, fluorescence-based quantitative PCR: A snapshot of current procedures and preferences. Expert. Rev. Mol. Diagn. 2005, 5, 493–498. [Google Scholar] [CrossRef] [PubMed]
- Large, E.C. Growth stage in cereals Illustration of the Feekes scale. Plant Pathol. 1954, 3, 128–129. [Google Scholar] [CrossRef]
- Scofield, S.R.; Huang, L.; Brandt, A.S.; Gill, B.S. Development of a virus-induced gene-silencing system for hexaploid wheat and its use in functional analysis of the Lr21-mediated leaf rust resistance pathway. Plant Physiol. 2005, 138, 2165–2173. [Google Scholar] [CrossRef] [PubMed]
- Liu, G.; Wu, Y.; Xu, M.; Gao, T.; Wang, P.; Wang, L.; Guo, T.; Kang, G. Virus-Induced Gene Silencing Identifies an Important Role of the TaRSR1 Transcription Factor in Starch Synthesis in Bread Wheat. Int. J. Mol. Sci. 2016, 17, 1557. [Google Scholar] [CrossRef] [PubMed]
- Guo, H.S.; Fei, J.F.; Xie, Q.; Chua, N.H. A chemical-regulated inducible RNAi system in plants. Plant J. 2003, 34, 383–392. [Google Scholar] [CrossRef]
Disclaimer/Publisher’s Note: The statements, opinions and data contained in all publications are solely those of the individual author(s) and contributor(s) and not of MDPI and/or the editor(s). MDPI and/or the editor(s) disclaim responsibility for any injury to people or property resulting from any ideas, methods, instructions or products referred to in the content. |
© 2024 by the authors. Licensee MDPI, Basel, Switzerland. This article is an open access article distributed under the terms and conditions of the Creative Commons Attribution (CC BY) license (https://creativecommons.org/licenses/by/4.0/).