Abstract
True morels (Morchella spp., Morchellaceae, Ascomycota) are a rare and highly valuable edible fungus. As the morel cultivation scale has expanded, obstacles to continuous cropping have come to the fore. This study investigates the specific biological mechanisms that may hinder the continuous cropping of Morchella by means of microbiome and metabolome analysis of the soil. Using amplicon sequencing-based microbiome analysis, 5288 bacterial operational taxonomic units (OTUs) and 1847 fungal OTUs were identified. Bacterial genera such as Arthrobacter, Tychonema, Rhodanobacter, Luteimonas, and Streptomyces, along with pathogenic fungi, likely play specific roles in hindering continuous cropping of Morchella. Metabolomic analysis revealed 368 metabolites, including lipids and lipid-like molecules, organic acids and derivatives, benzene-containing compounds, and heterocyclic compounds. Eighteen metabolites showed significant differences between Morchella continuous cropping and control soil, including toxic compounds such as 2,4,5-Trichloro-6-Hydroxybenzene-1,3-Dicarbonitrile, 2,4-Dichloro-6-nitrophenol, and Aflatoxin B2. These results indicate that alterations in soil microbial structure and toxic metabolites secreted by Morchella collectively contribute to the hindrance of continuous cropping.
1. Introduction
Morchella has gained increasing popularity due to its unique flavor and rich nutritional value. It is abundant in amino acids, polysaccharides, trace elements, and bioactive compounds and also exhibits anti-fatigue, antioxidant, antibacterial, antitumor, and immune-regulating properties [1,2,3]. Although the global commercial demand for morel continues to rise, wild harvests remain extremely limited. Despite over 130 years of domestication and cultivation history, significant breakthroughs in morel cultivation in China were not achieved until 2012. This led to a rapid expansion of cultivation areas to meet global demand [4,5,6].
Currently, several Morchella species can be artificially cultivated. However, the primary cultivar remains the high-yielding and resilient Morchella sextelata [1,7]. The cultivation method involves sowing spores directly into the soil and relying on exogenous nutrient bags for growth and development. This soil-covering system has become increasingly intensive and has begun to resemble other agricultural crops in terms of the emergence of continuous cropping obstacles. As the duration of consecutive planting increases and the scale of cultivation expands, the issue of impediments to continuous cropping has become more pronounced [8,9,10].
The primary factors that impede the continuous cropping of Morchella are alterations in soil microbial community structure, deterioration of soil physicochemical properties, and accumulation of autotoxic substances [9,10]. Previous studies have shown that a positive correlation between morel yield and soil microbial diversity and evenness. In nonfruiting soils, fungal communities were dominated by Acremonium or Mortierella, suggesting an essential link between morel fruiting body formation and soil microecology. Actinomycetes and other microbial groups in the substrate may also restrict the overproliferation of nitrogen-fixing microorganisms (e.g., cyanobacteria) during the fruiting stage in which accumulating lipids support fruiting body development [11]. In other work, Pseudomonas constituted up to 25.30% of the dominant bacterial community in the soil during the primordium differentiation stage [12], and a study by Zhang et al. revealed that continuous cropping stimulates saprophytic fungal activity that leads to significant nutrient accumulation in the soil. This inhibits primordium formation and ultimately causes a sharp decline in morel yield, indicating a dynamic interplay between beneficial and pathogenic fungal taxa in the soil’s microbial community [13]. Furthermore, Yu et al. identified key bacterial taxa involved in soil microbial genetic diversity, including nitrogen-fixing and nitrifying genera such as Arthrobacter, Bradyrhizobium, Devosia, Pseudarthrobacter, Pseudomonas and Nitrospira in high-yield soils [5]. Comparative analysis of soils used for Morchella sextelata cultivation over 0, 1, and 2 years has demonstrated that continuous cropping acidifies soil, increases pathogenic fungal populations, and reduces yield [14].
To investigate the key microorganisms and metabolites associated with continuous cropping obstacles for Morchella, we analyzed soils from noncontinuous and 1-year continuous cropping systems. Microbial community changes were examined via microbiome analysis to identify critical microbial taxa, and metabolome profiling was employed to detect differential metabolites. We expect our results to enhance the understanding of how continuous cropping impacts soil ecosystems, provide a theoretical basis for elucidating the mechanisms that underpin the obstacles to the continuous cropping of Morchella, and help to identify effective solutions to improve cultivation productivity in the future.
2. Materials and Methods
2.1. Experimental Materials
2.1.1. Strains and Cultivation
Test strain: Morchella sextelata YMe151, preserved at the Edible Fungi Industry Technology Innovation Laboratory of Yunnan Academy of Agricultural Sciences.
Continuous cropping cultivation: Using the conventional cultivation method of morel mushrooms. Cultivation was conducted in a demonstration greenhouse at the Azizuo Edible Fungi Base. Soil with no prior morel cultivation served as the control (dNC), and soil with one year of continuous morel cultivation was the treatment specimen (dCC). Uniformly prepared spawn was broadcast-seeded onto soil beds. Approximately 7 days post-sowing, nutrient bags were placed when white conidia appeared on the soil surface. Soil temperature was maintained at 6–20 °C, soil moisture at 20–28%, and air relative humidity at 60–80%.
2.1.2. Soil Sample Collection
All soil samples were collected during the morel harvest period in February, 2023. dNC and dCC groups each have 6 replicates, totaling 12 samples. Each sample was sampled using the five-point sampling method, surface soil was removed, and soils from a depth of 3 cm within a 5 cm radius were collected to form 200 g composite samples. All samples were stored at 4 °C for freshness and processed within 24 h. Due to sequencing requirements, each group of 6 duplicate samples was used for metabolomics sequencing, and 3 duplicate samples were randomly selected from each group for microbiome sequencing.
2.2. Experimental Methods
2.2.1. Analysis of Soil Physicochemical Properties
Using methods similar to Yao et al. [15], the air dried and sieved soil samples were sent to Yunnan Tongchuan Agricultural Analysis and Testing Technology Co., Ltd. (Kunming, China). for the determination of pH, organic matter, total nitrogen, available phosphorus, available potassium, total porosity, and moisture. Soil pH was measured using a calibrated pH meter INESA PHS-3E in a 1:2.5 soil/water suspension. The organic matter (OM) in the soil samples was measured using the chromic acid titration method [16]. The hydrolyzable nitrogen (N), the available phosphorus (P), and the potassium (K) were measured using the Alkaline solution diffusion method, UV—colorimetric analysis and flame atomic absorption spectrometry (FAAS), respectively [17,18,19].
2.2.2. High-Throughput Illumina Sequencing of Soil Microbes
Genomic DNA was extracted from soil samples using the E.Z.N.A.® soil DNA Kit (Omega Bio-tek, Norcross, GA, USA) according to manufacturer’s instructions and stored at −80°C. Polymerase Chain Reaction (PCR) amplification of microbial DNA was performed using barcode-tagged primers: 338F(5′-ACTCCTACGGGAGGCAGCAG-3′)/806R (5′-GGACTACHVGGGTWTCTAAT-3′) for the 16 S V3–V4 region and ITS1F(5′-CTTGGTCATTTAGAGGAAGTAA-3)/ITS2R (5′-GCTGCGTTCTTCATCGATGC-3′) for the ITS1 region. The PCR mixture (20 μL) consisted of 4 μL of 5 × FastPfu buffer, 2 μL of 2.5 mM dNTPs, 0.8 μL of forward primer (5 μM), 0.8 μL of reverse primer (5 μM), 0.4 μL of FastPfu DNA Polymerase, 10 ng of template DNA and DNase-free water. The thermal cycling program included an initial denaturation at 94 °C for 5 min; 26 cycles of 94 °C for 30 s, 56 °C for 30 s, and 72 °C for 20 s; followed by a final extension at 72 °C for 5 min. PCR products were evaluated by electrophoresis, purified using the Qubit dsDNA Assay Kit (Life Technologies, Waltham, MA USA) with magnetic beads, and subjected to a second round of PCR amplification. After re-purification and quantification via Qubit, equal amounts of PCR products were pooled and sequenced on the Illumina MiSeq platform by Shanghai Majorbio Bio-pharm Technology Co., Ltd. (Shanghai, China).
2.2.3. Soil LC-MS Untargeted Metabolomics Analysis
Samples of 100 mg soil were added to a 2 mL centrifuge tube and a 6 mm diameter grinding bead was added. A total of 800 μL of extraction solution (methanol:water = 4:1 (v:v) containing four internal standards (0.02 mg/mL L-2-chlorophenylalanine, etc.) was used for metabolite extraction. Samples were ground by the Wonbio-96c (Shanghai wanbo biotechnology Co., Ltd., Shanghai, China) frozen tissue grinder for 6 min (−10 °C, 50 Hz), followed by low-temperature ultrasonic extraction for 30 min (5 °C, 40 kHz). The samples were left at −20 °C for 30 min, centrifuged for 15 min (4 °C, 13,000× g), and the supernatant was transferred to the injection vial for LC-MS/MS analysis. Ultra-high-performance liquid chromatography coupled with Fourier transform mass spectrometry (UHPLC-Q Exactive HF-X system) was employed for analysis at Majorbio Bio-Pharm Technology Co., Ltd. (Shanghai, China). Chromatographic separation utilized an ACQUITY UPLC HSS T3 column (100 mm × 2.1 mm i.d., 1.8 µm; Waters, Milford, CT, USA) in which the mobile phase consisted of the following: Phase A: 95% water and 5% acetonitrile (containing 0.1% formic acid); Phase B: 47.5% acetonitrile, 47.5% isopropanol, and 5% water (containing 0.1% formic acid). The injection volume was 3 μL, and the column temperature was maintained at 40 °C. Metabolites were ionized via electrospray ionization (ESI), with mass spectra acquired in both positive and negative ion modes. Quality control (QC) samples prepared by pooling equal-volume aliquots from all extracts were analyzed to evaluate system stability. Chromatographically separated components were continuously introduced into the mass spectrometer for data acquisition.
2.3. Statistical Analysis
We used Fastp [20] (https://github.com/OpenGene/fastp (accessed on 1 October 2023), Version 0.19.6) for quality control of double ended raw sequencing sequences and FLASH [21] (https://ccb.jhu.edu/software/FLASH/, Version 1.2.11) for splicing. Using UPARSE v11 [22,23] (http://drive5.com/uparse/) software, perform OUT (operational taxonomic unit) clustering on the quality control concatenated sequence based on 97% similarity and remove chimeras. Using RDP classifier [24] (https://sourceforge.net/projects/rdp-classifier/, Version 2.11, accessed on 8 July 2025) perform OTU species taxonomic annotation on the Silva 16S rRNA gene database (version 138) with a confidence threshold of 70%. The ITS data were compared against the UNITE database. Using Mothur (version v.1.30.2) [25] software (https://mothur.org/wiki/calculators/, accessed on 8 July 2025) calculate the Chao 1, Shannon, and other indices of Alpha diversity and use Wilxocon rank sum test to analyze the inter group differences in Alpha diversity. PCoA (principal co-ordinates analysis) based on the unweighted unifrac distance algorithm is used to test the similarity of microbial community structure between samples, and PERMANOVA non parametric test is used to analyze whether the differences in microbial community structure between sample groups are significant. LEfSe (Linear discriminant analysis effect size) analysis [26] (http://huttenhower.sph.harvard.edu/LEfSe, accessed on 8 July 2025) (LDA > 3, p < 0.05) was used to determine bacterial groups with significant differences in genus level abundance between different groups. Statistically significant (p < 0.05) sparCC correlation (>0.1 or <0.1) was used to construct the network. Gephi−0.9.6 software visualizes networks. Zi-Pi analysis identifies the species that play a central role in the network.
Metabolomics analysis: Raw metabolomics data were processed using Progenesis QI v3.0 software (Waters Corporation, Milford, CT, USA) for peak extraction, alignment, and identification, which ultimately yielded a data matrix that contained retention time, peak area, mass-to-charge ratio, and identification information. These data underwent feature peak library identification in which MS and MS/MS mass spectrometry information was matched with mainstream public metabolomics databases HMDB (http://www.hmdb.ca/) and Metlin (https://metlin.scripps.edu/). Metabolites were identified based on their secondary mass spectrometry matching scores. At least 80% of the metabolic features detected in any set of samples were retained. Each metabolic signature was normalized to the sum. Meanwhile, the variables of QC samples with relative standard deviation (RSD) > 30% were excluded and log10 logarithmicized to obtain the final data matrix for subsequent analysis. The R package “ropls” (Version 1.6.2) was used to perform principal component analysis (PCA) and orthogonal least partial squares discriminant analysis (OPLS-DA), and 7-cycle interactive validation evaluating the stability of the model. The metabolites with VIP > 1, p < 0.05 were determined as significantly different metabolites based on the Variable importance in the projection (VIP) obtained by the OPLS-DA model and the p-value generated by Student’s t test. Differential metabolites among two groups were mapped into their biochemical pathways through metabolic enrichment and pathway analysis based on KEGG database (http://www.genome.jp/kegg/ accessed on 8 July 2025).
3. Results
3.1. Differences in Soil Physicochemical Properties
The results of the physicochemical analysis of soils with continuous cultivation of Morchella compared to noncontinuous cultivation are presented in Table 1. Relative to the control, the pH and available potassium content decreased in the continuously cultivated soil. However, the contents of organic matter, hydrolyzed nitrogen, available phosphorus, total porosity, and soil moisture were higher. This suggests that continuous cultivation changes soil structure nutrient content.

Table 1.
Soil physicochemical analysis.
3.2. Soil Microbial Diversity and Composition
To investigate whether soil microorganisms contribute to the obstacles to the continuous cultivation of Morchella, soil samples from noncontinuous cultivation areas were used as controls. Soil samples from areas with one year of continuous cultivation were collected, and DNA was extracted. The rarefaction curves showed clear asymptotes (Figure 1), which indicate a near-complete sampling of the community whether bacteria or fungi. Microbial community characteristics were determined using the MiSeq high-throughput sequencing method, where the total numbers of raw sequences for bacterial and fungal amplifications were 489,751 and 620,410, respectively. After quality control and chimera filtering, 474,189 bacterial sequences and 587,768 fungal sequences were obtained. Following database comparison, 5288 bacterial OTUs and 1847 fungal OTUs were identified, with a sequence similarity of 97% (Tables S1 and S2). Among them, dNC contains 4377 (83% of the total OTUs in the sample) bacterial OTUs and 1338 (72% of the total OTUs in the sample) fungal OTUs, while dCC contains 4164 (79% of the total OTUs in the sample) bacterial OTUs and 1354 (73% of the total OTUs in the sample) fungal OTUs. The continuous cropping method affects the decrease in soil bacterial OTUs and the increase in fungal OTUs. The range of sequencing coverage per sample group was shown in Table 2. The rarefaction curves showed clear asymptotes indicating that the sequencing volume can cover the vast majority of species in the sample.
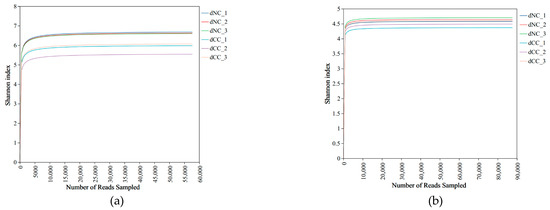
Figure 1.
Rarefaction analysis of bacteria and fungi. (a) Bacteria (b) Fungi.
Table 2.
The range of sequencing coverage per sample group.
The α-diversity of the microbial communities in different soil samples was analyzed using Shannon and Simpson diversity indices, which showed that for both bacteria and fungi, the α-diversity in the continuously cultivated soils was lower, although the differences compared to the control soil were not statistically significant (Figure 2a–e). In terms of β-diversity based on unweighted_UniFrac distance, the Adonis test for inter-group differences indicated a clear separation between the microbial communities in continuously cultivated versus non continuously cultivated soils, but the differences between the two groups were again not statistically significant (Figure 2c,f).
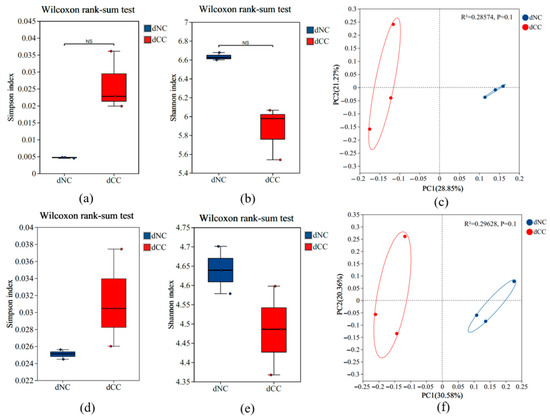
Figure 2.
The α-diversity and β-diversity of microbial communities in soils with continuous cultivation of Morchella. The α-diversity of bacterial (a,b) and fungal (d,e) communities. Principal coordinate analysis based on unweighted_UniFrac distances displays the structure of bacterial (c) and fungal (f) communities at different developmental stages. dNC: soil with no prior morel cultivation s, dCC: soil with one year of continuous morel cultivation.
The top 10 bacterial phyla are depicted in Figure 3a. Both continuously cultivated and noncontinuously cultivated soils were predominantly composed of Pseudomonadota, Actinobacteriota, Chloroflexota, and Acidobacteriota, which accounted for approximately 80% of the total. The relative abundance of Actinobacteriota was slightly higher in continuously cultivated soils. Notably, continuously cultivated soils contained a significant amount of Cyanobacteria. At the genus level, the contents of Arthrobacter, Pseudomonas, and Streptomyces were significantly higher in continuously cultivated soils compared to control soils. Additionally, Tychonema was specifically present in continuously cultivated soils (Figure 3b).
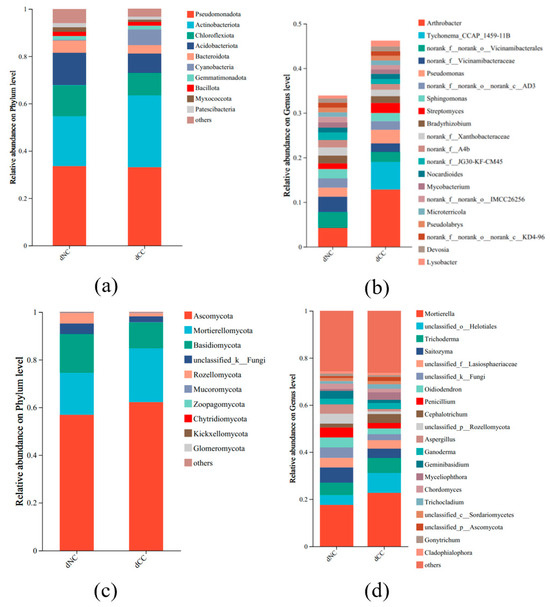
Figure 3.
The microbial composition of soil samples from continuously cultivated Morchella. (a) Bacteria at the phylum level; (b) Bacteria at the genus level; (c) Fungal at the phylum level; (d) Fungal at the genus level.
Regarding fungal taxonomic composition, the dominant phyla were Ascomycota, Mortierellomycota, and Basidiomycota. Compared to the control, the relative abundance of Ascomycota and Mortierellomycota was higher in continuously cultivated soils, but Basidiomycota and Rozellomycota were lower (Figure 3c). At the genus level, the relative abundance of Mortierella, Cephalotrichum, and Myceliophthora were higher in continuously cultivated soils, whereas Saitozyma, Penicillium, Aspergillus, and Geminibasidium were lower (Figure 3d).
3.3. Differential Analysis of Soil Microorganisms and Key Biological Biomarkers
To investigate the impact of continuous cultivation of Morchella on key biological biomarkers in the soil, we employed LEfSe analysis with an LDA threshold of 3. In noncontinuously cultivated soils, Flavobacterium, Ensifer, and Neochlamydia were identified as key biomarkers for the bacterial community, and Aspergillus, Saitozyma, and Geminibasidium were key biomarkers for the fungal community. In continuously cultivated soils, Arthrobacter, Tychonema, and Pseudomonas were key biomarkers for the bacterial community, and Myceliophthora, Cephalotrichum, and Trichoderma were key biomarkers for the fungal community (Figure 4). Intergroup t-tests were conducted to determine significantly different microbial populations (p < 0.05), FDR was applied to multiple testing correction. These results showed that in the bacterial community, Arthrobacter (p = 0.0001), Rhodanobacter (p = 0.0045), and Luteimonas (p = 0.008) were significantly higher in continuously cultivated soils compared to the control group and that Streptomyces (p = 0.0164) and Bacillus (p = 0.0463) were significantly higher as well. In the fungal community, Cephalotrichum (p = 0.0032), Myceliophthora (p = 0.0055), and Lophiotrema (p = 0.0027) were significantly higher in continuously cultivated soils compared to the control group, as were Trichoderma (p = 0.0130) and Coniochaeta (p = 0.0172) (Figure 5).
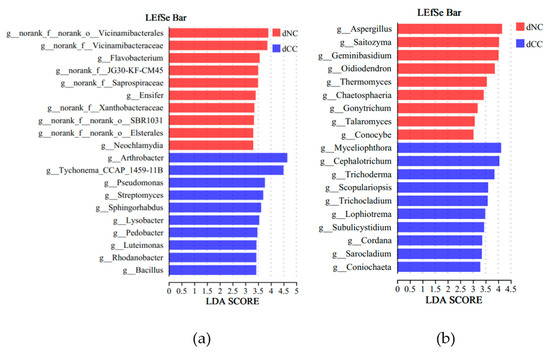
Figure 4.
The differences in microbial taxonomic groups based on LEfSe analysis. (a) Bacteria; (b) Fungi.
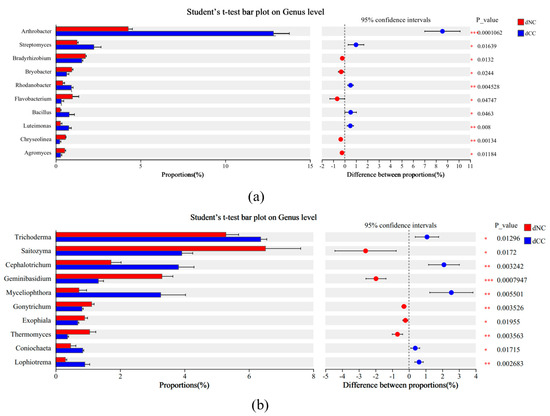
Figure 5.
The differences in microbial taxonomic groups between samples based on t-tests. (a) Bacteria; (b) Fungi. * p < 0.05, ** p < 0.01, *** p < 0.001.
3.4. Soil Microbial Interactions
Co-occurrence network analysis was conducted at the genus level for all microorganisms in order to construct microbial networks for the NC (noncontinuous cultivation) and CC (continuous cultivation) samples. Overall, whether for bacteria or fungi, the complexity of microbial interactions in continuously cultivated soils was higher than in control soils. Moreover, the proportion of negative connections was also greater than that of positive connections, indicating that the microbial network patterns in soils planted with Morchella were primarily characterized by negative correlations, with competitive interactions being more dominant (Figure 6). Microbial communities can be identified based on the modularity within modules (Zi) and between modules (Pi) in the network, which allows for the determination of key groups. There were 13 key bacterial groups in continuously cultivated soils and 45 in noncontinuously cultivated soils. For fungi, there were 41 key groups in continuously cultivated soils and 27 in noncontinuously cultivated soils (Table 3). This suggests that fungal communities may have a greater impact on the cultivation of Morchella.
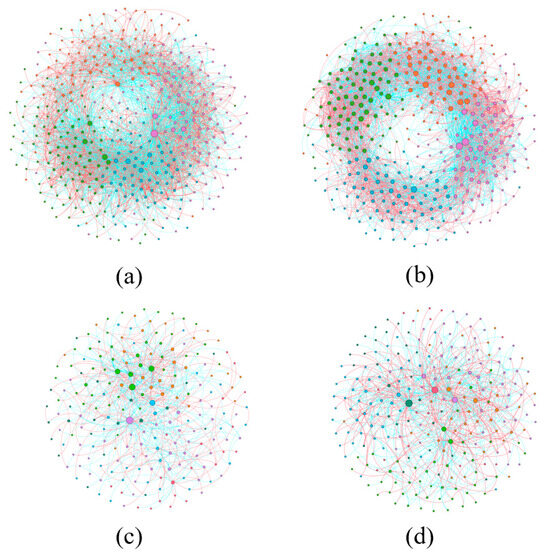
Figure 6.
The network analysis of microbial communities in soils with continuous cultivation of Morchella. (a) Bacteria in the noncontinuous cultivation; (b) Bacteria in the continuous cultivation; (c) Fungal in the noncontinuous cultivation; (d) Fungal in the continuous cultivation. Different colors represent different modules.
Table 3.
The main properties of the co-occurrence network.
3.5. Metabolome Composition Analysis
To understand the impact of continuous cultivation on soil metabolites, we conducted metabolomics analysis on soils with and without continuous cultivation of Morchella. After filtering, imputation, normalization, and log transformation, a total of 368 metabolites were obtained. In positive and negative ion modes, 197 and 171 metabolites were identified, respectively. The original LC-MS chromatograms from the apparatus were shown (Figure S1). Among these, 332 metabolites were classified into 13 categories (Figure 7). Principal Component Analysis (PCA) showed that the continuously cultivated and control soils were separated, with the control group having a larger confidence interval than the continuously cultivated group. This suggests that the continuously cultivated group may exhibit less variability in the metabolome (Figure 8).
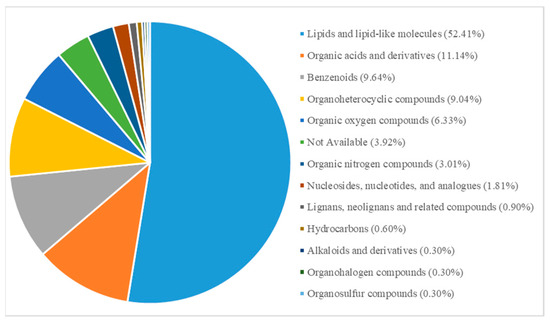
Figure 7.
Classification of all metabolites.
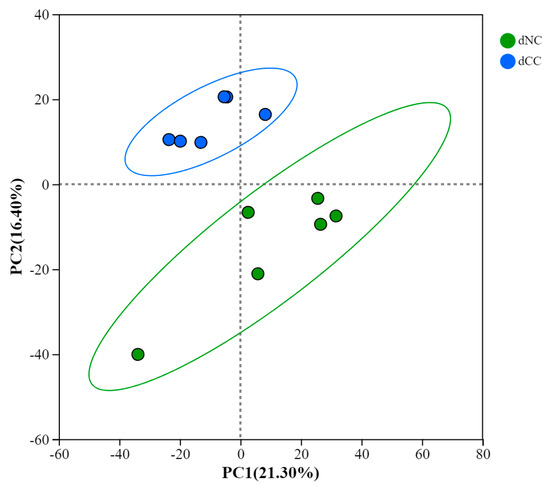
Figure 8.
PCA of metabolites in different groups.
3.6. Analysis of Differentially Accumulated Metabolites
Differentially accumulated metabolites were screened using OPLS-DA (ropls (R packages) Version 1.6.2) analysis between groups. Metabolites with VIP ≥ 1, p ≤ 0.05 in t-tests, and fold change (FC) > 1 were selected as differentially accumulated metabolites. Twenty-eight significantly different metabolites were identified, among which 18 metabolites were upregulated in continuously cultivated soil samples, and 10 metabolites were downregulated (Figure 9). The upregulated metabolites were primarily lipids and lipid-like molecules, but the most significantly upregulated metabolites were 2,4,5-Trichloro-6-Hydroxybenzene-1,3-Dicarbonitrile and 2,4-Dichloro-6-nitrophenol, both belonging to benzenoids. Benzenoids possess certain toxicity, have strong adsorption and mobility in soil, and can accumulate easily, all of which affects soil microorganisms and plant growth. The most significantly downregulated metabolites were organic acids and their derivatives (Table 4). In summary, continuous cultivation may primarily alter the content of acidic substances and toxic benzenoids in the soil, thereby impacting the cultivation of Morchella.
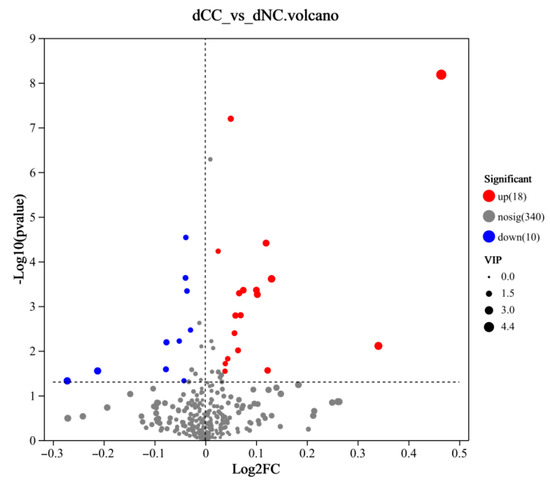
Figure 9.
Volcano plot of differentially accumulated metabolites. The x-axis represents the fold change in metabolite expression between the two groups, i.e., log2FC, and the y-axis represents the statistical test value of the metabolite expression difference, i.e., −log10 (p-value). Each point represents a specific metabolite, and the size of the point indicates the VIP score. Red points represent significantly upregulated metabolites, and blue points represent significantly downregulated metabolites.
Table 4.
Differential metabolites between continuous and non-continuous cropping soils of morel.
3.7. KEGG Enrichment Analysis
To understand further the metabolic pathways in which the differentially accumulated metabolites in continuously cultivated soils participate compared to noncontinuously cultivated soils, we annotated these metabolites using the KEGG database. These results showed that three metabolites in continuously cultivated soils were significantly enriched in Linoleic acid metabolism. One metabolite each was significantly enriched in Aflatoxin biosynthesis, Parkinson’s disease, and Betalain biosynthesis. In noncontinuously cultivated soils, two metabolites were significantly enriched in Galactose metabolism, and one metabolite each was significantly enriched in Sphingolipid metabolism, Oxidative phosphorylation, and the Sphingolipid signaling pathway (Figure 10).
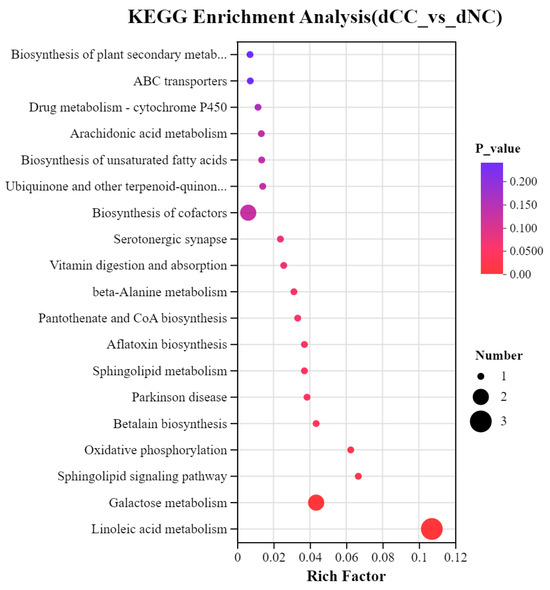
Figure 10.
KEGG enrichment pathways of differentially accumulated metabolites. The x-axis represents the enrichment ratio, calculated as num_in_study/num_in_pop, and the y-axis represents the KEGG pathways. The size of the bubbles in the figure indicates the number of compounds enriched in each pathway, and the color of the bubbles represents the significance of enrichment, with different colors corresponding to different p-values.
4. Discussion
Morel is renowned as the “king of fungi” due to its rarity and unique flavor. However, its typical cultivation method, similar to other crops, can generate certain obstacles to continuous cultivation. Elucidating the molecular mechanisms that underlie these obstacles may help to stabilize morel yields, and as such in this study we employed microbiome and metabolomics techniques to identify the most important microorganisms and metabolites that may present the largest obstacles to continuous cultivation. Provide certain reference value for eliminating continuous cropping obstacles of morel mushrooms.
From the perspective of soil physicochemical properties, morel cultivation leads to decreased soil pH and available potassium content and increases organic matter, hydrolyzed nitrogen, and available phosphorus. These changes are primarily driven by the interactions among Morchella, soil microorganisms, and organic matter decomposition. During the growth process of Morchella and the decomposition of organic matter by soil microorganisms, acidic substances are produced and a large amount of available potassium is consumed, resulting in a decrease in soil pH and available potassium content in Morchella after one year of continuous cultivation. The soil for cultivation of morel mushrooms then becomes more suitable for herbaceous plant growth, resulting in increased organic matter content. Organic matter is broken down by various enzymes secreted by morel mushrooms, releasing hydrolytic nitrogen and available phosphorus. Indeed, the content of available phosphorus often correlates positively with organic matter content, and increased organic matter leads to an abundance of phosphorus-solubilizing bacteria that facilitate the conversion of ineffective phosphorus to available phosphorus. Therefore, the content of organic matter, hydrolytic nitrogen, and available phosphorus in the soil of morel mushroom cultivation increases. This is consistent with the increase in organic matter, nitrogen, and other contents of morel mushrooms after growing on desert substrates.
Continuous cropping obstacles involve changes in soil microbial community structure and typically result in increased pathogenic bacteria and decreased beneficial microorganisms. Previous studies have shown that continuous cropping affects the microbial community in the rhizosphere of Goji, with an increase in harmful plant pathogens such as Pseudomonas, Arthrobacter, and Trichoderma over time [27]. In continuous cropping models of ginseng and tomato, Rhodanobacter often plays a dominant role [28,29]. Our present results indicate that compared to noncontinuous cultivation control soils, the α-diversity and β-diversity of microorganisms in continuously cultivated soils are not statistically different. However, the composition and differential analysis of bacterial communities in continuously cultivated soils, as well as LEfSe analysis, suggest that Arthrobacter, Tychonema, Rhodanobacter, Luteimonas, and Streptomyces may play unique roles in continuous cropping soil. Reports have shown that in soils with low or no morel production, fungi such as Gibberella, Microidium, Sarocladium, and Streptomyces is more prevalent [14]. We also found that Streptomyces was significantly more abundant in continuously cultivated soils compared to noncontinuously cultivated soils in the present study.
Compared to bacterial communities, fungal communities exhibited greater differences between treatment and control soils. In continuously cultivated soils, Cephalotrichum, Myceliophthora, and Lophiotrema were significantly higher, and Trichoderma and Coniochaeta were also notably elevated. Conversely, Geminibasidium and Thermomyces were significantly lower, as was also reduced. Research on Morchella continuous cropping obstacles has shown that carbendazim treatment can decrease the relative abundance of the fungal pathogen Phytophthora in continuously cultivated soils [9], and studies on the intercropping of Cinnamomum camphora and Polygonatum multiflorum have demonstrated a significant increase in Saitozyma abundance [30]. Reports also indicate that fungi such as Penicillium, Trichoderma, Aspergillus, and Fusarium increase in abundance during continuous cultivation of Morchella, potentially becoming major pathogens that reduce the yield of Morchella sextelata in particular [8].
Penicillium, Trichoderma, Aspergillus, Fusarium, Botrytis, Clonostachys, Acremonium, Mortierella and Paecilomyces are pathogenic fungi often found in various types of edible fungi and plant production, and in soils with low or no morel production, Gibberella, Microidium, Sarocladium, and Streptomyces have been found to be prevalent [14]. We also found that Trichoderma and Streptomyces were significantly elevated and dominant in continuously cultivated soils, suggesting they may be key microorganisms that contribute to obstacles to Morchella continuous cropping.
In addition, our metabolomics analysis of Morchella continuously cultivated soils identified 368 metabolites, primarily including lipids and lipid-like molecules, organic acids and their derivatives, benzenoid compounds, and organic heterocyclic compounds. This aligns with previous metabolomics results for Morchella that have indicated that the metabolites in cultivated soils are mainly derived from Morchella metabolism. Among these, 28 metabolites showed significant differences, with 18 being upregulated and 10 downregulated in continuously cultivated soils. Previous studies have found that phenolic acid extracts have a hindering effect on Morchella continuous cropping [10], and our current results revealed that benzenoid compounds and aflatoxin B2 were relatively abundant in continuously cultivated soils and that urea was low. This may contribute to the hindrance of continuous cropping of Morchella.
Finally, we also found several important compounds that may contribute to impeding continuous Morchella cropping. For example, 2,4,5-Trichloro-6-Hydroxybenzene-1,3-Dicarbonitrile is a benzenoid compound with relatively low toxicity [31], and 2,4-Dichloro-6-nitrophenol (DCNP) is an aromatic nitro derivative formed through the photo-nitration of 2,4-dichlorophenol (DCP), an environmental transformation intermediate of the herbicide propanil. DCNP exhibits genotoxicity that induces gene mutations and chromosomal aberrations [32,33,34]. Furthermore, aflatoxins are compounds with a basic structure that contains a difuran and a coumarin (oxynaphthoquinone), and previous studies have shown that phenolic acids may play a crucial role in soil diseases that affect Morchella. Moreover, cinnamic acid, a phenolic compound, inhibits the growth of three species of cultivated Morchella (M. sextelata, M. eximia, and M. importuna) [10,35]. Cinnamic acid can cyclize to form coumarin under acidic conditions. Additionally, the presence of aflatoxin B2, which contains coumarin, in continuously cultivated soils suggests it may also exert toxic effects that hinder continuous cropping.
Continuous cropping obstacles are a major problem in agricultural planting. This study was only a preliminary exploration. In the future, it is necessary to increase the duration of continuous cropping, increase the sampling volume, optimize the control settings, and solve or reduce the problem by more accurately exploring the mechanism of continuous cropping obstacles.
5. Conclusions
As Morchella cultivation becomes increasingly more feasible and therefore widespread, obstacles to its continuous cropping severely limit the output of the Morchella industry. This study, through microbiome and metabolome analysis, that continuous cultivation of morel can cause an imbalance in soil microbial communities, leading to a decrease in the abundance of beneficial microorganisms and an enrichment of fungal pathogens. Accumulation of toxic metabolites inhibits hyphal germination and fruiting body formation. Therefore, it is necessary to address the problem of continuous cropping obstacles through a dual approach of microbial regulation and metabolic intervention.
Supplementary Materials
The following supporting information can be downloaded at: https://www.mdpi.com/article/10.3390/microbiolres16090205/s1, Table S1: Absolute abundance in the phylum, class, order, family and genus level of bacterial taxa. Table S2: Absolute abundance in the phylum, class, order, family and genus level of fungi taxa. Figure S1: The original LC-MS chromatograms.
Author Contributions
Conceptualization, C.Y. and G.T.; methodology, P.Y.; validation, P.Y. and N.T.; formal analysis, P.Y.; investigation, P.Y. and C.Y.; resources, G.T.; data curation, P.Y., N.T., W.C. and J.Z.; writing—original draft preparation, P.Y.; writing—review and editing, P.Y., C.Y. and G.T.; visualization, W.C. and J.Z.; supervision, C.Y. and G.T.; project administration, C.Y. and G.T.; funding acquisition, C.Y. and G.T. All authors have read and agreed to the published version of the manuscript.
Funding
This research was funded by “The Yunnan Provincial Joint Special Key Project of Agricultural Basic Research, grant number 202501BD070001-013” and “The Yunnan Province Fumin County Prefabricated Vegetable Industry Science and Technology Special Mission, grant number 202504BI090004”.
Data Availability Statement
All microbiome raw data were submitted to the NCBI and can be found under the BioProject accession numbers PRJNA1298491. The metabolomics data have deposited in China National Center for Bioinformation, BioProject: PRJCA043906.
Conflicts of Interest
The authors declare no conflicts of interest.
References
- Liu, Q.; Ma, H.; Zhang, Y.; Dong, C. Artificial cultivation of true morels: Current state, issues and perspectives. Crit. Rev. Biotechnol. 2018, 38, 259–271. [Google Scholar] [CrossRef]
- Sambyal, K.; Singh, R.V. A comprehensive review on Morchella importuna: Cultivation aspects, phytochemistry, and other significant applications. Folia Microbiol. 2021, 66, 147–157. [Google Scholar] [CrossRef] [PubMed]
- Sunil, C.; Xu, B. Mycochemical profile and health-promoting effects of morel mushroom Morchella esculenta (L.)—A review. Food Res. Int. 2022, 159, 111571. [Google Scholar] [CrossRef]
- Tan, F. History, present situation and prospect of artificial cultivation of morels. Edible Med. Mushrooms 2016, 24, 140–144. [Google Scholar]
- Yu, F.M.; Jayawardena, R.S.; Thongklang, N.; Lv, M.L.; Zhu, X.T.; Zhao, Q. Morel production associated with soil nitrogen-fixing and nitrifying microorganisms. J. Fungi 2022, 8, 299. [Google Scholar] [CrossRef]
- Liu, W.; He, P.; Shi, X.; Zhang, Y.; Perez-Moreno, J.; Yu, F. Large-scale field cultivation of Morchella and relevance of basic knowledge for its steady production. J. Fungi 2023, 9, 855. [Google Scholar] [CrossRef]
- Du, X. Review on species resources, resproductive modes and genetic diversity of black morels. J. Fungal Res. 2019, 17, 240–251. [Google Scholar] [CrossRef]
- Liu, W.; Cai, Y.; Ma, X.; He, P. Evaluation system of cultivating suitability for the productive strains of Morchella mushrooms. J. Light. Ind. 2022, 37, 50–57. [Google Scholar] [CrossRef]
- Chen, B.; Shao, G.; Zhou, T.; Fan, Q.; Yang, N.; Cui, M.; Zhang, J.; Wu, X.; Zhang, B.; Zhang, R. Dazomet changes microbial communities and improves morel mushroom yield under continuous cropping. Front. Microbiol. 2023, 14, 1200226. [Google Scholar] [CrossRef] [PubMed]
- Yin, Q.; Chen, Z.; He, P.; Liu, W.; Zhang, W.; Cao, X. Allelopathic effects of phenolic acid extracts on Morchella mushrooms, pathogenic fungus, and soil-dominant fungus uncover the mechanism of morel continuous cropping obstacle. Arch. Microbiol. 2024, 206, 55. [Google Scholar] [CrossRef]
- Tan, H.; Liu, T.; Yu, Y.; Tang, J.; Jiang, L.; Martin, F.M.; Peng, W. Morel production related to soil microbial diversity and evenness. Microbiol. Spectr. 2021, 9, e0022921. [Google Scholar] [CrossRef]
- Zhang, F.; Long, L.; Hu, Z.; Yu, X.; Liu, Q.; Bao, J.; Long, Z. Analyses of artificial morel soil bacterial community structure and mineral element contents in ascocarp and the cultivated soil. Can. J. Microbiol. 2019, 65, 738–749. [Google Scholar] [CrossRef] [PubMed]
- Zhang, Y.; Sun, S.; Luo, D.; Mao, P.; Rosazlina, R.; Martin, F.; Xu, L. Decline in morel production upon continuous cropping is related to changes in soil mycobiome. J. Fungi 2023, 9, 492. [Google Scholar] [CrossRef] [PubMed]
- Liu, W.Y.; Guo, H.B.; Bi, K.X.; Alekseevna, S.L.; Qi, X.J.; Yu, X.D. Determining why continuous cropping reduces the production of the morel Morchella sextelata. Front. Microbiol. 2022, 13, 903983. [Google Scholar] [CrossRef]
- Yao, C.; Yu, P.; Yang, J.; Liu, J.; Zi, Z.; Li, D.; Liang, M.; Tian, G. Differences in soil microflora between the two chinese geographical indication products of "Tricholoma matsutake shangri-la" and " T. matsutake nanhua". Agronomy 2024, 14, 4. [Google Scholar] [CrossRef]
- Walkley, A.; Black, I.A. An examination of the Degtjareff method for determining soil organic matter, and a proposed modification of the chromic acid titration method. Soil Sci. 1934, 37, 29–38. [Google Scholar] [CrossRef]
- Mulvaney, R.L.; Khan, S.A. Diffusion methods to determine different forms of nitrogen in soil hydrolysates. Soil Sci. Soc. Am. J. 2001, 65, 1284–1292. [Google Scholar] [CrossRef]
- Truog, E. The determination of the readily available phosphorus soils. J. Am. Soc. Agron. 1930, 22, 874. [Google Scholar] [CrossRef]
- Ieggli, C.V.S.; Bohrer, D.; Do Nascimento, P.C.; De Carvalho, L.M. Determination of sodium, potassium, calcium, magnesium, zinc and iron in emulsified chocolate samples by flame atomic absorption spectrometry. Food Chem. 2011, 124, 1189–1193. [Google Scholar] [CrossRef]
- Chen, S.; Zhou, Y.; Chen, Y.; Gu, J. Fastp: An ultra-fast all-in-one FASTQ preprocessor. Bioinformatics 2018, 34, i884–i890. [Google Scholar] [CrossRef]
- Magoč, T.; Salzberg, S.L. FLASH: Fast length adjustment of short reads to improve genome assemblies. Bioinformatics 2011, 27, 2957–2963. [Google Scholar] [CrossRef]
- Edgar, R.C. UPARSE: Highly accurate OTU sequences from microbial amplicon reads. Nat. Methods 2013, 10, 996–998. [Google Scholar] [CrossRef]
- Stackebrandt, E.; Goebel, B.M. Taxonomic Note: A Place for DNA-DNA Reassociation and 16S rRNA Sequence Analysis in the Present Species Definition in Bacteriology. Int. J. Syst. Bacteriol. 1994, 44, 846–849. [Google Scholar] [CrossRef]
- Wang, Q. Naive Bayesian classifier for rapid assignment of rRNA sequences into the new bacterial taxonomy. Appl. Environ. Microbiol. 2007, 73, 5261–5267. [Google Scholar] [CrossRef]
- Schloss, P.D.; Westcott, S.L.; Ryabin, T.; Hall, J.R.; Hartmann, M.; Hollister, E.B.; Lesniewski, R.A.; Oakley, B.B.; Parks, D.H.; Robinson, C.J.; et al. Introducing mothur: Open-Source, Platform-Independent, Community-Supported Software for Describing and Comparing Microbial Communities. Appl. Environ. Microbiol. 2009, 75, 7537. [Google Scholar]
- Segata, N.; Izard, J.; Waldron, L.; Gevers, D.; Miropolsky, L.; Garrett, W.S.; Huttenhower, C. Metagenomic biomarker discovery and explanation. Genome Biol. 2011, 12, R60. [Google Scholar] [CrossRef]
- He, M.Y.; Shen, C.; Zhang, J.H.; Wang, Y.D. Effects of continuous cropping on the physiochemical properties, pesticide residues, and microbial community in the root zone soil of Lycium barbarum. Huan Jing Ke Xue 2024, 45, 5578–5590. [Google Scholar] [CrossRef]
- Li, C.; Chen, G.; Zhang, J.; Zhu, P.; Bai, X.; Hou, Y.; Zhang, X. The comprehensive changes in soil properties are continuous cropping obstacles associated with American ginseng (Panax quinquefolius) cultivation. Sci. Rep. 2021, 11, 5068. [Google Scholar] [CrossRef] [PubMed]
- Feng, C.; Yi, Z.; Qian, W.; Liu, H.; Jiang, X. Rotations improve the diversity of rhizosphere soil bacterial communities, enzyme activities and tomato yield. PLoS ONE 2023, 18, e0270944. [Google Scholar] [CrossRef] [PubMed]
- Wang, Q.; Peng, X.; Yuan, Y.; Zhou, X.; Huang, J.; Wang, H. The effect of Torreya grandis inter-cropping with Polygonatum sibiricum on soil microbial community. Front. Microbiol. 2024, 15, 1487619. [Google Scholar] [CrossRef]
- Liang, B.; Wang, G.; Zhao, Y.; Chen, K.; Li, S.; Jiang, J. Facilitation of bacterial adaptation to chlorothalonil-contaminated sites by horizontal transfer of the chlorothalonil hydrolytic dehalogenase gene. Appl. Environ. Microbiol. 2011, 77, 4268–4272. [Google Scholar] [CrossRef]
- Heng, Z.C.; Nath, J.; Liu, X.; Ong, T.M. Induction of chromosomal aberrations by 2,4-dichloro-6-aminophenol in cultured V79 cells. Teratog. Carcinog. Mutagen. 1996, 16, 81–87. [Google Scholar] [CrossRef]
- Heng, Z.C.; Ong, T.; Nath, J. In vitro studies on the genotoxicity of 2,4-dichloro-6-nitrophenol ammonium (DCNPA) and its major metabolite. Mutat. Res. 1996, 368, 149–155. [Google Scholar] [CrossRef] [PubMed]
- Maddigapu, P.R.; Minella, M.; Vione, D.; Maurino, V.; Minero, C. Modeling phototransformation reactions in surface water bodies: 2,4-dichloro-6-nitrophenol as a case study. Environ. Sci. Technol. 2011, 45, 209–214. [Google Scholar] [CrossRef]
- Ma, Z.; Guan, Z.; Liu, Q.; Hu, Y.; Liu, L.; Wang, B.; Huang, L.; Li, H.; Yang, Y.; Han, M.; et al. Obstacles in continuous cropping: Mechanisms and control measures. Adv. Agron. 2023, 179, 205–256. [Google Scholar] [CrossRef]
Disclaimer/Publisher’s Note: The statements, opinions and data contained in all publications are solely those of the individual author(s) and contributor(s) and not of MDPI and/or the editor(s). MDPI and/or the editor(s) disclaim responsibility for any injury to people or property resulting from any ideas, methods, instructions or products referred to in the content. |
© 2025 by the authors. Licensee MDPI, Basel, Switzerland. This article is an open access article distributed under the terms and conditions of the Creative Commons Attribution (CC BY) license (https://creativecommons.org/licenses/by/4.0/).