Article

Replication Kinetics and Infectivity of African Swine Fever Virus (ASFV) Variants with Different Genotypes or Levels of Virulence in Cell Culture Models of Primary Porcine Macrophages

1
Service Viral Re-Emerging, Enzootic and Bee Diseases, Department Infectious Diseases in Animals, Sciensano, Groeselenbergstraat 99, 1180 Brussels, Belgium
2
Laboratory of Virology, Department of Translational Physiology, Infectiology and Public Health, Faculty of Veterinary Medicine, Ghent University, Salisburylaan 133, 9820 Merelbeke, Belgium
*
Author to whom correspondence should be addressed.
These authors contributed equally to senior authorship.
Microbiol. Res. 2024, 15(3), 1690-1708; https://doi.org/10.3390/microbiolres15030112
Submission received: 10 July 2024 / Revised: 23 August 2024 / Accepted: 27 August 2024 / Published: 29 August 2024
(This article belongs to the Special Issue African Swine Fever Vaccines: Development and Application)

Abstract

:
African Swine Fever (ASF) is a devastating viral hemorrhagic disease that causes high morbidity and mortality in domestic pigs and wild boars, severely impacting the swine industry. The etiologic agent, African Swine Fever virus (ASFV), mainly infects myeloid cells of the swine mononuclear phagocytic system (MPS). For other porcine viruses, in vitro culture models with primary cells are widely used as they mimic the in vivo viral replication behavior better compared to continuous cell lines. Our study validates this possible correlation for ASFV using cell culture models established for three different porcine macrophages, isolated from the lungs (porcine alveolar macrophages), blood (monocyte-derived macrophages) and spleen (spleen macrophages). The cells were infected with two genotype I and two genotype II strains with different pathogenic potential in vivo. The highly virulent strains replicated better in general than the low-virulent strains. This was most pronounced in monocyte-derived macrophages, although only statistically significant 18 h post-infection (hpi) in the intracellular genomic ASFV copies between E70 and the low-virulent strains. For this reason, we conclude that the different replication characteristics between the strains with different virulence do not proportionally represent the differences in pathology seen between the strains in vivo. Additionally, ASFV-positive cells were observed earlier in monocyte-derived macrophages (MDMs) compared to the alveolar and spleen macrophages, subsequently leading to an earlier rise in extracellular virus, and, ultimately, more MDMs were infected at the end of sampling. For these reasons, we propose MDMs as the best-suited cell type to study ASFV.

1. Introduction

African Swine Fever is one of the most important viral diseases in domestic pigs due to its relevance for animal health and the pig industry. The causative agent, African Swine Fever virus (ASFV), is a large and complex DNA virus, a single member of the genus Asfivirus in the Asfarviridae family [1]. So far, control and eradication of the disease relied on early detection and strict stamping-out policies [2,3]. However, the rapid and continuous spread of the disease to new regions and countries worldwide demonstrates that such strategies are not successful and raise numerous ethical and social concerns [4].
ASFV isolates have been classified into 24 genotypes (I to XXIV) by comparative analysis of the C-terminal end of the B646L gene, which encodes the p72 protein [5]. Recently, the classification of genotypes has been reviewed, and a subdivision of six genotypes (1 to 6) has been proposed based on the predicted functional protein outcome of this B646L gene [6]. All genotypes are present in Africa, where ASF was first described more than a century ago [7]. Outside Africa, genotype I was related to historical ASFVs circulating in Europe and America until the mid-1990s [8,9,10]. This genotype was eradicated from most European countries during the 1990s but has remained endemic in Sardinia (Italy) since its introduction in 1978 [11]. In 2007, a second escape from the African continent was confirmed by the presence of ASFV genotype II in the Caucasus region of Georgia [12]. From Georgia, the virus rapidly spread throughout the Caucasus (Armenia, Azerbaijan, South of the Russian Federation) [13]. Afterwards, several long-distance jumps occurred in the Russian Federation between 2009 and 2010, affecting Central, Northern, and Western regions [14]. In 2011, the number of remote outbreaks increased drastically, with reported cases in wild boar and domestic pigs along the borders of Ukraine and Belarus [15], leading to a further spreading of the virus to neighboring regions and countries [14]. In 2012, the first outbreaks were declared in Ukraine, followed by Belarus in 2013. ASFV reached the European Union’s (EU) borders in 2014, when several dead wild boars were found in Lithuania and Poland. Since September 2014, ASFV has been reported in Estonia and Latvia and repeatedly in Lithuania and Poland [10,16]. Some more long-distance jumps occurred with outbreaks in the Czech Republic (2017), Belgium (2018), Italy (2022) [17,18] and Germany (2022 and 2024) (WOAH reports). More recently, the presence of genotype I outbreaks in China has been described as concomitant with the presence of genotype II isolates. This has led to a fast evolution of ASFVs through genomic recombination between different genotypes, which poses a new challenge to disease control efforts and vaccine development [19]. To date, ASFV outbreaks have been reported in five continents, including Europe, Asia, the Americas, Africa and Oceania. This highlights the pandemic character of ASFV and its subsequent threat to global pig production and food security.
The infection of domestic pigs (Sus scrofa domesticus) and European wild boars (Sus scrofa scrofa) results in a wide range of clinical pictures, varying from subclinical disease to severe hemorrhagic disease with up to 100% lethality depending on the virulence of the isolate (high, moderate and low) [20]. Concomitant with the virulence of the strains, the disease course is categorized in a peracute, acute, moderate or chronic form [10]. Highly virulent isolates are usually involved in peracute or acute forms of the disease. Moderately virulent isolates can induce acute, subacute or chronic forms of disease, while infection with low-virulent isolates is characterized by mild and nonspecific signs that are easily confused with other diseases, giving rise to chronic forms of ASF [10,21]. In addition to the disease course, the severity of pathological lesions can also be linked to the virulence of the ASFV strain [21].
The mononuclear phagocytic system (MPS) is the principal site of replication for ASFV [10,20,21]. The MPS consists of bone marrow progenitors, blood monocytes and tissue macrophages present in the lymphoid tissues, interstitial macrophages of the renal and hepatic parenchyma, and interstitial and alveolar macrophages of the lungs [22]. Predominantly monocytes and fixed-tissue macrophages, with key roles in the activation of innate and adaptive immune responses, are considered primary target cells for ASFV replication [21]. Tissue macrophages display a phenotypic heterogeneity, which can be exploited to discriminate subpopulations of macrophages. The fraction and presence of these subpopulations differ between tissues during homeostasis [22] and are continuously influenced by environmental factors and the origin of the macrophages [23]. This phenotypic heterogeneity preconditions the different subpopulations in their response to pathological events [22].
ASFV enters the body via tonsils or dorsal pharyngeal mucosa after oral inoculation, followed by a spread to the draining mandibular or retropharyngeal lymph nodes [20,21]. Only a limited number of studies document the onset of lesions and the time course for the first detection of organs affected during the pre-viremic state of ASF [24,25,26,27]. An aerosol exposure study located ASFV within the bronchial lymph nodes and spleen on the day of exposure, which suggests an initial virus entry through the lungs [21]. After initial entry and initial replication at the primary replication sites, the virus spreads systemically through viremia [20]. ASFV reaches the organs of secondary replication through the circulatory system. There, other cell types can become infected in addition to cells of the MPS [20,21,28]. ASFV can be transported in the form of free virions in serum, bound to erythrocytes or through infected monocytes [21]. ASFV is detectable in almost all tissues between 48 and 72 h after infection, with high titers in tissues containing high quantities of cells from the MPS, such as the spleen, lymph nodes and bone marrow, as well as in the liver, lung or kidney [21]. The lymphoid system, and especially the spleen, is the main target for ASFV replication in the initial stages following viremia [10,21,28]. The most characteristic splenic lesion in ASF is a hyperemic splenomegaly, which varies in severity depending on the virulence of the inoculated strain [15].
Different primary cells are used for in vitro cell culture models to represent in vivo replication of ASFV [29,30]. Strains adapted to grow in continuous cell lines exist, but they are less representative for in vivo infection, as adaptation leads to significant genome alterations and attenuation [31]. Furthermore, ASFV growth in continuous cell lines is marked by different replication defects, leading to limited replication capabilities or deviated infection characteristics [32,33]. Replication in porcine alveolar macrophages is proposed as the ideal model to investigate the replication characteristics for ASFV and demonstrates superior characteristics compared to monocytes [32,34]. However, this has never been studied in depth before.
Because the different clinical manifestations depend on the virulence of the strain, it could be questioned whether cell culture models can adequately reflect these variations. So far, in vitro studies of ASFV in cell cultures are limited to comparisons of attenuated strains with their respective wild-type strain [35,36] or incomplete observations of individual ASFV strains on subpopulations of porcine primary cells originating from the same tissue or cell lines [32,37,38,39]. Differences in experimental settings impede a cross-comparison of multiple studies.
To obtain a comprehensive picture, we conducted a systematic assessment of the replication kinetics and infectivity of a low-virulent, a moderately virulent and two virulent ASFV isolates belonging to genotype I or II that were involved in historical outbreaks of ASFV [40,41]. This evaluation was conducted on three types of primary cells from the MPS originating from different tissues crucial during early pathogenesis and/or commonly used in ASFV research: monocyte-derived macrophages (MDMs), porcine alveolar macrophages (PAMs) from the lungs and spleen macrophages.

2. Materials and Methods

2.1. Ethics Statement

Three 8–9-week-old healthy conventional crossbred pigs (Landrace x Piétrain) were used for the isolation of different subpopulations of primary swine macrophages. The three macrophage subpopulations were isolated at the same time from one animal during each experiment.
Euthanasia of animals was performed following the procedure approved by the Sciensano ethical committee under reference number 20200604-01.

2.2. Viruses and Cells

In this study, four ASFV isolates with different genotypes and virulence were used. Complete information about the four strains is presented in Table 1. Belgium 2018/01 was isolated from the spleen of a dead wild boar found in Etalle, Belgium, in 2018 [42,43]. The other isolates were kindly provided by the European Union Reference Laboratory for African Swine Fever (EURL-ASF) CISA-INIA (Valdeolmos, 28130, Madrid, Spain).
For the isolation of MDMs, ± 100 mL of venous blood was aseptically collected from the jugular vein in sterile heparinized vacutainer tubes (BD, Plymouth, UK) prior to euthanasia. Porcine peripheral blood mononuclear cells (PBMCs) were isolated through Ficoll-paque (Cytiva, Uppsala, Sweden) gradient centrifugation in 50 mL Sepmate tubes (Stemcell, Vancouver, Canada) following the manufacturer’s instructions. Afterwards, the PBMCs were seeded in T-175 cell culture flasks (Thermo Fisher, Roskilde, Denmark) in RPMI + glutamax (Gibco, Paisley, UK), supplemented with 1% penicillin (Kela, Sint-Niklaas, Belgium), 1% gentamycin (Gibco) and 1% amphotericin B (Gibco) and incubated for 1.5 h at 37 °C in a 5% CO2 atmosphere. After incubation, the medium was discarded, and the flasks were gently washed three times with heated phosphate-buffered saline (PBS) (Gibco) to enrich the adhering monocytes. The remaining cells were left to incubate overnight at 37 °C with 5% CO2 in PBMC seeding medium, containing RPMI + glutamax supplemented with antimicrobials and 10% fetal calf serum (FCS) (Gibco). Twenty-four hours later, the adhering cells were detached, as described in [48]. After detachment, cells were counted with a trypan blue exclusion dye in a Luna automated cell counter (Logosbio, Anyang, Republic Korea) and suspended at a concentration of 106 cells/mL in fresh PBMC seeding medium. The monocytes were seeded with 100 µL/well in 96-well Nunclon delta U-bottom plates (Thermo Fisher) for qPCR or virus titration (Thermo Fisher) and 1 mL/well in 24-well plates (VWR, Radnor, PA, USA) for immunofluorescence (IF) staining. The plates were further incubated for 48 h prior to inoculation at 37 °C and 5% CO2 to allow for further maturation of monocytes to MDMs.
For the isolation of PAMs and spleen macrophages, the animals were euthanized by intravenous injection with pentobarbital (Kela) at 12.5 mg/kg body weight.
PAMs were collected as described in [49] and suspended at a concentration of 106 cells/mL in PAM seeding medium, containing PBMC seeding medium supplemented with 1% non-essential amino acids (Thermo Fisher) and 1% sodium pyruvate. The cells were seeded according to the seeding procedure described for monocytes. Plates were further incubated for 24 h in 37 °C and 5% CO2 before inoculation.
Spleen macrophages were collected by physical cell separation in C-tubes (Miltenyi Biotec, Bergisch Gladbach, Germany) compatible with the gentleMACS octo dissociator (Miltenyi Biotec). Spleen tissue was minced in pieces of ±1 g and added to C-tubes containing PBS + 10% FCS. Afterwards, the tubes were processed using the gentleMACS octo Dissociator to obtain single-cell suspensions. The content of the C-tubes was passed through a 70 µm cell strainer to remove debris and cell aggregates. The suspension was centrifuged for 10 min at 1200 rpm and washed twice with PBS + 10% FCS. Subsequently, the cells were counted and diluted to a concentration of 5 × 10⁷ cells/mL in PBS supplemented with 10% FCS. Spleen macrophages were enriched from the mononuclear cell fraction by Ficoll-paque gradient centrifugation in 50 mL Sepmate tubes (Stemcell) following the manufacturer’s instructions. After this, the following steps were identical to those described for monocytes, except that PAM seeding medium was used for the seeding of the splenic cell suspension in T-175 flasks and subsequent seeding in cell culture plates. The cells were incubated at 37 °C and 5% CO2 for 24 h prior to inoculation.

2.3. Virus Inoculation and Sample Collection

Cultures of MDMs, PAMs and spleen macrophages were inoculated at a multiplicity of infection (MOI) of 0.01 with the respective strains in seeding medium to follow virus replication in a multistep growth curve. Every condition was conducted in technical triplicates. After 1.5 h incubation at 37 °C in the presence of 5% CO2, the inoculum was removed after centrifugation of the plates for 10 min at 1200 rpm. The cells were suspended in a washing step with 200 µL of seeding medium for the 96-well plates and 1 mL for the 24-well plates and centrifuged. After taking off the washing medium, 150 µL of fresh medium was added in the wells of the 96-well plates and 1 mL of fresh medium in the wells of the 24-well plates. The cells were further incubated until 0, 1,5, 3, 6, 9, 12, 18, 24 and 48 hpi. A mock-inoculated control (seeding medium alone) was included for each condition in triplicate. At the foreseen time points, cell culture supernatants and cells were collected separately. To determine the concentration of viral DNA copies with qPCR, 100 µL of supernatant was collected in micronic tubes (Micronic, Lelystad, The Netherlands) after centrifugation of the cell culture plate for 10 min at 1200 rpm and mixed with 90 µL ATL buffer (Qiagen, Hilden, Germany). The remaining supernatant was discarded. The cell pellets were washed in 200 µL PBS and centrifuged for 10 min at 1200 rpm. Afterwards, PBS was removed, and the cells were lysed with 90 µL ATL buffer. The cell lysates were placed in micronic tubes (Micronic) and the wells were subsequently washed with 100 µL PBS. The washing was added to the corresponding tube. For virus titration, plates were centrifuged for 10 min at 1200 rpm and 100 µL of supernatant was added to micronic tubes for virus titration of the supernatants. The remaining supernatant was discarded. The cell pellet underwent the same washing step as the wells for RT-PCR. Finally, 100 µL of PBS was added to the pellet in the cell culture plate, and the plate was frozen at −80 °C for cell lysis and stored until further analysis.

2.4. Real-Time qPCR

DNA was extracted using an automated magnetic bead-based extraction method with an Indimag 48 (Indical Bioscience, Leipzig, Germany) and the Indimag pathogen extraction kit following the manufacturer’s instructions. Next, a duplex qPCR assay targeting the viral P72 protein sequence and cellular beta-actin (reference gene) was performed. The qPCR was conducted on a LightCycler 480 thermocycler (Roche, Basel, Switzerland) according to the methods described in [50].

2.5. Virus Titration and Detection with Immunoperoxidase Test (IPT)

Supernatant and cell samples were titrated on PAMs and detected using an immuno-peroxidase test (IPT). Briefly, 24 h prior to inoculation, 105 PAMs/well were seeded in a 96-well cell culture plate and incubated at 37 °C, 5% CO2. The cells were then infected with a 5-fold serial dilution of the obtained samples in RPMI + glutamax and incubated under the same conditions. At 48 h post-inoculation, the cells were heat fixed: The supernatants were discarded, and the cells were air dried by placing the plates in an oven for 30 min at 37 °C, followed by a heat treatment of 1 h at 80 °C. After fixation, the plates were stored at 4 °C until staining. The infected cells were stained as described in [51] with the following adaptation: after the blocking step, the plates were incubated with a 1:50 dilution of a homemade anti-ASFV antibody-positive polyclonal swine serum in blocking solution. The infected cells were further revealed after a secondary binding with the protein A conjugated to the horseradish peroxidase (Sigma, St. Louis, MI, USA). Stained cells were visualized using a light microscope. Viral titers were calculated as log10 specific infection (SIN)/mL using the method described in [52].

2.6. Immunofluorescence Microscopy

The percentage of infected cells was determined by indirect immunofluorescence (IF) staining. The supernatants of the cells seeded in 24-well plates were discarded. The cells were washed once with 1ml PBS and heat fixed, as described in the IPMA methods. After fixation, the cells were permeabilized in 0.1% Triton-X for 10 min at room temperature. After permeabilization, the cells were incubated for 1 h at 37 °C with a monoclonal antibody detecting the ASFV major capsid protein p72 (1:100, clone 1BC11, Ingenasa, Madrid, Spain) in a blocking buffer containing 10% normal goat serum (NGS). Simultaneously, an isotype antibody against the irrelevant Pseudorabies virus (PRV) (clone 13D12, kindly provided by the laboratory of Professor H.J. Nauwynck) was used in the same dilution and blocking buffers. The cells were subsequently incubated with secondary goat anti-mouse IgG1 FITC (1:400, Invitrogen, Waltham, MA, USA). Nuclei were counterstained with Hoechst 33,342 (Invitrogen). The stained cells were mounted in glycerol-1,4-diazabicyclo[2.2.2]octane (DABCO) and covered with a 13 mm round coverslip No.1 (VWR) in the wells. The wells were analyzed using an ECLIPSE Ts2R-FL inverted microscope (Nikon, Amsterdam, The Netherlands). Pictures of 3 random fields were taken of every triplicate for each condition (time point/virus strain/cell type) with a 20x objective. Afterwards, pictures were analyzed for p72 positivity with Nikon Imaging Software (NIS) Elements 5.20 (Nikon). The percentage of ASFV-positive cells was determined by calculating the fraction of P72-positive cells to the total amount of cells visualized by staining of the nuclei with Hoechst 33342.
The purity of the extracted cells was assessed following the same protocol with re-placement of the ASFV-specific antibody by a monoclonal antibody targeting the monocyte/macrophage-specific CD163 membrane marker (1:200, clone 2A10, Bio Rad, Kidlington, UK) and visualized with a 40× objective.

2.7. Statistical Analysis

All data were presented as mean ± standard deviation (SD) from three independent experiments. Statistical analysis was conducted using Prism 9.4.1 (GraphPad, La Jolla, CA, USA). Data were analyzed by one-way analysis of variance (ANOVA) followed by Tukey’s multiple comparisons test. Statistical tests with a p-value < 0.05 were considered statistically significant. Statistical significance is visualized with asterisks on the graphs: * p-value < 0.05; ** p-value < 0.01; *** p-value < 0.005; **** p-value < 0.001.

3. Results

3.1. Determination of the Purity of the Extracted Cells

The purity of ASFV-susceptible macrophages was assessed by measuring the percentage of CD163-positive cells through immunofluorescence microscopy. This cell marker was specifically selected as it is a putative entry receptor for ASFV in vitro [53]. The ratio of CD163-positive cells to the total of isolated cells indicated a purity of 87.46% ± 7.21 for the PAMs, 83.12% ± 3.71 for the MDMs and 63.69% ± 6.48 for the spleen macrophages (Supplementary Figure S1). These percentages are likely an underestimation of the total fraction of macrophages present in the isolated cells of MDMs and especially spleen macrophages. While this scavenger receptor is ubiquitously present on PAMs [23], the monocyte fraction from PBMCs and the macrophage fraction originating from the single cell suspensions of spleen tissue after Ficoll gradient centrifugation were enriched by the distinguishing quality of myeloid cells to adhere to plastic. For spleen tissue, it is known that only macrophages in the red pulp express CD163, while in the macrophages residing in the follicles of the white pulp, the macrophages in the marginal zone and ellipsoids of the spleen do not [23]. CD163 is expressed on 5–50% of the blood monocytes, depending on the donor [54], after which the fraction of CD-163-positive monocytes increases during maturation [54].

3.2. Determination of Intracellular and Extracellular Viral DNA Copy Numbers

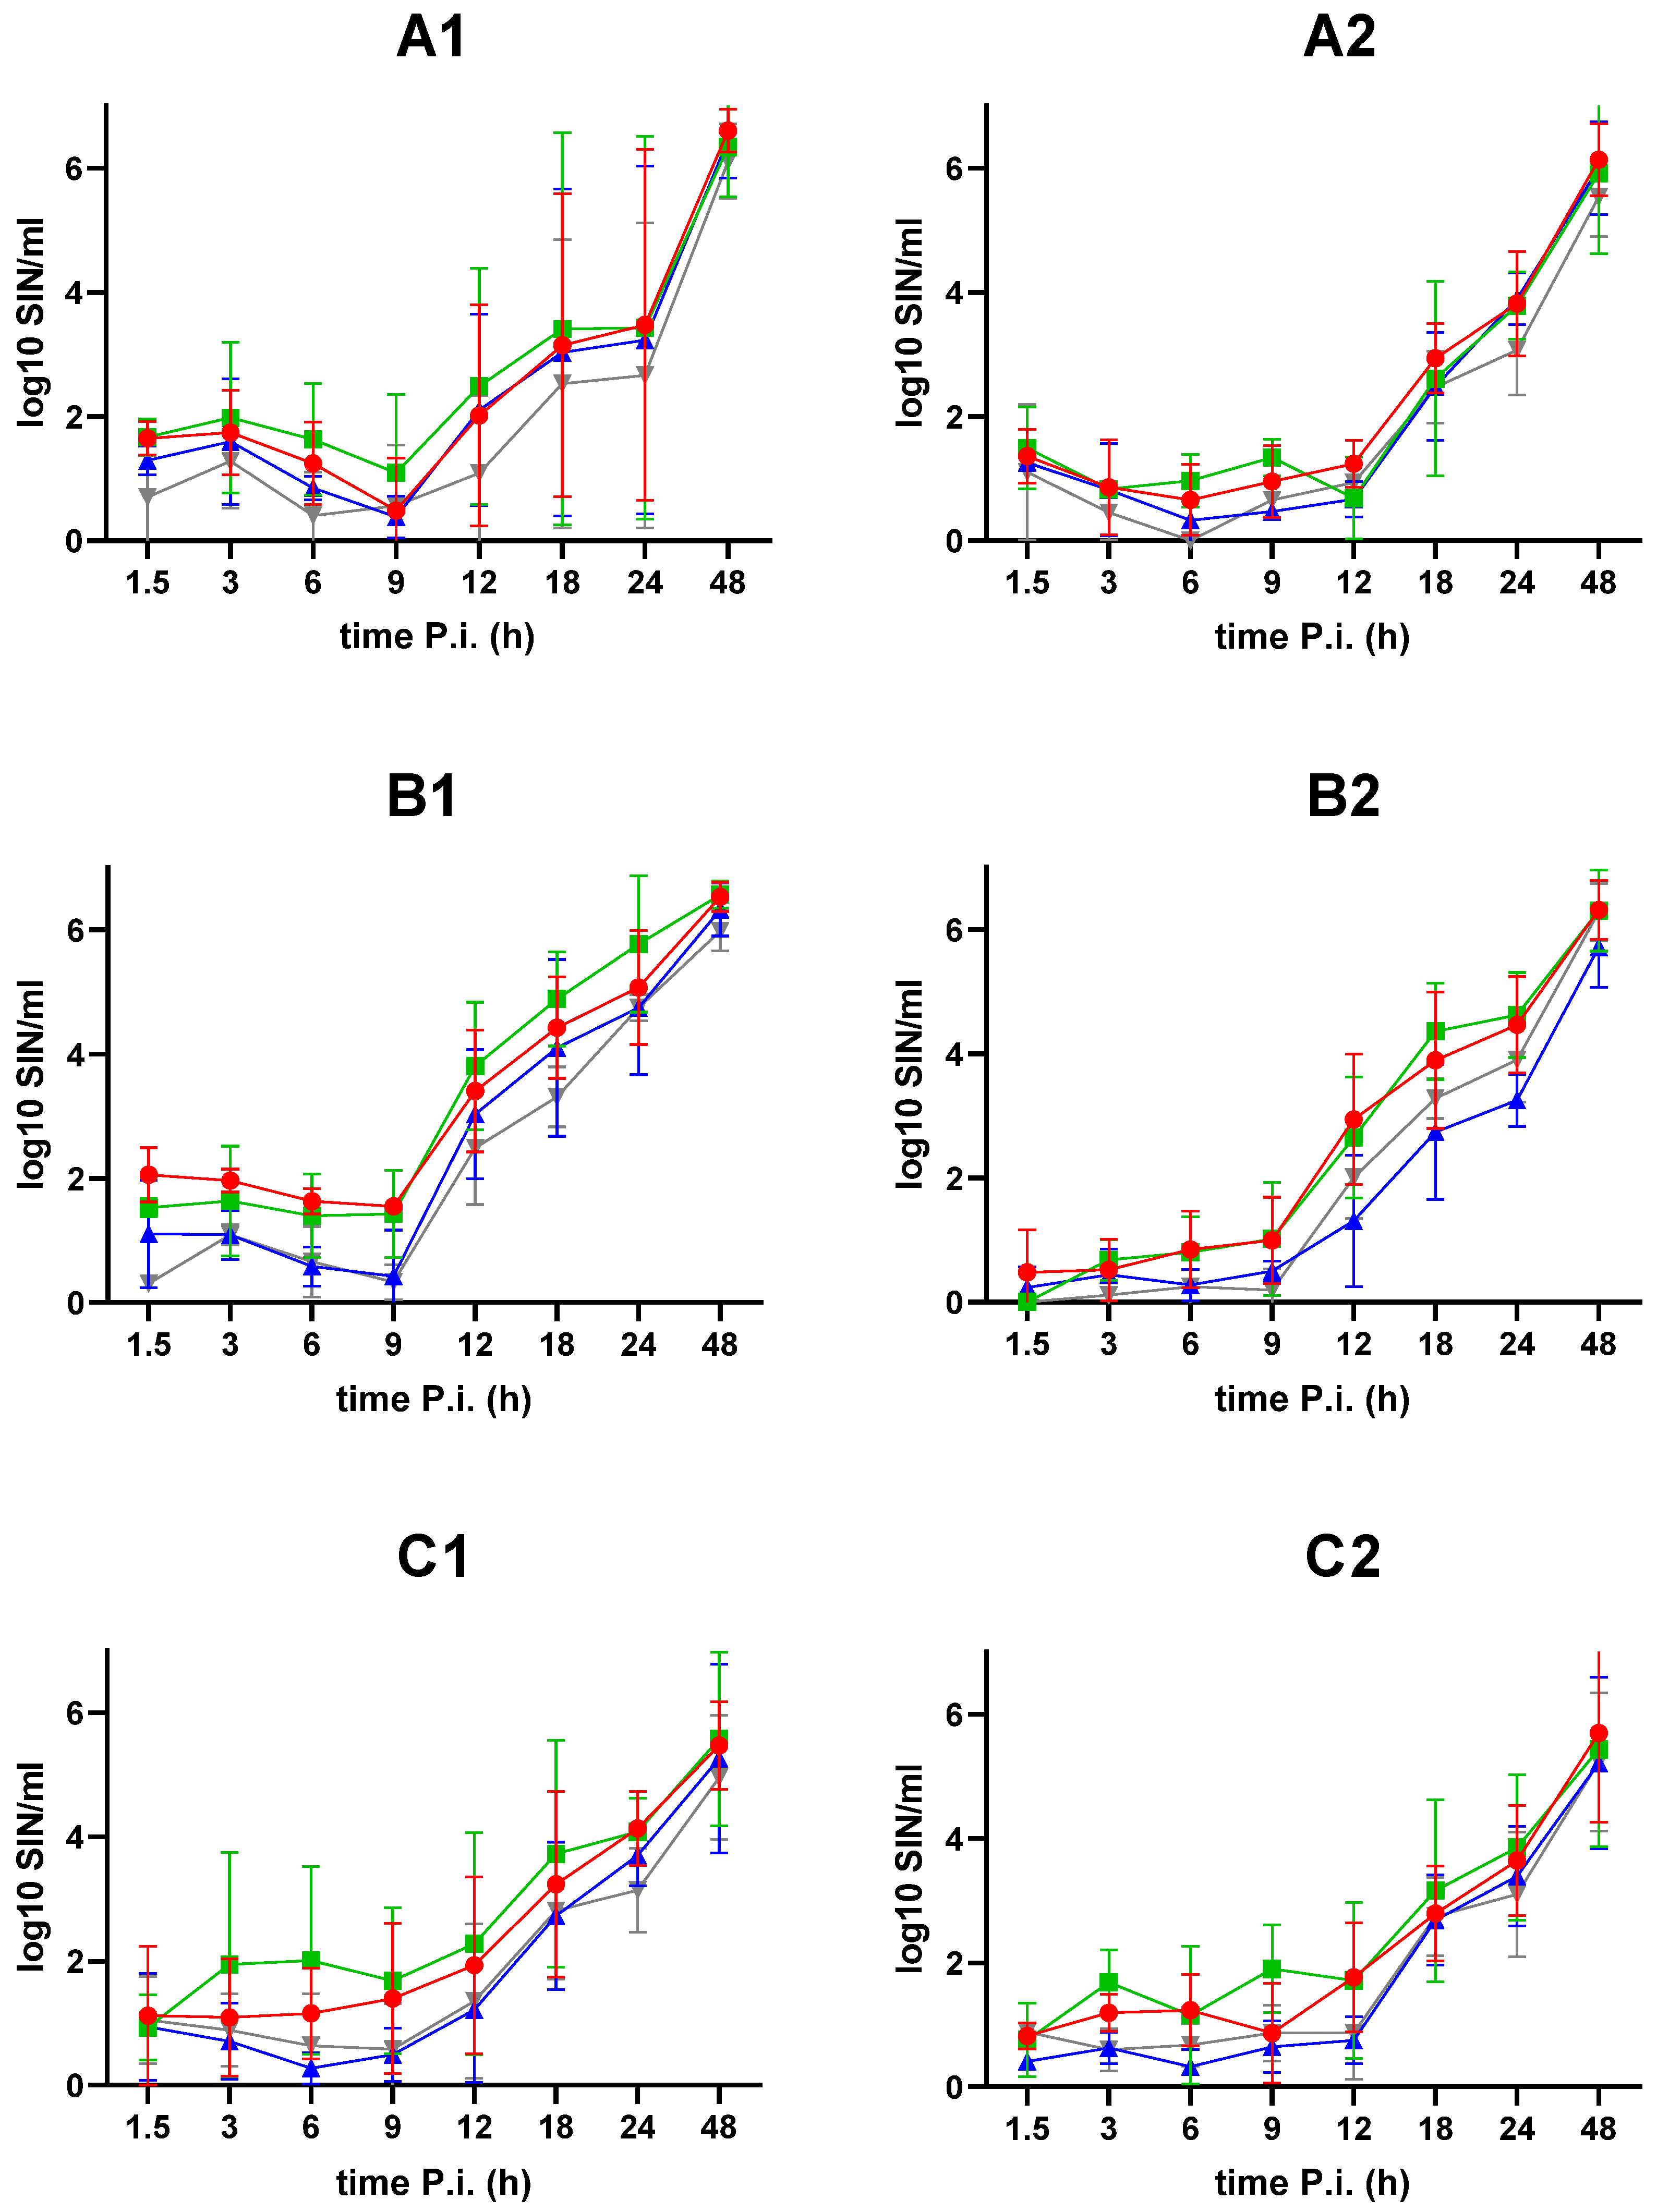
To follow replication of the different ASFV strains over time, the number of ASFV DNA copies in the cells and in supernatants was separately quantified by qPCR in cultures of PAMs, MDMs and spleen macrophages (Figure 1).
Samples were taken at 0, 1,5, 3, 6, 9, 12, 18, 24 and 48 hpi in the cultures of MDMs, PAMs and spleen macrophages. Replication was observed in all subpopulations of macrophages. Interestingly, different patterns of replication kinetics were seen between the different subpopulations of macrophages. In general, the two virulent strains (E70 and BE18) replicated better than the two attenuated strains (EST and NHV), which was most obvious in the intracellular and extracellular genomic copies of ASFV in the infected MDMs.
In PAMs, a biphasic replication kinetic was observed for the intracellular compartment, with a similar progression for all four strains. An increase in the number of intracellular DNA copies was observed simultaneously, starting from 6 hpi until 18 hpi. Between 18 and 24 hpi, the increase was interrupted by a plateau phase, which was marked with a decrease in the number of DNA copies between 18 hpi and 24 hpi for BE18, E70 and NHV. This plateau phase was followed by a steep increase between 24 hpi and 48 hpi. While individual kinetics differed slightly between the tested virus strains, all strains eventually reached similar DNA copy numbers at the end of the experiment.
In the supernatants of the PAM cultures, a decrease in DNA copies was observed between 1.5 hpi and 6 hpi. This decrease was followed by a continuous increase in DNA copy numbers starting from 6 hpi until the end of the experiment, with similar quantities for all strains tested. The onset of the increase coincided with the increase in DNA copy numbers in the intracellular compartment.
In MDMs, the increase in intracellular DNA copy numbers was marked by a steep increase observed between 6 and 9 hpi, followed by a more steady rise between 9 hpi and 24 hpi, after which all four strains rose to a similar copy number at 48 hpi. Over the full course of replication, both virulent strains presented a slightly higher number of intracellular genomic copies compared to both low-virulent strains, which resulted in significantly higher (p < 0.05) intracellular copy numbers for E70 (169.33 ± 30.05) compared to NHV (42.59 ± 30.72) and EST (23.93 ± 15.78).
In the supernatants of the MDMs, the pattern of replication of all four strains was comparable with the curve observed in the PAMs. Only in MDMs, the virulent strains displayed a slightly higher DNA copy number throughout the course of infection with a maximum 10-fold difference between E70 and NHV at 12 hpi.
In spleen macrophages, a rise in intracellular DNA copies was observed starting from 6 hpi, except for EST, where the onset of the rise was marked at 9 hpi. From 9 hpi onwards, all four strains presented a similar increase with small inter-strain variations to again reach a similar DNA copy number at 48 hpi.
For the DNA copy numbers in the spleen macrophage supernatants, a steady rise (three-fold increase) in DNA copy numbers was observed from 12 hpi until 24 hpi. Between 24 hpi and 48 hpi, a ten-fold increase in DNA copy numbers was measured.
The qPCR results show that all three subpopulations of macrophages could be productively infected by the four strains studied. For all three cell types, the DNA copy numbers showed a stagnation from 1.5 hpi until 6 hpi for the four strains in the intracellular copy numbers. Between these time points, a decrease in extracellular copy numbers for all four strains was observed. Between 6 hpi and 9 hpi, the intracellular ASFV copy numbers began to increase for all strains. For the PAMs however, replication was marked by an accentuated plateau phase of the intracellular DNA copy numbers between 18 hpi and 24 hpi, while a steady rise was observed in MDMs and spleen macrophages between these time points. Further, the onset of replication was comparable between the four strains, starting at 6 hpi. However, a steeper rise early in replication (between 6 hpi and 9 hpi) was observed in MDMs, compared to the PAMs and spleen macrophages.

3.3. Titration of Infectious Virus in Cells and Extracellular Supernatants

On the same samples that were analyzed for the number of DNA copies by qPCR, a titration for infectious virus was performed using IPT (Figure 2).
Samples were taken at 0, 1,5, 3, 6, 9, 12, 18, 24 and 48 hpi in the cultures of MDMs, PAMs and spleen macrophages. A productive infection of infectious virus was again observed in all three subpopulations of macrophages studied, in line with the qPCR results. Again, a slightly higher virus titer was found with the virulent strains compared to the attenuated strains.
In PAMs, the replication kinetics of all four strains show comparable figures. A decrease in titers of infectious virus is observed until 9 hpi, which marks the ending of the eclipse phase in this cell type. From 9 hpi until 18 hpi, the titers of infectious virus increased. Between 18 hpi and 24 hpi, the replication kinetics were marked by a stagnation in the production of infectious virus, followed by a steep increase in titers between 24 and 48 hpi to reach similar titers of infectious virus at the end of the experiment between the strains.
The titers of infectious virus in the supernatants of the PAMs were comparable between all strains throughout the full course of the experiment and started to increase at 12 hpi, followed by a continuous rise until the end of sampling.
In MDMs, an unequal starting titer between the strains could be observed at 1.5 hpi. NHV presented the lowest titer of infectious virus, followed by EST, E70 and BE18, respectively. A disparity in titers between the virulent strains BE18 and E70 on the one hand and EST and NHV on the other hand can be observed up to 9 hpi, with higher titers for both virulent strains. At this time point, the difference is maximum (4-fold difference). This time point marks the ending of the eclipse phase in this cell type, after which the titers of all strains start to increase to reach a similar titer at 48 hpi.
In the supernatants of MDMs, titers of infectious virus between the strains show similar patterns. The increase in infectious virus titers begins at 9 hpi and continues to rise throughout the sampling period, to end with comparable titers.
In spleen macrophages, a general rise in titers of intracellular infectious virus for all strains can be observed starting from 9 hpi, followed by slightly higher titers obtained by both virulent strains over the remaining course of this study. Ultimately, all four strains reached similar titers at 48 hpi
The titers of infectious virus in the supernatants of the spleen macrophages were comparable between all strains throughout the full course of the experiment and started to increase at 12 hpi, followed by a continuous rise until the end of sampling.
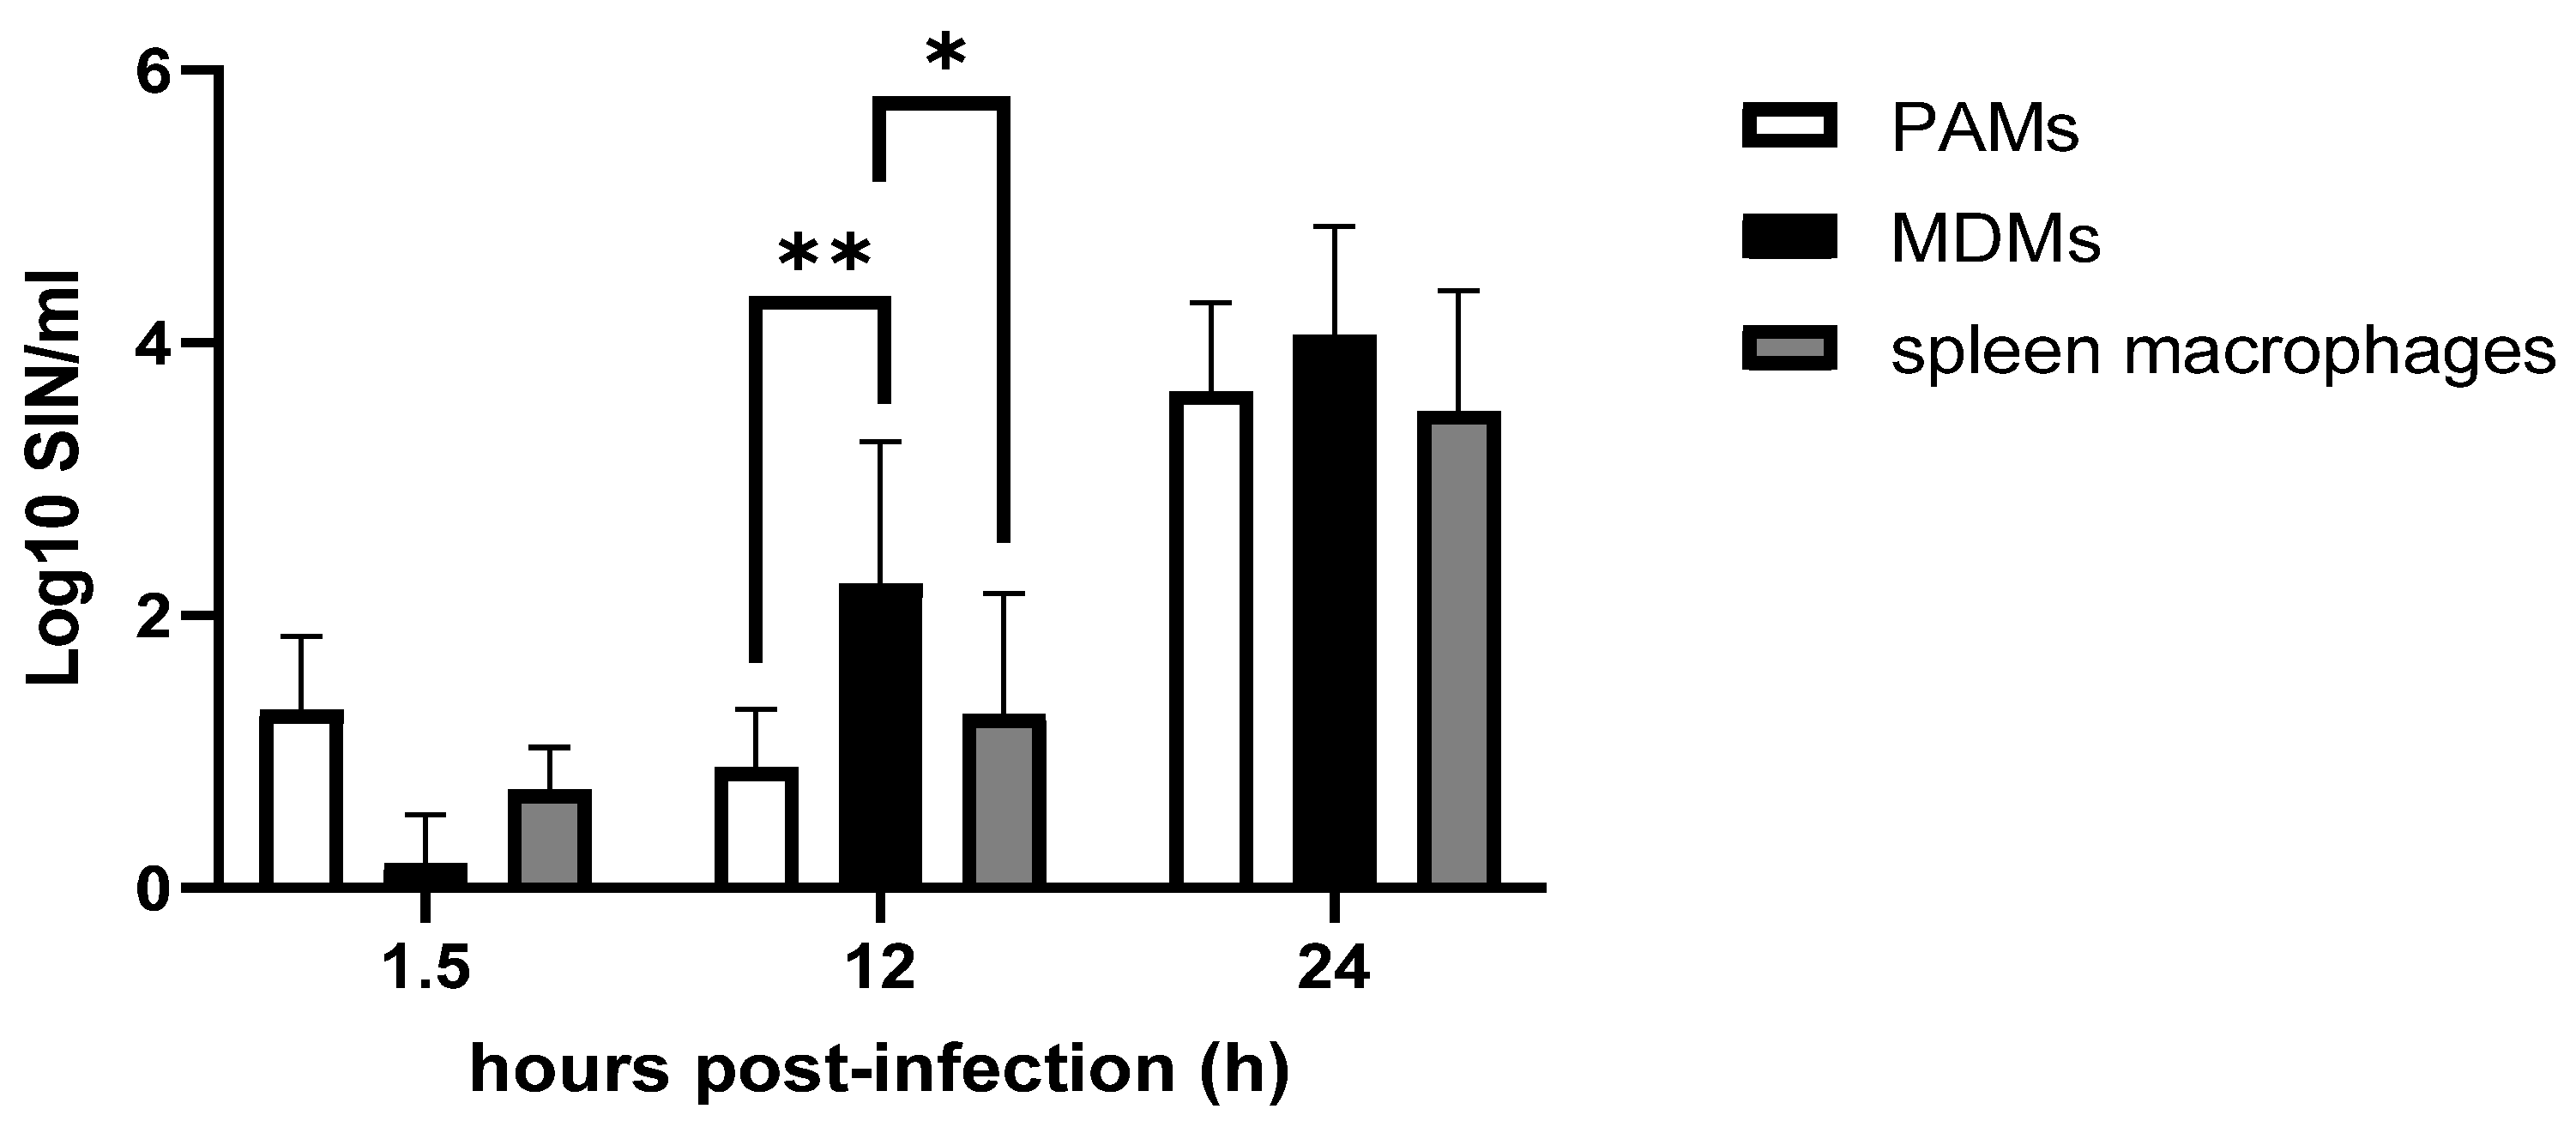
The titrations for infectious virus over the course of infection are in line with the results obtained by qPCR. The four strains presented similar replication kinetics, generally with slightly higher titers obtained by both virulent strains. Also, different patterns of replication between the cell types could be observed. In the intracellular fraction of the PAM cultures, the plateau phase between 18 hpi and 24 hpi observed by qPCR is in line with the plateau phase observed by IPT. In contrast to the PAMs, this plateau phase could not be observed in the intracellular viral titers of MDMs and spleen macrophages. In all cell types, the titers of intracellular infectious virus started to increase at 9 hpi, which generally marked the end of the eclipse phase for all four strains. However, a steeper rise early in replication (between 9 hpi and 12 hpi) was observed in MDMs, compared to the PAMs and spleen macrophages. Additionally, an earlier rise at 9 hpi in the titers of infectious virus in the supernatants of the MDMs was observed compared to the titers obtained in the PAMs and the spleen macrophages, which started to increase at 12 hpi. Although not statistically significant, a similar trend could be observed between the strains at the end of the first replication cycle (12 hpi), which is marked by virus release, leading to the rise of extracellular infectious virus. Here, titers of extracellular virus were higher in MDMs compared to PAMs and spleen macrophages (Supplementary Figure S2). This consequently leads to significantly higher mean titers of extracellular virus at 12 hpi in MDMs (2.23 ± 1.04) compared to PAMs (0.88 ± 0.43) (p < 0.01) and spleen macrophages (1.27 ± 0.89) (p < 0.05) (Figure 3).

3.4. Percentage of ASFV-Infected Cells

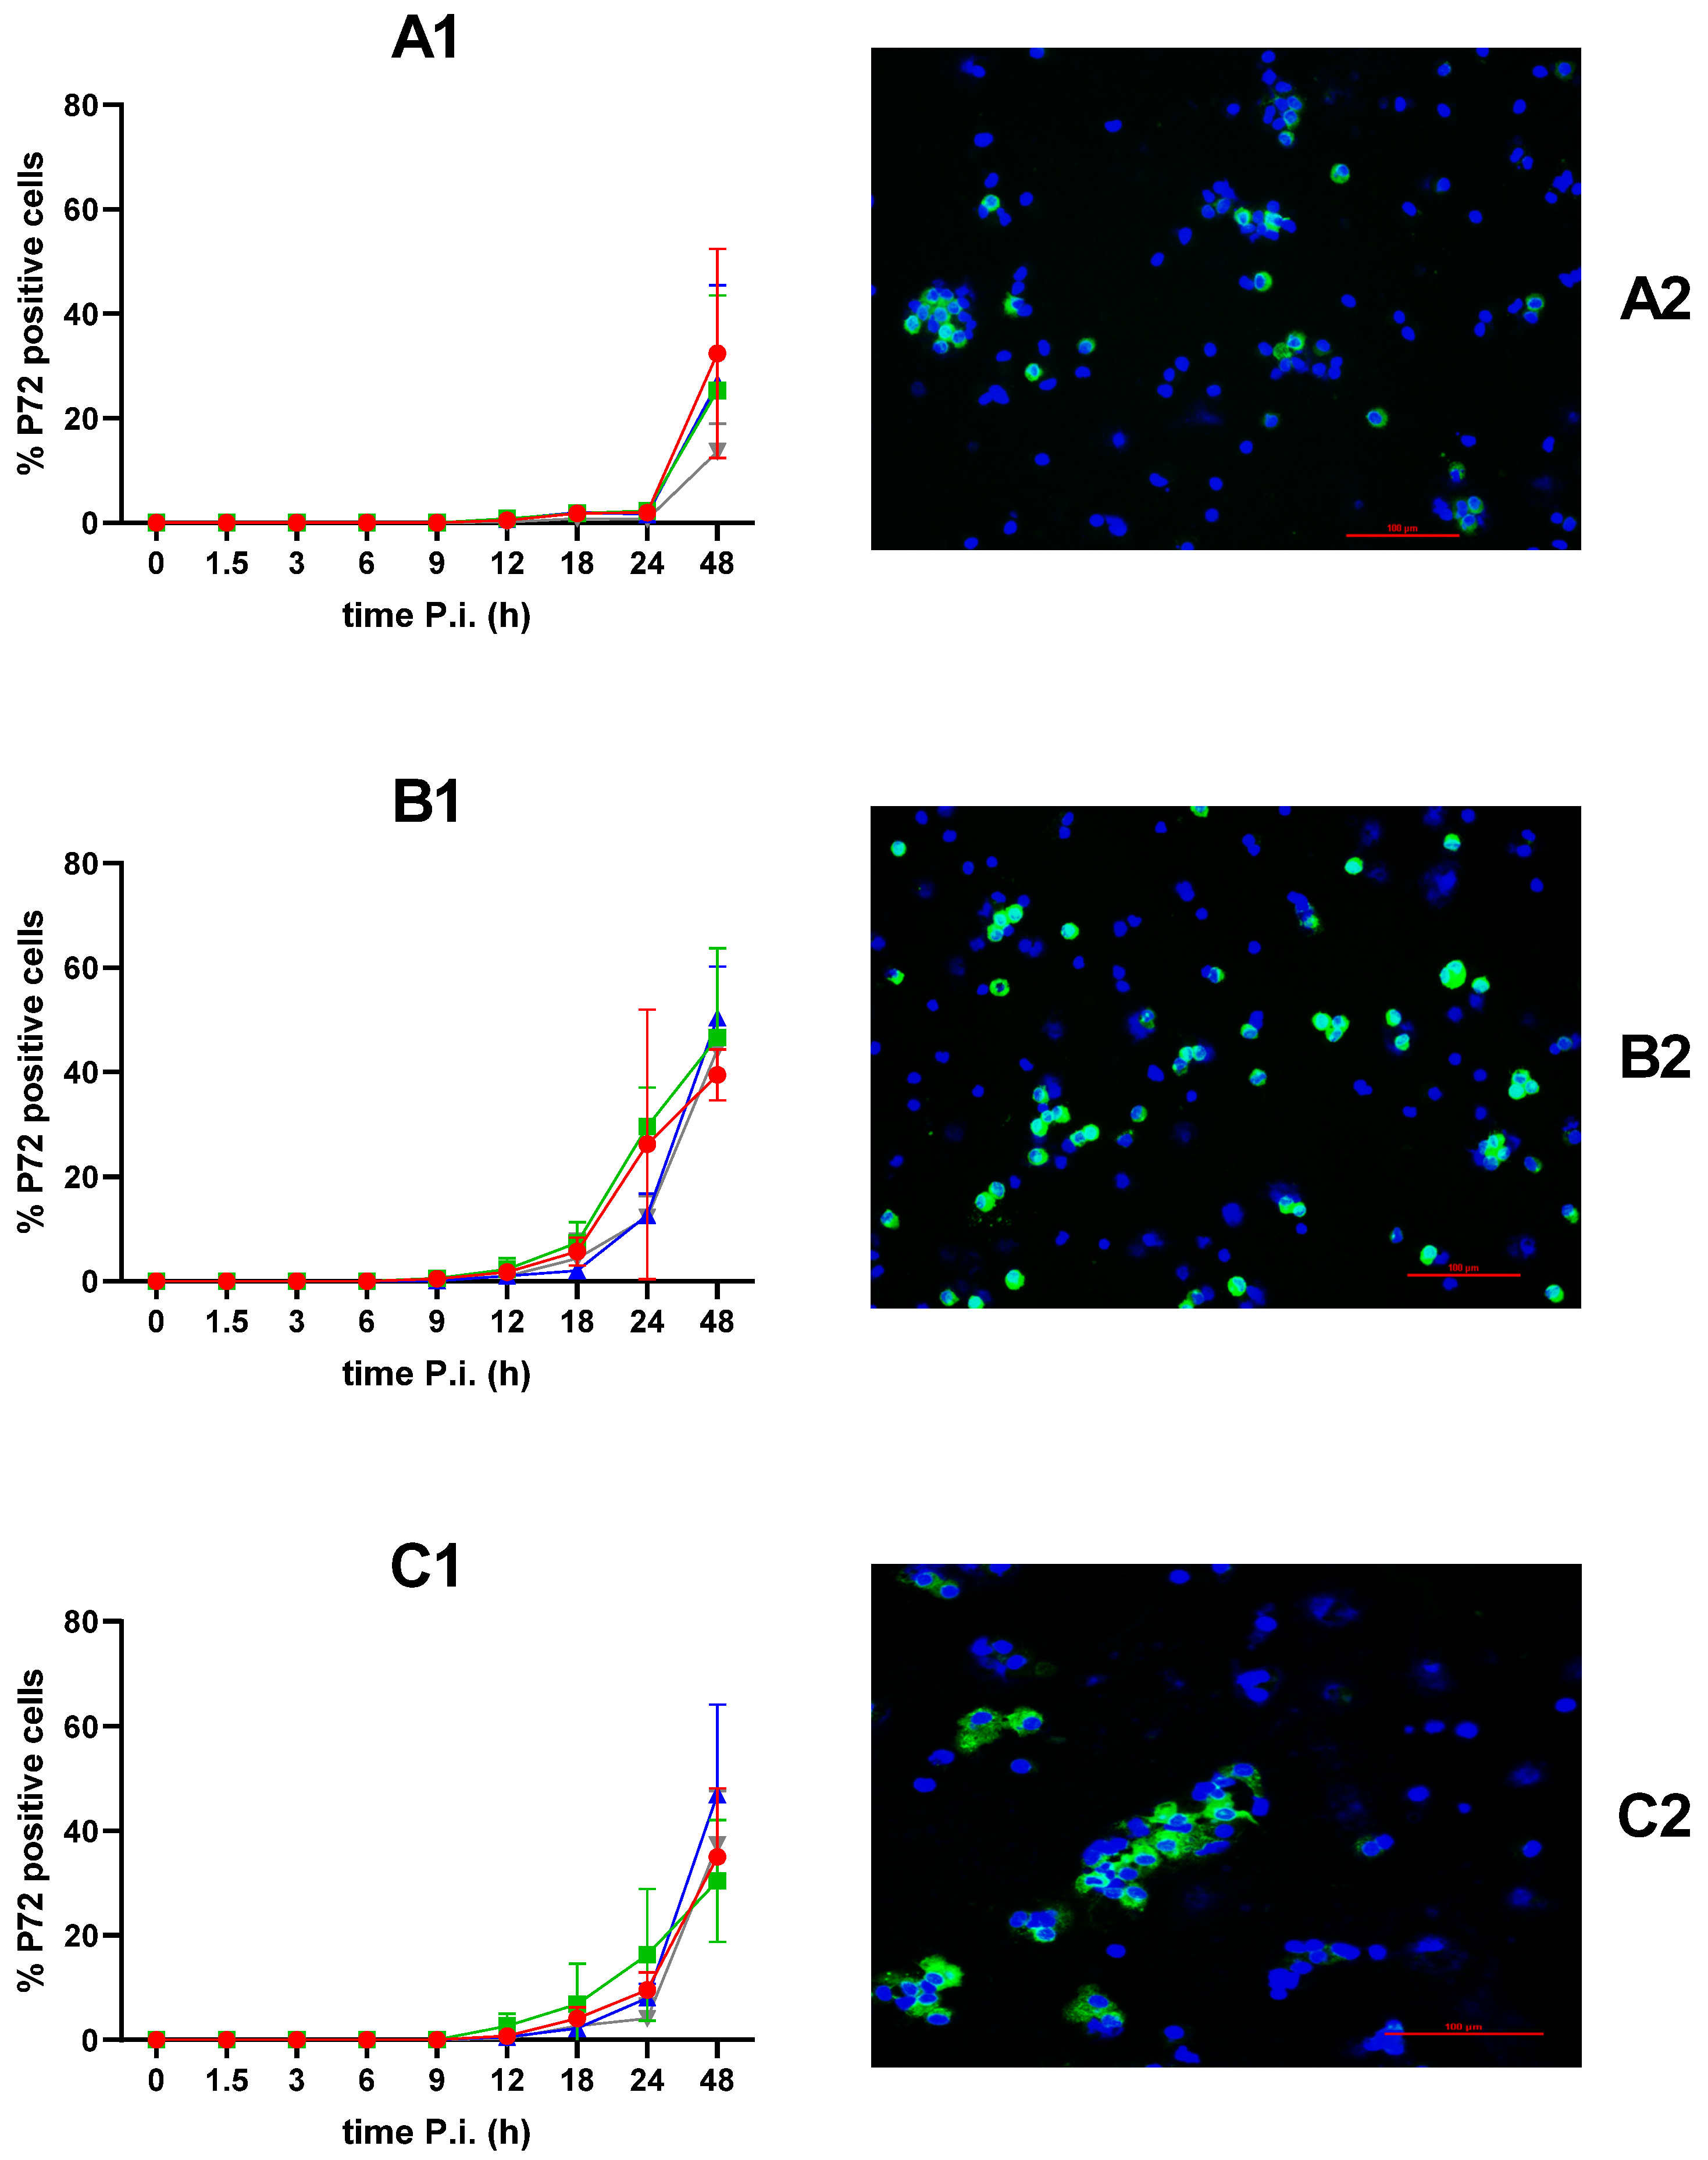
To quantify the percentage of infected cells over the course of infection, the cell cultures of PAMs, MDMs and spleen macrophages on 24-well plates were fixed at 0, 1.5, 3, 6, 9, 12, 18, 24 and 48 hpi and stained by immunofluorescence for the presence of nuclei and the viral P72 major capsid antigen (Figure 4). The P72-protein was located in the cytoplasm of productively infected cells.
In PAMs, the first infected cells were observed at 12 hpi. The percentage of infected cells remained quite similar at 18 and 24 hpi, after which it increased at 48 hpi. All strains represented similar numbers of infected cells, except NHV, which showed a lower number of infected cells at the end of the experiment compared to the other strains.
In MDMs, the first infected cells were detected at 9 hpi in all four strains. At 12 and 18 hpi, the increases in the percentages of infected cells were comparable between the strains. At 24 hpi, BE18 and E70 presented higher percentages of infected cells compared to EST and NHV, with a maximum difference between E70 and NHV, where E70 showed a two-fold higher percentage of infected cells. At 48 hpi, all four strains presented similar percentages of infected cells.
For the spleen macrophages, the first positive cells were observed at 12 hpi. Subsequently, an increase in the percentages of infected cells could be observed until the end of the experiment with minor inter-strain variations for the following time points.
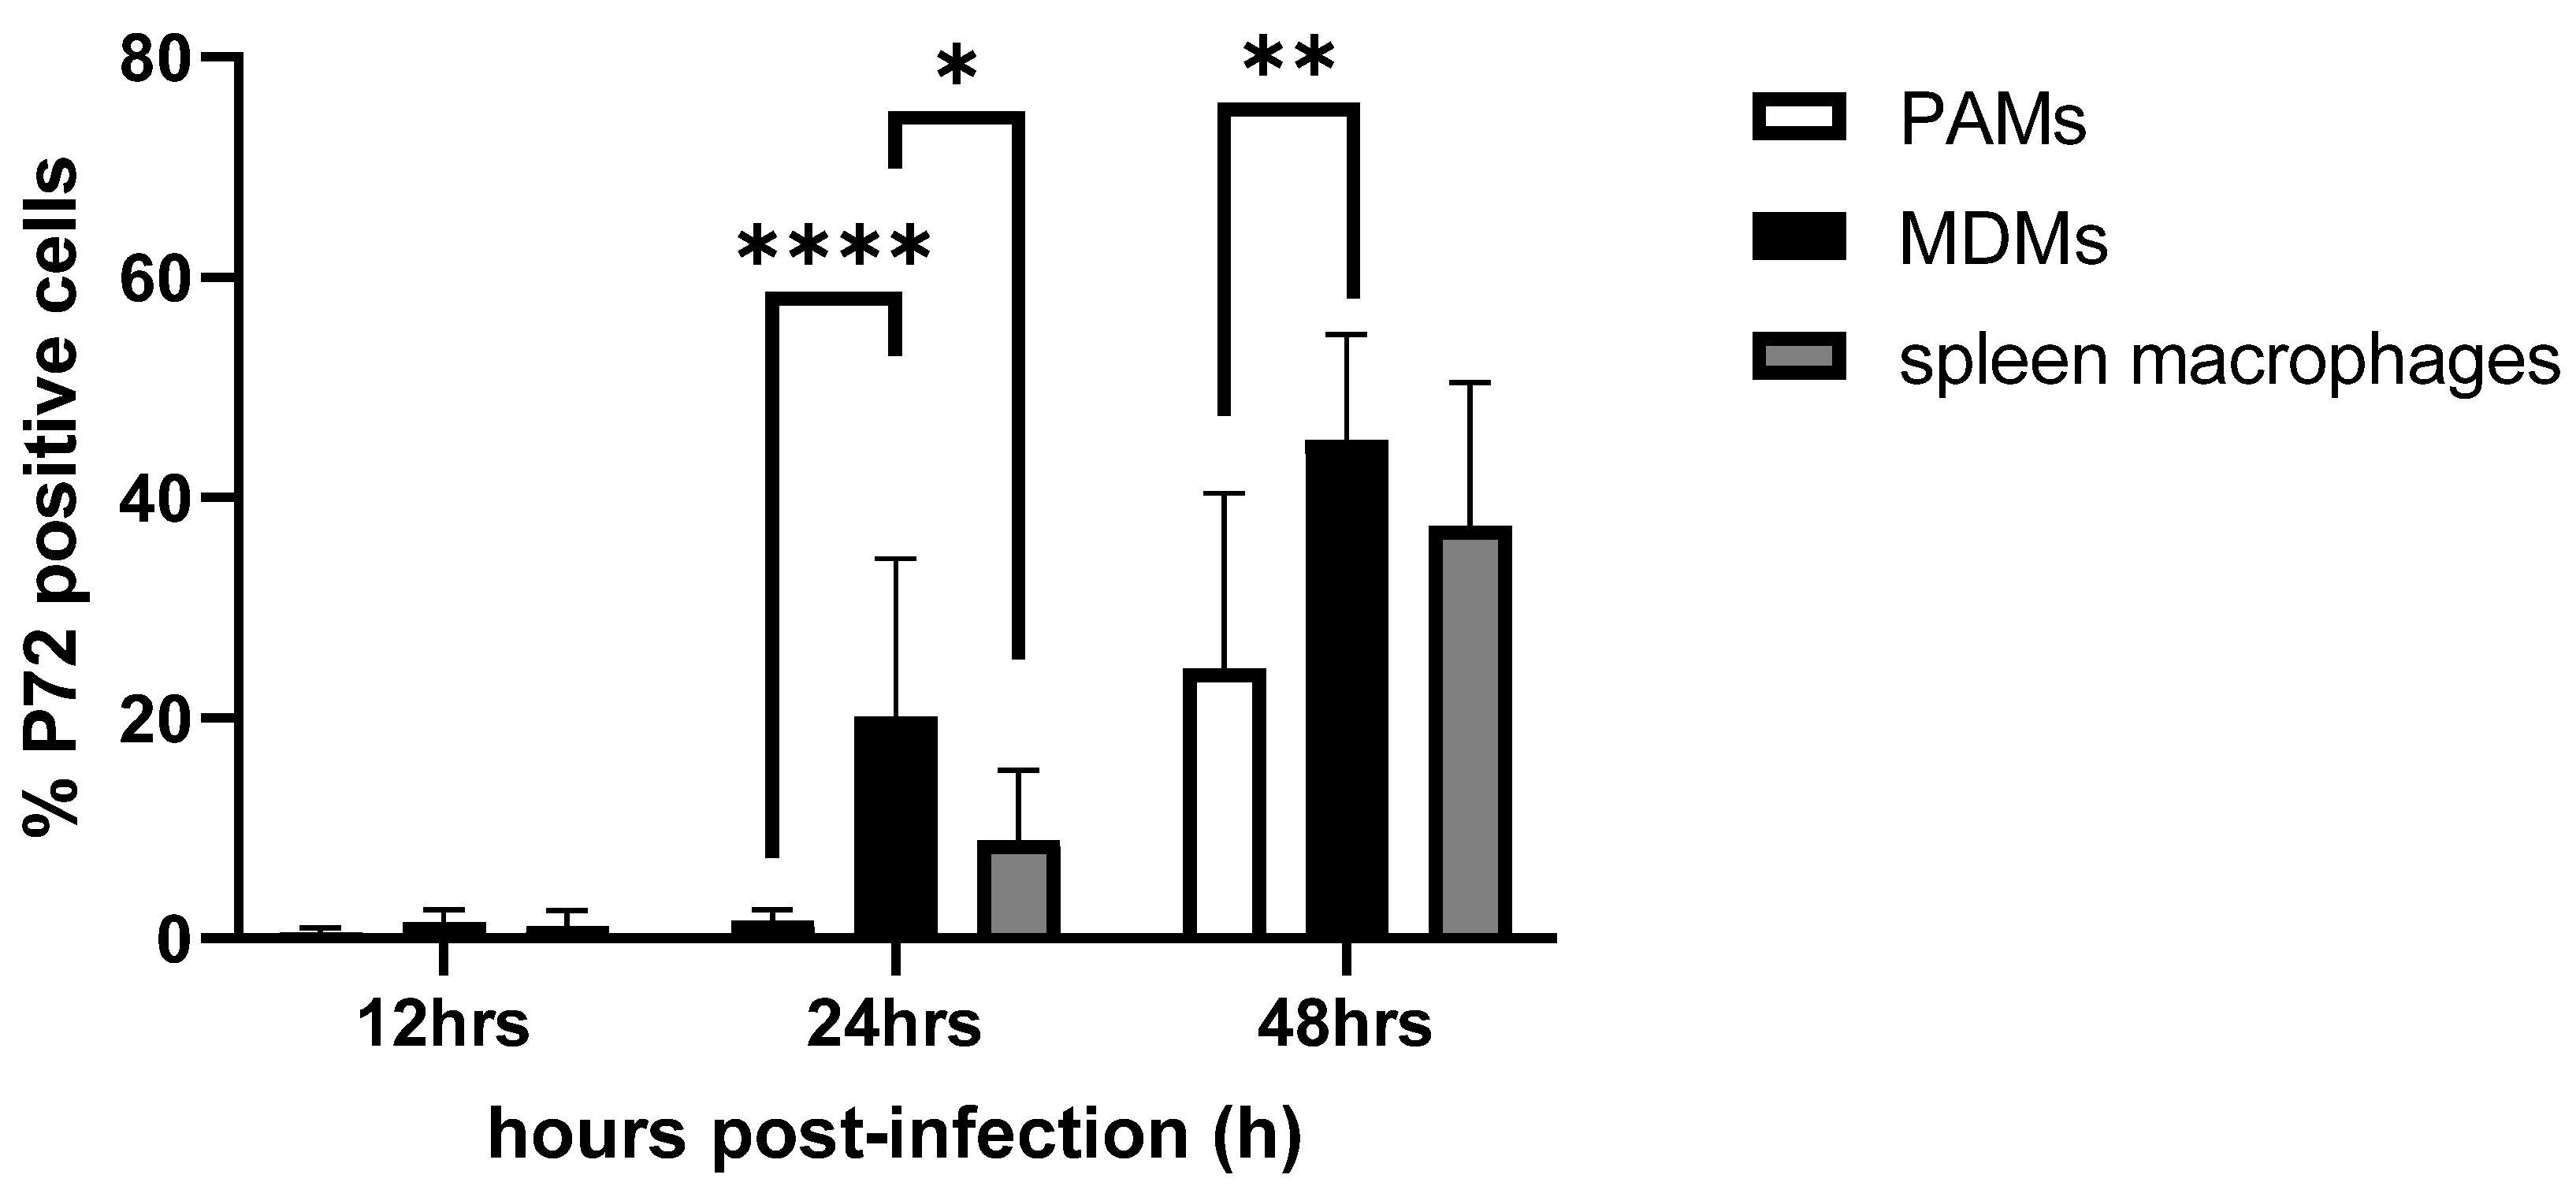
Contrary to the MDMs and spleen macrophages, PAMs are marked by a delay in the rise in the percentage of infected cells between 18 and 24 hpi. The earlier detection of ASFV-positive MDMs (9 hpi) compared to PAMs and spleen macrophages (12 hpi) potentially explains the earlier rise in infectious extracellular virus titers in MDMs (9–12 hpi) compared to PAMs and spleen macrophages (12–18 hpi). From 12 hpi onwards, P72-positive cells were present in all three cell types. From that point, the highest number of infected cells was consistently observed in MDMs across all four strains until the end of the experiment (Supplementary Figure S3). When the mean percentages of infected cells between the different cell types are compared at 24 hpi, significantly more MDMs (20.19 ± 14.30) compared to PAMs (1.64 ± 0.98) (p < 0.0001) and spleen macrophages (8.89 ± 6.38) (p < 0.05) were positive for the P72-protein. Further, when comparing the mean percentages of infected cells between the different cell types at the end of the experiment (48 hpi), ASFV replicated the best in MDMs (45.22 ± 9.64), followed by spleen macrophages (37.43 ± 13.00) and PAMs (24.50 ± 15.91), with significant differences (p < 0.01) between MDMs and PAMs (Figure 5).

4. Discussion

Currently, there is a scarcity of studies where the effect of ASFV virulence on virus replication is investigated in primary cell cultures. To our knowledge, the only data that exist compare the replication characteristics of ASFV between one primary cell type and different immortalized cell lines, or between different stimulation and/or maturation conditions [51,52].
Between 1.5 and 6 hpi, intracellular ASFV DNA copy numbers stagnated, suggesting that this period is required for ASFV attachment, internalization and uncoating before the viral genome is released in the cytoplasm. An increase in intracellular DNA copy numbers was observed starting at 6 hpi, while only notated around 9 hpi for the production of intracellular infectious virus. This indicates that the assembly of infectious particles occurs between 6 hpi and 9 hpi. This step is followed by a delayed release of virus particles between 12 and 18 hpi for PAMs and spleen macrophages. In MDMs, extracellular titers increased concomitantly with intracellular titers at 9 hpi, suggesting more efficient assembly and release mechanisms. Furthermore, P72-positive cells were already observed at 9 hpi in MDMs, whereas the first P72-positive PAMs and spleen macrophages were observed at 12 hpi, supporting this assumption. Together with the observations that MDMs produced more extracellular infectious particles and that more cells were infected compared to PAMs and spleen macrophages, we propose that MDMs are the best-suited cell type for ASFV replication.
In a study by Sanchez et al. (2017), the replication kinetics between virulent Genotype II Armenia/07, virulent genotype I E70 and the attenuated genotype I NHV were compared in established porcine cell lines and PAMs [55]. For the PAMs, similar replication kinetics between the strains were observed, with small inter-strain variations leading to equal titers of infectious virus at the end of sampling, which is in line with our observations between ASFV strains in PAMs.
Macrophages form a heterogeneous cell population displaying multiple functions and can be polarized into pro-inflammatory (M1) or anti-inflammatory (M2) activated macrophages by environmental factors during maturation in vitro [56]. Differentially polarized macrophages and also dendritic cells can be generated by the maturation of monocytes in the presence of different cytokines [56,57]. In a study by Franzoni et al. (2018), monocytes were isolated and treated with different cytokines to obtain MDMs after 4 days of cultivation and dendritic cells of two different phenotypes after 6 days of cultivation [38]. They compared replication kinetics in these cell types between the virulent genotype I 22653/14 strain, the attenuated genotype I NHV and an avirulent genotype I strain BA71V. The effects of the different maturation regimens impacted the susceptibility to ASFV infection differently between strains with different virulence. For the 4-day-old maturated monocytes, which are most comparable to the MDMs in our study, no statistical differences in replication kinetics could be measured between the virulent 22653/14 and NHV, which is comparable with our results with 3-day-old MDMs. In another study by Franzoni et al. (2020), the replication kinetics of the virulent ASFV 22653/14 and attenuated ASFV NHV were compared in vitro in three types of porcine monocyte-derived macrophages: classically (M1) or alternatively (M2) non-activated, and IFN-α-activated [37]. Again, different replication characteristics were observed between the strains, with altered replication kinetics for the ASFV variants between the cellular subpopulations. In the non-activated MDMs, a small but significant difference in titers of infectious virus (24 hpi) and number of positive cells (21 hpi) could be observed with higher values for NHV compared to the virulent 22653/14. At 48 hpi and 72 hpi, the titers of infectious virus for both strains were comparable, without statistical significance, which is in line with our observations of MDMs.
The studies of Franzoni et al. demonstrate the effect of maturation on the in vitro infectivity of ASFV strains with different levels of virulence [37,38]. Apart from the cytokines supplemented in the culture media to polarize monocytes during maturation, the maturation time itself also affects the ability of some viruses like PRRSV and ASFV to infect monocytes [58,59] and PAMs in the case of PRRSV [59]. Knowing this, it could be postulated that the differences in maturation time between the PAMs (24 h maturation) and the MDMs (72 h maturation) in our study may account for the distinct replication characteristics of ASFV observed among these macrophage subpopulations. In PAMs, we saw a plateau phase during virus replication (18–24 hpi), probably as a consequence of the lower percentages of infected PAMs compared to MDMs or spleen macrophages at these time points. Contrary to the PAMs, we observed an increase in intracellular infectious virus and viral DNA copies in MDMs and spleen macrophages between these time points. Next, an earlier onset of the rise in extracellular infectious virus (between 9–12 hpi) could be observed in the MDMs compared to the PAMs (between 12–18 hpi, respectively). These different characteristics of ASFV replication between PAMs on the one side and MDMs on the other side suggest a more privileged tropism for MDMs compared to PAMs, which is contrary to what other research groups state [53]. For this reason, we validated the effects of maturation time in PAMs and monocytes on the susceptibility to ASFV infection. The same methods as those described in the Section 2 were applied. PAMs from the same animals were used after storage in liquid nitrogen with the PAM medium supplemented with 10% DMSO (Sigma). The monocytes were isolated from three other animals with the same background and age as the animals used in the kinetic study, with methods identical to those described in the Section 2 (see Supplementary Results).
In a study by McCullough et al. (1999) [58], monocytes were maturated in the same medium for 2, 24, 48 or 72 h prior to infection with the virulent genotype X ASFV Kirawira strain TAN/Kwh12 [60]. At 24 hpi, cells were stained by immunofluorescence for the P72 antigen to determine the percentage of ASFV-infected cells. This study also reported the presence of monocyte–macrophages positive for the P72 antigen between 8 hpi and 12hpi. This is in line with our observations, confirming that cells positive for the P72 antigen are indeed virus-producing cells. In this study, the percentage of infected cells increased significantly with maturation times. We validated this study by repeating this experiment in our experimental conditions (Supplementary Figure S4). Monocytes were left to maturate for 24, 48 or 72 h prior to infection with BE18 (MOI = 0.01). At 24 hpi, supernatants were collected to determine the number of viral DNA copies by qPCR, and the cells were fixed to quantify the percentage of infected cells. Our results were in line with the results obtained by McCullough et al. (1999) [58]. We also observed an increasing number of ASFV-infected cells over maturation time (Supplementary Figure S4(A1)), but this result is balanced by an observed reduction in the total number of cells over incubation time (Supplementary Figure S4(B1)). Taken together, those observations explain the similar concentration of extracellular DNA copies produced in the different maturation conditions (Supplementary Figure S4(C1)). This allows us to establish that the increasing fraction of positive cells over maturation time is more a consequence of gradual cell loss rather than the increased susceptibility of these cells. This could explain the inconsistency observed between the percentage of infected cells and the concentration of DNA copies. Furthermore, the results of Wardley and Wilkinson (1978) [61] conflict with the results obtained by McCullough et al. (1999) [58]. In their study, they saw more infected monocytes compared to macrophages, but the monocytes underwent complete cell destruction within 3 days post-infection. This assumes that monocytes instead of mature macrophages are more susceptible to ASFV infection but are unable to maintain replication of the virus. This outcome of infected monocytes consequently leads to lower numbers of infected monocytes compared to infected macrophages over time of infection.
For PAMs, an effect of maturation on the susceptibility to virus infection was described for porcine reproductive and respiratory syndrome virus (PRRSV) [59]. PAMs were permissive for PRRSV infection, with a significant increase in their susceptibility after one day of cultivation, resulting in a ten-times more antigen-positive cells compared to freshly isolated infected cells. We verified the study conducted with PRRSV on ASFV-infected PAMs with different maturation times (24 or 48 h prior to infection). We quantified the percentage of ASFV-infected PAMs with BE18 (MOI = 0.01) at 24 hpi (Supplementary Figure S5). No significant difference in the number of infected PAMs was observed between both groups, which suggests no effect of in vitro maturation on the susceptibility for ASFV infection for PAMs.
Interestingly, from 24 hpi onwards, P72-positive PAMs appeared as plaques, with macrophages in close contact becoming positive (Supplementary Figure S6). This phenomenon where cells in close proximity are infected has also been observed in a previous in vitro infection study on explants of the nasal mucosa [62] and on lymphoid tissues and liver after experimental infection of domestic pigs [63]. This suggests that, from this time point on, a mechanism, distinct from receptor-mediated endocytosis, could contribute to the potential direct cell-to-cell spread of ASFV. Previous studies have shown that type I interferons can inhibit the replication of extracellular ASF virus via the induction of Interferon-Stimulated Gene (ISG) coding, e.g., for interferon-induced transmembrane proteins genes (IFITMs) [64,65,66,67,68]. Possibly type I interferons produced by the infected macrophages in our experiment block the entry of extracellular virus in the bystander PAMs. Recently, Gao et al. (2023) [69] demonstrated a new mechanism of ASFV cell-to-cell spread in PAMs by phagocytosis of apoptotic bodies containing intracellular virions. Additionally, the induction of apoptosis seems to take place starting from 20 hpi [70]. These apoptotic bodies could contribute to the second rise in virus progeny and number of infected PAMs between 24 and 48 hpi.
Other possible explanations for the different replication characteristics of ASFV in PAMs compared to MDMs could be the fact that PAMs display a gene expression profile typical of macrophages from embryonic origin rather than those derived from adult bone marrow monocytes [23], or that a different polarization of PAMs is induced by exposure to different endogenous and exogenous stimuli in the lungs compared to MDMs, originating from blood [22]. In both cases, this leads to phenotypically different cell subpopulations with different virus–cell interactions consequently [22,23].

5. Conclusions

Currently, primary culture systems for virus infection still offer the most advantages for biological and immunological in vitro studies since they mimic in vivo behavior better compared to cell lines [32]. For other porcine viruses, in vitro models with primary target cells can serve as a valuable tool to represent the differences in pathogenicity or virulence observed between field isolates in vivo [71,72,73]. We questioned whether this correlation could also be applied to ASFV. To our knowledge, there is a lack of existing data on the replication characteristics of field isolates with different virulence on primary macrophages derived from multiple tissues. For this reason, we isolated the primary target cells for ASFV involved early during pathogenesis and productively infected them with field isolates known to have a different virulence level in vivo. By using a relatively low MOI (0.01), our cell culture models allowed us to compare multistep growth curves of ASFV in three subpopulations of primary macrophages. Contrary to studies with other porcine viruses like PRRSV and porcine Pseudorabies virus, the strains of ASFV with differences in virulence in our study presented generally similar replication characteristics in all subpopulations of primary macrophages studied. Our results were in line with other in vitro studies where replication kinetics of strains of ASFV with different virulence were compared simultaneously in PAMs and cell lines or differentially maturated monocytes [35,36,54]. Interestingly, different growth characteristics of ASFV were observed between the studied macrophage subpopulations. ASFV-positive cells could be detected earlier after infection in MDMs (9 hpi) compared to PAMs and spleen macrophages (12 hpi), which consequently caused an earlier rise in extracellular viral titers. Ultimately, more MDMs were infected at the end of this study compared to PAMs and spleen macrophages. These characteristics highlight MDMs as the most suitable cell type to study ASFV–cell interactions in vitro. These differences hint at different dynamics and pathways of cell-to-cell transmission of ASFV, for which more in-depth research in ASFV–cell interactions will be needed to further increase our understanding of these matters.

Supplementary Materials

The following supporting information can be downloaded at: https://www.mdpi.com/article/10.3390/microbiolres15030112/s1, Figure S1: Representative immunofluorescence (IF) staining pictures of PAMs, MDMs and spleen macrophages visualized with a 40× objective. The fraction of CD163-positive macrophages (±SD) was determined by IF staining. The nuclei were visualized with Hoechst (blue), and the CD163 receptor was revealed by indirect antibody staining with FITC (green); Figure S2: Infectious virus titers in the supernatant from infected cells at 1.5, 12, and 24 h post-infection with BE18, E70, Est and NHV. The supernatants from the infected PAMs (white), MDMs (black), and spleen macrophages (grey) were collected after separation from the cells. The infectious virus titers were assessed by an IPT. For all four strains analyzed individually, the extracellular titers in MDMs were higher, but not significantly, at 12 hpi compared to those of PAMs and spleen macrophages. However, the mean titer at 12 hpi in MDMs was significantly higher compared to PAMs and spleen macrophages; Figure S3: Comparison of the percentage ASFV-infected PAMs (white), MDMs (black) and spleen macrophages (grey), quantified through immunofluorescence staining. From 12 hpi onwards, MDMs exhibited the highest numbers of infected cells consistently across all four strains until the end of the experiment. Next, the mean percentages of infected cells among the different cell types were compared. At 24 hpi, significantly more MDMs were positive for the P72-protein compared to PAMs and spleen macrophages. Furthermore, at 48 hpi, more ASFV-infected cells were observed in MDMs, followed by spleen macrophages and PAMs, with significant differences between MDMs and PAMs; Figure S4: Effect of maturation duration (24, 48, 72 h) of monocytes on ASFV infectivity; Figure S5: Effect of maturation duration (24, 48 h) on cultures of PAM’s and ASF infectivity expressed as percentage of P72-positive cells on the total number of cells; Figure S6: representative IF picture of PAM’s visualized by nuclear staining (blue) infected with ASFV BE18, 48 hpi, visualized by staining of the viral P72 antigen (FITC) with a 20× objective.

Author Contributions

Conceptualization, B.D., N.B., M.T., H.J.N. and A.B.C.; methodology, B.D., N.B., M.T. and H.J.N.; validation, B.D., N.B., M.T. and H.J.N.; formal analysis, B.D.; investigation, B.D.; resources, B.D., M.T., H.J.N. and A.B.C.; data curation, B.D.; writing—original draft preparation, B.D.; writing—review and editing, B.D., M.T., H.J.N., S.H. and D.O.; visualization, B.D., M.T. and H.J.N.; supervision, B.D., M.T., N.B. and H.J.N. project administration, M.T.; funding acquisition, M.T., H.J.N. and A.B.C. All authors have read and agreed to the published version of the manuscript.

Funding

This research was funded by the Belgian Federal Public Service Health, Food Chain Safety, and Environment (FOD), grant number RF 20/6341 ASFIMMUNE.

Institutional Review Board Statement

Euthanasia of animals was performed following the procedure approved by the Sciensano ethical committee under reference number 20200604-01.

Informed Consent Statement

Not applicable.

Data Availability Statement

The data presented in this study are available on request from the corresponding author. The data are not publicly available due to privacy reasons.

Acknowledgments

We would like to express our gratitude to the lab technicians Ondina Falcones and Susana Soares Martins for their indispensable contributions in this study.

Conflicts of Interest

The authors declare no conflicts of interest.

References

  1. Tulman, E.R.; Delhon, G.A.; Ku, B.K.; Rock, D.L. African Swine Fever Virus. In Lesser Known Large dsDNA Viruses; Van Etten, J.L., Ed.; Springer: Berlin/Heidelberg, Germany, 2009; pp. 43–87. [Google Scholar]
  2. Licoppe, A.; De Waele, V.; Malengreaux, C.; Paternostre, J.; Van Goethem, A.; Desmecht, D.; Herman, M.; Linden, A. Management of a Focal Introduction of ASF Virus in Wild Boar: The Belgian Experience. Pathogens 2023, 12, 152. [Google Scholar] [CrossRef] [PubMed]
  3. Sauter-Louis, C.; Conraths, F.J.; Probst, C.; Blohm, U.; Schulz, K.; Sehl, J.; Fischer, M.; Forth, J.H.; Zani, L.; Depner, K.; et al. African Swine Fever in Wild Boar in Europe—A Review. Viruses 2021, 13, 1717. [Google Scholar] [CrossRef]
  4. Busch, F.; Haumont, C.; Penrith, M.L.; Laddomada, A.; Dietze, K.; Globig, A.; Guberti, V.; Zani, L.; Depner, K. Evidence-Based African Swine Fever Policies: Do We Address Virus and Host Adequately? Front. Vet. Sci. 2021, 8, 637487. [Google Scholar] [CrossRef] [PubMed]
  5. Qu, H.; Ge, S.; Zhang, Y.; Wu, X.; Wang, Z. A Systematic Review of Genotypes and Serogroups of African Swine Fever Virus. Virus Genes 2022, 58, 77–87. [Google Scholar] [CrossRef]
  6. Spinard, E.; Dinhobl, M.; Tesler, N.; Birtley, H.; Signore, A.V.; Ambagala, A.; Masembe, C.; Borca, M.V.; Gladue, D.P. A Re-Evaluation of African Swine Fever Genotypes Based on P72 Sequences Reveals the Existence of Only Six Distinct P72 Groups. Viruses 2023, 15, 2246. [Google Scholar] [CrossRef]
  7. Eustace Montgomery, R. On A Form of Swine Fever Occurring in British East Africa (Kenya Colony). J. Comp. Pathol. Ther. 1921, 34, 159–191. [Google Scholar] [CrossRef]
  8. Penrith, M.L.; Vosloo, W. Review of African Swine Fever: Transmission, Spread and Control: Review Article. J. S. Afr. Vet. Assoc. 2009, 80, 58–62. [Google Scholar] [CrossRef] [PubMed]
  9. Sánchez, C. La peste porcine africaine: Nouveaux développements. Rev. Sci. Tech. Off. Int. Epiz. 1982, 1, 1031–1064. [Google Scholar]
  10. Sánchez-Vizcaíno, J.M.; Mur, L.; Gomez-Villamandos, J.C.; Carrasco, L. An Update on the Epidemiology and Pathology of African Swine Fever. J. Comp. Pathol. 2015, 152, 9–21. [Google Scholar] [CrossRef]
  11. Mur, L.; Atzeni, M.; Martínez-López, B.; Feliziani, F.; Rolesu, S.; Sanchez-Vizcaino, J.M. Thirty-Five-Year Presence of African Swine Fever in Sardinia: History, Evolution and Risk Factors for Disease Maintenance. Transbound. Emerg. Dis. 2016, 63, e165–e177. [Google Scholar] [CrossRef]
  12. Costard, S.; Mur, L.; Lubroth, J.; Sanchez-Vizcaino, J.M.; Pfeiffer, D.U. Epidemiology of African Swine Fever Virus. Virus Res. 2013, 173, 191–197. [Google Scholar] [CrossRef]
  13. Beltran-Alcrudo, D.; Lubroth, J.; Depner, K.; De La Rocque, S. African Swine Fever in the Caucasus. Unpublished Work, 2008. Available online: https://openknowledge.fao.org/server/api/core/bitstreams/155da05d-9c7b-4b5b-8428-3fd782dbdfa2/content (accessed on 20 July 2024).
  14. Beltran-Alcrudo, D.; Guberti, V.; Simone, L.D.; DeCastro, J.; Rozstalnyy, A.; Dietze, K.; Wainwright, S.; Slingenbergh, J. African Swine Fever Spread in the Russian Federation and the Risk for the Region. Unpublished Work, 2009. Available online: https://asf-referencelab.info/asf/images/ficherosasf/FAO_2009.pdf (accessed on 20 July 2024).
  15. Oganesyan, A.S. African Swine Fever in the Russian Federation: Spatio-Temporal Analysis and Epidemiological Overview. Virus Res. 2013, 173, 204–211. [Google Scholar] [CrossRef]
  16. Schulz, K.; Oļševskis, E.; Viltrop, A.; Masiulis, M.; Staubach, C.; Nurmoja, I.; Lamberga, K.; Seržants, M.; Malakauskas, A.; Conraths, F.J.; et al. Eight Years of African Swine Fever in the Baltic States: Epidemiological Reflections. Pathogens 2022, 11, 711. [Google Scholar] [CrossRef]
  17. Giudici, S.D.; Loi, F.; Ghisu, S.; Angioi, P.P.; Zinellu, S.; Fiori, M.S.; Carusillo, F.; Brundu, D.; Franzoni, G.; Zidda, G.M.; et al. The Long-Jumping of African Swine Fever: First Genotype II Notified in Sardinia, Italy. Viruses 2024, 16, 32. [Google Scholar] [CrossRef] [PubMed]
  18. Pavone, S.; Iscaro, C.; Dettori, A.; Feliziani, F. African Swine Fever: The State of the Art in Italy. Animals 2023, 13, 2998. [Google Scholar] [CrossRef] [PubMed]
  19. Zhao, D.; Sun, E.; Huang, L.; Ding, L.; Zhu, Y.; Zhang, J.; Shen, D.; Zhang, X.; Zhang, Z.; Ren, T.; et al. Highly Lethal Genotype I and II Recombinant African Swine Fever Viruses Detected in Pigs. Nat. Commun. 2023, 14, 3096. [Google Scholar] [CrossRef]
  20. Blome, S.; Gabriel, C.; Beer, M. Pathogenesis of African Swine Fever in Domestic Pigs and European Wild Boar. Virus Res. 2013, 173, 122–130. [Google Scholar] [CrossRef] [PubMed]
  21. Sánchez-Cordón, P.J.; Vidaña, B.; Neimanis, A.; Núñez, A.; Wikström, E.; Gavier-Widén, D. 4. Pathology of African Swine Fever. In Understanding and Combatting African Swine Fever; Iacolina, L., Penrith, M.L., Bellini, S., Chenais, E., Jori, F., Montoya, M., Ståhl, K., Gavier-Widén, D., Eds.; Wageningen Academic Publishers: Wageningen, The Netherlands, 2021; pp. 87–139. [Google Scholar]
  22. Wculek, S.K.; Dunphy, G.; Heras-Murillo, I.; Mastrangelo, A.; Sancho, D. Metabolism of Tissue Macrophages in Homeostasis and Pathology. Cell. Mol. Immunol. 2022, 19, 384–408. [Google Scholar] [CrossRef] [PubMed]
  23. Álvarez, B.; Revilla, C.; Poderoso, T.; Ezquerra, A.; Domínguez, J. Porcine Macrophage Markers and Populations: An Update. Cells 2023, 12, 2103. [Google Scholar] [CrossRef]
  24. Colgrove, G.S.; Haelterman, E.O.; Coggins, L. Pathogenesis of African Swine Fever in Young Pigs. Am. J. Vet. Res. 1969, 30, 1343–1359. [Google Scholar]
  25. Plowright, W.; Parker, J.; Staple, R.F. The Growth of a Virulent Strain of African Swine Fever Virus in Domestic Pigs. J. Hyg. 1968, 66, 117–134. [Google Scholar] [CrossRef] [PubMed]
  26. Greig, A. Pathogenesis of African Swine Fever in Pigs Naturally Exposed to the Disease. J. Comp. Pathol. 1972, 82, 73–79. [Google Scholar] [CrossRef]
  27. Wilkinson, P.J.; Donaldson, A.I.; Greig, A.; Bruce, W. Transmission Studies with African Swine Fever Virus: Infections of Pigs by Airborne Virus. J. Comp. Pathol. 1977, 87, 487–495. [Google Scholar] [CrossRef] [PubMed]
  28. Gómez-Villamandos, J.C.; Bautista, M.J.; Sánchez-Cordón, P.J.; Carrasco, L. Pathology of African Swine Fever: The Role of Monocyte-Macrophage. Virus Res. 2013, 173, 140–149. [Google Scholar] [CrossRef]
  29. Carrascosa, A.L.; Bustos, M.J.; de Leon, P. Methods for Growing and Titrating African Swine Fever Virus: Field and Laboratory Samples. Curr. Protoc. Cell Biol. 2011, 53, 26.14.1–26.14.25. [Google Scholar] [CrossRef] [PubMed]
  30. de León, P.; Bustos, M.J.; Carrascosa, A.L. Laboratory Methods to Study African Swine Fever Virus. Virus Res. 2013, 173, 168–179. [Google Scholar] [CrossRef]
  31. African Swine Fever Virus: Methods and Protocols; Netherton, C.L. (Ed.) Methods in Molecular Biology; Springer: New York, NY, USA, 2022; Volume 2503. [Google Scholar]
  32. Gao, Y.; Xia, T.; Bai, J.; Zhang, L.; Jiang, X.; Yang, X.; Zhang, K.; Jiang, P. African Swine Fever Virus Exhibits Distinct Replication Defects in Different Cell Types. Viruses 2022, 14, 2642. [Google Scholar] [CrossRef]
  33. Krug, P.W.; Holinka, L.G.; O’Donnell, V.; Reese, B.; Sanford, B.; Fernandez-Sainz, I.; Gladue, D.P.; Arzt, J.; Rodriguez, L.; Risatti, G.R.; et al. The Progressive Adaptation of a Georgian Isolate of African Swine Fever Virus to Vero Cells Leads to a Gradual Attenuation of Virulence in Swine Corresponding to Major Modifications of the Viral Genome. J. Virol. 2015, 89, 2324–2332. [Google Scholar] [CrossRef] [PubMed]
  34. Meloni, D.; Franzoni, G.; Oggiano, A. Cell Lines for the Development of African Swine Fever Virus Vaccine Candidates: An Update. Vaccines 2022, 10, 707. [Google Scholar] [CrossRef]
  35. Borca, M.V.; O’Donnell, V.; Holinka, L.G.; Risatti, G.R.; Ramirez-Medina, E.; Vuono, E.A.; Shi, J.; Pruitt, S.; Rai, A.; Silva, E.; et al. Deletion of CD2-like Gene from the Genome of African Swine Fever Virus Strain Georgia Does Not Attenuate Virulence in Swine. Sci. Rep. 2020, 10, 494. [Google Scholar] [CrossRef]
  36. Kholod, N.; Koltsov, A.; Krutko, S.; Tulman, E.R.; Namsrayn, S.; Kutish, G.F.; Belov, S.; Korotin, A.; Sukher, M.; Koltsova, G. Comparison of Attenuated and Virulent Strains of African Swine Fever Virus Genotype I and Serogroup 2. Viruses 2023, 15, 1373. [Google Scholar] [CrossRef] [PubMed]
  37. Franzoni, G.; Graham, S.P.; Giudici, S.D.; Bonelli, P.; Pilo, G.; Anfossi, A.G.; Pittau, M.; Nicolussi, P.S.; Laddomada, A.; Oggiano, A. Characterization of the Interaction of African Swine Fever Virus with Monocytes and Derived Macrophage Subsets. Vet. Microbiol. 2017, 198, 88–98. [Google Scholar] [CrossRef] [PubMed]
  38. Franzoni, G.; Graham, S.P.; Sanna, G.; Angioi, P.; Fiori, M.S.; Anfossi, A.; Amadori, M.; Dei Giudici, S.; Oggiano, A. Interaction of Porcine Monocyte-Derived Dendritic Cells with African Swine Fever Viruses of Diverse Virulence. Vet. Microbiol. 2018, 216, 190–197. [Google Scholar] [CrossRef] [PubMed]
  39. Franzoni, G.; Razzuoli, E.; Dei Giudici, S.; Carta, T.; Galleri, G.; Zinellu, S.; Ledda, M.; Angioi, P.; Modesto, P.; Graham, S.P.; et al. Comparison of Macrophage Responses to African Swine Fever Viruses Reveals That the NH/P68 Strain Is Associated with Enhanced Sensitivity to Type I IFN and Cytokine Responses from Classically Activated Macrophages. Pathogens 2020, 9, 209. [Google Scholar] [CrossRef]
  40. Alkhamis, M.A.; Gallardo, C.; Jurado, C.; Soler, A.; Arias, M. Phylodynamics and Evolutionary Epidemiology of African Swine Fever P72-CVR Genes in Eurasia and Africa. PLoS ONE 2018, 13, e0192565. [Google Scholar]
  41. Shen, Z.-J.; Jia, H.; Xie, C.-D.; Shagainar, J.; Feng, Z.; Zhang, X.; Li, K.; Zhou, R. Bayesian Phylodynamic Analysis Reveals the Dispersal Patterns of African Swine Fever Virus. Viruses 2022, 14, 889. [Google Scholar] [CrossRef]
  42. Pikalo, J.; Schoder, M.-E.; Sehl-Ewert, J.; Breithaupt, A.; Cay, A.B.; Lhoëst, C.; van Campe, W.; Mostin, L.; Deutschmann, P.; Roszyk, H.; et al. Towards Efficient Early Warning: Pathobiology of African Swine Fever Virus “Belgium 2018/1” in Domestic Pigs of Different Age Classes. Animals 2021, 11, 2602. [Google Scholar] [CrossRef]
  43. Linden, A.; Licoppe, A.; Volpe, R.; Paternostre, J.; Lesenfants, C.; Cassart, D.; Garigliany, M.; Tignon, M.; van den Berg, T.; Desmecht, D.; et al. Summer 2018: African Swine Fever Virus Hits North-Western Europe. Transbound. Emerg. Dis. 2019, 66, 54–55. [Google Scholar] [CrossRef]
  44. Forth, J.H.; Tignon, M.; Cay, A.B.; Forth, L.F.; Höper, D.; Blome, S.; Beer, M. Comparative Analysis of Whole-Genome Sequence of African Swine Fever Virus Belgium 2018/1. Emerg. Infect. Dis. 2019, 25, 1249–1252. [Google Scholar] [CrossRef]
  45. Gallardo, C.; Nurmoja, I.; Soler, A.; Delicado, V.; Simón, A.; Martin, E.; Perez, C.; Nieto, R.; Arias, M. Evolution in Europe of African Swine Fever Genotype II Viruses from Highly to Moderately Virulent. Vet. Microbiol. 2018, 219, 70–79. [Google Scholar]
  46. Fernandez, A.; Perez, J.; Carrasco, L.; Sierra, M.A.; Sanchez-Vizcaino, M.; Jover, A. Detection of African Swine Fever Viral Antigens in Paraffin-Embedded Tissues by Use of Immunohistologic Methods and Polyclonal Antibodies. Am. J. Vet. Res. 1992, 53, 1462–1476. [Google Scholar] [CrossRef]
  47. Leitão, A.; Cartaxeiro, C.; Coelho, R.; Cruz, B.; Parkhouse, R.M.E.; Portugal, F.C.; Vigário, J.D.; Martins, C.L.V. The Non-Haemadsorbing African Swine Fever Virus Isolate ASFV/NH/P68 Provides a Model for Defining the Protective Anti-Virus Immune Response. J. Gen. Virol. 2001, 82, 513–523. [Google Scholar] [CrossRef]
  48. Berg, C.; Wilker, S.; Roider, J.; Klettner, A. Isolation of Porcine Monocyte Population: A Simple and Efficient Method. Vet. Res. Commun. 2013, 37, 239–241. [Google Scholar] [CrossRef]
  49. Wensvoort, G.; Terpstra, C.; Pol, J.M.A.; ter Laak, E.A.; Bloemraad, M.; de Kluyver, E.P.; Kragten, C.; van Buiten, L.; den Besten, A.; Wagenaar, F.; et al. Mystery Swine Disease in the Netherlands: The Isolation of Lelystad Virus. Vet. Q. 1991, 13, 121–130. [Google Scholar] [CrossRef]
  50. Tignon, M.; Gallardo, C.; Iscaro, C.; Hutet, E.; Van der Stede, Y.; Kolbasov, D.; De Mia, G.M.; Le Potier, M.F.; Bishop, R.P.; Arias, M.; et al. Development and Inter-Laboratory Validation Study of an Improved New Real-Time PCR Assay with Internal Control for Detection and Laboratory Diagnosis of African Swine Fever Virus. J. Virol. Methods 2011, 178, 161–170. [Google Scholar] [CrossRef] [PubMed]
  51. Carmina, G.; Nieto, R.; Arias, M. Indirect Immunoperoxidase Test (IPT) for Detection of Antibodies against African Swine Fever Virus (ASFV) on African Green Monkey Cell Lines (Vero, MS). In African Swine Fever Virus: Methods and Protocols; Netherton, C.L., Ed.; Springer: New York, NY, USA, 2022; pp. 147–158. [Google Scholar]
  52. Cresta, D.; Warren, D.C.; Quirouette, C.; Smith, A.P.; Lane, L.C.; Smith, A.M.; Beauchemin, C.A.A. Time to Revisit the Endpoint Dilution Assay and to Replace the TCID50 as a Measure of a Virus Sample’s Infection Concentration. PLoS Comput. Biol. 2021, 17, e1009480. [Google Scholar] [CrossRef]
  53. Sánchez, C.; Gómez-Puertas, P.; Gómez-del-Moral, M.; Alonso, F.; Escribano, J.M.; Ezquerra, A.; Domínguez, J. Expression of Porcine CD163 on Monocytes/Macrophages Correlates with Permissiveness to African Swine Fever Infection. Arch. Virol. 2003, 148, 2307–2323. [Google Scholar] [CrossRef] [PubMed]
  54. Sánchez, C.; Doménech, N.; Vázquez, J.; Alonso, F.; Ezquerra, A.; Domínguez, J. The Porcine 2A10 Antigen Is Homologous to Human CD163 and Related to Macrophage Differentiation. J. Immunol. 1999, 162, 5230–5237. [Google Scholar] [CrossRef] [PubMed]
  55. Sánchez, E.G.; Riera, E.; Nogal, M.; Gallardo, C.; Fernández, P.; Bello-Morales, R.; López-Guerrero, J.A.; Chitko-McKown, C.G.; Richt, J.A.; Revilla, Y. Phenotyping and Susceptibility of Established Porcine Cells Lines to African Swine Fever Virus Infection and Viral Production. Sci. Rep. 2017, 7, 10369. [Google Scholar] [CrossRef]
  56. Vogel, D.Y.S.; Glim, J.E.; Stavenuiter, A.W.D.; Breur, M.; Heijnen, P.; Amor, S.; Dijkstra, C.D.; Beelen, R.H.J. Human Macrophage Polarization in Vitro: Maturation and Activation Methods Compared. Immunobiology 2014, 219, 695–703. [Google Scholar] [CrossRef]
  57. Carrasco, C.P.; Rigden, R.C.; Schaffner, R.; Gerber, H.; Neuhaus, V.; Inumaru, S.; Takamatsu, H.; Bertoni, G.; McCullough, K.C.; Summerfield, A. Porcine Dendritic Cells Generated in Vitro: Morphological, Phenotypic and Functional Properties. Immunology 2001, 104, 175–184. [Google Scholar] [CrossRef]
  58. McCullough, K.C.; Basta, S.; Knötig, S.; Gerber, H.; Schaffner, R.; Kim, Y.B.; Saalmüller, A.; Summerfield, A. Intermediate Stages in Monocyte-Macrophage Differentiation Modulate Phenotype and Susceptibility to Virus Infection: Macrophage Differentiation. Immunology 1999, 98, 203–212. [Google Scholar] [CrossRef] [PubMed]
  59. Duan, X.; Nauwynck, H.J.; Pensaert, M.B. Effects of Origin and State of Differentiation and Activation of Monocytes/Macrophages on Their Susceptibility to Porcine Reproductive and Respiratory Syndrome Virus (PRRSV). Arch. Virol. 1997, 142, 2483–2497. [Google Scholar] [CrossRef] [PubMed]
  60. Hakizimana, J.N.; Nyabongo, L.; Ntirandekura, J.B.; Yona, C.; Ntakirutimana, D.; Kamana, O.; Nauwynck, H.; Misinzo, G. Genetic Analysis of African Swine Fever Virus From the 2018 Outbreak in South-Eastern Burundi. Front. Vet. Sci. 2020, 7, 578474. [Google Scholar] [CrossRef] [PubMed]
  61. Wardley, R.C.; Wilkinson, P.J. The Growth of Virulent African Swine Fever Virus in Pig Monocytes and Macrophages. J. Gen. Virol. 1978, 38, 183–186. [Google Scholar] [CrossRef] [PubMed]
  62. Oh, D.; Han, S.; Tignon, M.; Balmelle, N.; Cay, A.B.; Griffioen, F.; Droesbeke, B.; Nauwynck, H.J. Differential Infection Behavior of African Swine Fever Virus (ASFV) Genotype I and II in the Upper Respiratory Tract. Vet. Res. 2023, 54, 121. [Google Scholar] [CrossRef]
  63. Howey, E.B. The Pathogenesis of African Swine Fever: Further Characterization of Infection Models and Tissue Dynamics. Doctoral Dissertation, Michigan State University, East Lansing, MI, USA, 2016. [Google Scholar]
  64. Cai, S.; Zheng, Z.; Cheng, J.; Zhong, L.; Shao, R.; Zheng, F.; Lai, Z.; Ou, J.; Xu, L.; Zhou, P.; et al. Swine Interferon-Inducible Transmembrane Proteins Potently Inhibit African Swine Fever Virus Replication. Front. Immunol. 2022, 13, 827709. [Google Scholar] [CrossRef]
  65. Fan, W.; Jiao, P.; Zhang, H.; Chen, T.; Zhou, X.; Qi, Y.; Sun, L.; Shang, Y.; Zhu, H.; Hu, R.; et al. Inhibition of African Swine Fever Virus Replication by Porcine Type I and Type II Interferons. Front. Microbiol. 2020, 11, 1203. [Google Scholar] [CrossRef]
  66. Golding, J.P.; Goatley, L.; Goodbourn, S.; Dixon, L.K.; Taylor, G.; Netherton, C.L. Sensitivity of African Swine Fever Virus to Type I Interferon Is Linked to Genes within Multigene Families 360 and 505. Virology 2016, 493, 154–161. [Google Scholar] [CrossRef]
  67. McNab, F.; Mayer-Barber, K.; Sher, A.; Wack, A.; O’Garra, A. Type I Interferons in Infectious Disease. Nat. Rev. Immunol. 2015, 15, 87–103. [Google Scholar] [CrossRef]
  68. Muñoz-Moreno, R.; Cuesta-Geijo, M.Á.; Martínez-Romero, C.; Barrado-Gil, L.; Galindo, I.; García-Sastre, A.; Alonso, C. Antiviral Role of IFITM Proteins in African Swine Fever Virus Infection. PLoS ONE 2016, 11, e0154366. [Google Scholar] [CrossRef] [PubMed]
  69. Gao, P.; Zhou, L.; Wu, J.; Weng, W.; Wang, H.; Ye, M.; Qu, Y.; Hao, Y.; Zhang, Y.; Ge, X.; et al. Riding Apoptotic Bodies for Cell-Cell Transmission by African Swine Fever Virus. Proc. Natl. Acad. Sci. USA 2023, 120, e2309506120. [Google Scholar] [CrossRef] [PubMed]
  70. Zsak, L.; Neilan, J.G. Regulation of Apoptosis in African Swine Fever Virus–Infected Macrophages. Sci. World J. 2002, 2, 1186–1195. [Google Scholar] [CrossRef] [PubMed]
  71. Frydas, I.S.; Nauwynck, H.J. Replication Characteristics of Eight Virulent and Two Attenuated Genotype 1 and 2 Porcine Reproductive and Respiratory Syndrome Virus (PRRSV) Strains in Nasal Mucosa Explants. Vet. Microbiol. 2016, 182, 156–162. [Google Scholar] [CrossRef]
  72. Frydas, I.S.; Verbeeck, M.; Cao, J.; Nauwynck, H.J. Replication Characteristics of Porcine Reproductive and Respiratory Syndrome Virus (PRRSV) European Subtype 1 (Lelystad) and Subtype 3 (Lena) Strains in Nasal Mucosa and Cells of the Monocytic Lineage: Indications for the Use of New Receptors of PRRSV (Lena). Vet. Res. 2013, 44, 73. [Google Scholar]
  73. Glorieux, S.; Favoreel, H.W.; Meesen, G.; Van den Broeck, W.; Nauwynck, H.J. Different Replication Characteristics of Historical Pseudorabies Virus Strains in Porcine Respiratory Nasal Mucosa Explants. Vet. Microbiol. 2009, 136, 341–346. [Google Scholar] [CrossRef]
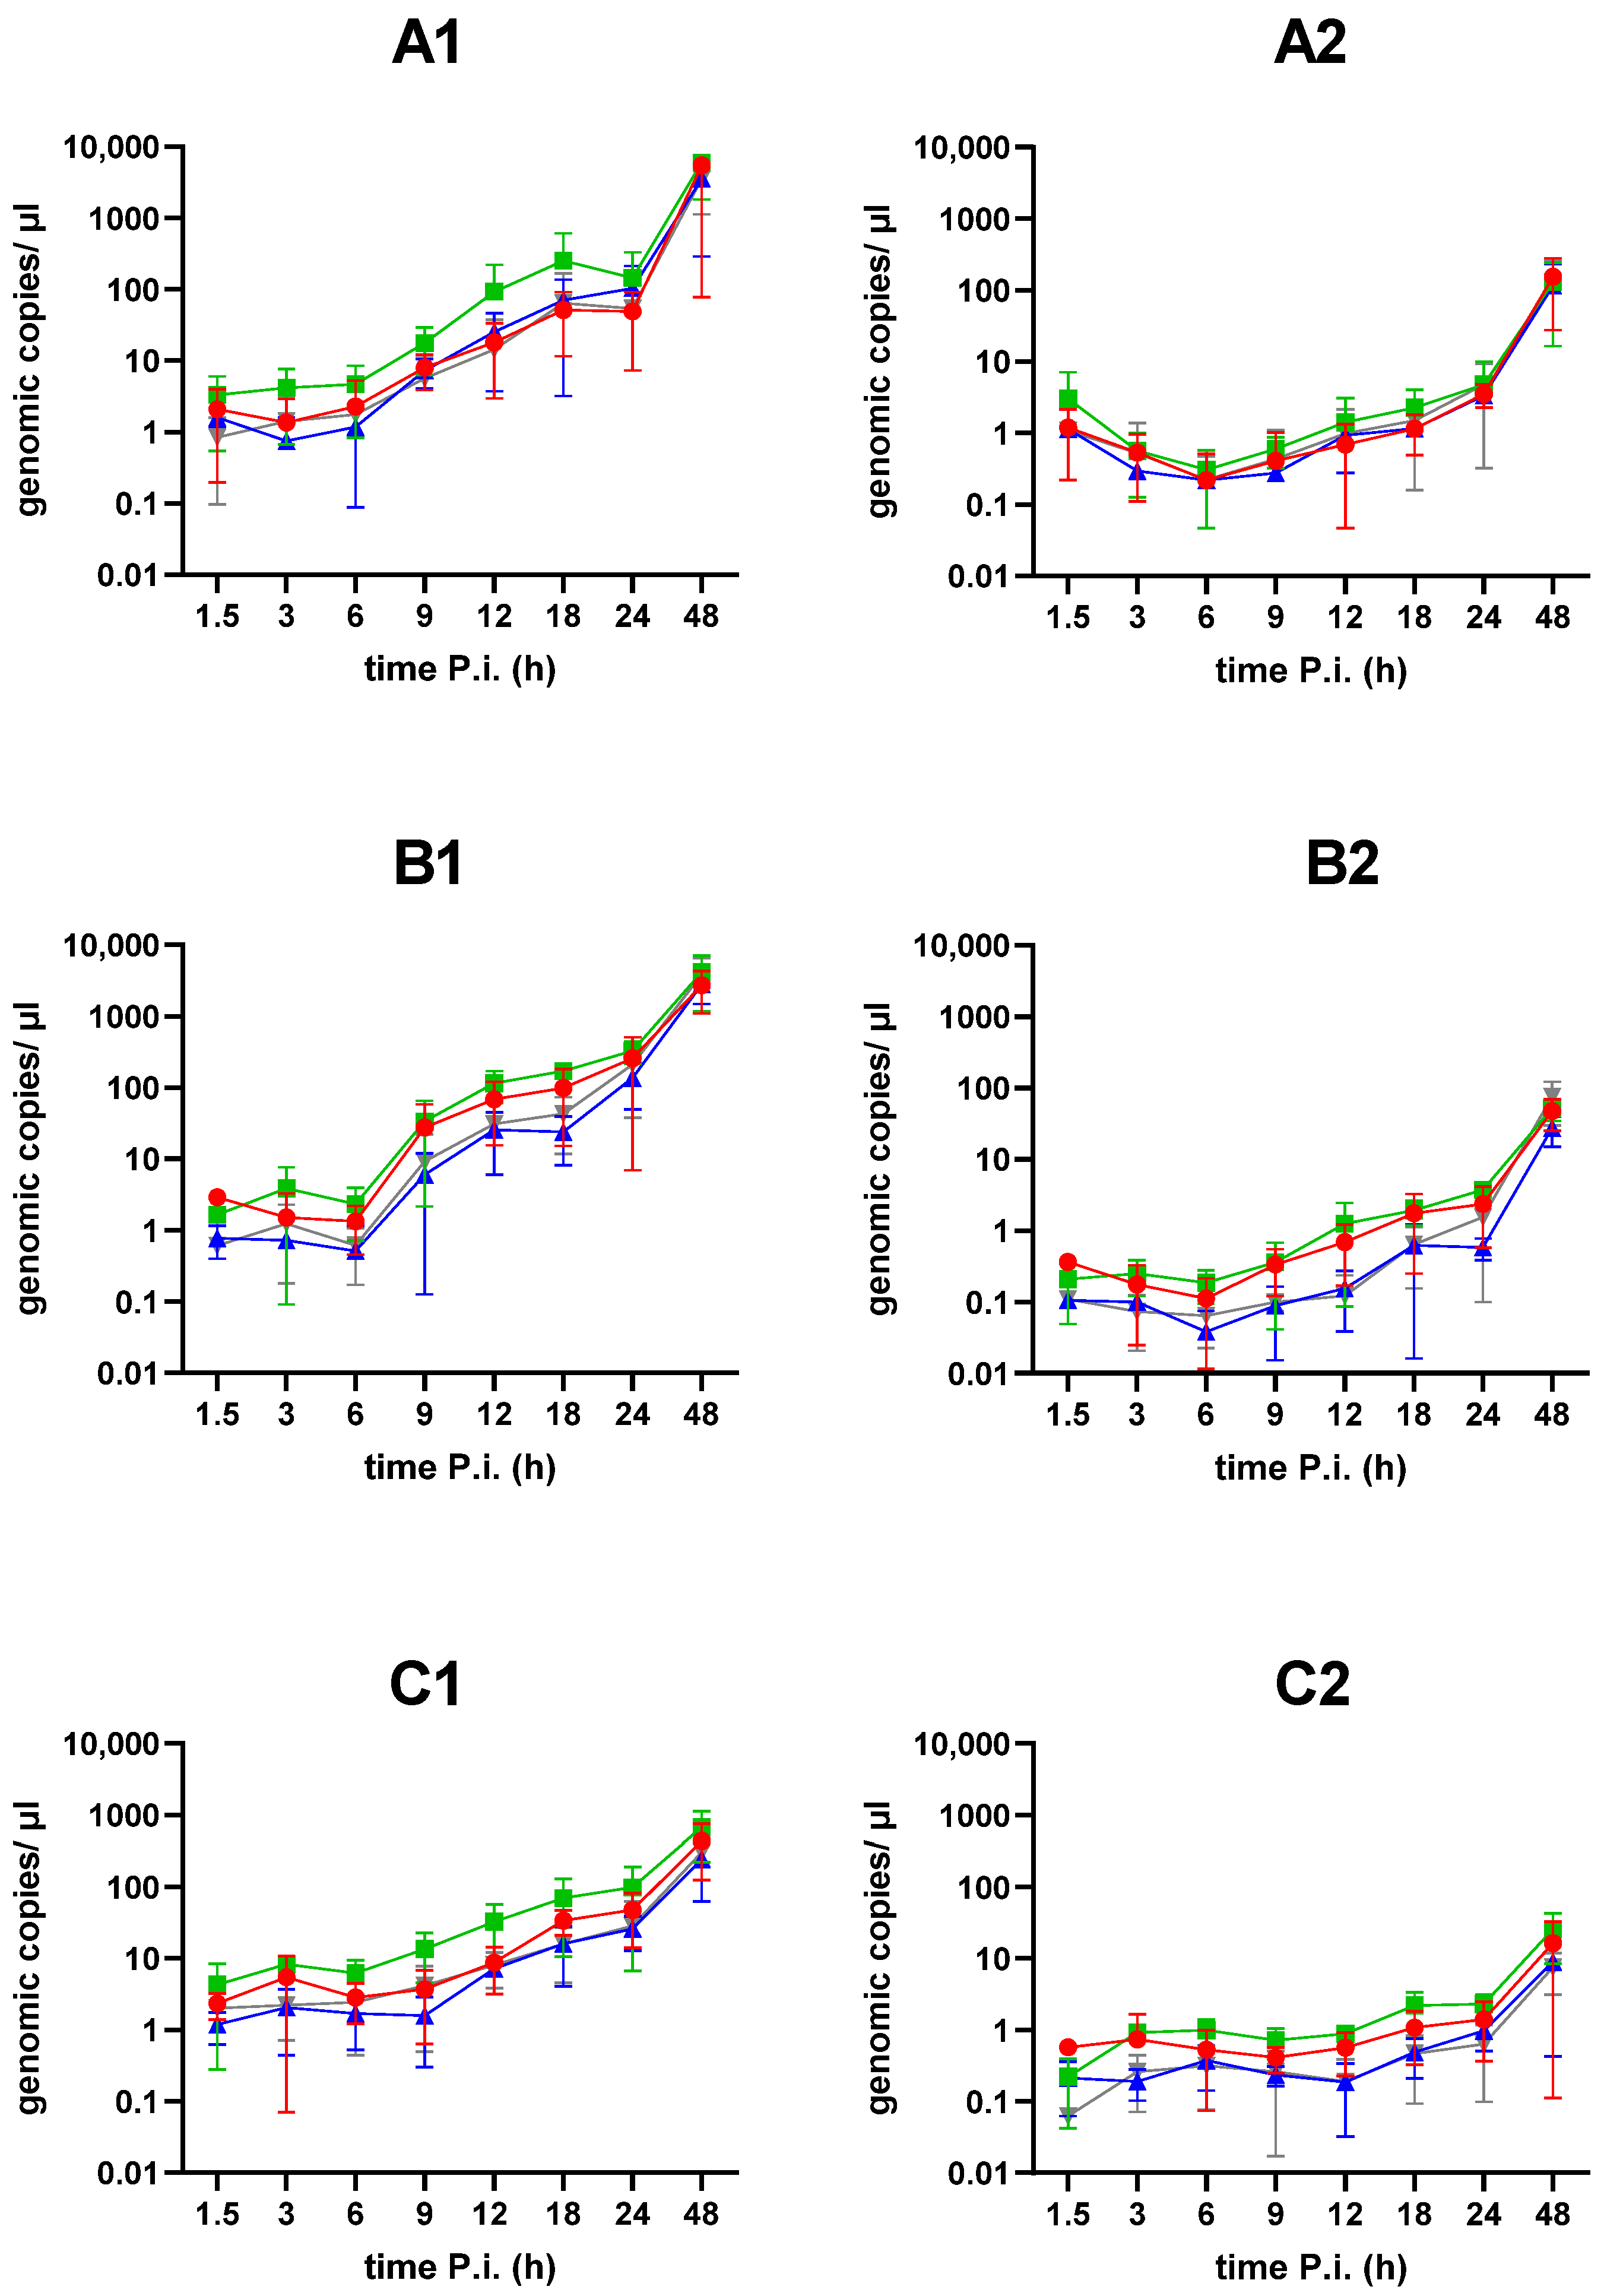
Figure 1. Viral replication kinetics of BE18 (red circle), E70 (green square), EST (blue triangle) and NHV (grey inverted triangle). PAMs (A1), MDMs (B1), and spleen macrophages (C1) were collected and the number of intracellular DNA copies was determined by qPCR. The supernatants from the PAMs (A2), MDMs (B2) and spleen macrophages (C2) were collected after separation from the cells and viral DNA copies were quantified by qPCR. No statistically significant differences were observed between the strains, except between E70 and both NHV and EST (p-value < 0.05) at 18hpi in B1.
Microbiolres 15 00112 g001
Figure 2. Viral replication kinetics of BE18 (red circle), E70 (green square), EST (blue triangle) and NHV (grey inverted triangle). PAMs (A1), MDMs (B1), and spleen macrophages (C1) were collected and the infectious virus titer was determined by an IPT. The supernatants from the PAMs (A2), MDMs (B2) and spleen macrophages (C2) were collected after separation from the cells and the infectious virus titer was assessed by an IPT. No statistically significant differences were observed between the strains.
Microbiolres 15 00112 g002
Figure 3. The supernatants from infected PAMs (white), MDMs (black) and spleen macrophages (grey) were collected after separation from the cells. The infectious virus titers were assessed by an IPT. At 12 hpi, mean titers were significantly higher in MDMs (2.23 ± 1.04) compared to PAMs (0.88 ± 0.43) (p < 0.01) and spleen macrophages (1.27 ± 0.89) (p < 0.05). * p-value < 0.05; ** p-value < 0.01.
Microbiolres 15 00112 g003
Figure 4. The percentage ASFV-infected cells with BE18 (red circle), E70 (green square), EST (blue triangle) and NHV (grey inverted triangle) was quantified through immunofluorescence staining in PAMs (A1), MDMs (B1) and spleen macrophages (C1). (A2,B2,C2) illustrate representative IF pictures of PAMs, MDMs and spleen macrophages, respectively, at 48 hpi with BE18. The nuclear staining (blue) and the viral P72 antigen (FITC) are visualized with a 20× objective. No statistically significant differences were observed between the strains.
Microbiolres 15 00112 g004
Figure 5. The percentage of ASFV-infected PAMs (white), MDMs (black) and spleen macrophages (grey) was quantified through immunofluorescence staining. The mean percentages of infected cells between the different cell types were compared. At 24 hpi, significantly more MDMs (20.19 ± 14.30) compared to PAMs (1.64 ± 0.98) and spleen macrophages (8.89 ± 6.38) were positive for the P72-protein. Furthermore, at 48 hpi, MDMs presented the highest number of ASFV-infected cells (45.22 ± 9.64), followed by spleen macrophages (37.43 ± 13.00) and PAMs (24.50 ± 15.91), with significant differences between MDMs and PAMs. * p-value < 0.05; ** p-value < 0.01; **** p-value <0.001.
Microbiolres 15 00112 g005
Table 1. Complete information on strains used in the study.
StrainOriginGenotypeVirulencePassage Level on PBMCsReference
Belgium 2018/01 (BE18)Belgium, 2018IIVirulent8[43,44]
Est15/WB-Valga-6 (EST)Estonia, 2015IIModerately virulent3[45]
E70Spain, 1970IVirulent5[46]
NH/P68 (NHV)Portugal, 1968IAttenuated3[47]
Disclaimer/Publisher’s Note: The statements, opinions and data contained in all publications are solely those of the individual author(s) and contributor(s) and not of MDPI and/or the editor(s). MDPI and/or the editor(s) disclaim responsibility for any injury to people or property resulting from any ideas, methods, instructions or products referred to in the content.