Abstract
We deal with various strains of Lactobacillus that can maintain the intestinal microbiome of rats treated with cyclophosphamide, an anticancer agent (chemotherapy). We use MiSeq and various types of statistical tests to prove that cyclophosphamide in rats alters the intestinal microbiome, favoring the growth of various fungi that are extremely harmful to intestinal metabolism. On the contrary, when Lactobacillus 3L is administered together with cyclophosphamide, we prove that the microbiome is preserved by having a much better intestinal metabolism.
1. Introduction
Various research challenges are critical for the cancer care continuum and finding treatment at various levels for the most threatening disease to human health [1]. Following an accumulation of mutational, genetic, and epigenetic alterations, abnormal cells begin to divide without control and soon form a mass of extra-tissue (or tumor) that can spread to the entire body through the bloodstream and lymph and become deadly [2,3,4,5]. Disease-specific mutational events can serve as reliable cancer biomarkers for diagnosis [6,7], which is especially important given that human cells can develop multiple types of primary cancerous tumors [8,9,10]. However, cancer is hard to treat because of the high diversity of genetic mutations in mitochondrial DNA, non-coding RNA, microRNA, ubiquitin, RNA editing, peptide mutation, spliceosome and/or RNA splicing, and the phenotype-specificity of drug sensitivity, which is mainly dependent on tumor-stroma interactions [11,12,13,14,15,16,17,18].
The effects of radiation, nanomedicine, nanoparticles, extracellular vesicle bioengineering, gene therapy, thermal ablation, and particularly immunotherapy and chemotherapy on cancer treatment have thus been the subject of numerous studies [19,20,21,22]. Cancer treatment has given special focus to immunotherapy, or increasing T cells’ ability for antigen-directed toxicity [23]. This is also important since anticancer strategies such as chemotherapy and radiotherapy also negatively affect the disease’s targeting of the immune system [24,25,26]. Chemotherapy, in particular, is the cancer treatment most likely to impair immunity and cause neutropenia because it is used to treat cancer cells that divide quickly. Still, it also affects many healthy cells in the body, including neutrophils, making it difficult to treat infections while receiving chemotherapy treatments [27,28,29]. This makes any strategy to try to preserve the immune system for chemotherapy extremely relevant.
The main issue for all anticancer treatments is maintaining the immune system and good health. Similar to radiotherapy, “chemo” has a temporary effect on the immune system. After a few months, one may regain normal or almost normal immune functioning depending on the type of treatment, how long it lasts, and other variables, including smoking, age, and general patient health problems [30]. As described for cyclophosphamide, or cyclophosphane, an antineoplastic alkylating agent in chemicals known as Disease-Modifying Anti-Rheumatic Drug (DMARD) used to treat various forms of cancer from lymphoma to sarcoma and to suppress the immune system, in a manner similar to aging, chemotherapy is thought to shorten lifespan due to medical complications such as heart disease, pulmonary fibrosis, and/or endocrine system-related disease [31,32]. The drug cyclosphosphamide, commonly known as Neosar® or Cytoxan® (CTX), is also used in veterinary medicine [33], making the study it undertook a good illustration of how human and animal medicine can complement one another in cancer research.
More than half of all cancer patients receive ionizing radiation therapy, which results in late inflammatory reactions and/or, over time, especially with high dose rate radiation, the patient’s immune system may develop inflammation-related disorders [34]. Cyclophosphamide-based chemotherapy, which is likely used to treat the other half of cancer cases, can potentially negatively affect the lungs, most frequently manifesting as diffuse alveolar destruction [35]. When the dose of CTX is increased, there is a risk that chemotherapeutic resistance will develop [36]. After using CTX for a long time, there is even a risk of developing another cancer. CTX-chemo is known to permanently affect the growth of neurons and sensory abilities [37,38]. Concerns about immune system modification and cell transplantation are another significant source of CTX-related worry. In allogeneic hematopoietic blood-forming stem cell transplants, post-transplant CTX changes immunological markers and results in poorer T cell reconstitution [39]. Finding novel approaches to continue using radiotherapy and/or chemotherapy is essential to promoting T cell lymphocyte activity in order to treat the disease. However, it is equally important to preserve the patient’s natural barriers and immune functions to fight other infections and/or preserve stem cells in the case of transplantation. Therefore, balancing effective cancer treatment and maintaining overall immune health poses one of the most difficult challenges in cancer research [40,41,42,43,44,45,46,47].
The idea of employing complementary and/or alternative, more natural medicine to treat cancer is not new. Microbe-mediated tumor therapy, which treats cancer by injecting bacteria nearby, is well known [47]. However, microbe-based approaches may be gaining popularity in our contemporary lifestyles. Bacteria-mediated tumor therapy has been practiced for more than a century. Nowadays, it looks as simple as the good bacteria moving to the tumor and multiplying there, activating the patient’s immune system [48]. However, things might be trickier than that. Microbiological studies show that gut microbiota is necessary for the effectiveness of CTX-chemotherapy [49]. Therefore, understanding how the CTX drug affects the gut microbiota and immune system and how the gut and immune system can be protected from hazardous chemotherapy drugs remains critical.
Given the relationship between the immune system and the gut, gut bacteria (or microflora) have also emerged as a key target for enhancing T cells and influencing the effectiveness of cancer therapies [50,51]. Several cancer model studies have proven that a healthy gut flora significantly affects the effectiveness of anticancer medications such as immune checkpoint inhibitors (ICIs), CTX, and other phosphamide chemical drugs [52,53,54,55]. The current Lactobacillus study is comparable to any commercially available probiotic preparation, such as L. rhamnosus, which is known to limit the growth of cancer cells in a dose- and time-dependent manner [56]. Enhancing the gut microbiota and preventing tumor genesis is comparable to L. rhamnosus GG, the microbe model of cancer that has been the subject of most research [56,57,58,59]. In this novel and difficult research area, which mostly focuses on colon cancer, a uniform ‘probiotic’ strategy is intended to prevent patient selection in light of the various chemical treatments and unique host responses to gut modification [60].
We examined the impact of using a probiotic containing three different Lactobacilli (3L) on the gut microbiome of rats following cyclophosphamide (CTX) treatment. CTX corresponds to chemotherapy used for human cancer treatment and is known to have adverse effects on the immune system.
We conducted our experiment with ten rats in five different experimental groups, including control, CTX-treated, and three groups receiving low, medium, and high 3L probiotic treatments with CTX treatment. We sequenced the stools of three of the ten rats in each group using both ITS and 16S sequencing. We then examined the taxonomic composition of these samples to determine whether the probiotic treatment helped the rat’s microbiome return to a similar structure as the control rats. We used Illumina MiSeq sequencing to generate sequencing data from microbial genomic DNA libraries, which is useful for testing the effects of 3L on bacteria and fungi. Microbiome analysis, phylogenetic and classification reports, and community data have all backed up the experiments and important findings that 3L had a significant positive impact on the microbiome. The overall results of the Lactobacillus + CTX chemotherapy treatment were favorable to a degree that had not previously been noted. The microbial gut flora significantly improved when the dose of 3L (acidophilus, casei, and plantarum) was increased. We proposed the role of novel natural probiotics (3L, multistrain) in establishing a strong and long-lasting healthy gut flora following chemotherapy using experimental results from the first in vivo chemotherapy model (immunosuppression caused by cyclophosphamide CTX).
2. Materials and Methods
2.1. Lactobacillus Preparation for Medical-Industrial Use
The idea of using multiple strains further to combat chronic, metabolic, and genetic diseases originated when we prepared a three-strain Lactobacillus probiotic formula (3L) that was demonstrated to combat weight gain, hypercholesterolemia, and hyperlipidemia [61,62,63]. Our industrial laboratory platform for natural medicine in Jinan City (Shandong Province, China) produced the same probiotic formula used in this study against gut and immune damage in cyclophosphamide chemotherapy (L. acidophilus SD65, L. casei SD07, and L. plantarum SD02). Following Yue et al., (2014) [61], pure cultures of the three bacterial strains were grown in de Man, Rogosa, and Sharpe (MRS) agar liquid medium and placed in an anaerobic workstation held at 37 °C (industrial platform). Each strain’s bacterial cells were harvested for 3L preparation by centrifugation at 2000× g for 20 min (4 °C). Each strain’s cell pellet was resuspended in sterile saline water solution at a 109 CFU/mL concentration and stored at 4 °C. The tripartite L probiotic solution (3L) was freshly prepared by mixing equal volumes of cold suspensions of SD65, SD07, and SD02 and stored in cold conditions (4–10 °C) for later use. Rats were given a daily dose (0.3 mL) of bioproducts administered intra-gastrically via a stainless–steel needle, along with chemotherapy (cyclophosphamide, CTX, 10 mg/mL; Figure 1). Yue et al.’s (2014) prior study was used to determine the concentration of each strain in the 3L mixture [61].
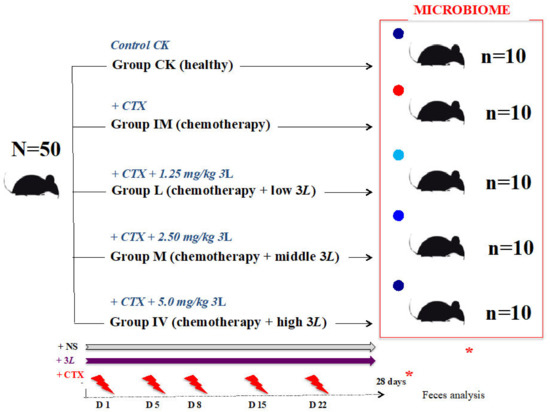
Figure 1.
Lactobacillus tritherapy experimental model in rats undergoing CTX chemotherapy conditions. After twenty-eight days of chemotherapy (cyclophosphamide CTX, 10 mg/mL), the red dot represents the immune-attacked group with depleted gut flora. In that order, CTX was administered to rats on D1, D5, D8, D15, and D22. Continuous perfusion of normal saline (NS) was used. Groups L, M, and H rats were given a probiotic medication (one dose) daily. Lactobacillus (3L: L. acidophilus SD65, L. casei SD07, and L. plantarum SD02). L: low dose (1.25 mg/kg); M: middle dose (2.50 mg/kg); H: high dose (5.0 mg/kg). The blue dots represent the groups that have kept their gut flora close to control healthy conditions (Lactobacillus-treated groups). The dark blue dot represents the group (high 3L) with gut flora (microbiome) that is highly similar to control healthy conditions (CK). Chemotherapy begins in the +CTX groups at time 0. After twenty-eight days of treatment (D28), fecal samples were collected in each group in order to conduct a full complete thorough workshop on microbiome analysis and a group-variation comparison (*). N = total number of rats in the experiment; n = number of rats per group.
2.2. Preparation of Five Groups in a CTX-Induced Immunosuppression Model in Rats
Rodents are the best models for examining diseases linked to obesity and metabolic problems in humans [63]. They are also excellent research subjects for investigations into immunology and immunotherapy for human cancer [64]. Jinan Pengyue Laboratory Animal Company supplied the rats (product license SCXK (LU) 20140007). In our laboratory, the rats were bred in the Class II clean animal facility of the Institute of Medicine (Shandong Academy of Medical Sciences) with a set temperature of 20–26 °C (relative humidity: 40–70%, ventilation rate ≥ 15 times/h). They all passed the quarantine inspection (laboratory animal use license No.: STXK(LU)20170003, issued by the Shandong Provincial Department of Science and Technology). The feed and drinking bottles were replaced every two to three days, if necessary. Fifty healthy Specific Pathogen Free (SPF) Sprague–Dawley (SD) male rats were divided into five experimental groups (N = 50 males, young adults, 8–9 weeks old; body weight: ~260–316 g): (1) Control healthy (CK), (2) Immune attacked (IM), (3) Immune attacked and treated with a low Lactobacillus dosage of 1.25 mL/kg bodyweight (L), (4) Immune attacked and treated with a middle Lactobacillus dosage of 2.5 mL/kg bodyweight (M), and (5) Immune attacked and treated with a high Lactobacillus dosage of 5.0 mL/kg bodyweight (H). The total number of rats studied was 50, with 10 rats in each group (Figure 1). They were fed in two five-rat cages (feeding density: ≤5/cage). Four rats in each cage were labeled with neutral red on the head, neck, back, and tail. The fifth rat was unmarked. Before the experiment, each group was given an equal volume of animal drinking water, and 5.0 mL/kg of animal drinking water was supplemented before gavage. The control rats (CK group) were given continuous gastric perfusion of normal saline (NS). The immune system of rats in groups 2–5 was attacked by an intraperitoneal injection of cyclophosphamide (CTX, 10 mg/mL). Another study using the same experimental design looked at the effects of CTX on the immune system of rats [65]. This companion study highlighted the negative effects of CTX cyclophosphamide chemotherapy on the rat immune system and the beneficial effects of Lactobacillus preparations on cyclophosphamide-induced immunosuppression [65]. Following the findings from Zhang et al., (2020) on CTX chemotherapy and immunodepression in rats [65], the current experiment on chemotherapy and the microbiome was followed for approximately 28 days (D28). CTX was administered to the rats on days 1, 5, 8, 15, and 22 (IM group; Figure 1). On each of the five shots, CTX was injected intraperitoneally at a 4 mL/kg dosage volume. The control group received saline shots of the same volume. The 3L preparation was administered via gavage, which is a tube that runs from the mouth to the stomach. “Covered” rats received a 3L continuous gastric perfusion in NS (1.25 mL/kg, low dose, L group; 2.50 mL/kg, middle dose, M group; 5.0 mL/kg, high dose, H group; Figure 1). L, M, and H, like IM, corresponded to five CTX injections of chemotherapy (Figure 1). In each rat group, feces were collected every day. Fresh fecal samples were collected for analysis on D28. Feces were collected with a sterile disposable plastic spoon (SteriPlast sample spoon) and placed in a 1.5 mL Eppendorf tube that had been sterilized. Fecal samples from the control CK, IM, L, M, and H groups were stored at −80 °C until DNA extraction, Illumina MiSeq sequencing, and microbiome profiling comparisons between the five groups (Figure 1).
2.3. Preparation of Microbial Genomic DNA Samples for Illumina MiSeq
DNA was extracted from the five groups of rats (CK, IM, L, M, and H) in the chemotherapy model using the method previously selected for mice and piglet fecal microbiome analysis [61,62,66]. This method was dependable for fecal DNA sample testing, quantity, purity, quality control, and Illumina sequencing [66]. As described by Yue et al., (2020) [66], 2.0 g of fecal samples from Group CK-H rats were processed for microbial genomic DNA extraction using the QIAamp Fast DNA Stool MiniKit (Qiagen GmbH, Hilden, Germany). The extracted DNA (10 ng) was used as a template in PCR reactions employing universal primers. For 16S samples (V3-V4, 480 bp, Miseq-PE250), the primers 338F 5′-ACTCCTCGGGAGGCAGCA-3′ and 806R 5′-GGACTACHVGGGTWTCTAAT -3′ (Personal Biotechnology Co., Ltd., Shanghai, China) were used. The primers ITS5F 5′-GGAAGTAAAAGTCGTAACAAGG-3′ and ITS1R 5′-GCTGCGTTCTTCATCGATGC-3′ (Personal Biotechnology Co., Ltd., Shanghai, China) were used in PCR reactions for ITS (ITS1, 250 bp, Miseq-PE250). Each Illumina sequencing sample corresponded to three rats from the same group. Consequently, fifteen different samples (CK: C101, C103, C105; IM: IM015, IM021, IM024; L: L102, L103, L104; M: M201, M202, M203; H: H105, H204, H205) were subjected to Illumina MiSeq (NCBI SubmissionID: SUB9725559; BioProject ID: PRJNA754332; BioSamples: SAMN20769197-SAMN20769206; Accession Numbers: SRX11740945-SRX11740959). Three biological samples were tested in each group of rats during microbiome analysis in relation to CTX chemotherapy, so we conducted individual, replicate, and comparison groups.
Prior to sequencing, ITS and 16S rDNA products (TransGen Biotech, Beijing, China) were amplified in a Takara Master Thermal Cycler Dice (Takara, Dalian, China) programmed for an initial denaturation of 95 °C for 3 min, followed by 30 cycles of 94 °C for 30 s, 50 °C for 30 s, 72 °C for 1 min, and a final extension of 72 °C for 7 min. Q5® high-fidelity DNA polymerase (New England BioLabs Inc., Ipswich, MA, USA) was used for PCR amplification. Each group’s PCR products or amplicons were purified using a 2 percent agarose gel electrophoresis (Bio-Rad Beijing, China) and a gel recovery kit (Axygen®, AxyPrep DNA gel extraction kit, New York, NY, USA). The PCR product concentration was determined in a microplate reader (BioTek™, FLx800™) using a fluorescence reagent-based method (Quant-iT PicoGreen dsDNA Assay Kit, Fisher Scientific™, Loughborough, UK).
2.4. Illumina MiSeq Sequencing
In the five groups of rats (CK-H), MiSeq sequencing by Illumina was used to generate sequencing data from microbial genomic DNA libraries for chemotherapy and bioproduct research. We used the same Illumina TruSeq Nano DNA LT Library Prep Kit used for the human genome and gut microbiota sequencing (Human Genome Assembly: The Genome Sequencing Consortium, 2001) [67]. To begin, rat fecal microbial genomic DNA amplicons were subjected to terminal end repair [68]. To purify the microbial library system, self-ligated fragments were removed using BECKMAN AMPure XP Beads (Beckman Coulter™, Illkirch, France). PCR amplicons were used as a template in a second PCR run to enrich the libraries as much as possible for the DNA of interest. The PCR conditions were the same as described in the section on preparing microbial genomic DNA samples for Illumina sequencing. Before high-throughput sequencing, PCR amplicons were purified using the Beckman magnetic beads screening method and analyzed by 2% agarose gel electrophoresis.
Prior to high-throughput sequencing, the quality of each rat fecal microbial genomic DNA library was checked on an Agilent Bioanalyzer with an Agilent High Sensitivity DNA kit (Agilent Technologies Inc., Waldbronn, Germany). On an Agilent check, each DNA library produced only a single peak and no joints. The sequence libraries were then quantified using the Quant-iT PicoGreen dsDNA assay kit from Promega on the Quantifluor fluorescence quantitative system (Promega Corporation, Madison, WI, USA). The concentration of the library was greater than 2 nM. DNA samples were mixed after serial dilutions, denatured with NaOH, and sequenced. Illumina MiSeq Reagent Kit v3 was used on a 600 cycles MiSeq Sequencer (Illumina Next Generation) to perform two-end sequencing with a 2 × 300 bp reading length. The target DNA fragment’s optimal sequencing length was between 200 and 450 bp.
Reading sequences were identified and assigned to the corresponding samples based on primers and barcode information. USEARCH (v5.2.236, http://www.drive5.com/usearch, accessed on 13 November 2019) was used to remove all chimeric sequences (or artifacts formed by incorrectly joined sequences) [69]. QIIME (Quantitative Insights Into Microbial Ecology, v1.8.0, http://qiime.org, accessed on 13 November 2019) was used to identify unreliable sequences (replication errors, nucleotide base substitutions, insert deletions, and so on) for microbial genomic DNA [70]. Sequences with more than one base mismatch and/or more than eight consecutive identical bases were discarded [69,70,71]. Other sequences were classified into Operational Taxonomic Units (OTUs), which were then used for microbial DNA taxonomic identification and phylogenetic analysis [72]. The diversity level of each sample was assessed using OTU values, and the depth of sequencing (enhanced microbial community analysis) was demonstrated using rarefaction curve analysis [73]. The composition of the five samples corresponding to the five rat groups (CK-H) was examined at different taxonomic levels: phylum, order, class, family, genus, and species (i.e., complete microbiome; Figure 1). Tables, box plots, and histograms were used to display the microbiome results (OTU, 100%; R software). Rare OTUs (with an abundance proportion of less than 0.001%) were excluded from microbiome analysis [74]. Venn diagrams in R (Treat*/2.5.1_Venn) were used to display shared and unique OTUs within each group (as calculated by R). Rarefaction curves were drawn to reflect the microbial diversity among samples using an OTU abundance matrix to study the complete microbial structure in each group. Specifically, we compared the number of OTUs in five different groups of rats (CK-H) at the same sequencing depth. We justified the level of diversity in each sample (QIIME2, alpha rarefaction curve). The length of the curve reflects the number of sample sequencing depths; the longer the curve, the greater the sequencing depth, which increases the likelihood of observing increased microbial diversity. We also measured “specaccum” (species accumulation curve) in five chemotherapy-treated rats and 3L groups. Specaccum, similar to the rarefaction curve, indicates the extent of an increase in microbial community richness with increasing sample size [75]. We estimated whether the sample size was sufficient to reflect the different underlying bacterial communities of the different groups or samples using R’s specaccum function. Using R in vegan (S3 method; Treat*/2.3.3_specaccum), the specaccum species accumulation curve was plotted for the total number of OTUs in each sample from the OTU abundance matrix [76]. Furthermore, the rank abundance curve (RAC) was used to determine the number of highly abundant versus rare OTUs in each community [77]. For RAC, OTU values were sorted and transformed into log2 data in R (Treat*/2.3.4_rabund). Other multiple indices were used to assess microbial alpha diversity in different rat groups. Using QIIME software (QIIME 2) in R, we included the Chao1 index and ACE index to reflect community richness and Shannon-Simpson indices to reflect both evenness and richness of the bacterial community in each of the five groups of rats related to cancer chemotherapy and Lactobacillus treatment (CK-H) [71,72,73,74,75,76,77].
Multiple statistical analysis tools (Metastats) in Mothur software (http://metastats.cbcb.umd.edu, accessed on 13 November 2019) were used to analyze the differences in gut flora structure and related microbial species between the groups, providing the sequence difference (or absolute abundance) of two samples/groups based on p and Q values [78]. Composition analysis included OTU number analysis for each taxonomic level. According to OTU classification results, we analyzed the OTU number of every sample at each taxonomic level (Kingdom, Phyllum, Class, Order, Family, Genus, and Species). The results were plotted as a histogram by R language. The OTU numbers of groups and individual samples were shown at each taxonomic level. The ordinate showed the relative abundance of each taxon. The longer the bar, the higher the relative abundance of the corresponding taxon in the sample. To show the differences in taxon composition between samples (groups and individual samples), the abundance differences were compared between the five groups and the fifteen samples one by one. The significance of these differences was determined using a statistical test, specifically the Metastats analysis by Mothur Software (Metastats in mothur v.1.44.3) [78]. A heatmap [79,80] was used in this descriptive study to show fungal microbial taxa clustering based on the abundance of each taxon in five groups and fifteen individual samples related to chemotherapy and Lactobacillus treatment in rats. The relative abundance of each taxon in each sample was used to create a microbial species heatmap (Treat*/2.2.1_taxa). The relative abundance values were all log transformed to reduce the degree of difference. If the taxon’s relative abundance is zero, half of the minimum abundance value will be substituted for it. As a result, heatmaps were created using the R software package “gplots”, the distance algorithm is “Euclidian”, and the clustering method is “complete” [80], as used by Yue et al., (2020) on curing piglets [66].
LEfSe was used to calculate the difference in community composition between groups based on the linear discriminant analysis (LDA) effect size. LDA is combined with Krustal–Wallis and Wilcoxon rank sum tests in LEfSe analysis to identify key biomarkers (i.e., key community members) [81]. The Galaxy Online Analysis Platform was used for sample group comparison and visual analysis results for LefSe analysis (http://huttenhower.sph.harvard.edu/galaxy, accessed on 13 November 2019 Treat*/2.5.5_LEfSe).
2.5. Sequence Denoising or Clustering
Instead of clustering based on similarity, we carried out dereplication, or 100% similarity clustering, using the DADA2 method [82]. The Amplicon Sequence Variants (ASVs) or feature sequences (corresponding to the OTU representative sequences) were to refer to each decontamination sequence produced through DADA2 quality control. The feature schedule is the frequency of these sequences in the sample or group of samples (corresponding to the OTU options). The current mainstream analysis platforms (QIIME2 and VSEARCH) promote the denoising and feature sequence generation methods represented by DADA2 [83]. DADA2 was picked for analysis by default, although the OTU clustering-based VSEARCH method from Rognes et al., (2016) [83] was still an option because the current methods, including DADA2, have not yet been optimized for all amplicon types. Priming, splicing, quality filtering, weight removal, chimera removal, clustering, and so forth were all performed using the VSEARCH method [83].
2.6. Classification and Phylogenetic Analysis
OTU representative sequences were used as taxa in the FastTree tool to construct phylogenetic trees (Newick) [84]. Using MEGAN [85], the abundance and taxonomic composition of OTUs in each sample were projected to the microbiological classification tree from NCBI (https://www.ncbi.nlm.nih.gov/taxonomy, accessed on 1 March 2020). Hierarchical trees (GraPhlAn) were constructed at each taxonomic level using the entire sample population. Taxonomic units were distinguished by different colors in GraPhlan, and their abundance distribution was reflected by the node size, i.e., the average relative abundance of the taxonomic unit [86]. KronaTools 2.4 software was used to deliver interactive community taxonomy presentations to groups of chemotherapy-related rats [87]. The primary goal of the ß-diversity analysis was to compare the similarity of community structure between the various groups. Principal component analysis (PCA), multidimensional scaling (MDS), and clustering analysis (CA) were used to observe differences between groups using the natural decomposition of the community data structure and sample ordination. PCA compared the similarity of samples using Euclidean distance, regardless of the original variables’ possible interrelationship (R software). Before classifying the group or sample distances, nonmetric MDS only considered the size of the relationship between samples (UniFrac distance matrices of Unweighted and Weighted in R software). CA methods such as Unweighted Pair-Group Method with Arithmetic Means (UPGMA), single-linkage clustering, and complete-linkage clustering, similar to Nonmetric MDS analysis, used any distance to evaluate sample similarity (QIIME-R). The t-test was used to test the Weighted and Unweighted UniFrac distance between or within groups using QIIME. A total of 1000 Monte Carlo permutations were used to test the statistical significance. This fully described the differences in flora structure size between or within groups of chemotherapy-related rat fecal samples.
Finally, the massive amount of community data generated by high-throughput DNA sequencing in five rats (CK-H) groups necessitated more statistical analyses such as Constrained Ordination and Supervised Learning. The commonly used Constrained Ordering and Supervised Learning methods, including redundancy analysis (RDA), canonical analysis (CNA), and partial least squares discriminant analysis (PLS-DA, Variable Importance in Projection or VIP value in R), extracted the pattern characteristics associated with the original microbial community. These methods utilized known sample correlation (a sample distribution or grouping information) or a sample test indicator (a continuous variable). The greater the VIP value, the greater the species’ contribution to group differences. Furthermore, Adonis/PERMANOVA (permutational multivariate analysis of variance) analysis was performed using QIIME software to determine whether the differences between groups were statistically significant. In terms of p-value, the smaller the p-value, the greater the difference between chemotherapy groups of rats.
2.7. Identification of Microbiomes and Pathway Abundances
The UCLUST sequence alignment tool from Edgar (2010) [71] was used with the QIIME software to merge bacterial sequences with a similarity value of 97% into specific OTUs. The highest abundance in each outgroup was selected as the representative bacterial sequence as described for ITS and fungal sequences. The matrix file (i.e., OTU table) was then constructed based on OTU abundance in each sample. This matrix file (i.e., OTU table) was transformed to BIOM (Biological Observation Matrix) file format and transferred to other analysis tools. Using QIIME software with the default parameters, the taxonomy information for each OTU was obtained by comparing the representative sequence of the OTU to the template sequence of the corresponding database, as described for the analysis of ITS sequences. Different types of sequences (e.g., 16S rRNA sequences of bacteria or ITS sequences of fungi) were classified based on the corresponding database: (a) the 16S rRNA gene database for bacteria (Greengenes database; Release 13.8, http://greengenes.secondgenome.com, accessed on 1 March 2020) [88], and (b) the ITS sequence database for fungi (UNITE database; Release 8.0, https://unite.ut.ee, accessed on 1 March 2020) [89].
The microbiome analysis was two-step: (1) The classify–sklearn algorithm with QIIME2 (https://github.com/QIIME2/q2-feature-classifier, accessed on 1 March 2020) was used for the UNITE database (release 8.0; ITS) and Greengenes database (Release 13.8; 16S). Species annotation was performed in QIIME2 software using a pre-trained Naive Bayes classifier with default parameters for each ASV/OTU representative sequence. (2) The BROCC algorithm was used for the NT database (https://github.com/kylebittinger/q2-brocc#the-brocc-algorithm, accessed on 1 March 2020) [90]. We used blastn to align the OTU sequence with the NT database. Using this procedure, for fungal ITS sequences in the UNITE database, Candida (CUG-Ser1 clade, Debaryomycetaceae) and Pichia (Pichiaceae) were identified as two different genera (Candida: C. africana/albicans sp.; Pichia: P. aff. Alni/barkeri/bovicola sp.). The same was conducted for Penicillium (formal name) and Talaromyces fungi. The International Code of Nomenclature for Algae, Fungi, and Plants (ICN) mandated single-name nomenclature for fungi [91]. The abandonment of dual nomenclature resulted in significant changes in Penicillium and Talaromyces taxonomy and nomenclature. Houbraken and Samson (2011) demonstrated that species formerly classified in the Penicillium subgenus Biverticullium are resolved in a monophyletic clade with the former teleomorph genus Talaromyces. Still, the remaining Penicillium species are associated with the younger teleomorph genus Eupenicillium based on four phylogenies [92]. The general scientific community working on this fungus fairly accepted this classification (see [93]). Identification of Fusarium (=Gibberella) was assisted using www.fusarium.org, accessed on 1 March 2020 (monophyletic node F3) [94]. To identify fungal microbes, we used this categorization and nomenclature.
We used the localization of the nt (2019.8 downloads, ftp:/ftp.ncbi.nih.gov/blast/db, accessed on 1 March 2020) database for functional genes and other requirements such as pathway identification in MetaCyc (metacyc.org; 2722 pathways from 3009 various organisms) [95,96,97]. After obtaining the abundance data for those pathways, we attempted to identify bacterial metabolic pathways with notable differences between groups. Here, we applied the metagenomeSeq method (normalized pathway abundance). FitFeatureModel was used to fit the distribution of each ASV/OTU sequence with a zero-selective log-normal model and to assess the significance of the difference. These were the analysis’s findings for differences in MetaCyc metabolic pathways between groups: Group A referred to the A group before the folder name, and Group B was up-regulated relative to Group A when the value of logFC(log2(fold change)) on the horizontal axis was positive and down-regulated when it was negative. On the final data, the label for each different MetaCyc metabolic pathway is in the ordinate. Different colors indicate the level of significance.
Finally, the bacterial species composition of the various metabolic pathways was examined using the stratified sample metabolic pathway abundance table (PATH_abun_strat.TSV), which was based on the significantly different metabolic pathways. Even low-level bacterial taxa were used to help label particular metabolic pathways in the MetaCyc database [98]. We used the “-f $pathway” option when calling humann2_barplot_py to specify the specific metabolic pathways examined. The ordinate value was set as the relative abundance, the abscissa was arranged according to the sample group, and the samples within the group were arranged according to similarity. By default, we conducted bacterial species composition analyses for MetaCyc metabolic pathways with differences.
3. Results
3.1. Microbiome Comparison in Rat Groups in Relation to Chemotherapy and Lactobacillus
This innovative study investigates the fecal microbiota of rats subjected to chemotherapy (cyclophosphamides for cancer). It shows significant gut health improvement when co-treated with a cocktail of three Lactobacillus spp. Despite the smaller sample size (N = 50), the topic is extremely important in cancer pharmacological treatments. This is due to the fact that cyclophosphamides (CTX) used against cancerous tumors are frequently found to severely damage the patient’s immune system. We used rats that did not have cancer. They were healthy rats severely harmed by CTX treatments (chemotherapy). The CTX-bioproduct study design includes five different experimental groups: healthy control rats (1), treated rats (CTX chemotherapy) that were either only treated with CTX (2), or treated with CTX and a low (3), middle (4), or high (5) complement dose of Lactobacillus spp. (Figure 1). In a previous study, leukocyte concentration, CD4/CD8, interleukin, and TNF-alpha expression were measured in each group (1–5), showing that CTX has a significant effect on the rat immune system (see [65]). Here, the microbiome was assessed in each group (1–5) using ITS and 16S rRNA gene sequencing on the Illumina MiSeq platform, suggesting that health can be maintained despite cyclophosphamide CTX when using Lactobacillus (Figure 2, Figure 3, Figure 4, Figure 5 and Figures S1–S13, and Table 1, Table 2, Tables S1–S4).
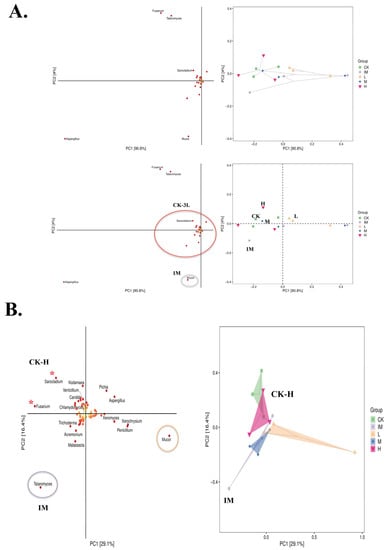
Figure 2.
Principal Component Analysis and fungal species matrix in five groups of rats related to chemo and Lactobacillus. (A) Partial Least Squares Discriminant Analysis (PLS-DA) in CK-H groups. Fungal species matrix (left) and sample grouping data (right) based on each species’ Variable Importance in Projection (VIP). VIP > 1, the greater the value, the greater the species’ contribution to the differences between groups. Mucor contributes significantly to the differences between the IM (immune-attacked, ill, CTX, chemo) and other groups (CK: control, healthy conditions, and L-H: Lactobacillus-treated). Lactobacillus tritherapy: L. acidophilus SD65, L. casei SD07, and L. plantarum SD02 (3L). L: 3L-low dose (1.25 mg/kg); M: 3L-middle dose (2.50 mg/kg); H: 3L-high dose (5.0 mg/kg). Each point or dot represents a sample; dots of the same color belong to the same group, and the same groups (three points or dots) are denoted by ovals (right). The closer the distance between similar groups and the greater the distance between different groups, the better the classification model. H-dose and CK groups are very close on the PLS-DA classification model for chemotherapy-related rats and Lactobacillus, with IM as the far point (R(v3.1.1), BGI Co., Ltd.; Beijing Genomics Institute, Beijing, China). (B) Discriminant Analysis using Orthogonal Projection to Latent Structures (OPLS-DA). Fusarium and Sarocladium play a significant role in the differences between CK-H groups and IM (see *). Talaromyces is associated with IM conditions (see circle in purple). Mucor is associated with CTX + low-dose of 3L bioproduct (see circle in orange). The high 3L probiotic treatment samples (H, in pink) cluster with the non-treated controls (CK, in green; Sarocladium, Kodamaea, Verticillium, Candida, Chlamydomyces, and Fusarium).
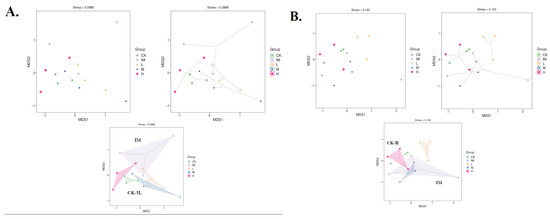
Figure 3.
Unweighted UniFrac Nonmetric MultiDimensional Scaling analysis of CTX + 3L rat groups. Each point represents a different sample, and different colored points represent different groups (CK: control, healthy conditions; IM: immune-attacked, ill, CTX treatment; L: 3L-low dose; M: 3L-middle dose; H: 3L-high dose). The shorter the distance between the two points, the greater the similarity between the two samples in terms of microbial community structure. (A) Bray–Curtis index (common, ellipse, and hull). (B) Jaccard index (common, ellipse, and hull). In (A,B), the distance between the two samples or groups is very close, and the similarity of the microbial community structure between the two samples or groups is very high (in (A): CK and 3L; in (B): CK and H; R(v3.1.1), BGI Co., Ltd.).
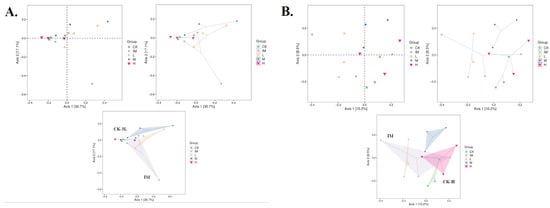
Figure 4.
Beta-diversity analysis of five rat groups in relation to CTX chemotherapy and Lactobacillus. Each point represents a different sample, and different colored points represent different groups (five groups/CK: control healthy conditions; IM: immune-attacked, ill, CTX-treated; L: 3L-low dose; M: 3L-middle dose; H: 3L-high dose). The shorter the distance between the two points or dots, the greater the similarity of the microbial community structure between the two samples. The percentage in parentheses in the coordinates (X-axis, 1st principal component, Axis 1; Y-axis, 2nd principal component, Axis 2) represents the proportion of the differences in the original data that the corresponding principal component can explain. (A) Principal Coordinates Analysis (PCoA) derived from unweighted and weighted UniFrac and Bray–Curtis index (common, ellipse, and hull). (B) Principal Coordinates Analysis (PCoA) derived from unweighted and weighted UniFrac and Jaccard index (common, ellipse, and hull). (A,B) The distance between the two groups is very close, as is the similarity of the microbial community structure between the two groups (in (A): CK and 3L; in (B): CK and H; R(v3.1.1), BGI Co., Ltd.).
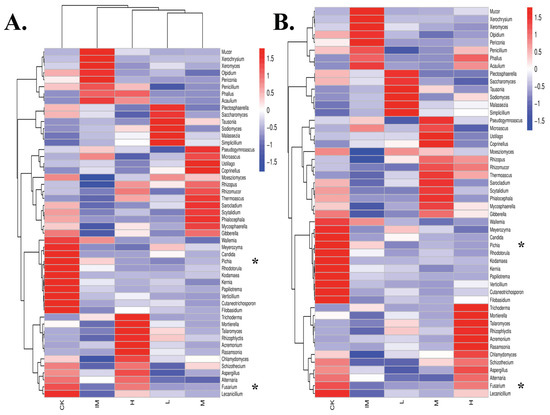
Figure 5.
Clustering of fungal species based on abundance (heatmap) in rat samples in relation to CTX chemotherapy, + 3L-treatment, and improved gut microbiome strength. Fungal genus-level log-scaled percentage heatmap in rat groups. Different colors represent various groups: (1) normal (control healthy, CK), (2) ill (immune damaged, IM), (3) chemotherapy + 3L-low dose (L), (4) chemotherapy + 3L-middle dose (M), and (5) chemotherapy + 3L-high dose (H). The similarity of all fungal species is indicated by longitudinal clustering between the five rat groups. Horizontal clustering denotes the resemblance of specific fungal genera among the five rat groups (CK-H). The closer the distance and the shorter the branch length, the more similar the genus composition is between the groups and samples. (A) Hierarchical clustering based on both groups and taxa (variables: columns and rows). The relative abundance of specific fungal genera is used to link groups (map both clustered). (B) Hierarchical clustering on taxa (variable: rows). The ordering of groups or samples is unaffected by the relative abundance of fungi (map taxa clustering). Fifty differentially regulated fungi are shown in the genus heatmap of rat groups in relation to chemo/3L. * shows a lack of Pichia in Lactobacillus groups and an abundance of Fusarium in both CK and H. Color gradients represent the amounts of individual fungal genera. The color gradation from red firebrick to navy–blue represents a decrease in the abundance of the fungal genus (R(v3.1.1), BGI Co., Ltd.).

Table 1.
Mycobiome (Genus of fungi and yeasts) composition in relation to Lactobacillus and cyclophosphamide treatment in five groups of rats. CK: control healthy conditions; IM: immune-attacked (CTX); L: CTX + 3L-low dose; M: CTX + 3L-middle dose; H: CTX + 3L-high dose. Treatment for Lactobacillus: tritherapy (3L) = L. acidophilus SD65 + L. casei SD07 + L. plantarum SD02. The group’s dominant genera are highlighted in bold. ° shows fungal genera specifically increased by a 3L M-dose in cyclophosphamide conditions. * indicates increased genera in CK and/or H groups.
Table 2.
Mycobiome (Phylum, Class, Order, Family, and Genus of fungi and yeasts) composition in relation to Lactobacillus and cyclophosphamide treatment in five groups of rats. CK: control healthy conditions; IM: immune-attacked (CTX); L: CTX + 3L-low dose; M: CTX + 3L-middle dose; H: CTX + 3L-high dose. Treatment for Lactobacillus: tritherapy (3L) = L. acidophilus SD65 + L. casei SD07 + L. plantarum SD02. The group’s dominant genera are highlighted in bold. * displays a significant increase in specific microbes in CK and the three Lactobacillus group doses (L, M, and H). ° shows a marked reduction in specific microbes caused by CTX chemotherapy. † shows increased microbes under chemo (see IM) but not under chemotherapy + Lactobacillus conditions (see L, M, and H).
The Venn Diagram depicting the relationships between the five groups in relation to chemotherapy and Lactobacillus suggested a relationship between healthy control and CTX + increasing dose of Lactobacillus spp. (CK and M-H; Figure S1). The circles’ position, configuration, and overlap, indicating the relationships between the groups, showed a gradual increase in gut flora and overall health depending on the Lactobacillus spp. complement dose (L-to-H; Figure S1). The IM group (CTX alone) was further along the bottom, representing a higher number of total unique OTUs (17.24%), similar to the L dose (number of total unique OTUs: 15.82%). The Venn diagram showed that the core microbiomes in the H and control groups were related when we looked at the number of total unique OTUs (10.52–10.82%). However, the M complement doses of Lactobacillus spp. remained too closely related to CTX alone conditions (15.07%; Figure 2A). The middle complement dose (×2, two-fold) fell between the control (CK) and immune-damaged (IM) groups (Figure S1). The H-dose group was opposite the IM group, with no overlap with the control group (CK). As a result, increasing the Lactobacillus concentration (more than fivefold) appeared to be required to produce an even more significant beneficial effect on the microbiome of rats treated by CTX (Figure S1).
The five groups appear to have relatively similar levels of similarity on Venn diagrams (Figure S1). All samples (three per group) and OTU numbers were consistent across the groups CK-H. In each group, approximately the same number of ITS and 16S sequences were obtained in different biological replicates (Table S1). The five different groups obtained roughly the same sequence quantity (Table S1). There were no differences in the number of OTUs found at each taxonomic level (phylum, class, order, family, genus, and species; Tables S2 and S3). Although all OTUs could be classified, the classification of OTUs at different taxonomic levels in five rat groups related to chemotherapy and Lactobacillus treatment revealed no discernible differences in OTU counting (Tables S2 and S3). This was seen in both grouped (CK, IM, L, M, and H) and ungrouped (C101, C103, C105, IM015, IM021, IM024, L102, L103, L104, M201, M202, M203, H105, H204, and H205) samples (Tables S2 and S3). As a result, the sample sizes were similar, particularly for Family and Genus (Figure S2). Using the OTU table for sample diversity in PCA, rank abundance curve, NMDS, principle coordinates analysis (PcoA), Bray–Curtis distance plot (default semimetric), binary Jaccard distance matrix (metric), and UPGMA, however, H was clustered with CK.
The PCA based on OTU composition revealed significant differences in the five groups (Figure 2A,B). At the community level, PCA revealed similarities between the chemotherapy + high lactobacillus spp. and control groups, with Fusarium, Talaromyces, Sarocladium, Aspergillus, and Mucor falling outside a common spectrum of microbe genera (Figure 2A).
Orthogonal Projections to Latent Structures and Discriminant Analysis (OPLS-DA) showed Mucor and Talaromyces to be associated with ill conditions (chemotherapy alone), but a wide range of microbes to be associated with control and chemotherapy + high Lactobacillus conditions (Figure 2B). The OPLS-DA analysis showed that the distances between the CK and H groups were very small, while the L, M, and IM groups were clearly separated. Fusarium, Sarocladium, Kodamaea, Verticillium, Candida, and Chlamydomyces were among the fungi with overlapping distributions in the two groups, CK and H. Trichoderma, Acremonium, and Malassezia were more closely associated with the Lactobacillus groups H, M, and L. Pichia and Aspergillus were separated from this group but mixed with the CK control group. Microbial fungi, such as Mucor, Talaromyces, Xeromyces, Xerochrysium, and Penicillium, were associated with CTX and the immune-damage group (Figure 2A,B).
In addition to PCA, CK-samples tended to cluster with H-, M-, and L-samples in NMDS (Figure 3). The IM group differed significantly from the other groups, with clear mean differences between microbiomes from CTX-treated samples and those from controls (no treatment) and rats treated with Lactobacillus in addition to CTX (Bray-Curtis; Figure 3A). The NMDS graph using the Jaccard index collapsed very clear information: CK was grouped with H-samples, showing mean similarities between H-microbiomes and controls (Jaccard; Figure 3B). The same grouping was observed using PcoA as a principle analysis, lending support to PCA and NMDS (Figure 4). Both the Bray–Curtis (abundance) and Jaccard (0/1 data) indices showed a pair of communities with comparable species richness (H and CK; Figure 4). The similarity between the CK and H samples was confirmed by unweighted and non-metric MDS analysis (UPGMA). H branches clustered with CK with a low distance value (0.005–0.0028) on the UPGMA tree (Figure S3A). There were also unweighted pairs found between the M and L groups (distance values 0.031–0.111, Figure S3A; 0.003, Figure S2B). The branches representing the immune-damaged group (IM) clustered at the bottom of the tree, indicating the mean distance (or difference) of IM compared to CK, H, M, and L (Figure S3). Therefore, many of our results (PCA, PcoA, NMDS, and UPGMA) show Lactobacillus-control clustering. Still, even in these plots, it is difficult to see how much closer the high Lactobacillus group is to controls compared to IM because of the large outlier within the IM grouping (Figure 2, Figure 3, Figure 4, Figure 5 and Figure S3). We could not conclude that the control and Lactobacillus groups had more microbial diversity. Still, in our rank abundance curve (i.e., species richness and species evenness), the IM group (CTX alone) was further along the x-axis, representing a higher number of total unique OTUs (Figure S4). We used specaccum (number of species vs. number of samples) to show how species richness increased as sample size increased. The curve rapidly reached a plateau. There were no significant differences in species richness when increasing the number of samples (up to 12) lumped into a single analysis, which was not conducted on a per-group basis (Figure S5). In grouped and ungrouped samples, the Chao1, Simpson, Shannon, Pielou_e, observed species, and Goods_coverage indices (alpha-diversity) were calculated (Figure S6 and Table S4). These indices (Chao1, Pielou_e, and observed_species) indicated that the CK and H groups had similar community richness and species evenness (Figure S6 and Table S4). The goods_coverage index showed significant differences between H and IM. Goods_coverage metrics at OTU levels (sample completeness, p = 0.76) showed a high level of microbial diversity in H (Figure S6 and Table S4).
3.2. Mycobiome of Five Different Groups of Rats Profiled in Relation to Chemotherapy and Lactobacillus
Examining individual taxon abundance using heatmaps was useful for analyzing fungal taxa clustering based on the abundance of each fungus in the five rat groups (Figure 5 and Figure S7). A heatmap analysis of fungi revealed the relative abundance of each taxon in CK, IM, H, M, and L. In this descriptive study, Table 1 lists the various fungal taxa found in the CK, CTX, and 3L groups. From the Acaulium (syn. Scopulariopsis) genus to Xeromyces, several broad types of microbes were identified in the CK group (Figure 5 and Table 1). CK (control, healthy condition) had high levels of Candida, Cutaneotrichosporon, Filobasidum, Fusarium, Kernia, Kodamaea, Lecanicillium, Meyerozima, Papiliotrema (Cryptococcus), Pichia, Rhodoturula, Verticillium, and Wallemia. On the other hand, the IM group (immune-attacked) had high levels of Acaulium, Mucor, Olpidium, Penicillium, Periconia, Phallus, Xerochrysium, and Xeromyces (Figure 5 and Table 1). However, treating rats with Lactobacillus in addition to Cyclophosphamide increased the relative fecal abundance of many different fungal taxa, including Acremonium, Aspergillus, Chlamydomyces, Fusarium, Mortierella, Phallus, Rasamsonia, Rhizophlyctis, Rhizopus, Talaromyces, and Trichoderma (in the H group), Coprinellus, Microascus, Mycosphaerella, Phialocephala, Pseudogymnoascus, Rhizomucor, Rhizophlyctis, Rhizopus, Sarocladium, Scytalidium, Thermoascus, and Ustilago (in the M group), and Mallassezia, Plectosphaerella, Rhizophlyctis, Rhizopus, Saccharomyces, Simplicillium, Sodiomyces, and Tausonia (in the L group; Figure 5 and Table 1).
‘Phallus’ was found in the heatmap in cyclophophasmide-treated rats and rats treated with CTX + high 3L lactobacilli (Figure 5). Despite CTX treatment, medium and low doses of 3L were able to eradicate Phallus fungi, as shown by triplicate samples (Figure S7 and Table 1), even though Phallus infection was not prevalent in all IM samples (Figure S7). More interestingly, the heatmap analysis highlighted two taxa in particular, Fusarium and Pichia, which were found in high abundance in feces from control and high Lactobacillus-treated groups. These taxa were repeatedly found in control samples but significantly altered by chemotherapy (Figure 5 and Figure S7). Furthermore, there was a correlation between Rhizopus and Lactobacillus treatments. Chemotherapy significantly reduced Rhizopus levels but increased them when Lactobacillus was added to phosphamide. Rhizopus was found in abundance in the H, M, and L groups (Figure 5 and Figure S7). The Rhizopus microbe was more abundant in M samples (CTX + middle dose/2.5 mL/kg bodyweight of Lactobacillus), indicating that a specific dose of bioproduct should be chosen for effective regulation of specific microbes (Figure 5 and Figure S7 and Table 1). We found that high-, medium-, and low-dose 3L cocktail gavages were effective in lowering Acaulium, Mucor, Olpidium, Penicillium, Periconia, Xerochrysium, and Xeromyces levels (Figure 5 and Figure S7 and Table 1).
In our descriptive analysis of rats in relation to CTX and Lactobacillus, microbial composition distribution histograms of each sample were displayed at the phylum, order, class, family, and genus levels (Figure 6 and Table 2). The analysis included a total of 50 samples, considering both group-level and individual-level comparisons within the same chemotherapy session. This study involved the administration of one drug, five shots, and the addition of Lactobacilli. The analysis employed a 3L-test with three different doses, comparing the results with control samples to assess the beneficial effects. The dominant microbial phyla were similar in control and 3L therapy conditions (Figure 6A and Table 2). CTX, on the other hand, caused a significant decrease in Ascomycota levels, which was not seen with high doses of 3L during chemotherapy (Figure 6A). Many other microbial fungal phyla, including Basidiomycota, Kickxellomycota, and Mortierellomycota, benefited from 3L gavage (Figure 6A and Table 2). Mucoromycota and Olpidiomycota levels in rat fecal microbiomes increased during CTX chemotherapy but remained low when H, M, or L doses of Lactobacillus were added to CTX (Figure 6A and Table 2). Similarly, analysis of the distribution of microbial fungal classes, orders, families, and genera in the five rat groups showed specific beneficial effects of Lactobacillus treatment in addition to cancer chemotherapy (Figure 6B–E and Table 2). Dothideomycetes, Eurotiomycetes, Saccharomycetes, Sordariomycetes, and Tremellomycetes were the most abundant microbial fungal classes in healthy control rats without any other treatment than normal saline injection. CTX chemotherapy had a significant impact on all five classes. Chemotherapy also increased Mucoromycetes levels in the fecal microbiome. With high-dose injections of 3L, Dothideomycetes, Eurotiomycetes, and Sordariomycetes were kept at normal levels. Mucoromycetes were kept at normal levels in all three Lactobacilli-treated samples. After probiotic treatments, Agaricostilbocytes, Leotiomycetes, and Tremellomycetes were also recovered at normal levels (Figure 6B and Table 2). Eurotiales, Hypocreales, Saccharomycetales, and Trichosporonales were the most abundant microbes on an order level in CK and the H group. The IM group had a different microbial order profile, with significantly altered levels of Eurotiales, Hypocreales, Saccharomycetales, and Trichosporonales, as well as significantly increased levels of Mucorales. Lactobacillus treatment restored normal levels of Capnodiales, Cystofilobasidiales, and Glomerellales that had been affected by chemotherapy. Lactobacillus H, M, and L doses effectively controlled Mucorales levels. A low dose of Lactobacillus was also particularly effective in stimulating Mallasseziales levels, emphasizing the importance of controlling Lactobacillus dose to target specific microbial orders (Figure 6C and Table 2). Four major microbial families were identified in rat fecal samples related to CTX and 3L therapy: Aspergillaceae, Didymellaceae, Nectriaceae, and Pleosporaceae. Surprisingly, these microbial families were vulnerable to chemotherapy alone but were kept alive by combining 3L with CTX-chemo treatment (Figure 6D). To maintain the levels of Aspergillaceae, a gradual increase in 3L seemed to be required (Figure 6D). CTX also reduced the levels of Cordycipitaceae, Mycosphaerellaceae, Rhizopodaceae, Thermoascaceae, and Trichosporonaceae, but these levels were maintained when CTX was combined with Lactobacillus gavage. This was not true for all microbial families found in rat feces. Pichiaceae was a microbial family that was down-regulated after CTX treatment, which could not be reversed by adding Lactobacillus during chemo treatment (Figure 6D). However, Lactobacillus at high, medium, and low doses had a clear beneficial effect on Mucoraceae control (Figure 6D). Mucoraceae levels in the IM group were extremely high, which could be reversed by adding H, M, or L doses of Lactobacillus (Figure 6D). A low dose of the bioproduct induced especially high levels of Mallasseziaceae (Figure 6D and Table 2). Alternaria, Aspergillus, Fusarium, and Mycosphaerella were the main microbial genera characteristic of the CK and H groups, respectively, while Mucor was a diagnosis of immune damage caused by CTX treatment. The addition of Lactobacillus to chemotherapy effectively controlled Mucor. Mucor levels were extremely low in rats’ H, M, and L groups related to Chemo + Lacto treatment. On Xerochrysium, similar effects were observed. Xerochrysium levels rose during chemotherapy but were controlled by Lactobacillus at low, medium, and high doses. Other microbial genera, such as Chlamydomyces, Lecanicillium, Rhizomucor, and Sarocladium, were maintained by Lactobacillus at low, medium, or high doses. Only Pichia was not maintained by Lactobacillus treatment, regardless of the dose of the 3L bioproduct (Figure 6E and Table 2).
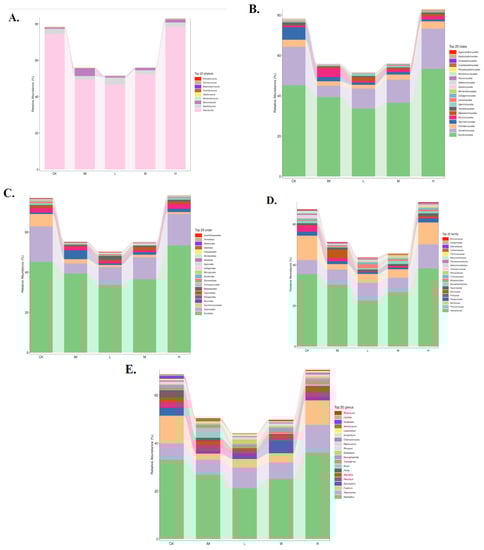
Figure 6.
Distribution of fungal taxa in rat groups in relation to CTX chemotherapy, 3L, and gut microbiome at the phylum, order, class, family, and genus level. (A) Phylum-level, (B) Class-level, (C) Order-level, (D) Family-level, and (E) Genus-level. Each fungal taxon’s ratio or relative abundance in a specific group is directly displayed (color code). The histogram was drawn at the phylum-to–genus level using the top 20 most abundant fungal taxa in rat fecal samples. The curve shows that the rat gut flora is down-regulated after chemotherapy, but the microbiome is up-regulated during high-dose Lactobacillus ((A–E), R(v3.1.1), BGI Co., Ltd.).
When all triplicates were compared (Figure S8), Ascomycota levels were remarkably high in CK and H triplicates (Figure S8A). In contrast, Ascomycota levels were particularly low in IM021, L103, and M201. Mucoromycota and Olpidiomycota were abundant in IM015 samples (Figure S8A). Mucoromycota and Olpidiomycota were significantly lower in Lactobacillus samples, particularly H (H105, H204, and H205). Mortierellomycota were missing in IM triplicates (IM015, IM021, and IM024) but present in C101, C103, L104, M202, M203, H105, H204, and H205 (Figure S8A). High levels of Sordariomycetes, Saccharomycetes, and Tremellomycetes were found in control triplicates (C101, C103, and C105) in ungrouped samples. Sordariomycetes and Tremellomycetes levels remained high in L102, L104, M202, M203, H105, H204, and H205. Eurotiomycetes were found in very low concentrations in IM021. Mucoromycetes were found in abundance in the IM015 sample. Eurotiomycetes and Mucoromycetes were kept under normal conditions in all H samples (Figure S8B). On the order level, IM015 was distinguished by a high Mucorales/low Saccharomycetales ratio (Figure S8C). Despite the fact that Saccharomycetales remained low in all H, M, and L Lactobacillus-treated samples, Mucorales levels in Lactobacillus samples were comparable to controls (Figure S8C). Furthermore, Capnodiales levels in medium and high Lactobacillus samples M202–H205 were comparable to those found in C101, C103, and C105. Glomerellales levels were high in both the control (C101 and C103) and Lactobacillus (L104) samples (Figure S8C). Microbial family profiling was diverse in all samples, particularly in the CK and H groups. C101, C103, C105, H105, H204, and H205 all showed high levels of Nectriaceae and Trichosporonaceae, as well as a variety of other families ranging from Aspergilaceae to Microascaceae. Notably, none of the Lactobacillus samples had the high levels of Mucoraceae found in IM015 (Figure S8D). In the genus taxa summary from ungrouped samples, IM015 had high levels of Mucor, whereas C101, C102, C105, L102, L104, M202, M203, H105, H204, and H205 had high levels of Fusarium but no Mucor to the extent seen in IM105 (Figure S8E). As a result, ungrouped samples of CTX-related rat fecal microbiomes and the effects of adding specific bioproducts also argued for Lactobacillus’ rather beneficial role in maintaining the host’s health microbiome during chemotherapy.
The analysis of metagenome sequence data (CK versus M) revealed a pattern that overlapped with enriched core microbes in the order Trichosporonales and the phylum Basidiomycota (Figure S9). The relative abundance of Fungi, Ascomycota, Sordariomycetes, Hypocreales, Nectriaceae, and Fusarium in CK and H class samples was very high (above 60,000–140,000). In the IM, L, and M classes of samples, the relative abundance of Fusarium fungi was less than 50,000 (Figure S10A). Fusarium was identified as a key biomarker (i.e., a key community member) of the CK group by LEfSe (LDA, Krustal–Wallis and Wilcoxon; Figure S10B). Comparative metagenomics and network analysis at the phylum level showed a high degree of similarity between control and Lactobacillus-treated rat fecal samples, as well as the dominance of Ascomycota in this network (Figure S11). This CK-Lactobacillus group is not associated with IM samples (in blue; Figure S11A). Mucoromycota (in orange) dominated in CTX-immune-attacked ill rat feces (Figure S11B).
3.3. CTX and CTX + Lactobacillus Therapy Effects on Bacteriome and Metabolic Pathways
The relative abundance of each functional category (biosynthesis, degradation/utilization/assimilation, generation of precursor metabolites and energy, glycan pathways, and metabolic clusters) was calculated using pathway abundance and read count abundance (MetaCyc; Figure S12). Differential abundance was found primarily for respiration, fermentation, fatty acid/lipid/carbohydrate degradation, and biosynthetic pathways (Figure S12A). Similarly, in MetaCyc, raw counts for metabolic pathways and enzymes, metabolites, and reaction orthologs revealed a strong statistical significance of differential abundance, primarily for cofactor, prosthetic group, electron carrier, vitamin, fatty acid, and lipid biosynthesis (Figure S12B). A specific pathway (PWY-7839), 6-hydroxymethyl-dihydropterin diphosphate biosynthesis I, converts GTP into pterin precursors (methanopterin and sarcinapterin) for the biosynthesis of several cofactors in specific bacterial strains. In our study, this pathway was particularly highly expressed in CK and Lactobacillus-treated samples. This increase in expression was due to an increase in S24-7 Muribaculaceae, Prevotella, Clostridiales, Bacteroides, and CF231 Paraprevotellaceae (Figure 7A). Treatments with M- and H-doses were clearly effective in increasing the levels of Bacteroides and Prevotella. Both of these are essential in the pyridoxine pathway required for vitamin B6 synthesis (PYRIDOXSYN-PWY, pyridoxal 5′-phosphate (PLP) biosynthesis I; Figure 7B). Furthermore, Lactobacillus treatment restored the abundance of helicobacterial taxa required for the TCA cycle (tricarboxylic acid cycle) or the Krebs cycle. Despite chemotherapy, with Lactobacillus treatment, not only Helicobacter levels but also “Flexispira” (in purple), Rothia, and Halomonas levels were maintained (Figure 7C). Lactobacillus L-, M-, or H-doses did not affect Bacillales. To control Halomonas, a high dose of 3L (5.0 mL/kg) was strictly required (Figure 7C). In IM samples, a formaldehyde oxydation peak was observed. This was linked to the emergence of Enterococcus bacteria in immune-compromised conditions (Figure 7D). Many Enterococcus species are known to be commensals and are not actively causing infection. In our case (Figure 7D), our results show a peak of Enterococcus linked to chemotherapy (CTX alone), implying that Enterococcus is an active infection. Adding Lactobacillus to chemotherapy completely eliminated it; no Enterococcus peak was observed in the CK, H, or M groups (Figure 7D). TCA-GLYOX-BYPASS, the superpathway or bypass that integrates the common prokaryotic Krebs cycle (TCA) with the glyoxylate shunt, benefited from Lactobacillus treatment during chemotherapy (+CTX). A high diversity of bacterial taxa was observed in both CK and H-dose conditions. Enrichment of Enterobacteriaceae, Rothia, Cupriavidus, Halomonas, and Devosia was detected in controls and persisted during CTX chemotherapy when an additive probiotic treatment with high doses of 3L was used. Treatment with Lactobacillus was ineffective on Bacillales at 1.25–5 mL/kg doses (Figure 7E). Lactobacillus at a medium dose (2.5 mL/kg) was particularly effective in stimulating Enterobacteriaceae (Figure 7E). Lactobacillus at a high dose (5 mL/kg) was particularly effective in stimulating Devosia (Figure 7E). Similarly, the additive Lactobacillus treatment positively regulated Bacteroidales, Bacteroides, Enterobacteriaceae, Halomonas, and Devosia responsible for (prokaryotic) TCA cycle I (Figure 7F). CTX chemotherapy and/or treatment with 3L bioproduct significantly impacted tRNA charging and the microbiome. We observed the main stimulatory effects of 3L on S24-7, Prevotella, Bacteroides, Ruminococcus, CF231, and Oscillospira using high doses of Lactobacillus 3L (Figure 7G). Finally, Illumina and MetaCyc analyses revealed that a middle dose of Lactobacillus had a strong effect on Enterobacteriaceae, which mediates the bacterial superpathway of coenzyme Q ubiquinol-8 biosynthesis (UBISYN-PWY, Figure 7H).
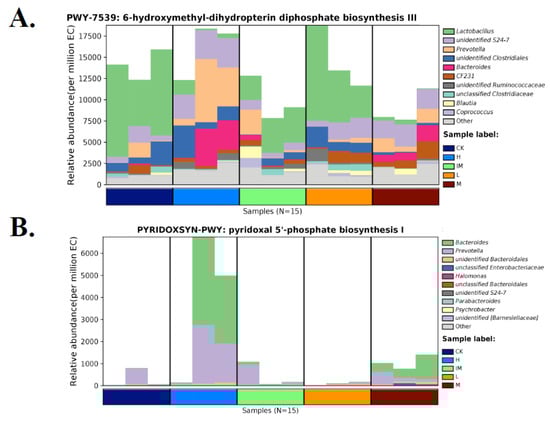
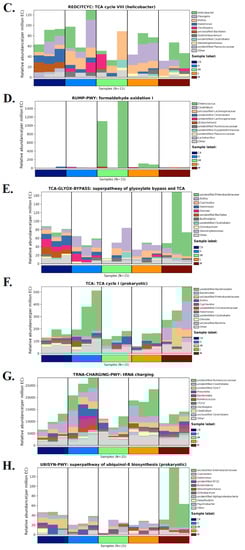
Figure 7.
Species distribution map of distinct MetaCyc metabolic pathways in rat groups in relation to chemotherapy, the addition of 3L bioproduct to the gut, and immune strengthening. Each group had three samples tested. CK: normal (control healthy), IM: immune-damaged (ill), L: chemotherapy + 3L-low dose, M: chemotherapy + 3L-middle dose, H: chemotherapy + 3L-high dose. (A) 6-hydroxymethyl-dihydropterin diphosphate biosynthesis III; (B) Pyridoxal 5′-phosphate biosynthesis I; (C) TCA cycle VIII; (D) Formaldehyde oxidation I; (E) Superpathway of glyoxylate bypass and TCA; (F) TCA cycle I, (G) tRNA charging; and (H) Superpathway of ubiquinol-8 biosynthesis. The abscissa is composed of various sample labels that are grouped according to various colors. The groups’ samples are arranged in accordance with how closely the data match. The relative abundance of metabolic pathways is represented by the ordinate. At the same taxonomic level (genus level is used by default), the contributions of various taxon species to the metabolic pathway are displayed in various colors. With control of CK and healthy conditions for both metabolism and gut flora, a high dose of Lactobacillus (H group) is ordered.
When other types of metabolic pathways were examined (MetaCyc), the effects of Lactobacillus and CTX were less obvious (Figure S13). No particular bacteria were found for the MetaCyc L-methionine salvage cycle III (PWY-7527, Figure S13A). Lactobacillus doses (M and H) primarily stimulated the anaerobic pathway for oleate biosynthesis IV (PWY-7664). However, one sample from the IM group had a much higher abundance of this pathway than the majority of the Lactobacillus groups. The medium group appeared to have higher overall levels than the high group, possibly indicating an effect of 3L on this pathway (Prevotella and Bacteroides), but making any dose–response relationship difficult to determine (Figure S13B). M- and H-doses of the bioproduct apparently had similar beneficial effects on mycolate biosynthesis (PWYG-321), with high levels of Bacteroides accumulating in M-treated samples (Figure S13C). Analysis of bacterial strains involved in the pathway of teichoic acid (poly-glycerol) biosynthesis, which is part of cell wall biogenesis, seemed to positively affect the 3L bioproduct (M and/or H) as an additive to chemotherapy. Lactobacillus contributed to the low levels of Clostridiales, Mogibacteriaceae, Ruminococcaceae, and Gemella, while strains such as Jeotgalicoccus were stimulated (Figure S13D). Except for enterobacter in some low-dose Lactobacillus samples, no specific bacterial strains were identified for the superpathway of L-threonine metabolism (Figure S13E). Chemotherapy (immune-attacked; IM) reduced the levels of Clostridiales, Ruminococcaceae, Ruminococcus, and Oscillospira in the pathway UDP-N-acetyl-D-glucosamine biosynthesis I (UDPNAGSYN-PWY), which could be avoided by combining CTX with a high dose (5 mL/kg) of Lactobacillus (Figure S13F).
4. Discussion
Cancer, a cell disease caused by DNA changes, is a major burden and threat to human health worldwide. When chemotherapy is envisioned as the primary or perhaps only way to prevent cancer development, it poses an increased risk to human health. Using one or more anticancer chemical drugs, such as cyclophosphamide (cytophosphane, CTX), kills lymphoma or any cancer cells. Still, it also kills or seriously alters the patient’s immune system, potentially limiting life and health expectancies, just like the disease.
This was shown in a previous study by Zhang et al., in rats, where CTX was shown to alter several immune marker indicators such as the number of white blood cells, the CD4+/CD8+ ratio, the serum levels of interleukin 6 (IL-6) and interleukin gene expression (see [65]). In a previous study using the same chemotherapy rat model (see Figure 1), CTX increased the expression of the TNF-alpha cytokine. TNF-alpha is an endocrine mediator of inflammatory and immune functions and is known to regulate cell growth and signaling. However, it is also associated with many side effects of cytotoxicity in transformed cells, which was another indication of immune attacks in CTX conditions [65]. Our study of chemo-damaged rats also describes this when a strong, beneficial, and healthy gut flora is suppressed by CTX treatment. The microbiomes of five groups of rats were examined in relation to chemotherapy. It was found that rats given CTX had completely altered microbiomes with peaks of harmful strains (Enterococcaceae, Mucor, and Xerochrysium). Despite chemotherapy, we also establish strong, healthy conditions in rats by demonstrating that Lactobacillus treatments are particularly effective at preserving healthy gut flora in the rat intestine: Enterococcaceae, Mucor, and Xerochrysium are kept at extremely low levels. Conversely, beneficial strains become extremely abundant (see Figure 2, Figure 3, Figure 4, Figure 5, Figure 6, Figure 7, Figure 8 and Figures S1–S13). Though there have been previous reports on using Lactobacillus in gut flora and gastrointestinal tract protection [99,100,101,102], we will always seek the best solution. We are still looking for a probiotic remedy that strongly and significantly impacts the adverse effects developed by CTX therapy, is active on beneficial microbes, improves microbial balance, activates nutrients, and stimulates gut-powered immune systems. Based on the findings of the current study, we can state that the 3L contributes to the maintenance of healthy gut flora by influencing the number of particular beneficial microbial species (Burkholderiaceae, Defferibacteraceae, Halomonadaceae, Helicobacteraceae, Hyphomicrobiaceae, Micrococcaceae, Muribaculaceae, Prevotellaceae, and Staphylococcaceae), as illustrated in Figure 2, Figure 3, Figure 4, Figure 5, Figure 6, Figure 7, Figure 8 and Figures S1–S13.
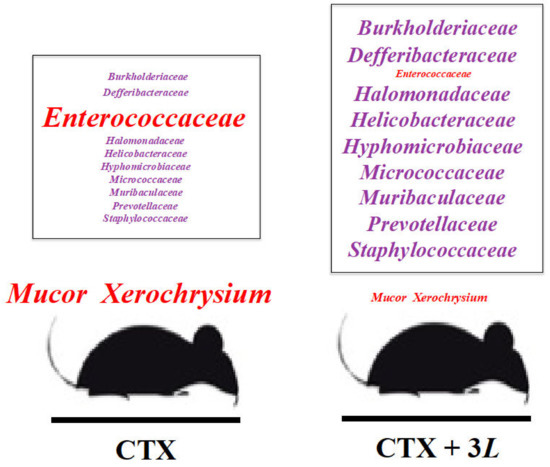
Figure 8.
Regulation of gut microbiome by adding 3L to cyclophosphamide (CTX) chemotherapy in rats. The addition of 3L-Lactobacillus tritherapy to CTX treatment reduces Mucor, Xerochrysium, and Enterocococcaceae (in red). 3L promotes the growth of numerous beneficial bacterial families (in purple: Burkholderiaceae, Defferibacteraceae, Halomonadaceae, Helicobacteraceae, Hyphomicrobiaceae, Muribaculaceae, Prevotellaceae, and Staphylococcaceae) that correspond to various metabolic pathways (see Figure 7). 3L (Lactobacillus bioproduct): L. acidophilus SD65, L. casei SD07, and L. plantarum SD02. L: 3L-low dose (1.25 mg/kg); M: 3L-middle dose (2.50 mg/kg); H: 3L-high dose (5.0 mg/kg).
The use of probiotics in chemotherapy is still uncommon, not applicable to all ages and populations, and an emerging field with many contradictory clinical results regarding interaction with the host or patient consumption [103,104]. Manipulation of the microbiota by natural probiotics vs. chemical drugs is a constant challenge in human and veterinary medicine, especially for genetic diseases such as cancer. The safety and stability of chemotherapeutic drugs such as CTX in cancer clinical trials are questionable [105,106]. We always look into clinical trials for anticancer methods that are highly efficient, have a low resistance capacity, and have no impact on the patient’s quality of life or health conditions. Some chemicals can cause the organism to develop resistance. Repeatedly using the same class of chemicals to control a disease, such as cancer, can have various negative consequences. When the organism becomes ill and resistant, the chemical (CTX) is used more frequently, and the adjuvant must eventually be added as the CTX level rises. Despite this, no comprehensive microbiological medical study of the impact of Lactobacillus during chemotherapy has been conducted. The rat response to a new bioproduct (3L: L. acidophilus + L. casei + L. plantarum) added to chemo/cyclophosphamide CTX shots was studied as a preliminary set for more extensive biomedical cancer research. The purpose of this study was to study the effect of Lactobacillus therapy on immune dysfunction and genotoxicity induced by cyclophosphamide in rats (cyclophosphamide is an immunosuppressive and antineoplastic drug). The rats we used in this straightforward pilot test were healthy rats that received the chemical substance cyclophosphamide CTX; they were not sick or malignant. We plan to use animals with tumors and treat them with cyclophosphamide and Lactobacillus using the same experimental ‘in vivo’ setup. We also plan to treat “animals de compagnie”, pets, and humans with different chronic diseases and Lactobacillus.
We present MiSeq data for rat feces microbiome variations under five different conditions: normal and healthy, CTX chemotherapy and immune attack, and low, medium, and high doses of Lactobacillus (3L). We particularly focus on the fungal composition at the phylum, class, order, family, genus, and species levels (see Figure 5, Figure 6 and Figures S7–S11). We show in this study that rats given CTX plus high doses of a new natural microbial biomedical product, the bioproduct 3L, have preserved microbiota (Burkholderiaceae to Staphylococcaceae) that are critical for maintaining a strong immune system and a healthy condition. Such findings are especially significant because it has been established that microbial dysbiosis is associated with carcinogenesis in cancers ranging from the colon to the liver to the pancreas. In particular, the growth of nocive fungi (Malassezia) in the gut microbiome can promote oncogenesis by activating mannose-binding lectins [107] and urging medication to control the microbiome and MBL.
Chemotherapy has been shown to alter immune, metabolic, and physiological functions and potentially stimulate invasive fungal infection in patients [108,109]. Therefore, it is not surprising that CTX alters gut flora and increases Mucor or Xerochrysium infection in groups of rat models (see Figure 5, Figure 6 and Figures S7–S11, and Table 1 and Table 2). The most striking finding of our study in five groups of rats in relation to chemotherapy is perhaps the beneficial regulation of gut flora after Lactobacillus (3L) supplementation at various doses. High doses of 3L have been shown to maintain beneficial, healthy normal gut flora in CTX-treated rats (see Figure 2, Figure 3, Figure 4, Figure 5, Figure 6, Figure 7 and Figures S1–S12, and Table 1 and Table 2). These findings urge the method of lactobacillus treatment additive to CTX to be tested on cancer rat models. We show that high doses of L. acidophilus, L. casei, and L. plantarum are especially important for regulating Ascomycota and Capnodiale levels. Ascomycetes are well-known for their use in medicine, producing antibiotics such as penicillin and cephalosporin [110]. Additionally, endophytic sooty mold fungi (Dothideomycetes) can be important for tissue health, environmental adaptation, and stress tolerance [111]. Therefore, this could be a significant discovery for cancer treatment. Interestingly, high doses of 3L (H treatment) have been shown to stimulate the levels of many different fungi families, including Aspergilaceae, Microascaceae, Nectriaceae, and Trichosporonaceae.
Additionally, there are regulated species of fungi that are not known to be pathogens or animal commensals. Lecanicillium fungi are classified as generalist entomopathogenic fungi [112]. Ustilago is a Poaceae plant pathogen [113]. Phallus mushrooms have big visible fruiting bodies [114]. However, the presence of these fungi in the rat microbiota is not necessarily suspect and may merit further investigation. The breeding history of rats occurs in the Institute of Medicine’s Class II animal facility in SAMS (Specific Free Pathogen/SPF facilities and acute hospital care settings designed to keep organisms in sterile environments). Saprophytic basidiomycetes are well-known wood-decaying fungi, but Phallus sequences have been found in the animal penis and urethras, where they play a role in male fertility [115]. In fact, little is known about the fungal flora of rodents’ digestive and reproductive tracts. Lecanicillium species are pathogens that parasitize insects, worms, and many other fungi, which could explain their presence in gut fungi associated with rats. Lecanicillium strains have been found in gut fungi associated with marmots [116]. A large variety of ‘forgotten’ odd fungi, including Ustilaginales and Ustilago sp., are found in the human digestive tract [117,118,119,120], as seen in rodents (Figure 5 and Table 1). Therefore, it is unsurprising that fungal sequences such as Lecanicillium, Phallus, and Ustilago have been found in the fecal DNA of CTX-rat models. It has been described in a variety of other animal species, including humans. What is more unusual or surprising is the discovery that these fungi are differentially regulated by CTX and/or 3L conditions. This is a critical key point in addressing their prevalence in the gut microbial system (Figure 5 and Table 1).
Although many of these fungi are plant, insect, and human pathogens, many are also biodegraders and biocontrol agents that could be used in medical applications [121]. For example, given that these ascomycete fungi can help degrade residual CTX and control cyclophosphamide toxicity [122], this could be used in chemotherapy. Another important aspect of using chemo and Lactobacillus is that 3L (high dose, 5.0 mL/kg) has been shown to keep pathogens such as Mucormycetes (Mucormycota, Mucoraceae) and Chytridiomycetes (Olpidiomycota, Olpidiaceae) at bay (see Figure 6 and Figure S8 and Table 1 and Table 2). High Mucorales typically invade the blood vessels and are linked to emerging infectious diseases such as mucormycosis in addition to other zygomycoses [123]. Chytrid fungi cause chytridiomycosis, an emerging disease in amphibians, and subcutaneous phycomycosis in humans [124]. As a result, this is a comprehensive pattern of many different fungal infections that could be regulated by Lactobacillus bioproduct 3L. Furthermore, 3L can potentially influence the magnitude of beneficial fungal components of the intestinal microbiota, known as the gut mycobiome. Some fungi from the diet or the environment play an important role in mediating interactions in gut bacterial communities and regulating metabolic homeostasis. This is true for Eurotiales, Hypocreales, Saccharomycetales, and Trichosporonales, all of which are important components of the healthy mycobiome in both control and 3L-treated rats (see Figure 6 and Figures S7–S11, and Table 1 and Table 2). The structure of the human gut microbial community is determined by genetics and environmental factors. However, the fungi that mediate changes in this structure and cause disease are relatively common in humans and rodents [125,126]. Although it is commonly assumed that probiotics do not colonize the digestive tract or other parts of the human body, there is evidence of transient probiotic or foodborne strain colonization of the human gut via various mucoadhesion-related proteins on the probiotic cell surface [127,128]. There is also the option of encapsulating three Lactobacilli [129]. As a result, it may be critical to use 3L during cancer chemotherapy to maintain the mycobiome balance, microbial community interactions, bacterial–fungal interactions, fungal–fungal interactions, and host–fungal interactions [130]. CTX injections, similar to diabetes [131], caused significant changes in Mortierellomycota levels, which could be reversed by adding 3L (see Figure S8A). Therefore, using a 3L mix could be extremely useful in targeting specific components of the mycobiome (Mortierella), which plays a key role in developing diseases ranging from cancer and chronic diseases to diabetes.
It is probably crucial to remember that the potential for treating or enhancing the health of 3L tested in rats can be dose-dependent. To treat the rats for Mallasseziomycetes, a low dose of 3L Lactobacillus cocktail (1.25 mL/kg) was required (see Figure 6C and Table 2). This could be important in medications for specific pathologies, such as colorectal cancer. Mallasseziomycetes fungi are associated with late-stage colorectal cancer [132]. However, Lactobacillus ingredients must eventually be gradually increased in order to regulate a specific fungal group, such as Aspergillaceae, Cordycipitaceae, Mycosphaerellaceae, Rhizopodaceae, Thermoascaceae, and Trichosporonaceae (see Figure 6D and Table 1 and Table 2). During chemotherapy, it is critical to regulate the gut fungal mycobiome. The gut mycobiome is involved in microbiome assembly and immune functionality, prompting the modulation of specific fungi to regulate both the gut microbiome and the immune system during chemotherapy [133]. While 3L is effective in modulating yeasts in the order Saccharomycetales (Ascomycota; see Figure 6 and Table 2), Pichia is one of the few microbial genera that is affected by CTX chemotherapy but does not respond to Lactobacillus treatment (see Figure 6E and Table 1 and Table 2). One possible explanation is that 3L controls gut fungi but not oral fungi or genera such as Pichia and Candida [134]. Perhaps the formulation of 3L can still be improved to treat both oral and gut mycobiomes. Adding one or more Lactobacillus strains, such as L. reuteri, to 3L may be very effective in controlling the entire mycobiome on oral and gut tissues (see Jørgensen et al., 2017 [135] and our descriptive study on 3L in chemo).
The plethora of metabolic functions maintained by 3L treatment in five groups of rats in relation to CTX chemotherapy was one of our study’s most striking findings about Lactobacillus and chemo (see Figure 7, Figures S12 and S13). Not only cancer but also chemotherapy has a significant impact on cell metabolism [136,137,138,139]. Therefore, targeting chemotherapy (and cancer) metabolism as a complementary strategy is a promising approach for disease intervention and preserving physiological functions in the patient’s immune system. After treatment with our three Lactobacilli cocktail (3L), we find that the gut flora of chemotherapy-treated rats is rich in Firmicutes–Clostridia–Clostridiales-S24-7, as found in healthy control conditions (see Figure 7A,G). Overall, the detailed composition of the bacteriome using MetaCyc data suggests shared patterns of microbial strains and metabolic activities in healthy and 3L-treated groups for a wide range of systems. Bacteroidales–Muribaculaceae-S24-7 is an important component of the microbiome for carbohydrate metabolism, while Deferribacteraceae upregulates genes for amino acid and vitamin metabolism [140]. In the gastrointestinal tract, Bacteroidales–Prevotellaceae–Prevotella–Paraprevotella plays a key role in glucose (central carbon) metabolism, polysaccharide breakdown, glycogen storage, sulfate assimilation, and the production of propionate, which has anticancer and anti-inflammatory properties [141,142,143,144]. Campylobacterales–Helicobacteraceae–Helicobacter (pylori) is not always infectious or linked to metabolic syndromes such as atherosclerosis. In many cases, it can be considered very beneficial to prevent the development of autoimmune diseases in humans. H. pylori can aid in the regulation of fatty acid metabolism. H. pylori is also known to contribute to the metabolic fate of pyruvate to lactate–acetate, nucleotide biosynthesis, oxidative metabolism, and cellular respiration [145,146,147]. This dual aspect (“beneficial pathogen”) highlights the significance of our finding with 3L controlling Helicobacter levels during chemotherapy (see Figure 7C). This includes the ability of 3L to control Helicobacter of the genus Flexispira, a urease-producing microorganism from the mid-colon and jejunum in humans. Typically, this microorganism is associated with diarrhea symptoms and complete febrile illnesses such as malaise, arthralgias, pain, leg swelling, and polyserositis [148,149]. It also includes a beneficial control of 3L for Actinomycetales–Micrococcaceae–Rothia and Oceanospirillales–Halomonadaceae–Halomonas (see Figure 7C). This may be important because Rothia and Halomonas are both prevalent in the oral (salivae), oropharynx, respiratory tract, and intestinal (gut) microbiota. They contribute to maintaining healthy mucosal surfaces (iron scavenged from food, breakdown of proline and glutamine-rich proteins, glutamate, and central carbohydrate metabolism) [150,151]. The beneficial effects of high doses of 3L (in addition to CTX in rats) on the levels of Burkholderiales–Burkholderiaceae–Cupriavidus and Rhizobiales–Hyphomicrobiaceae–Devosia further suggest the stimulatory effects of 3L-pharmacological agents on central carbon metabolism and energy production (see Figure 7E,F). Cupriavidus bacteria have a diverse metabolic range that can be used to produce sulfur biofuels and energy sources from hydrogen and CO2 [152]. Similarly, Rhizobium and Devosia are known to express a wide range of metabolic activities, including carbohydrates, cysteine, methionine, branch-chain amino acids, and phosphorus compound metabolism. These are ideal for sustaining cellular and genetic component synthesis, energy transfer, and/or mycotoxin degradation [153,154]. Furthermore, the 3L mix may increase the levels of Bacillales–Staphylococcaceae–Jeotgalicoccus (see Figure S13D). This is important for biotin/vitamin H, or vitamin B7 metabolism, a cofactor in carboxylase activities in the gut, and its relationship with health [155]. The use of Lactobacillus (3L) to potentially stimulate amino acid, biotin, carbohydrate, glucose, iron, nitrogen, oxygen, phosphorus, protein, pyruvate, sulfide, and vitamin metabolism as a complement to chemo has been highlighted (see Figure 7 and Figure S13). The most notable effect of Lactobacillus treatment on the microbiome is perhaps found in Enterococcus (see Figure 7D). Chemotherapy (CTX) significantly increases the risk of Enterococcus peak (see Figure 7D), which in humans becomes a risk of ulcerative colitis or even colorectal cancer [156]. Probiotics such as 3L (3-Lactobacilli) are very effective in raising bacteroides and Clostridiales and keeping Enterococcaceae at bay in order to restore the gut flora to healthy conditions during chemotherapy (see Figure 7 and Figure S13). As a result, our 3L cocktail appears capable of controlling not only the mycobiome but also the entire bacterial microbial metabolism in a strain-dependent manner.
Different Lactobacilli formulations have been shown to modify gut flora and general metabolism and behavior in humans, fishes, and rodents [157,158]. Rats outperformed mice as preclinical models for human microbiota engraftment. Rats’ microbial communities are more similar to those of humans. Rats capture more human microbial species than mice [159]. As a result, rats are frequently used in cross-species microbiome analysis to study a wide range of human pathologies [160,161]. We describe the microbial profiles associated with chemotherapy and the various Lactobacillus doses required to counteract the specific aversive or inhibitory effects of CTX in rodents. In addition to the infectious microbial pathogens induced by the CTX chemical treatment, a systematic analysis of the gut microbiota in groups of rats exposed to cyclophosphamide shots + bioproducts suggests a list of key beneficial microbial families induced by 3L. These microbial families help maintain the gut flora and immune system (Figure 8).
L. casei supports the growth of L. acidophilus, which produces carbohydrate-digesting enzymes. In contrast, L. plantarum, a more adaptable and versatile strain, produces a slew of antimicrobial substances that aid its survival in the gastrointestinal tract under any conditions. There is no previously published bibliography of these strains for tumor therapy. The impact of this multistrain Lactobacillus probiotic formulation on in vivo models of microflora abundance preservation during chemotherapy has not previously been described. When tested on lipid metabolism, hyperlipidemia, and hypercholesterolemia, we observed that the tritherapy, 3L, and three-Lactobacilli cocktail had more significant effects than a single strain. Hence, none of these strains were included in this research tested on chemo as a single strain mix (see [61]).
Our first results in CTX chemo-rats could pave the way for future human chemotherapy attempts. Due to “chemo”, fragile health conditions and microbial infections are frequently associated with a weakened immune system. Hence, complementary and/or alternative clinical medicine for cancer prevention and/or treatment is required. The immune system, which relies on energy to reduce the risk of chronic diseases, is strongly linked to body composition (gut flora and metabolism). Furthermore, because 3L has positive effects on a variety of bacteria and metabolic systems (see Figure 8), it might function as an adjuvant to chemical medications for cancer and a variety of metabolic illnesses. It helps eliminate specific invading agents such as fungi (Mucor) and infectious bacteria (Enterococcus). Additionally, the diversity of bacteria elevated by 3L treatment (see Figure 8) makes it simple to modify our probiotic formula (L. acidophilus SD65, L. casei SD07, and L. plantarum SD02) to target particular human metabolism systems. Our straightforward pilot test in rats has the benefit of showing that different Lactobacillus dosages have distinct impacts on gut flora (see Figure 7 and Figure 8). Therefore, the impact of various SD65-SD07-SD02 ratios in 3L mixtures or in combination with other Lactobacilli or beneficial bacteria mixtures should be further studied (see Figure 8). In this pilot study, we provide a research-feasibility recommendation for preserving gut flora, general metabolism, immunization, or enhanced immune systems throughout chemotherapy and different chronic, genetic, and metabolic diseases.
Although much remains to be learned from studying 3L, such as its long-term effects on the immune system and/or how it affects tumor cell histology, this pilot study is nevertheless important in our continued search for methods to enhance the quality of life for cancer patients receiving chemotherapy. Our 3L bioproduct could pave the way for the development of a large family of pharmacologically therapeutic microbial bioproducts that would be used on cancer patients rather than chemo-animal models. We begin the comprehensive strategy to control the microbiome and ribosomes and treat human cancer with 3L [162].
5. Conclusions
The work given here can be used as a component in designing future experimental and clinical investigations related to cancer, chemotherapy, bionatural pharmacology, and microbial treatment. The 3L probiotic formulation affects the rat gut flora in chemotherapeutic settings. While CTX and anticancer drugs have several potential side effects, as documented here on the gut flora, adding 3L to chemotherapy has been shown to improve the gut flora, the immune system, and, consequently, health conditions. In this pilot study, 3L seems to keep fungi and bacteria that are good for health. Results on bacteria are constrained by particular metabolic pathways, which seems to be how 3L approaches chemotherapy. In particular, the results of this pilot study on rats suggest the effectiveness, frequency, and dependability of high-dose 3L across a month of treatment, which is a crucial finding for designing subsequent research projects and clinical trials. The high dose of 3L candidates maintains health conditions throughout chemotherapy, restores gut flora to normal levels, and boosts the host’s overall immunological defense. In this detailed description of the microbiome, we can see that the intervention (high 3L) has, at least at the level of the intestinal gut flora, a fairly effective protective effect against CTX toxicity.
Supplementary Materials
The following supporting information can be downloaded at: https://www.mdpi.com/article/10.3390/microbiolres14030059/s1, Figure S1: Venn diagram of shared OTUs among rat groups in CTX chemotherapy, treatment with 3L Lactobacilli and gut immune system changes; Figure S2: Differences of Amplicon Sequence Variants/Operational Taxonomic Units composition in fifteen samples corresponding to five groups of rats in relation to CTX chemotherapy + 3L Lactobacillus; Figure S3: Unweighted pair-group method with arithmetic means (UPGMA) clustering analysis of rat groups related to CTX (chemotherapy) and 3L bioproduct (additive Lactobacillus tritherapy); Figure S4: Rank abundance curve (OTU richness) of each rat group related to chemotherapy and Lactobacillu; Figure S5: Specaccum species accumulation curve of fifteen samples from rat groups with chemo + 3L; Figure S6: Alpha-diversity analysis of five rat groups in relation with chemotherapy and Lactobacillus; Figure S7: Fungal species clustering based on the abundance of each species (heatmap) in rat individual samples in relation to CTX chemotherapy, + 3L-treatment and improved gut microbiome strength; Figure S8: Distribution of fungal taxa in rat individual samples in relation to CTX chemotherapy, 3L, and gut microbiome at the phylum, order, class, family, and genus level; Figure S9: MetagenomeSeq of enriched microbes in control healthy versus immune-damaged conditions; Figure S10: LefSe analysis, linear discriminant analysis with nonparametric Kruskal-Wallis and Wilcoxon rank sum tests; Figure S11: Interaction network based on group and fungal microbial species composition in relation to CTX chemotherapy and 3L Lactobacillus bioproduct treatment in rats; Figure S12: Predicted abundance map for the secondary functional pathway in MetCyc; Figure S13: Map of the species distribution of additional differential MetaCyc metabolic pathways in rat groups in relation to chemotherapy and addition of 3L bioproduct to gut, and immune strengthening; Table S1: Number of samples being sequenced in relation to chemotherapy and Lactobacillus treatment in individuals from five groups of rats; Table S2: Number of OTU sequences at each taxonomic level in relation to chemotherapy and Lactobacillus treatment in individuals from five groups of rats; Table S3: Classification of OTUs at various taxonomic levels in ungrouped samples of rats in relation to chemotherapy and Lactobacillus treatment; Table S4. Alpha-diversity index table of the microbial community in relation to CTX chemotherapy and Lactobacillus treatment in individuals from five groups of rats.
Author Contributions
S.Y., J.L. and J.-F.P. designed the concept and research; S.Y., Z.Z., F.B., Y.Z. (Yan Zhang), G.C., Y.Z. (Youfeng Zhu), J.L. and J.-F.P. carried out research; Z.Z. and J.L. (supervision) reared rats in Specific Free Pathogen facilities/acute hospital care settings (Class II animal facility) and set up chemotherapy assays; S.Y., F.B., Y.Z. (Yan Zhang), G.C., Y.Z. (Youfeng Zhu) and J.-F.P. produced and injected Lactobacillus; S.Y., Z.Z., F.B., Y.Z. (Yan Zhang), G.C. and J.L. collected feces in SFP facilities and prepared genomic DNA samples; S.Y., F.B., Y.Z. (Yan Zhang), G.C., Y.Z. (Youfeng Zhu) and J.-F.P. performed molecular biology and prepared 16S and ITS samples for sequencing; BGI Co., Ltd. (Beijing, China) ran 16S and ITS Illumina sequencing; S.Y., J.L. and J.-F.P. validated methods; S.Y., J.L. and J.-F.P. analyzed and interpreted data; Y.Z. (Youfeng Zhu) helped with the classification (bacteria and fungi); S.Y., J.L. and J.-F.P. prepared all figures and tables; and J.-F.P. wrote the first draft of the manuscript. All authors have read and agreed to the published version of the manuscript.
Funding
The plan to develop a new bioproduct for immunomodulation during chemotherapy was supported by grant support from Shandong Province Overseas High-Level Talents Program (Taishan Scholar, #tshw20091015), Key Research and Development of Shandong Province (#2016GGH3111), Agricultural Science and Technology Innovation Engineering Program of Shandong Academy of Agricultural Sciences (#CXGC2017A01-1), and Academic Promotion Program of Shandong First Medical University (#2019LJ003).
Institutional Review Board Statement
The animal study protocol was approved by the Institutional Review Board (or Ethics Committee) of Shandong Academy of Medical Sciences and Shandong Province (Governmental license SYXK (LU) 20170003) for studies involving animals.
Informed Consent Statement
Not applicable (studies not involving humans).
Data Availability Statement
Our 16S and ITS sequencing data in the CTX-rat model are updated at NCBI (SubmissionID: SUB9725559; BioProject ID: PRJNA754332), e.g., by the linkage of one or more BioSamples (SAMN20769197-SAMN20769206; Accession Numbers: SRX11740945-SRX11740959). The locus_tag prefixes for each linked BioSample are included in the locustagprefix.txt file that can be accessed from BioProject ID PRJNA754332 in the submission portal: https://submit.ncbi.nlm.nih.gov/subs/bioproject/SUB9725559/overview, https://submit.ncbi.nlm.nih.gov/subs/bioproject, accessed on 1 January 2022.
Acknowledgments
We acknowledge Beijing Genomics Institute (BGI Co., Ltd., Beijing, China) for Illumina MiSeq sequencing (ITS and 16S). We also thank the editor and two reviewers for their excellent consideration and guidance, which significantly advanced the discussion of the 3L test and our original in vivo chemotherapy rat model.
Conflicts of Interest
The authors declare no conflict of interest.
References
- Hanahan, D.; Weinberg, R.A. Hallmarks of cancer: The next generation. Cell 2011, 144, 646–674. [Google Scholar] [CrossRef] [PubMed]
- Salk, J.J.; Fox, E.J.; Loeb, L.A. Mutational heterogeneity in human cancers: Origins and consequences. Annu. Rev. Pathol. 2010, 5, 51–75. [Google Scholar] [CrossRef]
- Chakravarthi, B.V.S.K.; Nepal, S.; Varambally, S. Genomic and epigenomic alterations in cancer. J. Am. Pathol. 2016, 186, 1724–1735. [Google Scholar] [CrossRef]
- Mroz, E.A.; Rocco, J.W. The challenges of tumor genetic diversity. Cancer 2017, 123, 917–927. [Google Scholar] [CrossRef]
- Takeshima, H.; Ushijima, T. Accumulation of genetic and epigenetic alterations in normal cells and cancer risk. NPJ Precis. Oncol. 2019, 3, 7. [Google Scholar] [CrossRef] [PubMed]
- Herceg, Z.; Hainaut, P. Genetic and epigenetic alterations as biomarkers for cancer detection, diagnosis and prognosis. Mol. Oncol. 2007, 1, 26–41. [Google Scholar] [CrossRef] [PubMed]
- Berg, M.; Søreide, K. Genetic and epigenetic traits as biomarkers in colorectal cancer. Int. J. Mol. Sci. 2011, 12, 9426–9439. [Google Scholar] [CrossRef]
- Loeb, L.A.; Loeb, K.R.; Anderson, J.P. Multiple mutations and cancer. Proc. Natl. Acad. Sci. USA 2003, 100, 776–781. [Google Scholar] [CrossRef] [PubMed]
- Vogt, A.; Schmid, S.; Heinimann, K.; Frick, H.; Herrmann, C.; Cerny, T.; Omlin, A. Multiple primary tumours: Challenges and approaches, a review. ESMO Open 2017, 2, e000172. [Google Scholar] [CrossRef]
- Wang, L.; Shilatifard, A. UTX mutations in human cancer. Cancer Cell 2019, 35, 168–176. [Google Scholar] [CrossRef]
- Chatterjee, A.; Mambo, E.; Sidransky, D. Mitochondrial DNA mutations in human cancer. Oncogene 2006, 25, 4663–4674. [Google Scholar] [CrossRef] [PubMed]
- Anastasiadou, E.; Jacob, L.S.; Slack, F.J. Non-coding RNA networks in cancer. Nat. Rev. Cancer 2013, 18, 5–18. [Google Scholar] [CrossRef] [PubMed]
- Lin, S.; Gregory, R.I. MicroRNA biogenesis pathways in cancer. Nat. Rev. Cancer 2016, 15, 321–333. [Google Scholar] [CrossRef]
- Gallo, L.H.; Ko, J.; Donoghue, D.J. The importance of regulatory ubiquitination in cancer and metastasis. Cell Cycle 2017, 16, 634–648. [Google Scholar] [CrossRef]
- Ben-Aroya, S.; Levanon, E.Y. A-to-I RNA editing: An overlooked source of cancer mutations. Cancer Cell 2018, 33, P789–P790. [Google Scholar] [CrossRef]
- Shuai, S.; Suzuki, H.; Diaz-Navarro, A.; Nadeu, F.; Kumar, S.A.; Gutierrez-Fernandez, A.; Delgado, J.; Pinyol, M.; López-Otín, C.; Puente, X.S.; et al. The U1 spliceosomal RNA is recurrently mutated in multiple cancers. Nature 2019, 574, 712–716. [Google Scholar] [CrossRef]
- Wang, E.; Aifantis, I. RNA splicing and cancer. Trends Cancer 2020, 6, P631–P644. [Google Scholar] [CrossRef]
- Wilkinson, S.; Harmon, S.A.; Terrigino, N.T.; Karzai, F.; Pinto, P.A.; Madan, R.A.; VanderWeele, D.J.; Lake, R.; Atway, R.; Bright, J.R.; et al. A case report of multiple primary prostate tumors with differential drug sensitivity. Nat. Commun. 2020, 11, 837. [Google Scholar] [CrossRef]
- Romiti, A.; Falcone, R.; Roberto, M.; Marchetti, P. Current achievements and future perspectives of metronomic chemotherapy. Investig. New Drugs 2017, 35, 359–374. [Google Scholar] [CrossRef] [PubMed]
- Charmsaz, S.; Prencipe, M.; Kiely, M.; Pidgeon, G.P.; Collins, D.M. Innovative technologies changing cancer treatment. Cancers 2018, 10, 208. [Google Scholar] [CrossRef]
- Pucci, C.; Martinelli, C.; Ciofani, G. Innovative approaches for cancer treatment: Current perspectives and new challenges. Ecancermedicalscience 2019, 13, 961. [Google Scholar] [CrossRef]
- Pusuluri, A.; Wu, D.; Mitragotri, S. Immunological consequences of chemotherapy: Single drugs, combination therapies and nanoparticle-based treatments. J. Control. Release 2019, 305, 130–154. [Google Scholar] [CrossRef]
- Waldman, A.D.; Fritz, J.M.; Lenardo, M.J. A guide to cancer immunotherapy: From T cell basic science to clinical practice. Nat. Rev. Immunol. 2020, 20, 651–668. [Google Scholar] [CrossRef]
- Gonzales, H.; Hagerling, C.; Werb, Z. Roles of the immune system in cancer: From tumor initiation to metastatic progression. Genes Dev. 2018, 32, 1267–1284. [Google Scholar] [CrossRef]
- Kaur, P.; Asea, A. Radiation-induced effects and the immune system in cancer. Front. Oncol. 2012, 2, 191. [Google Scholar] [CrossRef] [PubMed]
- Rébé, C.; Ghiringhelli, F. Cytotoxic effects of chemotherapy on cancer and immune cells: How can it be modulated to generate novel therapeutic strategies? Future Oncol. 2015, 11, 2645–2654. [Google Scholar] [CrossRef]
- Hota, D.; Tripathy, A. Chemotherapy Effects on Immune System. In Cancer Diagnostics and Therapeutics; Basu, S.K., Panda, C.K., Goswami, S., Eds.; Springer: Singapore, 2022. [Google Scholar] [CrossRef]
- Ba, Y.; Shi, Y.; Jiang, W.; Feng, J.; Cheng, Y.; Xiao, L.; Zhang, Q.; Qiu, W.; Xu, B.; Xu, R.; et al. Current management of chemotherapy-induced neutropenia in adults: Key points and new challenges. Cancer Biol. Med. 2020, 17, 896–909. [Google Scholar] [CrossRef]
- Ocana, A.; Nieto-Jiménez, C.; Pandiella, A.; Templeton, A.J. Neutrophils in cancer: Prognostic role and therapeutic strategies. Mol. Cancer 2017, 16, 137. [Google Scholar] [CrossRef]
- Verma, R.; Foster, R.E.; Horgan, K.; Mounsey, K.; Nixon, H.; Smalle, N.; Hugues, T.A.; Carter, C.R.D. Lymphocyte depletion and repopulation after chemotherapy for primary breast cancer. Breast Cancer Res. 2016, 18, 10. [Google Scholar] [CrossRef] [PubMed]
- Cupit-Link, M.C.; Kirkland, J.L.; Ness, K.K.; Armstrong, G.T.; Tchkonia, T.; LeBrasseur, N.K.; Armenian, S.H.; Ruddy, K.J.; Hashmi, S.K. Biology of premature ageing in survivors of cancer. ESMO Open 2017, 2, e000250. [Google Scholar] [CrossRef] [PubMed]
- Athira, V.R.; Shivanandappa, T.; Yajurvedi, H.N. Cyclophosphamide, a cancer chemotherapy drug-induced realy onset of reproductive senescence and alterations in reproductive performance and their prevention in mice. Drug Chem. Toxicol. 2022, 45, 760–766. [Google Scholar] [CrossRef]
- Matsuyama, A.; Schott, C.R.; Wood, G.A.; Richardson, D.; Woods, J.P.; Mutsaers, A.J. Evaluation of metronomic cyclophosphamide chemotherapy as mainteance treatment for dogs with appendicular osteosarcoma following limb amputation and carboplatin chemotherapy. J. Am. Vet. Med. Assoc. 2018, 252, 1377–1383. [Google Scholar] [CrossRef]
- Alfonso, J.C.L.; Papaxenopoulou, L.A.; Mascheroni, P.; Meyer-Hermann, M.; Hatzikirou, H. On the immunological consequences of conventionally fractionated radiotherapy. Science 2020, 23, 100897. [Google Scholar] [CrossRef] [PubMed]
- Gupta, S.; Mahipal, A. Fatal pulmonary toxicity after a single dose of cyclophosphamide. Pharmacotherapy 2007, 27, 617–618. [Google Scholar] [CrossRef]
- Rebucci, M.; Michiels, C. Molecular aspects of cancer cell resistance to chemotherapy. Biochem. Pharmacol. 2013, 85, 1219–1226. [Google Scholar] [CrossRef] [PubMed]
- Van den Brand, J.A.J.G.; Van Dijk, P.R.; Hofstra, J.M.; Wetzels, J.F.M. Cancer risk after cyclophosphamide treatment in idiopathic membranous nephropathy. Clin. J. Am. Soc. Nephrol. 2014, 9, 1066–1073. [Google Scholar] [CrossRef] [PubMed]
- Awadallah, N.; Proctor, K.; Joseph, K.B.; Delay, E.R.; Delay, R.J. Cyclophosphamide has long-term effects on proliferation in olfactory epithelia. Chem. Senses 2020, 45, 97–109. [Google Scholar] [CrossRef]
- Zhao, C.; Bartock, M.; Jia, B.; Shah, N.; Claxton, D.F.; Wirk, B.; Rakszawski, K.L.; Nickolich, M.S.; Naik, S.G.; Rybka, W.B.; et al. Post-transplant cyclophosphamide alters immune signatures and leads to impaired T cell reconstitution in allogenic hematopoietic stem cell transplant. J. Hematol. Oncol. 2022, 15, 64. [Google Scholar] [CrossRef]
- Zitvogel, L.; Apetoh, L.; Ghiringhelli, F.; Kroemer, G. Immunological aspects of chemotherapy. Nat. Rev. Immunol. 2008, 8, 59–73. [Google Scholar] [CrossRef]
- Scheithauer, K.; Belka, C.; Lauber, K.; Gaipl, U.S. Immunological aspects of radiotherapy. Radiat. Oncol. 2014, 9, 185. [Google Scholar] [CrossRef]
- Wargo, J.A.; Reuben, A.; Cooper, Z.A.; Oh, K.S.; Sullivan, R.J. Immune effects of chemotherapy, radiation, and targeted therapy and opportunities for combination with immunotherapy. Semin. Oncol. 2015, 42, 601–616. [Google Scholar] [CrossRef]
- Najafi, M.; Shirazi, A.; Motevaseli, E.; Geraily, G.; Norouzi, F.; Heidari, M.; Rezapoor, S. The melatonin immunomodulatory actions in radiotherapy. Biophys. Rev. 2017, 9, 139–148. [Google Scholar] [CrossRef] [PubMed]
- Najafi, M.; Salehi, E.; Farhood, B.; Nashtaei, M.S.; Hashemi Goradel, N.; Khanlarkhani, N.; Namjoo, Z.; Mortezaee, K. Adjuvant chemotherapy with melatonin for targeting human cancer: A review. J. Cell. Physiol. 2019, 234, 2356–2372. [Google Scholar] [CrossRef]
- Park, Y.H.; Lal, S.; Lee, J.E.; Choi, Y.-L.; Wen, J.; Ram, S.; Ding, Y.; Lee, S.-Y.; Powell, E.; Lee, S.K.; et al. Chemotherapy induces dynamic immune responses in breast cancers that impact treatment outcome. Nat. Commun. 2020, 11, 6175. [Google Scholar] [CrossRef] [PubMed]
- Galluzzi, L.; Humeau, J.; Buqué, A.; Zitvogel, L.; Kroemer, G. Immunostimulation with chemotherapy in the era of immune checkpoint inhibitors. Nat. Rev. Clin. Oncol. 2020, 17, 725–741. [Google Scholar] [CrossRef]
- Eastham, L.L.; Howard, C.M.; Balachadran, P.; Pasco, D.S.; Claudio, P.P. Eating green: Shining light on the use of dietary phytochemicals as a modern approach in the prevention and treatment of head and neck cancers. Curr. Top. Med. Chem. 2018, 18, 182–191. [Google Scholar] [CrossRef] [PubMed]
- Akolpoglu, M.B.; Alapan, Y.; Dogan, N.O.; Baltaci, S.F.; Yasa, O.; Tural, G.A.; Sitti, M. Magnetically steerable bacterial microrobots moving in 3D biological matrices for stimuli-responsive cargo delivery. Sci. Adv. 2022, 8, eabo6163. [Google Scholar] [CrossRef]
- Xu, X.; Zhang, X. Effects of cyclophosphamide on immune system and gut microbiota in mice. Microbiol. Res. 2015, 171, 97–106. [Google Scholar] [CrossRef]
- Vivarelli, S.; Salemi, R.; Candido, S.; Falzone, L.; Santagati, M.; Stefania, S.; Torino, F.; Banna, G.L.; Tonini, G.; Libra, M. Gut microbiota and cancer: From pathogenesis to therapy. Cancers 2019, 11, 38. [Google Scholar] [CrossRef]
- Cheng, W.Y.; Wu, C.Y.; Yu, J. The role of gut microbiota in cancer treatment: Friend or foe? Gut 2020, 69, 1867–1876. [Google Scholar] [CrossRef]
- Davis, L.S. Flora-ishing guts assist cancer immunotherapies. Sci. Immunol. 2018, 3, eaat0813. [Google Scholar] [CrossRef]
- Routy, B.; Le Chatelier, E.; Derosa, L.; Duong, C.P.M.; Alou, M.T.; Daillère, R.; Fluckiger, A.; Messaoudene, M.; Rauber, C.; Roberti, M.P.; et al. Gut microbiome influences efficacy of PD-1-based immunotherapy against epithelial tumors. Science 2018, 359, 91–97. [Google Scholar] [CrossRef]
- Li, Y.; Tinoco, R.; Elmén, L.; Segota, I.; Xian, Y.; Fujita, Y.; Sahu, A.; Zarecki, R.; Marie, K.; Feng, Y.; et al. Gut microbiota dependent anti-tumor immunity restricts melanoma growth in Rnf5−/− mice. Nat. Commun. 2019, 10, 1492. [Google Scholar] [CrossRef]
- Ma, W.; Mao, Q.; Xia, W.; Dong, G.; Yu, C.; Jiang, F. Gut microbiota shapes the efficiency of cancer therapy. Front. Microbiol. 2019, 10, 1050. [Google Scholar] [CrossRef]
- Dehghani, N.; Tafvizi, F.; Jafari, P. Cell cycle arrest and anti-cancer potential of probiotic Lactobacillus rhamnosus against HT-29 cancer cells. Bioimpacts 2021, 11, 245–252. [Google Scholar] [CrossRef]
- Chen, L.; Li, H.; Chen, Y.; Yang, Y. Lactobacillus rhamnosus GG reduced mortality of septic mice by modulating gut microbiota composition and metabolic profiles. Nutrition 2020, 78, 110863. [Google Scholar] [CrossRef] [PubMed]
- Owens, J.A.; Saeedi, B.J.; Naudin, C.R.; Hunter-Chang, S.; Barbian, M.E.; Eboka, R.U.; Askew, L.; Darby, T.M.; Robinson, B.S.; Jones, R.M. Lactobacillus rhamnosus GG orchestrates an antitumor immune response. Cell. Mol. Gastroenterol. Hepatol. 2021, 12, 1311–1327. [Google Scholar] [CrossRef] [PubMed]
- Liu, X.; Jin, G.; Tang, Q.; Huang, S.; Zhang, Y.; Sun, Y.; Liu, T.; Guo, Z.; Yang, C.; Wang, B.; et al. Early life Lactobacillus rhamnosus GG colonisation inhibits intestinal tumour formation. Br. J. Cancer 2022, 126, 1421–1441. [Google Scholar] [CrossRef] [PubMed]
- Fong, W.; Li, Q.; Yu, J. Gut microbiota modulation: A novel strategy for prevention and treatment of colorectal cancer. Oncogene 2020, 39, 4925–4943. [Google Scholar] [CrossRef] [PubMed]
- Yue, S.; Chinnapandi, B.; Ge, H.; Zou, X.; Chen, X.; Wang, C.; Hu, W.; Picimbon, J.-F. A Lactobacillus cocktail changes gut flora and reduces cholesterolemia and weight gain in hyperlipidemia mice. SOJ Microbiol. Infect. Dis. 2014, 2, 1–14. [Google Scholar] [CrossRef]
- Yue, S.; Liu, X.; Fu, J. Lactobacillus tritherapy for cholesterol and heart diseases. Res. Rev. J. Microbiol. Biotechnol. 2016, 5, 23–26. [Google Scholar]
- Tian, H.; Lyu, Y.; Yang, Y.G.; Hu, Z. Humanized rodent models for cancer research. Front. Oncol. 2020, 10, 1696. [Google Scholar] [CrossRef] [PubMed]
- Czpirer, C. Cancer Research in Rat Models. In Rat Genomics. Methods in Molecular Biology (Methods and Protocols); Anegon, I., Ed.; Humana Press: Totowa, NJ, USA, 2010; Volume 597, pp. 445–458. [Google Scholar]
- Zhang, Z.; Yue, S.; Chen, L.; Teng, S.; Sun, P.; Wang, Y.; Li, J. Effect of Lactobacillus preparation on immunosuppression induced by cyclophosphamide in rats. Food Drug 2020, 22, 103–107. [Google Scholar]
- Yue, S.; Li, Z.; Hu, F.; Picimbon, J.-F. Curing piglets from diarrhea and preparation of a healthy microbiome with Bacillus treatment for industrial animal breeding. Sci. Rep. 2020, 10, 19476. [Google Scholar] [CrossRef]
- Human Genome Assembly: The Genome Sequencing Consortium. Initial sequencing and analysis of the human genome. Nature 2001, 409, 860–921. [Google Scholar] [CrossRef]
- Qin, J.; Li, R.; Raes, J.; Arumugam, M.; Burgdorf, K.S.; Manichanh, C.; Nielsen, T.; Pons, N.; Levenez, F.; Yamada, T.; et al. A human gut microbial gene catalogue established by metagenomic sequencing. Nature 2010, 464, 59–65. [Google Scholar] [CrossRef] [PubMed]
- Ravi, R.K.; Walton, K.; Khosroheidari, M. MiSeq: A Next Generation Sequencing Platform for Genomic Analysis. In Disease Gene Identification, Methods in Molecular Biology; DiStefano, J., Ed.; Humana Press: New York, NY, USA, 2018; Volume 1706, pp. 223–232. [Google Scholar]
- Caporaso, J.G.; Kuczynski, J.; Stombaugh, J.; Bittinger, K.; Bushman, F.D.; Costello, E.K.; Fierer, N.; González Peña, A.; Goodrich, J.K.; Gordon, J.I.; et al. QIIME allows analysis of high-throughput community sequencing data. Nat. Methods 2010, 7, 335–336. [Google Scholar] [CrossRef] [PubMed]
- Edgar, R.C. Search and clustering orders of magnitude faster than BLAST. Bioinformatics 2010, 26, 2460–2461. [Google Scholar] [CrossRef]
- Bolyen, E.; Rideout, J.R.; Dillon, M.R.; Bokulich, N.A.; Abnet, C.C.; Al-Ghalith, G.A.; Alexander, H.; Alm, E.J.; Arumugam, M.; Asnicar, F.; et al. Reproducible, interactive, scalable and extensible microbiome data science using QIIME 2. Nat. Biotechnol. 2019, 37, 852–857. [Google Scholar] [CrossRef] [PubMed]
- Blaxter, M.; Mann, J.; Chapman, T.; Thomas, F.; Whitton, C.; Floyd, R.; Abebe, E. Defining operational taxonomic units using DNA barcode data. Philos. Trans. R. Soc. Lond. B Biol. Sci. 2005, 360, 1935–1943. [Google Scholar] [CrossRef]
- Cameron, E.S.; Schmidt, P.J.; Tremblay, B.J.; Emelko, M.B.; Müller, K.M. To rarefy or not to rarefy: Enhancing microbial community analysis through next-generation sequencing. Sci. Rep. 2020, 11, 22302. [Google Scholar] [CrossRef] [PubMed]
- Gotelli, N.J.; Colwell, R.K. Quantifying biodiversity: Procedures and pitfalls in the measurement and comparison of species richness. Ecol. Lett. 2001, 4, 379–391. [Google Scholar] [CrossRef]
- Oksanen, J.; Kindt, R.; Legendre, P.; O’Hara, B.; Stevens, M.; Oksanen, M.; Suggests, M. The vegan package. Community Ecol. Package 2007, 10, 631–637. [Google Scholar]
- Izsák, J.; Pavoine, S. Links between the species abundance distribution and the shape of the corresponding rank abundance curve. Ecol. Indic. 2012, 14, 1–6. [Google Scholar] [CrossRef]
- White, J.R.; Nagarajan, N.; Pop, M. Statistical methods for detecting differentially abundant features in clinical metagenomic samples. PLoS Comput. Biol. 2009, 5, e1000352. [Google Scholar] [CrossRef]
- Barter, L.L.; Yu, B. Superheat: An R package for creating beautiful and extendable heatmaps for visualizing complex data. J. Comput. Graph. Stat. 2018, 27, 910–922. [Google Scholar] [CrossRef]
- Warnes, G.R.; Bolker, B.; Bonebakker, L.; Gentleman, R.; Liaw, W.H.A.; Lumley, T.; Maechler, M.; Magnusson, A.; Moeller, S.; Schwartz, M.; et al. Gplots: Various R Programming Tools for Plotting Data, R Package Version 2.17.0; The R Foundation for Statistical Computing: Vienna, Austria, 2015. [Google Scholar]
- Segata, N.; Izard, J.; Waldron, L.; Gevers, D.; Miropolsky, L.; Garrett, W.S.; Huttenhower, C. Metagenomic biomarker discovery and explanation. Genome Biol. 2011, 12, R60. [Google Scholar] [CrossRef]
- Callahan, B.J.; McMurdie, P.J.; Rosen, M.J.; Han, A.W.; Johnson, A.J.A.; Holmes, S.P. DADA2, High-resolution sample inference from Illumina amplicon data. Nat. Methods 2016, 13, 581–583. [Google Scholar] [CrossRef] [PubMed]
- Rognes, T.; Flouri, T.; Nichols, B.; Quince, C.; Mahé, F. VSEARCH: A versatile open source tool for metagenomics. PeerJ 2016, 4, e2584. [Google Scholar] [CrossRef]
- Price, M.N.; Dehal, P.S.; Arkin, A.P. FastTree: Computing large minimum-evolution trees with profiles instead of a distance matrix. Mol. Biol. Evol. 2009, 26, 1641–1650. [Google Scholar] [CrossRef] [PubMed]
- Huson, D.H.; Mitra, S.; Ruscheweyh, H.J.; Weber, N.; Schuster, S.C. Integrative analysis of environmental sequences using MEGAN4. Genome Res. 2011, 21, 1552–1560. [Google Scholar] [CrossRef]
- Asnicar, F.; Weingart, G.; Tickle, T.L.; Huttenhower, C.; Segata, N. Compact graphical representation of phylogenetic data and metadata with GraPhlAn. PeerJ 2015, 3, e1029. [Google Scholar] [CrossRef] [PubMed]
- Ondov, B.D.; Bergman, N.H.; Phillippy, A.M. Interactive metagenomic visualization in a Web browser. BMC Bioinform. 2011, 12, 385. [Google Scholar] [CrossRef]
- De Santis, T.Z.; Hugenholtz, P.; Larsen, N.; Rojas, M.; Brodie, E.L.; Keller, K.; Huber, T.; Dalevi, D.; Ping, H.; Andersen, G.L. Greengenes, a chimera-checked 16S rRNA gene database and workbench compatible with ARB. Appl. Environ. Microbiol. 2006, 72, 5069–5072. [Google Scholar] [CrossRef] [PubMed]
- Kõljalg, U.; Nilsson, R.; Abarenkov, K.; Tedersoo, L.; Taylor, A.F.S.; Bahram, M.; Bates, S.T.; Bruns, T.D.; Bengtsson-Palme, J.; Callaghan, T.M.; et al. Towards a unified paradigm for sequence-based identification of fungi. Mol. Ecol. 2013, 22, 5271–5277. [Google Scholar] [CrossRef] [PubMed]
- Nilsson, R.H.; Ryberg, M.; Kristiansson, E.; Abarenkov, K.; Larsson, K.H.; Köljalg, U. Taxonomic reliability of DNA sequences in public sequence databases: A fungal perspective. PLoS ONE 2006, 1, e59. [Google Scholar] [CrossRef]
- McNeill, J.; Turland, N.J. Major Changes to the Code of Nomenclature-Melbourne, July 2011. Taxon 2011, 60, 1495–1497. [Google Scholar] [CrossRef]
- Houbraken, J.; Samson, R.A. Phylogeny of Penicillium and the segregation of Trichocomaceae into three families. Stud. Mycol. 2011, 70, 1–51. [Google Scholar] [CrossRef] [PubMed]
- Visagie, C.M.; Hirooka, Y.; Tanney, J.B.; Whitfield, E.; Mwange, K.; Meijer, M.; Amend, A.S.; Seifert, K.A.; Samson, R.A. Aspergillus, Penicillium and Talaromyces isolated from house dust samples collected around the world. Stud. Mycol. 2014, 78, 63–139. [Google Scholar] [CrossRef]
- Crous, P.W.; Lombard, L.; Sandoval-Denis, M.; Seifert, K.A.; Schroers, H.J.; Chaverri, P.; Gené, J.; Guarro, J.; Hirooka, Y.; Bensch, K.; et al. Fusarium: More than a node or a foot-shaped basal cell. Stud. Mycol. 2021, 98, 100116. [Google Scholar] [CrossRef]
- Karp, P.D.; Caspi, R. A survey of metabolic diseases emphasizing the MetaCyc family. Arch. Toxicol. 2011, 85, 1015–1033. [Google Scholar] [CrossRef] [PubMed]
- Caspi, R.; Dreher, K.; Karp, P.D. The challenge of constructing, classifying, and representing metabolic pathways. FEMS Microbiol. Lett. 2013, 345, 85–93. [Google Scholar] [CrossRef] [PubMed]
- Caspi, R.; Altman, R.; Billington, R.; Dreher, K.; Foerster, H.; Fulcher, C.A.; Holland, T.A.; Keseler, I.M.; Kothari, A.; Kubo, A.; et al. The MetaCyc Database of metabolic pathways and enzymes and the BioCyc collection of Pathway/Genome Databases. Nucleic Acids Res. 2014, 42, D459–D471. [Google Scholar] [CrossRef]
- Caspi, R.; Billington, R.; Fulcher, C.A.; Keseler, I.M.; Kothari, A.; Krummenacker, M.; Latendresse, M.; Midford, P.E.; Ong, Q.; Ong, W.K.; et al. The MetaCyc database of metabolic pathways and enzymes. Nucleic Acids Res. 2018, 46, D633–D639. [Google Scholar] [CrossRef]
- Hove, H.; Nørgaard, H.; Mortensen, P.B. Lactic acid bacteria and the human gastrointestinal tract. Eur. J. Clin. Nutr. 1999, 53, 339–350. [Google Scholar] [CrossRef]
- Fooks, L.J.; Gibson, G.R. Probiotics as modulators of the gut flora. Br. J. Nutr. 2002, 88, S39–S49. [Google Scholar] [CrossRef]
- Walter, J. Ecological role of Lactobacilli in the gastrointestinal tract: Implications for fundamental and biomedical research. Appl. Environ. Microbiol. 2008, 74, 4985–4996. [Google Scholar] [CrossRef] [PubMed]
- Hemarajata, P.; Versalovic, J. Effects of probiotics on gut microbiota: Mechanisms of intestinal immunomodulation and neuromodulation. Ther. Adv. Gastroenterol. 2013, 26, 39–51. [Google Scholar] [CrossRef] [PubMed]
- Panebianco, C.; Latiano, T.; Pazienza, V. Microbiota manipulation by probiotics administration as emerging tool in cancer prevention and therapy. Front. Oncol. 2020, 10, 679. [Google Scholar] [CrossRef]
- Lu, K.; Dong, S.; Wu, X.; Jin, R.; Chen, H. Probiotics in cancer. Front. Oncol. 2021, 11, 638148. [Google Scholar] [CrossRef]
- Yu, A.Q.; Li, L. The potential role of probiotics in cancer prevention and treatment. Nutr. Cancer 2016, 68, 535–544. [Google Scholar] [CrossRef] [PubMed]
- Legesse Bedada, T.L.; Feto, T.K.; Awoke, K.S.; Garedew, A.D.; Yifat, F.T.; Birri, D.J. Probiotics for cancer alternative prevention and treatment. Biomed. Pharmacother. 2020, 129, 110409. [Google Scholar] [CrossRef] [PubMed]
- Aykut, B.; Pushalkar, S.; Chen, R.; Li, Q.; Abengozar, R.; Kim, J.I.; Shadaloey, S.A.; Wu, D.; Preiss, P.; Verma, N.; et al. The fungal mycobiome promotes pancreatic oncogenesis via activation of MBL. Nature 2019, 574, 264–267. [Google Scholar] [CrossRef] [PubMed]
- Korula, A.; Abraham, A.; Abubacker, F.N.; Viswabandya, A.; Lakshmi, K.M.; Abraham, O.C.; Rupali, P.; Varghese, G.M.; Michael, J.S.; Srivastava, A.; et al. Invasive fungal infection following chemotherapy for acute myeloid leukaemia-Experience from a developing country. Mycoses 2017, 60, 686–691. [Google Scholar] [CrossRef] [PubMed]
- Iida, N.; Mizukoshi, E.; Yamashita, T.; Terashima, T.; Arai, K.; Seishima, J.; Kaneko, S. Overuse of antianaerobic drug is associated with poor postchemotherapy prognosis of patients with hepatocellular carcinoma. Int. J. Cancer 2019, 145, 2701–2711. [Google Scholar] [CrossRef]
- Wainwright, M. Some highlights in the history of fungi in medicine—A personal journey. Fungal Biol. Rev. 2008, 22, 97–102. [Google Scholar] [CrossRef]
- Nishad, J.H.; Singh, A.; Gautam, V.S.; Kumar, D.; Kumar, J.; Kharwar, R.N. Endophytic Fungi: A Cryptic Fountainhead for Biodiversity, Functional Metabolites, Host Stress Tolerance, and Myco-Mediated Nanoparticles (Nps) Synthesis. In Endophytes and Secondary Metabolites, References Series in Phytochemistry; Jha, S., Ed.; Springer: Cham, Switzerland, 2018; pp. 1–29. [Google Scholar]
- Vega, F.E.; Meyling, N.V.; Luangsa-ard, J.J.; Blackwell, M. Chapter 6—Fungal Entomopathogens. In Insect Pathology, 2nd ed.; Vega, F.E., Kaya, H.K., Eds.; Academic Press: Cambridge, MA, USA, 2012; pp. 171–220. [Google Scholar]
- Jermy, A. Ustilago gives plants a Pep talk. Nat. Rev. Microbiol. 2012, 10, 444–445. [Google Scholar] [CrossRef]
- Tang, X.; Mi, F.; Zhang, Y.; He, X.; Cao, Y.; Wang, P.; Liu, C.; Yang, D.; Dong, J.; Zhang, K.; et al. Diversity, population genetics, and evolution of macrofungi associated with animals. Mycology 2015, 6, 94–109. [Google Scholar] [CrossRef][Green Version]
- Rota, A.; Calicchio, E.; Nardoni, S.; Fratini, F.; Ebani, V.V.; Sgorbini, M.; Panzani, D.; Camillo, F.; Mancianti, F. Presence and distribution of fungi and bacteria in the reproductive tract of healthy stallions. Theriogenology 2011, 76, 464–470. [Google Scholar] [CrossRef]
- Su, L.; Zhu, H.; Guo, Y.; Du, X.; Guo, J.; Zhang, L.; Qin, C. Coprophilum (Cordypitaceae, Hypocreales), a new species of fungus from the feces of Marmota monax in China. Phytotaxa 2019, 387, 55–62. [Google Scholar] [CrossRef]
- McGhie, T.A.; Huber, T.W.; Kassis, C.E.; Jinadatha, C. Ustilago species as a cause of central line-related blood stream infection. Am. J. Med. Sci. 2013, 345, 254–255. [Google Scholar] [CrossRef] [PubMed]
- Huseyin, C.E.; O’Toole, P.W.; Cotter, P.D.; Scanlan, P.D. Forgotten fungi-the gut mycobiome in human health and disease. FEMS Microbiol. Rev. 2017, 41, 479–511. [Google Scholar] [CrossRef]
- Sam, Q.H.; Chang, M.W.; Chai, L.Y. The fungal mycobiome and its interaction with gut bacteria in the host. Int. J. Mol. Sci. 2017, 18, 330. [Google Scholar] [CrossRef] [PubMed]
- Li, J.; Chen, D.; Yu, B.; He, J.; Zheng, P.; Mao, X.; Yu, J.; Luo, J.; Tian, G.; Huang, Z.; et al. Fungi in gastrointestinal tracts of human and mice: From community to functions. Microb. Ecol. 2018, 75, 821–829. [Google Scholar] [CrossRef] [PubMed]
- Lombard, L.; Van der Merwe, N.A.; Groenewald, J.Z.; Crous, P.W. Generic concepts in Nectriaceae. Stud. Mycol. 2015, 80, 189–245. [Google Scholar] [CrossRef]
- Fraiser, L.H.; Kanekal, S.; Kehrer, J.P. Cyclophosphamide toxicity. Characterising and avoiding the problem. Drugs 1991, 42, 781–795. [Google Scholar] [CrossRef]
- Nicolás, F.E.; Murcia, L.; Navarro, E.; Navarro-Mendoza, M.I.; Pérez-Arques, C.; Garre, V. Mucorales species and macrophages. J. Fungi 2020, 6, 94. [Google Scholar] [CrossRef]
- Rosenblum, E.B.; Voyles, J.; Poorten, T.J.; Stajich, J.E. The deadly chytrid fungus: A story of an emerging pathogen. PLoS Pathog. 2010, 6, e1000550. [Google Scholar] [CrossRef]
- Wos-Oxley, M.L.; Bleich, A.; Oxley, A.P.A.; Kahl, S.; Janus, L.M.; Smoczek, A.; Nahrstedt, H.; Pils, M.C.; Taudien, S.; Platzer, M.; et al. Comparative evaluation of establishing a human gut microbial community within rodent models. Gut Microbes 2012, 3, 234–249. [Google Scholar] [CrossRef]
- American Society for Microbiology. One Health: Fungal Pathogens of Humans, Animals, and Plants: Report on an American Academy of Microbiology Colloqium Held in Washington (DC); American Society for Microbiology: Washington, DC, USA, 2019. [Google Scholar]
- Roselli, M.; Natella, F.; Zinno, P.; Guantario, B.; Canali, R.; Schifano, E.; De Angelis, M.; Nikoloudaki, O.; Gobbetti, M.; Perozzi, G.; et al. Colonization ability and impact on human gut microbiota of foodborne microbes from traditional or probiotic-added fermented foods: A systemic review. Front. Nutr. 2021, 8, 689084. [Google Scholar] [CrossRef]
- Han, S.; Lu, Y.; Xie, J.; Fei, Y.; Zheng, G.; Wang, Z.; Liu, J.; Lv, L.; Ling, Z.; Berglund, B.; et al. Probiotic gastrointestinal transit and colonization after oral administration: A long journey. Front. Cell. Infect. Microbiol. 2021, 11, 609722. [Google Scholar] [CrossRef] [PubMed]
- Magro Reque, P.; Brandelli, A. Encapsulation of probiotics and nutraceuticals: Applications in functional food industry. Trends Food Sci. Technol. 2021, 114, 1–10. [Google Scholar] [CrossRef]
- Witherden, E.A.; Shoale, S.; Hall, R.A.; Moyes, D.L. The human mucosal mycobiome and fungal community interactions. J. Fungi 2017, 3, 56. [Google Scholar] [CrossRef] [PubMed]
- Jayasudha, R.; Das, T.; Kalyana Chakravarthy, S.; Sai Prashanthi, G.; Bhargava, A.; Tyagi, M.; Kumari Rani, P.; Pappuru, R.R.; Shivaji, S. Gut mycobiomes are altered in people with type 2 Diabetes Mellitus Diabetic Retinopathy. PLoS ONE 2020, 15, e0243077. [Google Scholar] [CrossRef] [PubMed]
- Coker, O.O.; Nakatsu, G.; Dai, R.Z.; Wu, W.K.K.; Wong, S.H.; Ng, S.C.; Chan, F.K.L.; Sung, J.J.Y.; Yu, J. Enteric fungal microbiota dysbiosis and ecological alterations in colorectal cancer. Gut 2019, 68, 654–662. [Google Scholar] [CrossRef]
- Van Tilburg Bernardes, E.; Pettersen, V.K.; Gutierrez, M.W.; Laforest-Lapointe, I.; Jendzjowsky, N.G.; Cavin, J.B.; Vicentini, F.A.; Keenan, C.M.; Ramay, H.R.; Samara, J.; et al. Intestinal fungi are causally implicated in microbiome assembly and immune development in mice. Nat. Commun. 2020, 11, 2577. [Google Scholar] [CrossRef]
- Ghannoum, M.A.; Jurevic, R.J.; Mukherjee, P.K.; Cui, F.; Sikaroodi, M.; Naqvi, A.; Gillevet, P. Characterization of the oral fungal microbiome (mycobiome) in healthy individuals. PLoS Pathog. 2010, 6, e1000713. [Google Scholar] [CrossRef]
- Jørgensen, M.R.; Kragelund, C.; Jensen, P.Ø.; Keller, M.K.; Twetman, S. Probiotic Lactobacillus reuteri has antifungal effects on oral Candida species in vitro. J. Oral Microbiol. 2017, 9, 1274582. [Google Scholar] [CrossRef]
- Locasale, J.W.; Cantley, L.C. Altered metabolism in cancer. BMC Biol. 2010, 8, 88. [Google Scholar] [CrossRef]
- Heske, C.M. Beyond energy metabolism: Exploiting the additional roles of NAMPT for cancer therapy. Front. Oncol. 2020, 9, 1514. [Google Scholar] [CrossRef]
- Desbats, M.A.; Giacomini, I.; Prayer-Galetti, T.; Montopoli, M. Metabolic plasticity in chemotherapy resistance. Front. Oncol. 2020, 10, 281. [Google Scholar] [CrossRef]
- Van Soom, T.; El Bakkali, S.; Gebruers, N.; Verbelen, H.; Tjalma, W.; Van Breda, E. The effects of chemotherapy on energy metabolic aspects in cancer patients: A systematic review. Clin. Nutr. 2020, 39, 1863–1877. [Google Scholar] [CrossRef]
- Chung, Y.W.; Gwak, H.J.; Moon, S.; Rho, M.; Ryu, J.H. Functional dynamics of bacterial species in the mouse gut microbiome revealed by metagenomic and metatranscriptomic analyses. PLoS ONE 2020, 15, e0227886. [Google Scholar] [CrossRef]
- Kovatcheva-Datchary, P.; Nilsson, A.; Akrami, R.; Lee, Y.S.; De Vadder, F.; Arora, T.; Hallen, A.; Martens, E.; Björck, I.; Bäckhed, F. Dietary fiber-induced improvement in glucose metabolism is associated with increased abundance of Prevotella. Cell Metab. 2015, 22, 971–982. [Google Scholar] [CrossRef]
- Polansky, O.; Sekelova, Z.; Faldynova, M.; Sebkova, A.; Sisak, F.; Rychlik, I. Important metabolic pathways and biological processes expressed by chicken cecal microbiota. Appl. Environ. Microbiol. 2016, 82, 1569–1576. [Google Scholar] [CrossRef]
- Franke, T.; Deppenmeier, U. Physiology and central carbon metabolism of the gut bacterium Prevotella copri. Mol. Microbiol. 2018, 109, 528–540. [Google Scholar] [CrossRef]
- Precup, G.; Vodnar, D.C. Gut Prevotella as a possible biomarker of diet and its eubiotic versus dysbiotic roles: A comprehensive literature review. Br. J. Nutr. 2019, 122, 131–140. [Google Scholar] [CrossRef]
- Owyang, S.Y.; Luther, J.; Kao, J.Y. Helicobacter pylori: Beneficial for most? Expert Rev. Gastroenterol. Hepatol. 2011, 5, 649–651. [Google Scholar] [CrossRef]
- Abadi, A.T.B. Helicobacter pylori: A beneficial gastric pathogen? Front. Med. 2014, 1, 26. [Google Scholar]
- Marais, M.; Mendz, G.L.; Hazell, S.L.; Mégraud, F. Metabolism and genetics of Helicobacter pylori: The genome era. Microbiol. Mol. Biol. Rev. 1999, 63, 642–674. [Google Scholar] [CrossRef]
- Weir, S.; Cuccherini, B.; Whitney, A.M.; Ray, M.L.; MacGregor, J.P.; Steigerwalt, A.; Daneshvar, M.I.; Weyant, R.; Wray, B.; Steele, J.; et al. Recurrent bacteremia caused by a “Flexispira”-like organism in a patient with X-linked (Bruton’s) aggammaglobulinemia. J. Clin. Microbiol. 1999, 37, 2439–2445. [Google Scholar] [CrossRef] [PubMed]
- Iten, A.; Graf, S.; Egger, M.; Tauber, M.; Graf, J. Helicobacter sp. flexispira bacteremia in an immunocompetent young adult. J. Clin. Microbiol. 2001, 39, 1716–1720. [Google Scholar] [CrossRef] [PubMed]
- Wei, G.; Tian, N.; Siezen, R.; Schuppan, D.; Helmerhorst, E.J. Identification of food-grade substilisins as gluten-degrading enzymes to treat celiac disease. Am. J. Physiol.—Gastrointest. Liver Physiol. 2016, 311, G571–G580. [Google Scholar] [CrossRef] [PubMed]
- Moore, R.E.; Townsend, S.D. Temporal development of the infant gut microbiome. Open Biol. 2019, 9, 190128. [Google Scholar] [CrossRef] [PubMed]
- Lü, C.; Xia, Y.; Liu, D.; Zhao, R.; Gao, R.; Liu, H.; Xun, L. Cupriavidus necator H16 uses flavocytochrome c sulfide dehydrogenase to oxidize self-produced and added sulfide. Appl. Environ. Microbiol. 2017, 83, e01610-17. [Google Scholar] [CrossRef]
- Sosa, O.A. Phosphorus redox reactions as pinch hitters in microbial metabolism. Proc. Natl. Acad. Sci. USA 2018, 115, 7–8. [Google Scholar] [CrossRef]
- Talwar, C.; Nagar, S.; Kumar, R.; Scaria, J.; Lal, R.; Negi, R.K. Defining the environmental adaptations of genus Devosia: Insights into its expansive short peptide transport system and positively selected genes. Sci. Rep. 2020, 10, 1151. [Google Scholar] [CrossRef]
- McMahon, R.J. Biotin in metabolism and molecular biology. Annu. Rev. Nutr. 2002, 22, 221–239. [Google Scholar] [CrossRef]
- Vieira de Almeida, C.; Taddei, A.; Amedei, A. The controversial role of Enterococcus faecalis in colorectal cancer. Ther. Adv. Gastroenterol. 2018, 11, 1756284818783606. [Google Scholar] [CrossRef]
- Falcinelli, S.; Rodiles, A.; Unniappan, S.; Picchietti, S.; Gioacchini, G.; Merrifield, D.L.; Carnevali, O. Probiotic treatment reduces appetite and glucose level in the zebrafish model. Sci. Rep. 2016, 6, 18061. [Google Scholar] [CrossRef]
- Wang, M.; Chen, Y.; Wang, Y.; Li, Y.; Zhang, X.; Zheng, H.; Ma, F.; Ma, C.W.; Lu, B.; Xie, Z.; et al. Beneficial changes of gut microbiota and metabolism in weaned rats with Lactobacillus acidophilus NCFM and Bifidobacterium lactis Bi-07 supplementation. J. Funct. Foods 2018, 48, 252–265. [Google Scholar] [CrossRef]
- Lleal, M.; Sarrabayrouse, G.; Willamil, J.; Santiago, A.; Pozuelo, M.; Manichanh, C. A single faecal microbiota transplantation modulates the microbiome and improves clinical manifestations in a rat model of colitis. EBioMedicine 2019, 48, 630–641. [Google Scholar] [CrossRef]
- Zhang, S.L.; Bai, L.; Goel, N.; Bailey, A.; Jang, C.J.; Bushman, F.D.; Meerlo, P.; Dinges, D.F.; Sehgal, A. Human and rat gut microbiome composition is maintained following sleep restrictions. Proc. Natl. Acad. Sci. USA 2017, 114, E1564–E1571. [Google Scholar] [CrossRef]
- Coklo, M.; Maslov, D.R.; Kraljević Pavelić, S. Modulation of gut microbiota in healthy rats after exposure to nutritional supplements. Gut Microbes 2020, 12, 1779002. [Google Scholar] [CrossRef]
- Yue, S.; He, Q.X.; Picimbon, J.-F. Lactobacillus for ribosome peptide editing cancer. Clin. Transl. Oncol. 2023, 25, 1522–1544. [Google Scholar] [CrossRef]
Disclaimer/Publisher’s Note: The statements, opinions and data contained in all publications are solely those of the individual author(s) and contributor(s) and not of MDPI and/or the editor(s). MDPI and/or the editor(s) disclaim responsibility for any injury to people or property resulting from any ideas, methods, instructions or products referred to in the content. |
© 2023 by the authors. Licensee MDPI, Basel, Switzerland. This article is an open access article distributed under the terms and conditions of the Creative Commons Attribution (CC BY) license (https://creativecommons.org/licenses/by/4.0/).