Article

Evaluation of Antibiotic Tolerance in Pseudomonas aeruginosa for Aminoglycosides and Its Predicted Gene Regulations through In-Silico Transcriptomic Analysis

by
Abishek Kumar B
1,*,
Bency Thankappan
2,
Angayarkanni Jayaraman
2,* and
Akshita Gupta
1
1
Department of Microbiology, Kasturba Medical College (Manipal), Manipal Academy of Higher Education (MAHE), Manipal 576104, India
2
Department of Microbial Biotechnology, Bharathiar University, Coimbatore 641046, India
*
Authors to whom correspondence should be addressed.
Microbiol. Res. 2021, 12(3), 630-645; https://doi.org/10.3390/microbiolres12030045
Submission received: 1 May 2021 / Revised: 14 July 2021 / Accepted: 20 July 2021 / Published: 29 July 2021

Abstract

:
Pseudomonas aeruginosa causes chronic infections, such as cystic fibrosis, endocarditis, bacteremia, and sepsis, which are life-threatening and difficult to treat. The lack of antibiotic response in P. aeruginosa is due to adaptive resistance mechanism, which prevents the entry of antibiotics into the cytosol of the cell to achieve tolerance. Among the different groups of antibiotics, aminoglycosides are used as a parenteral antibiotic for the treatment of P. aeruginosa. This study aimed to determine the kinetics of antibiotic tolerance and gene expression changes in P. aeruginosa exposed to amikacin, gentamicin, and tobramycin. These antibiotics were exposed to P. aeruginosa at their MICs and the experimental setup was monitored for 72 h, followed by the measurement of optical density every 12 h. The growth of P. aeruginosa in the MICs of antibiotics represented the kinetics of antibiotic tolerance in amikacin, gentamicin, and tobramycin. The transcriptomic profile of antibiotic exposed P. aeruginosa PA14 was taken from the Gene Expression Omnibus (GEO), NCBI as microarray datasets. The gene expressions of two datasets were compared by test versus control. Tobramycin-exposed P. aeruginosa failed to develop tolerance in MICs of 0.5 µg/mL, 1 µg/mL, and 1.5 µg/mL, whereas amikacin- and gentamicin-treated P. aeruginosa developed tolerance. This illustrated the superior in vitro response of tobramycin over gentamicin and amikacin. Further, in silico transcriptomic analysis of tobramycin-treated P. aeruginosa resulted in differentially expressed genes (DEGs), enriched in 16s rRNA methyltransferase E, B, and L, alginate biosynthesis genes, and several proteins of the type II secretion system (T2SS) and type III secretion system (T3SS). The regulation of mucA in alginate biosynthesis, and gidB in RNA methyltransferases, suggested an increased antibiotic response and a low probability of developing resistance during tobramycin treatment. The use of tobramycin as a parenteral antibiotic with its synergistic combination might combat P. aeruginosa with increased response.

1. Introduction

P. aeruginosa is an opportunistic pathogen, which causes chronic infections that are difficult to treat due to its limited response to antimicrobials and the emergence of antibiotic resistance during therapy [1]. Multi-drug resistance (MDR) is increasing due to over-exposure to antibiotics [2]. Drug resistance in P. aeruginosa is developed as a result of various physiological and genetic mechanisms, which include multidrug efflux pumps, beta-lactamase production, outer membrane protein (porin) loss, and target mutations. In hospitals, MDR P. aeruginosa are, in most cases, concurrently resistant to ciprofloxacin, imipenem, ceftazidime, and piperacillin-tazobactam, which limits treatment options [3].
Aminoglycosides are a major group of antibiotics with a potential bacteriocidic effect for the treatment of Pseudomonas infections. They are used in monotherapy or in combination with antimicrobials to treat various infections to overcome drug resistance, particularly in cystic fibrosis patients [4] and infective endocarditis [5]. In the face of systemic infection with septic shock and sepsis, antimicrobial therapy should consist of two antimicrobial agents, with one of these being an aminoglycoside [6], because it exhibits concentration-dependent bactericidal activity and produces prolonged post-antibiotic effects [7].
β-lactam antibiotic coupled with an aminoglycoside is a commonly used synergistic combination for the treatment of clinical infections. Other combinations include fluoroquinolone and aminoglycosides, and tetracycline and aminoglycosides. Clinical isolates show a high susceptibility to aminoglycosides as compared to other first-line antibiotics [8]. Despite high susceptibility to aminoglycosides in clinical isolates, P. aeruginosa exhibits physiological adaptations to these antibiotics, which results in less response to its synergistic combinations.
P. aeruginosa thrives in the inhibitory concentration of antibiotics and acquires adaptive resistance gradually, which makes treatment more complicated [9]. The adaptive resistance mechanism is characterized by the modification of the cytoplasmic membrane, condensation of membrane proteins, and the reduction of phospholipid content [10], which reduces penetration of antibiotics into the plasma membrane. Studies show that adaptive resistance can also develop by the up-regulation of efflux pumps, especially MexXY-OprM [11].
Among immunocompromised patients, P. aeruginosa are favored to adapt to the administered antibiotics and enable better survival of the bacterial generation by emerging as physiologically resistant groups [12]. Adaptive resistance is developed due to rapid transcriptomic alteration in response to antibiotics [13]. A better understanding of the kinetics and transcriptomic changes during antibiotic exposure can develop scientific insight on the adaptive resistance mechanism in P. aeruginosa [13,14]. In light of this, our study was designed to gain a better understanding of the adaptive resistance mechanism in P. aeruginosa to the aminoglycosides gentamicin, amikacin, and tobramycin, which are commonly used as first line antibiotics.

2. Materials and Methods

2.1. Broth Dilution Method

The minimum inhibitory concentrations (MICs) of P. aeruginosa ATCC 27853 was determined by the broth dilution method as per the Clinical and Laboratory Standards Institute (CLSI) guidelines. MIC assay was performed for gentamicin, amikacin, and tobramycin (purchased from Sigma Aldrich, Bangalore, Karnataka, India) with log phase culture (5 × 10⁸ CFU/mL) in Mueller Hinton broth (MHB) using a 96-well microtiter plate. The final optical density (OD600) at 600 nm wavelength was determined via an Epoch Microplate spectrophotometer (BioTek Instruments Inc., Winooski, VT, USA).

2.2. In Vitro Exposure of Antibiotics to P. aeruginosa

From the observed MICs in the broth dilution method, antibiotic concentrations of 1 μg/mL, 2 μg/mL, and 3 μg/mL for amikacin and 0.5 μg/mL, 1 μg/mL, and 1.5 μg/mL for gentamicin and tobramycin were prepared separately in 10 mL of MHB dispensed in Tarsons tubes. P. aeruginosa ATCC 27853 was inoculated and the initial cell density at OD600 was adjusted to ≅ 0.26 uniformly in all the tubes. The experimental set up was observed for 72 h. The experimental condition was incubated at 37 °C with optimal shaking at 74 rpm. Every 12 h, the turbidity was monitored by measuring the OD600 in an Epoch microtiter plate reader (BioTek Instruments Inc., Winooski, VT, USA) [14,15]. The tubes with growth were sub-cultured in nutrient agar. The colonies were confirmed for P. aeruginosa through the matrix-assisted laser desorption ionization time-of-flight (MALDI-TOF) automated identification system VITEK® MS (BioMérieux, SA, Marcy l’Etoile, France) by following the standard procedure for sample preparation [16].

2.3. In Silico Transcriptomic Analysis

2.3.1. Retrieval of Microarray Datasets

The differential gene expression analysis was performed by exploring microarray datasets from the Gene Expression Omnibus (GEO), NCBI. The datasets which mimicked our experimental condition, P. aeruginosa exposed to an MIC of tobramycin, were available as accessible series no. GSE9991 and GSE9989. Two datasets were analyzed: (1) a tobramycin-treated planktonic culture of P. aeruginosa (GSE9991), and (2) a tobramycin-treated P. aeruginosa biofilm (GSE9989). In GSE9991, a planktonic culture of PA14 was exposed to an MIC of tobramycin of 5 µg/mL for 30 min at 37 °C [17]. Two samples, GSM252561 and GSM252562, of tobramycin-treated PA14 planktonic culture was taken as a test, which was compared to two controls, GSM252559 and GSM252560, of unexposed PA14 planktonic culture. GSE9989 consisted of six samples, in which three samples (GSM252496, GSM252501, and GSM252505) of unexposed P. aeruginosa biofilm were used as controls, and three samples (GSM252506, GSM252507, and GSM252508) of tobramycin-exposed P. aeruginosa biofilm were used as the test. Biofilms were grown on CFBE41o-cells in culture for 9 h in MEM/0.4% arginine. Replicate samples were then incubated in the presence or absence of 500 μg/mL tobramycin for 30 min [17].
In the microarray datasets, before RNA harvesting, cells were washed several times in 2 mL PBS to remove antibiotics. The RNA was extracted using a RNeasy RNA isolation kit (QIAGEN Inc., Valencia, CA, USA). The bacterial RNA was then purified, using a MICROBEnrich™ kit (Ambion®, Austin, TX, USA), to exclude mammalian RNA. The purified RNA was subjected to cDNA synthesis, followed by microarray preparation according to the Affymetrix GeneChip P. aeruginosa genome array expression analysis protocol [17].

2.3.2. Differential Gene Expression Analysis

In the microarray datasets, raw data, available as a platform file, was extracted, formatted, and uploaded as input data in NetworkAnalyst 3.0 (https://www.networkanalyst.ca/, accessed on 28 March 2020). In NetworkAnalyst 3.0, organism ID—P. aeruginosa and data type—intensity table (microarray data) options were selected, and probe summarization was performed by a multi-array average algorithm. The raw data was preprocessed by removing novel genes and hypothetical proteins (unannotated genes). A variance filter score of 15 and low abundance threshold of 5 were applied, and the datasets were normalized by log2 transformation. Using the linear models for microarray analysis (Limma) statistical package, datasets were subjected to specific comparisons by the test versus control samples to determine the log2 fold change (LogFc) between the two groups. To identify significant DEGs, the datasets were filtered by a significant threshold cutoff of an adjusted p-value of ≤0.05 [18].

2.3.3. Functional Enrichment Analysis

DAVID Bioinformatics Resources 6.8 (https://david.ncifcrf.gov/, accessed on 17 April 2020) [19], a computational tool, was used for further downstream analysis of significant DEGs. The databases selected for enrichment analysis in DAVID were the KEGG Pathway, InterPro, GO Terms, UniProtKB, and SMART. A minimum threshold gene count of ≥2 and an EASE Score of 0.1 were set as the cutoff, and only enrichments of ≤0.05 false discovery rate (FDR) were considered for the study. A clustering enrichment analysis was performed by categorizing clustered groups that shared similar functional terms in global annotation profiles across databases. A module-centric approach for DEGs was used to determine similar enrichments for more significance [20]. In the functional annotation clusters, an enrichment score of 2.0 was set as the threshold for the selection of enriched clusters.
DEGs significantly enriched in the functional groups were considered as target genes. Further, target genes were studied functionally using Pseudomonas Genome DB (http://pseudomonas.com/, accessed on 20 April 2020) [21] and PseudoCyc (http://www.pseudomonas.com:1555/, accessed on 25 April 2020) [22] to determine the function and regulations of DEGs based on previously published resources. The protein-to-protein interactions (PPI) of the regulatory genes were studied using the STRING database (https://string-db.org/, accessed on 2 July 2021) to determine protein and molecular interactions. Only a highly significant interaction score of ≥0.850 was considered for interactions [23,24].

3. Results

3.1. Broth Dilution Method

The MICs of gentamicin, amikacin, and tobramycin for P. aeruginosa (ATCC 27853) were 0.5 μg/mL, 1.5 μg/mL, and 0.5 μg/mL.

3.2. In Vitro Exposure of Antibiotics to P. aeruginosa

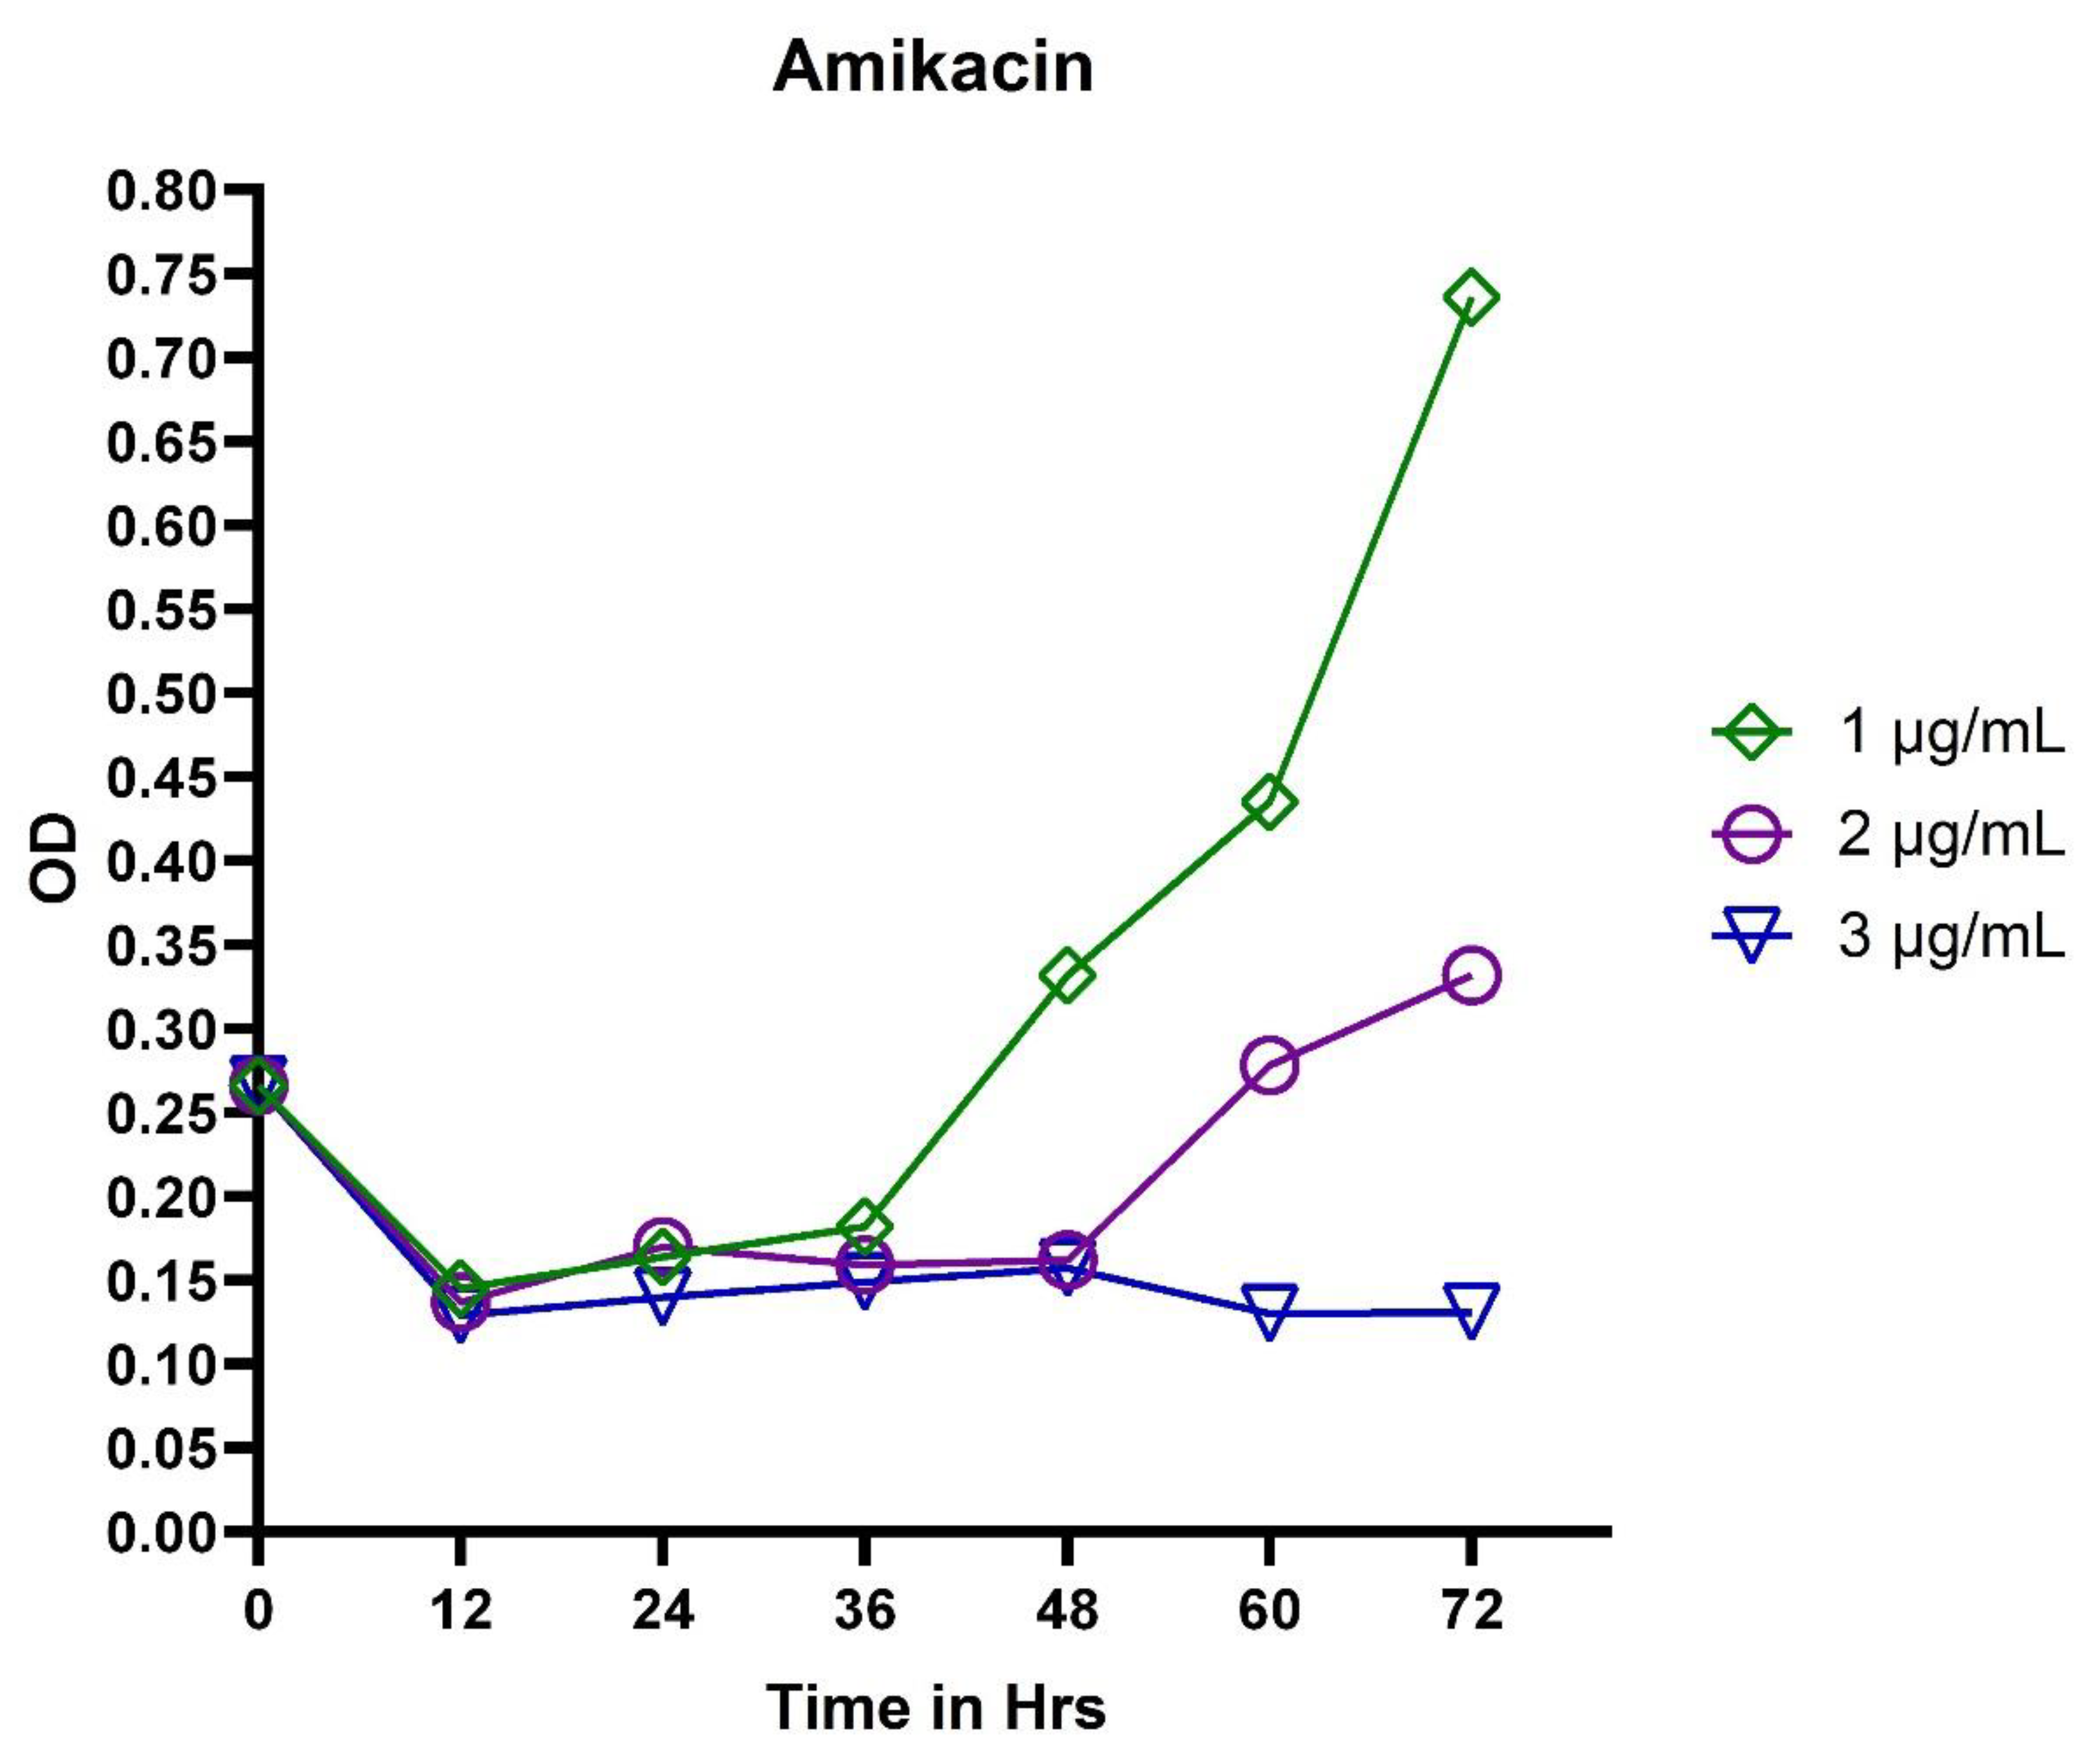
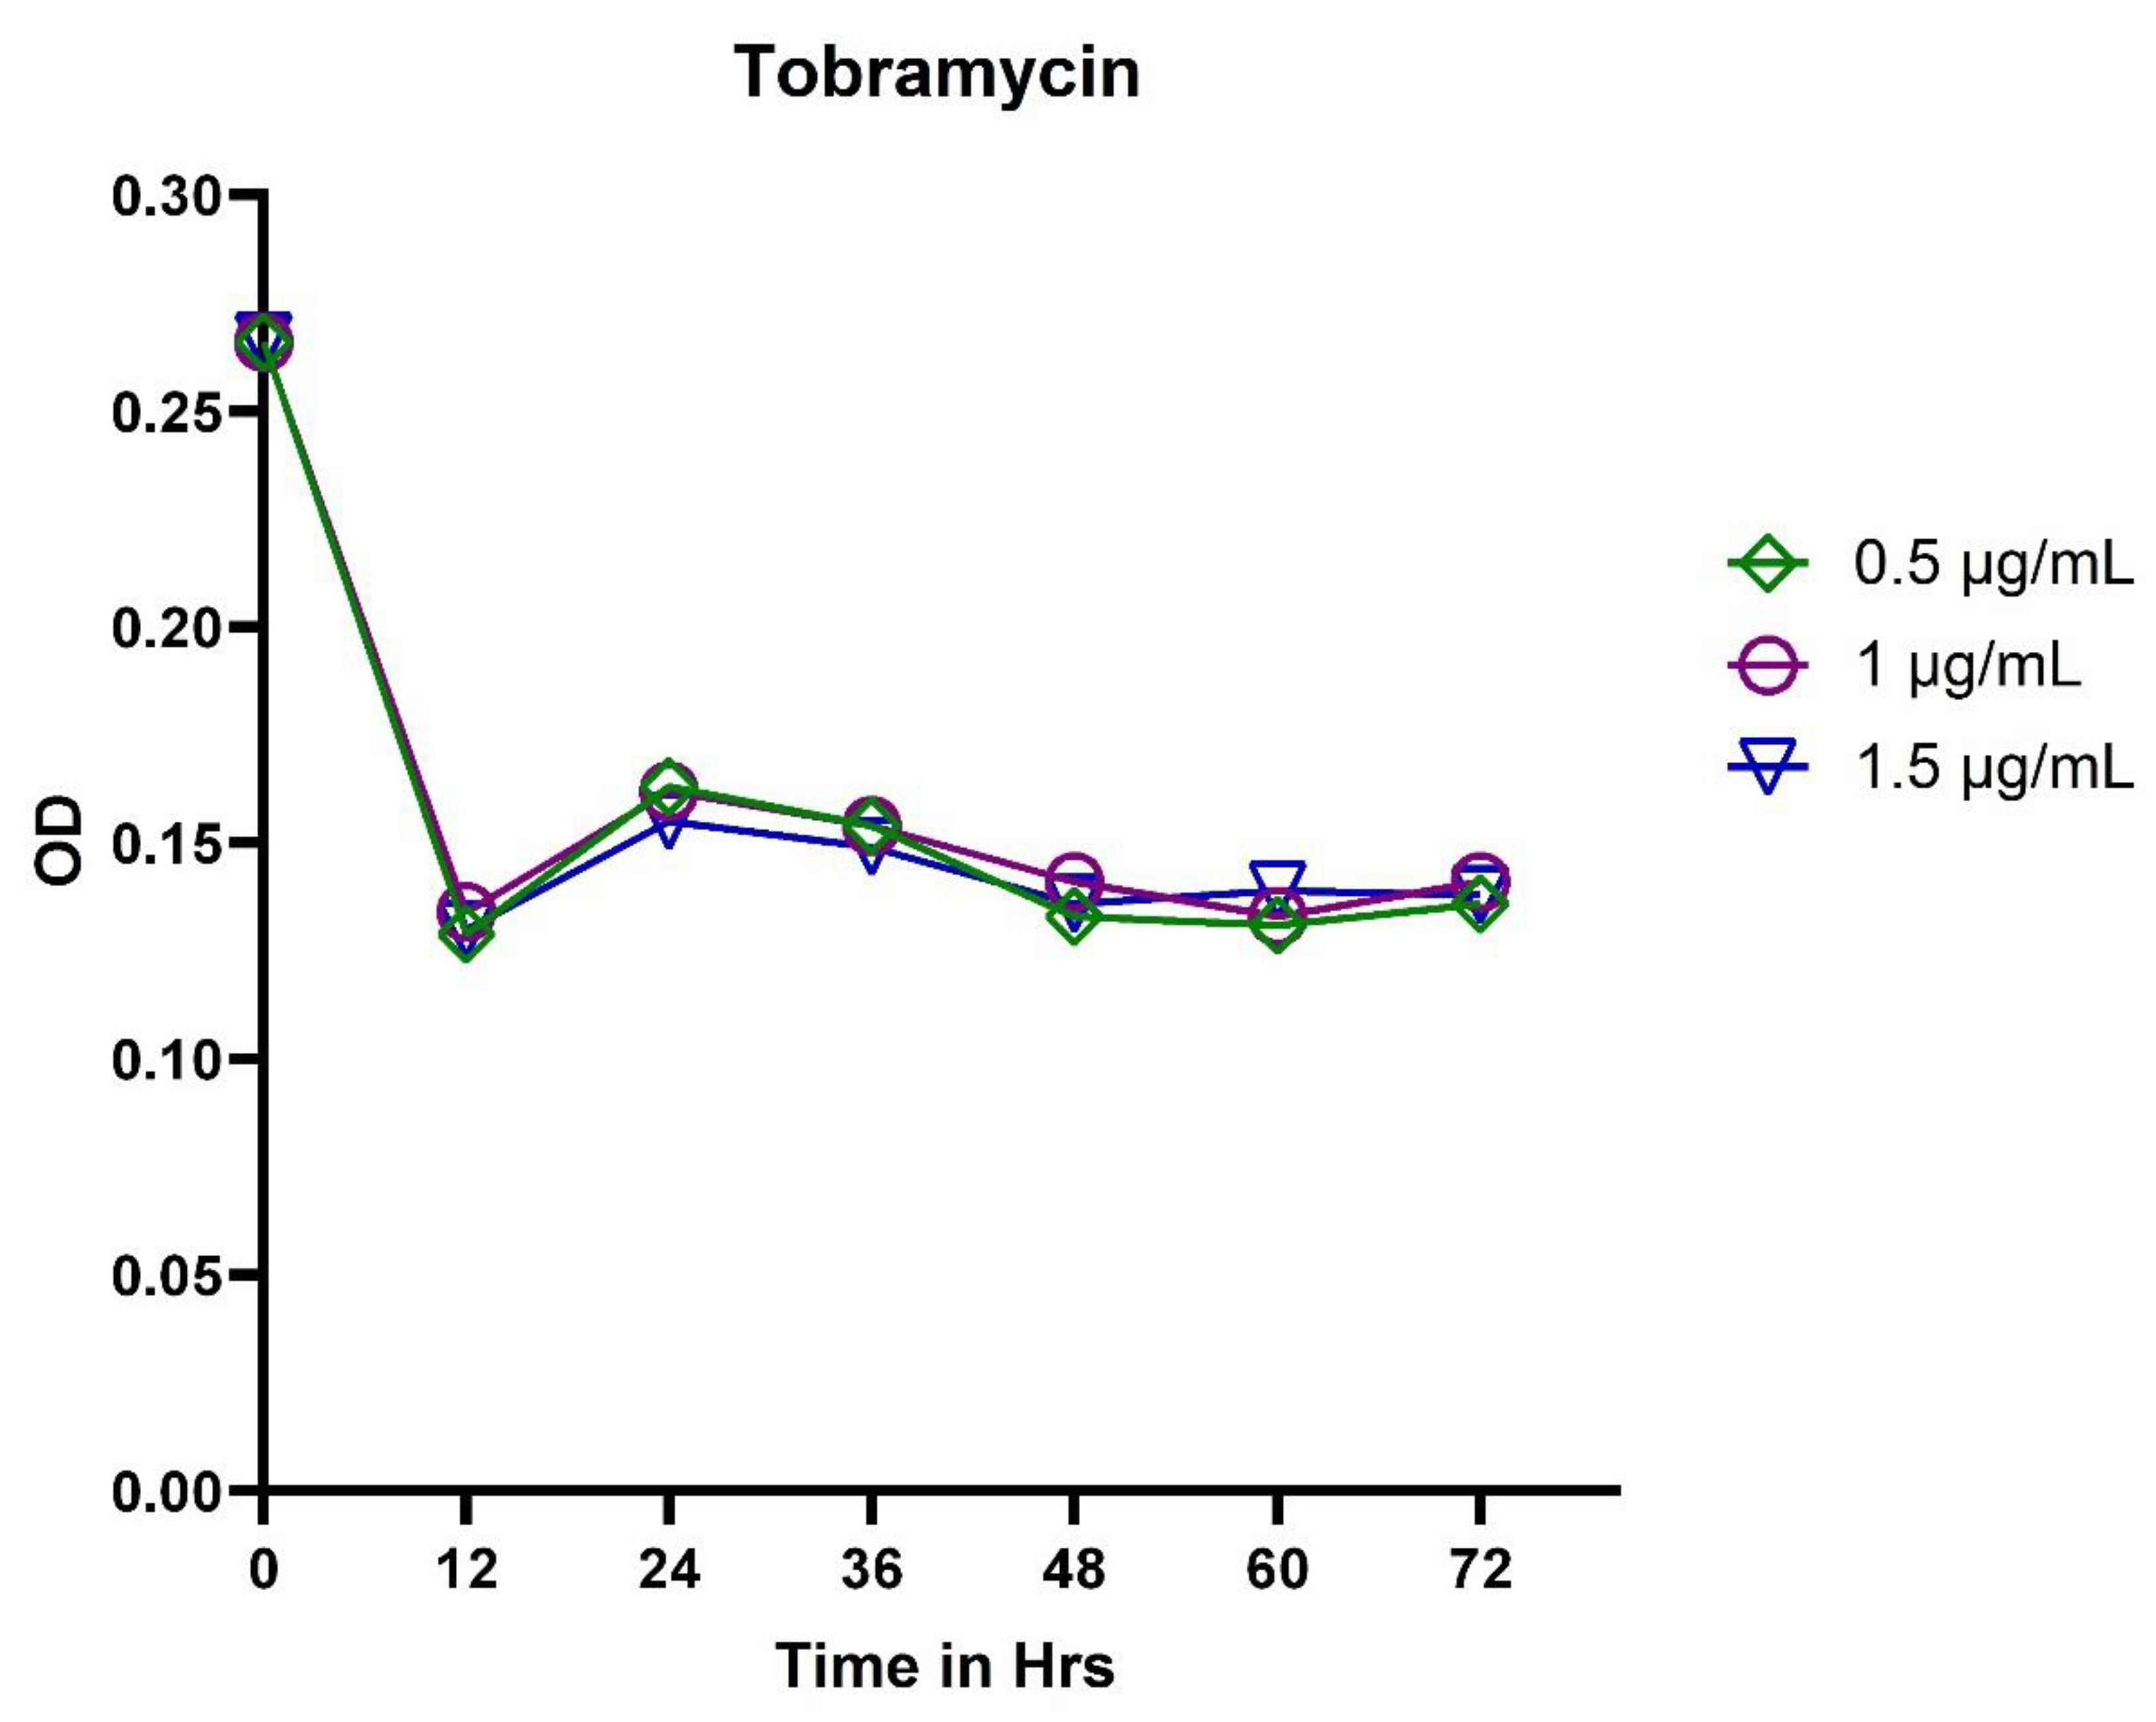
The initial OD600 of the bacterial culture was ≅ 0.26 in all the tubes. After 12 h, the cell density dropped to ≅ 0.13. In the 0.5 μg/mL and 1 μg/mL of gentamicin (Figure 1) and 1 μg/mL and 2 μg/mL of amikacin (Figure 2) tubes, the OD600 increased exponentially after 24 h. After 48 h, the bacterial growth attained the initial OD600 of ≅ 0.26 (Figure 1 and Figure 2), and the cells resumed active growth after the post-antibiotic effect. In tobramycin and the higher concentrations of gentamicin and amikacin tubes, after 12 h the OD600 further declined, and no growth was observed until 72 h (Figure 1, Figure 2 and Figure 3). The growth in the tubes of 1 μg/mL and 2 μg/mL of amikacin and the 0.5 μg/mL and 1 μg/mL tubes of gentamicin were confirmed as P. aeruginosa by MALDI-TOF automated identification system, based on peptide mass fingerprint matching.

3.3. Differential Gene Expression Analysis

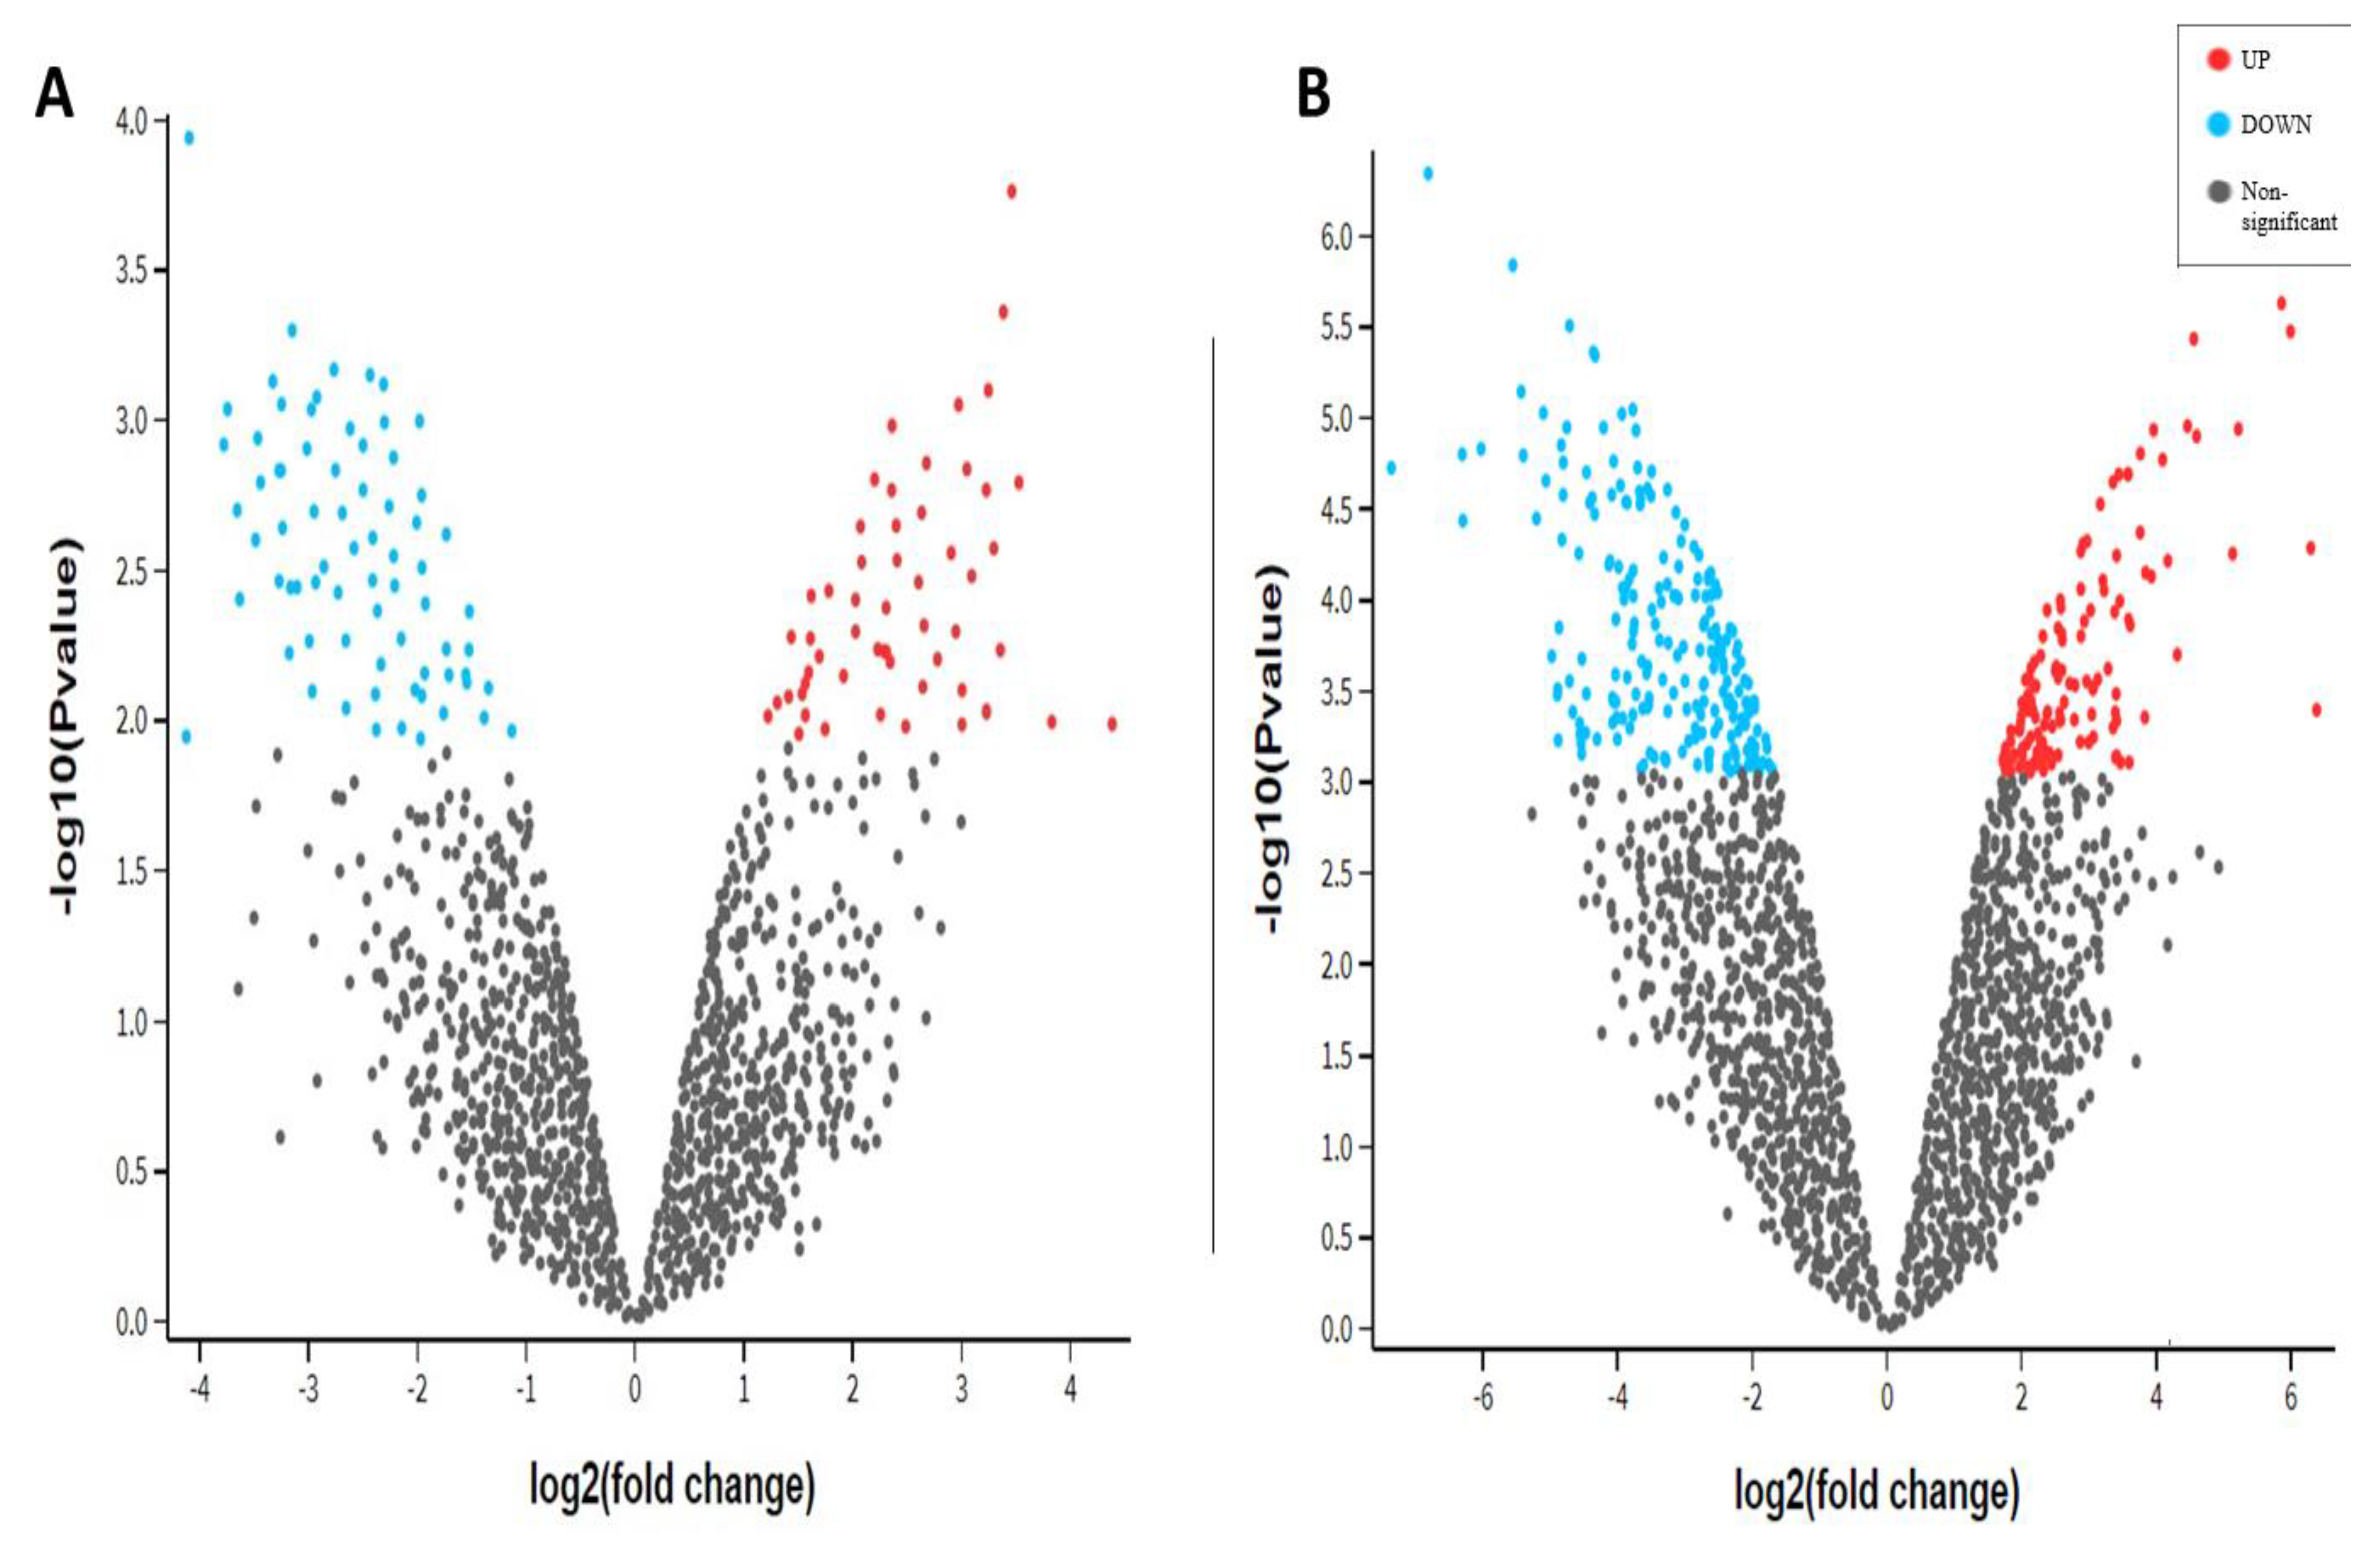
In GSE9991, 125 genes were differentially expressed. Among them, 53 genes were upregulated and 72 were downregulated. In GSE9989, a total of 307 genes were differentially expressed, in which 52 genes were upregulated and 255 genes were downregulated. The distribution of DEGs in both the datasets were represented in a volcano plot (Figure 4). In this study, the targeted DEGs included 17 from GSE9991 and 22 from GSE9989 (Table 1 and Table 2).

3.4. Functional Enrichment Analysis

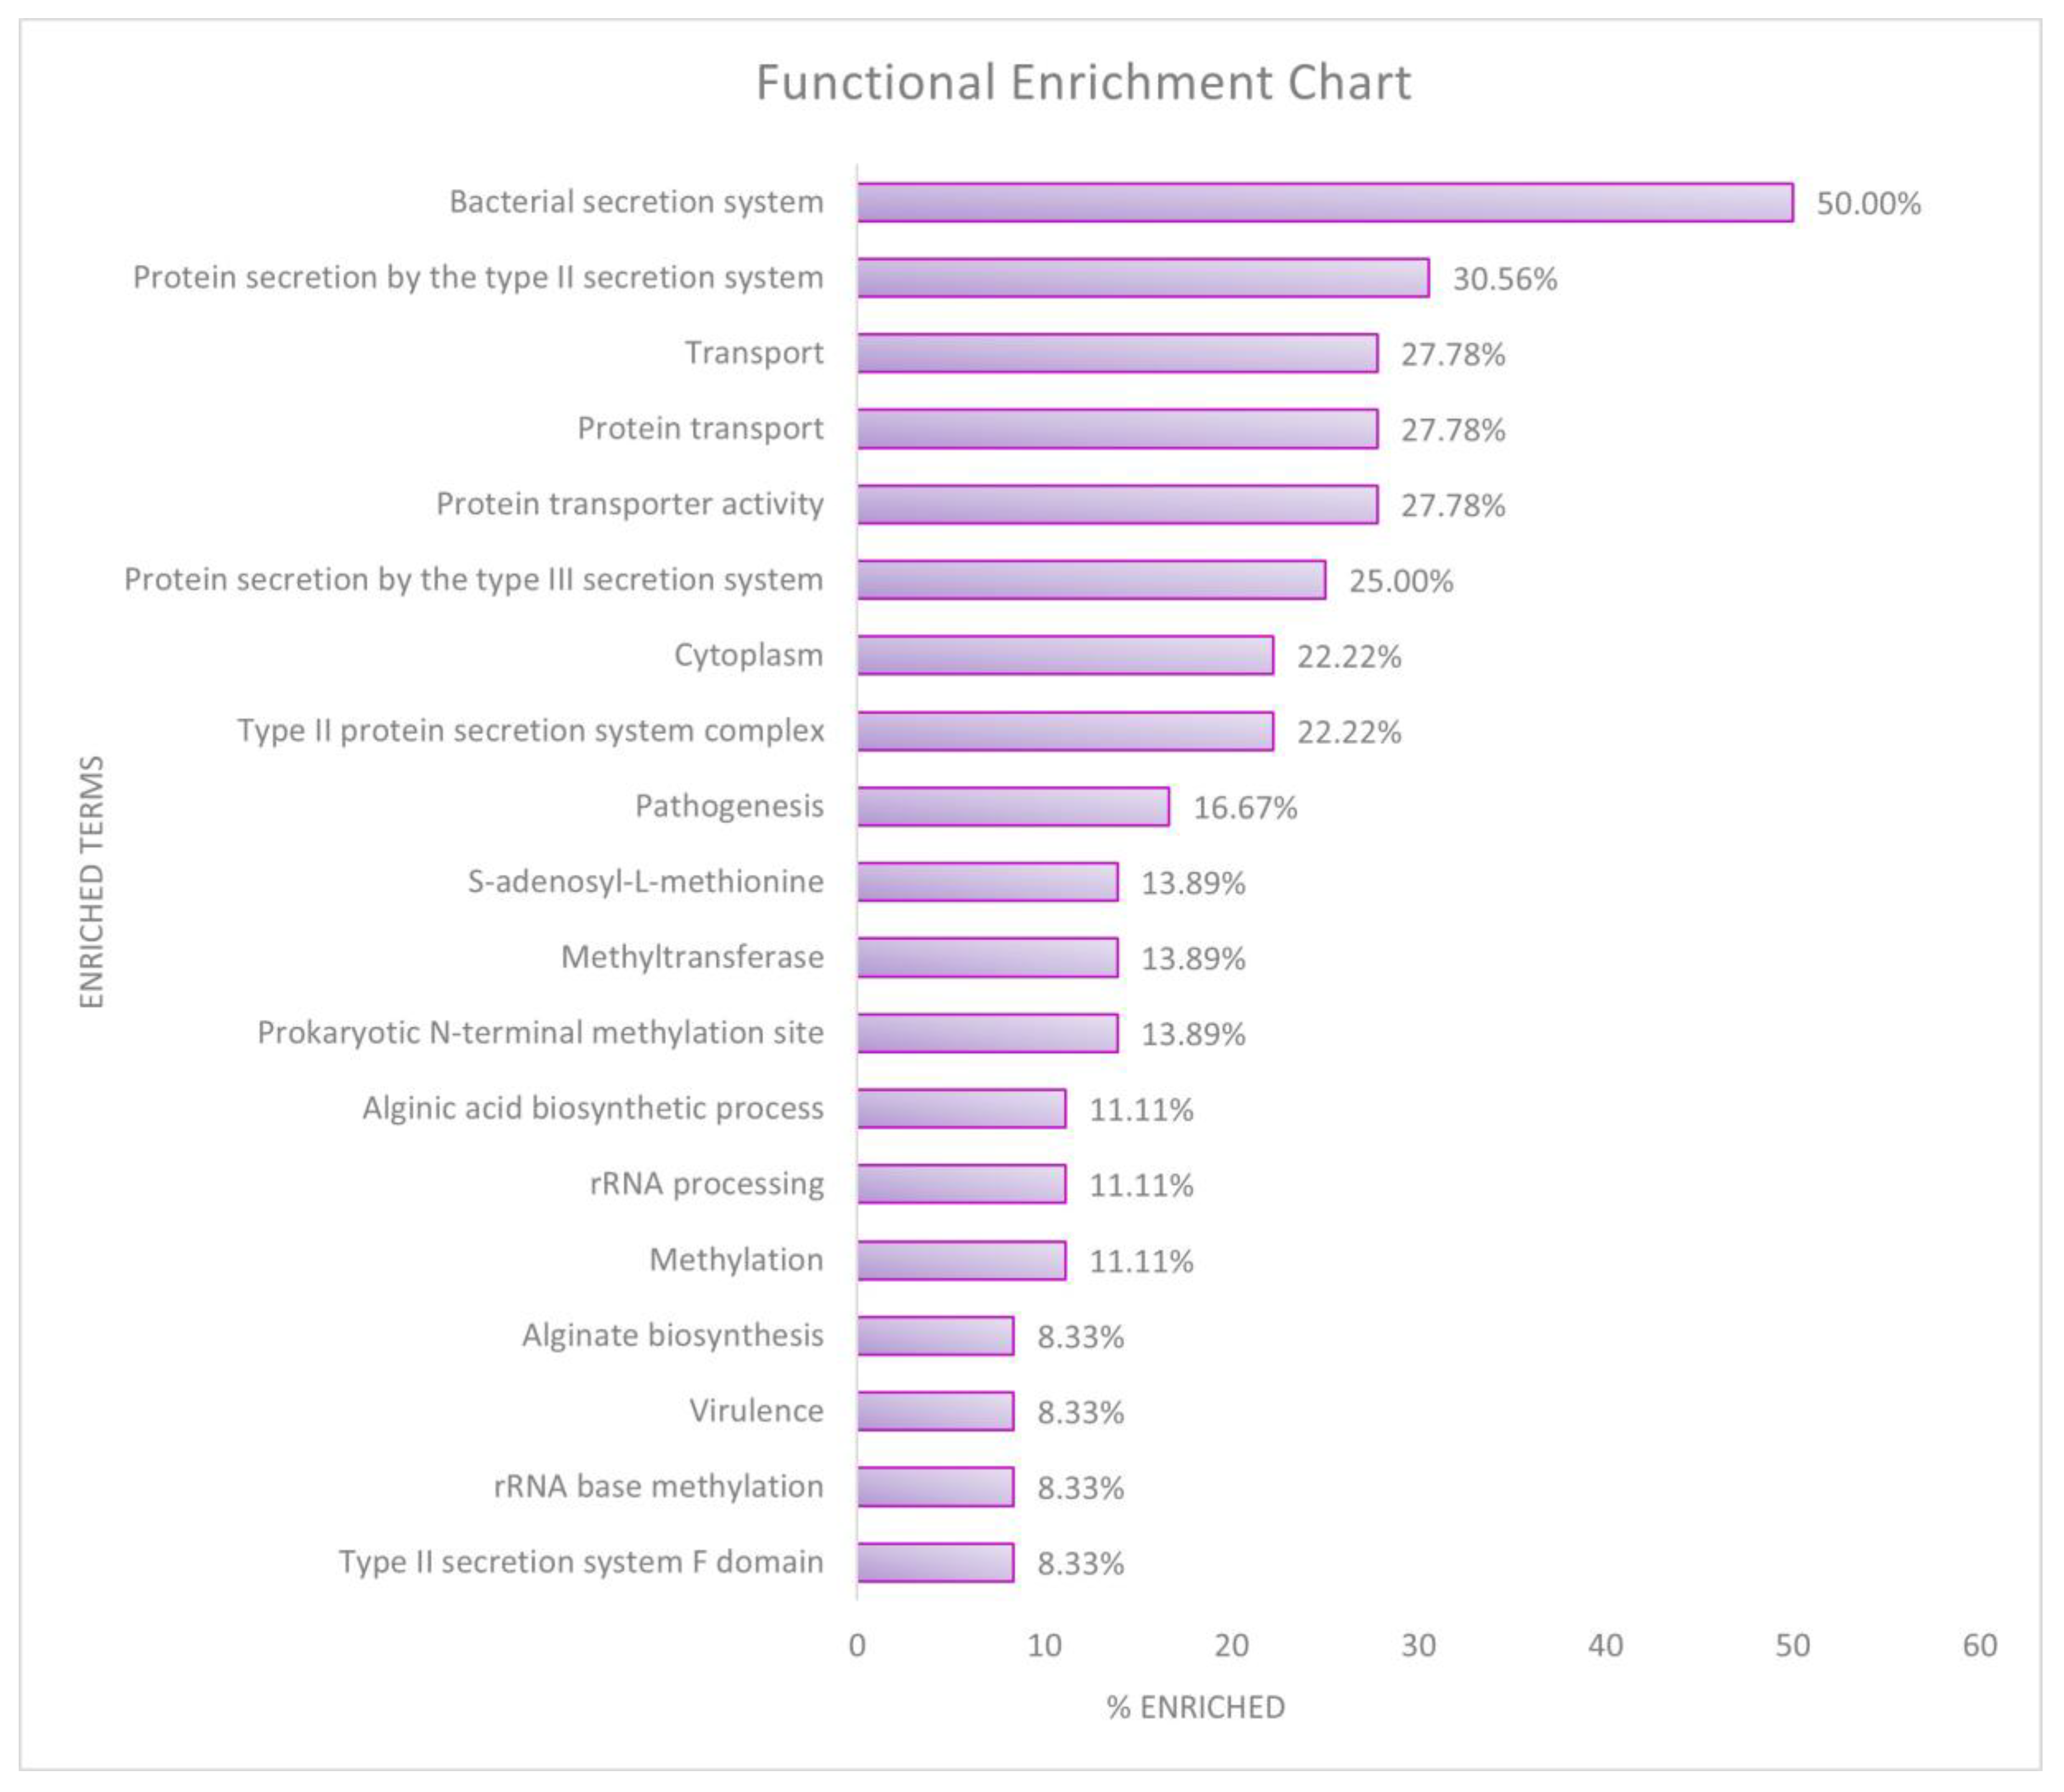
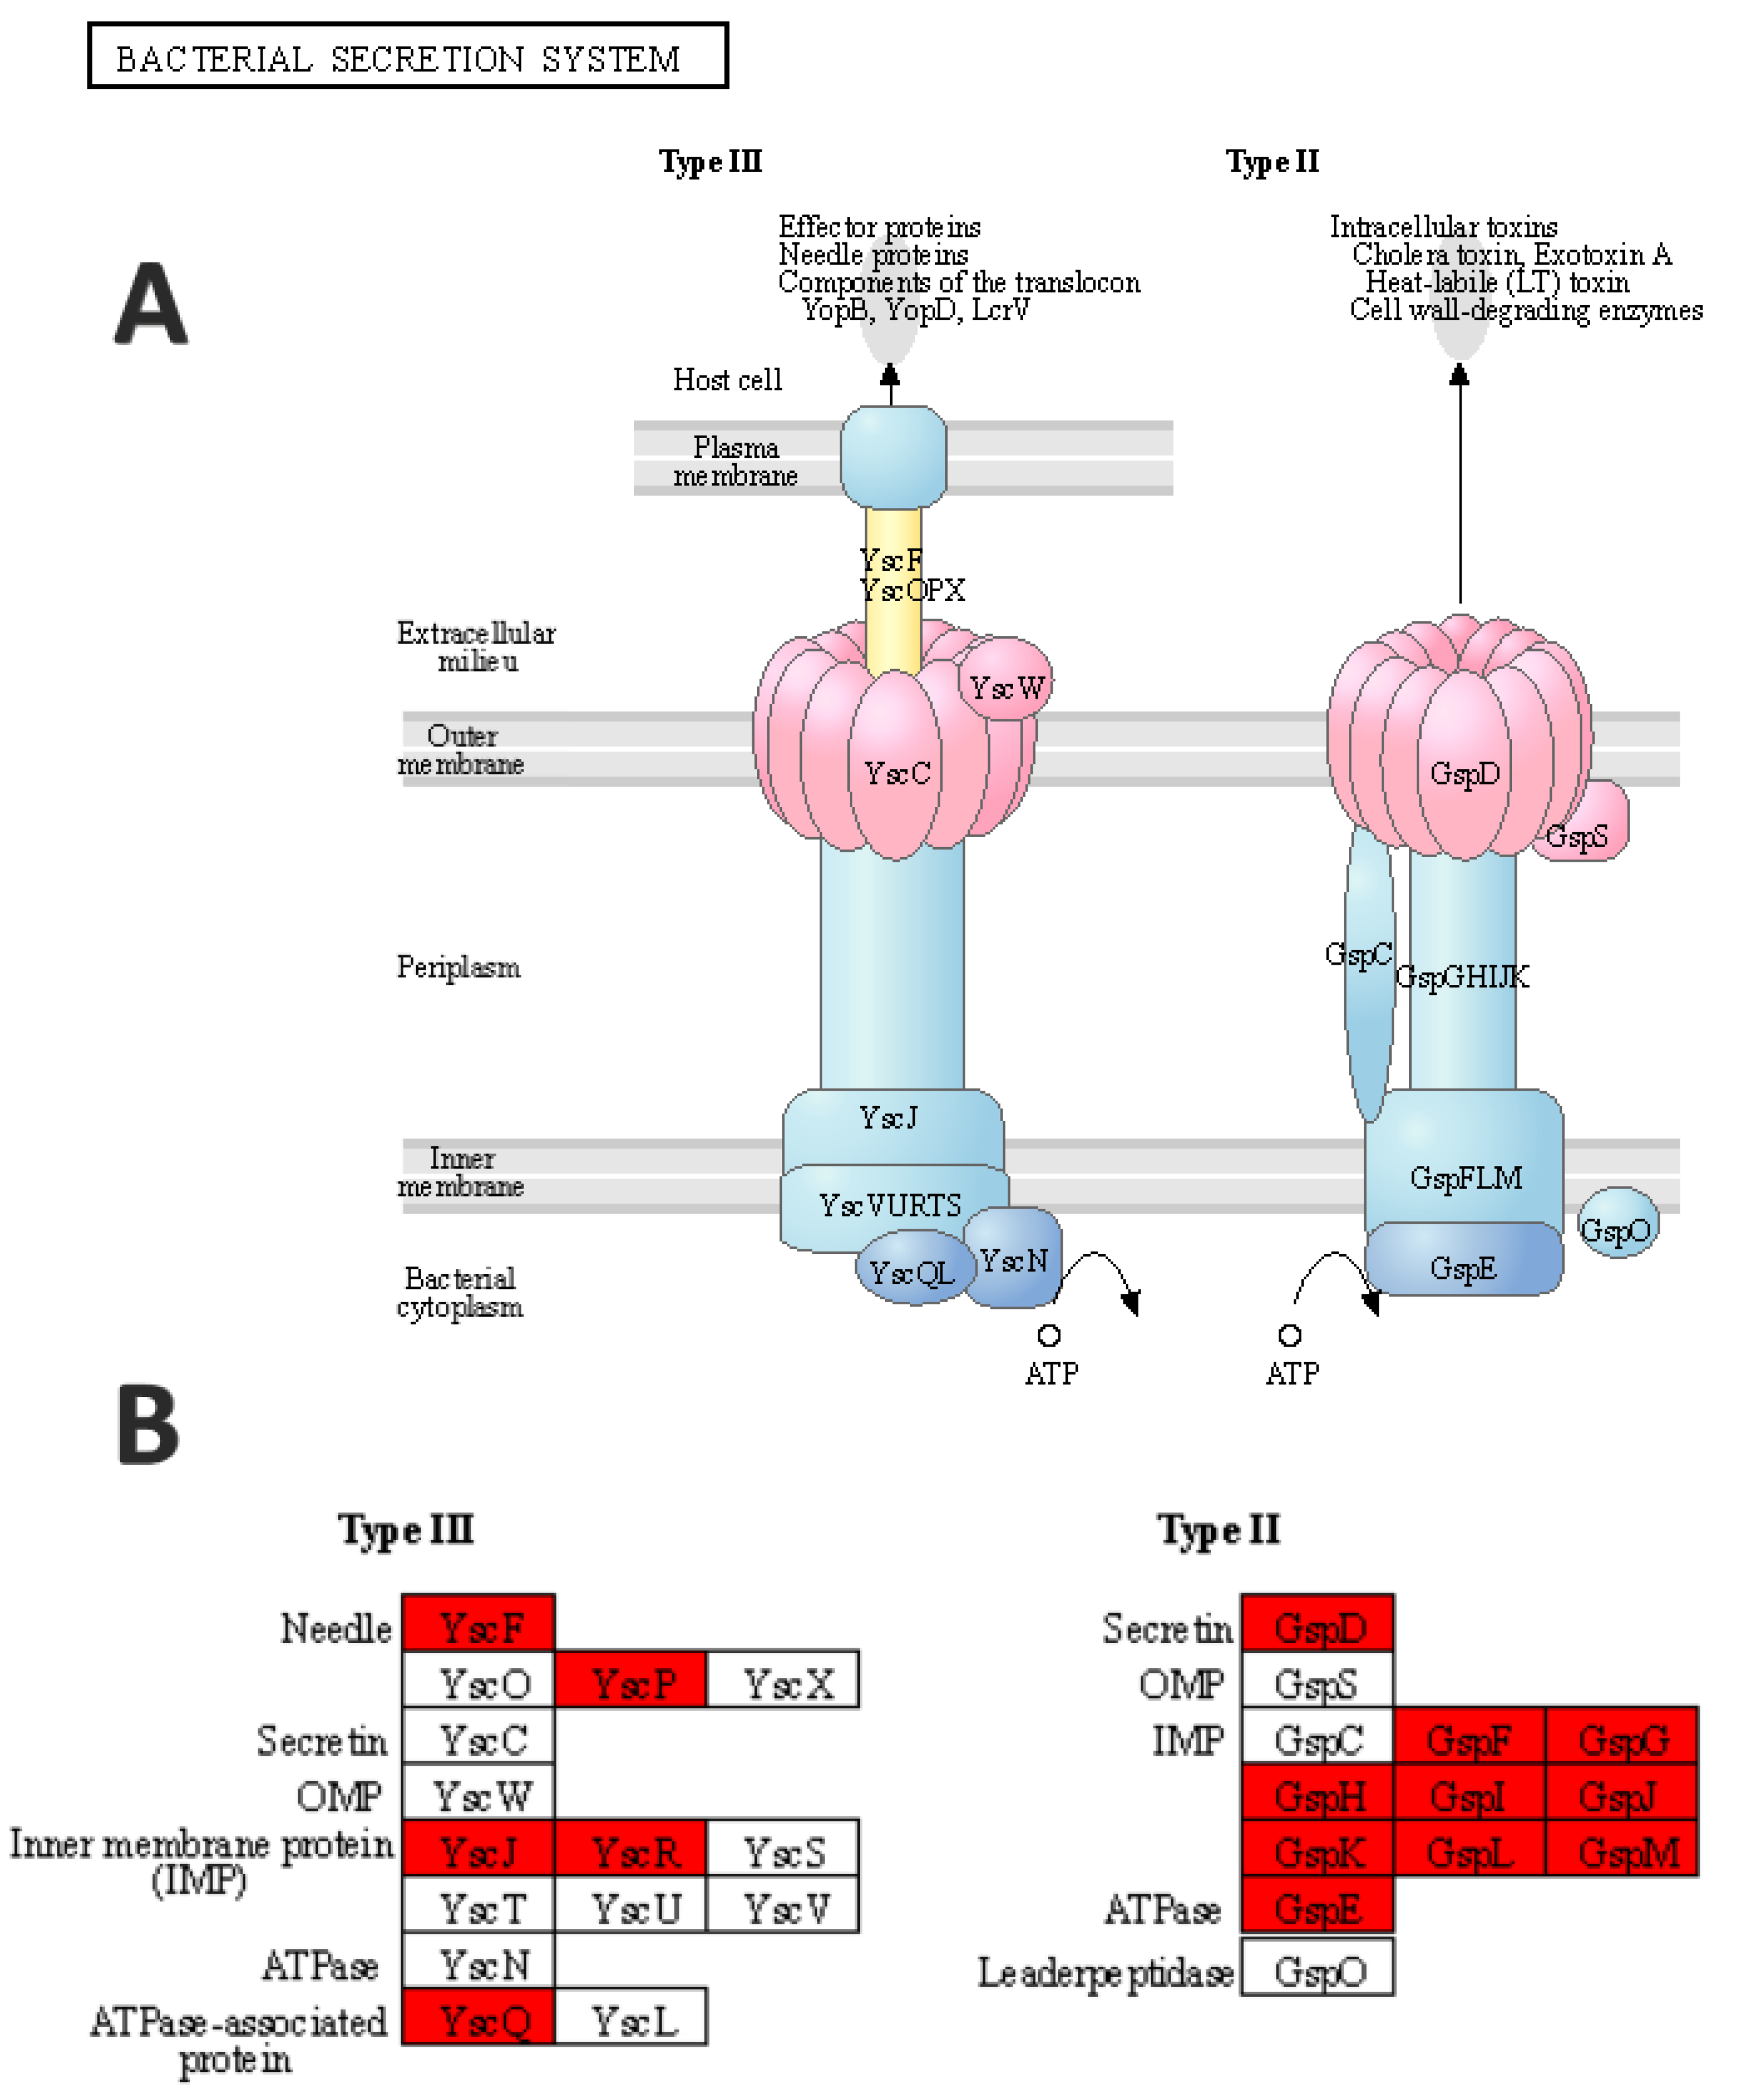
The DEGs enriched in the functional classification are presented in Figure 5. The highest enrichment was observed in the bacterial secretory system from the KEGG pathways (Figure 6). All the DEGs enriched in this pathway were downregulated in the type III and type II toxin system.
DEGs enriched in similar functional groups across databases were clustered as functional annotation clusters with a significant enrichment score (Table 3). The enriched clusters shared similar functional terms in type II and type III toxin secretion system (cluster 1), methylation (cluster 2), and RNA methyltransferase and rRNA processing (cluster 3).
From Pseudomonas Genome DB and PseudoCyc, we found that the targeted DEGs regulated the functions of RNA methyltransferases, 16S rRNA 7-methylguanosine methyltransferase, repressors for alginate synthesis, type II secretary proteins, type II transport domains, translocation protein in type III secretion, and type III export protein.
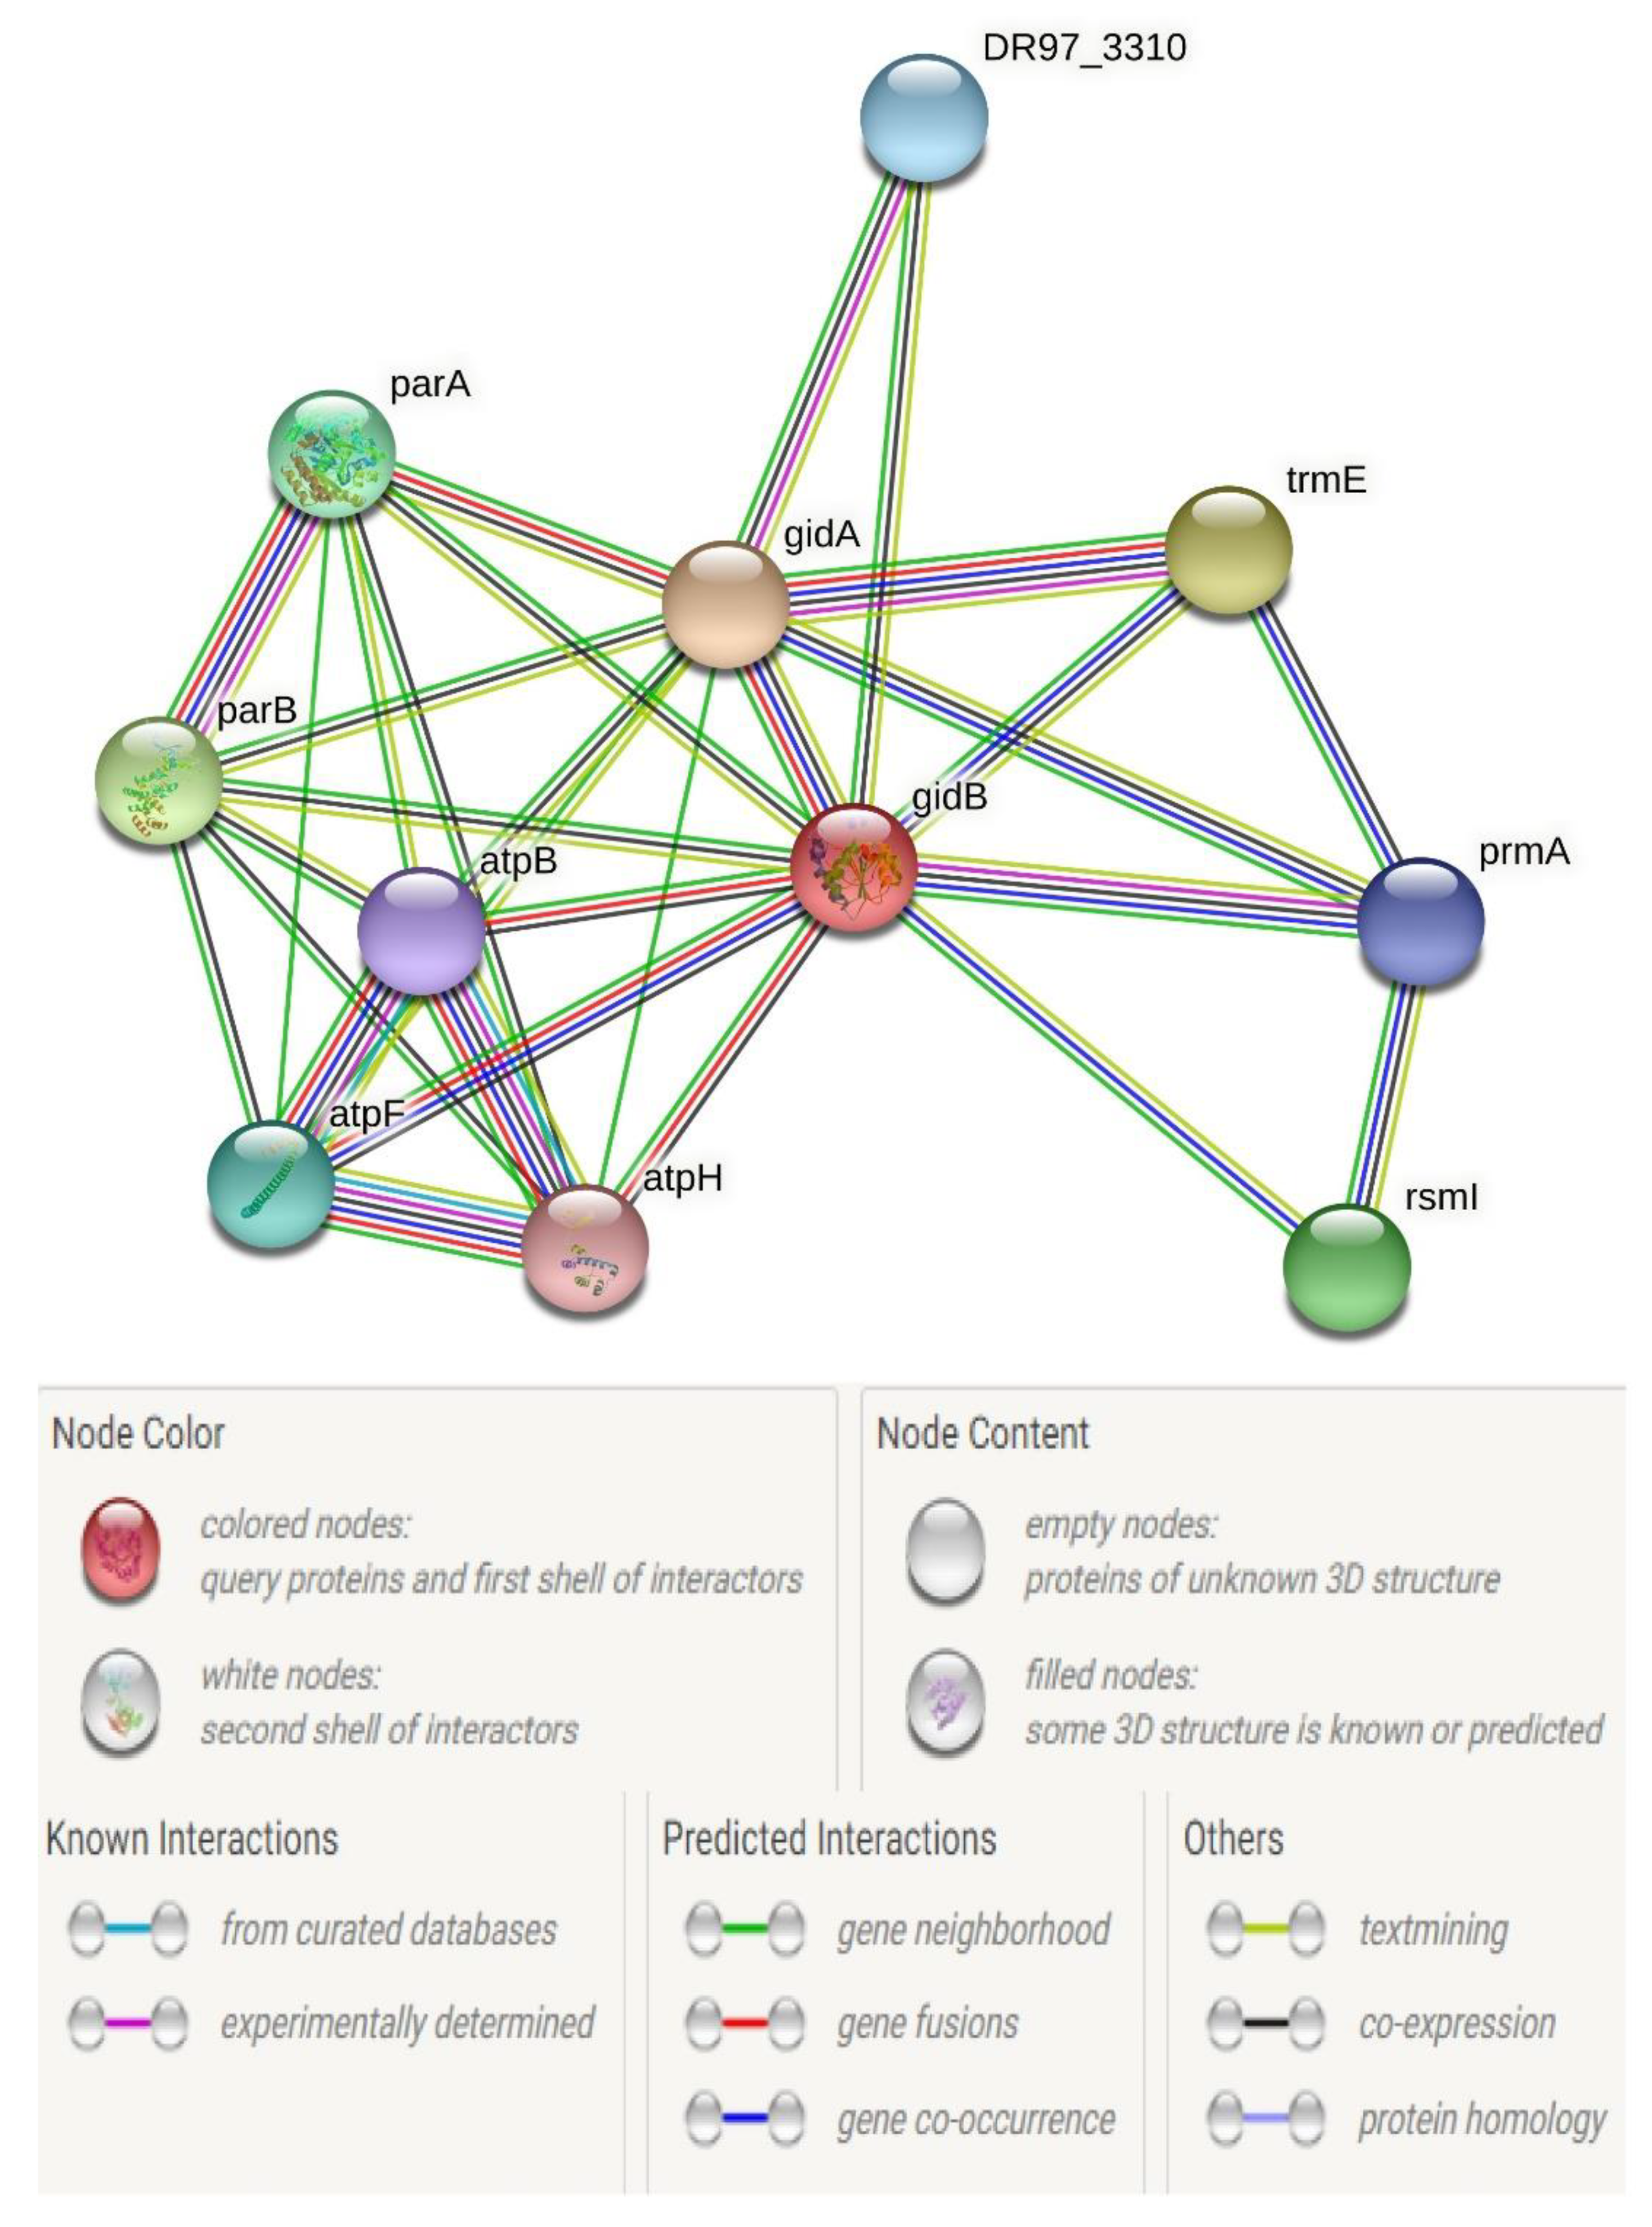
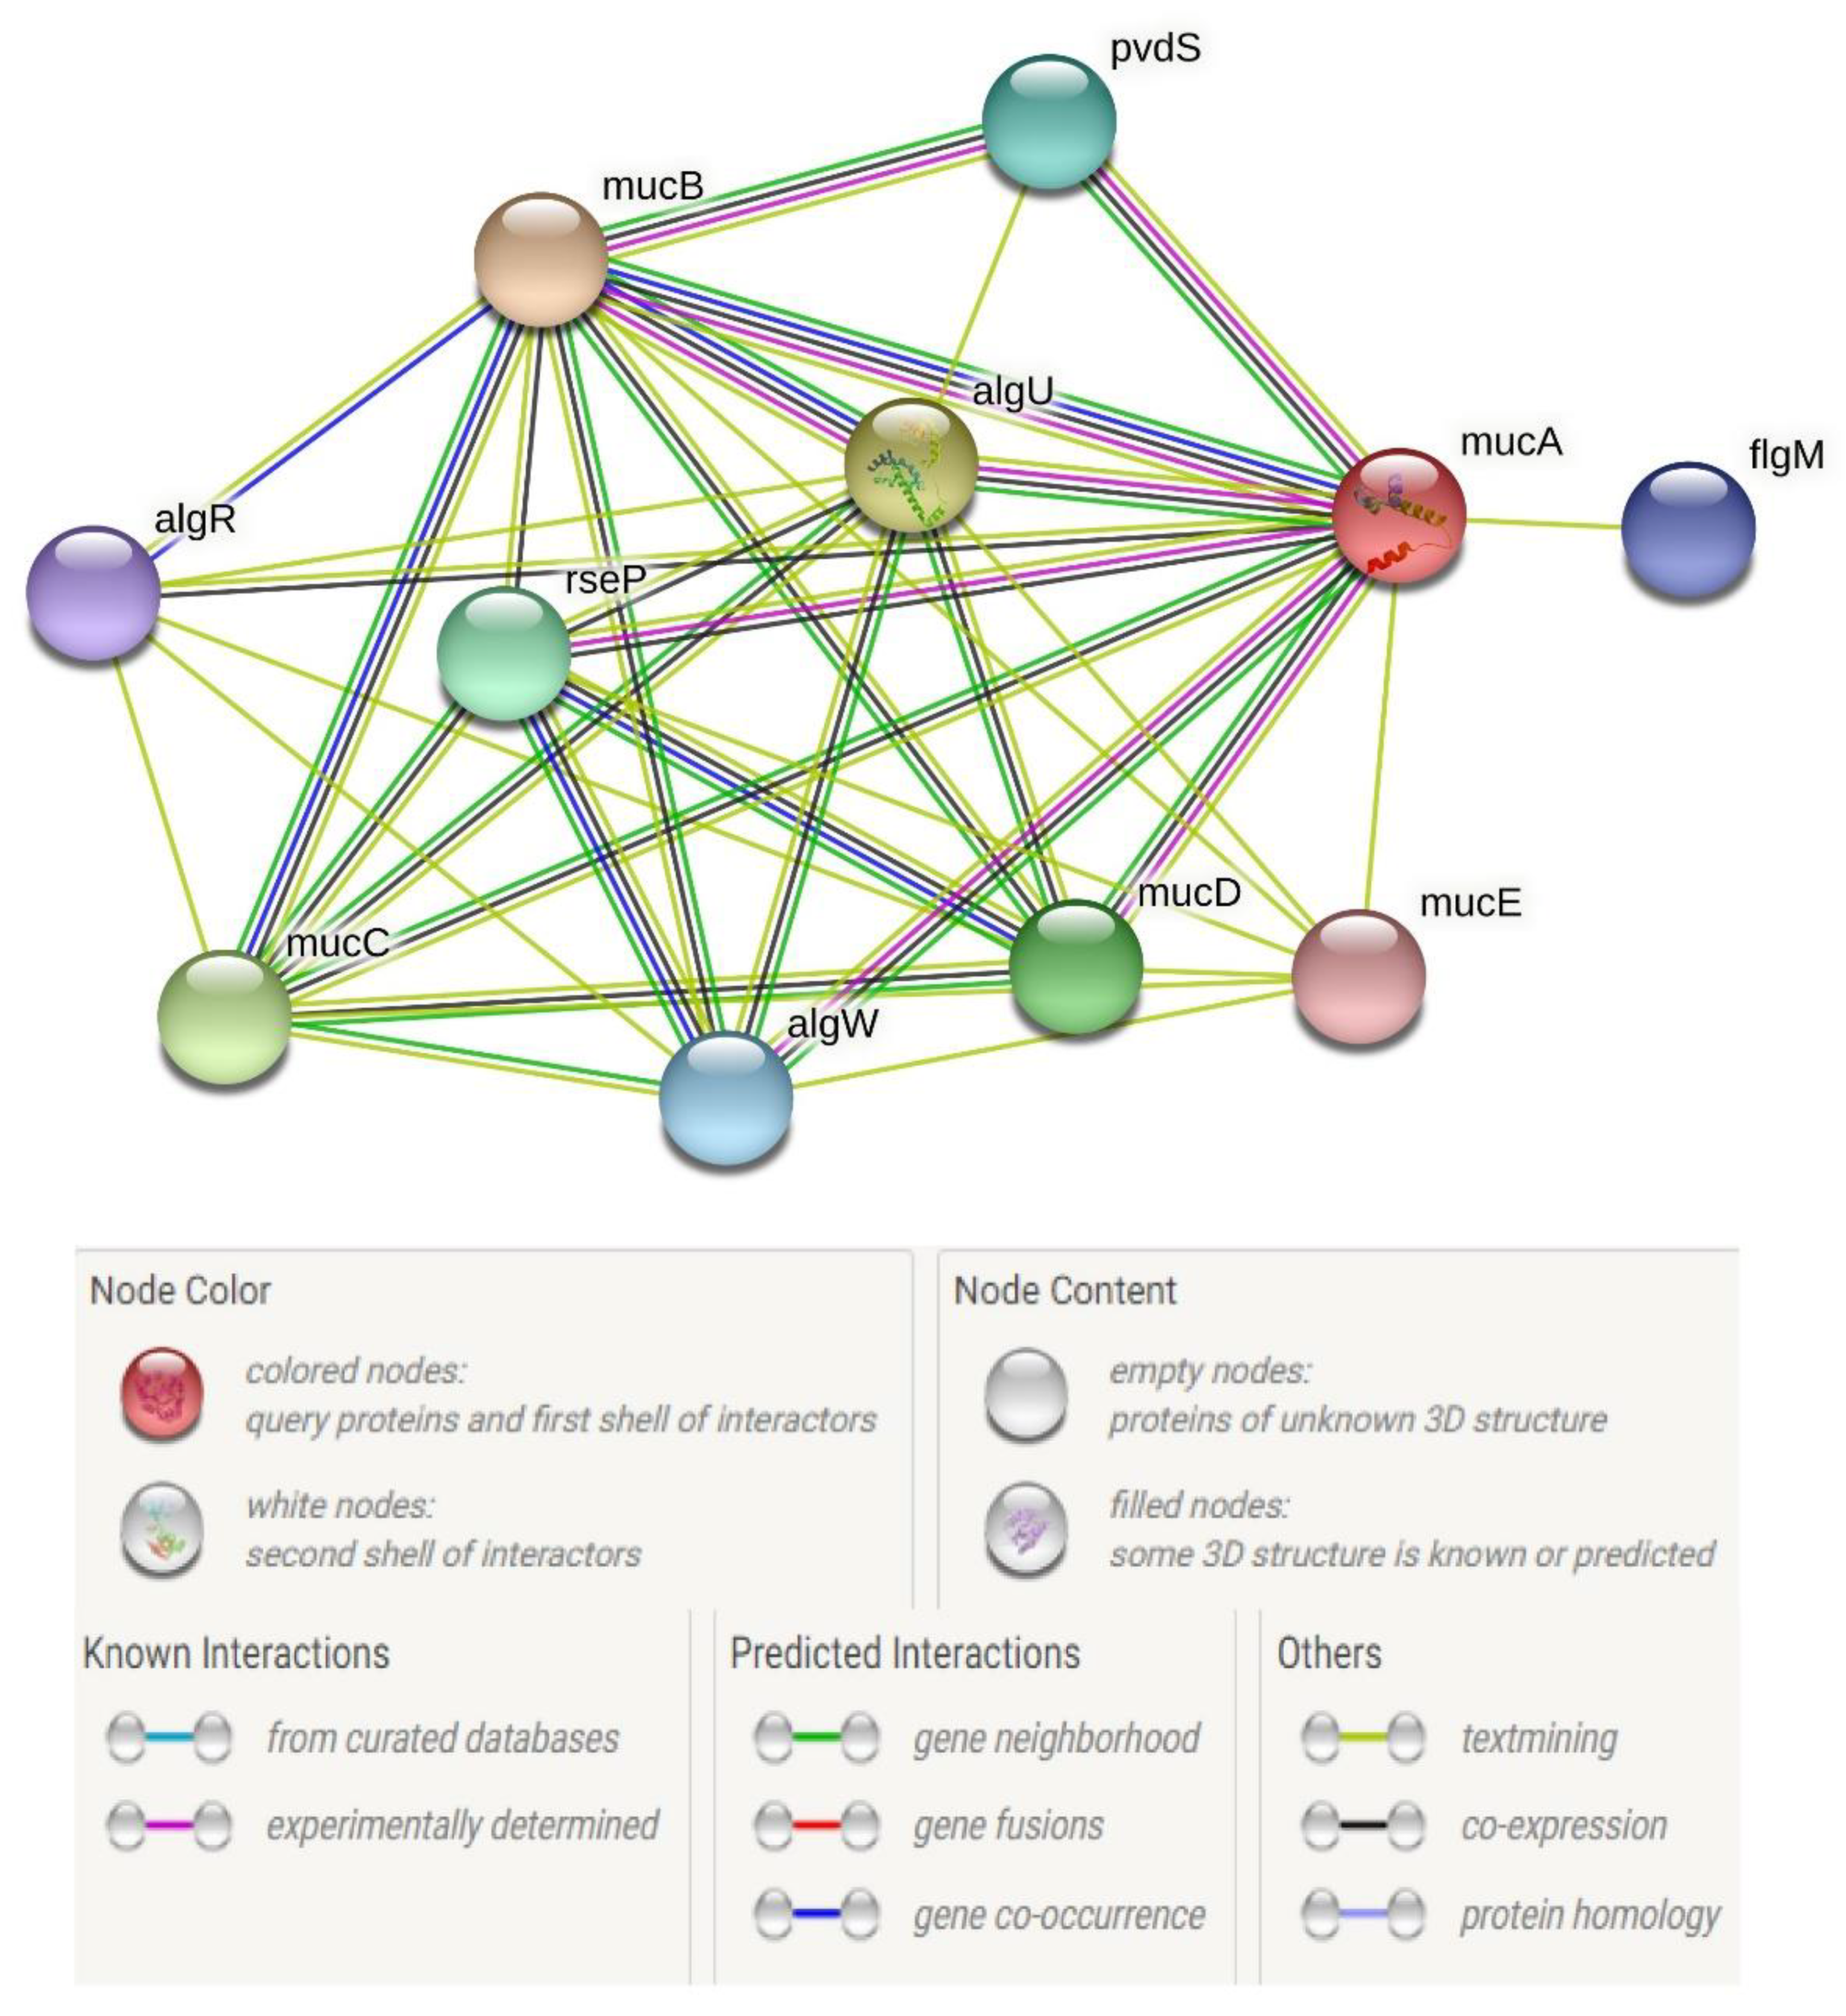
The PPI of gidB coding for methyltransferase activity (Figure 7) and mucA coding for repressor of alginate synthesis (Figure 8) were constructed using the STRING interaction network.

4. Discussion

The bacterial populations in the MICs experience antibiotic stress, which triggers the tolerance mechanism by regulating transcriptional changes in P. aeruginosa. The experimental setup of the in vitro treatment of antibiotics to P. aeruginosa reflects the antibiotic tolerance in chronic infections, where the response to antimicrobials is reduced due to the development of adaptive resistance [25]. Among the antibiotics evaluated for tolerance in P. aeruginosa, tobramycin exhibited a superior post-antibiotic effect in all the MICs and was found to be more effective at suppressing the bacterial sub-populations. Further, in silico analysis of the DEGs in the microarray datasets mimicking our experimental condition exposed the possible effectiveness of tobramycin in antibiotic tolerance. Anderson et al. published the microarray datasets of P. aeruginosa exposed to MIC of tobramycin in 2008 [17]. We further performed functional enrichment analysis for the DEGs and its putative gene regulations.
In the microarray datasets, the functional enrichment analysis enabled preliminary classification of the DEGs. The functional enrichments of the DEGs were observed in RNA methylation metabolism, alginate biosynthesis, and type II and type III secretory systems, which accounts for the resistance and virulence in P. aeruginosa. Anderson et al. reported the downregulation of drug efflux transporter genes PA1541, mexB and mexR, which contributed to efflux pump mediated resistance [26]. We further explored the methylation genes coding resistance to aminoglycosides by target methylation. Methylation of 16s rRNA by methyltransferase is a common mechanism of resistance to aminoglycosides, leading to a loss of affinity of the drug to the target [27]. RNA methyltransferases: PA0419, a ribosomal RNA small subunit methyltransferase E, which methylates 16s rRNA bases in 30s subunit, was downregulated. PA0017 and PA3680 genes of class B and J methyltransferase also lagged in expression. 16S rRNA 7-methylguanosine methyltransferase: gidB belongs to methyltransferase G, which involves methylation of the seventh nucleotide guanosine, confers resistance to aminoglycoside by decreasing the binding affinity to its target [28]. The PPI of gidB was determined to study its functionally associated genes of RNA modifying enzymes in the gid operon (Figure 7). Among the interactions, gidA, trmE, parB, rsmL, and parA genes exhibited the most significant association and they participated in the RNA methylation metabolism [29]. Hence, gidB may serve as a hub gene for 16S rRNA methylation in P. aeruginosa. A low expression of gidB (LogFc -3.32) and the gene expression profile of methyltransferases suggested a low incidence of resistance development during tobramycin exposure. The following observations also extend the insights in adaptive resistance mechanism and the possibility of regulation control of RNA methyltransferases by P. aeruginosa during antibiotic exposure.
In chronic infections caused by P. aeruginosa, biofilm formation is common during the course of infection [30], conferring additional resistance from host defenses and antibiotics [31]. Some antibiotics are involved in the up-regulation of genes that are responsible for induction of alginate production, which results in reduced antigen presentation to the immune system [32]. In addition, biofilms of P. aeruginosa also contribute to antibiotic tolerance, and the regulation of several biofilm-forming genes will affect the persistence of the cells in antibiotics [33]. Alginate Biosynthesis: algL, a lyase precursor that participates in catabolic activity of alginic acid, which leads to deconstruction of alginate complex [34], was highly expressed. Regulatory protein of alginate biosynthesis genes, algR [35], declined in expression. The gene pslF, which was low expressed (LogFc -1.03), is part of the glycosyltransferase family and is involved in the extracellular polysaccharide biosynthetic pathway [36]. Repressors for alginate synthesis: algU is the sigma factor for alginate biosynthesis genes. The gene mucA codes for anti-sigma factor and negatively regulates algU [37]. The gene mucB also regulates the algU activity in a negative manner, along with mucA. The high expression of mucA (LogFc 4.09) and mucB (LogFc 1.15) may downregulate the alginate biosynthesis. Anderson et al. reported a set of alginate biosynthesis genes that were differentially expressed. We further predicted the regulations of mucA and their PPI between gene neighbors to determine the functional partners (Figure 8). The negative transcriptional regulator, mucA, shared significant gene interacting neighbors with mucB, algU, mucC, mucD, rseP, algW, algR, and mucE. These genes were reported in the regulations of mucoid conversion of P. aeruginosa, responsible for the alginate production. Hence, mucA and algU are the determining factors for alginate regulation [37]. The following transcriptional changes, observed in mucA, mucB, algR, algL, and pslF, would possibly affect the alginate production to a significant level in the presence of tobramycin treatment.
Previous studies suggested that the toxin-anti-toxin system mediates persister cells in antibiotics. Although studies in E. coli showed evidence for the mechanism [38], it was not clear in P. aeruginosa. The DEGs in the type II and type III secretary system were enriched in the bacterial secretion system of KEGG pathways, and the downregulated genes in the system, coding for various protein domains in the type II and type III secretary system, are represented in Figure 6. Anderson et al. reported the marked downregulation of three transcripts, pscE, pscI, and PA1692, in the type III secretary system. We further explored the panel of genes that prime the interactions in both the type III secretary system and the type II secretary system. Type II Secretary Proteins: PA2677, PA2672, and PA0687, which engage in catalytic and transporter protein activity, were downregulated. Other transporter domains, namely xcpR, xcpU, xcpV, xcpX, xcpY, xcpZ, tadB, and tadD, were also low expressed [39], affecting the T2SS. Type II Transport Domains: xcpQ, xcpS, xcpT, xcpU, xcpV, xcpW, xcpX, and xcpY, which involve the efflux of the toxin from a cytosolic domain xcpR, were down-regulated and thus affected the export of T2SS [40]. Translocation protein in type III secretion: pscQ, pscP, and pscR are translocation proteins of the type III secretion system, which translocate the toxin across the host cell cytoplasmic membrane [41]. Downregulation of pscQ negatively impacted the toxin delivery to the cytosol of the host cell. Type III Export protein: pscE, pscF, pscG, pscH, pscI, pscJ, and pscK are the export proteins of the type III secretion system present in the cytoplasmic membrane, which transfer the toxin from the cytosolic domain to the MS ring of basal body [40]. Low expression of all these proteins prevent toxins from reaching the filament where it is translocated into the host cell. The following transcriptomic changes suggest the suppression of T2SS and T3SS, which may reduce the virulence of the P. aeruginosa during tobramycin treatment.
Anderson et al. observed similar changes in the reduction of the virulence and biofilm formation in P. aeruginosa after tobramycin treatment. Our study targeted a different panel of DEGs involved in the aminoglycoside resistance, biofilm formation and virulence mechanism, which are suitable to elucidate the antibiotic tolerance mechanism during antibiotic treatment. Our observations suggest that tobramycin treatment possibly reduces the regulations of RNA methyltransferases, alginate biosynthesis, and T2SS and T3SS in P. aeruginosa.
Spontaneous exposure of antibiotics in the bacterial population alters transcriptional regulation, favoring adaptive resistance which out-turns the fall in antibiotic activity over time [42]. This study suggested the use of tobramycin for treatment of chronic pseudomonas infection, as P. aeruginosa failed to develop adaptive resistance to tobramycin and exhibited a positive transcriptomic regulation for antibiotic response. Tobramycin is restricted for systemic use due to the rise of creatinine level during the initial days of therapy. Considering the in vivo drug response, tobramycin might enable a better treatment alternative as compared to current drug combinations.
Transcriptional alterations in microbes are dynamic events triggered by environmental changes, which out-turns the increase in adaptive resistance. Although adaptive resistance is involved in the increase of baseline MICs of the bacteria over time, genetic resistance is a function of time. It takes several generations of the bacteria to achieve genotypic resistance. The methodology of constantly switching antibiotics through in vitro exposure of antibiotics would enable us to decipher which clinical isolates would be physiologically resistant, leading to alternative aminoglycoside treatment for combating chronic infections.

Author Contributions

Conceptualization, A.K.B., B.T. and A.G.; Formal analysis, B.T. and A.G.; Investigation, A.K.B.; Methodology, A.K.B. and B.T.; Project administration, A.K.B. and A.J.; Resources, A.J.; Supervision, B.T.; Visualization, A.J.; Writing—original draft, A.K.B.; Writing—review & editing, B.T., A.J. and A.G. All authors have read and agreed to the published version of the manuscript.

Funding

This research received no external funding.

Institutional Review Board Statement

Not applicable.

Informed Consent Statement

Not applicable.

Data Availability Statement

All data are available within the manuscript with relevant citations.

Acknowledgments

We would like to express our gratitude to the Department of Microbial Biotechnology, Bharathiar University for laboratory access and technical support. We are thankful to Angayarkanni Jayaraman for guidance during the study period.

Conflicts of Interest

The authors declare that there is no conflict of interest.

References

  1. Carmeli, Y.; Troillet, N.; Eliopoulos, G.M.; Samore, M.H. Emergence of antibiotic-resistant Pseudomonas aeruginosa: Comparison of risks associated with different antipseudomonal agents. Antimicrob. Agents Chemother. 1999, 43, 1379–1382. [Google Scholar] [CrossRef] [Green Version]
  2. Zhanel, G.G.; Clark, N.; Lynch, J.P. Emergence of antimicrobial resistance among Pseudomonas aeruginosa: Implications for therapy. Semin. Respir. Crit. Care Med. 2017, 38, 326–345. [Google Scholar] [CrossRef]
  3. Bassetti, M.; Vena, A.; Croxatto, A.; Righi, E.; Guery, B. How to manage Pseudomonas aeruginosa infections. Drugs Context 2018, 7, 212527. [Google Scholar] [CrossRef]
  4. Prayle, A.; Smyth, A. Aminoglycoside use in cystic fibrosis: Therapeutic strategies and toxicity. Curr. Opin. Pulm. Med. 2010, 16, 604–610. [Google Scholar] [CrossRef]
  5. Falagas, M.E.; Matthaiou, D.; Bliziotis, I.A. The role of aminoglycosides in combination with a β-lactam for the treatment of bacterial endocarditis: A meta-analysis of comparative trials. J. Antimicrob. Chemother. 2006, 57, 639–647. [Google Scholar] [CrossRef]
  6. Bodmann, K. Current guidelines for the treatment of severe pneumonia and sepsis. Chemotherapy 2005, 51, 227–233. [Google Scholar] [CrossRef]
  7. Dornbusch, K.; Olofsson, C.; Holm, S. Postantibiotic effect and postantibiotic sub-mic effect of dirithromycin and erythromycin against respiratory tract pathogenic bacteria. APMIS 1999, 107, 505–513. [Google Scholar] [CrossRef] [PubMed]
  8. Patel, J.A.; Javiya, V.A.; Ghatak, S.B.; Patel, K.R. Antibiotic susceptibility patterns of Pseudomonas aeruginosa at a tertiary care hospital in Gujarat, India. Indian J. Pharmacol. 2008, 40, 230–234. [Google Scholar] [CrossRef] [PubMed] [Green Version]
  9. Karlowsky, J.A.; Saunders, M.H.; Harding, G.A.; Hoban, D.J.; Zhanel, G.G. In Vitro characterization of aminoglycoside adaptive resistance in Pseudomonas aeruginosa. Antimicrob. Agents Chemother. 1996, 40, 1387–1393. [Google Scholar] [CrossRef] [PubMed] [Green Version]
  10. Gilleland, L.B.; Gilleland, H.E.; Gibson, J.A.; Champlin, F.R. Adaptive resistance to aminoglycoside antibiotics in Pseudomonas aeruginosa. J. Med. Microbiol. 1989, 29, 41–50. [Google Scholar] [CrossRef] [Green Version]
  11. Hocquet, D.; Vogne, C.; El Garch, F.; Vejux, A.; Gotoh, N.; Lee, A.; Lomovskaya, O.; Plésiat, P. MexXY-OprM efflux pump is necessary for adaptive resistance of Pseudomonas aeruginosa to aminoglycosides. Antimicrob. Agents Chemother. 2003, 47, 1371–1375. [Google Scholar] [CrossRef] [Green Version]
  12. Moradali, M.F.; Ghods, S.; Rehm, B.H.A. Pseudomonas aeruginosa lifestyle: A paradigm for adaptation, survival, and persistence. Front. Cell. Infect. Microbiol. 2017, 7, 39. [Google Scholar] [CrossRef] [Green Version]
  13. Esani, S.; Chen, T.; Leung, K.P.; Van Laar, T.A. Transcriptome sequence of antibiotic-treated Pseudomonas aeruginosa. Microbiol. Resour. Announc. 2019, 8, e01367-18. [Google Scholar] [CrossRef] [PubMed] [Green Version]
  14. Lonergan, Z.; Nairn, B.L.; Wang, J.; Hsu, Y.-P.; Hesse, L.; Beavers, W.N.; Chazin, W.J.; Trinidad, J.C.; VanNieuwenhze, M.S.; Giedroc, D.P.; et al. An Acinetobacter baumannii, zinc-regulated peptidase maintains cell wall integrity during immune-mediated nutrient sequestration. Cell Rep. 2019, 26, 2009–2018.e6. [Google Scholar] [CrossRef] [Green Version]
  15. Berti, A.D.; Wergin, J.E.; Girdaukas, G.G.; Hetzel, S.J.; Sakoulas, G.; Rose, W.E. Altering the proclivity towards daptomycin resistance in methicillin-resistant staphylococcus aureus using combinations with other antibiotics. Antimicrob. Agents Chemother. 2012, 56, 5046–5053. [Google Scholar] [CrossRef] [Green Version]
  16. Mellmann, A.; Cloud, J.; Maier, T.; Keckevoet, U.; Ramminger, I.; Iwen, P.; Dunn, J.; Hall, G.; Wilson, D.; LaSala, P.; et al. Evaluation of matrix-assisted laser desorption ionization-time-of-flight mass spectrometry in comparison to 16S rRNA gene sequencing for species identification of Nonfermenting bacteria. J. Clin. Microbiol. 2008, 46, 1946–1954. [Google Scholar] [CrossRef] [PubMed] [Green Version]
  17. Anderson, G.G.; Moreau-Marquis, S.; Stanton, B.A.; O’Toole, G.A. In Vitro analysis of tobramycin-treated Pseudomonas aeruginosa biofilms on cystic fibrosis-derived airway epithelial cells. Infect. Immun. 2008, 76, 1423–1433. [Google Scholar] [CrossRef] [Green Version]
  18. Xia, J.; Gill, E.E.; Hancock, R. NetworkAnalyst for statistical, visual and network-based meta-analysis of gene expression data. Nat. Protoc. 2015, 10, 823–844. [Google Scholar] [CrossRef] [PubMed]
  19. Huang, D.W.; Sherman, B.T.; Lempicki, R.A. Bioinformatics enrichment tools: Paths toward the comprehensive functional analysis of large gene lists. Nucleic Acids Res. 2009, 37, e16. [Google Scholar] [CrossRef] [PubMed] [Green Version]
  20. Freudenberg, J.; Joshi, V.K.; Hu, Z.; Medvedovic, M. Clean: Clustering enrichment analysis. BMC Bioinform. 2009, 10, 234. [Google Scholar] [CrossRef] [PubMed] [Green Version]
  21. Winsor, G.L.; Griffiths, E.J.; Lo, R.; Dhillon, B.K.; Shay, J.A.; Brinkman, F.S.L. Enhanced annotations and features for comparing thousands of Pseudomonas genomes in the Pseudomonas genome database. Nucleic Acids Res. 2016, 44, D646–D653. [Google Scholar] [CrossRef] [PubMed] [Green Version]
  22. Romero, P.; Karp, P. PseudoCyc, a pathway-genome database for Pseudomonas aeruginosa. J. Mol. Microbiol. Biotechnol. 2003, 5, 230–239. [Google Scholar] [CrossRef] [PubMed]
  23. Snel, B. String: A web-server to retrieve and display the repeatedly occurring neighbourhood of a gene. Nucleic Acids Res. 2000, 28, 3442–3444. [Google Scholar] [CrossRef] [PubMed] [Green Version]
  24. Szklarczyk, D.; Gable, A.L.; Lyon, D.; Junge, A.; Wyder, S.; Huerta-Cepas, J.; Simonovic, M.; Doncheva, N.T.; Morris, J.H.; Bork, P.; et al. String v11: Protein–Protein association networks with increased coverage, supporting functional discovery in genome-wide experimental datasets. Nucleic Acids Res. 2019, 47, D607–D613. [Google Scholar] [CrossRef] [PubMed] [Green Version]
  25. La Rosa, R.; Rossi, E.; Feist, A.M.; Johansen, H.K.; Molin, S. Compensatory evolution of Pseudomonas aeruginosa’s slow growth phenotype suggests mechanisms of adaptation in cystic fibrosis. Nat. Commun. 2021, 12, 3186. [Google Scholar] [CrossRef] [PubMed]
  26. Ziha-Zarifi, I.; Llanes, C.; Köhler, T.; Pechere, J.-C.; Plesiat, P. In Vivo emergence of multidrug-resistant mutants of Pseudomonas aeruginosa overexpressing the active efflux system MexA-MexB-OprM. Antimicrob. Agents Chemother. 1999, 43, 287–291. [Google Scholar] [CrossRef] [Green Version]
  27. Doi, Y.; Arakawa, Y. 16S ribosomal RNA methylation: Emerging resistance mechanism against aminoglycosides. Clin. Infect. Dis. 2007, 45, 88–94. [Google Scholar] [CrossRef]
  28. Mikheil, D.M.; Shippy, D.; Eakley, N.M.; Okwumabua, O.E.; Fadl, A.A. Deletion of gene encoding methyltransferase (gidB) confers high-level antimicrobial resistance in Salmonella. J. Antibiot. 2012, 65, 185–192. [Google Scholar] [CrossRef]
  29. Shippy, D.; Fadl, A.A. RNA modification enzymes encoded by the gid operon: Implications in biology and virulence of bacteria. Microb. Pathog. 2015, 89, 100–107. [Google Scholar] [CrossRef]
  30. Yu, S.; Wei, Q.; Zhao, T.; Guo, Y.; Ma, L.Z. A Survival Strategy for Pseudomonas aeruginosa that uses exopolysaccharides to sequester and store iron to stimulate psl-dependent biofilm formation. Appl. Environ. Microbiol. 2016, 82, 6403–6413. [Google Scholar] [CrossRef] [PubMed] [Green Version]
  31. Menendez, A.; Finlay, B.B. Defensins in the immunology of bacterial infections. Curr. Opin. Immunol. 2007, 19, 385–391. [Google Scholar] [CrossRef]
  32. Li, Y.-H.; Tian, X. Quorum sensing and bacterial social interactions in biofilms. Sensors 2012, 12, 2519–2538. [Google Scholar] [CrossRef] [PubMed]
  33. Ciofu, O.; Tolker-Nielsen, T. Tolerance and resistance of Pseudomonas aeruginosa biofilms to antimicrobial agents—How P. aeruginosa can escape antibiotics. Front. Microbiol. 2019, 10, 913. [Google Scholar] [CrossRef] [PubMed] [Green Version]
  34. Schiller, N.L.; Monday, S.R.; Boyd, C.M.; Keen, N.T.; Ohman, D.E. Characterization of the Pseudomonas aeruginosa alginate lyase gene (algL): Cloning, sequencing, and expression in Escherichia coli. J. Bacteriol. 1993, 175, 4780–4789. [Google Scholar] [CrossRef] [Green Version]
  35. Deretic, V.; Konyecsni, W.M. Control of mucoidy in Pseudomonas aeruginosa: Transcriptional regulation of algR and identification of the second regulatory gene, algQ. J. Bacteriol. 1989, 171, 3680–3688. [Google Scholar] [CrossRef] [PubMed] [Green Version]
  36. Jackson, K.D.; Starkey, M.; Kremer, S.; Parsek, M.R.; Wozniak, D.J. Identification of psl, a locus encoding a potential exopolysaccharide that is essential for Pseudomonas aeruginosa PAO1 biofilm formation. J. Bacteriol. 2004, 186, 4466–4475. [Google Scholar] [CrossRef] [PubMed] [Green Version]
  37. Qiu, D.; Eisinger, V.M.; Rowen, D.W.; Yu, H.D. Regulated proteolysis controls mucoid conversion in Pseudomonas aeruginosa. Proc. Natl. Acad. Sci. USA 2007, 104, 8107–8112. [Google Scholar] [CrossRef] [Green Version]
  38. Kim, Y.; Wood, T.K. Toxins Hha and CspD and small RNA regulator Hfq are involved in persister cell formation through MqsR in Escherichia coli. Biochem. Biophys. Res. Commun. 2010, 391, 209–213. [Google Scholar] [CrossRef] [PubMed] [Green Version]
  39. Korotkov, K.; Sandkvist, M.; Hol, W.G.J. The type II secretion system: Biogenesis, molecular architecture and mechanism. Nat. Rev. Genet. 2012, 10, 336–351. [Google Scholar] [CrossRef] [Green Version]
  40. Ma, Q.; Zhai, Y.; Schneider, J.C.; Ramseier, T.M.; Saier, M.H. Protein secretion systems of Pseudomonas aeruginosa and P. fluorescens. Biochim. Biophys. Acta Biomembr. 2003, 1611, 223–233. [Google Scholar] [CrossRef] [Green Version]
  41. Notti, R.Q.; Stebbins, C.E. The structure and function of type III secretion systems. Microbiol. Spectr. 2016, 4. [Google Scholar] [CrossRef] [PubMed] [Green Version]
  42. Sandoval-Motta, S.; Aldana, M. Adaptive resistance to antibiotics in bacteria: A systems biology perspective. Wiley Interdiscip. Rev. Syst. Biol. Med. 2016, 8, 253–267. [Google Scholar] [CrossRef] [PubMed]
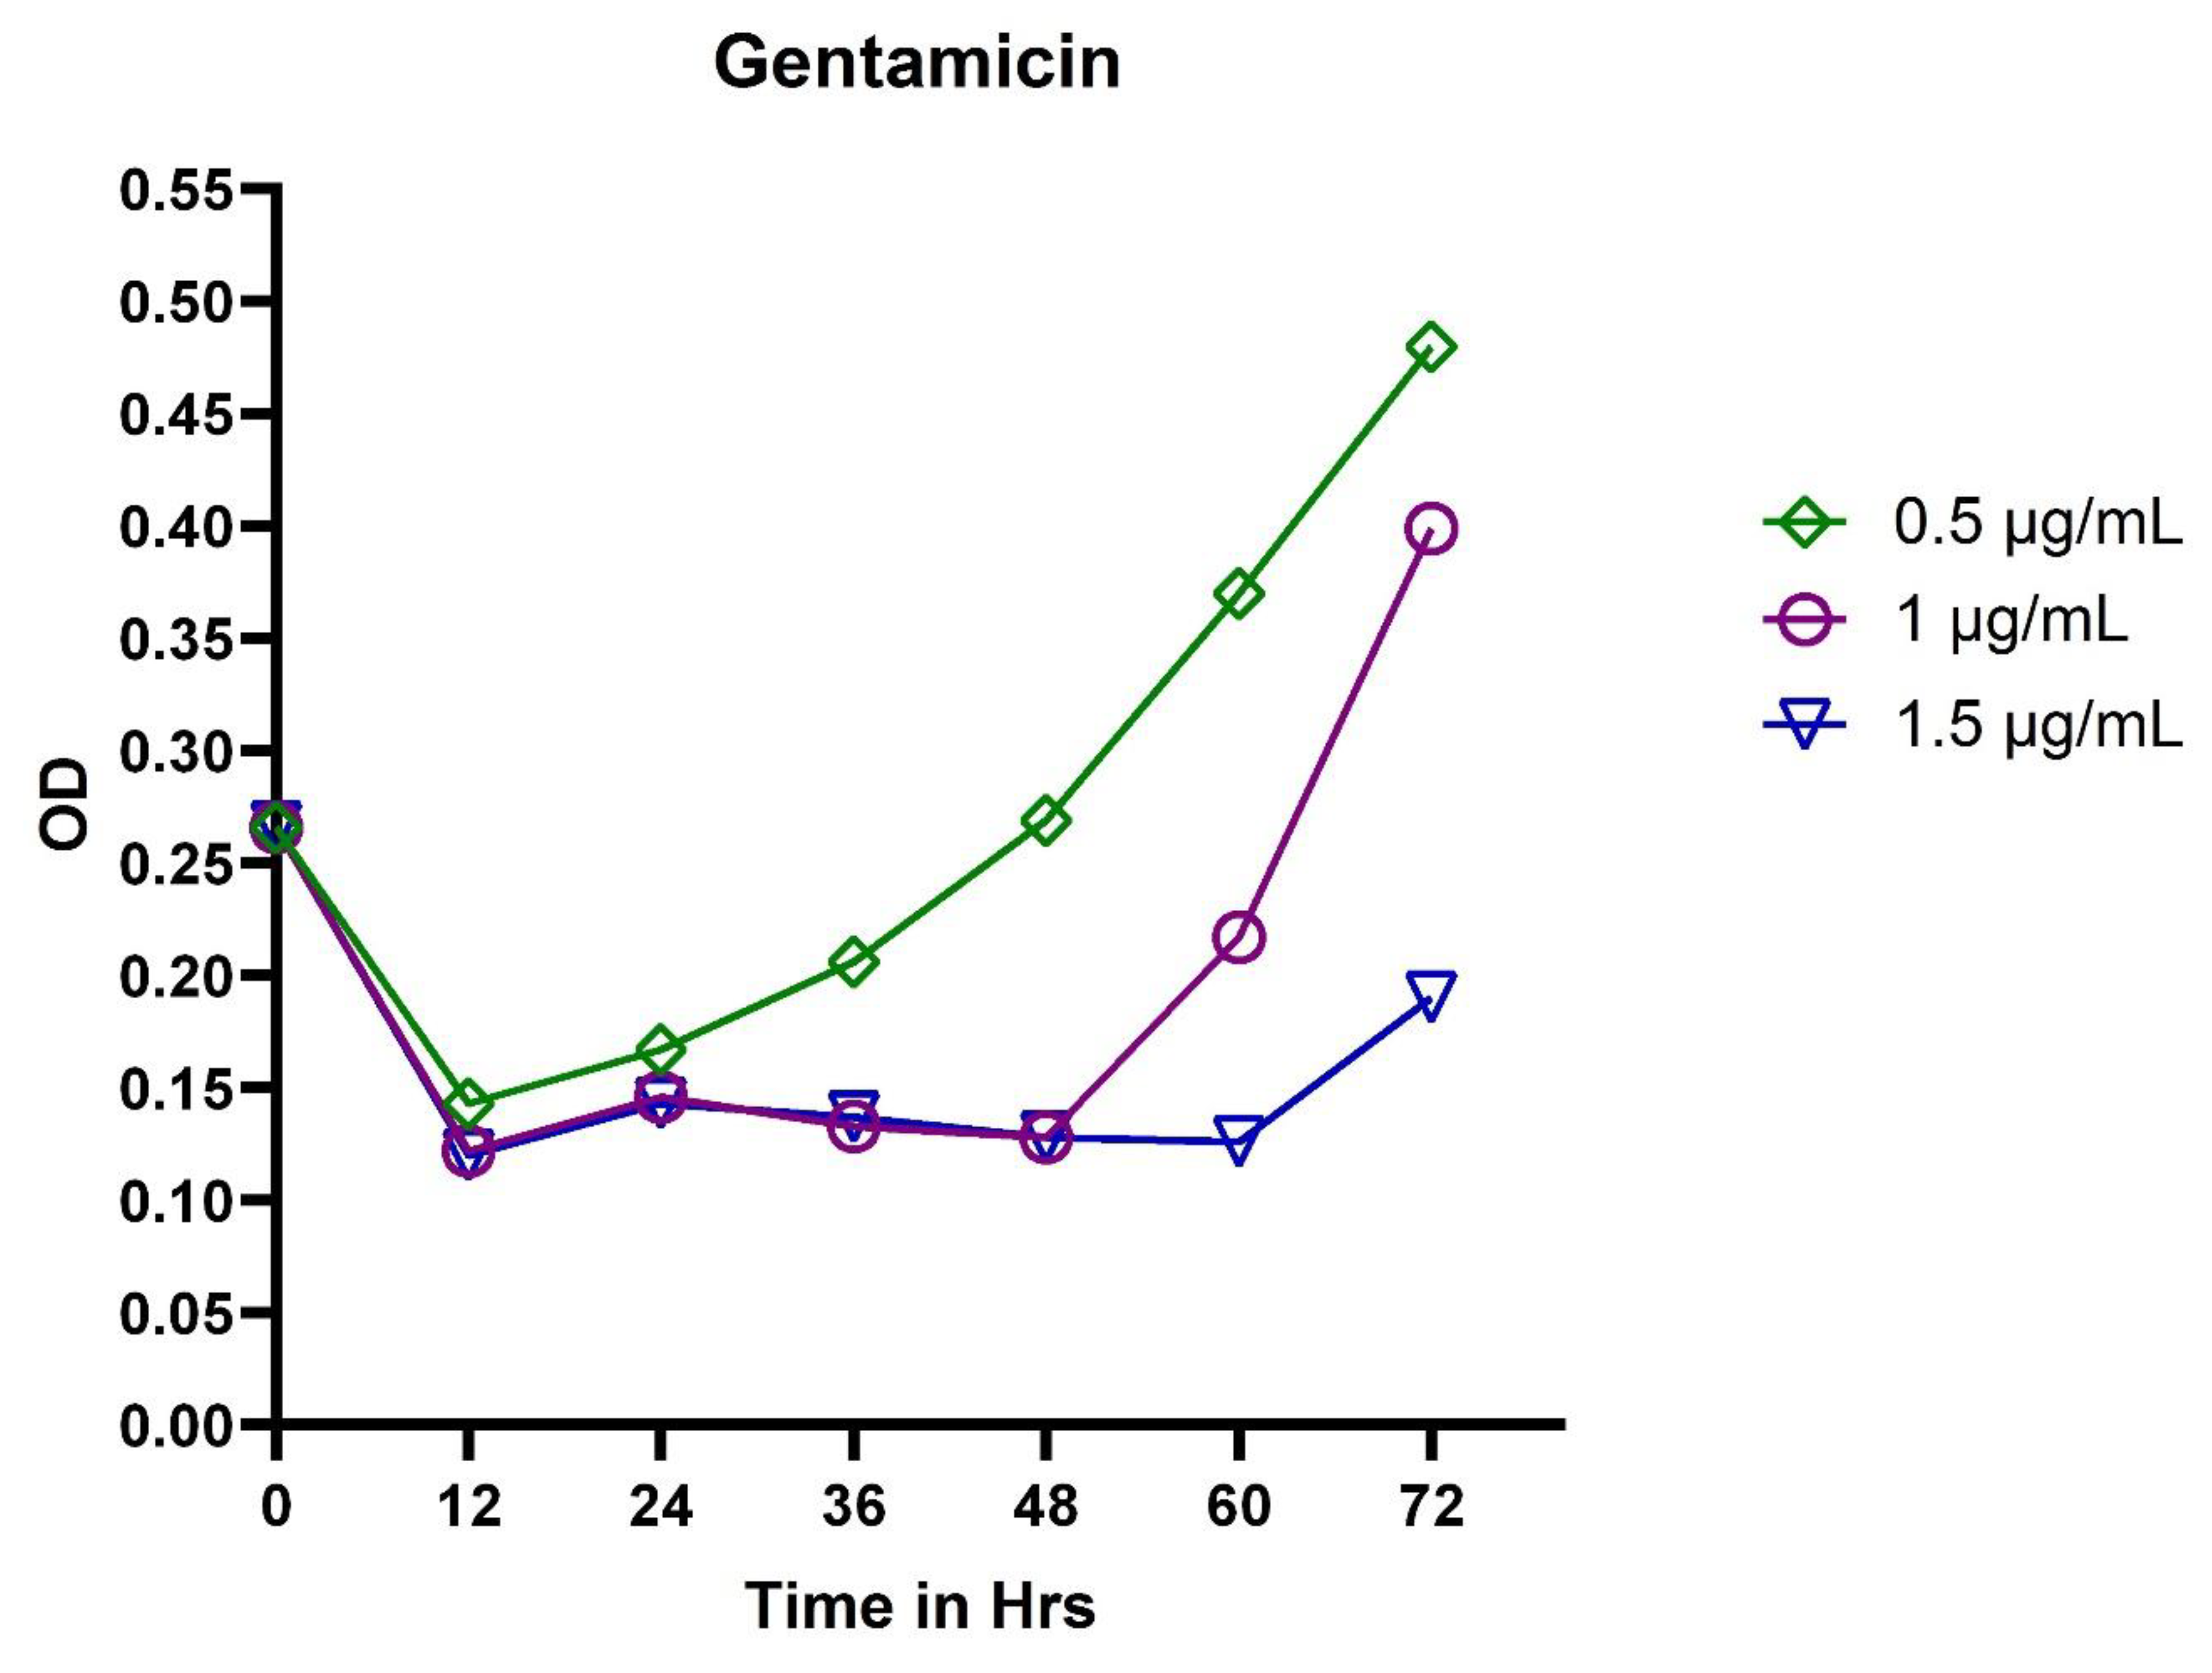
Figure 1. In vitro exposure of MICs 0.5 μg/mL, 1 μg/mL, and 1.5 μg/mL of gentamicin to P. aeruginosa. The OD600 values depict the kinetics of adaptive resistance in the cell.
Microbiolres 12 00045 g001
Figure 2. In vitro exposure of MICs 1 μg/mL, 2 μg/mL, and 3 μg/mL of amikacin to P. aeruginosa. The OD600 values depict the kinetics of adaptive resistance in the cell.
Microbiolres 12 00045 g002
Figure 3. In vitro exposure of MICs 0.5 μg/mL, 1 μg/mL, and 1.5 μg/mL of tobramycin to P. aeruginosa. The OD600 values depict the kinetics of adaptive resistance in the cell.
Microbiolres 12 00045 g003
Figure 4. Volcano plots of the microarray datasets representing the distribution of DEGs in tobramycin-treated P. aeruginosa. The (A) volcano plot of GSE9991, tobramycin treated planktonic culture; and (B) volcano plot of GSE9989, tobramycin-treated biofilm. The figure illustrates the degree of variation in the gene expression of P. aeruginosa after exposure to tobramycin.
Microbiolres 12 00045 g004
Figure 5. Functional enrichments of DEGs. The functional classification of DEGs were performed in the DAVID Bioinformatics Resources 6.8 and the enrichments of various pathways and terms are represented in this graph.
Microbiolres 12 00045 g005
Figure 6. The architecture of type III and type II bacterial secretory system. The (A) distribution of various protein domains in type III and type II toxin exports, and (B) the set of proteins in the type III and type II system. The red highlight denotes the proteins coded by the downregulated genes that are enriched in bacterial secretory system from KEGG pathways. Type III export proteins YscF (pscF), YscJ (pscJ), translocation protein YscR (pscR), YscQ (pscQ), and YscP (pscP) were downregulated in T3SS. Type II secretion proteins GspD (xcpQ), GspE (xcpR), GspF (xcpS), GspG (xcpT), GspH (xcpU), GspI (xcpV), GspJ (xcpW), GspK (xcpX), GspL (xcpY), and GspM (xcpZ) were downregulated in T2SS.
Microbiolres 12 00045 g006
Figure 7. PPI network of gidB. The network shows the significant STRING interactions of gidB with its gene neighbors. The predicted functional partners of gidB were gidA, trmE, parB, rsmL parA, atpF, prmA, atpB, and atpH in RNA methylation metabolism.
Microbiolres 12 00045 g007
Figure 8. PPI network of mucA. The network shows the significant STRING interactions of mucA with its gene neighbors. The predicted functional partners of mucA were mucB, algU, mucC, mucD, rseP, pvdS, algW, flgM, algR, and mucE in alginate biosynthesis metabolism.
Microbiolres 12 00045 g008
Table 1. List of target DEGs and log fold change of expression in tobramycin-treated planktonic P. aeruginosa (GSE9991).
GenesLog FcAdj. p-Value
PA2677−2.218090.0013
PA0687−1.448160.0287
PA2672−1.238360.0271
xcpR−0.284360.0332
xcpU−0.502740.0200
xcpV−0.198490.0484
xcpY−0.222140.0436
xcpZ−0.216260.0496
tadB−0.169730.0407
tadD−0.253590.0387
algR−0.359210.0284
algL0.6400090.0280
pslF−1.034520.0478
PA18392.2008920.0015
PA0419−0.924390.0339
PA0017−0.337280.0257
PA3680−0.341650.0065
Table 2. List of target DEGs and log fold change of expression in tobramycin-treated P. aeruginosa biofilm (GSE9989).
GenesLog FcAdj. p-Value
mucA4.0945360.0035
mucB1.1553180.0062
lexA3.429620.0035
gidB−3.319090.0050
pscQ−2.358210.0105
pscP−3.644320.0155
pscR−3.11905 0.0346
pscG−1.753240.0061
pscH−1.521180.0381
pscE−3.847990.0501
pscF−1.36760.0122
pscI−2.272610.0176
pscJ−1.435670.0491
pscK−1.67670.0129
xcpQ−2.317780.0307
xcpS−1.403970.0273
xcpT−0.720490.0273
xcpU−1.335750.0248
xcpV−3.115430.0281
xcpW−0.697830.0323
xcpX−0.422210.0530
xcpY−0.56160.0380
Table 3. Clustering enrichment analysis of the DEGs from various databases. The clusters grouped with significant enrichment scores are listed. Performed in the source DAVID Bioinformatics Resources 6.8.
DatabasesClusters% EnrichedFold EnrichmentFDR
Cluster 1—Type II and Type III toxin secretion system
KEGG PathwaysBacterial secretion system50.0016.682.93 × 10−20
GO Term—Biological ProcessProtein secretion by type II secretion system30.5643.278.77 × 10−14
GO Term—Molecular FunctionsProtein transporter activity27.7852.902.65 × 10−13
UniProtKBProtein transport27.7833.911.89 × 10−10
GO Term—Cellular componentType II protein secretion system complex22.2242.901.33 × 10−9
UniProtKBTransport27.784.310.003997
Cluster 1 Enrichment Score: 12.16
Cluster 2—Methylation metabolism
GO Term—Cellular componentType II protein secretion system complex22.2242.901.33 × 10−9
InterProProkaryotic N-terminal methylation site13.8938.234.58 × 10−4
UniProtKBMethylation11.1135.910.003334
Cluster 2 Enrichment Score: 6.32
Cluster 3—RNA methyltransferase and rRNA processing
UniProtKBMethyltransferase13.8911.560.007267
UniProtKBrRNA processing11.1119.690.007267
UniProtKBS-adenosyl-L-methionine13.8910.750.007267
GO Term—Biological ProcessrRNA base methylation8.3336.880.010077
UniProtKBCytoplasm22.223.160.047188
Cluster 3 Enrichment Score: 2.06
Publisher’s Note: MDPI stays neutral with regard to jurisdictional claims in published maps and institutional affiliations.