Article

Analyzing New Quality Productive Forces in New Energy Vehicle Companies Based on a New Multi-Criteria Decision Analysis Model

1
School of Foreign Studies, Yiwu Industrial & Commercial College, Yiwu 322000, China
2
Graduate School, Lyceum of the Philippines University-Batangas, Batangas 4200, Philippines
3
School of Economics & Management, University of Science and Technology Beijing, Beijing 100083, China
*
Author to whom correspondence should be addressed.
World Electr. Veh. J. 2024, 15(11), 503; https://doi.org/10.3390/wevj15110503
Submission received: 25 September 2024 / Revised: 25 October 2024 / Accepted: 30 October 2024 / Published: 2 November 2024

Abstract

:
Assessing the new quality productive forces (NQPF) of new energy vehicle (NEV) companies is crucial for promoting the sustainable development of the NEV industry. This paper systematically evaluated and analyzed the NQPF of Chinese listed NEV companies from 2018 to 2022 using a novel multi-criteria decision analysis (MCDA) model. To address limitations in traditional MCDA models, such as unbalanced weight distribution, insufficient ranking differentiation, and incomplete identification of key influencing factors, this study introduced a new model, IDOCRIW-PROBID (integrated determination of objective criteria weights—preference ranking on the basis of ideal-average distance). First, an evaluation index system tailored to NEV companies’ NQPF was developed. Then, the IDOCRIW method was used to objectively assign weights to the indicators, enhancing the scientific rigor of the weight distribution. The PROBID method was employed to rank companies based on their NQPF, identifying differences between them. Additionally, an obstacle degree model was introduced to analyze key influencing factors, compensating for the traditional MCDA model’s limitations in this regard. The results showed, first, that the proposed IDOCRIW-PROBID model has a high degree of consistency with the classical Entropy-TOPSIS (technique for order of preference by similarity to ideal solution) model in terms of ranking the results (correlation coefficient = 0.91), and that IDOCRIW-PROBID offers higher differentiation compared to other MCDA models, validating its reliability and superiority. Second, during the study period, the development levels of NQPF in Chinese listed NEV companies varied significantly, with most companies at a low level of development and showing a downward trend, indicating that companies face considerable challenges in improving their NQPF. Third, the obstacle degree analysis revealed that R&D lease fees, R&D depreciation and amortization, and direct R&D investment were the primary factors hindering NQPF growth. This research provides theoretical support and decision-making insights for strategic optimization in NEV companies and informs government policy formulation.

1. Introduction

With the intensification of global climate change and the deepening of the energy crisis, the development of the new energy vehicle (NEV) industry will play a crucial role in driving the global economy toward a green and low-carbon transition. Furthermore, the use of autonomously operating NEVs has become an urgent priority for establishing sustainable urban transportation networks [1]. As a result, countries around the world are increasing their support for NEV research and industrial development [2]. China has demonstrated enormous market potential in this field, but at the same time, it faces numerous technological challenges. Promoting new quality productive forces (NQPF), centered on technological innovation, is key to overcoming the development bottleneck of China’s NEV industry.
NQPF is a type of productive force driven by technological innovation and achieved through breakthroughs in disruptive technologies, surpassing traditional productive forces [3]. The development of NQPF has been listed as one of the top priorities of the Chinese government for 2024 and has garnered widespread attention and discussion since its proposal [4]. To better understand the development and current state of NQPF, researchers like Lu et al. [5] and Zeng et al. [6] have conducted assessments and analyses of NQPF at the provincial and municipal levels in China. Luo et al. [7] and Deng et al. [8] have explored NQPF development in the agricultural and industrial sectors, respectively. Liu et al. [9] further investigated the role of NQPF in driving high-quality development in the manufacturing industry. However, existing research mainly focuses on the macro level of provinces, cities, and industries, while research on NQPF at the industry or company level remains relatively scarce, especially in the technology-intensive NEV sector. Therefore, this paper aimed to evaluate the NQPF of NEV companies, filling this research gap and helping companies identify key barriers to development, thereby optimizing resource allocation and technological innovation pathways.
DEA (data envelopment analysis) and MCDA are the mainstream methods in company evaluation research. For example, Yang et al. [10], Quan et al. [11], and Xu et al. [12] used DEA models to analyze companies’ performance, comprehensive technical efficiency, and technological innovation efficiency, respectively. MCDA models have been widely applied in evaluating companies’ trade performance [13], service levels [14], resilience [15], cultural competitiveness [16], and green marketing management [17]. Compared to DEA models, MCDA models are more widely used in analyzing companies’ multidimensional comprehensive performance, especially when multiple indicators are involved, making them more advantageous. Therefore, this paper adopted an MCDA model to evaluate and analyze the NQPF of NEV companies. Existing studies mainly used the entropy weight method or combined it with the TOPSIS method for NQPF evaluation [5,6,7,9,18], which are considered traditional MCDA models. With the continuous development of MCDA theory and practice, many more robust MCDA methods have been proposed [19], and existing NQPF evaluation methods have fallen behind these advances. Hence, developing new MCDA models to address NQPF evaluation is of great significance.
MCDA models generally consist of weighting methods and ranking methods. Weighting methods calculate the weights of evaluation indicators, while ranking methods compute the overall scores of the objects being evaluated. Common weighting methods include the analytic hierarchy process (AHP) [20], best–worst method (BWM) [21], stepwise weight assessment ratio analysis (SWARA) [22], and full consistency method (FUCOM) [23]. While these methods have their merits, they are prone to subjectivity or uneven weight distribution when dealing with complex MCDA problems [24]. To overcome the shortcomings of subjective weighting methods, this paper adopted objective weighting methods to calculate indicator weights. Common objective weighting methods include the entropy weight method [17], criteria importance through inter-criteria correlation (CRITIC) [25], method based on the removal effects of criteria (MEREC) [26], and the standard deviation (SD) method [27]. Among them, the entropy weight method is widely used in practice [28], but its tendency to attribute superiority to a particular evaluation object may result in that object being overestimated, thereby affecting the overall decision analysis [24]. To address this issue, Zavadskas et al. [24] proposed an objective weighting method that combines the entropy weight method with the criterion impact loss (CILOS) method—integrated determination of objective criteria weights (IDOCRIW)—which eliminates the shortcomings of the entropy weight method [29] and has been proven advantageous in terms of reliability and accuracy [30]. Therefore, this paper introduced the IDOCRIW method into the NQPF evaluation model for NEV companies.
The choice of ranking method is critical to the evaluation results of the MCDA model. Traditional MCDA ranking methods such as simple additive weighting (SAW) [31], complex proportional assessment (COPRAS) [32], TOPSIS [33], and multi-objective optimization by ratio analysis (MOORA) [34] are prone to rank reversal, which means that when certain schemes are added or removed, the relative ranking of some schemes in the original dataset may change or reverse [35]. To solve this problem, Wang et al. [36] proposed the preference ranking on the basis of ideal-average distance (PROBID) method, which considers a series of ideal solutions from the positive ideal solution to the negative ideal solution, providing better ranking consistency compared to other popular MCDA methods [36]. Therefore, this paper combined the IDOCRIW and PROBID methods to propose a new evaluation model for the NQPF of NEV companies.
Although the MCDA model excels in comprehensive evaluation, it still has limitations in identifying key factors influencing company productivity. To compensate for this, this paper introduced the obstacle degree model [37], which analyzes the degree of obstacles in each indicator for companies, identifying the main bottlenecks affecting the NQPF of NEV companies. The obstacle degree model provides a more detailed factor analysis for the evaluation model, helping companies clarify improvement directions and offering decision support for enhancing NQPF.
In summary, this paper focused on the development status of NQPF in Chinese NEV companies from 2018 to 2022 and the key obstacles they face. The research steps are as follows: first, an evaluation index system for company NQPF is constructed; second, the IDOCRIW-PROBID model is constructed to evaluate the NQPF of NEV companies; finally, an empirical analysis of A-share listed NEV companies in China is conducted to systematically identify the key obstacles affecting companies’ NQPF. The specific research steps are shown in Figure 1. The contributions of this paper are as follows:
(1)
It is the first to study the issue of NQPF evaluation in the NEV industry.
(2)
It proposes the IDOCRIW-PROBID model, which addresses the shortcomings of traditional entropy weight and TOPSIS methods.
(3)
It introduces obstacle degree analysis into the MCDA model, providing more comprehensive references for industry policy formulation and company strategy adjustments.

2. Research Methods

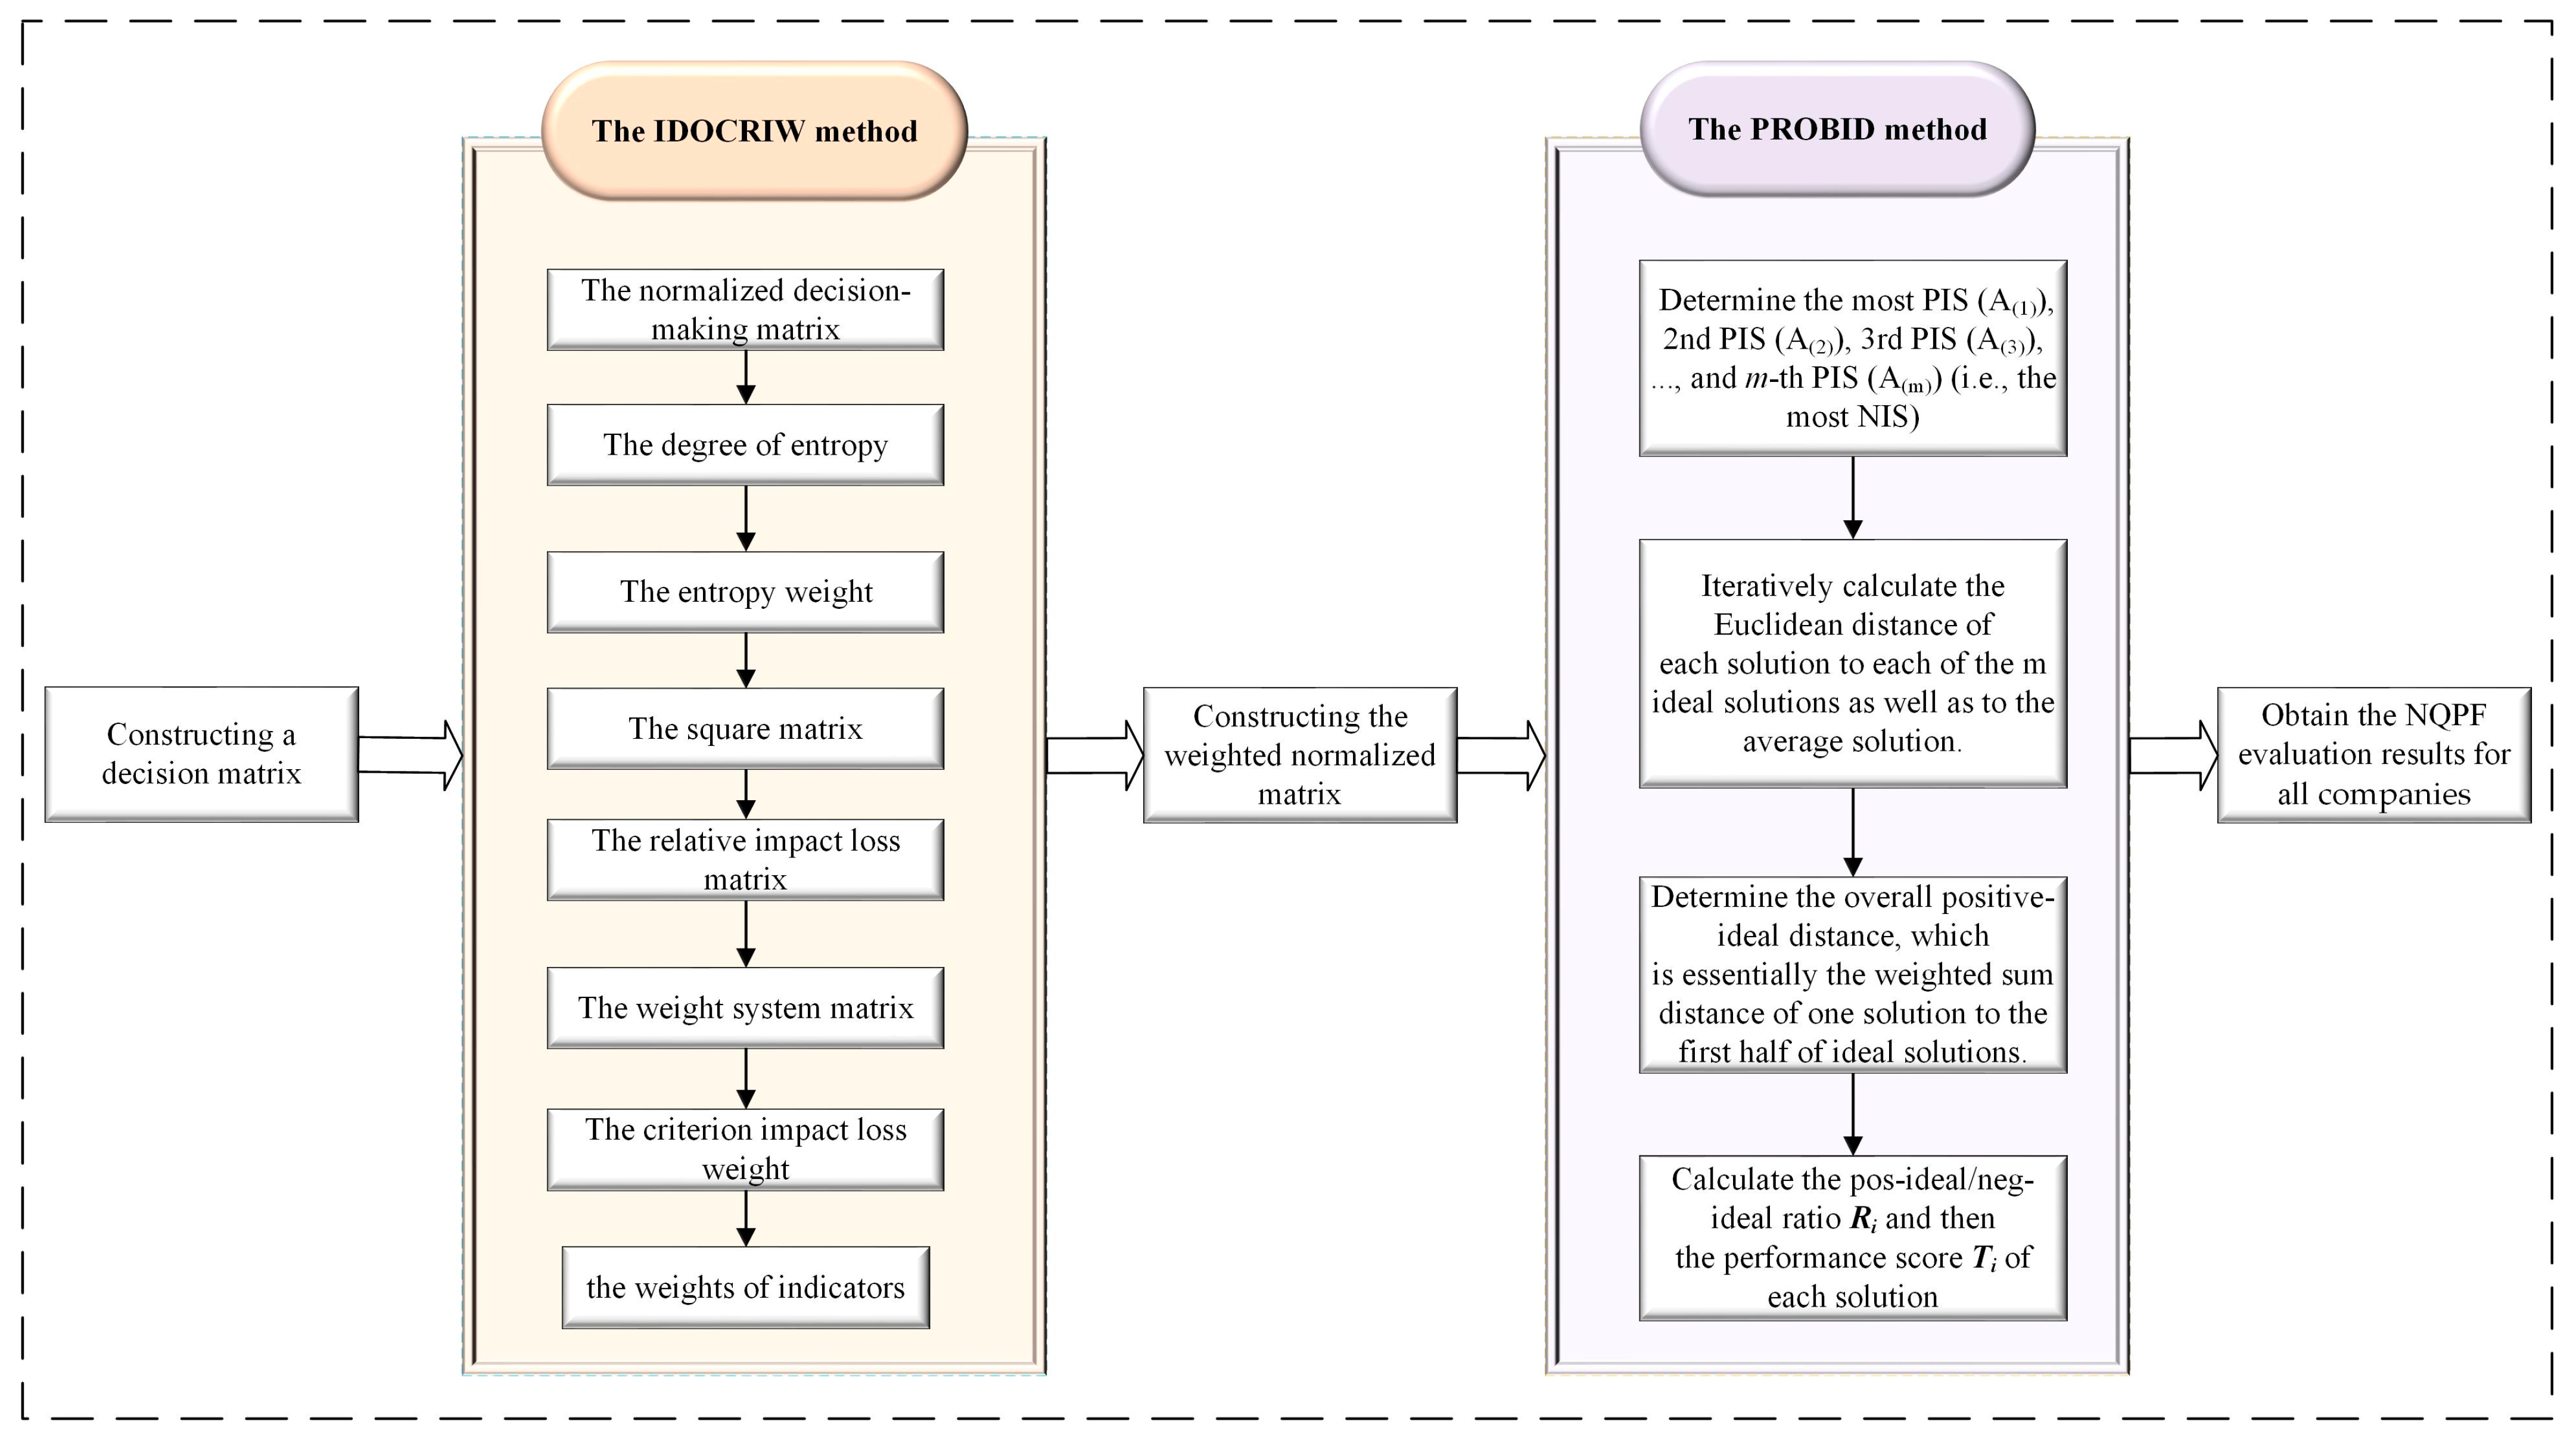
2.1. A New MCDA Model for Evaluating NQPF

This paper integrated the IDOCRIW method with the PROBID method to construct a new MCDA model. Data preprocessing is required before implementing this model. The original data of the indicators are standardized using Equation (1) to avoid evaluation errors caused by differences in the dimensions of the data.
x i j = x i j min x i j max x i j min x i j , i f j B max x i j x i j max x i j min x i j , i f j C
where x i j is the original value of the i-th company (i = 1, 2, 3, …, n) on the j-th indicator (j = 1, 2, 3, …, m), and x i j is the standardized value. B represents benefit-type indicators, and C represents cost-type indicators.
The specific implementation process of the model is shown in Figure 2. Detailed descriptions of each method involved in these steps will be provided below.

2.1.1. Weight Calculation Based on IDOCRIW

Referring to the study in [24], the calculation of the IDOCRIW method can be summarized in the following steps:
Step 1: Calculate the information entropy E j of the indicators.
E j = 1 ln n i = 1 n r i j ln r i j
where r i j = x i j i = 1 n x i j , if r i j = 0 , then lim r i j 0 r i j ln r i j = 0
Step 2: Calculate the entropy weight w j .
w j = 1 E j j = 1 m 1 E j
Step 3: Obtain the square matrix.
a j = max i x i j = a k i j ; i , j { 1 , 2 , 3 , , m }
where a k i j specifies the maximum values of the j-th criteria, is taken from a decision matrix with k i rows to form a square matrix and a i j = a k i j and a j j = a j .
Step 4: Construct the relative loss matrix P = p i j m × m .
p i j = a j j a i j a j j ; i , j { 1 , 2 , 3 , m } , p j j = 0
where p i j represents the relative impact loss if the j-th indicator is chosen as the optimal value.
Step 5: Construct the weight system matrix.
F = i = 1 m p i 1 p 12 p 1 m p 21 i = 1 m p i 2 p 2 m p m 1 p m 2 i = 1 m p i m
Step 6: Obtain the criterion impact loss weight.
F q i j T = 0
Step 7: Calculate the final weights of the indicators determined by the IDOCRIW method according to Equation (8).
w j = q j × w j j = 1 m q j × w j

2.1.2. Calculating NQPF Based on PROBID

The key concept of the PROBID method is to comprehensively consider all ideal and average solutions. The ideal solutions include the most positive ideal solution (PIS), the second PIS, the third PIS, and so on, up to the n-th PIS, which is the most negative ideal solution (NIS). The maximum PIS is defined as the combination of the best values for each objective (i.e., the maximum for benefit objectives and the minimum for cost objectives) among all non-dominated solutions. Similarly, the second PIS is the combination of the second-best values for each objective among all non-dominated solutions, and this pattern continues for the definitions of the third PIS and up to the n-th PIS. The six steps of PROBID are detailed as follows [36].
Step 1: Construct the normalized matrix.
X i j = x i j k = 1 n x k j 2 i { 1 , 2 , 3 , , n } ; j { 1 , 2 , 3 , , m }
Step 2: Construct the weighted normalized decision matrix using the indicator weights w j obtained from the IDOCRIW method.
v i j = X i j × w j i { 1 , 2 , 3 , n } ; j { 1 , 2 , 3 m }
Step 3: Determine the optimal PIS (A(1)), the second PIS (A(2)), the third PIS (A(3)), and so on, up to the n-th PIS (A(n)).
A ( k ) = { ( Large ( v j , k ) | j J ) , ( S m a l l ( v j , k ) | j J ) }       = { v ( k ) 1 , v ( k ) 2 , v ( k ) 3 , , v ( k ) j , , v ( k ) m }
where k { 1 ,   2 , 3 , , n } , J is the set of maximized/benefit objectives selected from { 1 ,   2 , 3 , , m } , and J is the set of minimized/cost objectives. L a r g e ( v j , k ) represents the k-th largest value in the j-th indicator (i.e., v j ), while S m a l l ( v j , k ) denotes the k-th smallest value in the j-th indicator. For example, v ( 1 ) 2 represents the best value in the second indicator (i.e., the maximum for benefit objectives or the minimum for cost objectives); v ( 2 ) 3 is the second-best value in the third indicator; and v ( n ) m is the n-th best value (i.e., the worst value) in the m-th indicator. Next, calculate the average for each indicator.
v ¯ j = k = 1 n v ( k ) j n , for   j { 1 , 2 , 3 , , m }
Based on the calculation results of Equation (13), the average solution can be obtained.
A ¯ = { v ¯ 1 ,   v ¯ 1 ,   v ¯ 1 ,   , v ¯ j , ,   v ¯ m }
Step 4: Iteratively calculate the Euclidean distance from each solution to each of the n ideal solutions and to the average solution.
S i ( k ) = j = 1 m ( v i j v ( k ) j ) 2 S i ( a v g ) = j = 1 m ( v i j v ¯ j ) 2 i { 1 , 2 , 3 , , n } ; k { 1 , 2 , 3 , , n }
where S i ( k ) represents the distance to the ideal solution. For example, S 2 1 represents the Euclidean distance between the second-best solution (row) and the best PIS (A(1)), while S 2 n represents the Euclidean distance between the second-best solution (row) and the n-th best PIS (A(n)) (i.e., the worst NIS). Additionally, S i ( a v g ) represents the distance to the average solution.
Step 5: Determine the overall positive ideal distance, which is essentially the weighted sum of distances from a solution to the first half of the ideal solutions.
S i ( p o s i d e a l ) = k = 1 ( n + 1 ) / 2 1 k S i ( k ) , i { 1 , 2 , 3 , , n } , w h e n   n   i s   a n   o d d   n u m b e r k = 1 n / 2 1 k S i ( k ) , i { 1 , 2 , 3 , , n } , w h e n   n   i s   a n   e v e n   n u m b e r
Here, the weights decrease as the number of ideal solutions (i.e., k = 1, 2, 3 etc.) increases. Similarly, the overall negative ideal distance is determined, which is essentially the weighted sum of distances from a solution to the latter half of the ideal solutions.
S i ( n e g i d e a l ) = k = ( n + 1 ) / 2 n 1 m k + 1 S i ( k ) , i { 1 , 2 , 3 , , n } , w h e n   n   i s   a n   o d d   n u m b e r k = ( n / 2 ) + 1 n 1 m k + 1 S i ( k ) , i { 1 , 2 , 3 , , n } , w h e n   n   i s   a n   e v e n   n u m b e r
Here, the weights increase as the number of ideal solutions increases (i.e., as k increases to n). Therefore, the overall positive ideal distance and negative ideal distance for each solution (i = 1, 2, …, n) are calculated using Equations (15) and (16), respectively.
Step 6: Calculate the positive-ideal/negative-ideal ratio ( R i ), and then compute the performance score ( T i ) for each solution.
R i = S i ( p o s i d e a l ) S i ( n e g i d e a l ) T i = 1 1 + R i 2 + S i ( a v g ) i { 1 , 2 , 3 , , n }
where R i close to 0 indicates that solution i is closer to the PISs rather than the NISs and will result in a higher T i value. Conversely, a larger R i suggests that solution i is farther from the PISs than from the NISs, resulting in a lower T i value. Among non-dominated solutions, the solution with the highest T i value is recommended.

2.2. Obstacle Degree Model

The obstacle degree model [37] is introduced to examine the obstructive indicators in order to understand the impact of various indicators on the development of NQPF in new energy vehicle companies, and to identify directions for improving the companies’ NQPF. The specific formula for calculating the obstacle degree is as follows:
O i j = ( 1 E i j ) × w j j = 1 m ( 1 E i j ) × w j
where O i j and E i j represent the obstacle degree and standardized value of the j-th evaluation indicator for the i-th company being evaluated, respectively. 1 E i j indicates the deviation of the j-th evaluation indicator for the i-th company, and w j is the weight of the indicator calculated using the IDOCRIW method.

3. Case Study

3.1. Case Introduction

This study selected 18 A-share listed companies from the NEV concept sector in the Tonghuashun Financial database, with vehicle manufacturing as their primary business (including well-known Chinese companies such as BYD, Great Wall Motors, Changan Automobile, and GAC Group). The selection of these companies was based on the availability of comprehensive financial and operational data from 2018 to 2022. These companies represent the core participants in China’s NEV industry, ensuring that this study covers a representative cross-section of the sector. Additionally, these companies have significant market influence and complete publicly available data, making them ideal for evaluating NQPF development. To ensure a rigorous evaluation, this study drew upon existing research [38,39,40] and, following the two-factor theory of productivity (which refers to labor and production tools), established an NQPF evaluation index system (as shown in Table 1).
Under the NQPF evaluation index system, the target layer indicators are labor and production tools. The criterion layer further subdivides labor into live labor and materialized labor, while production tools are divided into hard technology and soft technology.
Live labor is measured through the R&D personnel salary ratio, R&D personnel proportion, and high-education personnel proportion, reflecting the company’s innovation investment in human capital. Materialized labor is assessed using the fixed asset ratio and manufacturing expense ratio, with the latter being a key indicator of production efficiency, especially given the strong reliance of new energy vehicle companies on high-end equipment and production machinery. Hard technology is primarily reflected in the ratio of direct R&D investment, depreciation and amortization ratio, and leasing fee ratio, indicating the company’s innovation investment in hardware. Meanwhile, soft technology is measured using indicators like the intangible asset ratio and total asset turnover ratio to assess the company’s innovative productivity. Notably, the equity multiplier serves as an indicator of financial risk, where a higher value indicates greater financial risk for the company; therefore, it is a negative indicator reflecting the impact of the company’s financial structure on innovative productivity.
Based on the aforementioned index system, this study collected and analyzed relevant data for the 18 sample companies from 2018 to 2022, with data primarily sourced from the Wind database.

3.2. Case Calculation

The NQPF of the companies was calculated using the IDOCRIW-PROBID model proposed in this study. The specific calculation process is as follows: First, the original dataset is standardized according to Equation (1) to obtain the standardized decision matrix. Based on this standardized decision matrix, the weights of each indicator under the entropy weight method are calculated using Equations (2) and (3). Then, the indicator weights under the CILOS method are computed using Equations (4)–(7). Finally, the final weights of the indicators under the IDOCRIW method are determined using Equation (8). The results of the weight calculations are shown in Table 2. Next, the standardized decision matrix is constructed into a normalized decision matrix using Equation (9), and the weight calculation results are incorporated into the normalized matrix to calculate the weighted normalized matrix using Equation (10). Lastly, the T i values (i.e., NQPF evaluation values) for all companies are calculated based on Equations (11)–(17), with the results presented in Table 3.

4. Results Analysis

4.1. Model Comparison Analysis

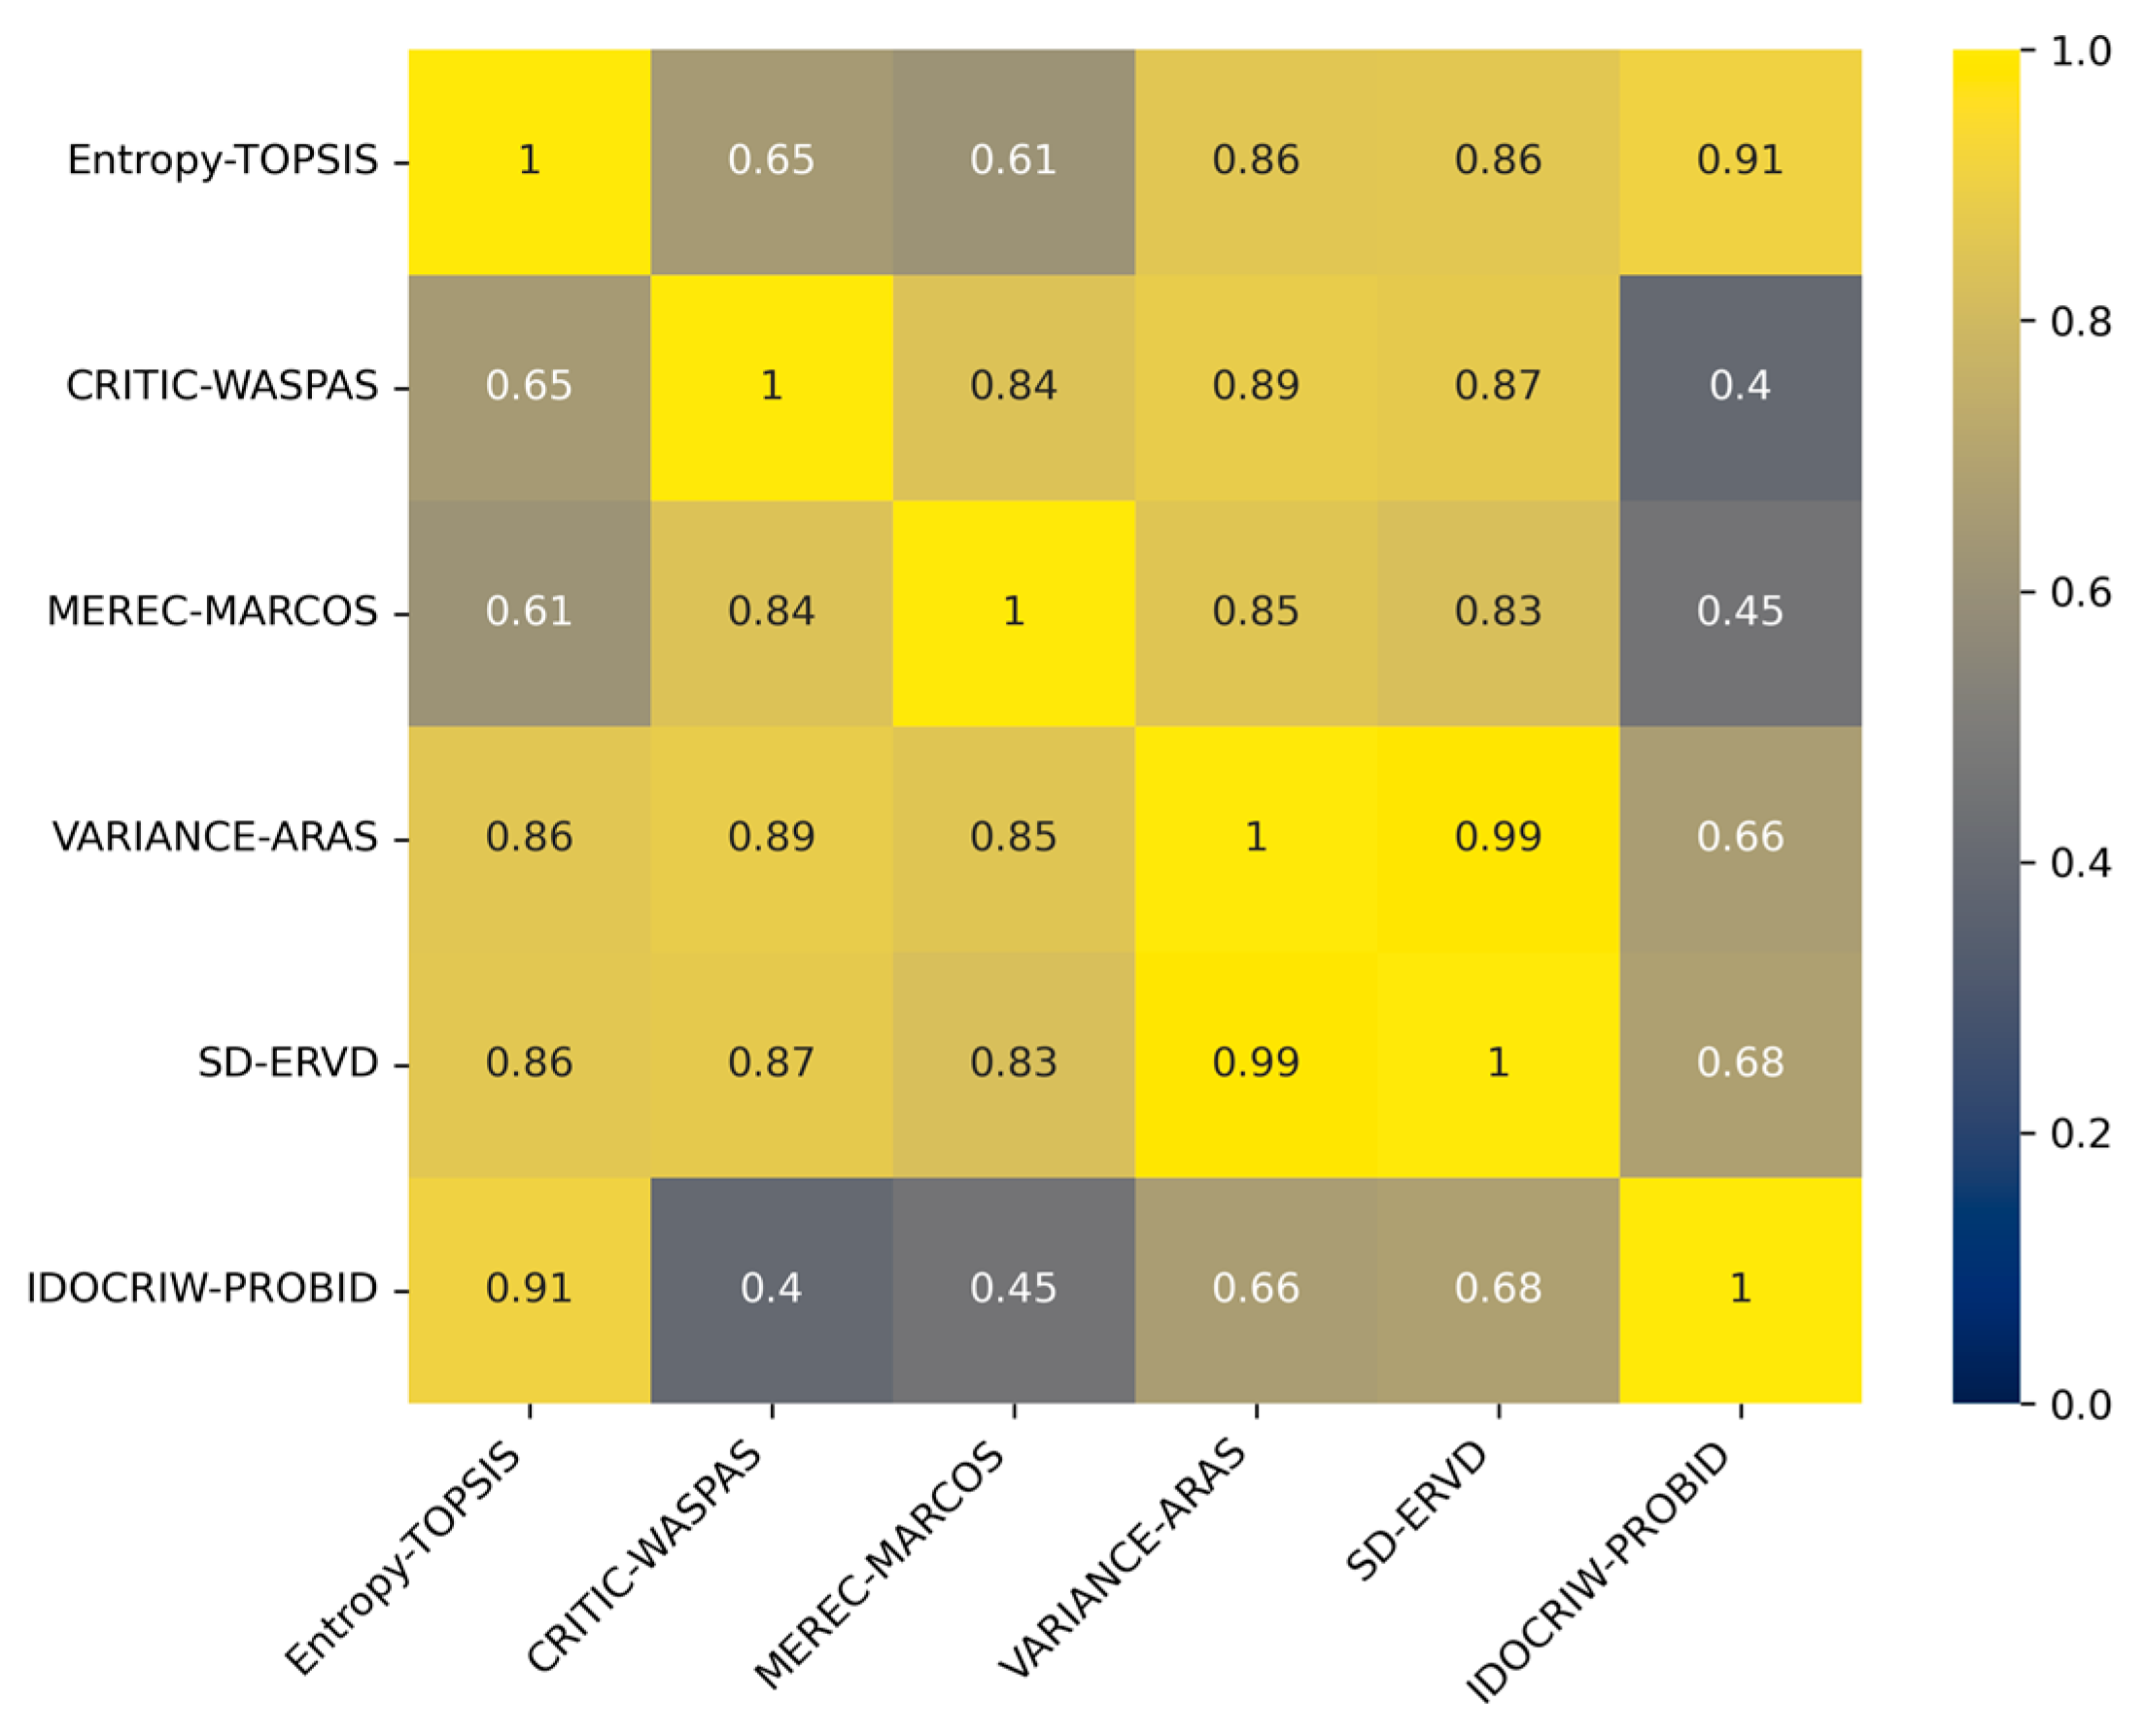
4.1.1. Reliability Analysis of the Model

To verify the reliability of the NQPF evaluation model for NEV companies based on the IDOCRIW-PROBID model, the Spearman correlation coefficient between the ranking results of this model and those of other models, such as Entropy-TOPSIS [41], CRITIC-WASPAS (weighted aggregated sum product assessment) [42], MEREC-MARCOS (measurement of alternatives and ranking according to compromise solution) [43], VARIANCE-ARAS (additive ratio assessment) [44] and SD-ERVD (election based on relative value distances) [45], was calculated. The results of the correlation analysis are illustrated in Figure 3.
Based on Figure 3, it can be observed that the correlation between the IDOCRIW-PROBID model and the classic Entropy-TOPSIS model is the highest, reaching 0.91. Entropy-TOPSIS is not only a well-established NQPF evaluation model but also one of the most widely used models across various decision-making domains, with its reliability extensively validated. Therefore, Entropy-TOPSIS was selected as the benchmark model in this study. The strong correlation between IDOCRIW-PROBID and Entropy-TOPSIS demonstrates that the IDOCRIW-PROBID model exhibits a high level of consistency and reliability with the benchmark.
Other models, such as VARIANCE-ARAS and SD-ERVD, also exhibit a high correlation with each other, reaching 0.99. However, this merely indicates similarity in their ranking results and does not necessarily demonstrate their reliability. These models have yet to be widely applied or thoroughly validated in both academic and practical contexts, and their reliability remains uncertain. Furthermore, their correlation with Entropy-TOPSIS is 0.86, which is lower than the 0.91 correlation between IDOCRIW-PROBID and Entropy-TOPSIS. This suggests that IDOCRIW-PROBID offers greater reliability compared to these models, as it maintains a closer alignment with the widely accepted benchmark.
Additionally, the correlations between IDOCRIW-PROBID and models like SD-ERVD and VARIANCE-ARAS, which place more emphasis on data stability, are 0.68 and 0.66, respectively. This suggests that the evaluation results of IDOCRIW-PROBID are stable, offering consistent and reliable NQPF assessments for most companies. However, the correlations with newer evaluation models, such as CRITIC-WASPAS and MEREC-MARCOS, are relatively lower, at 0.4 and 0.45, respectively. This indicates that while IDOCRIW-PROBID maintains high consistency with well-established models, it also provides a distinct evaluation perspective compared to emerging approaches.

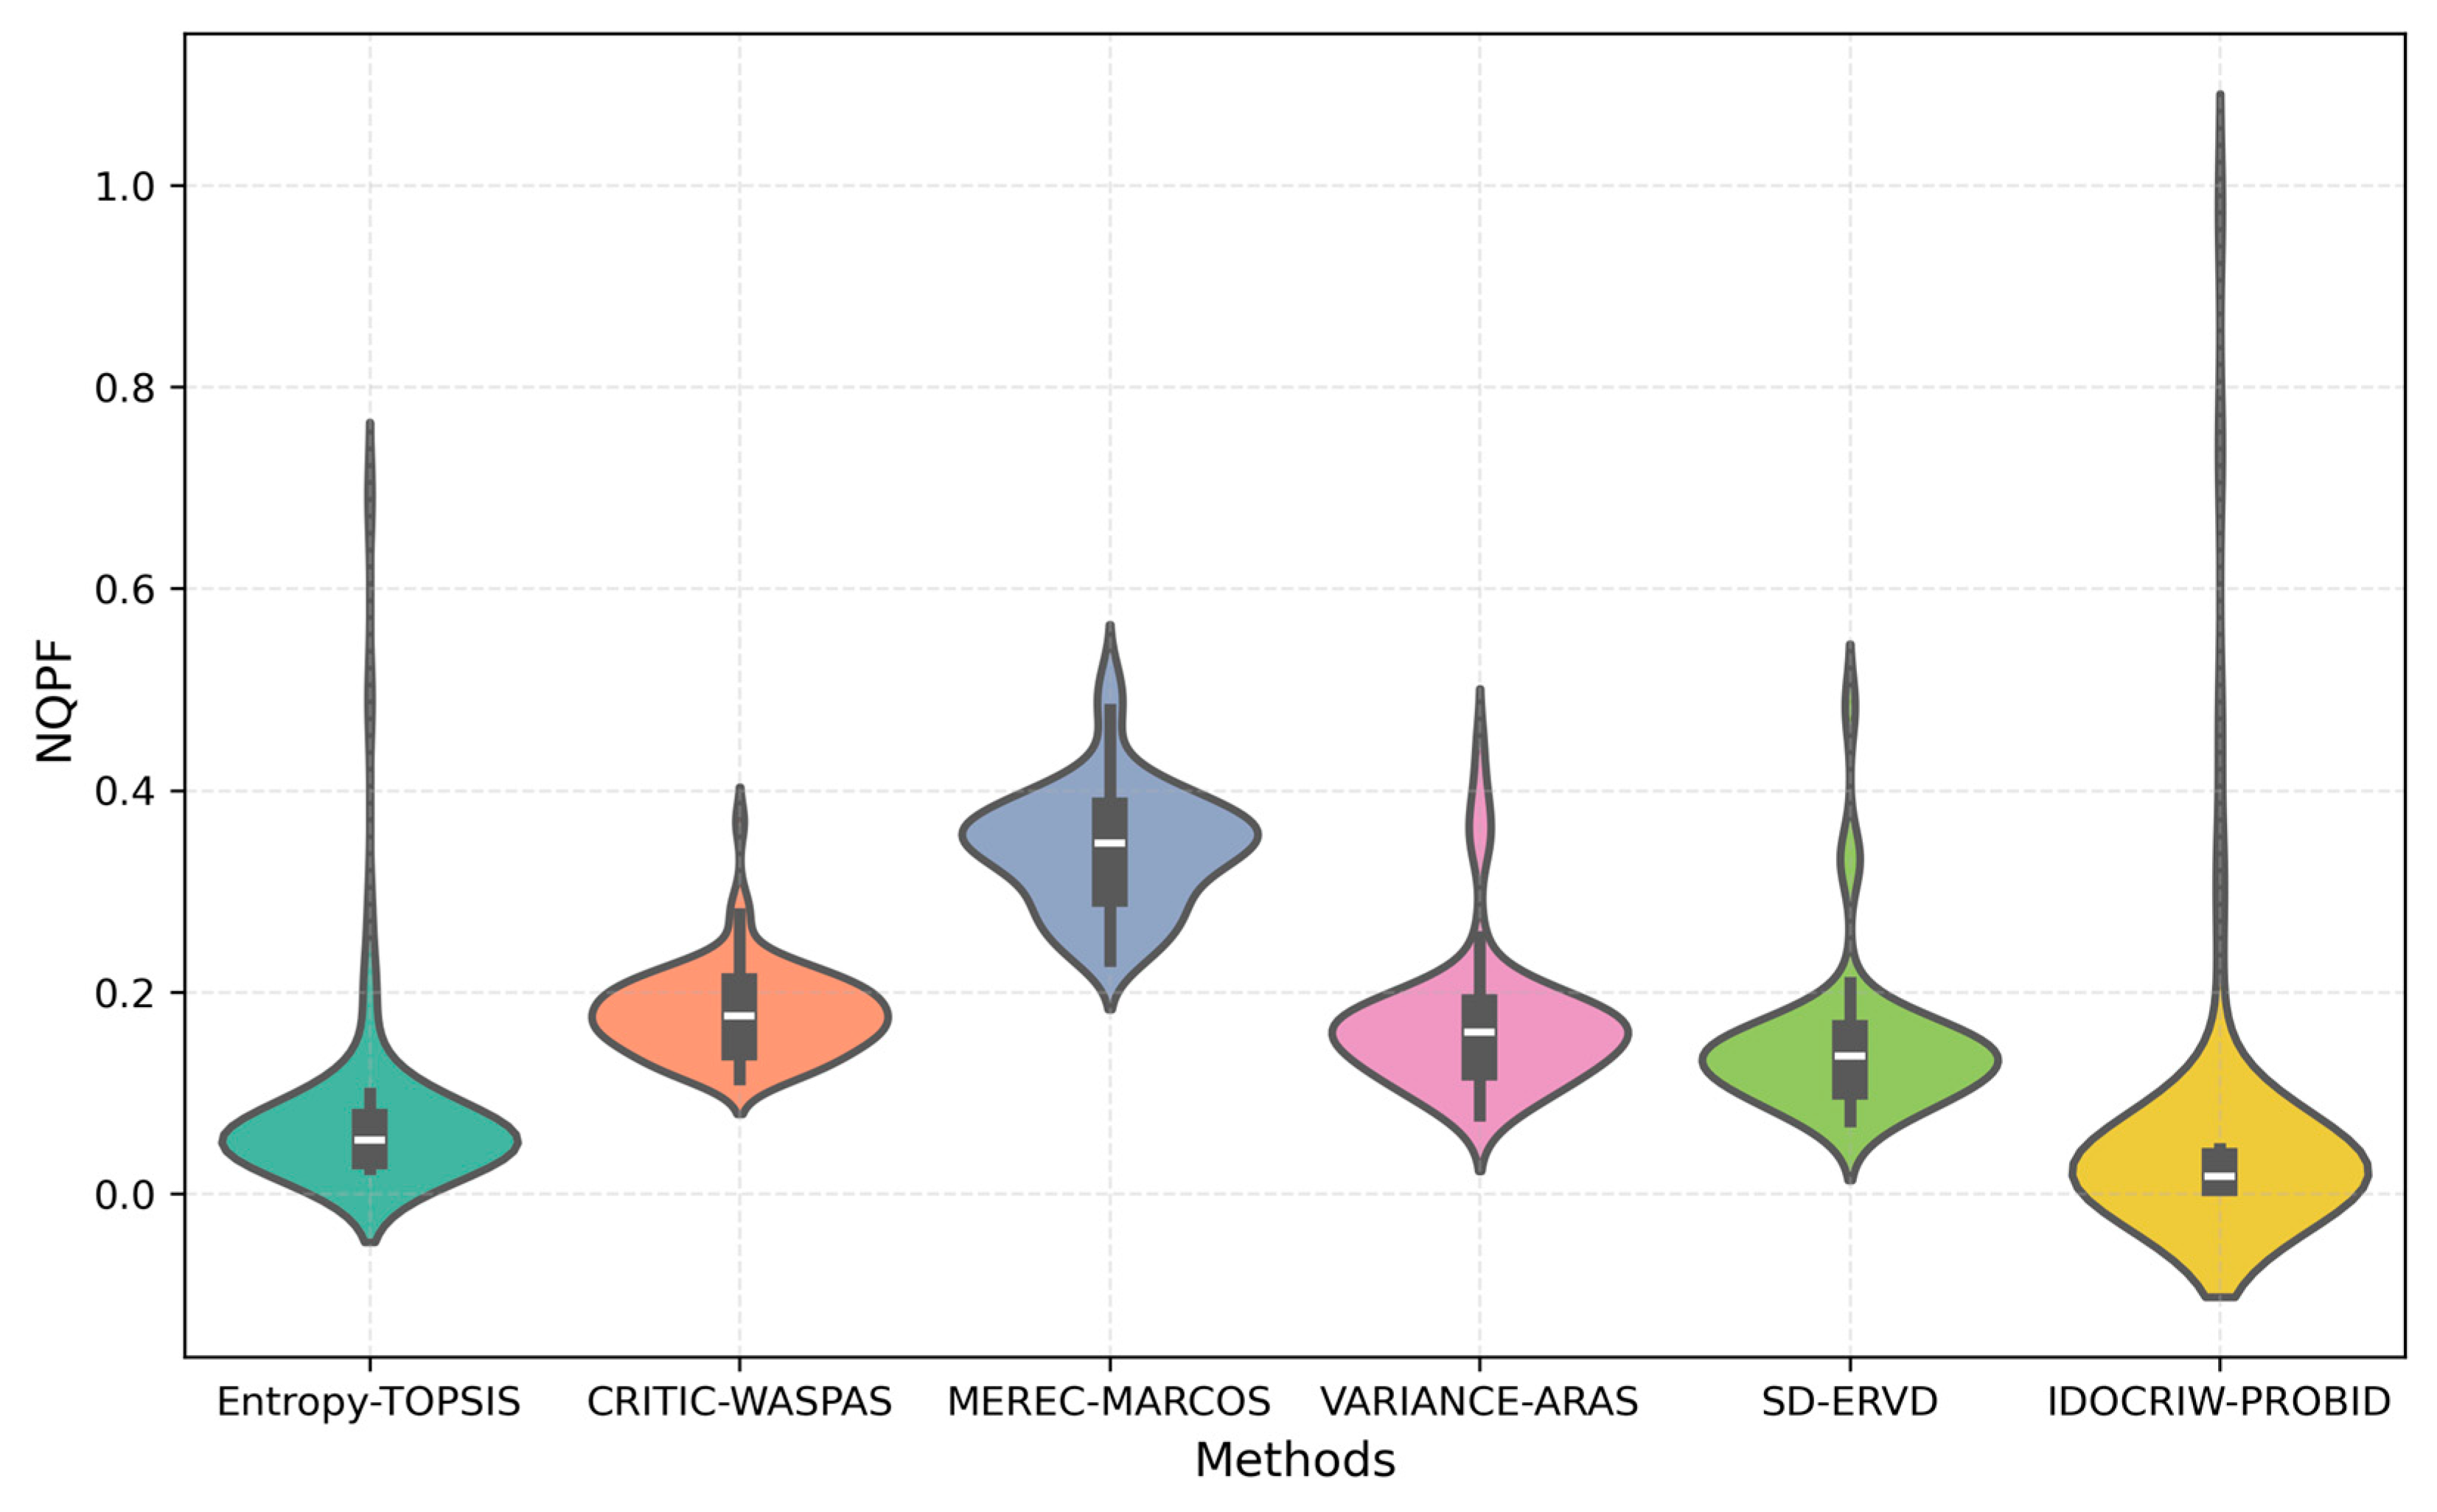
4.1.2. Superiority Analysis of the Model

To assess the superiority of the IDOCRIW-PROBID model, the distribution of NQPF evaluation values calculated by this model was visualized and compared with those obtained from other models, including Entropy-TOPSIS, CRITIC-WASPAS, MEREC-MARCOS, and SD-ERVD. The resulting distribution is illustrated in Figure 4.
Based on Figure 4, it can be observed that the IDOCRIW-PROBID method exhibits several unique advantages in analyzing the NQPF of NEV companies.
First, the violin plot of the IDOCRIW-PROBID method shows a wider distribution range, indicating that this method can capture a broad spectrum of productivity differences among different companies. Compared with other methods, IDOCRIW-PROBID exhibits high sensitivity in identifying both high- and low-performing companies. This is particularly important in the NEV industry, where significant disparities exist among companies, and this method effectively reflects that reality. Second, the box plot of this method is relatively short and positioned lower, indicating that most companies’ productivity is concentrated within a narrow and lower range. This concentrated distribution shows that the IDOCRIW-PROBID method maintains high stability and consistency in evaluating the NQPF of most companies, reducing volatility. Additionally, the lower box plot suggests that the method does not overestimate the competitiveness of most companies, providing an accurate reflection of average performance. Finally, although the violin plot of the IDOCRIW-PROBID method is longer, it simultaneously demonstrates an effective ability to identify outlier companies, whether they perform exceptionally well or poorly. This suggests that the IDOCRIW-PROBID method, when applied to large samples of companies, maintains stable core evaluations while sensitively capturing anomalies, offering a richer dimension for competitiveness assessment.
In conclusion, the IDOCRIW-PROBID method, through its unique distribution characteristics, achieves a balance of stability, sensitivity, and broad applicability, making it highly suitable for NQPF evaluation of NEV companies. It provides decision-makers with comprehensive and precise support.

4.2. Analysis of NQPF Levels

This section uses descriptive statistics and regression analysis to explore the development levels and trends of NQPF in Chinese NEV companies.

4.2.1. Descriptive Statistical Analysis

Table 4 presents the descriptive statistics of the new quality productivity (NQPF) of NEV companies from 2018 to 2022. Overall, the mean shows a downward trend, dropping from 0.0746 in 2018 to 0.0381 in 2021, and remaining at 0.0380 in 2022. This indicates a decline in overall company NQPF. The standard deviation reflects the variation among companies. In 2018, the standard deviation was 0.2255, indicating significant differences among companies, whereas the standard deviations in 2021 and 2022 were 0.0702 and 0.0695, respectively, indicating a convergence in NQPF. The notable fluctuation in the maximum values (0.9767 in 2018 and 0.3096 in 2022) reflects the instability in the performance of individual companies, while the minimum values remained stable, suggesting little change in NQPF among less efficient companies. Changes in the median and quartiles further reveal that the NQPF of most companies declined in 2020 and remained at lower levels in 2021 and 2022, reflecting the challenges faced by the industry as a whole.
In summary, from 2018 to 2022, the NQPF of NEV companies showed an overall declining trend, with differences among companies gradually narrowing. This phenomenon indicates that the global economy is entering a new phase of inventory reduction, with the economic downturn significantly impacting the development of companies’ NQPF. Notably, the outbreak of the COVID-19 pandemic at the end of 2019 caused significant disruptions to the supply chains, financial resources, and innovation efforts of NEV companies, leading to a stagnation in the development of their NQPF. For instance, pandemic-related lockdowns and restrictions led to widespread factory shutdowns, halts in logistics, and severe bottlenecks in the supply chain, resulting in delays in the delivery of critical components, such as batteries and semiconductors, which are essential for NEV production. Furthermore, travel restrictions, lockdown measures, and a decline in consumer purchasing power severely impacted market demand for automobiles, including NEVs. As the pandemic unfolded, companies were also forced to reallocate resources to maintain liquidity and ensure short-term survival, which diverted attention away from long-term investments in technological innovation and productivity improvements.
As competition intensifies, price wars between traditional fuel vehicles and NEVs, as well as within the NEV industry, have become increasingly fierce, putting enormous price pressure on companies. These price wars have not only squeezed companies’ profit margins but also forced them to continuously reduce costs to remain competitive in the tough market environment. To cope with this competitive pressure, companies have accelerated technological upgrades and improvements in operational efficiency. In the long term, these technological advancements and efficiency improvements will positively impact companies’ NQPF and market competitiveness. However, this process is typically accompanied by short-term cost increases, including investments in research and development, equipment upgrades, and operational adjustments. Moreover, the benefits of technological upgrades often exhibit a lag effect, making it difficult for companies to achieve immediate NQPF improvements in the short term, which exacerbates the challenges faced by companies during the transition period.
Additionally, between 2018 and 2022, policy changes implemented by the government regarding the NEV industry, such as subsidy reductions and stricter carbon emission regulations, have also had a profound impact on companies’ NQPF. The reduction in subsidies directly affected companies’ cost structures and profitability, especially for small companies that were heavily reliant on government subsidies, leading to greater financial strain. In response to reduced subsidies, companies had to increase investment in technology research and development as well as cost control in production, which often led to short-term financial pressures and a subsequent decline in NQPF. Meanwhile, stricter carbon emission regulations forced companies to pursue technological upgrades, particularly in battery technology, energy management, and production processes. While these adjustments contribute to long-term NQPF gains, they require substantial capital and resource investment in the initial stages. The high costs associated with these technological improvements and production line adjustments often result in temporary NQPF declines for companies in the short term.

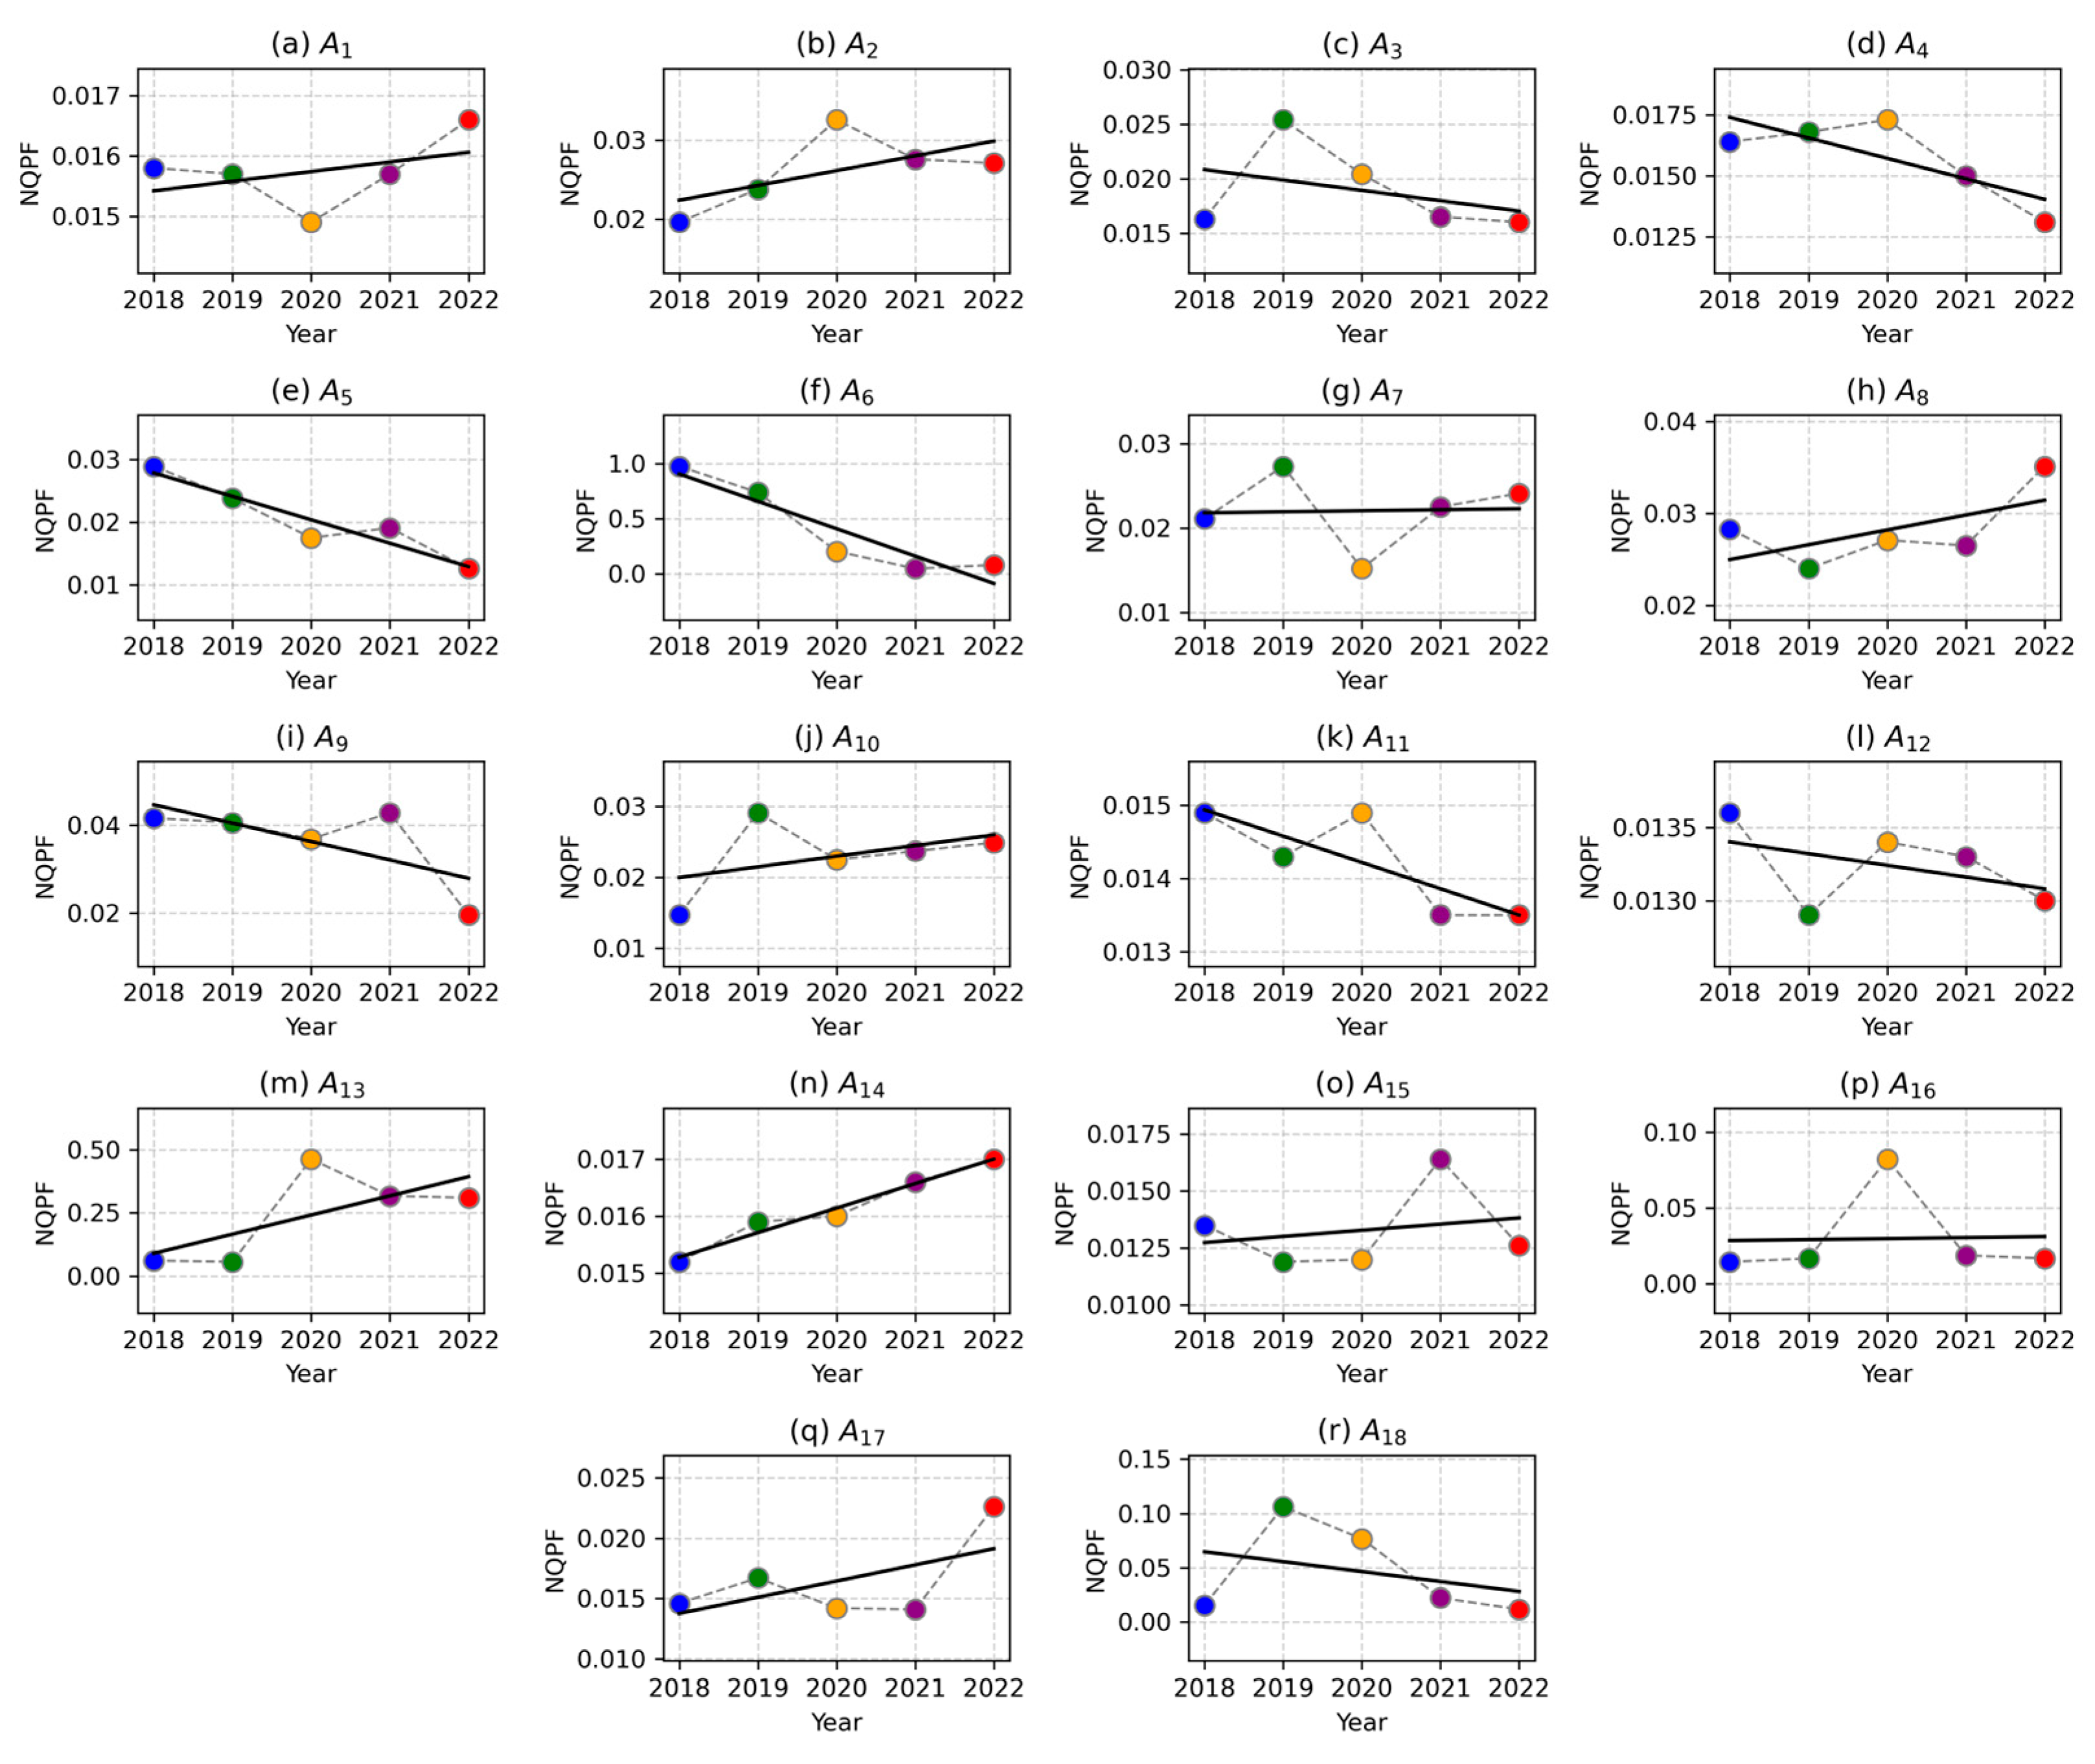
4.2.2. Regression Analysis

To gain a deeper understanding of the long-term changes in NQPF for NEV companies, we performed linear regression analysis for each company to more accurately reveal the trajectory of their NQPF growth or decline. The visualized results of the linear regression analysis are shown in Figure 5.
According to Figure 5, which presents the regression analysis of NQPF for Chinese A-share NEV companies from 2018 to 2022, the following three key findings can be drawn. First, most companies exhibit low levels of NQPF, with limited fluctuations over the five-year period, indicating that the industry as a whole still has significant potential for development in terms of technological innovation and NQPF improvement. Second, there is a significant variation in NQPF among companies. Some companies, such as A13, demonstrated strong growth, with their NQPF rising sharply from 0.0611 in 2018 to 0.4628 in 2020. In contrast, A6 showed a dramatic decline in NQPF, dropping from 0.9767 in 2018 to 0.0779 in 2022, reflecting a clear downward trend. Lastly, while some companies, like A13, show significant growth, most companies either maintain low levels of NQPF or exhibit a downward trend. This overall pattern indicates that many companies are facing substantial challenges in improving their NQPF.

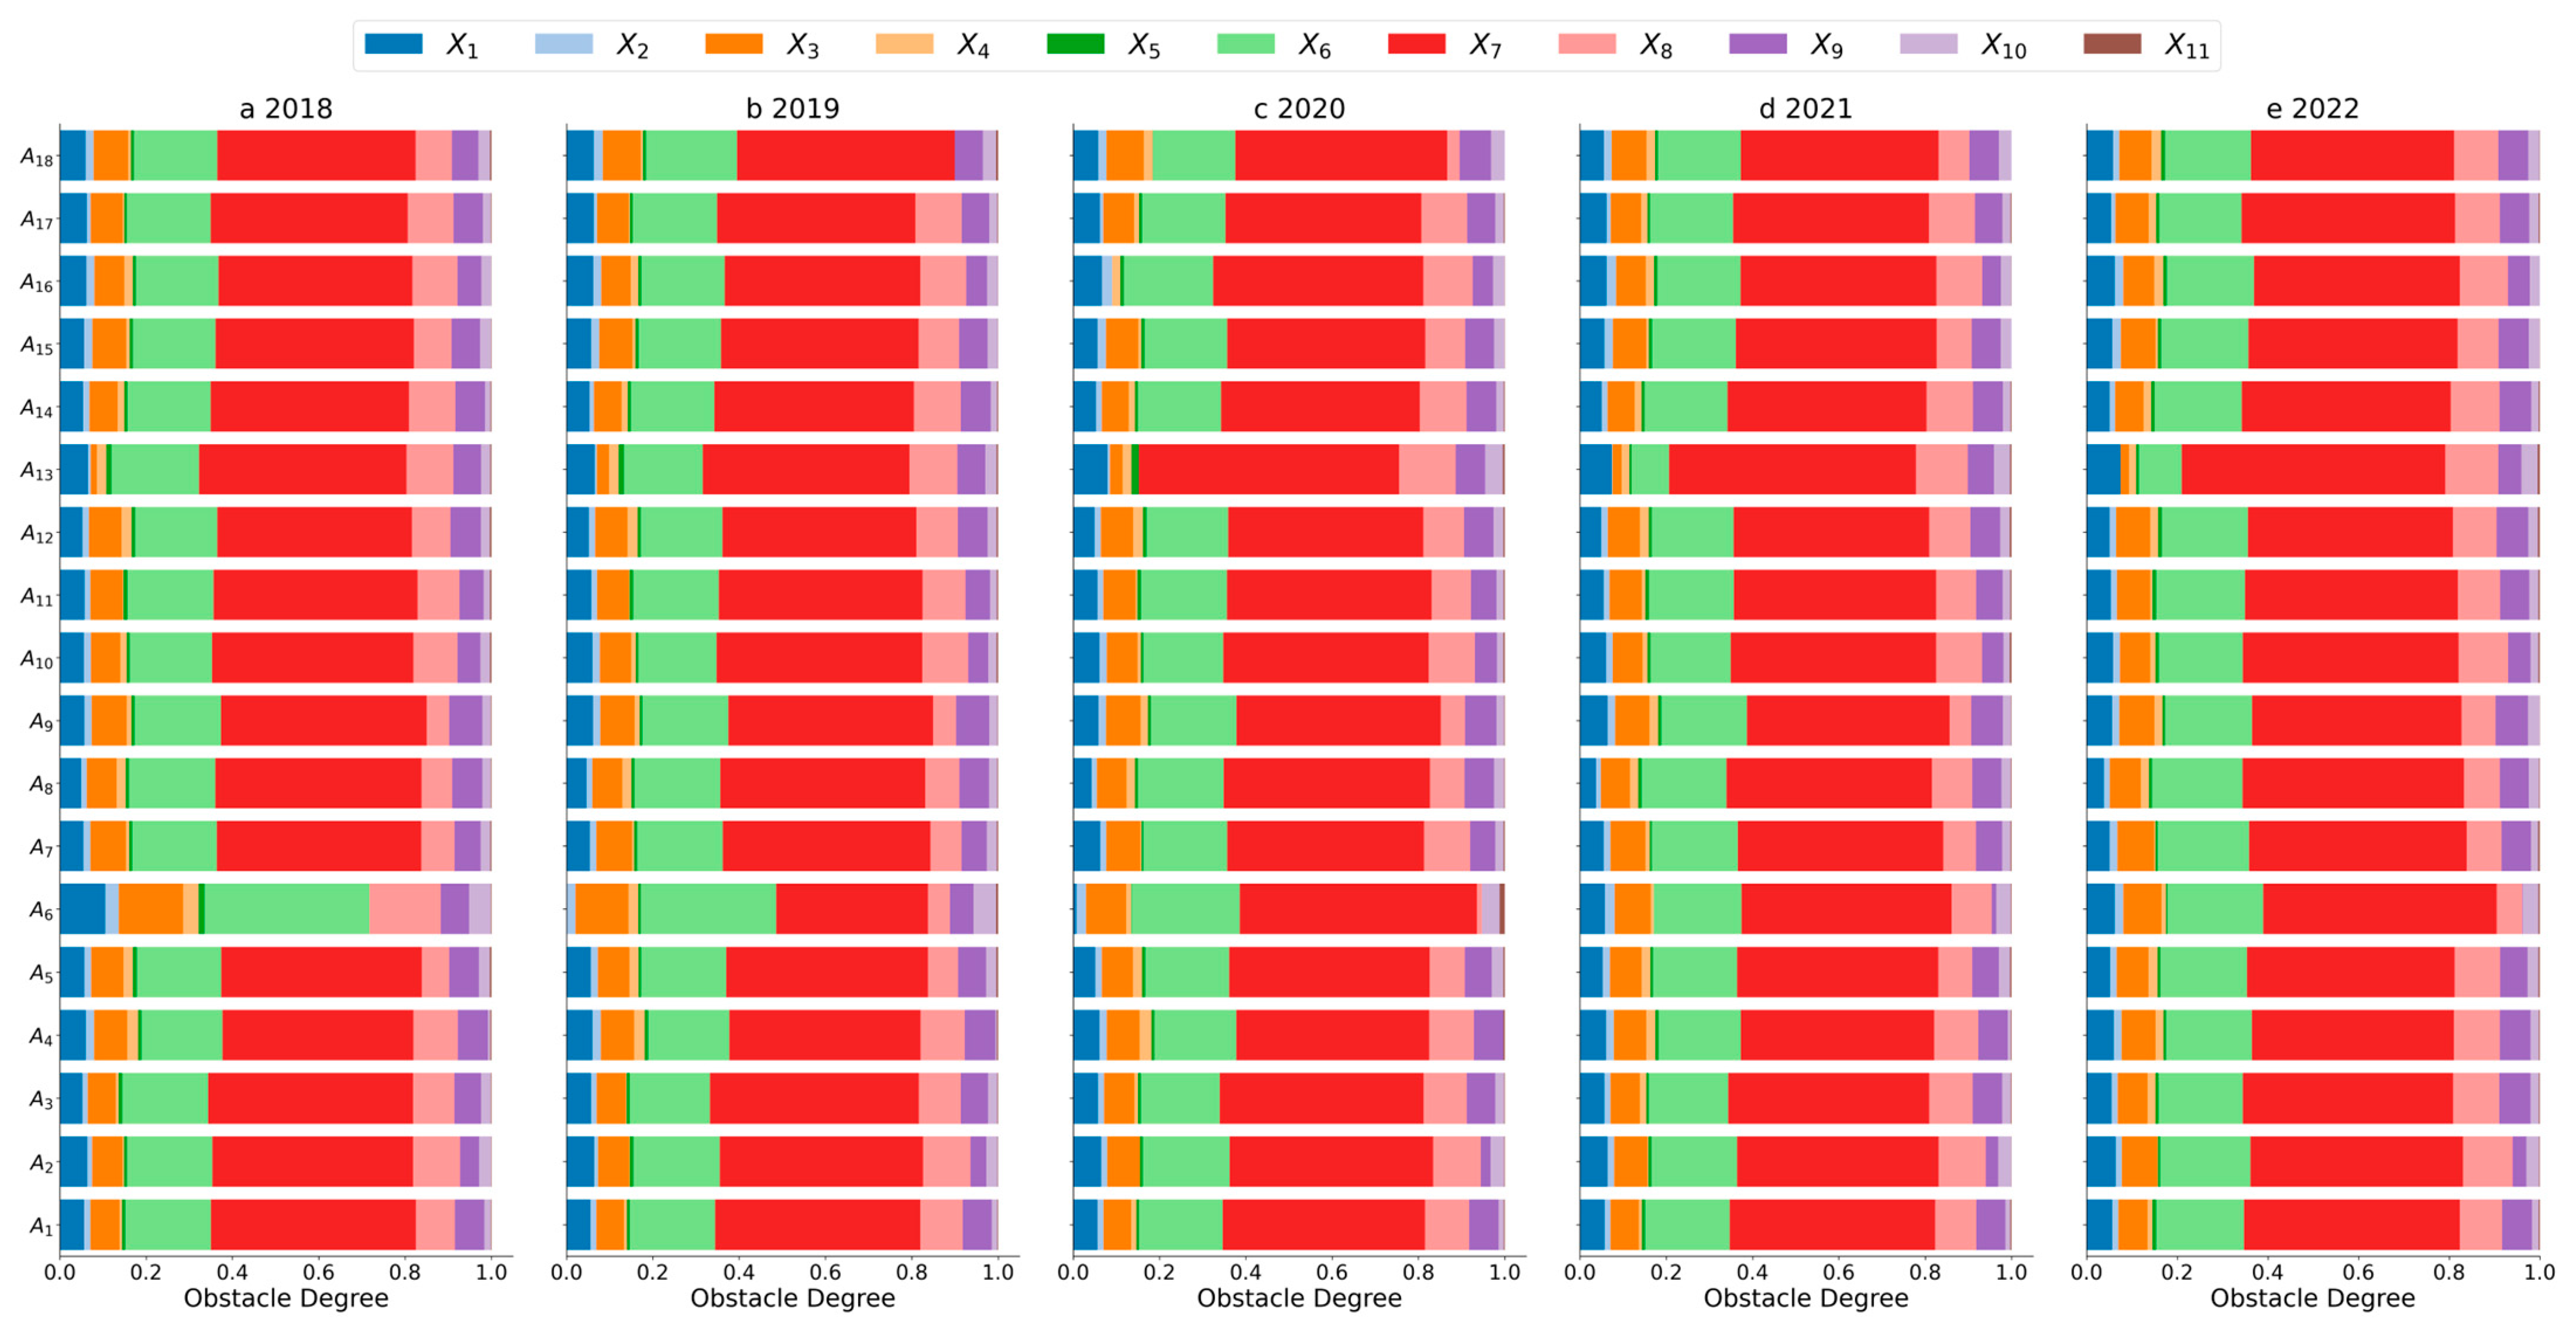
4.3. Analysis of NQPF Obstacle Factors

To analyze the challenges faced by the development of new quality productivity (NQPF) in China’s NEV industry, this study calculated the NQPF obstacle degrees of NEV companies from 2018 to 2022 using Equation (18). The results are shown in Figure 6. According to Figure 6, the changes in obstacle degrees of various indicators over the five-year period were relatively small, indicating a certain degree of stability. Indicators such as X7, X6, X8, X3, X1, and X9 consistently ranked as the main obstacle factors. The persistently high obstacle degrees of these indicators suggest that technological innovation and talent resource allocation have become long-term constraints and key bottlenecks in the NEV industry, reflecting the systemic challenges the industry faces in these areas.
According to Figure 6, it can be observed that the significant changes in the NQPF of individual companies are closely related to their ability to overcome key obstacle factors. For instance, Company A13 significantly reduced the impact of these key obstacles through effective management and optimization of research and development (R&D) resources, particularly achieving substantial progress in human resource allocation and financial efficiency. This has driven the notable increase in its NQPF. In contrast, the performance of Company A6 is more concerning. Although the obstacle degree of X3 decreased, indicating progress in talent acquisition and development, the obstacle degrees of X7, X6, and X8 remained high. This reflects the company’s insufficient financial investment in R&D facilities, equipment leasing, and direct R&D expenditure, which limited the effectiveness of its R&D activities and hindered its technological innovation and NQPF growth. While there were improvements in the talent structure, the low level of R&D investment remains the primary bottleneck for Company A6, restricting significant improvements in its overall NQPF.
Overall, these results reveal the persistent challenges faced by the NEV industry in terms of technological innovation, talent resource allocation, and R&D investment. Specifically, for key indicators such as X6, X7, and X8, companies across the industry generally exhibit low levels of investment, which limits improvements in R&D efficiency and the optimization of asset utilization. Companies in the industry need to further strengthen their investment and management in R&D funding to overcome these long-standing obstacles and promote the continuous improvement of NQPF.

5. Conclusions and Recommendations

This study integrated the IDOCRIW and PROBID methods to construct a new MCDA model for evaluating the NQPF of Chinese NEV companies. The results indicate that the proposed model provides reliable outcomes and offers better ranking differentiation compared to traditional models. Furthermore, despite some progress in technological innovation and talent resource allocation by certain NEV companies, overall, the NQPF development of the Chinese NEV industry shows a downward trend. Companies still face significant challenges in R&D investment and asset management, particularly with the low levels of key indicators such as X6, X7, and X8, which have become critical factors hindering the improvement of NQPF.

5.1. Conclusions

(1)
The proposed IDOCRIW-PROBID model demonstrates reliability and superiority. The correlation between the evaluation results of the IDOCRIW-PROBID model and traditional models (such as Entropy-TOPSIS) reached 0.91, indicating the high reliability and accuracy of the model in assessing the NQPF of NEV companies. The model can effectively distinguish differences in productivity levels among companies and shows high sensitivity in identifying subtle changes and performance variations.
(2)
The development level of NQPF in Chinese NEV companies is suboptimal. From 2018 to 2022, the overall NQPF level of NEV companies showed a downward trend, and the disparity among companies gradually narrowed. This reflects insufficient investment in technological innovation, asset utilization, and talent acquisition across the industry, especially in terms of direct R&D investment, R&D depreciation, and leasing costs, which have become major obstacles to improving productivity.
(3)
The lack of hard technology is a primary obstacle to the development of NQPF in Chinese NEV companies. During the study period, the high obstacle degrees of X6, X7, and X8 indicated low levels of investment in these key R&D inputs, which severely affected companies’ technological innovation capabilities and asset utilization efficiency. The insufficient investment in these critical areas has become a long-term challenge for NEV companies.

5.2. Recommendations

(1)
Increase R&D investment and optimize fund allocation. NEV companies should increase their R&D funding, especially in key areas such as R&D depreciation, R&D leasing, and other critical fields, to ensure the sustainability of technological innovation. At the same time, companies should strengthen their fine management of R&D funds, rationally allocate R&D expenses, and improve fund utilization efficiency.
(2)
Strengthen technological innovation capabilities and improve R&D efficiency. Technological innovation is a key driver for improving NQPF. Companies should, while maintaining their current R&D investment, further improve the efficiency of R&D activities. By optimizing the management of R&D assets and reducing unnecessary leasing costs, companies can enhance the utilization efficiency of R&D depreciation and leasing expenses, maximizing the benefits of R&D activities.
(3)
Improve asset management and enhance resource utilization efficiency. Companies should focus on improving their overall asset utilization efficiency, especially in the rational allocation of R&D funds and resource optimization. Strengthening technology transfer and the industrial application of innovative outcomes will help boost productivity. Furthermore, optimizing the management of R&D depreciation and leasing expenses will enhance companies’ ability to allocate R&D resources, reducing financial waste.
(4)
Improve talent recruitment and training mechanisms. Although companies have made some improvements in the proportion of highly educated personnel, the overall allocation of R&D talent still needs optimization. Companies should further enhance their talent recruitment and training mechanisms to improve the overall quality and innovative capabilities of their R&D teams, providing more high-quality human resources to support technological innovation.
(5)
Government support and policy guidance. The government should continue to encourage NEV companies to increase R&D investment through policy support, particularly by offering appropriate tax incentives or subsidies for R&D leasing and depreciation costs. Additionally, the government should promote the establishment of a comprehensive technological innovation ecosystem, facilitating collaboration between companies and research institutions to drive technology transfer and the industrialization of outcomes. Furthermore, the government should offer talent recruitment policy support to help companies better attract and retain high-end R&D talent.

Author Contributions

Conceptualization, G.H. and F.Z.; methodology, G.H.; software, F.Z.; validation, G.H.; formal analysis, G.H.; investigation, G.H.; resources, G.H.; data curation, G.H.; writing—original draft preparation, G.H.; writing—review and editing, F.Z.; visualization, F.Z.; supervision, H.S.; project administration, H.S.; funding acquisition, H.S. All authors have read and agreed to the published version of the manuscript.

Funding

This research was funded by the Key Program of National Social Science Fund of China, grant number 21AZD067; and the Key Project of Jinhua Social Science Association, grant number ZD202402.

Data Availability Statement

The data presented in this study are available on request from the corresponding author.

Conflicts of Interest

The authors declare no conflicts of interest.

References

  1. Martyushev, N.V.; Malozyomov, B.V.; Kukartsev, V.V.; Gozbenko, V.E.; Konyukhov, V.Y.; Mikhalev, A.S.; Tynchenko, Y.A. Determination of the reliability of urban electric transport running autonomously through diagnostic parameters. World Electr. Veh. J. 2023, 14, 334. [Google Scholar] [CrossRef]
  2. Wang, S. Exploring the sustainability of China’s new energy vehicle development: Fresh evidence from population symbiosis. Sustainability 2022, 14, 10796. [Google Scholar] [CrossRef]
  3. Zhou, W.; Xu, L. On New Quality Productivity: Connotative Characteristics and Important Focus. Reform 2023, 10, 1–13. [Google Scholar]
  4. Xie, F.; Jiang, N.; Kuang, X. Towards an accurate understanding of ‘new quality productive forces’. Econ. Political Stud. 2024, 1–15. [Google Scholar] [CrossRef]
  5. Lu, J.; Guo, Z.; Wang, Y. Levels of development of new quality productivity, regional differences and paths to enhancement. J. Chongqing Univ. 2024, 30, 1–17. [Google Scholar]
  6. Zeng, P.; Qin, Y.; Zhou, L. Measurement and spatiotemporal pattern of new quality productive forces level in Chinese cities. Prog. Geogr. 2024, 43, 1102–1117. [Google Scholar]
  7. Luo, G.; Song, X. The Production Mechanisms, Spatial and Temporal Characteristics, and Regional Differences of Agricultural New Quality Productivity in China. Chin. J. Agric. Resour. Reg. Plan. 2024, 1–14. Available online: https://link.cnki.net/urlid/11.3513.s.20240624.1845.020 (accessed on 24 September 2024).
  8. Deng, Z.; Wu, H.; Yang, D. Accelerating the Development of New Quality Productive Forces in the Industrial Field: History, Characteristics, and Pathways. J. Beijing Univ. Technol. 2024, 24, 107–117. [Google Scholar]
  9. Liu, Y.; He, Z. Synergistic Industrial Agglomeration, New Quality Productive Forces and High-quality Development of the Manufacturing Industry. Int. Rev. Econ. Financ. 2024, 94, 103373. [Google Scholar] [CrossRef]
  10. Yang, L.H.; Ye, F.F.; Wang, Y.M.; Huang, Y.; Hu, H. An ensemble model for efficiency evaluation of enterprise performance based on evidential reasoning approach. J. Intell. Fuzzy Syst. 2023, 45, 2477–2495. [Google Scholar] [CrossRef]
  11. Quan, C.; Yu, S.; Cheng, X.; Liu, F. Comprehensive efficiency evaluation of social responsibility of Chinese listed logistics enterprises based on DEA-Malmquist model. Oper. Manag. Res. 2022, 15, 1383–1398. [Google Scholar] [CrossRef]
  12. Xu, X.; He, D.; Wang, T.; Chen, X.; Zhou, Y. Technological innovation efficiency of listed carbon capture companies in China: Based on the dual dimensions of legal policy and technology. Energies 2023, 16, 1118. [Google Scholar] [CrossRef]
  13. Dong, J.; Liu, D.; Liu, Y.; Huo, H.; Dou, X.; Bao, A. Trading performance evaluation for traditional power generation group based on an integrated matter-element extension cloud model. Energy Rep. 2021, 7, 3074–3089. [Google Scholar] [CrossRef]
  14. Liang, X.; Chen, T.; Ye, M.; Lin, H.; Li, Z. A hybrid fuzzy BWM-VIKOR MCDM to evaluate the service level of bike-sharing companies: A case study from Chengdu, China. J. Clean. Prod. 2021, 298, 126759. [Google Scholar] [CrossRef]
  15. Mohammed, A.; Jabbour, A.B.L.D.S.; Diabat, A. COVID-19 pandemic disruption: A matter of building companies’ internal and external resilience. Int. J. Prod. Res. 2023, 61, 2716–2737. [Google Scholar] [CrossRef]
  16. Sun, P.; Cui, T.; Qi, S. MADM framework based on 2-tuple linguistic neutrosophic sets and its application to comprehensive evaluation of corporate cultural competitiveness. J. Intell. Fuzzy Syst. 2023, 45, 7921–7937. [Google Scholar] [CrossRef]
  17. Guo, C.; Wang, Y.; Yuan, S.; Li, Z. A Novel Hybrid Multiple Attribute Decision Making Framework for Enterprise Green Marketing Performance Management Evaluation Based on the Triangular Fuzzy Neutrosophic Sets. IEEE Access 2023, 11, 142676–142688. [Google Scholar] [CrossRef]
  18. Lin, L.; Gu, T.; Shi, Y. The Influence of New Quality Productive Forces on High-Quality Agricultural Development in China: Mechanisms and Empirical Testing. Agriculture 2024, 14, 1022. [Google Scholar] [CrossRef]
  19. López-Parra, P.; Alvarez, P.A.; León-Castro, E.; Velázquez-Cázares, M.; Muñoz-Palma, M. A Bibliometric Analysis of Robustness and MCDA. In Soft Computing and Fuzzy Methodologies in Innovation Management and Sustainability; Springer International Publishing: Cham, Switzerland, 2022; pp. 249–274. [Google Scholar]
  20. Bhaskar, A.S.; Khan, A. Comparative analysis of hybrid MCDM methods in material selection for dental applications. Expert Syst. Appl. 2022, 209, 118268. [Google Scholar] [CrossRef]
  21. Wu, Q.; Liu, X.; Zhou, L.; Qin, J.; Rezaei, J. An analytical framework for the best–worst method. Omega 2024, 123, 102974. [Google Scholar] [CrossRef]
  22. Zeng, F.; Sun, H. Spatial Network Analysis of Coupling Coordination between Digital Financial Inclusion and Common Prosperity in the Yangtze River Delta Urban Agglomeration. Mathematics 2024, 12, 1285. [Google Scholar] [CrossRef]
  23. Pamučar, D.; Stević, Ž.; Sremac, S. A new model for determining weight coefficients of criteria in MCDM models: Full consistency method (FUCOM). Symmetry 2018, 10, 393. [Google Scholar] [CrossRef]
  24. Zavadskas, E.K.; Podvezko, V. Integrated determination of objective criteria weights in MCDM. Int. J. Inf. Technol. Decis. Mak. 2016, 15, 267–283. [Google Scholar] [CrossRef]
  25. Zhang, X.; Lv, M.; Yuan, X. Research on cloud-CRITIC-PDR method for hybrid multi-criteria decision making. J. Intell. Fuzzy Syst. 2023, 45, 8789–8803. [Google Scholar] [CrossRef]
  26. Keshavarz-Ghorabaee, M.; Amiri, M.; Zavadskas, E.K.; Turskis, Z.; Antucheviciene, J. Determination of objective weights using a new method based on the removal effects of criteria (MEREC). Symmetry 2021, 13, 525. [Google Scholar] [CrossRef]
  27. Sałabun, W.; Wątróbski, J.; Shekhovtsov, A. Are MCDA methods benchmarkable? A comparative study of TOPSIS, VIKOR, COPRAS, and PROMETHEE II methods. Symmetry 2020, 12, 1549. [Google Scholar] [CrossRef]
  28. Alao, M.A.; Popoola, O.M.; Ayodele, T.R. Selection of waste-to-energy technology for distributed generation using IDOCRIW-Weighted TOPSIS method: A case study of the City of Johannesburg, South Africa. Renew. Energy 2021, 178, 162–183. [Google Scholar] [CrossRef]
  29. Ayan, B.; Abacıoğlu, S.; Basilio, M.P. A comprehensive review of the novel weighting methods for multi-criteria decision-making. Information 2023, 14, 285. [Google Scholar] [CrossRef]
  30. Luo, Y.; Zhang, X.; Qin, Y.; Yang, Z.; Liang, Y. Tourism attraction selection with sentiment analysis of online reviews based on probabilistic linguistic term sets and the IDOCRIW-COCOSO model. Int. J. Fuzzy Syst. 2021, 23, 295–308. [Google Scholar] [CrossRef]
  31. Ciardiello, F.; Genovese, A. A comparison between TOPSIS and SAW methods. Ann. Oper. Res. 2023, 325, 967–994. [Google Scholar] [CrossRef]
  32. Ünvan, Y.A.; Ergenç, C. Financial performance analysis with the fuzzy COPRAS and entropy-COPRAS approaches. Comput. Econ. 2022, 59, 1577–1605. [Google Scholar] [CrossRef]
  33. Su, J.; Sun, Y. An improved TOPSIS model based on cumulative prospect theory: Application to ESG performance evaluation of state-owned mining enterprises. Sustainability 2023, 15, 10046. [Google Scholar] [CrossRef]
  34. Palas, M.R.; Islam, M.R.; Roy, P.; Razzaque, M.A.; Alsanad, A.; AlQahtani, S.A.; Hassan, M.M. Multi-criteria handover mobility management in 5G cellular network. Comput. Commun. 2021, 174, 81–91. [Google Scholar] [CrossRef]
  35. Mufazzal, S.; Muzakkir, S.M. A new multi-criterion decision making (MCDM) method based on proximity indexed value for minimizing rank reversals. Comput. Ind. Eng. 2018, 119, 427–438. [Google Scholar] [CrossRef]
  36. Wang, Z.; Rangaiah, G.P.; Wang, X. Preference ranking on the basis of ideal-average distance method for multi-criteria decision-making. Ind. Eng. Chem. Res. 2021, 60, 11216–11230. [Google Scholar] [CrossRef]
  37. Chun, Y.; Zhang, J.; Han, Y. Green development level assessment and obstacle analysis of China’s coal-resource-based regions. Heliyon 2023, 9, e22495. [Google Scholar] [CrossRef]
  38. Song, J.; Zhang, J.; Pan, Y. Research on the Impact of ESG Development on New Quality Productive Forces of Enterprises—Empirical Evidence from Chinese A-share Listed Companies. Contemp. Econ. Manag. 2024, 46, 1–11. [Google Scholar]
  39. Shi, D.; Sun, G. Data Elements and New Quality Productive Forces: A Perspective from Total Factor Productivity of Enterprises. Econ. Theory Bus. Manag. 2024, 44, 12. [Google Scholar]
  40. Li, B. Research on the Influence of Government Subsidy on New Quality Productive Forces of Grain Enterprises—Empirical Evidence from Listed Companies in China. Econ. Insights-Trends Chall. 2024, 3, 45–72. [Google Scholar] [CrossRef]
  41. Wang, J.; Mo, L.; Ma, Z. Evaluation of port competitiveness along China’s “Belt and Road” based on the entropy-TOPSIS method. Sci. Rep. 2023, 13, 15717. [Google Scholar] [CrossRef]
  42. Sampath, V.K.; Radhakrishnan, N. Prioritization of Sub-Watersheds Susceptible to Soil Erosion using Different Combinations of Objective Weighting and MCDM Techniques in an Ungauged River Basin. Water Resour. Manag. 2024, 38, 3447–3469. [Google Scholar] [CrossRef]
  43. Simic, V.; Gokasar, I.; Deveci, M.; Švadlenka, L. Mitigating climate change effects of urban transportation using a type-2 neutrosophic MEREC-MARCOS model. IEEE Trans. Eng. Manag. 2022, 71, 3233–3249. [Google Scholar] [CrossRef]
  44. Seikh, M.R.; Chatterjee, P. Determination of best renewable energy sources in India using SWARA-ARAS in confidence level based interval-valued Fermatean fuzzy environment. Appl. Soft Comput. 2024, 155, 111495. [Google Scholar] [CrossRef]
  45. Shyur, H.J.; Yin, L.; Shih, H.S.; Cheng, C.B. A multiple criteria decision making method based on relative value distances. Found. Comput. Decis. Sci. 2015, 40, 299–315. [Google Scholar] [CrossRef]
Figure 1. Research framework.
Wevj 15 00503 g001
Figure 2. Flowchart of the IDOCRIW-PROBID model.
Wevj 15 00503 g002
Figure 3. Correlation heatmap of NEV companies’ NQPF rankings across different evaluation models.
Wevj 15 00503 g003
Figure 4. Comparison of NQPF evaluation results for NEV companies across different models.
Wevj 15 00503 g004
Figure 5. Trend of NQPF changes in Chinese NEV companies from 2018 to 2022.
Wevj 15 00503 g005
Figure 6. Distribution of obstacle factors affecting NQPF in NEV companies (2018–2022).
Wevj 15 00503 g006
Table 1. NQPF evaluation index system for NEV companies.
Target LayerCriterion LayerIndex LayerCalculation FormulaProperty
LaborLive LaborR&D Personnel Salary
Ratio (X1)
(R&D Expenses − Salary Compensation)/Operating Income+
R&D Personnel
Proportion (X2)
Number of R&D Personnel/Total Number of Employees+
High-Education
Personnel Proportion (X3)
Number of Personnel with Bachelor’s Degree or Higher/Total Number of Employees+
Materialized
Labor
Fixed Asset Ratio (X4)Fixed Assets/Total Assets+
Manufacturing
Expense Ratio (X5)
(Net Cash Flow from Operating Activities + Fixed Asset Depreciation + Intangible Asset Amortization + Provision for Impairment − Cash Paid for Goods and Services − Wages Paid to Employees)/(Net Cash Flow from Operating Activities + Fixed Asset Depreciation + Intangible Asset Amortization + Provision for Impairment)+
Production ToolsHard
Technology
R&D Depreciation & Amortization Ratio (X6)(R&D Expenses − Depreciation & Amortization)/Operating Income+
R&D Leasing Fee Ratio (X7)(R&D Expenses − Leasing Fee)/Operating Income+
R&D Direct Investment Ratio (X8)(R&D Expenses − Direct Investment)/Operating Income+
Soft
Technology
Intangible Asset
Ratio (X9)
Intangible Assets/Total Assets+
Total Asset Turnover
Ratio (X10)
Operating Income/Average Total Assets+
Equity Multiplier (X11)Total Assets/Shareholders’ Equity-
Table 2. Calculation results of indicator weights.
X1X2X3X4X5X6X7X8X9X10X11
w j 0.0690.0200.0660.0160.0070.1840.4820.0830.0460.0240.003
q j 0.0560.0690.0750.1090.1090.0660.0590.0800.1020.0800.196
w j 0.0580.0200.0740.0260.0120.1800.4240.0990.0690.0290.009
Table 3. Evaluation results of NQPF for NEV companies.
Companies20182019202020212022
A10.0158 0.0157 0.0149 0.0157 0.0166
A20.0196 0.0238 0.0326 0.0276 0.0271
A30.0163 0.0254 0.0204 0.0165 0.0160
A40.0164 0.0168 0.0173 0.0150 0.0131
A50.0289 0.0238 0.0175 0.0191 0.0126
A60.9767 0.7387 0.2028 0.0445 0.0779
A70.0211 0.0273 0.0152 0.0225 0.0241
A80.0283 0.0240 0.0271 0.0265 0.0351
A90.0416 0.0405 0.0368 0.0428 0.0195
A100.0147 0.0291 0.0225 0.0237 0.0249
A110.0149 0.0143 0.0149 0.0135 0.0135
A120.0136 0.0129 0.0134 0.0133 0.0130
A130.0611 0.0562 0.4628 0.3171 0.3096
A140.0152 0.0159 0.0160 0.0166 0.0170
A150.0135 0.0119 0.0120 0.0164 0.0126
A160.0145 0.0167 0.0822 0.0187 0.0168
A170.0146 0.0148 0.0142 0.0141 0.0226
A180.0153 0.1062 0.0767 0.0222 0.0116
Table 4. Descriptive Statistics of NQPF of NEV companies (2018–2022).
20182019202020212022
count1818181818
mean0.07460.06740.06110.03810.038
std0.22550.1690.11030.07020.0695
min0.01350.01190.0120.01330.0116
25%0.01480.01580.0150.01590.0132
50%0.01610.02380.0190.01890.0169
75%0.02650.02860.03570.02580.0247
max0.97670.73870.46280.31710.3096
Disclaimer/Publisher’s Note: The statements, opinions and data contained in all publications are solely those of the individual author(s) and contributor(s) and not of MDPI and/or the editor(s). MDPI and/or the editor(s) disclaim responsibility for any injury to people or property resulting from any ideas, methods, instructions or products referred to in the content.

