Article

Optimal Mileage of Electric Vehicles Considering Range Anxiety and Charging Times

1
School of Management, Wuhan Textile University, Wuhan 430200, China
2
School of Information Management and Statistics, Hubei University of Economics, Wuhan 430205, China
*
Authors to whom correspondence should be addressed.
World Electr. Veh. J. 2023, 14(1), 21; https://doi.org/10.3390/wevj14010021
Submission received: 23 November 2022 / Revised: 26 December 2022 / Accepted: 9 January 2023 / Published: 11 January 2023

Abstract

:
This paper aims to find out the optimal mileage of battery electric vehicles (BEVs) by considering the trade-off between range anxiety and charging times, since frequent charging is a customary way to ease range anxiety for BEV drivers in practice, but declines the life cycle of battery and increases the charging cost. We propose a power function to measure the range anxiety and then solve two types of optimal mileages. The results show that the increment of BEVs’ cruising range increases the optimal absolute mileage but decreases the optimal relative mileage, while the improvement of the driver’s tolerance to range anxiety increases both. It is concluded that improving the driver’s tolerance, such as by expanding charging infrastructures and raising drivers’ practical experience with BEVs, is more effective than the increment of BEVs’ cruising range. The findings help to understand the optimal mileage of EVs and provide recommendations on the design of BEVs’ cruising range.

1. Introduction

Battery electric vehicles (BEVs) offer a prominent option to tackle the global challenges of greenhouse gas (GHG) emissions and oil depletion [1,2], but have a limited cruising range and need a long time to recharge. These factors, combined with the sparse recharging network, make consumers fear or worry that they may run out of power before reaching a destination while driving a BEV [3,4]. This mental stress refers to range anxiety (RA), which has become one of the major barriers to the widespread adoption of BEVs [5,6,7]. Several solutions are provided to relieve RA, e.g., the extended-range EV, the rapid charging pile, the battery swapping mode, the new battery technology, etc. Moreover, some governments encourage industries to expand the charging network or reduce the charging cost.
However, battery technology cannot make a breakthrough in a short time. The charging infrastructure construction has been slow because of the chicken-and-egg dilemma, i.e., consumers are unwilling to purchase BEVs unless they are ready to access charging infrastructure, while the industry is reluctant to invest heavily in BEV technology and infrastructure without sufficient consumers [8]. As a result, frequent charging is the most realistic option for EV drivers to eliminate their RA. However, this will accelerate the degradation of the battery and increase the charging cost, such as the charging service fee and the electricity cost. For each EV driver, there is always a trade-off between RA and charging times.
Given current battery technology and charging infrastructure, this study attempts to find out the optimal mileage considering the above trade-off. Firstly, a power function is applied to measure RA mathematically, which is related to the ratio of driven mileage to the EV’s cruising range and the EV driver’s tolerance to RA. Secondly, the objective function is presented, which consists of the RA and the charging times. Finally, two types of optimal mileages are calculated and analyzed. They are the absolute mileage and the relative mileage. The interesting finding is that the increment of EVs’ cruising range increases the optimal absolute mileage but decreases the optimal relative mileage, while the improvement of the driver’s tolerance to RA increases both. Its management insight is that improving the driver’s tolerance, such as by expanding charging infrastructures and raising the driver’s practical experience with EVs, is more effective in increasing the EV’s cruising range.
The present research makes the following contributions. First, unlike previous research that pays more attention to the pre-adoption behavior of EVs, this study is concerned with the charging behavior in the actual use of EVs. Second, prior research mainly focuses on BEV charging strategy from the perspective of the distribution grid, battery lifetime, and charging cost, and this study investigates BEV charging strategy by taking the conflict between charging times and RA into account. Finally, most research measured RA with proxy indicators, such as range limitation cost and the minimum range margin, which ignored the importance of charging infrastructure and driving experience in RA. This study proposes a mathematical model that combines charging infrastructure with driving experience to measure RA.
The remainder of this paper is as follows. Section 2 provides an overview of previous related work. Section 3 presents functions to measure RA, the charging times, and the objective function. Section 4 finds out and analyzes the optimal mileage. Conclusions and suggestions are given in Section 5.

2. Literature Review

This paper is related to the previous research on electric vehicles, range anxiety, and the charging strategy of EVs as follows.

2.1. Electric Vehicles

Electric vehicles (EVs) driven mainly by electricity have the potential to greatly reduce fossil fuel use and curb greenhouse gas emissions, so there is increasing attention on the promotion of EVs. Research on EVs is mainly divided into two aspects:
(1) Research on EV technology. Since the limited range is the most important barrier to the dissemination of EVs [9], many scholars discuss the way to overcome this barrier from a technical perspective. For example, reference [10] argued that the provision of public EV charging infrastructure is an effective way to improve EV range. Reference [11] revealed that in-vehicle information systems are useful for mitigating problems with limited BEV range. Reference [12] reviewed wireless charging systems for EVs, and concluded that EV wireless charging is an important enabling technology to extend the driving range. However, although these technical approaches are promising solutions, they need a lot of time to be developed and implemented. Therefore, the limited range is still the main obstacle to the widespread use of EVs. This study mainly focuses on range anxiety and charging problems caused by the limited range.
(2) Research on the adoption of EVs, which includes EV acceptance, EV purchase, and willingness to pay for EVs. The literature mainly studies the adoption of electric vehicles from two theoretical perspectives. One is the perspective of rational decision-making, in which the theory of planned behavior (TPB) has been widely applied. For example, reference [13] used an extended TPB to predict consumers’ intention to adopt EVs. Reference [14] developed a comprehensive framework based on the TPB to explain the intention of small and medium-sized firms to introduce EVs in commercial vehicle fleets. The other is the perspective of environmental protection behavior, considering the environmental protection nature of electric vehicles. Under this perspective, scholars mainly study the adoption behavior of electric vehicles based on normative activation theory, e.g., reference [15,16,17]. The key factors that influence consumers’ decisions to adopt EVs can be divided into three categories—technical attributes, consumer attributes, and contextual factors. Technical attributes include vehicle ownership costs, driving range, and charging time [18,19,20,21]. Consumer attributes involve education, income, attitude, norms, driving experience, environmental concern, and innovation [22,23,24,25]. Contextual factors include the availability of charging stations, government policy, and fuel prices [26,27,28,29,30]. However, existing research pays more attention to the pre-adoption behavior of EVs, while the post-adoption behavior of EVs, especially the actual usage behavior of EVs, has not been completely investigated. To fill this gap, we are concerned about the charging behavior in the actual use of EVs.

2.2. Range Anxiety

Range anxiety (RA), the fear of fully depleting the BEV battery in the middle of a trip [31,32], has become a widely discussed issue. Research has identified that RA is a potential obstacle to the mass adoption of BEVs. For example, reference [33] found that RA is positively related to range preference, which suggests that RA has a negative impact on the likelihood of purchasing a limited-range BEV.
Recently, many researchers have focused on the way to mitigate RA in BEV drivers and have identified two sets of influence factors of RA: mainly, charging infrastructure and BEV driving experience. Research indicates that charging infrastructure is an important factor in RA. For example, reference [32] found that the significant effect of RA on BEV utility is reduced by access to charging infrastructure. Reference [34] suggested that the deployment of public charging infrastructure is a way to eliminate RA. Some research has used empirical data to examine whether BEV driving experience plays a prominent role in RA. For example, reference [33] conducted a 6-month field trial with 40 EVs leased to volunteer drivers, and showed that drivers’ experience with EVs would reduce RA and lead to higher range satisfaction. Reference [35] carried out an EV field trial in the Berlin metropolitan area in Germany and indicated that experienced drivers of EVs have lower RA than inexperienced. Reference [36] conducted a field experiment with 63 participants and revealed that practical driving experience reduced RA.
Although RA has attracted considerable attention, the measurement method for RA is limited. Some research has quantified RA. For example, reference [37] measured RA with “range limitation cost”, which is defined as the cost and burden of the BEV cruising range not meeting the arranged daily driving distance. Reference [32] used the minimum range margin as a proxy for RA. However, these measurements of RA ignored the roles of charging infrastructure and driving experience. Therefore, we developed a simple power function to measure RA mathematically by taking the effect of both charging infrastructure and driving experience into account.

2.3. Charging Strategy

The charging strategy refers to where and when to refuel vehicles, which is a kind of charge behavior including frequency of charging, charging pattern, and charging location. There are two streams in which researchers investigate BEV charging strategy. The mainstream focuses on the impact of the charging strategy on the distribution grid. For example, reference [38], which reviewed various charging strategies of EVs and analyzed their impacts on power distribution networks, found that coordinated charging is the most proficient and valuable strategy for the grid. Reference [39] pointed out that a load of fast charging is more than double an average household load, which has a great impact on the grid. The other stream studies charging strategies by integrating battery lifetime and charging cost. For example, reference [40] presents an intelligent charge algorithm to optimize EV charging profiles by considering the costs of electricity and battery degradation. Reference [41] compared the influence of different charging strategies on the costs of battery depreciation and electricity and found that appropriate charging strategies can significantly increase battery life and reduce charging costs. Reference [42] showed that smart charging, where the charging load can be shifted throughout the entire day to provide flexibility to the system, can substantially reduce charging costs.
Charging times, the frequency of charging, is one of the charging strategies. The more frequent the charging times, the higher the charging cost and the worse the degradation of the battery will be, but the less the RA will be; or vice versa. That is, the charging times conflict with RA. Therefore, we aim to investigate the trade-off between charging times and RA.

3. Model

Our model is based on the following assumptions. (i) BEVs are in full charge for the first time; (ii) each recharging returns BEVs to full charge state again; (iii) BEVs have a fixed cruising range.
We suppose D (D > 0) is a BEV driver’s total driven mileage during a certain period, e.g., D = 10,000 km during one year. Q (Q > 0) is the fixed cruising range of the BEV, which is the distance traveled after each full charge. Let x denote the driven mileage after each full charge and y = x/Q. We name x as the absolute mileage and y as the relative mileage in this paper. The goal of the model is to find out the optimal x and y with the trade-off between RA and the charging times.

3.1. Range Anxiety Function

The value of x is within the range of 0 to Q. There are two extreme situations. The first is x = 0, which means that a BEV is in a full charge state. Then, the BEV driver has no RA, i.e., RA = 0 (if x = 0). The second is x = Q, which means a BEV is just out of power. Then, the BEV driver has the maximal RA, i.e., RA = 1 (if x = Q). It is evident that RA increases with x monotonically. On the other hand, both charging infrastructure and driving experience influence BEV drivers’ RA to the change of x, i.e., given driven mileage x, BEV drivers who are rich in BEV-driving experience and can conveniently recharge the car with charging infrastructure will have less RA than those who lack driving experience in BEVs or have limited access to charging infrastructure. Thus, we define the RA function as follows.
R A ( x ) = ( x Q ) n , x ( 0 , Q ] ,
where n is defined as the driver’s tolerance to RA, related to the charging infrastructure and the driver’s practical experience with BEVs. Both the expansion of charging infrastructure and the improvement of the driver’s practical experience leads to an increase in the driver’s tolerance to RA.
Owing to the limited battery capacity, we assume that the cruising range of a BEV is 150 km on average. Hence, we consider Q = 150 as the baseline case. Figure 1 shows examples of RA(x) under different n at the baseline case. When n = 1, there is a linear relationship between RA and x. This means that a BEV driver’s RA grows with the driven mileage at a constant rate. When n > 1, it means that a BEV driver has almost no RA less than the mileage, but the RA increases sharply later. For example, if n = 10, we see that RA is almost zero when x < 100 but increases sharply when x > 100.
According to assumption (ii), we take it that a BEV is recharged fully after each x. Then, the BEV driver’s RA is the cumulative sum from 0 to x. Let CRA denote the cumulative RA, so we have:
C R A ( x ) = 0 x R A ( t ) d t = 0 x ( t Q ) n d t = Q n + 1 ( x Q ) n + 1
It is evident that the cumulative RA also increases with x monotonically. As a result, a BEV driver’s decision for x is the less, the better if only the RA is considered.

3.2. Charging Times Function

Suppose a BEV driver travels D mileage during a certain period and he/she fully recharges the battery after each x mileage. Let N denote the charging times during the period, so we have:
N ( x ) = D x , x ( 0 , Q ]
Since D is a constant, it is evident that the charging time has an inverse relationship with the driven mileage. The less x is, the more N will be, and then the higher the charging cost and the worse the degradation of the battery will be. As a result, a BEV driver’s decision for x is the more the better if the charging time is only considered.

3.3. The Objective Function

Drivers usually alleviate RA by increasing charging times, but they need to reduce charging times in consideration of drivers’ overall interests. Therefore, based on functions of cumulative RA and charging times, we establish an objective function to balance the two.
Since the cumulative RA and the charging times have different dimensions, we apply 0–1 standardization to them at first.
For standardization on CRA(x), we obtain CRA0–1(x):
C R A 0 1 ( x ) = C R A ( x ) × n + 1 Q = ( x Q ) n + 1 , x [ 1 , Q ]
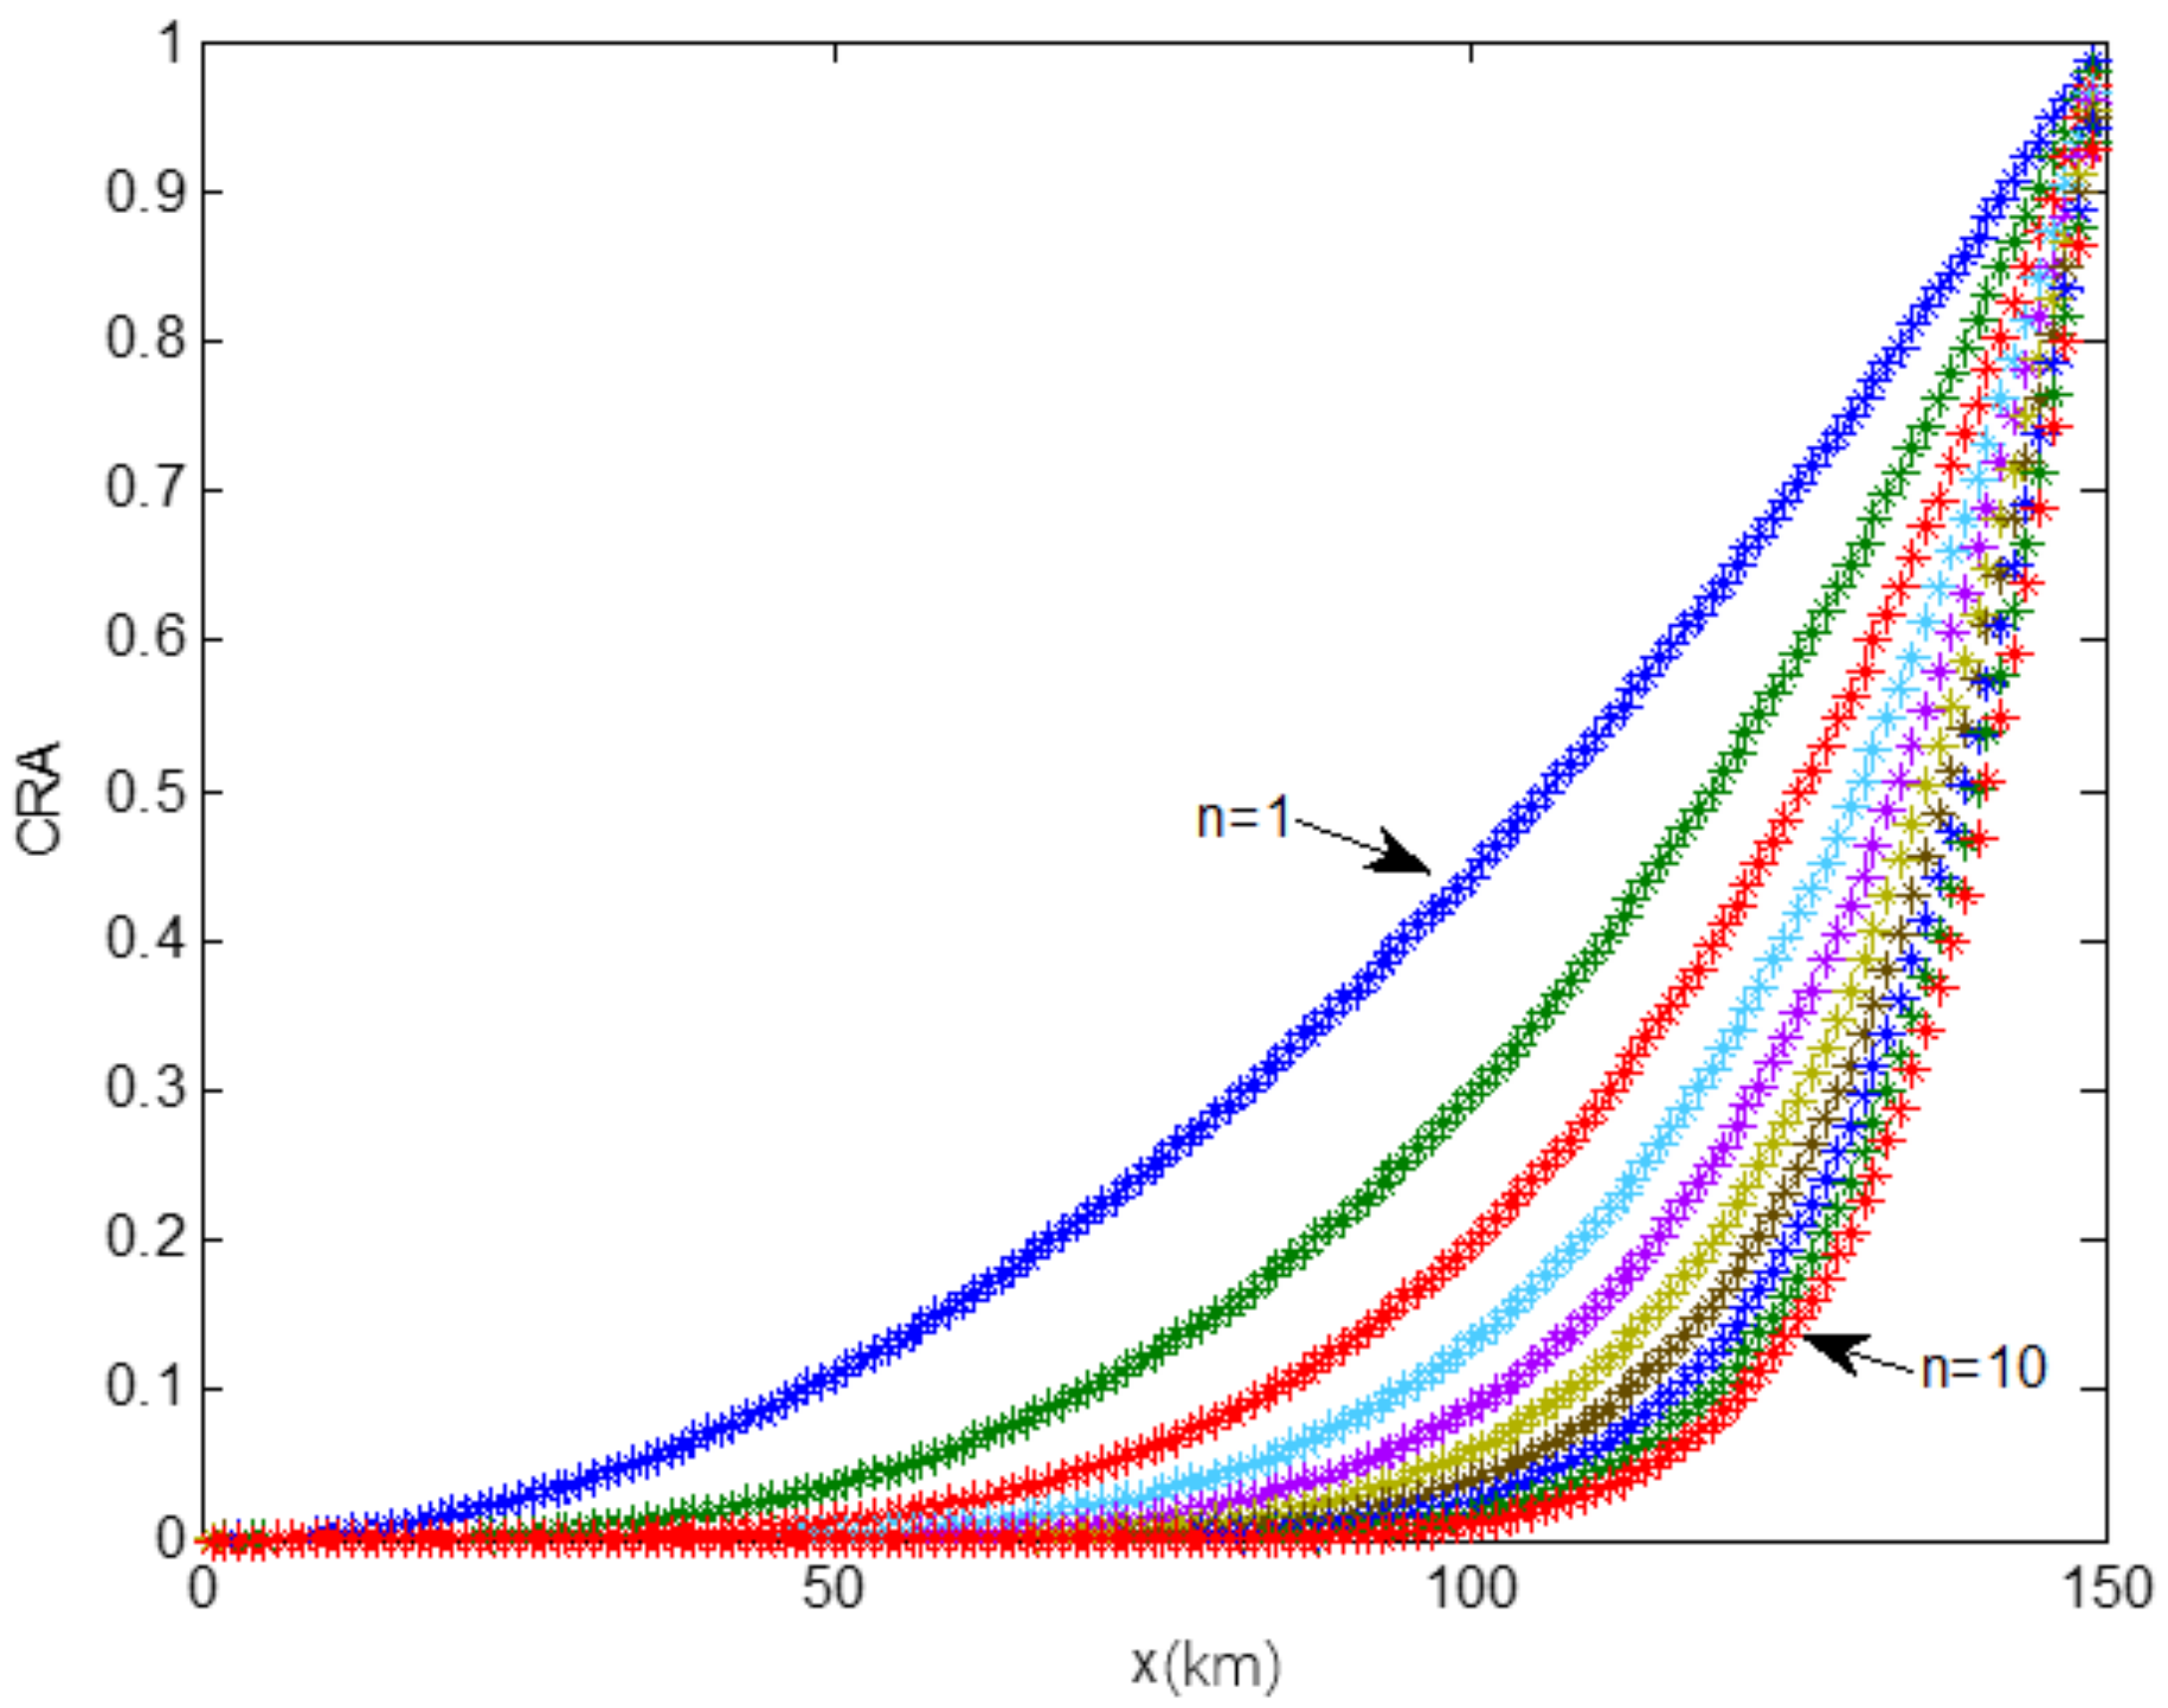
Then, we have C R A 0 1 ( x = 1 ) = ( 1 Q ) n + 1 , C R A 0 1 ( x = Q ) = 1 . Figure 2 gives the CRA0–1(x) in the baseline.
Likewise, with standardization on N(x), we obtain N0–1(x):
N 0 1 ( x ) = N ( x ) D = 1 x , x [ 1 , Q ]
Then, we have N 0 1 ( x = 1 ) = 1 , N 0 1 ( x = Q ) = 1 Q . Figure 3 gives the N0–1(x) in the baseline.
By combining CRA0–1(x) and N0–1(x), we have the objective function.
T ( x ) = C R A 0 1 ( x ) + N 0 1 ( x ) = ( x Q ) n + 1 + 1 x
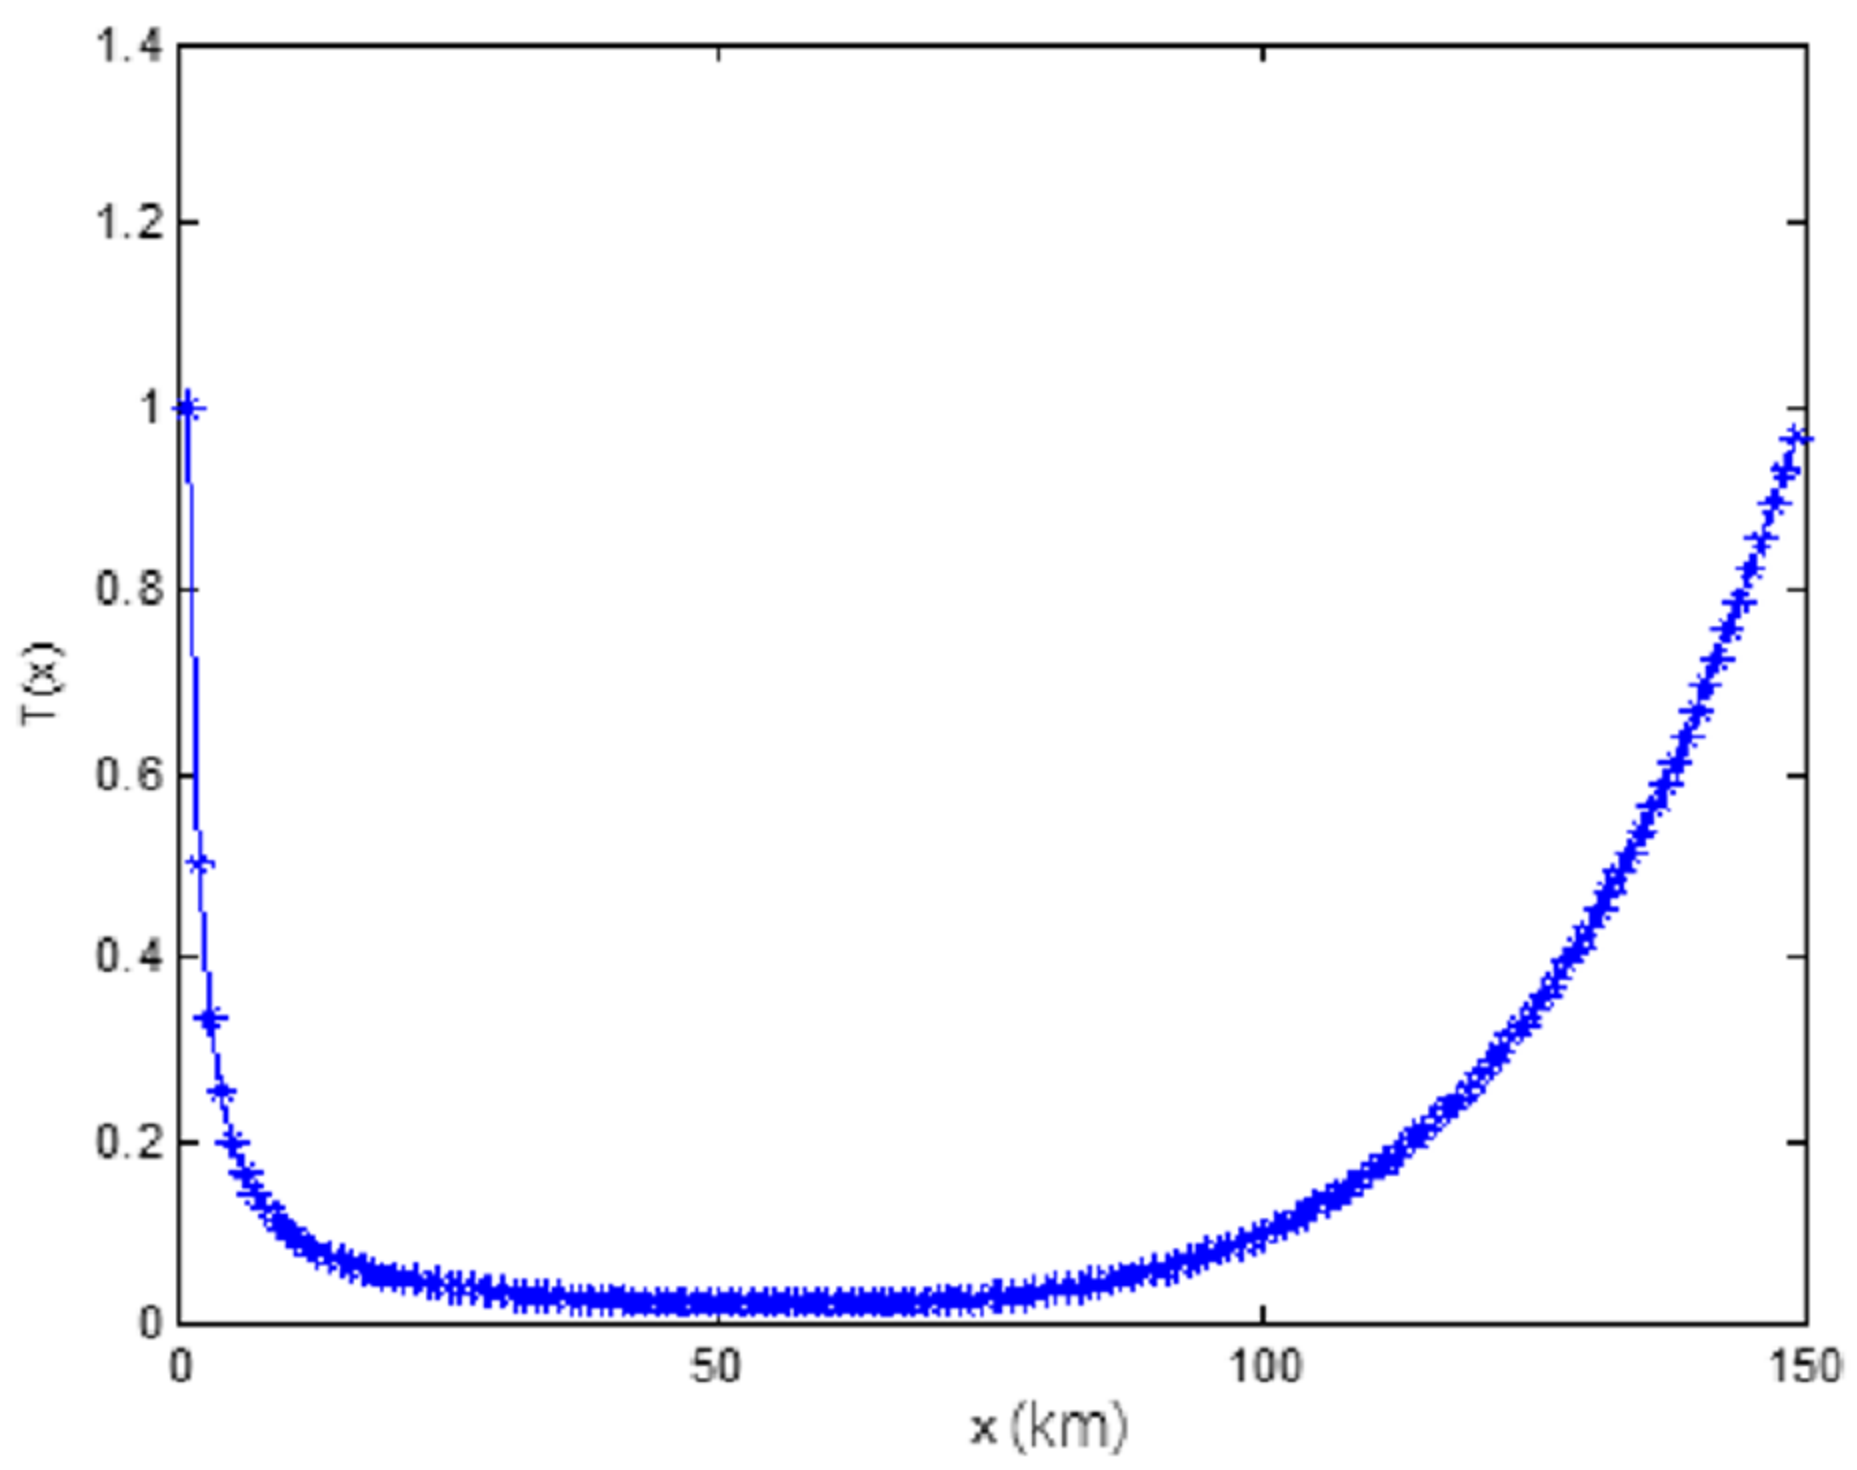
In Figure 4, in the baseline case, the plot of T(x) is a shape of ‘U’ with n = 5. T(x) increases sharply towards 1 as x is close to 0 or contrary to 150, while during the remaining interval it falls steadily to 0 as x increases. This indicates that neither reducing the absolute mileage for alleviating RA nor increasing it to decrease charging times is an optimal solution.

4. Analysis and Result

In this section, we attempt to solve two types of optimal mileages which are optimal absolute mileage and optimal relative mileage. Relative mileage is described as the ratio of absolute mileage to a BEV’s cruising range. The result of the solution is also plotted with MATLAB software and analyzed.

4.1. Optimal Absolute Mileage

The value of absolute mileage affects both RA and charging times, but they change in opposite directions in response to increasing absolute mileage. Therefore, there must be an optimal absolute mileage for drivers.
To find out the optimal absolute mileage, we minimize the objective function by a first-order derivative of T ( x ) concerning x. Then, we have T ( x ) x = n + 1 Q ( x Q ) n 1 x 2 with T ( x ) x = 0 , and we have the optimal x:
x * = Q n + 1 n + 1 n + 2
where the optimal mileage ( x * ) refers to a BEV’s cruising range (Q) and drivers’ tolerance to RA (n). It is worthwhile to study the influence of the cruising range and drivers’ tolerance to RA on the optimal mileage, i.e., how the optimal mileage changes with a change in parameters Q or n. This is conducted by the first-order derivative of x* concerning Q and n, respectively.
x * Q = Q 1 / ( n + 2 ) ( n + 2 ) ( n + 1 ) ( n + 1 ) / ( n + 2 ) > 0
x * n = x * n { ln [ ( n + 1 ) Q ] 1 } + { ln [ ( n + 1 ) Q ] 2 } ( n + 1 ) ( n + 2 ) 2 > 0
Since Q > 50, we have ln [ ( n + 1 ) Q ] ln Q > ln 50 > 3.9 > 2 .
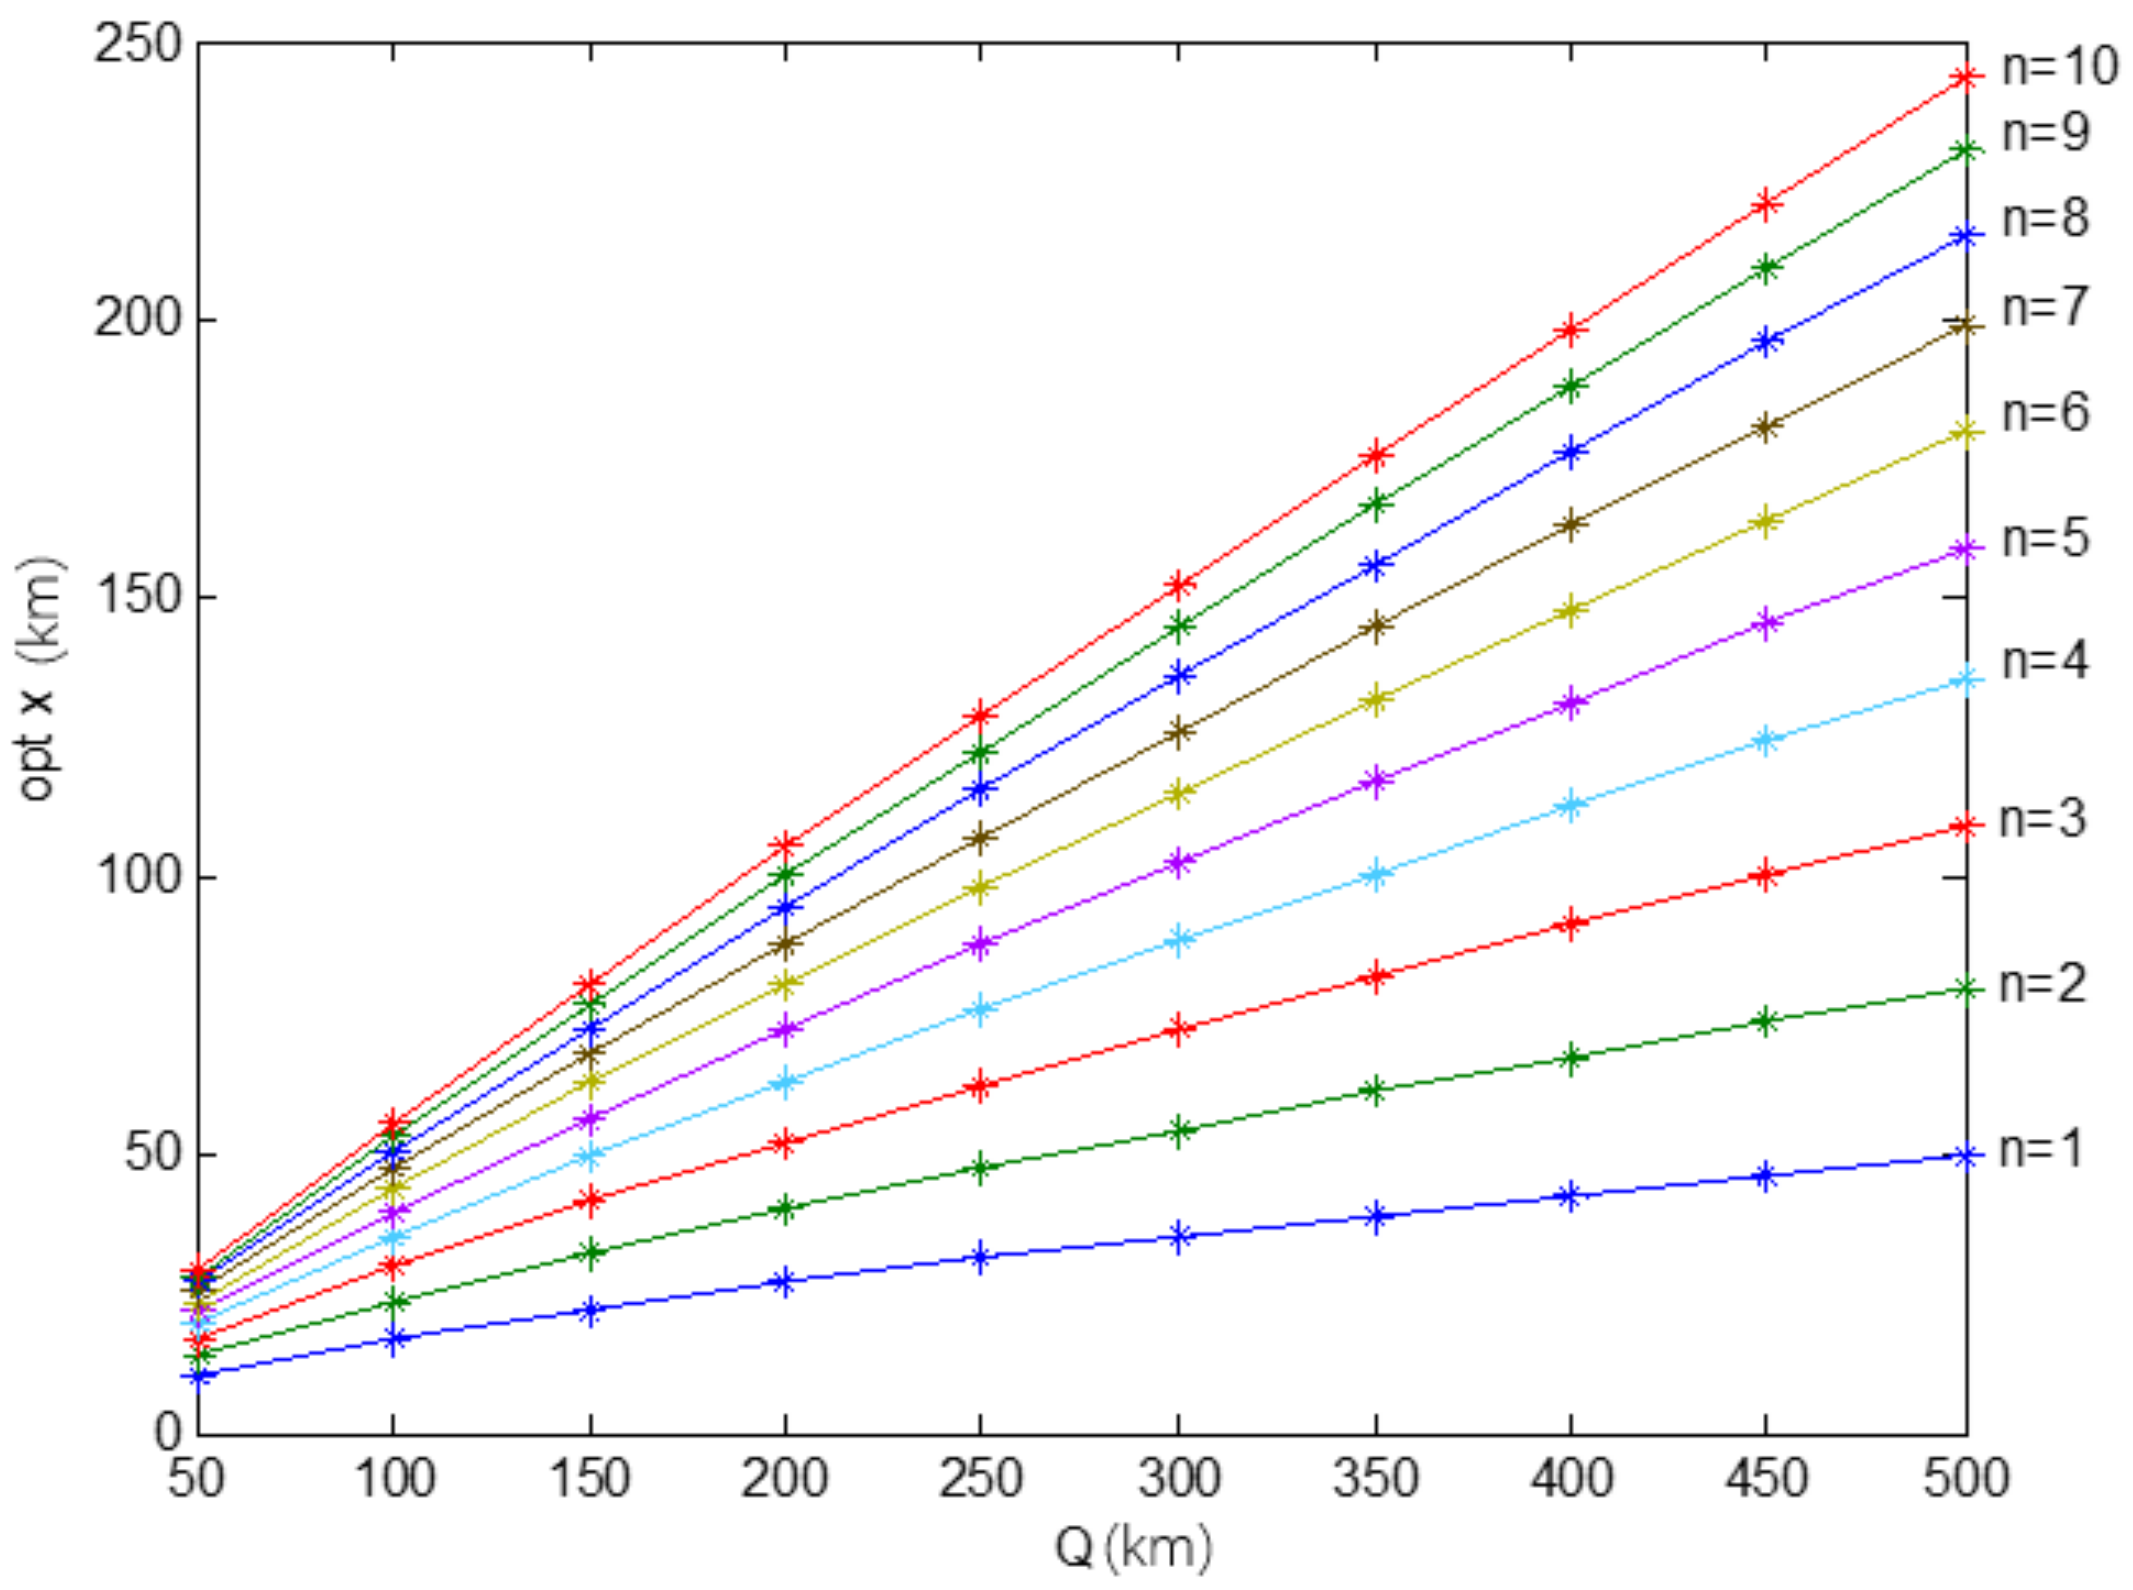
As shown in Figure 5, the optimal mileage (x*) increases with the increment of the cruising range (Q). For example, selecting a driver whose tolerance to RA is 5 (n = 5) when the cruising range (Q) is 50 km, his optimal absolute mileage is 22.1358 km, and it becomes 56.7619 km when the cruising range is enhanced to 150 km. This implies that the increment of BEVs’ cruising range contributes to a rise in the optimal absolute mileage. Intuitively, in the case where BEVs’ cruising range is enhanced, drivers would travel longer before recharging, and their charging times would be reduced at a given total annual driven mileage.
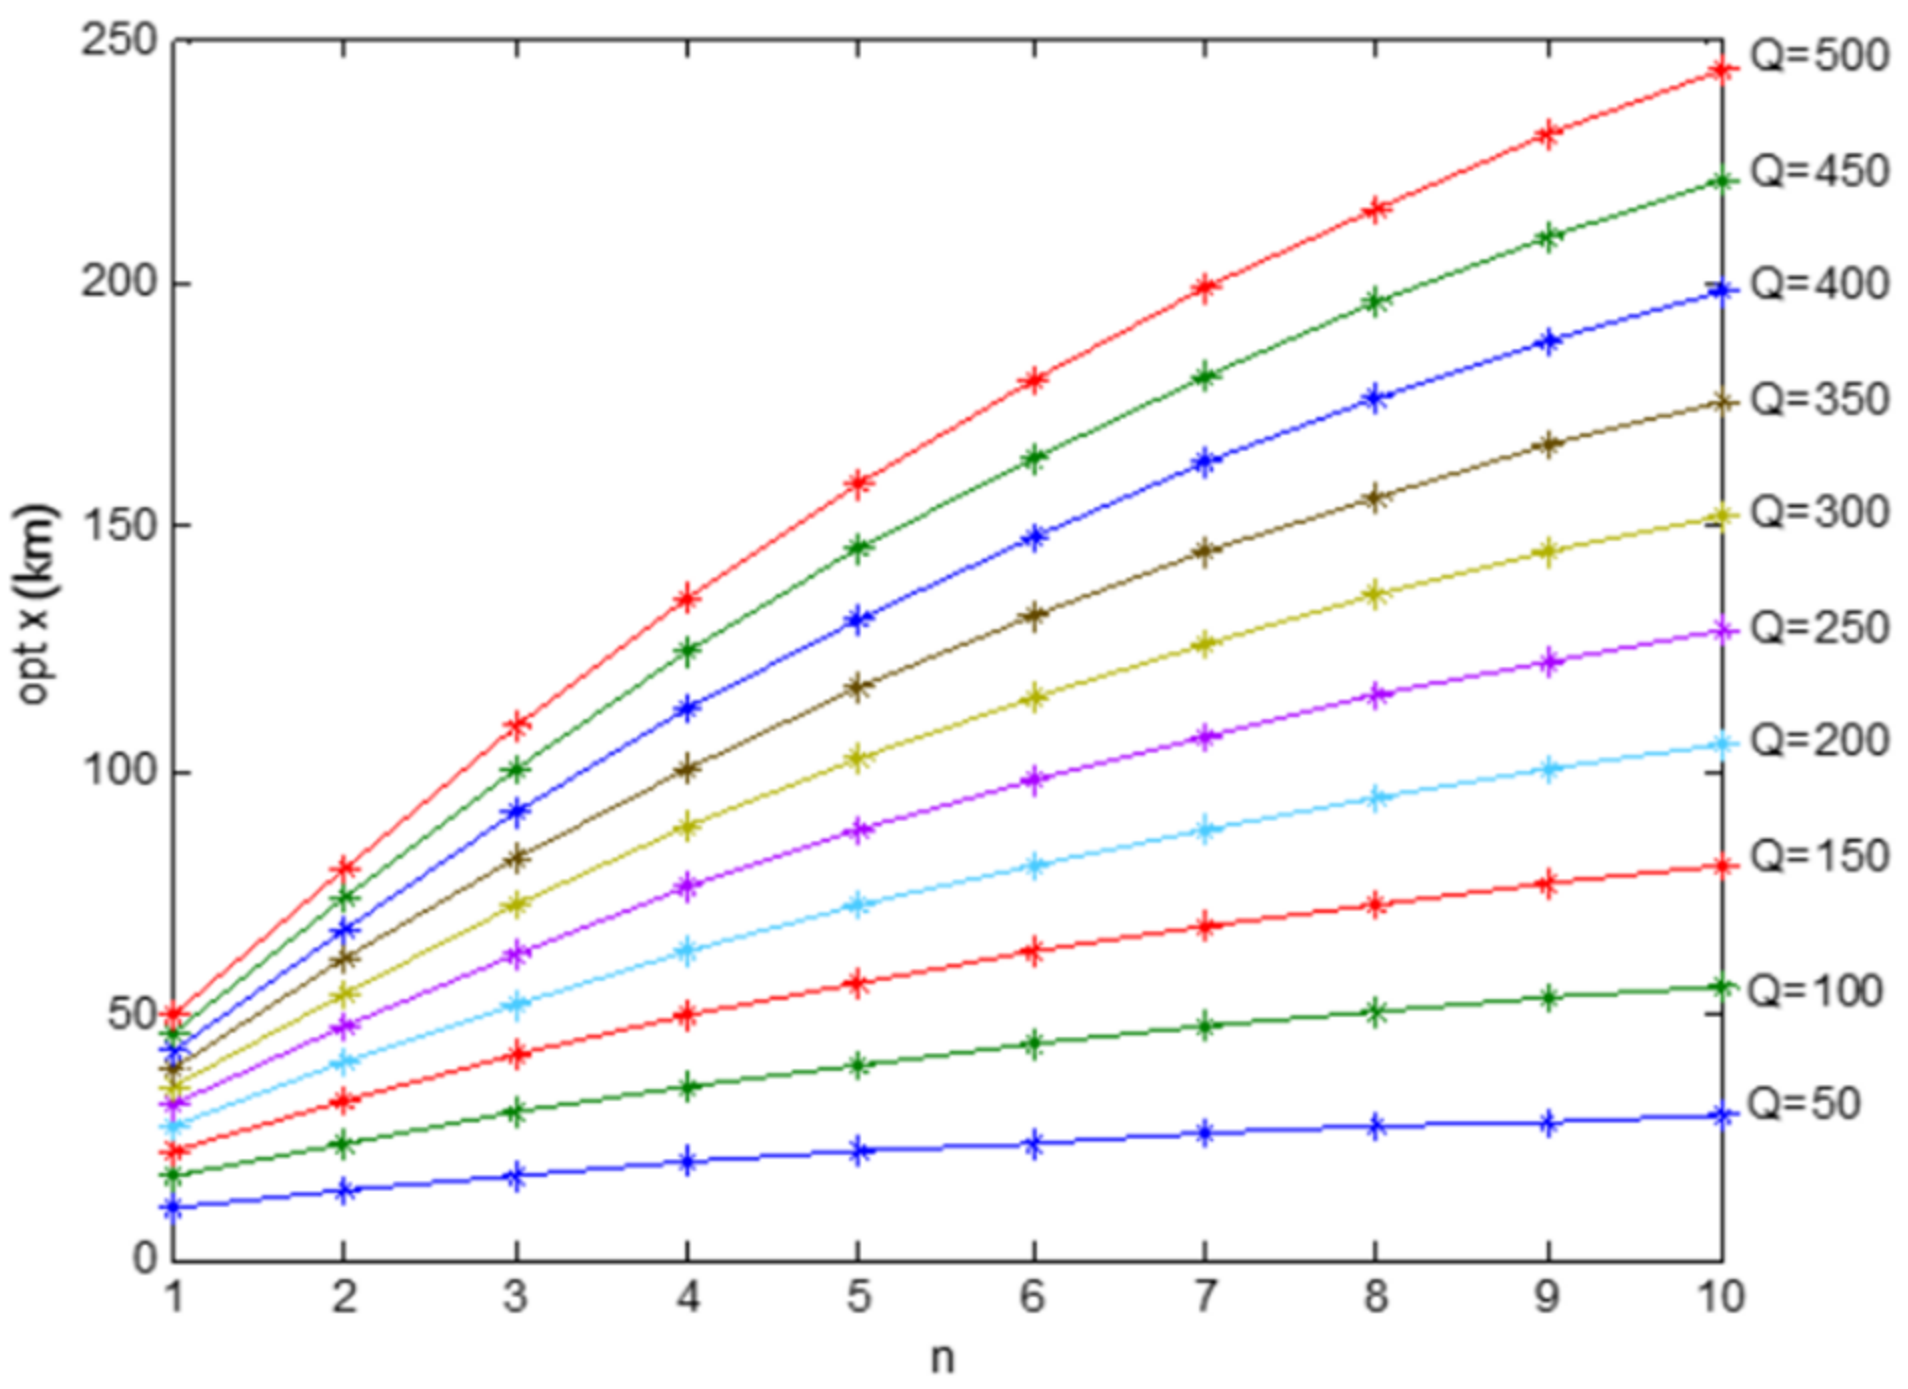
In Figure 6, we can see that the optimal mileage (x*) increases rapidly at the beginning, and then slowly as the driver’s tolerance to RA (n) increases. In the baseline case, the optimal mileage is 22.4070 km at n = 1 and increases to 243.9344 km as n increases to 10. This suggests that improving the driver’s tolerance to RA could increase the optimal absolute mileage. That is, if the charging infrastructure is sufficient to enable drivers to easily obtain charge, drivers will no longer worry about the BEV’s power loss as before, and they will increase the absolute mileage and reduce the charging times. Meanwhile, drivers’ practical experience of BEVs can make them more confident in driving BEVs and then this reduces both RA and charging times, thus bringing a higher optimal absolute mileage.

4.2. Optimal Relative Mileage

Now, we explore the effectiveness of the two strategies: increasing BEVs’ cruising range and improving drivers’ tolerance to RA. We use the optimal relative mileage to measure the effectiveness, considering that relative mileage is the ratio of absolute mileage to BEVs’ cruising range. The optimal relative mileage can be expressed by y * = x * Q , then,
y * = x * Q = 1 ( n + 1 ) Q n + 2
An issue of interest is how the optimal relative mileage (y*) changes in response to the changing parameters of the cruising range (Q) and the driver’s tolerance to RA (n). If the change of a parameter results in a higher optimal relative mileage, it means that the strategy is favorable to drivers. The first-order derivative of y* concerning Q and n are, respectively,
y * Q = Q ( n + 3 ) / ( n + 2 ) ( n + 2 ) ( n + 1 ) 1 / ( n + 2 ) < 0
y * n = y * n { ln [ ( n + 1 ) Q ] 1 } + { ln [ ( n + 1 ) Q ] 2 } ( n + 1 ) ( n + 2 ) 2 > 0
Since Q > 50, we have:
ln [ ( n + 1 ) Q ] ln Q > ln 50 > 3.9 > 2
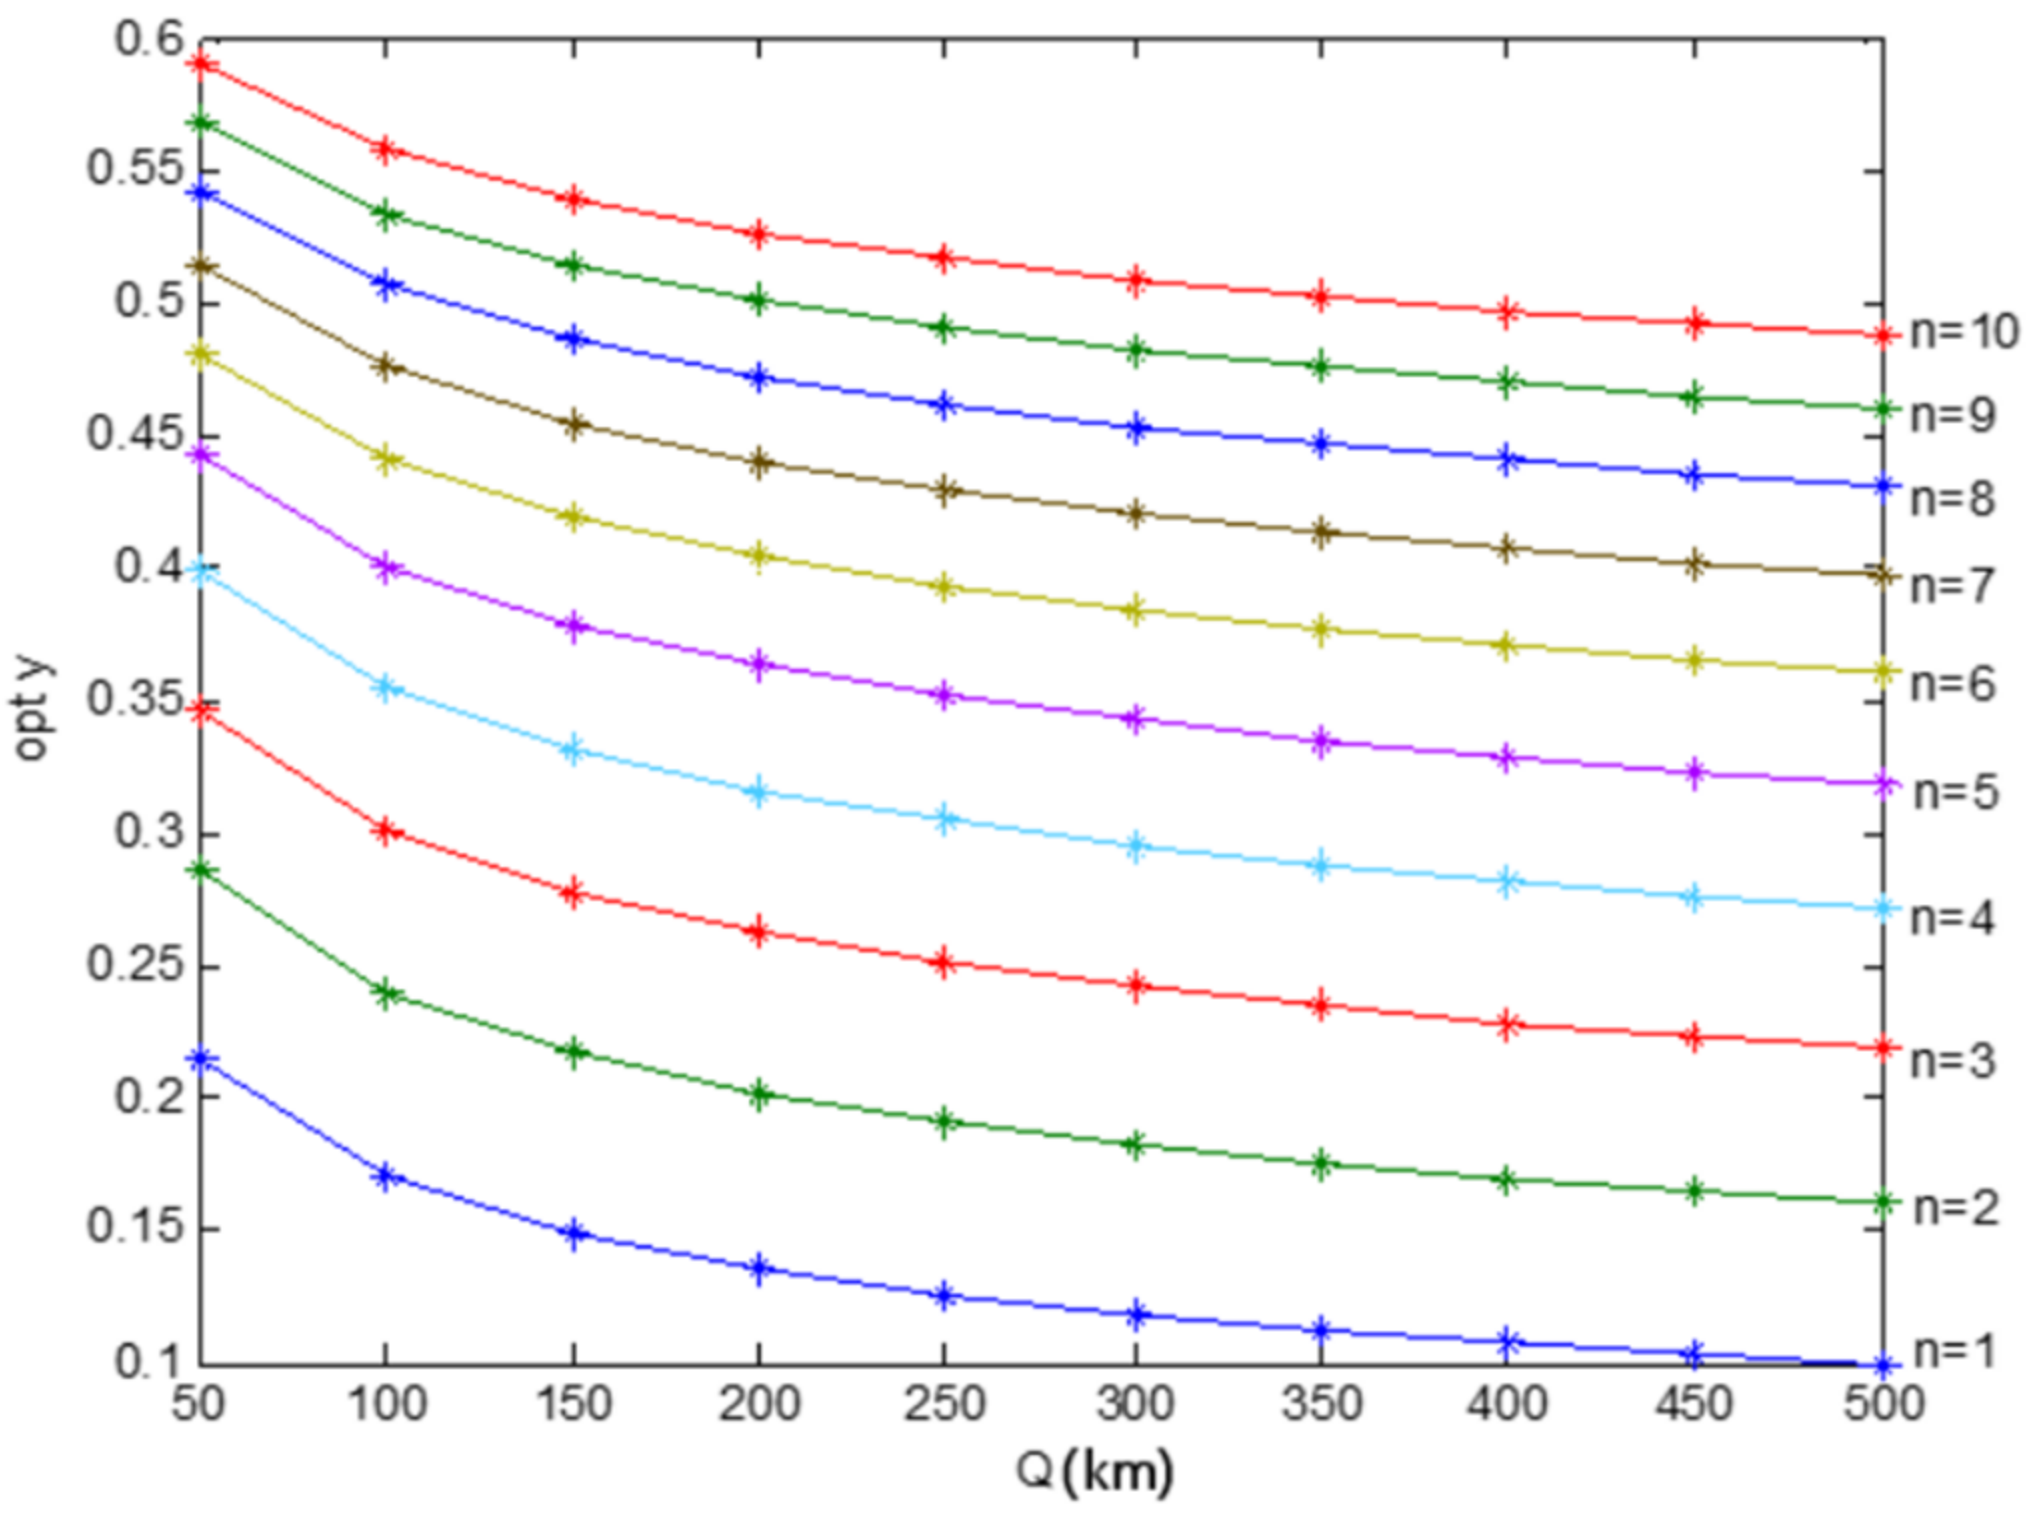
Interestingly, the optimal relative mileage (y*) decreases with the increment of the cruising range (Q), as shown in Figure 7. For drivers with moderate tolerance to RA, suppose n = 5, their optimal relative mileage is 44.27% at Q = 50, it is 37.84% in the baseline case and decreases to 31.86% as Q increases to 500. This suggests that the increment of the cruising range is not a favorable strategy for drivers. In practice, increasing the BEVs cruising range will increase the purchase cost for drivers, while the optimal relative mileage being reduced means the cruising range has not been fully used. Thus, from the perspective of BEVs adoption, increasing BEVs cruising range would make it hard for drivers.
Figure 8 shows that the optimal relative mileage (y*) increases with the driver’s tolerance to RA (n). In the baseline case, it rises from 14.94% to 53.94% over the range n ∈ [1,10]. This implies that improving drivers’ tolerance to RA, such as expanding charging infrastructures and raising drivers’ practical experience with BEVs, is an effective strategy to alleviate drivers’ RA and reduce their charging times.

5. Conclusions

This paper studied BEV drivers’ optimal mileage for the trade-off between RA and charging times. We considered that BEV drivers, in practice, may get rid of RA by increasing charging times for cars being in “comfortable range”, but they will bear more costs of charging and battery degradation. Since RA is mainly affected by BEV cruising range, charging infrastructure, and drivers’ experience, we measured BEV drivers’ RA with a function related to the ratio of driven mileage to BEV’s cruising range and BEV driver’s tolerance to RA. We then developed the objective function consisting of models of RA and charging times, which was minimized to find the optimal driven mileage for BEV drivers. In addition, we analyzed the impacts of BEV cruising range and drivers’ tolerance to RA on two types of optimal mileages, that is, optimal absolute mileage and optimal relative mileage. The former is the driven mileage before each full charge and the latter is the ratio of absolute mileage to EVs’ cruising range.
The results show that the optimal absolute mileage increases with the BEV cruising range and drivers’ tolerance to RA; interestingly, the optimal relative mileage increases with drivers’ tolerance to RA but decreases with BEV cruising range. This indicates that BEV drivers would take a longer trip with a longer cruising range before a charge, but the increment of BEVs’ cruising range leads to the inefficient use of range because of optimal charging with more remaining range. Notably, improving the driver’s tolerance to RA, such as by expanding charging infrastructures and raising drivers’ practical experience with BEVs, is an effective way to promote drivers’ travel with less anxiety and reduce their charging behavior.
This study has several limitations. One of the limitations is the assumption that drivers fully charge BEVs at each recharge without considering charging opportunity and charging situation. We also ignore the effect of BEVs’ auxiliary devices consumption on the cruising range. One may further the study by relaxing such assumption and taking BEV drivers’ usage behavior into account. Furthermore, the simple power function to measure range anxiety may need to be validated. Additionally, BEV cruising range needs to be properly determined, because the increment of range alleviates range anxiety but declines the range efficiency.

Author Contributions

Conceptualization and methodology, X.H. and Y.H.; writing—original draft X.H.; review and editing, X.H. and Y.H. All authors have read and agreed to the published version of the manuscript.

Funding

The work was supported by the General Project of Hubei Provincial Department of Education (No. 20Y084 and 20Q065) and the National Natural Science Foundation of China (NSFC) (No.72072139).

Data Availability Statement

Not applicable.

Conflicts of Interest

The authors declare no conflict of interest.

Nomenclature

AbbreviationMeaning
EVElectric vehicle
RARange anxiety
CRACumulative range anxiety
DDriver’s total driven mileage
QFixed cruising range of BEV
xAbsolute mileage (the driven mileage after each full charge)
yRelative mileage (the ratio of x and Q)
NCharging times
nDriver’s tolerance to range anxiety

References

  1. Daramy-Williams, E.; Anable, J.; Grant-Muller, S. A Systematic Review of the Evidence on Plug-in Electric Vehicle User Experience. Transp. Res. Part D Transp. Environ. 2019, 71, 22–36. [Google Scholar] [CrossRef] [Green Version]
  2. Zhang, B.; Niu, N.; Li, H.; Wang, Z.; He, W. Could Fast Battery Charging Effectively Mitigate Range Anxiety in Electric Vehicle Usage?Evidence from Large-Scale Data on Travel and Charging in Beijing. Transp. Res. Part D Transp. Environ. 2021, 95, 102840. [Google Scholar] [CrossRef]
  3. Jung, M.F.; Sirkin, D.; Gür, T.M.; Steinert, M. Displayed Uncertainty Improves Driving Experience and Behavior: The Case of Range Anxiety in an Electric Car. In Proceedings of the 33rd Annual ACM Conference on Human Factors in Computing Systems—CHI ’15, Seoul, Republic of Korea, 18–23 April 2015; ACM Press: Seoul, Republic of Korea, 2015; pp. 2201–2210. [Google Scholar]
  4. Xie, C.; Wu, X.; Boyles, S. Network Equilibrium of Electric Vehicles with Stochastic Range Anxiety. In Proceedings of the 17th International IEEE Conference on Intelligent Transportation Systems (ITSC), Qingdao, China, 8–11 October 2014; pp. 2505–2510. [Google Scholar]
  5. Melliger, M.A.; van Vliet, O.P.R.; Liimatainen, H. Anxiety vs. Reality—Sufficiency of Battery Electric Vehicle Range in Switzerland and Finland. Transp. Res. Part D Transp. Environ. 2018, 65, 101–115. [Google Scholar] [CrossRef]
  6. Singh, V.; Singh, V.; Vaibhav, S. A Review and Simple Meta-Analysis of Factors Influencing Adoption of Electric Vehicles. Transp. Res. Part D: Transp. Environ. 2020, 86, 102436. [Google Scholar] [CrossRef]
  7. Bonges, H.A.; Lusk, A.C. Addressing Electric Vehicle (EV) Sales and Range Anxiety through Parking Layout, Policy and Regulation. Transp. Res. Part A Policy Pract. 2016, 83, 63–73. [Google Scholar] [CrossRef] [Green Version]
  8. Struben, J.; Sterman, J.D. Transition Challenges for Alternative Fuel Vehicle and Transportation Systems. Environ. Plan. B Plan. Des. 2008, 35, 1070–1097. [Google Scholar] [CrossRef]
  9. Bühler, F.; Cocron, P.; Neumann, I.; Franke, T.; Krems, J.F. Is EV Experience Related to EV Acceptance? Results from a German Field Study. Transp. Res. Part F Traffic Psychol. Behav. 2014, 25, 34–49. [Google Scholar] [CrossRef]
  10. Chen, T.D.; Wang, Y.; Kockelman, K.M. Where Are the Electric Vehicles? A Spatial Model for Vehicle-Choice Count Data. J. Transp. Geogr. 2015, 43, 181–188. [Google Scholar] [CrossRef] [Green Version]
  11. Eisel, M.; Nastjuk, I.; Kolbe, L.M. Understanding the Influence of In-Vehicle Information Systems on Range Stress—Insights from an Electric Vehicle Field Experiment. Transp. Res. Part F Traffic Psychol. Behav. 2016, 43, 199–211. [Google Scholar] [CrossRef]
  12. Amjad, M.; Farooq-i-Azam, M.; Ni, Q.; Dong, M.; Ansari, E.A. Wireless Charging Systems for Electric Vehicles. Renew. Sustain. Energy Rev. 2022, 167, 112730. [Google Scholar] [CrossRef]
  13. Wang, S.; Fan, J.; Zhao, D.; Yang, S.; Fu, Y. Predicting Consumers’ Intention to Adopt Hybrid Electric Vehicles: Using an Extended Version of the Theory of Planned Behavior Model. Transportation 2016, 43, 123–143. [Google Scholar] [CrossRef]
  14. Kaplan, S.; Gruber, J.; Reinthaler, M.; Klauenberg, J. Intentions to Introduce Electric Vehicles in the Commercial Sector: A Model Based on the Theory of Planned Behaviour. Res. Transp. Econ. 2016, 55, 12–19. [Google Scholar] [CrossRef]
  15. Asadi, S.; Nilashi, M.; Samad, S.; Abdullah, R.; Mahmoud, M.; Alkinani, M.H.; Yadegaridehkordi, E. Factors Impacting Consumers’ Intention toward Adoption of Electric Vehicles in Malaysia. J. Clean. Prod. 2020, 282, 124474. [Google Scholar] [CrossRef]
  16. He, X.; Zhan, W. How to Activate Moral Norm to Adopt Electric Vehicles in China? An Empirical Study Based on Extended Norm Activation Theory. J. Clean. Prod. 2018, 172, 3546–3556. [Google Scholar] [CrossRef]
  17. Nordlund, A.; Jansson, J.; Westin, K. New Transportation Technology: Norm Activation Processes and the Intention to Switch to an Electric/Hybrid Vehicle. Transp. Res. Procedia 2016, 14, 2527–2536. [Google Scholar] [CrossRef] [Green Version]
  18. Carley, S.; Krause, R.M.; Lane, B.W.; Graham, J.D. Intent to Purchase a Plug-in Electric Vehicle: A Survey of Early Impressions in Large US Cites. Transp. Res. Part D Transp. Environ. 2013, 18, 39–45. [Google Scholar] [CrossRef]
  19. Egbue, O.; Long, S. Barriers to Widespread Adoption of Electric Vehicles: An Analysis of Consumer Attitudes and Perceptions. Energy Policy 2012, 48, 717–729. [Google Scholar] [CrossRef]
  20. Graham-Rowe, E.; Gardner, B.; Abraham, C.; Skippon, S.; Dittmar, H.; Hutchins, R.; Stannard, J. Mainstream Consumers Driving Plug-in Battery-Electric and Plug-in Hybrid Electric Cars: A Qualitative Analysis of Responses and Evaluations. Transp. Res. Part A Policy Pract. 2012, 46, 140–153. [Google Scholar] [CrossRef]
  21. Jensen, A.F.; Cherchi, E.; Mabit, S.L. On the Stability of Preferences and Attitudes before and after Experiencing an Electric Vehicle. Transp. Res. Part D: Transp. Environ. 2013, 25, 24–32. [Google Scholar] [CrossRef] [Green Version]
  22. He, X.; Zhan, W.; Hu, Y. Consumer Purchase Intention of Electric Vehicles in China: The Roles of Perception and Personality. J. Clean. Prod. 2018, 204, 1060–1069. [Google Scholar] [CrossRef]
  23. Chu, W.; Im, M.; Song, M.R.; Park, J. Psychological and Behavioral Factors Affecting Electric Vehicle Adoption and Satisfaction: A Comparative Study of Early Adopters in China and Korea. Transp. Res. Part D Transp. Environ. 2019, 76, 1–18. [Google Scholar] [CrossRef]
  24. Xu, G.; Wang, S.; Zhao, D. Transition to Sustainable Transport: Understanding the Antecedents of Consumer’s Intention to Adopt Electric Vehicles from the Emotional Research Perspective. Env. Sci. Pollut. Res. 2021, 28, 20362–20374. [Google Scholar] [CrossRef] [PubMed]
  25. Yan, Q.; Qin, G.; Zhang, M.; Xiao, B. Research on Real Purchasing Behavior Analysis of Electric Cars in Beijing Based on Structural Equation Modeling and Multinomial Logit Model. Sustainability 2019, 11, 5870. [Google Scholar] [CrossRef] [Green Version]
  26. Yang, S.; Cheng, P.; Li, J.; Wang, S. Which Group Should Policies Target? Effects of Incentive Policies and Product Cognitions for Electric Vehicle Adoption among Chinese Consumers. Energy Policy 2019, 135, 111009. [Google Scholar] [CrossRef]
  27. He, H.; Fan, J.; Li, Y.; Li, J. When to Switch to a Hybrid Electric Vehicle: A Replacement Optimisation Decision. J. Clean. Prod. 2017, 148, 295–303. [Google Scholar] [CrossRef]
  28. Nazari, F.; Mohammadian, A.K.; Stephens, T. Modeling Electric Vehicle Adoption Considering a Latent Travel Pattern Construct and Charging Infrastructure. Transp. Res. Part D Transp. Environ. 2019, 72, 65–82. [Google Scholar] [CrossRef]
  29. Qiu, Y.Q.; Zhou, P.; Sun, H.C. Assessing the Effectiveness of City-Level Electric Vehicle Policies in China. Energy Policy 2019, 130, 22–31. [Google Scholar] [CrossRef]
  30. Wang, N.; Tang, L.; Pan, H. A Global Comparison and Assessment of Incentive Policy on Electric Vehicle Promotion. Sustain. Cities Soc. 2019, 44, 597–603. [Google Scholar] [CrossRef]
  31. Pevec, D.; Babic, J.; Carvalho, A.; Ghiassi-Farrokhfal, Y.; Ketter, W.; Podobnik, V. A Survey-Based Assessment of How Existing and Potential Electric Vehicle Owners Perceive Range Anxiety. J. Clean. Prod. 2020, 276, 122779. [Google Scholar] [CrossRef]
  32. Neubauer, J.; Wood, E. The Impact of Range Anxiety and Home, Workplace, and Public Charging Infrastructure on Simulated Battery Electric Vehicle Lifetime Utility. J. Power Sources 2014, 257, 12–20. [Google Scholar] [CrossRef]
  33. Franke, T.; Krems, J.F. What Drives Range Preferences in Electric Vehicle Users? Transp. Policy 2013, 30, 56–62. [Google Scholar] [CrossRef]
  34. Dong, J.; Liu, C.; Lin, Z. Charging Infrastructure Planning for Promoting Battery Electric Vehicles: An Activity-Based Approach Using Multiday Travel Data. Transp. Res. Part C Emerg. Technol. 2014, 38, 44–55. [Google Scholar] [CrossRef] [Green Version]
  35. Rauh, N.; Franke, T.; Krems, J.F. Understanding the Impact of Electric Vehicle Driving Experience on Range Anxiety. Hum. Factors 2015, 57, 177–187. [Google Scholar] [CrossRef]
  36. Rauh, N.; Günther, M.; Krems, J.F. Positive Influence of Practical Electric Vehicle Driving Experience and Range Related Knowledge on Drivers’ Experienced Range Stress. Transp. Res. Part F Traffic Psychol. Behav. 2020, 71, 182–197. [Google Scholar] [CrossRef]
  37. Lin, Z. Optimizing and Diversifying Electric Vehicle Driving Range for U.S. Drivers. Transp. Sci. 2014, 48, 635–650. [Google Scholar] [CrossRef]
  38. Habib, S.; Kamran, M.; Rashid, U. Impact Analysis of Vehicle-to-Grid Technology and Charging Strategies of Electric Vehicles on Distribution Networks—A Review. J. Power Sources 2015, 277, 205–214. [Google Scholar] [CrossRef]
  39. Shireen, W.; Patel, S. Plug-in Hybrid Electric Vehicles in the Smart Grid Environment. In Proceedings of the IEEE PES T&D 2010, New Orleans, LA, USA, 19–22 April 2010; pp. 1–4. [Google Scholar]
  40. Hoke, A.; Brissette, A.; Maksimović, D.; Pratt, A.; Smith, K. Electric Vehicle Charge Optimization Including Effects of Lithium-Ion Battery Degradation. In Proceedings of the 2011 IEEE Vehicle Power and Propulsion Conference, Chicago, IL, USA, 6–9 September 2011; pp. 1–8. [Google Scholar]
  41. Lunz, B.; Yan, Z.; Gerschler, J.B.; Sauer, D.U. Influence of Plug-in Hybrid Electric Vehicle Charging Strategies on Charging and Battery Degradation Costs. Energy Policy 2012, 46, 511–519. [Google Scholar] [CrossRef]
  42. Schwab, J.; Sölch, C.; Zöttl, G. Electric Vehicle Cost in 2035: The Impact of Market Penetration and Charging Strategies. Energy Econ. 2022, 114, 106263. [Google Scholar] [CrossRef]
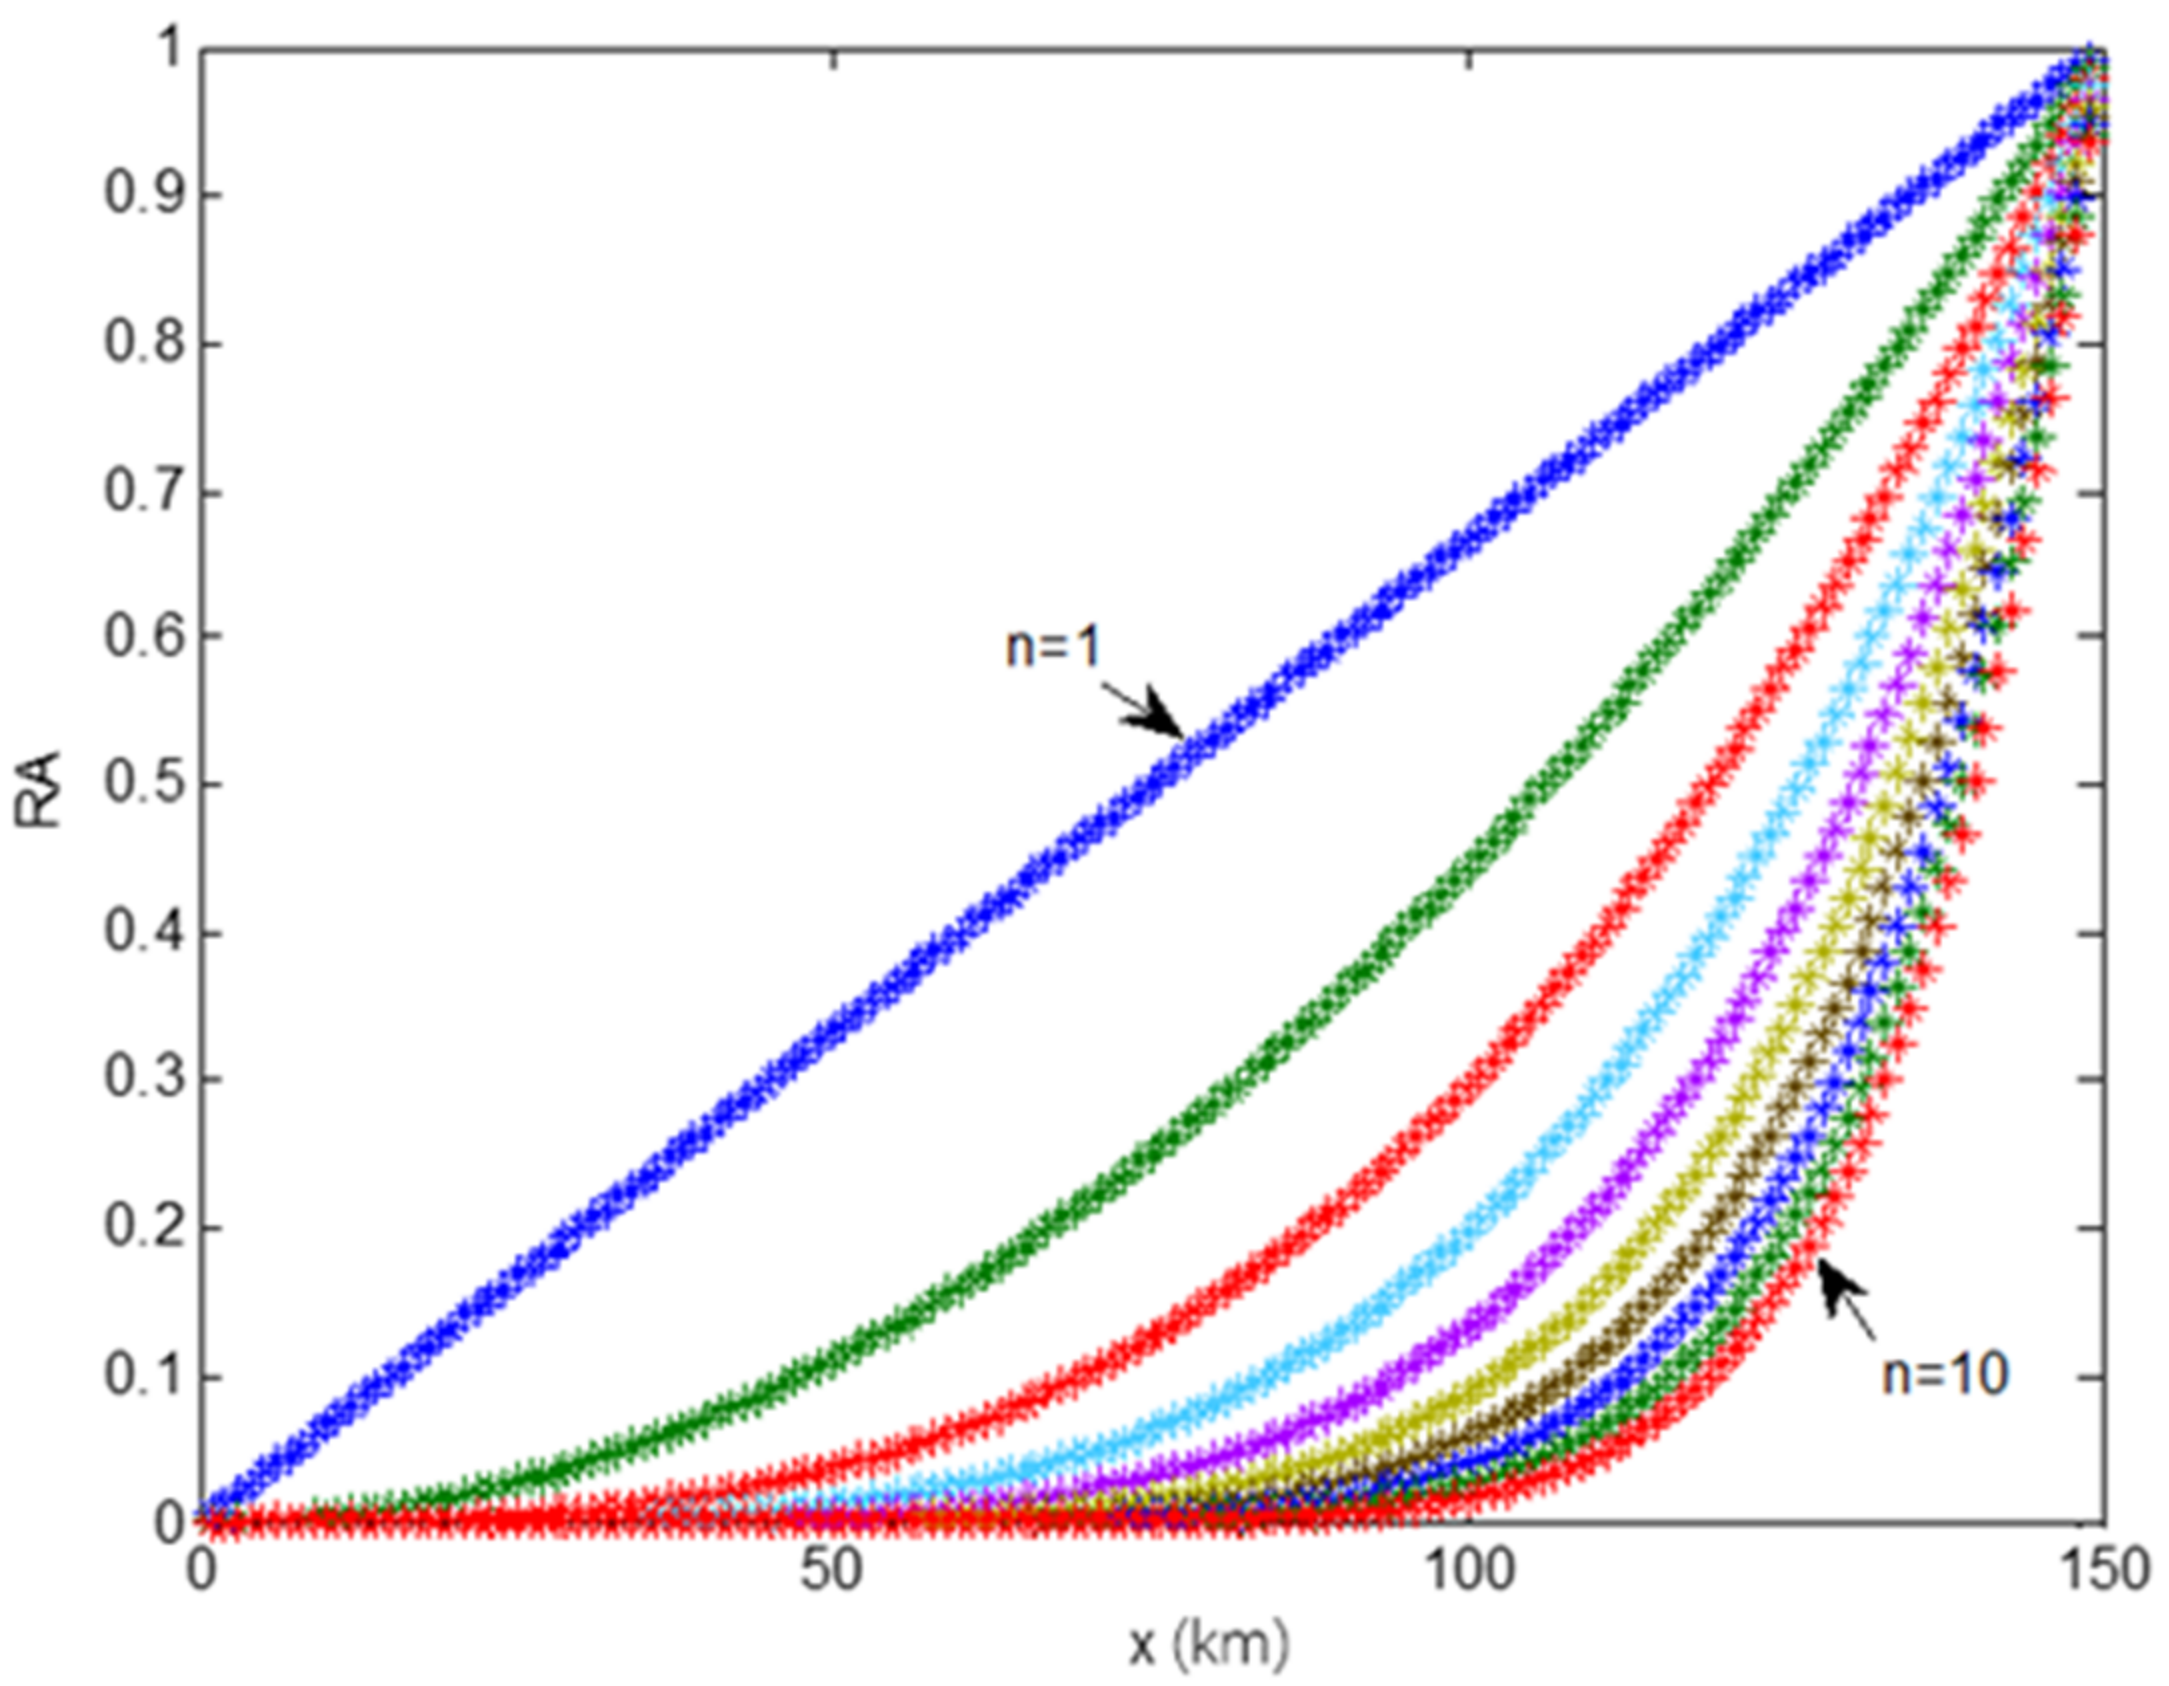
Figure 1. The plot of R A ( x ) at Q = 150, n = 1, …, 10.
Wevj 14 00021 g001
Figure 2. The plot of C R A 0 1 ( x ) at Q = 150, n = 1, …, 10.
Wevj 14 00021 g002
Figure 3. The plot of N 0 1 ( x ) at Q = 150.
Wevj 14 00021 g003
Figure 4. The plot of T ( x ) at Q = 150, n = 5.
Wevj 14 00021 g004
Figure 5. The optimal x under different cruising range scenarios.
Wevj 14 00021 g005
Figure 6. The optimal x under different n.
Wevj 14 00021 g006
Figure 7. The optimal y under different driving range scenarios.
Wevj 14 00021 g007
Figure 8. The optimal y under different n.
Wevj 14 00021 g008
Disclaimer/Publisher’s Note: The statements, opinions and data contained in all publications are solely those of the individual author(s) and contributor(s) and not of MDPI and/or the editor(s). MDPI and/or the editor(s) disclaim responsibility for any injury to people or property resulting from any ideas, methods, instructions or products referred to in the content.