Article

Pedestrian Crossing Intention Prediction Method Based on Multi-Feature Fusion

School of Automotive Studies, Tongji University, No. 4800, Cao’an Road, Shanghai 201804, China
*
Author to whom correspondence should be addressed.
World Electr. Veh. J. 2022, 13(8), 158; https://doi.org/10.3390/wevj13080158
Submission received: 31 July 2022 / Revised: 14 August 2022 / Accepted: 17 August 2022 / Published: 20 August 2022

Abstract

:
Pedestrians are important traffic participants and prediction of pedestrian crossing intention can help reduce pedestrian–vehicle collisions. For the problem of predicting an individual pedestrian’s action where there is crossing potential, a pedestrian crossing intention prediction method that considers multi-feature fusion is proposed in this study, which integrates information affecting pedestrians’ actions, such as pedestrian action and traffic environment. This study is based on the BPI dataset for training and validation, and the test results show that the model has good data fitting and generalization ability; the test set has good prediction accuracy of 89.5% in the model, with an AUC of 0.992. In the specific scenario, the method proposed in this study can predict pedestrian crossing intention when the longitudinal relative distance between a pedestrian and vehicle is about 20 m and about 0.6 s before the pedestrian crossing, which can provide useful information for decision making in intelligent vehicles.

1. Introduction

Pedestrians are a vulnerable group in the road traffic environment and are highly susceptible to serious injuries in pedestrian–vehicle collisions. In the 2018 Global Status Report on Road Safety, the World Health Organization pointed out that the number of road traffic fatalities is climbing year by year, with about 1.35 million deaths due to traffic accidents worldwide each year [1]. Assisted driving technology is supposed to help reduce human–vehicle collisions, but nowadays, smart vehicle collisions with pedestrians occur from time to time and pedestrian safety has attracted widespread attention. Current methods to prevent human–vehicle collisions focus on pedestrian detection and warning, but frequent emergency braking not only affects the passenger driving experience but may also lead to danger due to untimely braking or excessive warning. To avoid human–vehicle collisions, intelligent vehicles should be able to predict the movement of nearby pedestrians in advance based on assisted driving systems.
Currently, pedestrian crossing intention prediction models are mainly divided into traditional kinematic models and data-driven prediction models, and traditional kinematic models rely on artificially designed features to model pedestrian movements and interactions, including constant velocity models and constant acceleration models [2]. Helbing, Molnar et al. [3,4] proposed a social force model, which explains pedestrian behavior with the concept of force. Zeng et al. [5,6] employed and adjusted the theory for pedestrian behavior analysis at signalized intersections. However, there are many shortcomings in terms of prediction effectiveness and reliability. Shen et al. [7] proposed a migratable pedestrian trajectory prediction strategy based on inverse reinforcement learning. On the basis of predicting pedestrian trajectory, collision time can be estimated to guide intelligent vehicles to avoid pedestrians in time. Fang et al. [8] used a support vector machine (SVM) classifier to predict pedestrian intention by using key point information from the human body. Quintero et al. [9] detected human skeletal points in 3D space and recognized standing, starting, walking and stopping movements of pedestrians based on skeletal information. Gesnouin [10] proposed a pedestrian intention prediction model based on human skeleton features, based only on the pedestrian’s posture. Bonnin et al. [11,12] defined feature quantities, such as pedestrian to collision point distance, and trained a single-level perceptron model for urban traffic scenarios by normalizing the Fermi function to classify the pedestrian behavior and predict whether the pedestrian is crossing. Volz et al. [13] used a linear quantile regression and quantile regression forest for pedestrian behavior prediction using a LiDAR sensor, but the method is affected by fluctuations in pedestrian walking speed. Yingning Huang et al. [14] used dynamic Bayesian networks to determine the intention of pedestrians by detecting their head posture only. Sheng Jiang et al. [15] proposed a prediction method for pedestrian crossing intention based on video detection technology, which predicts whether a pedestrian will cross the street by comparing the data obtained from context-based feature extraction and trajectory tracking methods with the calibrated data. Wang et al. [16] proposed a shallow neural network classifier to predict pedestrian behavior according to the two-dimensional posture of pedestrians. Xiao et al. [17] proposed a pedestrian crossing behavior prediction network for surveillance video. Compared with traditional vehicle-based video, surveillance video can capture richer road and vehicle information. However, this method relies on the labeling of key points to encode human posture, which restricts the practical use of the method.
In summary, most domestic and international studies have been conducted only on a single dimension of information, such as pedestrian posture. However, pedestrian crossing behavior is influenced by a combination of pedestrians, traffic environment and other factors. Integrating more of the key factors that influence pedestrian crossing intentions will result in a more accurate prediction model. Therefore, this study proposes a pedestrian crossing intention prediction method that integrates pedestrian and environment-related features. The main contributions include: Proposal of a new method for solving the pedestrian crossing intention prediction problem. The experiment results with quantitative analysis and qualitative analysis are shown in Section 3. Then, we analyze the feature correlation in Section 4. Finally, we discuss the conclusions in Section 5.

2. Materials and Methods
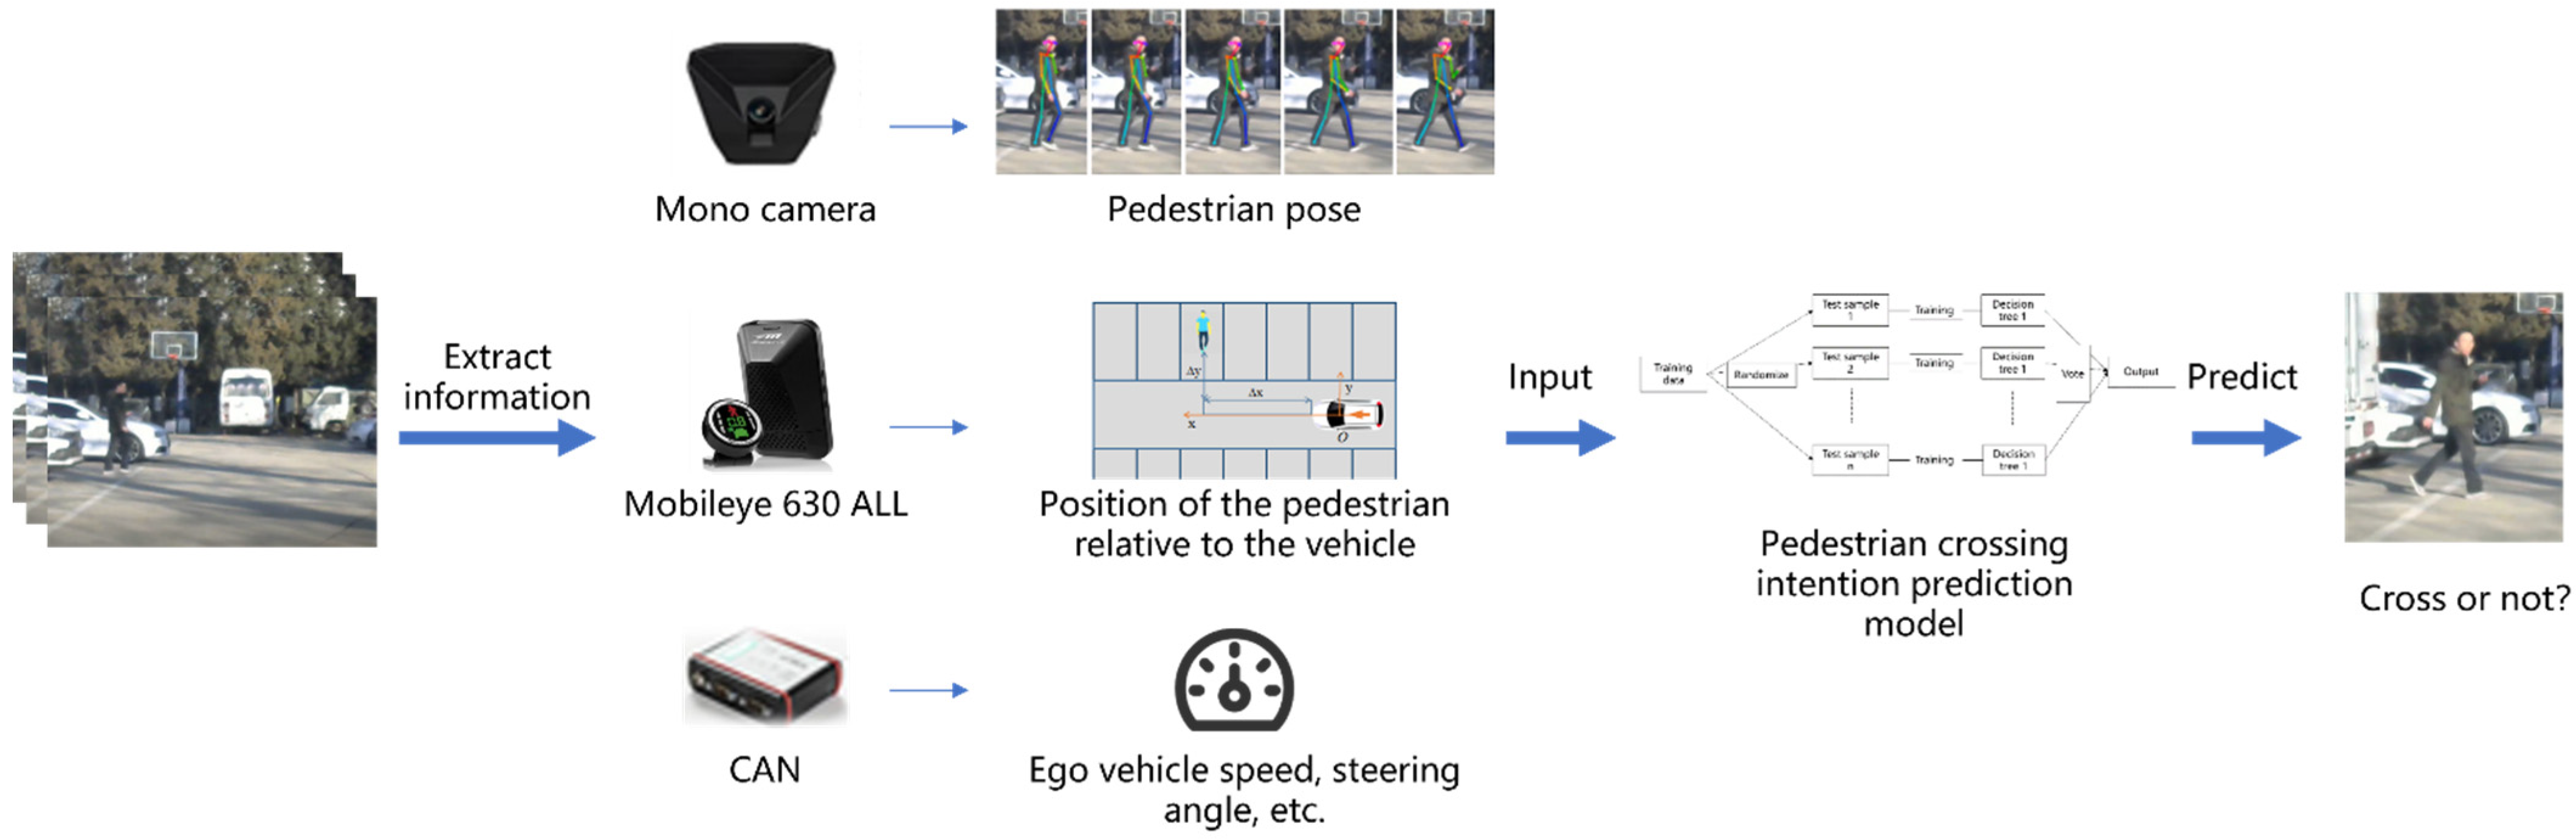
2.1. Framework

As mentioned above, the purpose of this paper is to identify pedestrian crossing intentions. For intelligent vehicles, sensing sufficient and necessary environmental information is the basis for decision making. Therefore, this paper proposes a multi-feature fusion research method for pedestrian crossing intention prediction, as shown in Figure 1. In this study, the pedestrian positional features and environmental information are obtained by monocular camera, engineering machine Mobileye 630 All and vehicle CAN, and the pedestrian behavior features, pedestrian transverse–longitudinal distance from the vehicle and vehicle speed information are extracted by algorithms. This information is fed into a random-forest-based prediction model to predict pedestrian crossing intention. The random forest algorithm has good generalization ability and prediction accuracy and is widely used in research on accident frequency prediction and traffic flow prediction problems.

2.2. Dataset

Tests were conducted using the BPI Dataset (Behavior, Position, and Interaction Dataset), which was built by Tsinghua University, mainly for pedestrian behavior recognition, intent recognition and trajectory prediction. The average speed of vehicles in this dataset is 10–30 km/h. The testers randomly select a behavior of their own and the test vehicle takes flexible actions such as steering, slowing down and stopping according to the pedestrian state [18].
The image frames are obtained from the monocular camera and the images are subjected to pedestrian posture key point detection to obtain the coordinates of 18 pedestrian key points and the confidence level of the corresponding key points, and then the key angles representing the pedestrian behavior characteristics are obtained by calculation. At the same time, the engineering machine can provide the lateral and longitudinal distances of pedestrians from the car in the corresponding images. To ensure the validity of the data, preliminary data processing is performed to obtain the corresponding valid data. In the final data, the number of key-point groups of pedestrians is less than the number of frames of the images acquired by the camera due to the effectiveness of the pedestrian detection algorithm. Preliminary data processing is performed to remove some abnormal data obtained at the beginning or after the end of the experiment due to an error in the information device or a limitation of the pedestrian behavior recognition algorithm.
The test dataset is filtered to obtain 596 sets of data. These data are randomly divided according to a ratio of 70% in the training set and 30% in the test set. In the random forest model, there are 417 sets of data in the training set and 179 sets of data in the test set.

2.3. Key Characteristics of Pedestrian Behavior

There are two main types of methods to fit the human skeleton information, bottom-up and top-down [19]. Initially, researchers usually use the top-down approach, in which the human body position in the image is detected first and then the key points of the human skeleton are estimated separately. This method is more accurate but relies on the results of pedestrian detection and may have problems such as duplicate detection or omission. OpenPose is a real-time deep-learning-based multi-person 2D pose estimation system developed by Carnegie Mellon University [20]. The system is an open-source library based on convolutional neural networks and supervised learning and developed with Caffe as the deep learning framework, which is able to detect and track the activities of human body movements, facial expressions and finger movements in real time with excellent robustness. In the scenario of pedestrian crossing intention prediction, the system requires high computation time and accuracy in the recognition algorithm; therefore, OpenPose is used to fit the skeleton key-point information of pedestrians.
The OpenPose algorithm for human pose recognition detects 18 key points on a person, as shown in Figure 2, and the information of each key point is shown in Table 1.
The algorithm has different recognition accuracy for different human key points and it is concluded through experiments and related research that the algorithm can recognize 9 of the human key points more stably, corresponding to the main torso of the body, as shown in Figure 3 [20].
For the pedestrian crossing intention problem, related studies concluded that the angle between the pedestrian’s limbs and the ground level is the most critical, especially the angle between the thighs and calves [8]. Therefore, considering that the body orientation of pedestrians walking is firstly shown by the posture of hips and legs, while the upper body parts such as arms may make the angle of clamping change and uncertainty due to the posture of holding something, putting it in pocket, etc., the angle between thighs and calves on both sides of pedestrians and the angle between calves and ground level are taken as the feature information of pedestrian posture. The key points obtained by the pedestrian posture recognition algorithm are characterized as shown in Figure 4.
Calculating the angle between the lower leg and the ground involves two key points at the knee and ankle on the left and right side of the pedestrian, using the tangent theorem, as shown in Equation (1), where x k n e e is the horizontal coordinate of the pedestrian knee key point, y k n e e is the vertical coordinate of the pedestrian knee key point, x a n k l e is the horizontal coordinate of the pedestrian ankle key point and y a n k l e is the vertical coordinate of the pedestrian ankle key point.
θ = a r c t a n y k n e e y a n k l e x k n e e x k n e e
The calculation of the angle between the calf and the thigh involves a total of three key points at the hip, knee and ankle on the left and right sides of the pedestrian and the calculation formula is shown in Equation (2); a is the length of the thigh, b is the length of the calf, c is the length of the pedestrian side of the hip to the ankle on that side and the formula is shown in Formulae (3), (4) and (5), respectively, x h i p is the horizontal coordinate of the critical point of the pedestrian’s hip and y h i p is the vertical coordinate of the critical point of the pedestrian’s hip.
α = a r c c o s a 2 + b 2 c 2 2 a b
a = ( x h i p x k n e e ) 2 + ( y c r o t c h y k n e e ) 2
b = ( x a n k l e x k n e e ) 2 + ( y a n k l e y k n e e ) 2
c = ( x h i p x a n k l e ) 2 + ( y h i p y a n k l e ) 2
Usually when a person stands, walks or runs normally, the angle between the lower leg and the ground is roughly between 0 and 90 degrees (0, π/2] and the angle between the large and small legs is between 90 and 180 degrees (π/2, π], and the values beyond this range are regarded as abnormal values and treated as invalid. The grouping process is conducted for angles within a normal range and the grouping is marked at 30 degree intervals. This can appropriately correct the problem of low accuracy in key-point identification, thus, improving the accuracy in model prediction after the pedestrian posture parameters are input into the pedestrian crossing intention prediction model.

2.4. Pedestrian Crossing Intention Prediction

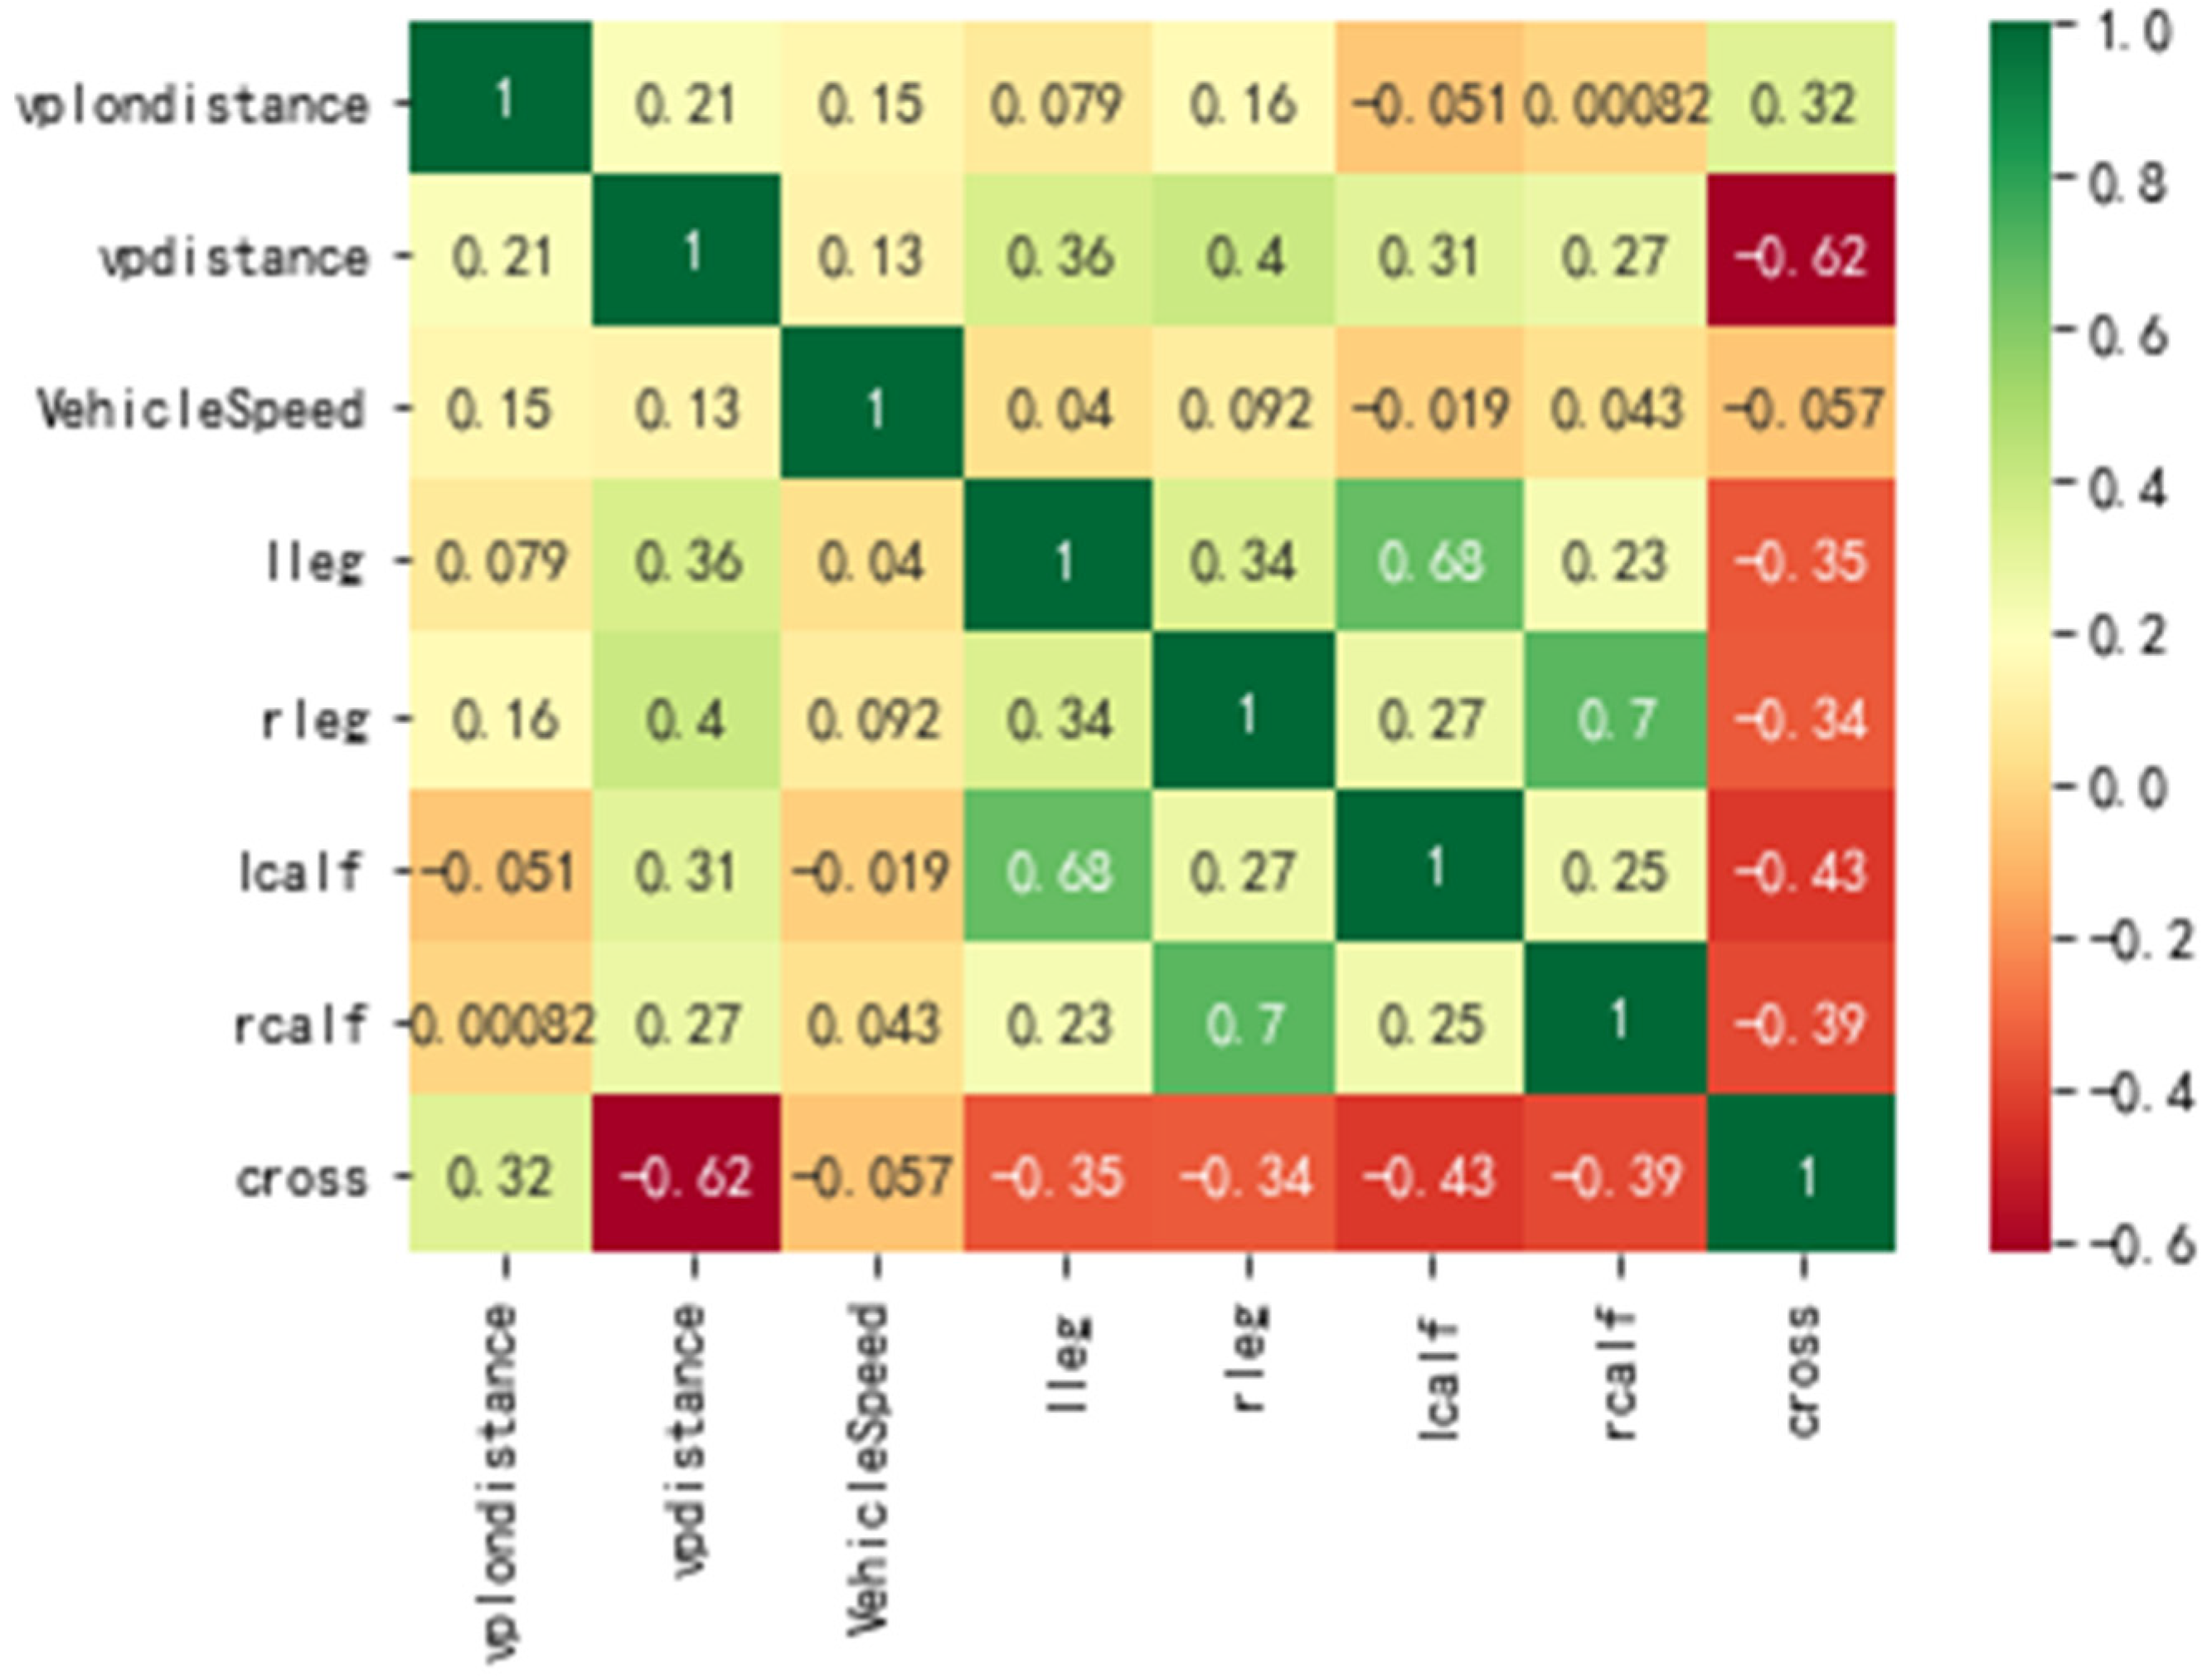
2.4.1. Factors Affecting Pedestrian Crossing Intention

Pedestrian crossing intention is influenced by many factors. Pedestrian crossing is an action made on the basis of their own action needs, together with the observation of the road, surrounding vehicles and other conditions. However, the subject of this study is an intelligent vehicle, which needs the vehicle to predict the pedestrian intention. Intelligent vehicles do not directly perceive the subjective thoughts of pedestrians and need to predict the intention of pedestrian crossing from the observable pedestrian action characteristics, the position of pedestrians relative to the road and vehicles and other information. For a comprehensive analysis, the factors influencing pedestrian crossing intention will be analyzed from both pedestrian and vehicle perspectives.
From a pedestrian perspective, the factors that influence a pedestrian’s intention to cross are the pedestrian destination, the level of danger of crossing and the pedestrian location. Pedestrian destination is the primary factor that determines a person’s action. When pedestrians come to the curb, they often need to cross the roadway. The degree of danger of pedestrian crossing is influenced by the speed of a vehicle, the width of the roadway and even the number of people traveling with the pedestrian, and generally, pedestrians will cross the roadway after a vehicle has slowed or passed. Pedestrian position means that when a pedestrian is already in the roadway and begins to cross, the pedestrian will generally cross at the original speed or accelerate; when the pedestrian is not yet in the lane, the pedestrian will consider all factors to decide whether to cross.
For vehicles, although they cannot directly sense pedestrians’ intention to cross, they can observe and analyze pedestrian and environmental information through sensors and other tools to predict pedestrian crossing intention. The variables that can be observed by vehicles include, but are not limited to:
Δx: the distance between the pedestrian and the vehicle in the direction of travel along the vehicle.
Δy: the distance between the pedestrian and the vehicle in the direction perpendicular to the vehicle’s travel.
Pedestrian behavior: the information of pedestrian’s posture characteristics and walking speed observed in the vehicle view.
Vehicle direction angle: the angle between the direction of vehicle travel and the direction of the lane, which is usually approximately equal to zero when the vehicle is moving forward.
Vehicle speed: the speed of the vehicle for observation; the speed can be divided into the longitudinal speed along the lane direction and the transverse speed perpendicular to the lane direction.
Pedestrian speed: the pedestrian speed can be divided into longitudinal speed along the lane direction and transverse speed perpendicular to the lane direction.
Longitudinal distance collision time: the longitudinal relative distance between pedestrian and vehicle divided by the longitudinal relative speed of both. Compared with the vehicle, the pedestrian speed is lower and the pedestrian speed is often ignored in the actual calculation.
Transverse distance collision time: the pedestrian and vehicle transverse relative distance divided by the two transverse relative speed. The vehicle lateral speed is generally zero and the pedestrian speed is taken as the lateral relative speed of the pedestrian and the vehicle.
A schematic diagram of the above parameters is shown in Figure 5.
Based on the analysis of factors affecting pedestrian crossing intention, in total, seven types of features, namely, lateral distance of pedestrian from vehicle, longitudinal distance of pedestrian from vehicle, self-vehicle speed, angle between thighs and calves of pedestrian and angle between calves of pedestrian and ground, are determined as input features, so as to predict pedestrian crossing intention using random forest model.

2.4.2. Random Forest Model

Random forest is an integrated learning algorithm proposed by Breiman in 2001 [21], which can be used to solve classification and regression problems and when applied to classification problems can be seen as a forest classifier containing multiple decision trees, by randomly taking a number of samples from a given dataset with put-back and using these samples to generate the base classifier, the decision tree and then combining the results of all decision trees; the result with the most occurrences is the predicted result of the model [22].

3. Results and Analysis

3.1. Benchmark and Metrics

After training the traveler crossing intention prediction model, the test set is tested and then the prediction effect is evaluated by the classification model evaluation metric. The problem to be handled in this study is a binary classification problem and the possible classification results are shown in Table 2 [23].
Based on Table 2, the metrics of prediction effectiveness are calculated as follows.
Accuracy indicates the proportion of correctly predicted samples to all predicted samples and the formula is calculated as in Equation (6).
Accuracy = TP + TN TP + TN + FP + FN
Precision indicates the proportion of the samples whose predicted outcome is a crossing and the true situation is also a crossing; the formula is as in Equation (7).
Precision = TP TP + FP
Recall indicates the proportion of the actual penetrated samples with a predicted outcome of penetration and the formula is as in Equation (8).
Recall = TP TP + FN
The F1-Score measures the robustness of the model with the formula in Equation (9).
F 1 = 2 Precision · Recall Precision + Recall
The horizontal axis of the ROC (receiver operating characteristic) curve plot is the false-positive rate (FPR) and the vertical axis is the true-positive rate (TPR), an aggregate curve of several sets of data obtained by varying the classification threshold of the sample [24]. The AUC (area under the ROC curve) value is the area under the ROC curve in the coordinate system. The minimum value of AUC under normal conditions is 0.5 and the maximum value is 1.0, and the larger this value is, the more accurate the model prediction is.

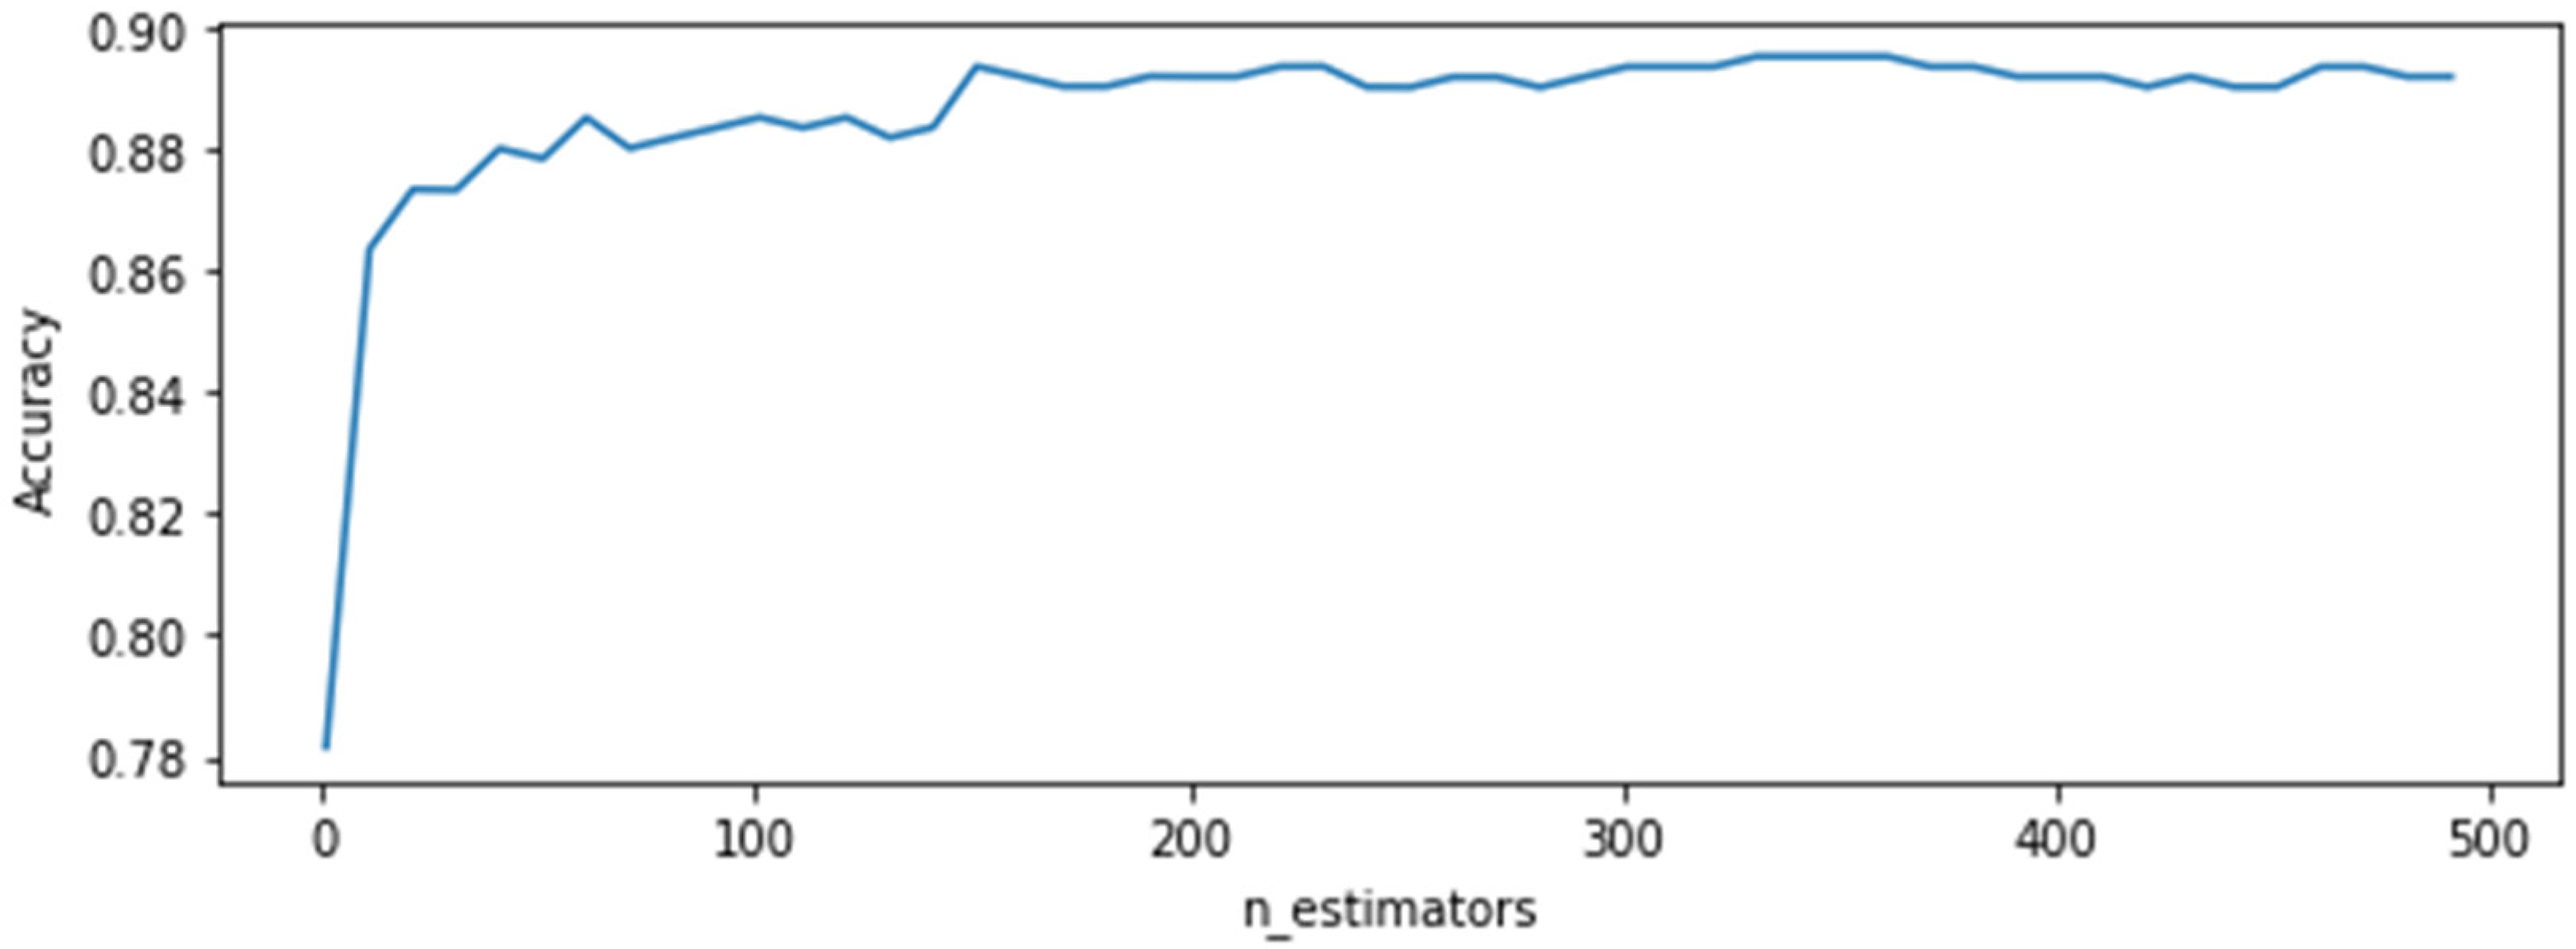
3.2. Model Parameters

The learning curve is used to determine the range and trend of the parameters and the number of decision trees n_estimators with the greatest impact on the random forest model is tuned. To obtain a more robust model, cross-validation was used. A 10-fold cross-validation was used in the experiment. Due to the large amount of data, the approximate range of the value was first determined within a number of trees of 0–500, with an interval of 10, and then the specific value was determined. As the number of trees increased, the accuracy of the model was the first to increase rapidly on the test set, then increased slowly and, finally, was basically smooth, as shown in Figure 6. Between 320 and 370 trees, the model accuracy was better and for 331 trees, the accuracy was 89.5%. Then, calculations were continued within that range to determine the exact number of decision trees. The final result is that the model works better with an accuracy of 89.7% when the number of decision trees is 345. Considering that too many decision trees will make the model operation time longer, the final parameter size was determined to be 320.

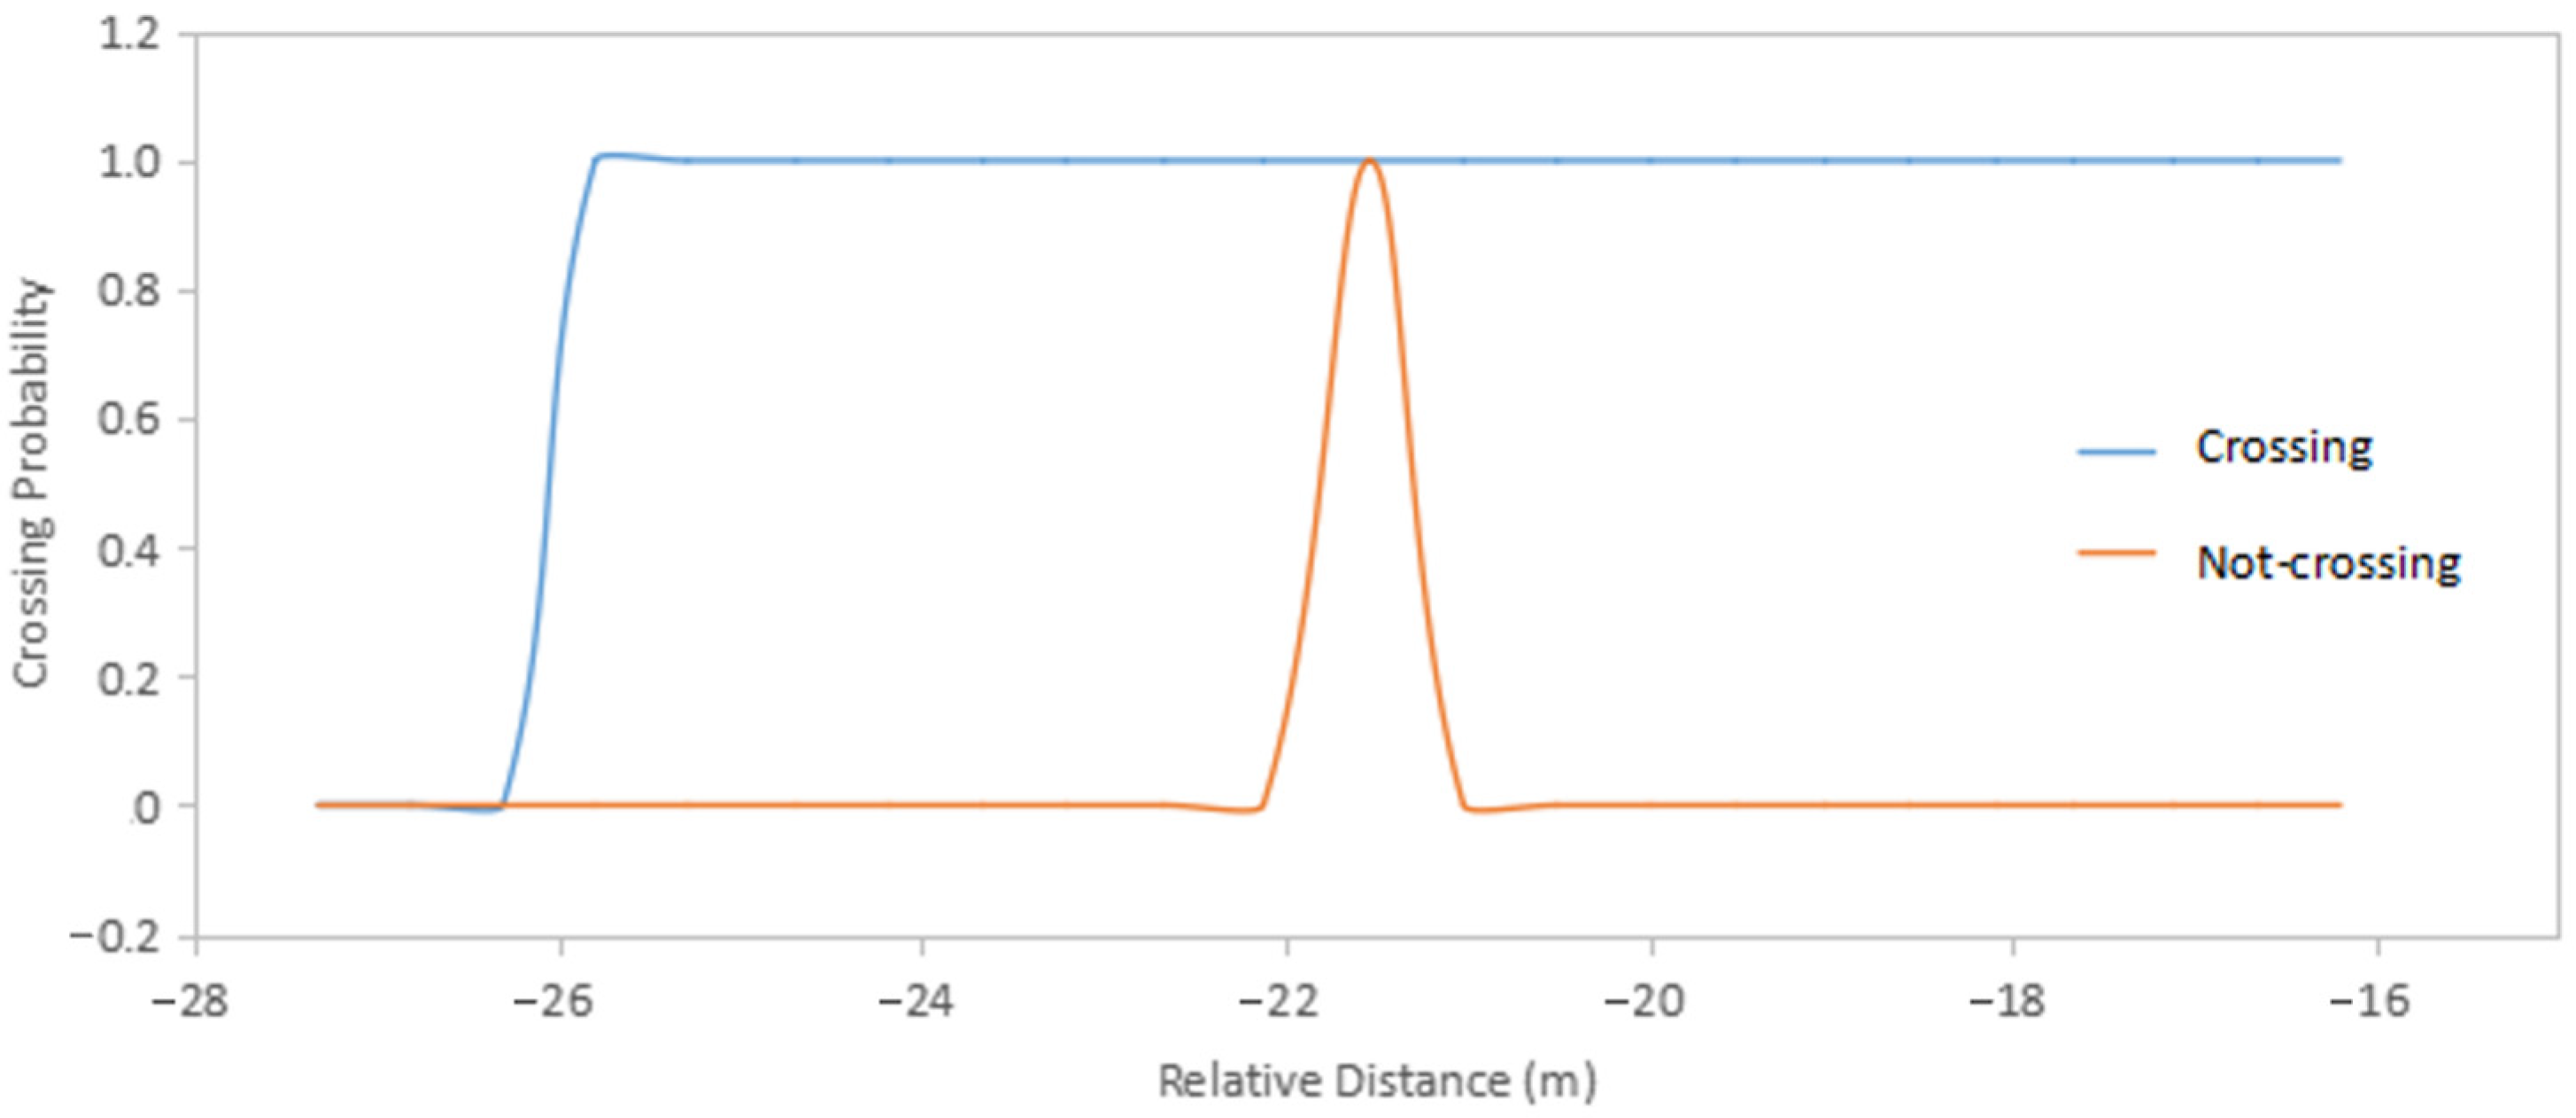
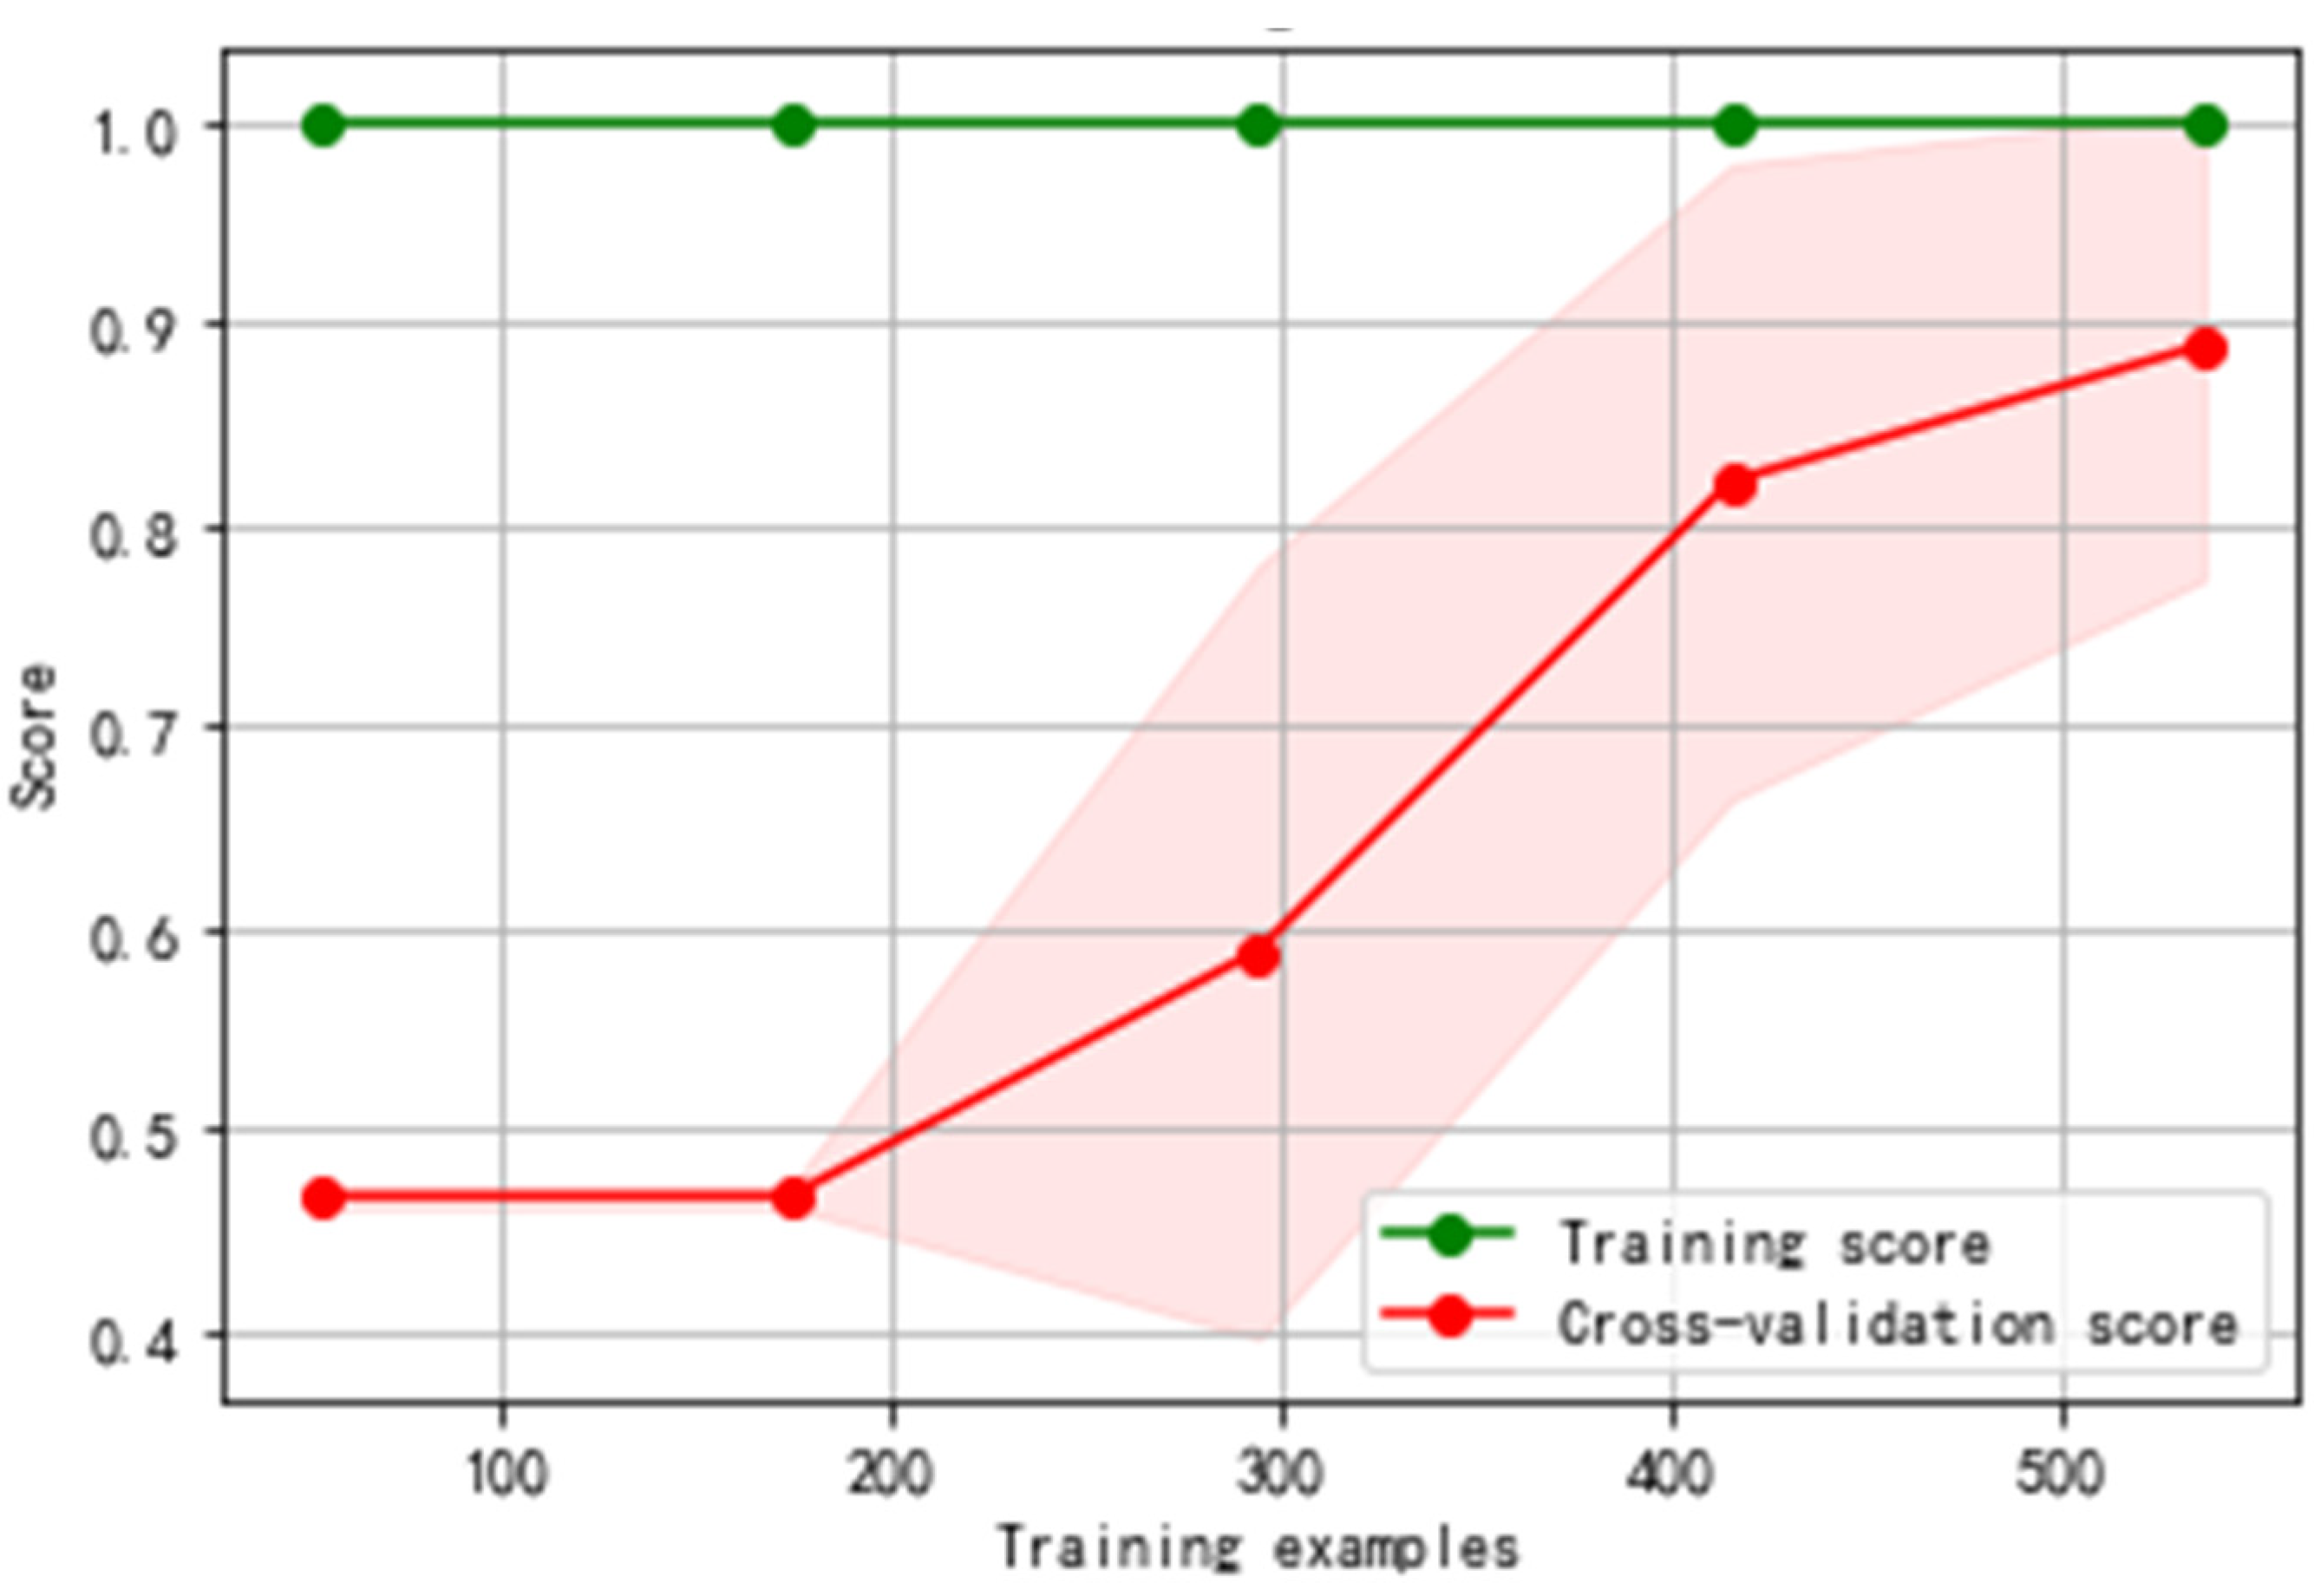
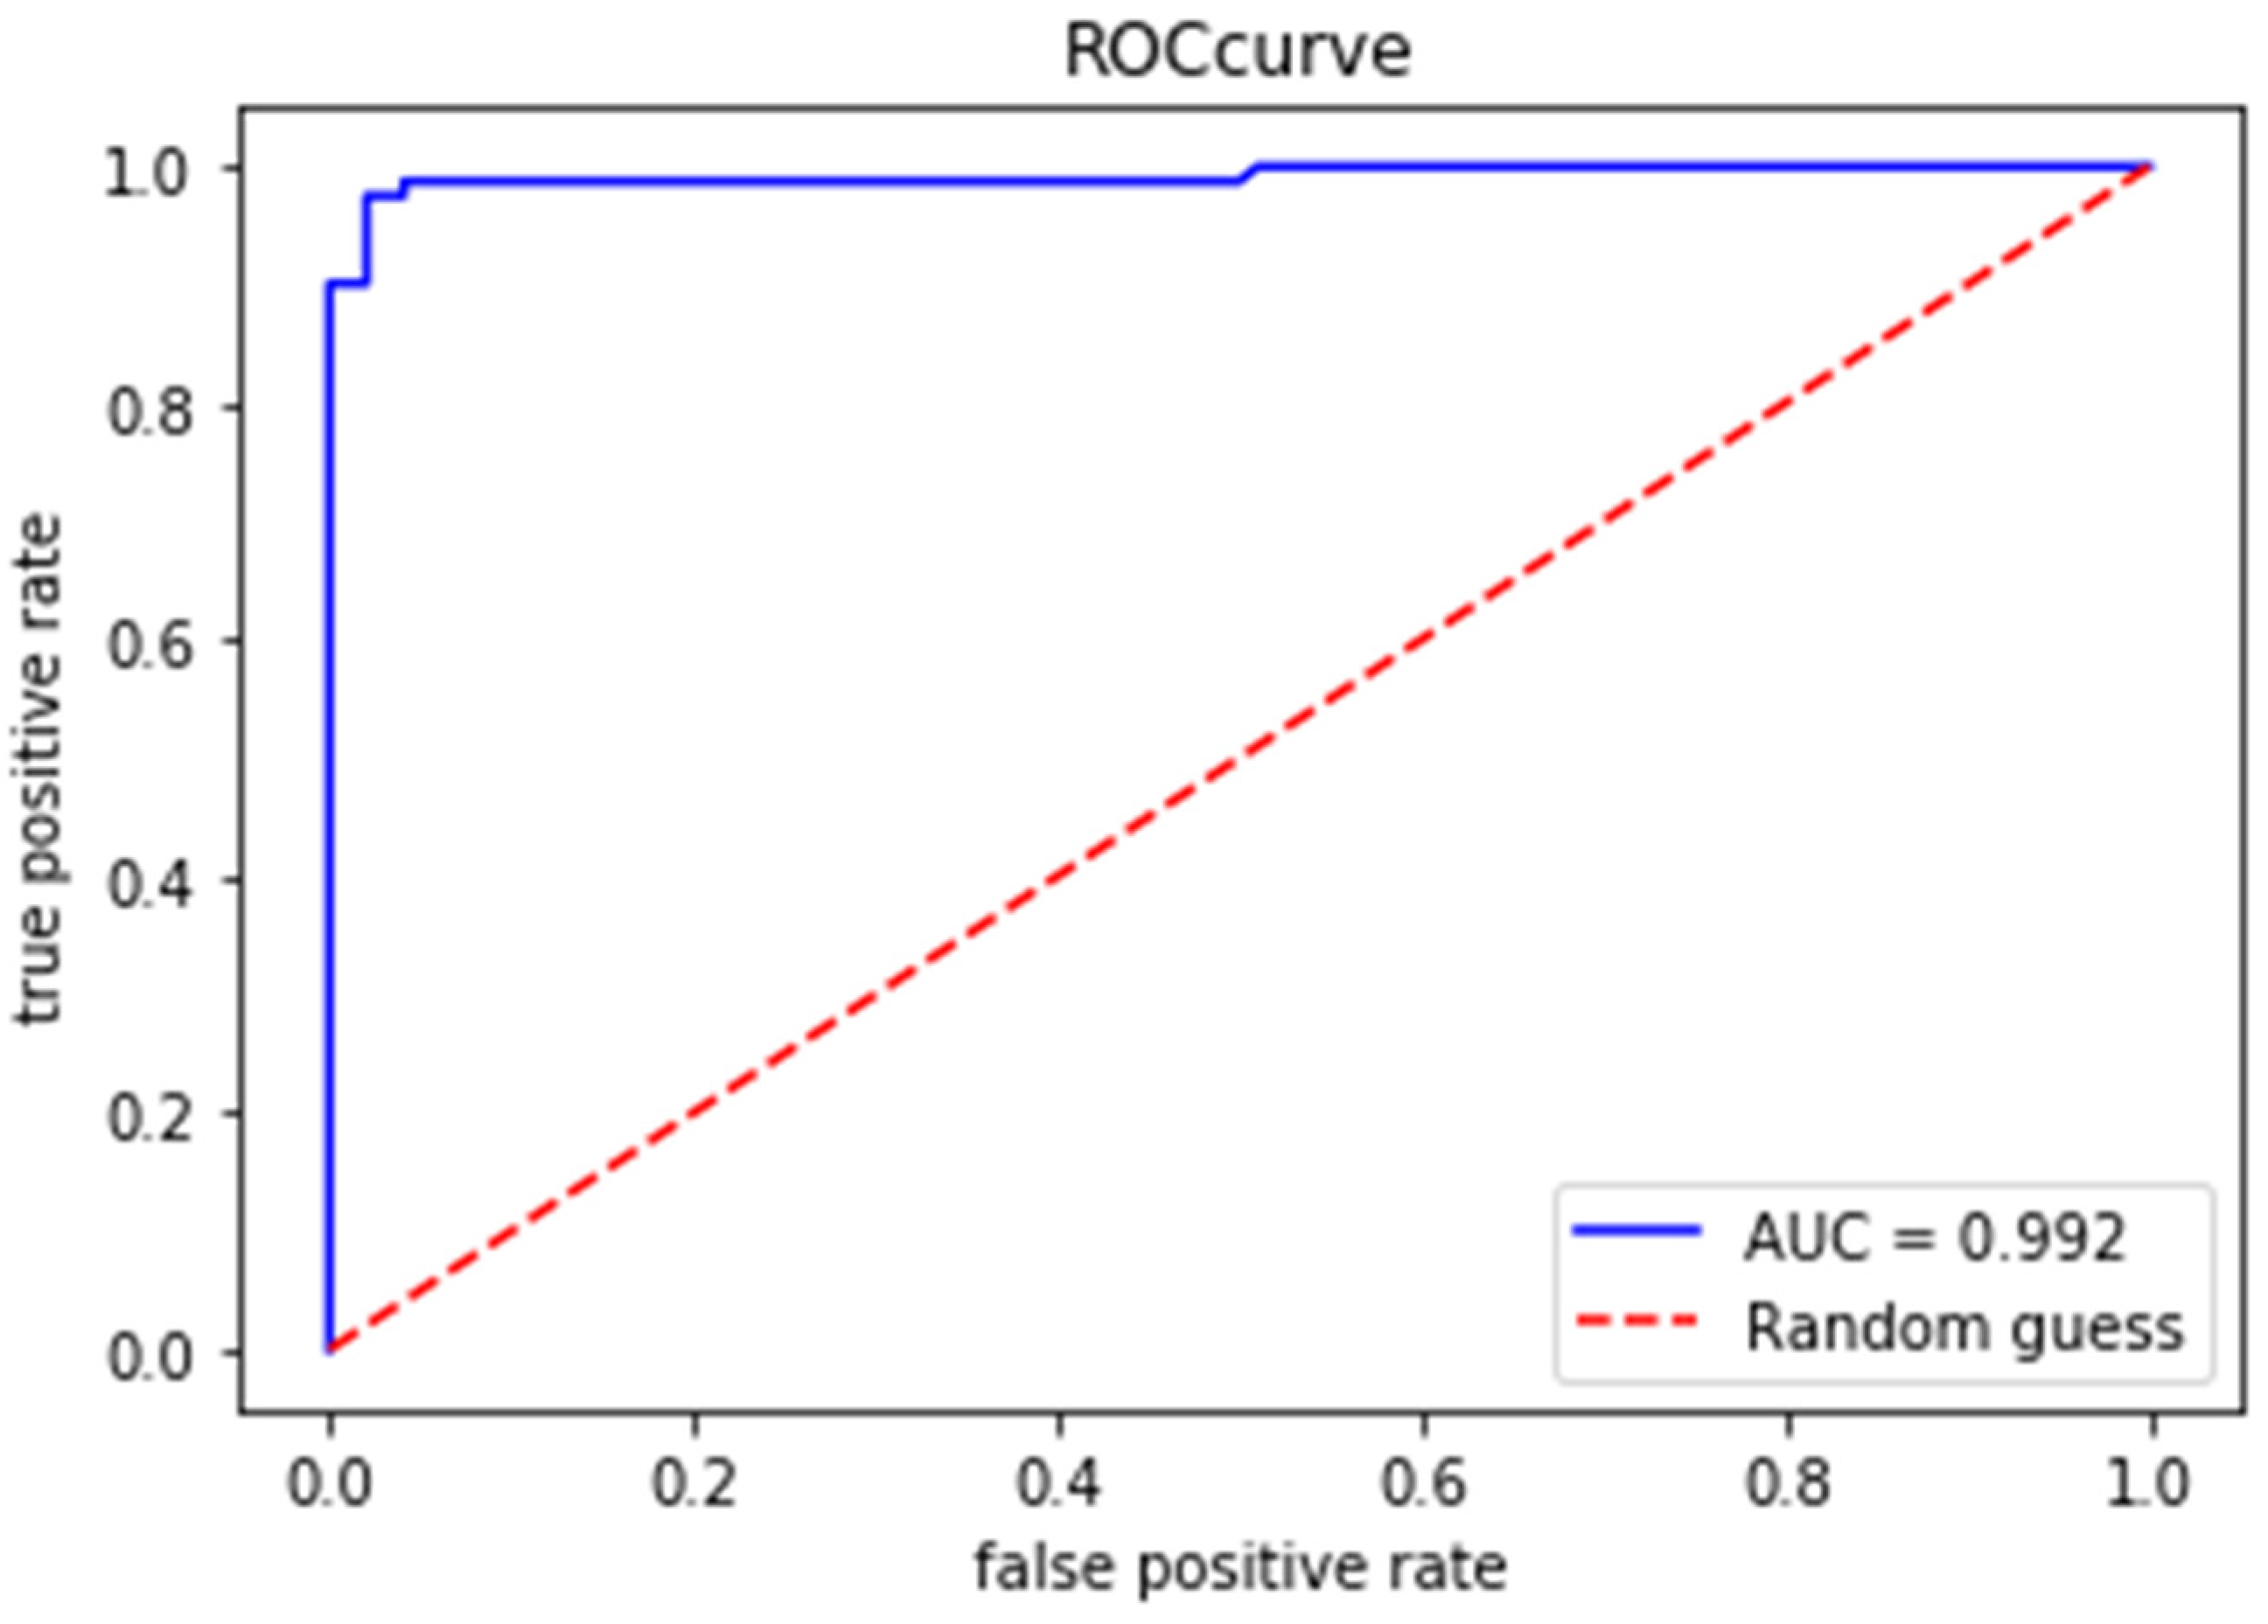
3.3. Quantitative Analysis of Pedestrian Crossing Intention

The learning curve of the model is derived by plotting the accuracy scores of the training set and the cross-validation set under different sizes of training sets, as shown in Figure 7. It can be seen from the curves that the accuracy difference between the model on the training set and the validation set is large, which indicates that the model can fit the known data well and the curves on the training set and the validation set in the figure have a tendency to converge, which indicates that the model has a good generalization ability. It also shows that the convergence of the model and the error is small, i.e., the deviation and variance are small and there is no overfitting and underfitting, which is a more ideal situation.
The best validation accuracy of the random forest model proposed in this study reaches about 89% on the cross-validation set. Further, it is higher than the best accuracy of 88% obtained in the literature [25] that studied pedestrian intention prediction. This shows that the feature selection and sample size of the model are both appropriate. When the number of decision trees in the random forest is 320, the accuracy of pedestrian crossing intention prediction in the model prediction test set with cross-validation is 89.5%. The recall is 95.1%, which means that among actual walkers, the model is able to correctly predict the outcome that they are crossing. The check accuracy rate is 97.5%, indicating that the percentage of those whom the model predicts as crossing is 97.5% of those who actually do so. The F1-Score is 0.963, indicating that the model has good robustness.
From the ROC curve in Figure 8, the AUC value is 0.992, which should theoretically be between 0.5 and 1.0. The larger the value, the better the prediction of the model, which shows that the random forest model built for pedestrian crossing intention prediction has better prediction effect.

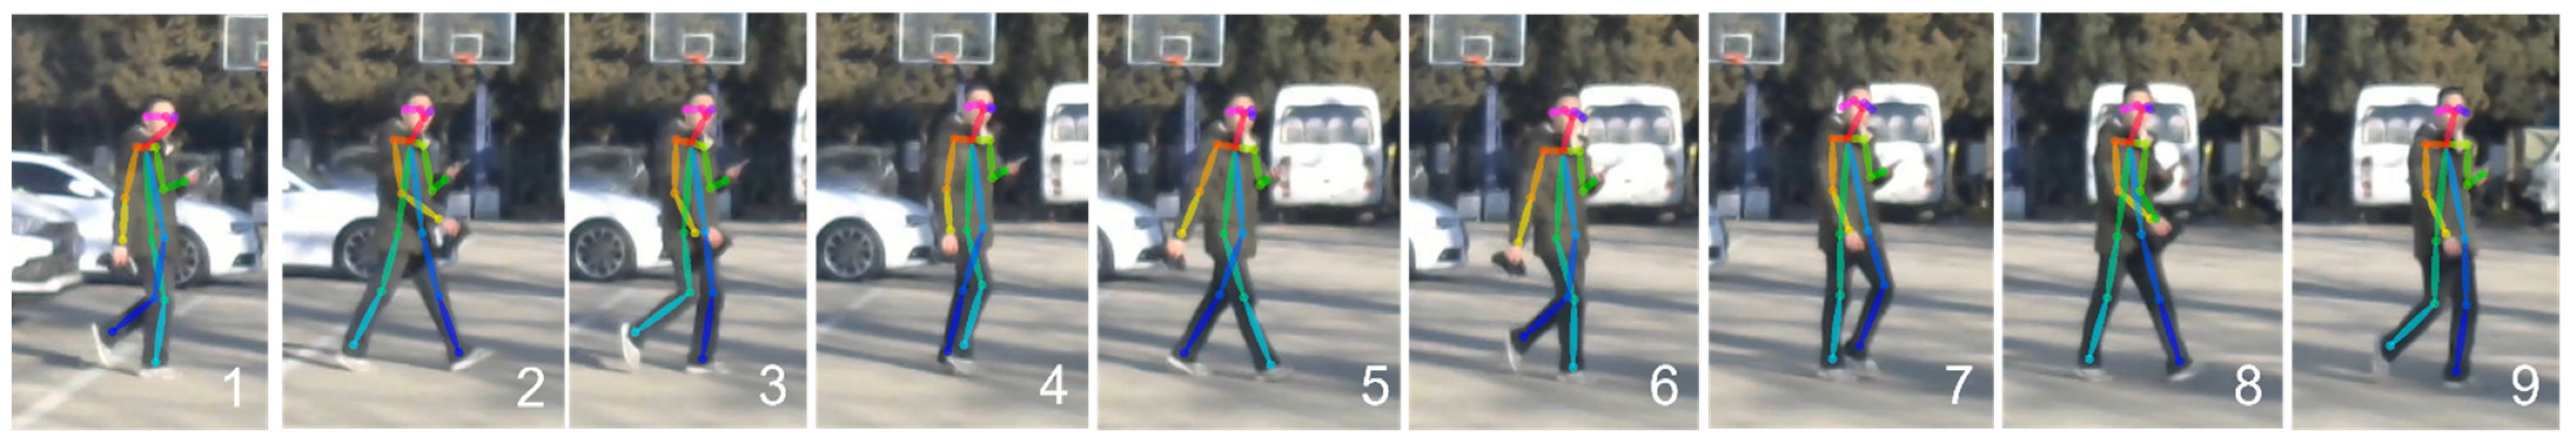
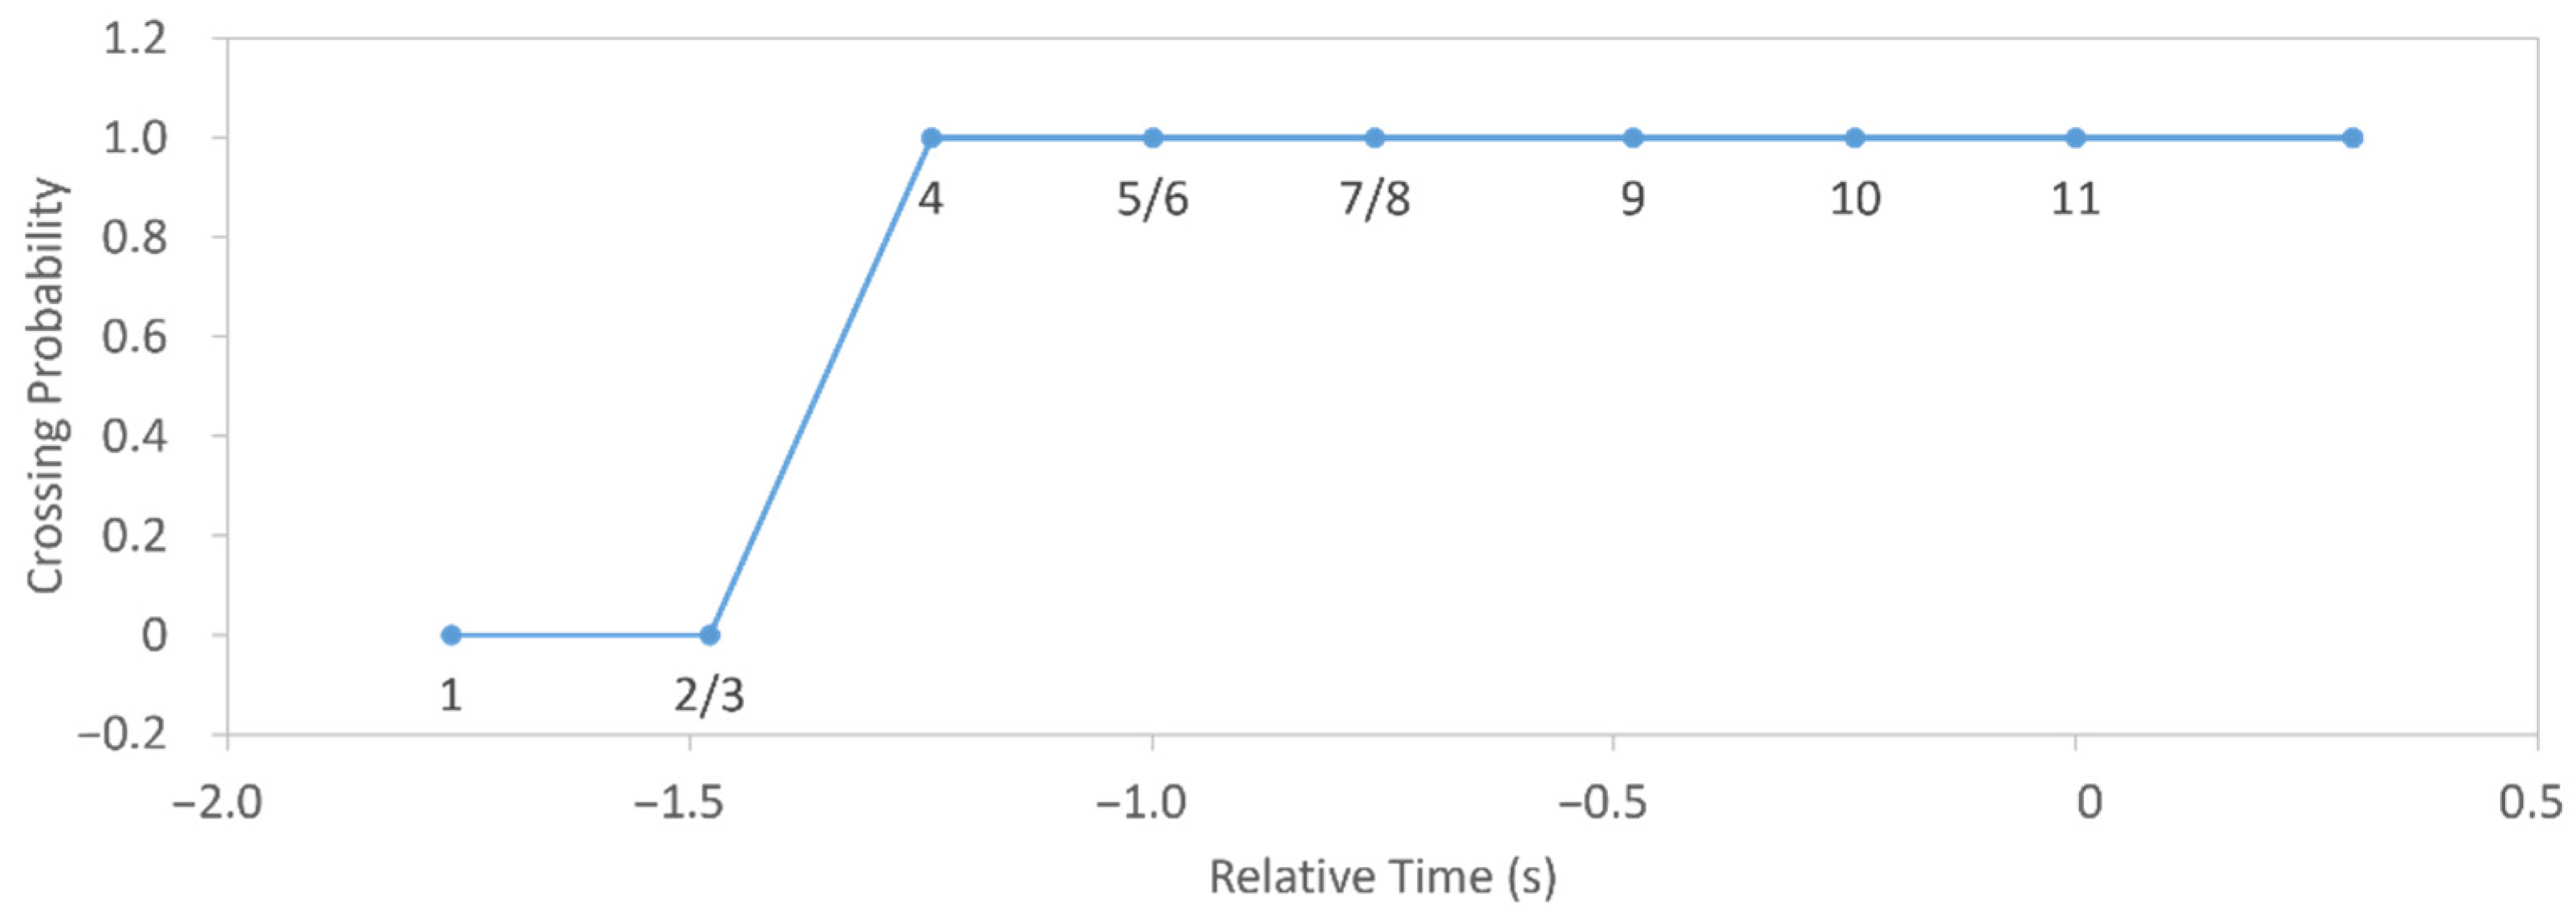
3.4. Qualitative Analysis of Pedestrian Crossing Intention

The results of pedestrian crossing intention in the test are divided into two types: crossing road and non-crossing road. Time to event (TTE) means time to the crossing frame or to the last frame (if the pedestrian does not cross). A TTE of 0 indicates the moment when the pedestrian enters the vehicle forward area for the pedestrian crossing scenario and the final moment of the trial for the pedestrian-not-crossing scenario, after which there are no trial data or the data are invalid. A negative value indicates that the event occurs before the moment of crossing, while a positive value indicates that the event occurs after the moment of crossing. The collected test data and the results of the pedestrian behavior recognition algorithm are input into the established random forest pedestrian crossing intention prediction model to verify the validity of the prediction algorithm.
The data labels that were given are used as the standard results. The random forest pedestrian crossing intention prediction model predicts the test set with predictions of 1 or 0, representing pedestrian crossing and pedestrian not crossing, respectively. Figure 9 shows a series of key-point identification maps linking pedestrians, which can visualize the change in pedestrians’ behavioral characteristics in terms of angle. Figure 10 represents the variation in pedestrian crossing intention with relative time and the serial number on each point of the curve corresponds to the serial number in the image frame. Here, the moment when the relative time is zero indicates the moment when the pedestrian enters the area in which the vehicle is advancing.
From Figure 10, it can be seen that the pedestrian’s intention to cross can be accurately predicted about 1.2 s before the pedestrian starts to cross and the prediction results of the algorithm do not change after that, indicating that the algorithm can effectively predict the pedestrian crossing intention. The reason that the point on the curve in the figure corresponds to the two points in Figure 9 is that the longitudinal distance of the pedestrian from the car changes less and the relative time change is shorter and it is detected by the engineering machine as no change; the results of the intention prediction model are the same, so the two points on the plotted curve overlap.
Figure 11 shows the variation in pedestrian crossing intention with the longitudinal relative distance between pedestrians and vehicles, and the human crossing intention can be accurately predicted roughly at a longitudinal relative distance of 9 m between pedestrians and vehicles. For the problem that the model did not recognize the pedestrian intention at the beginning, it may be caused by an error in the model prediction.
In order to further verify the prediction effect of the algorithm, representative data from the uninvolved training dataset are selected for the pedestrian-crossing scenario and the non-crossing scenario and the changes in pedestrian crossing intention with relative time for the corresponding data after the algorithm operation are given, as shown in Figure 12. From Figure 12, it can be seen that in the pedestrian-crossing scenario, the crossing intention predicted by the model is 1 before the actual crossing of the pedestrian, while in the not-crossing scenario, the crossing intention predicted by the model is 0 at the moment before the data failure, indicating that the prediction algorithm of the pedestrian crossing intention is basically effective and can give the classification of the crossing intention of the pedestrian. The prediction results fluctuated slightly during the prediction of pedestrian intention in the pedestrian non-crossing scenario, but also eventually made accurate prediction results for pedestrians no longer passing before they started to enter the vehicle forward area.
Figure 13 gives the variation in pedestrian crossing intention with longitudinal relative distance for the pedestrian-crossing scenario and the non-crossing scenario. For the pedestrian-crossing scenario, the prediction model starts to have high stability and accuracy after the longitudinal relative distance between pedestrians and vehicles is approximately less than 25 m. For the pedestrian-not-crossing scenario, the prediction model fluctuates at a longitudinal relative distance between pedestrians and vehicles of about 22 m, after which it returns to the correct prediction result. Compared with Figure 12, the moment of advance relative to the actual pedestrian crossing at this point is about 0.6 s. The model effectively predicts the intention of pedestrian crossing, which has positive implications for traffic safety.
In summary, for the pedestrian-crossing scenario, the random-forest-based pedestrian crossing intention prediction algorithm proposed in this study is able to predict whether a traveler intends to cross at a longitudinal relative distance of about 20 m between a pedestrian and a vehicle, about 0.6 s in advance. The algorithm is able to make a better prediction of pedestrian’s crossing intention based on the information of pedestrians and vehicles, thus, further improving traffic safety.

4. Discussion

In this paper, a multi-feature fusion-based pedestrian walking behavior prediction method is proposed and the effectiveness of the algorithm is verified through experiments. Compared with traditional prediction methods, the method integrates pedestrian posture features and environmental information, such as vehicles and roads, to improve the accuracy of prediction.
The larger the correlation coefficient, the stronger the correlation coefficient between the characteristics. A correlation coefficient of 1 indicates that the two random variables are perfectly linearly positively correlated; a correlation coefficient of −1 indicates that the two random variables are perfectly linearly negatively correlated; and a correlation coefficient of 0 indicates that the two random variables are linearly uncorrelated but does not mean that the variables are uncorrelated. Figure 14 shows the characteristic correlation coefficient matrix of the data. The darker the color of the grid formed by the intersection of the horizontal and vertical coordinates of the variables, the greater the correlation between the variables. The degree of influence for each feature on the results can also be seen in the figure. The lateral distance of pedestrians from the car best reflects the degree of danger in the traveler crossing and will have an important influence on the pedestrian crossing intention. The magnitude of the correlation coefficients for the feature angles of pedestrian behavior is close, which shows that the selection of pedestrian behavior feature angles has better rationality. The feature that has less influence on pedestrian intention to cross is the speed of a self-vehicle, which is a reasonable situation considering that pedestrians may not observe the condition of traffic vehicles and the bias of different pedestrians’ perceptions of vehicle speed judgment.

5. Conclusions

In this study, for pedestrian posture, a class of features characterizing pedestrian behavioral posture with high stability and accuracy is proposed. The key-point information of pedestrians is obtained through images and considering the recognition accuracy of different key points and the angle between the limbs and the ground level line characterizing pedestrian walking intention, the information of body direction when pedestrians walk is firstly demonstrated by the posture of the hips and legs, while there are large changes and uncertainties in the characteristics related to upper-body parts, such as arms, etc. The angle between thighs and calves on the left and right sides of pedestrians and the angle between calves and the ground level line are determined as the characteristic information of pedestrian behavior and are input into the pedestrian crossing intention prediction model for analysis, together with other environmental information.
For pedestrian crossing intention prediction, a random-forest-based prediction model incorporating multiple features is proposed. The prediction accuracy of the model is 89.5%, on average, and the AUC value is 0.992, indicating that the model has a good prediction effect. For the pedestrian-crossing scenario, the pedestrian crossing intention prediction algorithm proposed in this study can predict the intention of whether a pedestrian is crossing or not about 0.6 s in advance, when the longitudinal relative distance between pedestrians and vehicles is about 20 m. The experiment shows that the pedestrian motion prediction algorithm can make a good prediction, with good effects, based on the information of pedestrians and vehicles. Further, the prediction results provide an important reference for the decision-making and path planning of intelligent vehicles. Although the study achieved good performance on the BPI dataset, there are still some problems. The method relies on the movement of roadside pedestrians and location information relative to the detected vehicle to identify pedestrian crossing intentions. The performance of the method becomes poor for unsuspected sudden pedestrian crossings and the sudden appearance of other vehicles.
Future studies can collect richer data. The current BPI dataset used in this study has a small sample size and cannot fully cover various scenarios of pedestrian movement changes in practice. Richer data will enhance the generalization performance of the model proposed in this study and further analyze the effectiveness of the method in this study in more scenarios.

Author Contributions

Conceptualization, J.M. and W.R.; methodology, W.R.; software, W.R.; validation, J.M. and W.R.; investigation, W.R.; data curation, W.R.; writing—original draft preparation, W.R.; writing—review and editing, J.M. and W.R.; visualization, W.R.; project administration, W.R.; All authors have read and agreed to the published version of the manuscript.

Funding

This work was supported by the Shanghai Municipal Science and Technology Major Project (2021SHZDZX0100) and the Fundamental Research Funds for the Central Universities.

Institutional Review Board Statement

Not applicable.

Informed Consent Statement

Not applicable.

Conflicts of Interest

The authors declare no conflict of interest.

References

  1. Zhang, Y. World Health Organization Releases Global Status Report on Road Safety 2018. Chin. Disaster Relief Med. 2019, 7, 100. [Google Scholar]
  2. Ouyang, J.; Shi, Q.; Wang, X.; Wang, L. Research on pedestrian trajectory prediction based on GAN and attention mechanism. Adv. Lasers Optoelectron. 2019, 57, 1–20. [Google Scholar]
  3. Helbing, D. A mathematical model for the behavior of pedestrians. Behav. Sci. 1991, 36, 298–310. [Google Scholar] [CrossRef]
  4. Helbing, D. A Fluid Dynamic Model for the Movement of Pedestrians. Complex Syst. 1998, 6, 391–415. [Google Scholar]
  5. Zeng, W.; Chen, P.; Nakamura, H.; Iryo-Asano, M. Application of social force model to pedestrian behavior analysis at signalized crosswalk. Transp. Res. Part C 2014, 40, 143–159. [Google Scholar] [CrossRef]
  6. Zeng, W.; Chen, P.; Yu, G.; Wang, Y. Specification and calibration of a microscopic model for pedestrian dynamic simulation at signalized intersections: A hybrid approach. Transp. Res. Part C 2017, 80, 37–70. [Google Scholar] [CrossRef]
  7. Shen, M.; Habibi, G.; How, J. Transferable pedestrian motion prediction models at intersections. In Proceedings of the 2018 IEEE/RSJ International Conference on Intelligent Robots and Systems (IROS), Madrid, Spain, 1–5 October 2018; IEEE: Piscataway, NJ, USA, 2018; pp. 4547–4553. [Google Scholar]
  8. Fang, Z.; Vázquez, D.; López, A.M. On-Board Detection of Pedestrian Intentions. Sensors 2017, 17, 2193. [Google Scholar] [CrossRef] [PubMed]
  9. Quintero, M.; Parra, A.; Fernandez-Llorca, D.; Sotelo, M.A. Pedestrian Path, Pose, and Intention Prediction Through Gaussian Process Dynamical Models and Pedestrian Activity Recognition. IEEE Trans. Intell. Transp. Syst. 2019, 20, 1803–1814. [Google Scholar] [CrossRef]
  10. Gesnouin, J.; Pechberti, S.; Bresson, G.; Stanciulescu, B.; Moutarde, F. Predicting intentions of pedestrians from 2d skeletal pose sequences with a representation-focused multi-branch deep learning network. Algorithms 2020, 13, 331. [Google Scholar] [CrossRef]
  11. Bonnin, S.; Weisswange, T.; Kummert, F.; Schmuedderich, J. General Behavior Prediction by a Combination of Scenario-Specific Models. IEEE Trans. Intell. Transp. Syst. 2014, 15, 1478–1488. [Google Scholar] [CrossRef]
  12. Bonnin, S.; Weisswange, T.; Kummert, F.; Schmüdderich, J. Pedestrian crossing prediction using multiple context-based models. In Proceedings of the Intelligent Transportation Systems (ITSC), 2014 IEEE 17th International Conferrnce on IEEE, Chengdu, China, 19–21 December 2014; pp. 378–385. [Google Scholar]
  13. Volz, B.; Mielenz, H.; Siegwart, R.; Nieto, J. Predicting pedestrian crossing using Quantile Regression forests. In Proceedings of the Intelligent Vehicles Symposium, Gothenburg, Sweden, 19–22 June 2016; IEEE: Piscataway, NJ, USA, 2016; pp. 426–432. [Google Scholar]
  14. Huang, Y.; Cui, J.; Fwanck, D.; Zhao, H.; Zha, H. Head pose based intention prediction using discrete dynamic bayesian network. In Proceedings of the 2013 Seventh International Conference on Distributed Smart Cameras (ICDSC), Palm Springs, CA, USA, 29 October–1 November 2013; IEEE: Piscataway, NJ, USA, 2013; pp. 1–6. [Google Scholar]
  15. Jiang, S.; Wang, D.; Chen, Y.; Sun, D. Video-based pedestrian motion trajectory reproduction and street crossing behavior expression. J. Southeast Univ. 2012, 42, 1233–1237. [Google Scholar]
  16. Wang, Z.; Papanikolopoulos, N. Estimating pedestrian crossing states based on single 2D body pose. In Proceedings of the 2020 IEEE/RSJ International Conference on Intelligent Robots and Systems (IROS), Las Vegas, NV, USA, 25–29 October 2020; pp. 2205–2210. [Google Scholar]
  17. Zhou, X.; Ren, H.; Zhang, T.; Mou, X.; He, Y.; Chan, C.-Y. Prediction of Pedestrian Crossing Behavior Based on Surveillance Video. Sensors 2022, 22, 1467. [Google Scholar] [CrossRef] [PubMed]
  18. Wu, H. BPI_Dataset. 2020. Available online: https://github.com/wuhaoran111/BPI_Dataset (accessed on 10 March 2020).
  19. Gao, Y. Key Point Detection of Human Skeleton and Its Application in Pose Recognition; Chongqing University of Technology: Chongqing, China, 2019. [Google Scholar]
  20. Cao, Z.; Simon, T.; Wei, S.H.; Sheikh, Y. OpenPose: Realtime multi-person 2D pose estimation using part affinity fields. In Proceedings of the 2017 IEEE Conference on Computer Vision and Pattern Recognition (CVPR), Honolulu, HI, USA, 21–26 July 2017. [Google Scholar]
  21. Breiman, L. Random forests. Mach. Learn. 2001, 45, 5. [Google Scholar] [CrossRef] [Green Version]
  22. Peng, L.; Yang, L. Urban Classification Based on Random Forest Algorithm. Int. J. Adv. Res. 2019, 7, 844–849. [Google Scholar]
  23. Liu, B.; Adeli, E.; Cao, Z.; Lee, K.H.; Shenoi, A.; Gaidon, A.; Niebles, J.C. Spatio-temporal relationship reasoning for pedestrian intent prediction. IEEE Robot. Autom. Lett. 2020, 5, 3485–3492. [Google Scholar] [CrossRef] [Green Version]
  24. Huang, Y.; Cha, W. Comparison of classification performance between random forests and support vector machines. Software 2012, 33, 107–110. [Google Scholar]
  25. Fang, Z. Is the Pedestrian Going to Cross? Answering by 2D Pose Estimation; IEEE: Piscataway, NJ, USA, 2018; pp. 1271–1276. [Google Scholar]
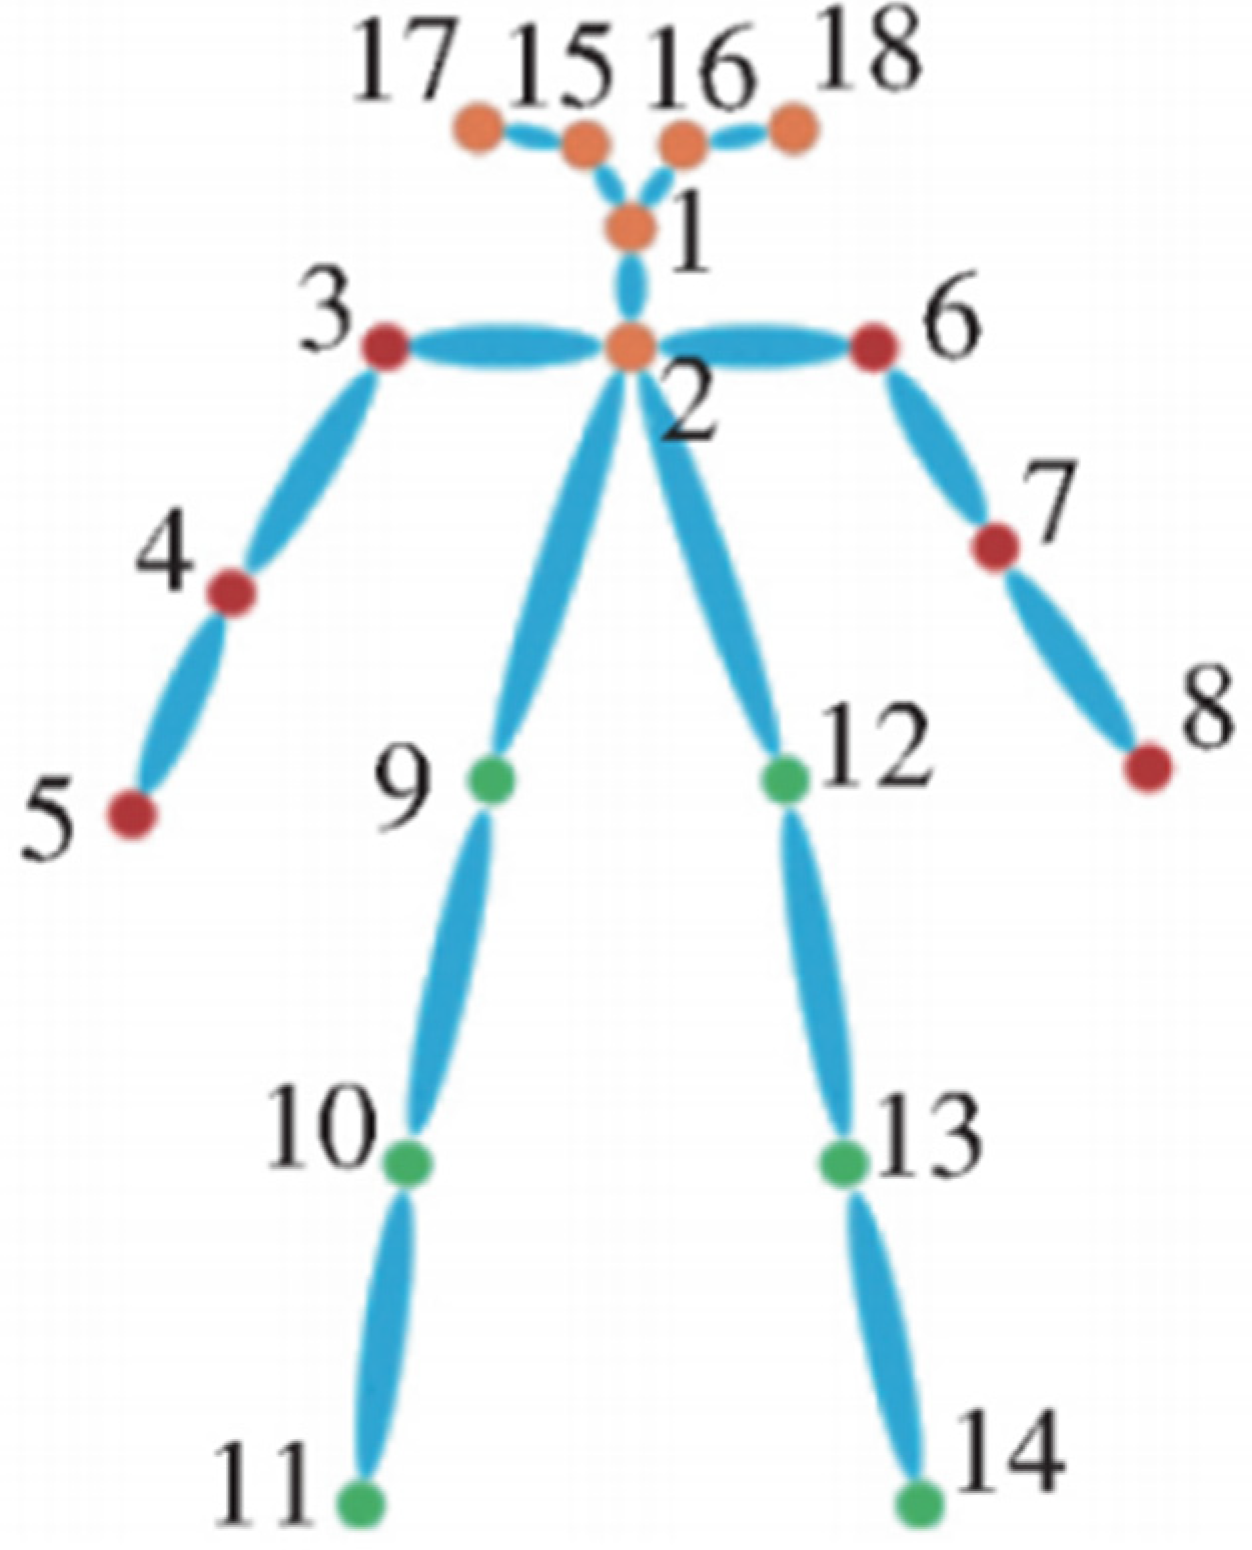
Figure 1. The framework of the proposed model.
Wevj 13 00158 g001
Figure 2. Pedestrian key points.
Wevj 13 00158 g002
Figure 3. Key points for stable identification.
Wevj 13 00158 g003
Figure 4. Movement Angle.
Wevj 13 00158 g004
Figure 5. Relative position of pedestrian and vehicle.
Wevj 13 00158 g005
Figure 6. Accuracy—n_estimators’ curve (0–500).
Wevj 13 00158 g006
Figure 7. Learning Curve.
Wevj 13 00158 g007
Figure 8. ROC curve.
Wevj 13 00158 g008
Figure 9. Pedestrian behavior key-point identification.
Wevj 13 00158 g009
Figure 10. Pedestrian crossing intention prediction with relative time.
Wevj 13 00158 g010
Figure 11. Pedestrian crossing intention prediction with longitudinal relative distance between pedestrian and vehicle.
Wevj 13 00158 g011
Figure 12. Pedestrian crossing intention prediction with relative time in different scenarios.
Wevj 13 00158 g012
Figure 13. Pedestrian crossing intention prediction with longitudinal relative distance between pedestrians and vehicle in different scenarios.
Wevj 13 00158 g013
Figure 14. Correlation coefficient matrix.
Wevj 13 00158 g014
Table 1. Index of pedestrian key points.
Index123/64/75/89/1210/1311/1415/1617/18
NameMouthNeckLeft/Right shoulderLeft/Right elbowLeft/Right wristLeft/Right hipLeft/Right kneeLeft/Right ankleLeft/Right eyeLeft/Right ear
Table 2. Outcomes of a binary classification problem.
Actual ResultPredicted Result
1 (Crossing)0 (Not-Crossing)
1 (Crossing)True Positive (TP)False Negative (FN)
0 (Not-crossing)False Positive (FP)True Negative (TN)
Publisher’s Note: MDPI stays neutral with regard to jurisdictional claims in published maps and institutional affiliations.

