Article

The Evolutionary Game Analysis and Optimization Algorithm of Electric Vehicle Cell Innovation Diffusion Based on a Patent Pool Strategy

1
Business School, University of Shanghai for Science and Technology, Shanghai 200093, China
2
School of Medical Instrument and Food Engineering, University of Shanghai for Science and Technology, Shanghai 200093, China
*
Author to whom correspondence should be addressed.
World Electr. Veh. J. 2021, 12(4), 251; https://doi.org/10.3390/wevj12040251
Submission received: 1 November 2021 / Revised: 18 November 2021 / Accepted: 21 November 2021 / Published: 25 November 2021

Abstract

:
A patent pool strategy was proposed for use in the electric vehicle cell industry to manage patent licensing disputes and litigation. How to promote EV cell innovation diffusion under a patent pool scenario is unclear. We introduced an innovation diffusion channel model comprising different players with patent licensing relationships and market competition relationships following evolutionary game analysis and simulation. We found the interlinked factors that influenced evolutionary stable strategies with a sensitivity test on all factors to identify the important and unimportant factors. To achieve the maximum return for the players, an optimization algorithm was introduced to find the maximum weighted object function. The decision and policy makers could focus on important factors such as improving the technology’s competitive advantages, delivering more profits to its licensees with reasonable licensing fees, and finding the best patent pool strategy with the support of the optimization algorithm to balance the competition relationships and patent licensing relationships between players.

1. Introduction

The electric vehicle (EV) cell industry is facing fierce patent disputes and litigation, which are key challenges for this emerging market’s players [1]. The existing literature lacks studies regarding patents in this emerging industry, and a patent pool as a potential tool was proposed for use in the EV cell industry [2]. However, both in theory and in practice, the implementation of fair, reasonable, and non-discriminatory (FRAND) licensing principles [1] comes with extensive arguments and litigation. Thus, balancing the competition relationship and the patent licensing relationship of the players to promote innovation diffusion instead needs to be further investigated. In particular, we aimed to answer the following questions: if each of the patent holders in the patent pool owns an EV cell producer and they also compete with their licensees’ EV cell producers, what are the factors that influence the adoption of a patent pool, which factors are the most important, how do the factors influence each other, and what is the best strategy to maximize the returns of the patent pool members?
Based on the existing literature regarding electric vehicle cell innovation diffusion without a patent pool [3], we extended our analysis to consider patent pool strategy by following the evolutionary game and optimization algorithm approaches, which sets our study apart from others in the literature that consider different industries, different factors, different supply chain structures, or different approaches [4,5,6,7,8,9,10,11,12,13,14,15,16,17,18]. This study contributes to the existing literature on innovation diffusion in the electric vehicle cell industry since it considered a patent pool strategy, established an innovation diffusion channel model, conducted an evolutionary game analysis and simulation, identified the key factors and the interplay between these factors, and developed an optimization algorithm for use by decision- and policymakers.
This paper is organized as follows. In Section 2, we introduce the literature background and a list of questions that we aimed to answer in this study. The proposed innovation model is presented in Section 3, where we identified which players are involved in the innovation diffusion model. Following this, we discuss the pay-off matrix and evolutionary game model. In Section 4, the use of Vensim simulation software to carry out sensitivity tests on the identified factors is discussed. In Section 5, we introduce an optimization algorithm to find the best patent pool strategy for promoting innovation diffusion. Finally, our results are discussed and conclusions are drawn in Section 6.

2. Literature Background

Patent licensing can be a barrier to innovation diffusion and adoption. Establishing a patent pool is one of the strategies that can be utilized to accelerate innovation diffusion [1]. Sun et al. measured China’s new energy vehicle patents using a social network analysis approach and suggested that the creation of a patent pool could be a suitable solution to tackle the patent licensing issue in the industry [2]. Sun and Zhang studied a patent licensing strategy to promote the electric vehicle cell innovation diffusion, but the licensor not considering patent pool strategy [3]. Liu et al. studied electronic product supply chain patent licensing and outsourcing strategies [4]. Bagchi and Mukherjee studied different patent licensing strategies’ impacts on the profits of patent holders under product differentiation and market competition scenarios [5]. Hill found that licensing fees played a critical role in patent licensing when licensing to a competitor [6]. Wang studied a patent licensing fee strategy under a duopoly in a Cournot competition scenario [7]. Wu analyzed the price competition and patent licensing options under a duopoly [8]. Zhang et al. studied the best patent licensing strategy in a supply chain consisting of the joint research and development (R&D) investments of an original equipment manufacturer (OEM) and a contract manufacturer [9]. Narasipuram and Mopidevi described optimization algorithms that could create optimal designs for EV charging stations [10]. Yuan analyzed the threshold on firms’ patent pool number and found a negative correlation between the threshold and patent licensing fee [11].
Regarding electric vehicle or electric vehicle cell innovation diffusion, Fang et al. studied the policy incentives and user preference factors [12]. Huan identified the different resources that are involved in EV cell patents [13]. Chu and Zhu estimated Chinese EV ownership based on the Bass model and the GM (1, 1) model [14], while Zhang et al. used the Bass model and the Lotka–Volterra model [15], which predicted different future results and analyzed the difference. Li et al. analyzed the impact of government policies EV diffusion in complex networks [16]. Liu and Xiao used the system dynamics (SD) model to explore the impact of the policy incentive factor on EV development [17]. Gómez et al. analyzed the effect of EV purchase incentives on EV adoption in the European Union [18].
In contrast to the existing literature, this study aimed to investigate the patent pool licensing strategy in the EV cell industry, which is different from past studies in terms of the industry, supply chain structure, influencing factors, and approach. The goal of the study was to find what the key factors are, how these factors influence each other, and what the best strategy is to maximize the return of the patent pool members with an evolutionary game and optimization algorithm approach. We hope that our results will support decision makers in identifying ways of promoting innovation diffusion and maximizing return through innovation channels, which contributes to extending the innovation diffusion theory and has managerial and policy implications regarding patent pool licensing strategies in the EV cell industry.
The assumption of our study was that several patent holders create an EV cell patent pool and that they also own EV cell producers that produce EV cells. These producers compete with each other to win market share and profits. The patent pool members do not need to pay a licensing fee for the patent pool, while the non-member licensees do. The patent licensing fees are allocated to the members of the patent pool based on their number of patent contributions. The non-member licensees can adopt EV cell technology from the patent pool or use a competitor’s technology.
This study aimed to answer the following questions:
(1)
What are the innovation diffusion structures under the patent pool scenario?
(2)
What are the factors that influenced the adoption of patent pools, which are the most important factors, and how do these factors influence each other?
(3)
What is the best strategy to maximize the return of the players?
In order to answer these questions, we first introduced the innovation diffusion model so that we could better understand the supply chain structure and the key players [19]. We then developed an evolutionary game model with a simulation to investigate the payoff and evolutionary stable strategies (ESSs) and to uncover the factors that influence the adoption ratio (innovation diffusion ratio). Furthermore, we established a weighted object function and an optimization algorithm to identify the best patent pool strategy.

3. Proposed Model

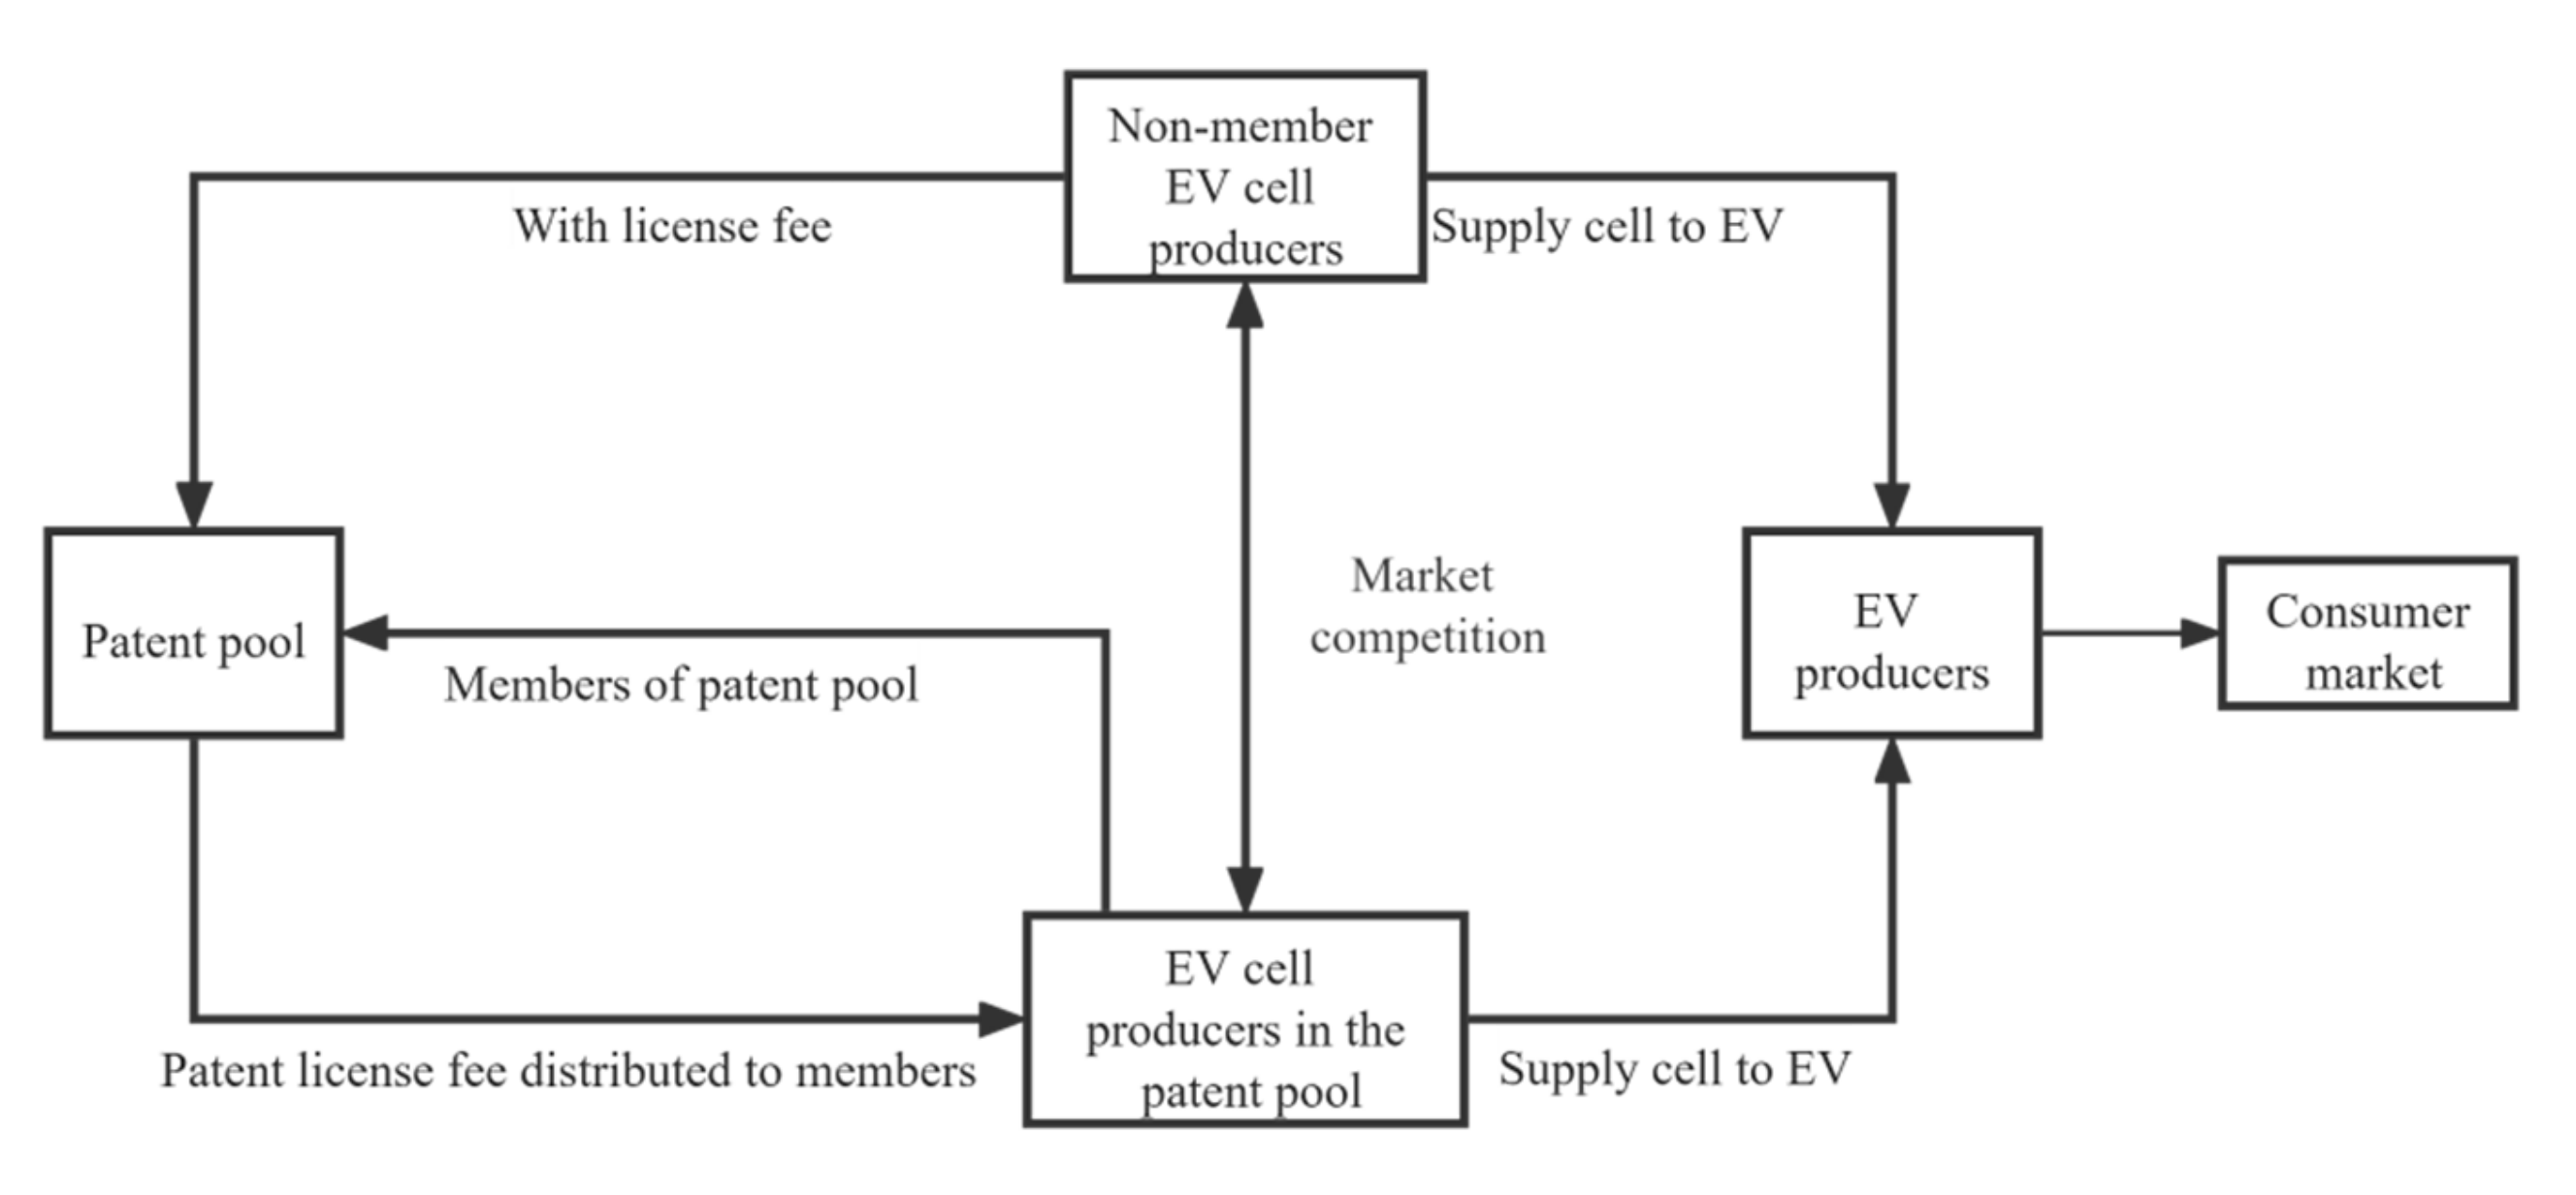
3.1. The Innovation Diffusion Channel of the EV Cell Patent Pool

The innovation diffusion channel of the EV cell patent pool is illustrated in Figure 1. It consists of a patent pool, its members (who also own an EV cell producer), non-member EV cell producers, EV producers, and consumer markets. We focused on the relationship between the patent pool, its members, and its non-members.
The patent licensing relationship is explained as follows: The patent pool is created to integrate all necessary patents into one pool. The members are the patent holders of the patents in the patent pool, and the patent pool licenses the patents in the patent pool as a package to the external potential adopters or named non-member licensees. The patent licensing fee is distributed among the members of the patent holders based on their number of contributions to the patent pool.
Besides the patent licensing relationship, there exists market competition between EV cell producers and non-member EV cell producers, who supply EV cells to EV producers or, in some instances, directly to the consumer.

3.2. Assumptions

(1)
Market potential assumptions: We assumed that the overall potential market size after its long-term evolution and the actual current market size follow a logistic growth model (i.e., short term to long term).
(2)
Technology advantage assumptions: We assumed that the EV cell technology in the patent pool has a competitive advantage over other options, i.e., the EV cell has higher safety and performance, such as shorter charging time and longer battery range. The advantage ratio of the potential market share of the EV cell patent pool is in the range of [0.5, 1].
(3)
Patent pool licensing assumptions: We assumed that patent holders in the patent pool can use the patents in the patent pool free of charge, while non-members need to pay a patent licensing fee to the patent pool at a package cost. The licensing fee is distributed to the members of the patent pool based on their contributions to the patent pool.
(4)
Player assumptions: We assumed that there are EV cell patent holders in the patent pool (number n), that there are non-member licensees outside the patent pool (number s), and that each member or non-member owns one EV cell producer.
(5)
Adoption decision-making assumptions: We assumed that producers’ adoption decision making is based on calculations and comparisons of the benefits and costs. If the benefit is greater than the cost to adopt the patent pool, then the adopter will choose to adopt; otherwise, they will not.

3.3. Payoff for Players

If the non-member EV cell producers adopt the patent pool technology, then the patent pool is diffused to the adopters (potential non-member licensees). The payoff matrix is shown in Table 1.
The payoff table was created based on the literature [3,11,13,16]. To simplify the analysis, we ignored factors such as government subsidies and patent pool commission, choosing instead to focus on the patent licensing and market competition cost and benefit factors according to the assumption in Section 3.2. The details listed in Equations (1) and (2) and the total return of the patent pool member was calculated as shown in Equation (3):
B 1 = a m l + r n + s x
B 2   =   m u 1 a 1 x s
P A   = a m q n + s x + l m 1 a n
where x is the ratio of potential adopters that adopted the patent pool technology, a is the technology advantage ratio of the patent pool, l is the patent pool licensing fee that non-member licensees pay per unit of EV cell, r is the EV cell producers’ unit profit if patent the pool technology is adopted, u is the EV cell producers’ unit profit if the patent pool technology is not adopted, s is the total number of non-members, and n is the number of patent pool members.

3.4. Replicator Dynamic Equation

The replicator dynamic equation (RDE) of a non-member EV cell producer is shown in Equation (4):
F x = d x d t = x a m 1 x r l n + s x m u 1 a s
and its derivative is given in Equation (5):
d F x d x = a m 1 x r l n + s x m u 1 a s + x a m s 1 x r l n + s x 2 a m r l n + s x
Based on the replicator dynamic equation and its derivative, we found the two equilibrium points of x. Their derivative values are calculated as shown in Table 2.

4. Simulation

We used Vensim software (PLE, Ventana Systems. Inc, Harvard, MA, USA), which is based on system dynamics and was developed by Professor Forrester [20]. It has become an important method for qualitatively and quantitatively studying dynamic and complex systems to uncover the interaction or interplay between the components in the system [21]. The simulation diagram consisted of level variables, such as the adoption ratio, auxiliary variables (such as B1 and B2), and constants (such as the initial adoption ratio). The variable relationship could be set by linking the variables with equations. The flow rate formula and functional relationship are described by Equations (4) and (5). The time step was 0.0078125, the unit was years, the initial time was 0, the final time was 10, and the integration type was RK4 auto. The detailed diagram is shown in Figure 2.
To set the parameters for the simulation, the initial values were set according to the existing literature [13,14,15] and public resources in the Chinese market, such as listed reports of the Contemporary Amperex Technology Co., Limited. (No. 2, Xingang Road, Ningde, China) and BYD Company Ltd.(3009 BYD Road, Pingshan District, Shenzhen, China) The details are shown in Table 3.

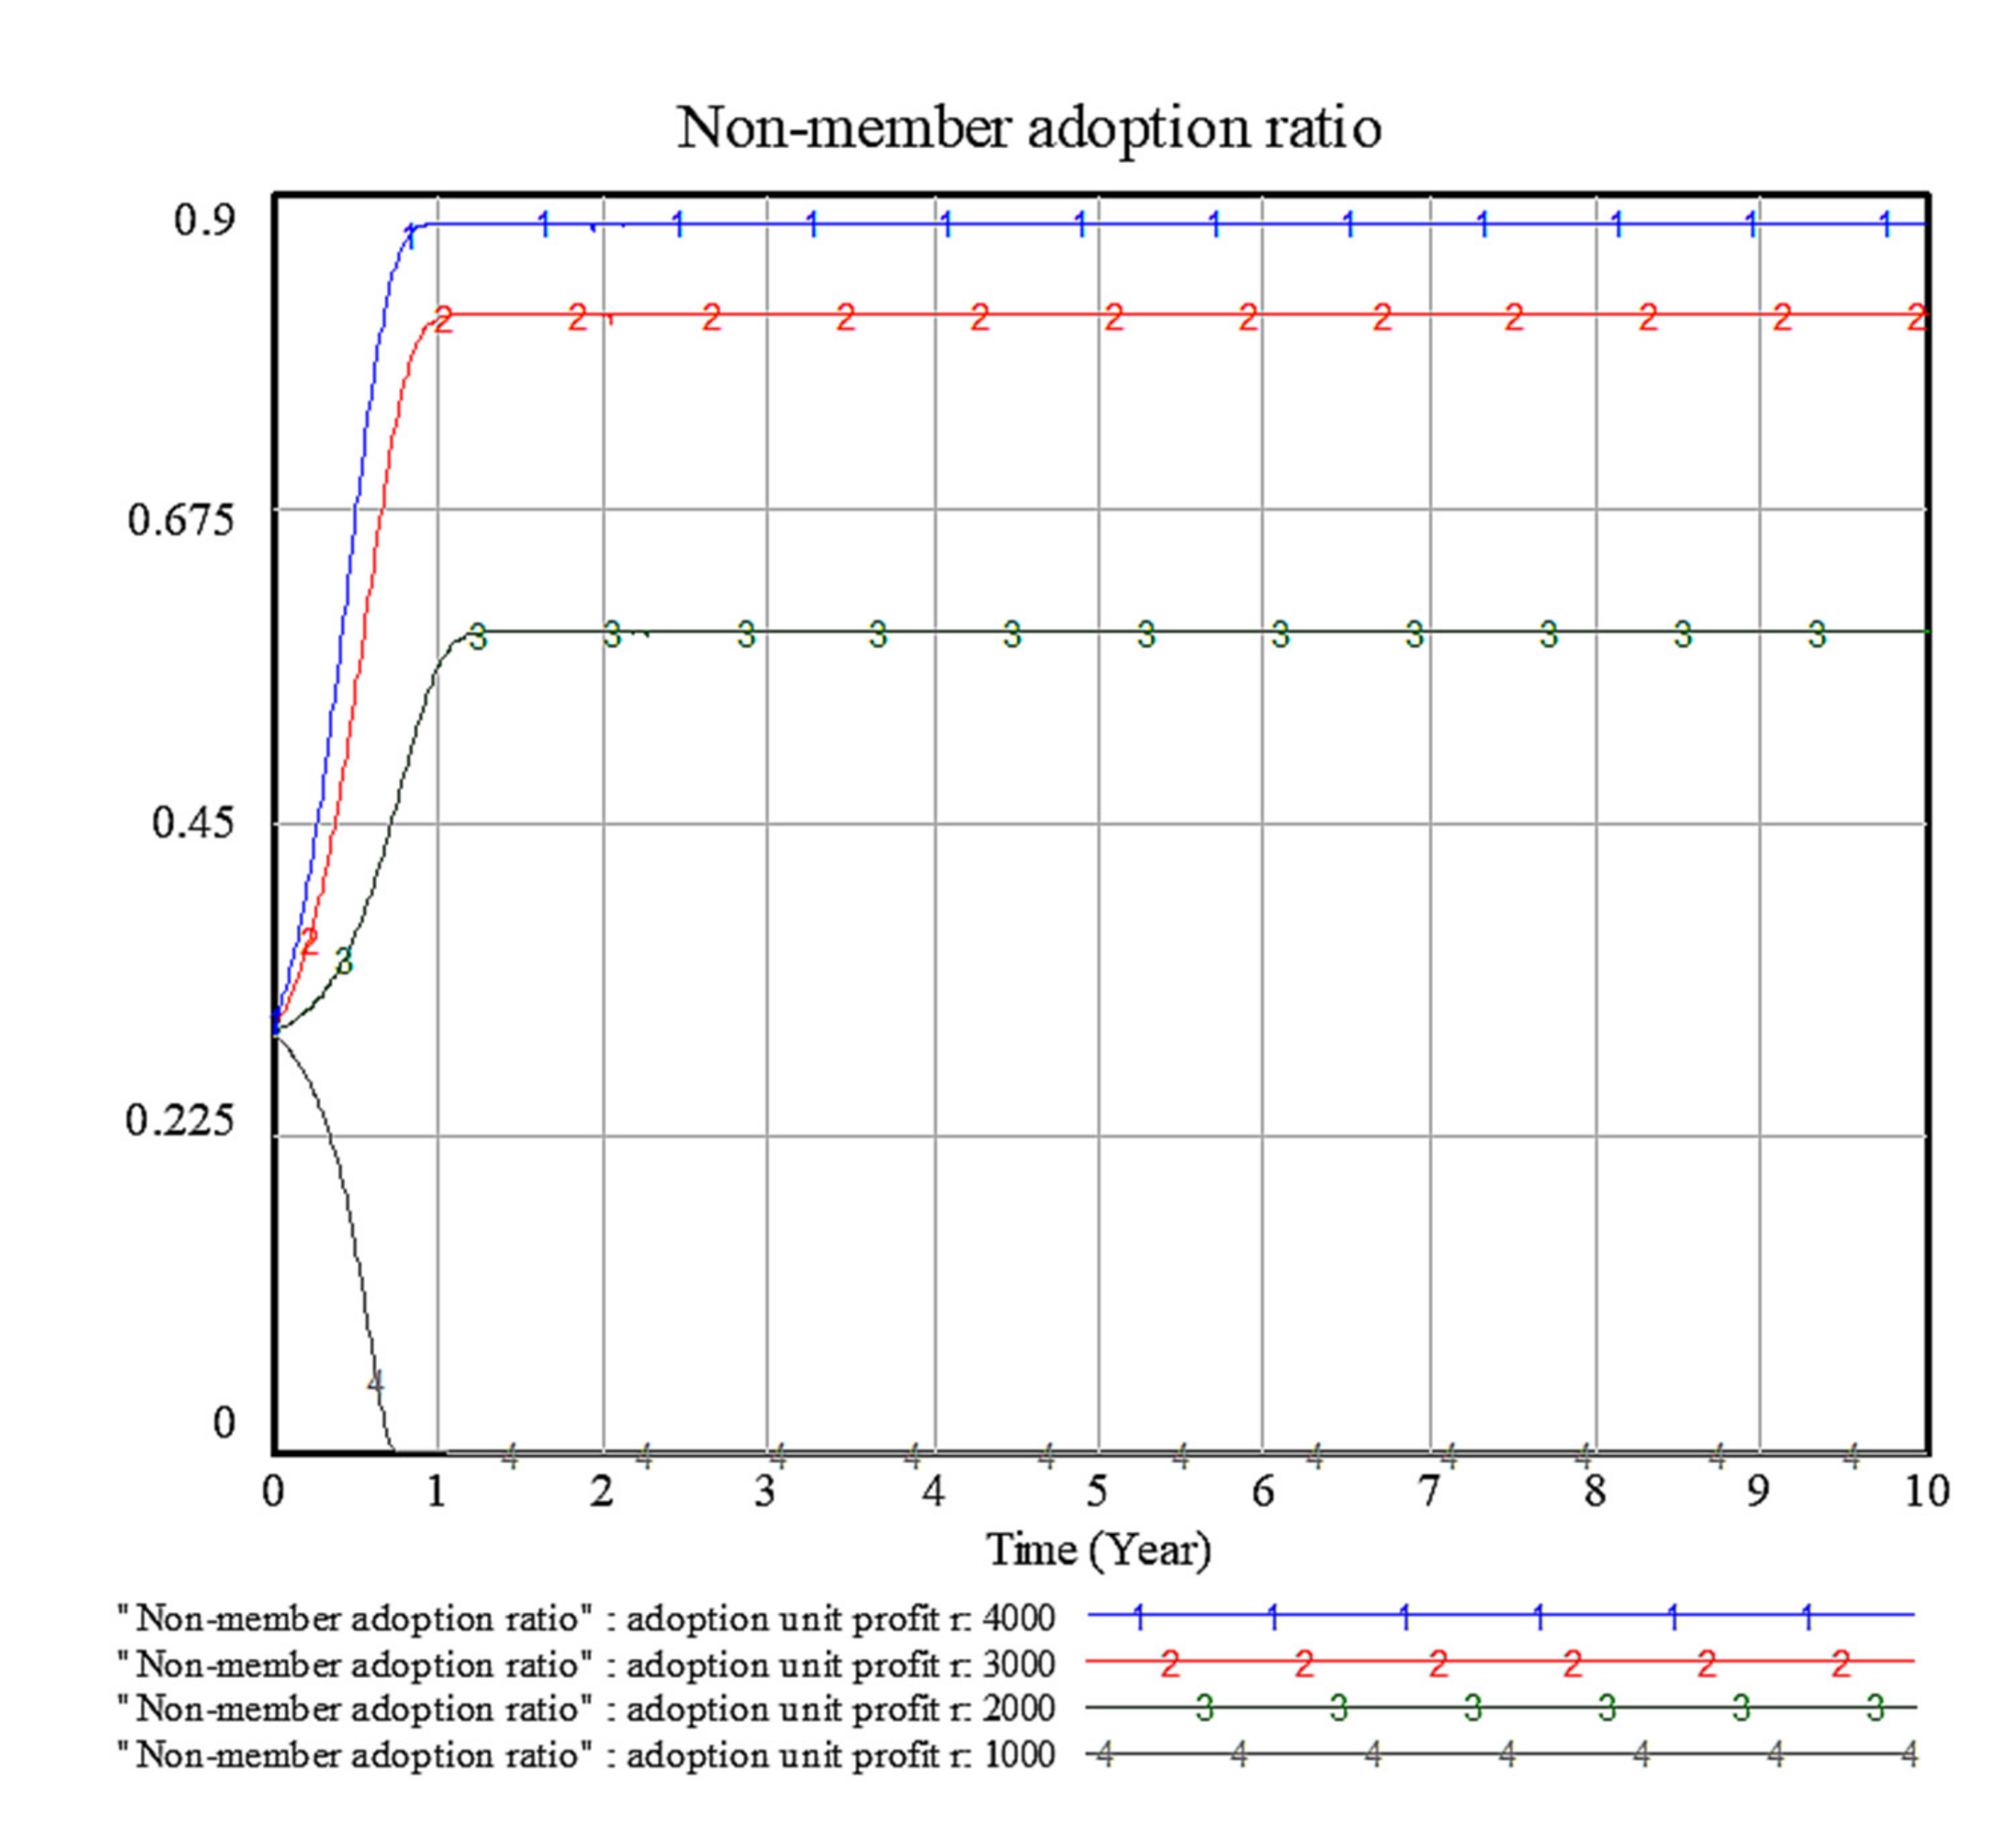
4.1. Sensitivity Analysis of Factor r: Unit Profit of Non-Member EV Cell Producers That Adopts the Patent Pool

The simulation shows that the adoption ratio changed, along with the unit profit of non-member EV cell producers that adopted the patent pool, which is factor r. The simulation analysis found that r had a significant positive effect on the ESS, which is the stability ratio after long-term evolution; that is, the higher the unit profit, the higher the adoption ratio and the greater the diffusion depth of the technological innovation outside the patent pool. When the unit profit from the adoption of the patent pool technology was greater than 2000, the diffusion depth was greater than 50%, and the diffusion depth was 0% when the profit was 1000. If the unit profit was 4000, the diffusion depth was close to 90%, as shown in Figure 3.

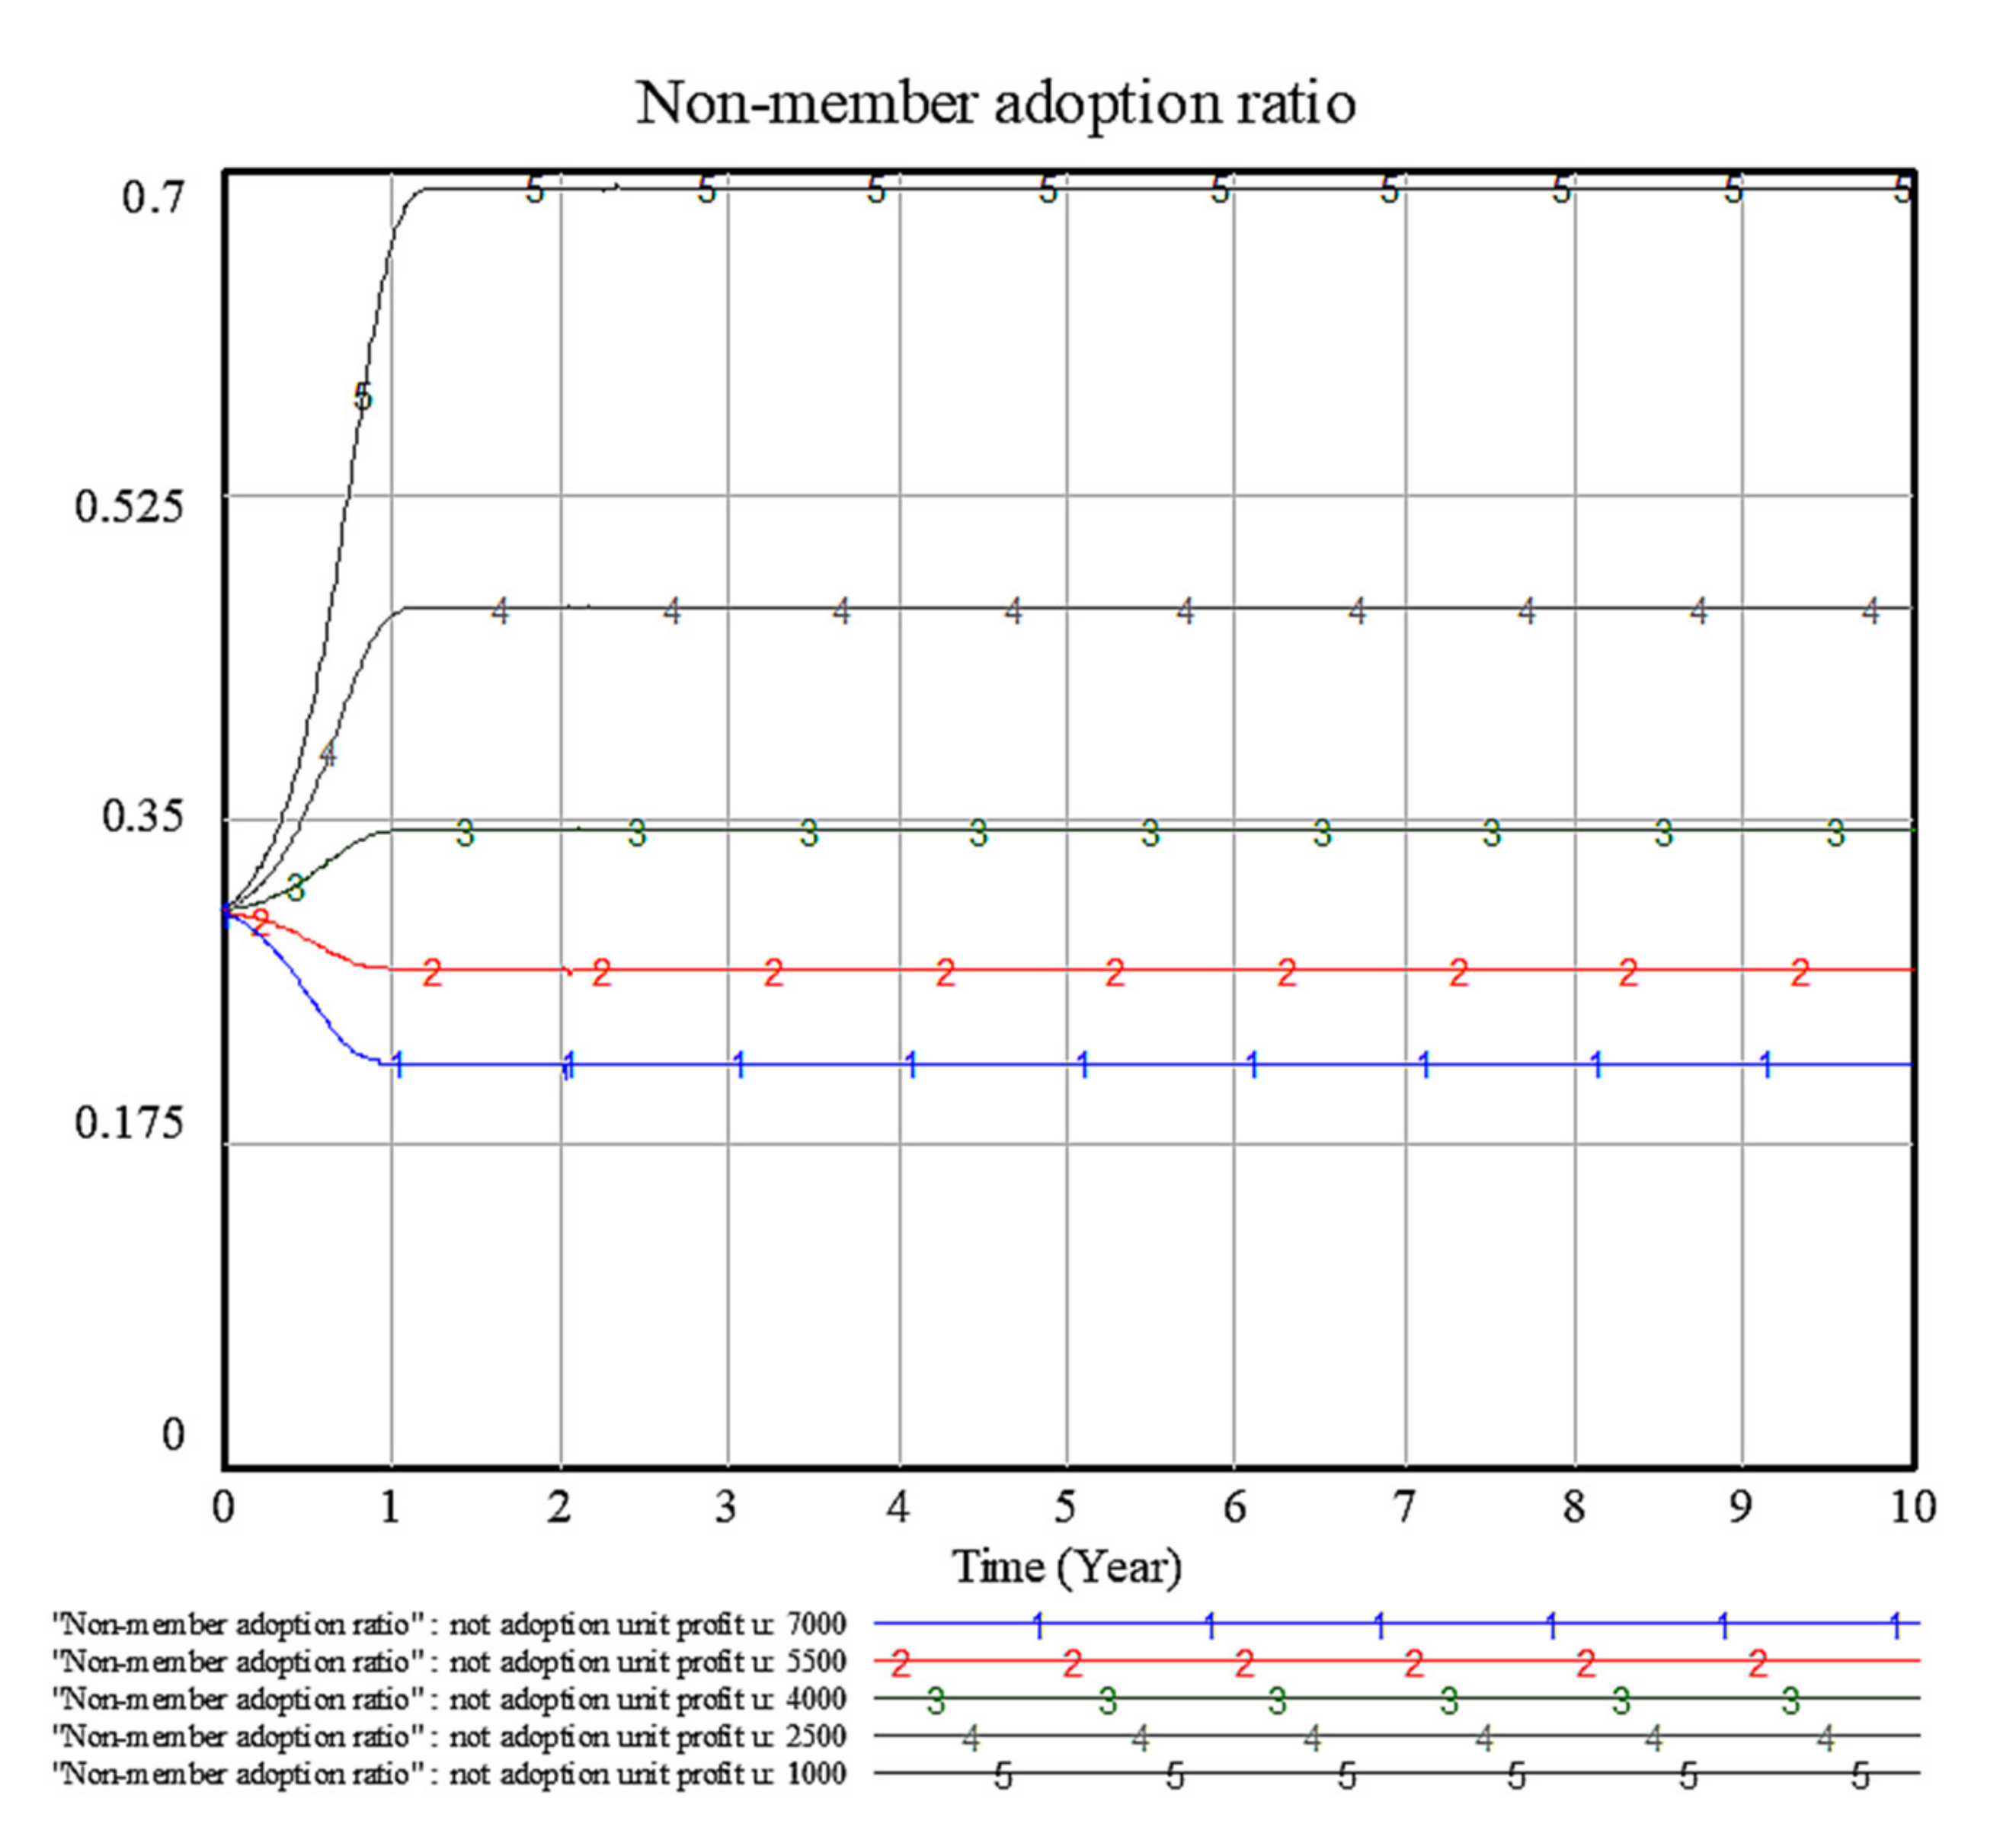
4.2. Sensitivity Analysis of Factor u: Unit Profit of Non-member EV Cell Producers That Adopted the Non-Patent Pool Technology

Our analysis showed that the adoption ratio had a negative correlation with the unit profit of those that adopted the non-patent pool technology. We also found that the unit profit had a negative impact on the diffusion ratio; that is, the higher the cell unit profit, the lower the adoption ratio and the smaller the diffusion depth of technological innovation outside the patent pool. When the unit profit was above 2500, the diffusion depth was less than 50%, but when the unit profit was 1000, the diffusion depth was close to 70%, as shown in Figure 4.

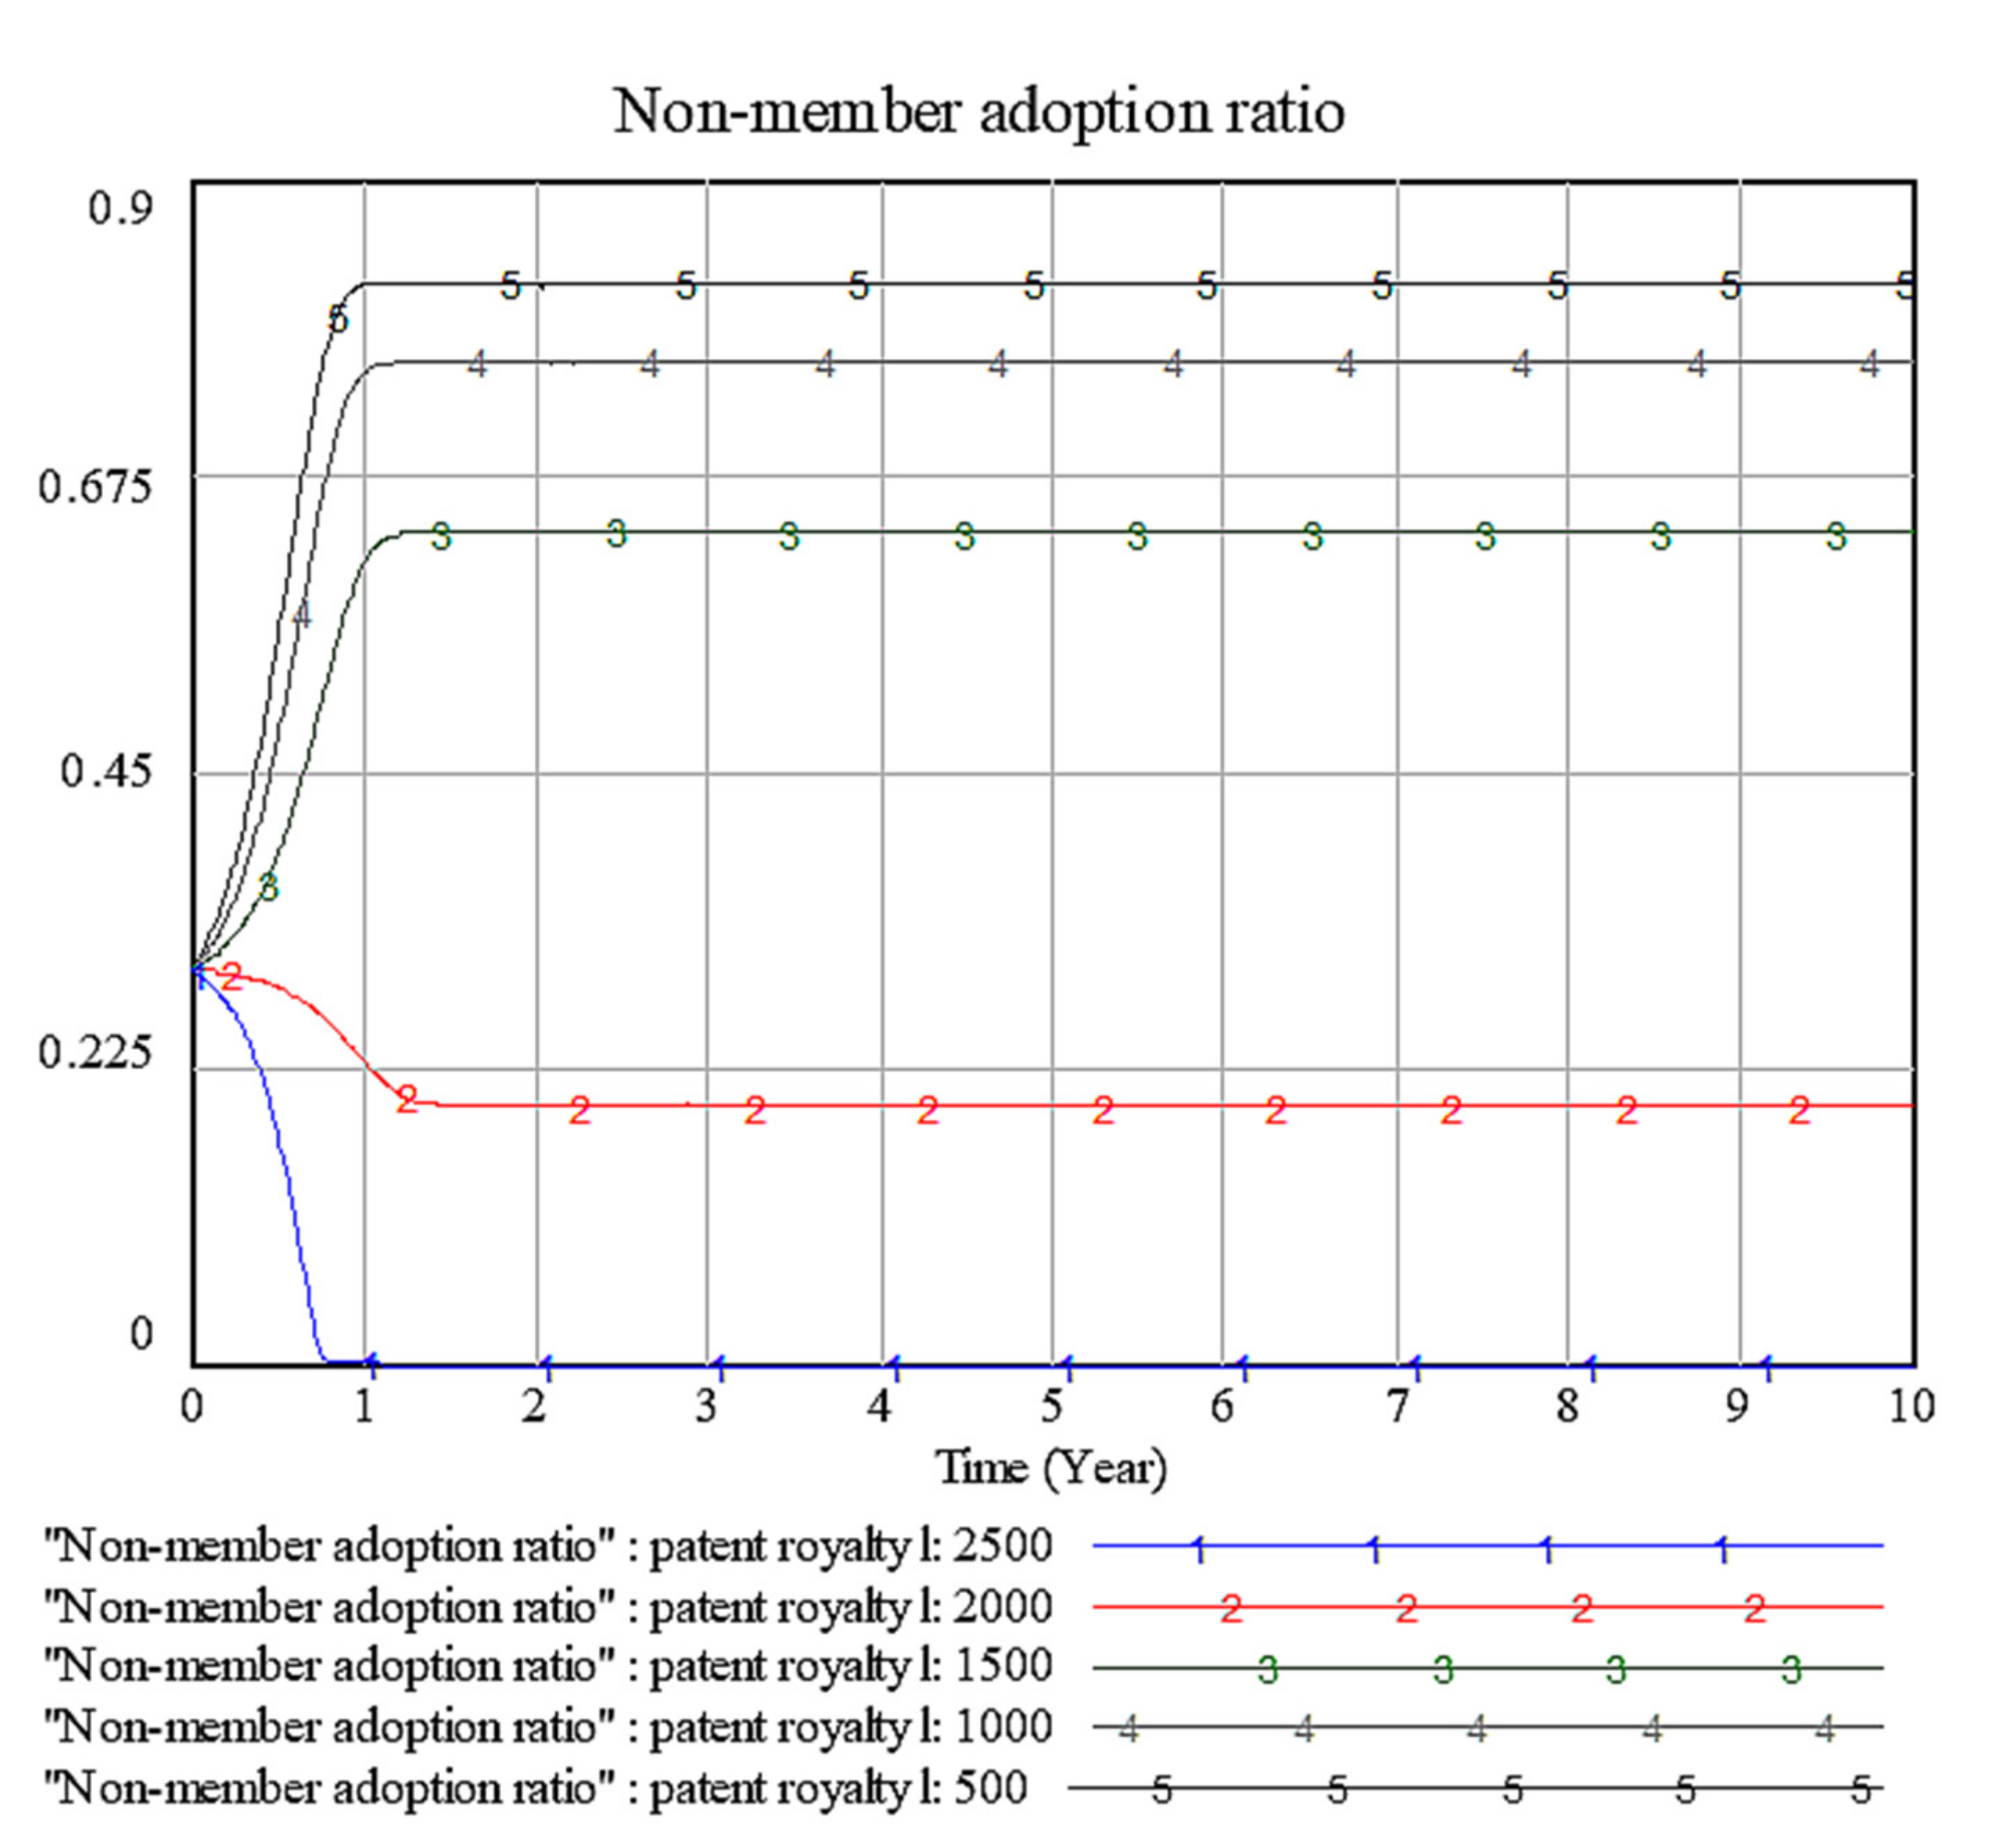
4.3. Sensitivity Analysis of Factor l: The Patent Royalty of Each Unit EV Cell of Each EV Cell Producer That Pays for the Patent Pool

When the patent royalty was too high, the rational choice for EV cell producers was not to adopt the patent technology. The diffusion ratio thus decreased with a rise in the patent royalty, which had a negative influence on the depth of technology innovation diffusion; that is, the higher the patent royalty, the lower the adoption ratio, and less technology innovation diffused outside the patent pool. When the patent royalty was below 1500, the diffusion depth was greater than 50%, but when the patent royalty was more than 2000, the diffusion depth was less than 22.5%, as shown in Figure 5.

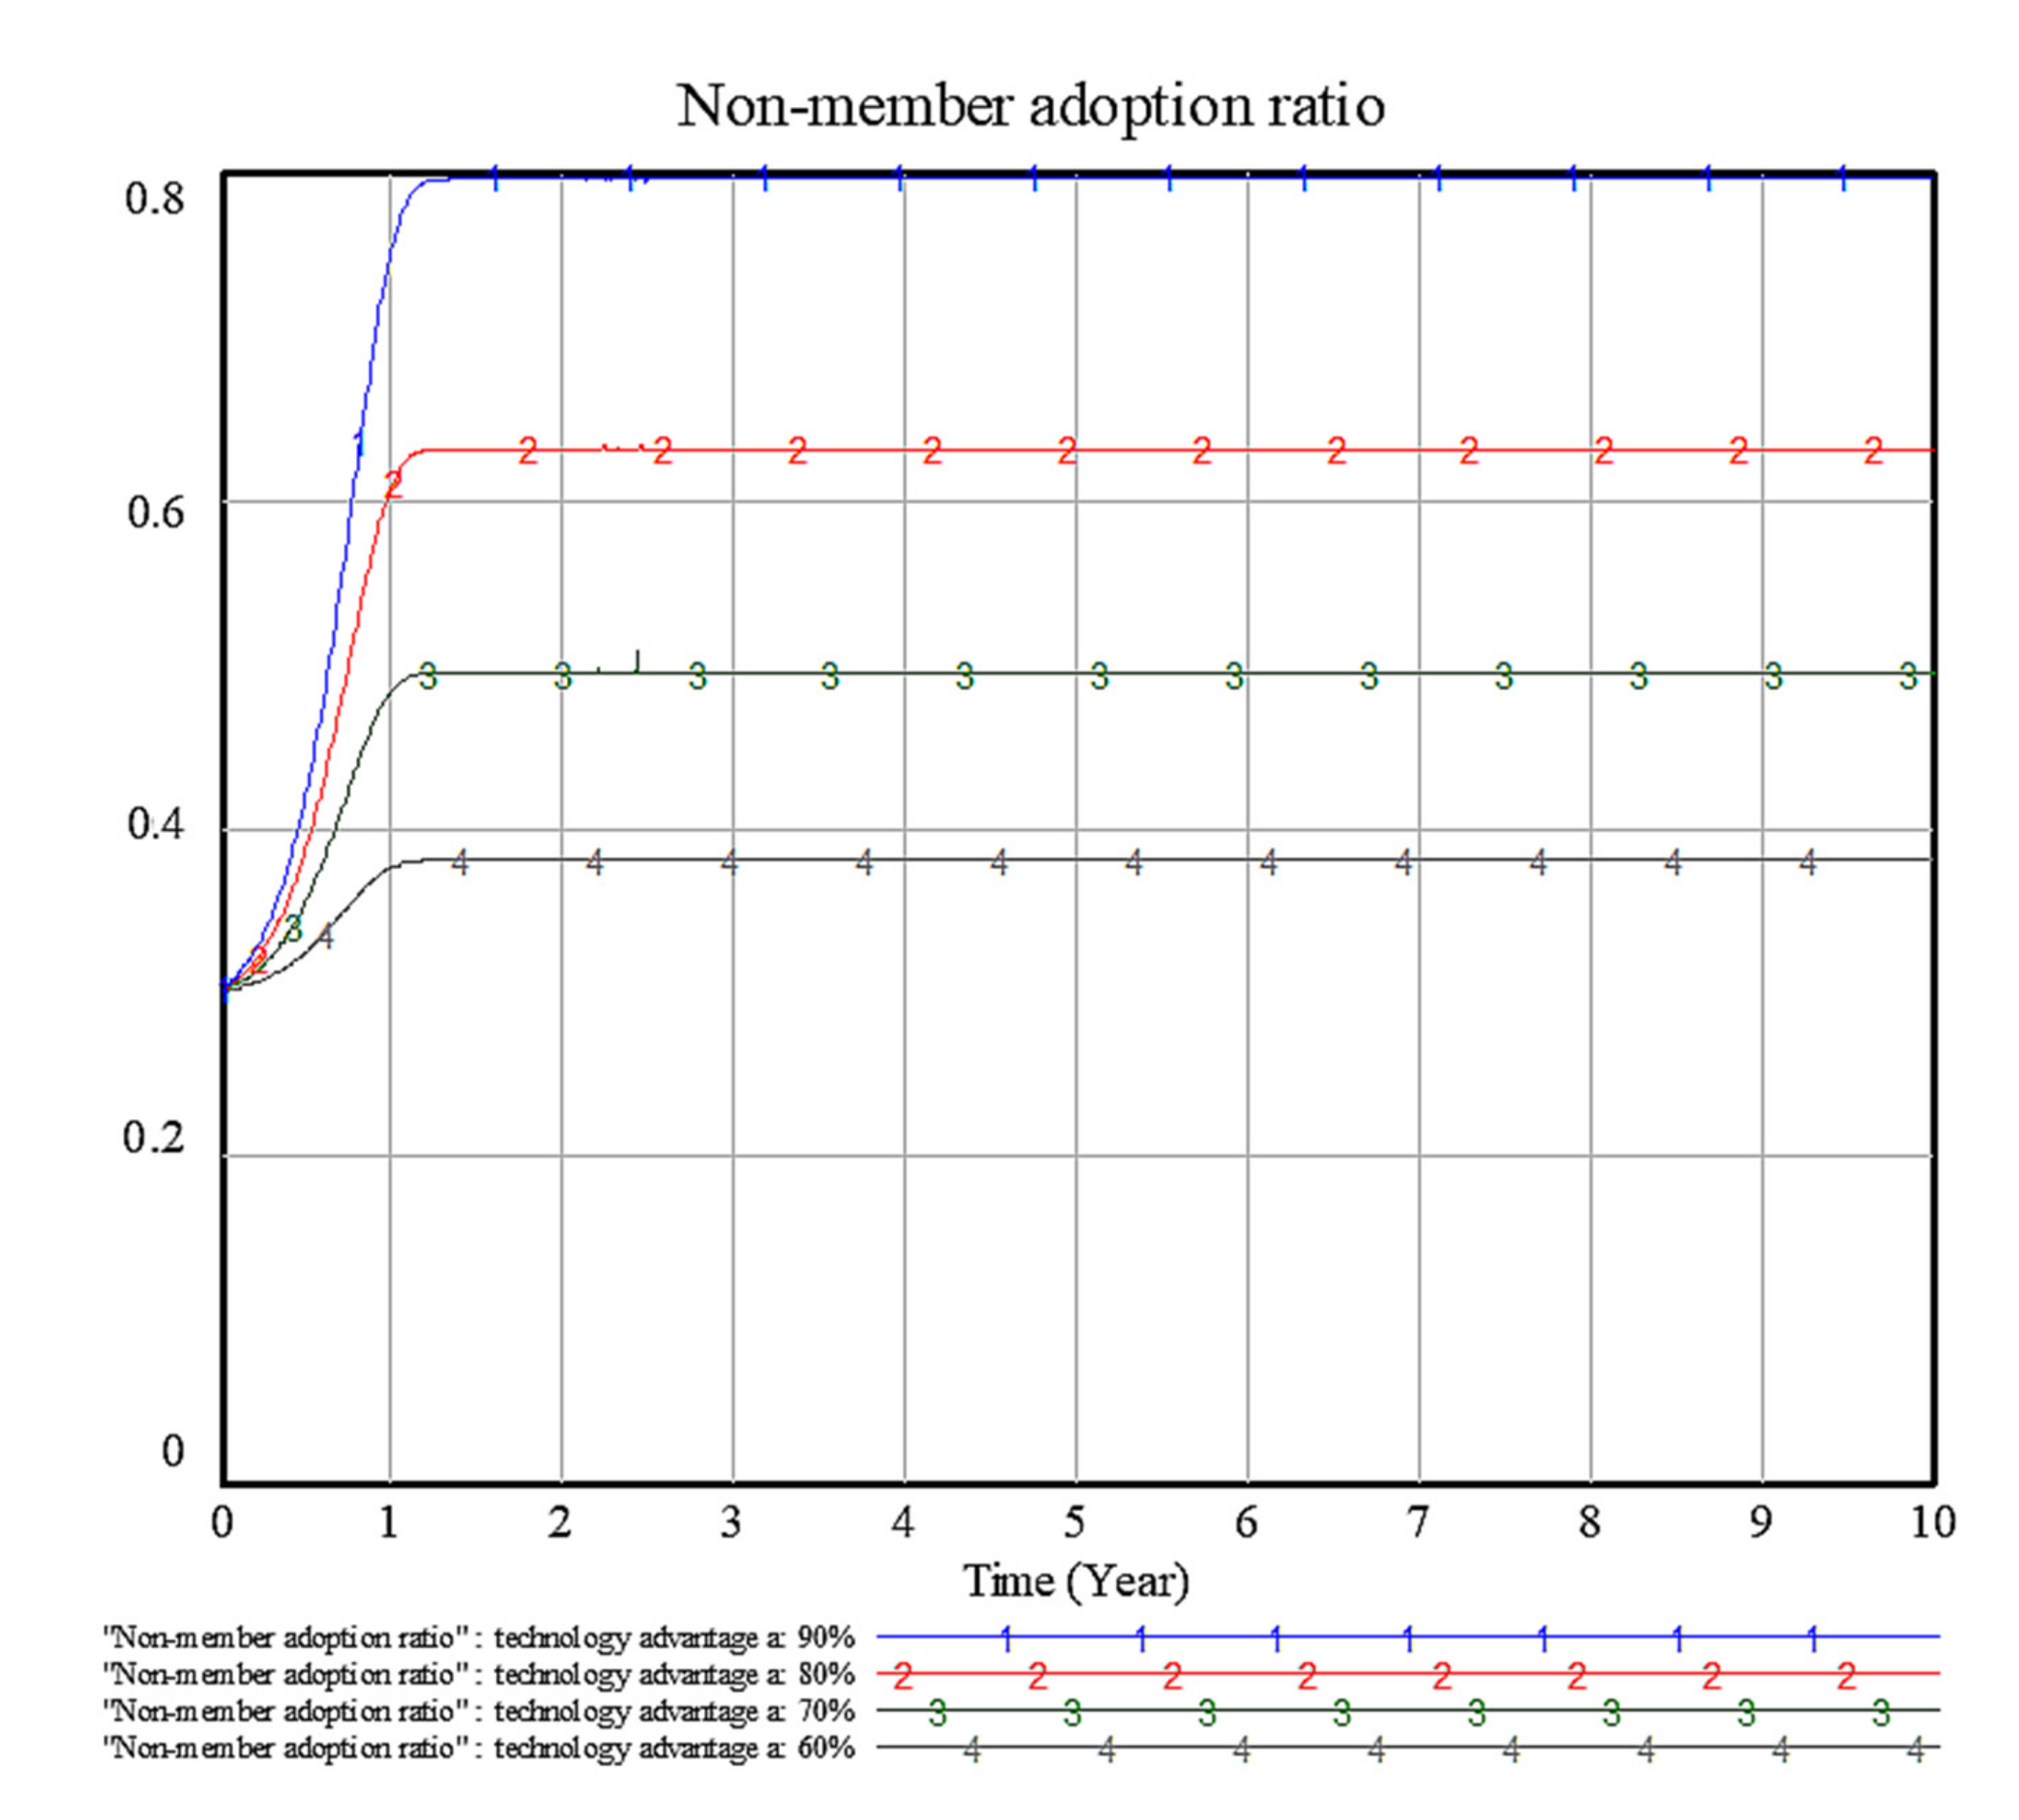
4.4. Sensitivity Analysis of Factor a: Patented Patent Pool Technology Advantage Coefficient

Our simulation showed that the advantage coefficient of patented pool technology had a significant impact on the diffusion depth of technological innovation if it had a comparative advantage over a competitor technology, such as in terms of performance, safety, or compatibility. The advantage coefficient had a positive correlation with the diffusion depth. When the advantage coefficient was 60%, the diffusion depth of the EV cell could reach near 40%; when the advantage coefficient was 70%, the diffusion depth was about 50%; and when the advantage coefficient was 90%, the diffusion depth could reach about 80%. That is, the advantage coefficient had a positive effect on the diffusion depth, and the effect was nonlinear, as shown in Figure 6.

4.5. Sensitivity Analysis of Factor n: Total Number of Patent Pool Members

The influence of the number of members in the patent pool (n) on the evolution of the system showed that the more firms there were in the patent pool, the smaller the diffusion depth; that is, the number of members in the patent pool had a negative impact on the evolutionary stability strategy, which was the depth of the technological innovation diffusion. When the number of members changed from 50 to 650, the diffusion depth changed from about 60% to 20%. Thus, we could conclude that the number of members in the patent pool had a negative influence on the depth of diffusion, as shown in Figure 7.

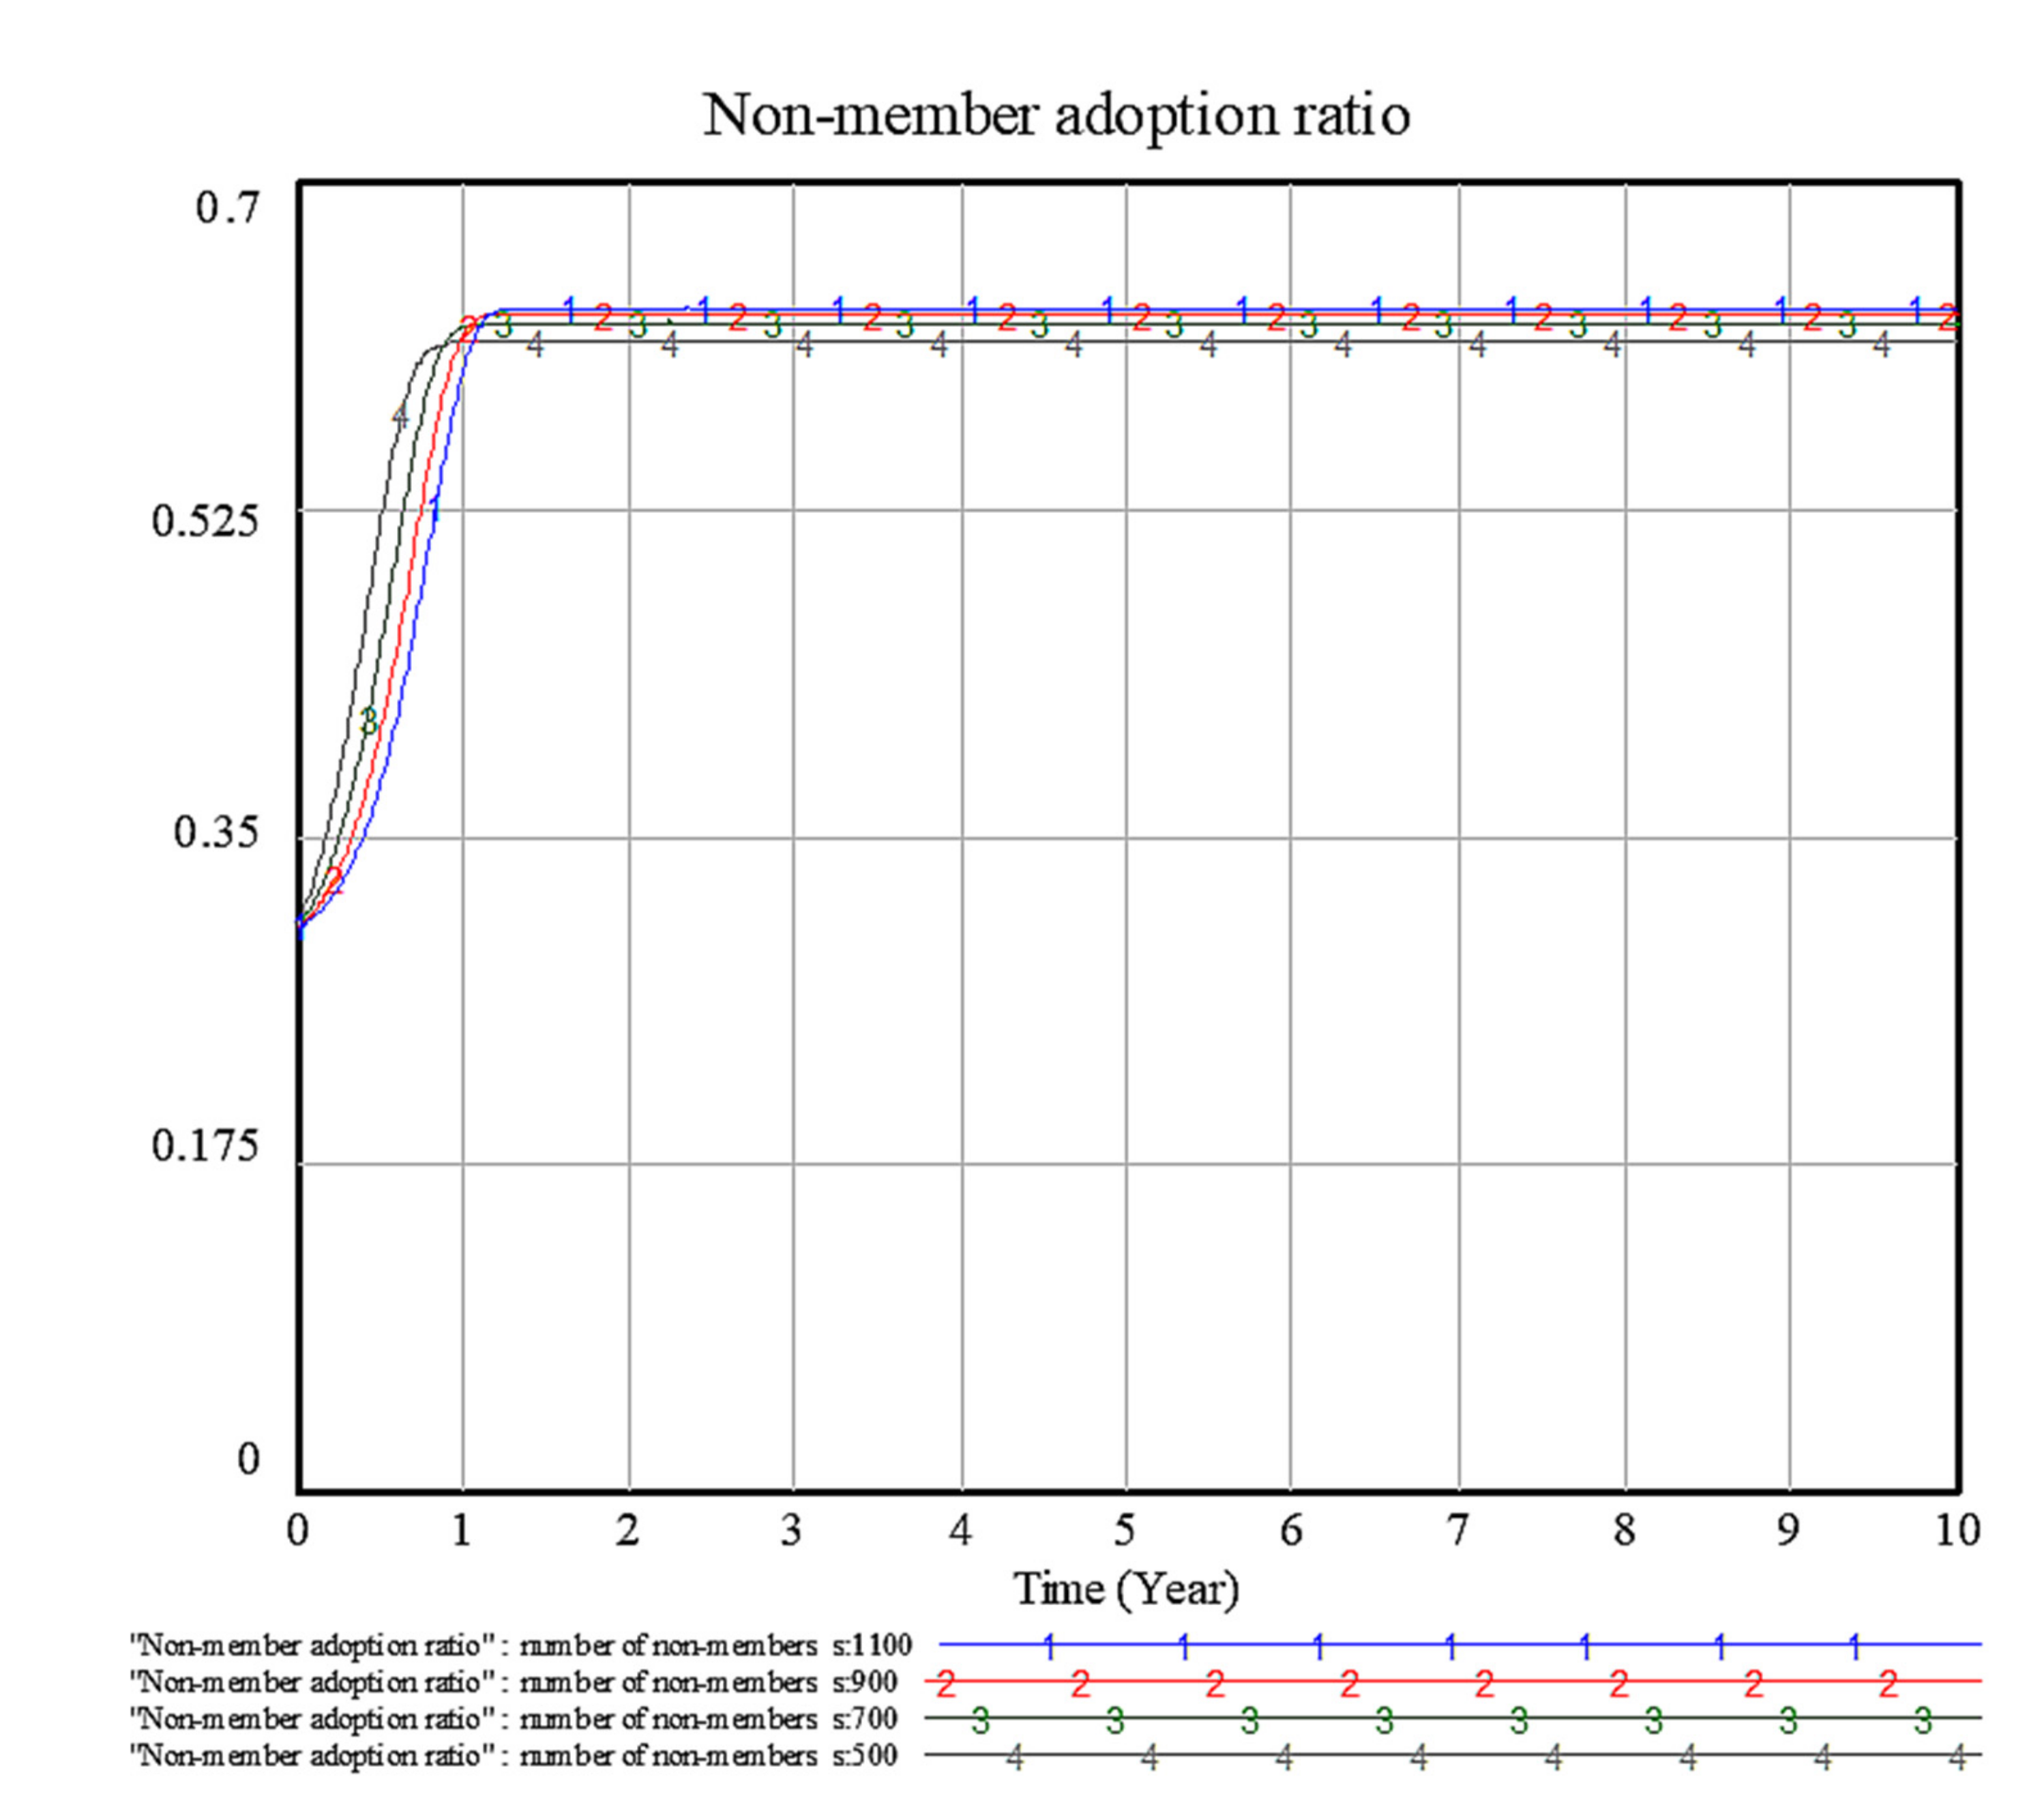
4.6. Sensitivity Analysis of Factors: Total Amount of Non-Member EV Cell Producers

Further analysis on the impact of the number of EV cell producers outside the patent pool on the evolution of the system (s) showed a positive impact on the depth of technological innovation diffusion, i.e., the more EV cell producers there were outside the patent pool, the greater the proportion of adoption of the technology in the patent pool. When the number changed from 500 to 1100, the depth of diffusion changed slightly, but the positive impact was not significant, as shown in Figure 8.

5. Optimization Algorithm

The critical decision making for optimal licensing strategies requires further study. Similar to [3], we found that the decision-making space included three major directions: adjusting the patent royalty, increasing the advantage coefficient via investment in R&D, and changing the number of patent pool members.
The objective function can be the weighted object function based on the adoption ratio and the patent holder’s profit. The lower limit of the adoption ratio of the objective function can be set by enterprises, such as expecting more than 50% of EV cell producers to adopt the patent pool technology; the weight can be changed to adapt to the actual situation.
The objective function is shown in Equation (6):
m a x f = w a m q n + s x + l m 1 a n + 1 w x *
subject to:
x * = a l s a n u a r s + n u s a l a r + a u u x _ l o w , 1 ,   if   the   ESS   exists a 0.5 , 1 l l _ l o w , l _ u p p e r
The pseudo code of the optimization algorithm is shown below:
Step 1.
Initialize the parameters;
Step 2.
For a (0, 1);
Step 3.
For n (n_low, n_upper);
Step 4.
For l (l_low, l_upper);
Step 5.
If calculate x*   (x_low, 1);
Step 6.
If deviation of x* < 0;
Step 7.
Calculate the weight object function;
Step 8.
Compare and record the max_obj;
Step 9.
Update l under assigned step;
Step 10.
Update n under assigned step;
Step 11.
Update a under assigned step;
Step 12.
Return max_obj.
Based on the assigned step for each factor, the local and global maximum object function is reported in Table 4, the weighted object function = 1 × (patent license return + market return) + 0 × diffusion ratio, the patent pool member step was 50 in the range [50, 500], the step of patent royalty was 500 in the range [500, 2100], the advantage coefficient step was 10% in the range [0.6, 0.9], and the lowest acceptable limit of the diffusion ratio was 50%.
The maximum weighted object function is given in bold in Table 4.
Furthermore, we adjusted the weight to w = 1/200,000,000, which put more emphasis on the diffusion ratio rather than the market and patent license return alone. The results are reported in Table 5. Compared with Table 4, we found that the global optimization value was different in terms of factors such as the patent royalty, diffusion ratio, and advantage coefficient.

6. Discussion and Conclusions

The existing literature argues that patents can be legal and financial barriers to the diffusion of technological innovation. To avoid this negative impact, a patent pool was proposed to tackle the litigation issues between licensors and licensees. The patent pool can reduce the patent transaction cost between the patent pool members. However, which patent pool licensing strategy is best for promoting technological innovation is still unclear, especially in the electric vehicle industry. In this paper, we discussed the use of the patent pool strategy in the electric vehicle supply chain, which is different from any study in the existing literature. The diffusion channel and the relationships between the electric vehicle cell producers were analyzed based on the supply chain structure of the industry. Additionally, a tailor-made optimization algorithm is lacking for the aforementioned electric vehicle cell supply chain.
  • First, this study contributed to investigating the innovation diffusion of electric vehicle cells via considering patent pool strategies by establishing an innovation diffusion channel model, which included members of the patent pool and non-members outside the patent pool, which were interlinked with relationships, such as the patent licensing relationship, patent pool mutual licensing relationship, and market competition relationship. The model can be a reference to clarify the roles of and complex relationships between players in the electric vehicle cell supply chain, which is different from other industries or supply structures in the literature. Additionally, the model that was developed in this study extended the innovation diffusion theory by integrating all the key players and their relationships into one model, which can also be helpful for other related research areas.
  • Second, the pay-off matrix and ESS of the players was analyzed based on several factors, including market competition factors and patent licensing factors, such as the technology advantage coefficient, number of patent pool members, number of non-member EV cell producers outside the patent pool, patent license fee, and unit profit for adopters when adopting different EV cell technologies. The evolutionary game model and its analysis extended the innovation diffusion study regarding electric vehicle cells and can also help decision makers in the industry to identify which factors need to be considered.
  • Third, based on the simulation of the evolutionary game, we distinguished the important and unimportant factors that impact the adoption ratio and the diffusion ratio, which can aid decision makers in the electric vehicle industry with finding and changing key factors. We found that the patent licensing fees, the advantage of the patent pool technology, and the unit profit of the non-patent pool technology were the most significant factors. Decision makers should focus on improving the competitive advantage of the patent pool technology and deliver more profit to its licensees with reasonable patent and production costs.
  • Fourth, we found that the return to the patent pool members had a non-linear relationship with several factors, and these factors influenced each other. For example, the stabilized diffusion ratio depended on other factors, and the advantage ratio could have both positive and negative effects on the members. Since competition and patent licensing relationships exist in the supply chain, it is difficult to find the maximum return for the patent pool members.
  • Lastly, for certain decision and policy makers, besides the financial return, there are other social and environmental returns to be considered. For example, a patent pool cell can have more energy-friendly benefits. Therefore, the weighted object function was introduced to have a more comprehensive object based on patent license returns, market returns, and diffusion depth. Furthermore, an optimization algorithm was introduced to find the maximum weighted object function, and the weight of the diffusion ratio can reflect other social or environmental benefits or returns.
Regarding the limitations and future directions, future research will follow three directions: (1) The study was based on the assumption that all necessary patent holders are in the patent pool and that they all own EV cell producers to compete with their licensees, while there are other scenarios that can be investigated in future research, for example, some of the patent holders choose not to engage in the patent pool but to compete with the patent pool or some of the patent pool members choose not to produce EV cells. (2) More empirical data could be collected for further analysis, for example, data from other countries (i.e., not just China). (3) The weight of the object function can be adjusted based on more factors or using different methodologies to adapt to the different decision- and policy makers’ actual requirements, such as to follow the national anti-trust laws regarding market share.

Author Contributions

Conceptualization, W.S.; formal analysis, W.S.; methodology, W.S. and M.Y.; project administration, Z.Z.; resources, Z.Z.; software, W.S.; supervision, Z.Z.; visualization, M.Y.; writing—original draft, W.S.; writing—review and editing, Z.Z. All authors have read and agreed to the published version of the manuscript.

Funding

This research was funded by the National Natural Science Foundation of China, grant number 71371124.

Institutional Review Board Statement

Not applicable.

Informed Consent Statement

Not applicable.

Data Availability Statement

Not applicable.

Conflicts of Interest

The authors declare that they have no known competing financial interests or personal relationships that could appear to influence the work reported in this paper.

References

  1. Chuffart-Finsterwald, S. Patent Markets: An Opportunity for Technology Diffusion and FRAND Licensing? Marq. Intellect. Prop. L. Rev. 2014, 18, 335. [Google Scholar]
  2. Sun, H.; Geng, Y.; Hu, L.; Shi, L.; Xu, T. Measuring China’s new energy vehicle patents: A social network analysis approach. Energy 2018, 153, 685–693. [Google Scholar] [CrossRef]
  3. Sun, W.; Zhang, Z. Promoting Electric Vehicle Cell Innovation Diffusion Considering Patent Licensing Strategy: A Combination of Evolutionary Game and Optimization Algorithm Approach. World Electr. Veh. J. 2021, 12, 95. [Google Scholar] [CrossRef]
  4. Liu, J.; Sun, R.; Liu, F. Outsourcing strategy with patent licensing in an electronic product supply chain. IEEE Access 2021, 8, 98359–98368. [Google Scholar] [CrossRef]
  5. Bagchi, A.; Mukherjee, A. Technology licensing in a differentiated oligopoly. Int. Rev. Econ. Financ. 2014, 29, 455–465. [Google Scholar] [CrossRef] [Green Version]
  6. Hill, C.W. Strategies for Exploiting Technological Innovations: When and When Not to License. Organ. Sci. 1992, 3, 428–441. [Google Scholar] [CrossRef]
  7. Wang, X.H. Fee versus royalty licensing in a Cournot duopoly model. Econ. Lett. 1998, 60, 55–62. [Google Scholar] [CrossRef]
  8. Wu, C.H. Price competition and technology licensing in a dynamic duopoly. Eur. J. Oper. Res. 2018, 267, 570–584. [Google Scholar] [CrossRef]
  9. Zhang, Q.; Zhang, J.; Zaccour, G.; Tang, W. Strategic technology licensing in a supply chain. Eur. J. Oper. Res. 2018, 267, 162–175. [Google Scholar] [CrossRef]
  10. Narasipuram, R.P.; Mopidevi, S. A technological overview & design considerations for developing electric vehicle charging stations. J. Energy Storage 2021, 43, 103225. [Google Scholar] [CrossRef]
  11. Yuan, W. Analysis of the Threshold of the Firms’ Number in the Formation of Patent Pool. Oper. Res. Manag. Sci. 2021, 3, 199–203. [Google Scholar]
  12. Fang, Y.; Wei, W.; Mei, S.; Chen, L.; Zhang, X.; Huang, S. Promoting electric vehicle charging infrastructure considering policy incentives and user preferences: An evolutionary game model in a small-world network. J. Clean. Prod. 2020, 258, 120753. [Google Scholar] [CrossRef]
  13. Huan, H. Quantitative Identification of Fragmentation of Patent Resources—An Empirical Study on China’s New Energy Vehicle Power Battery Patents. J. Intell. 2021, 7, 16–22. [Google Scholar]
  14. Chu, Y.; Zhu, T. Research on Forecast of Electric Vehicle’s Ownership in China Based on Bass Model and GM(1,1) Model. Math. Pract. Theory 2021, 11, 21–32. [Google Scholar]
  15. Zhang, G.; Chen, H.; Li, H. Research on Forecast of Electric Vehicle’s Ownership Based on the Comparison of Bass Model and Lotka-Volterra Model. J. Wuhan Univ. Technol. 2017, 8, 91–98. [Google Scholar]
  16. Li, J.; Jiao, J.; Tang, Y. An evolutionary analysis on the effect of government policies on electric vehicle diffusion in complex network. Energy Policy 2019, 129, 1–12. [Google Scholar] [CrossRef]
  17. Liu, D.; Xiao, B. Exploring the development of electric vehicles under policy incentives: A scenario-based system dynamics model. Energy Policy 2018, 120, 8–23. [Google Scholar] [CrossRef]
  18. Vilchez, J.J.G.; Thiel, C. The Effect of Reducing Electric Car Purchase Incentives in the European Union. World Electr. Veh. J. 2019, 10, 64. [Google Scholar] [CrossRef] [Green Version]
  19. Rogers, E.M. The Diffusion of Innovations; Free Press: Glencoe, IL, USA, 1962. [Google Scholar]
  20. Forrester, J.W. Principles of Systems; MIT Press: Cambridge, MA, USA, 1961. [Google Scholar]
  21. Eberlein, R.L.; Peterson, D.W. Understanding models with Vensim™. Eur. J. Oper. Res. 1992, 59, 216–219. [Google Scholar] [CrossRef]
Figure 1. Innovation diffusion channel of the EV cell patent pool.
Wevj 12 00251 g001
Figure 2. Dynamic system simulation diagram.
Wevj 12 00251 g002
Figure 3. Sensitivity test of factor r’s impact on the EV cell producer adoption ratio.
Wevj 12 00251 g003
Figure 4. Sensitivity test of factor u’s impact on the EV cell producer adoption ratio.
Wevj 12 00251 g004
Figure 5. Sensitivity test of factor l’s impact on the EV cell producer adoption ratio.
Wevj 12 00251 g005
Figure 6. Sensitivity test of factor a’s impact on the EV cell producer adoption ratio.
Wevj 12 00251 g006
Figure 7. Sensitivity test of factor n’s impact on the EV cell producer adoption ratio.
Wevj 12 00251 g007
Figure 8. Sensitivity test of factor s’s impact on the EV cell producer adoption ratio.
Wevj 12 00251 g008
Table 1. Payoff table for the EV cell producers (potential non-member licensees or potential adopters).
Game PlayersPotential Non-Member Licensee 2
Adopted Patent Pool (x)Not Adopted Patent Pool (1−x)
Potential Non Member Licensee 1Adopted Patent Pool (x)B1, B1B1, B2
Not Adopted Patent Pool (1−x)B2, B1B2, B2
Table 2. Stability table of the EV cell producers.
Equilibrium Point xDerivativeStability
0 m a s l r + n u a 1 n s Uncertain
x * = a l s a n u a r s + n u s a l a r + a u u m a 2 l 2 s + a 2 l n u + 2 a 2 l r s a 2 l s u a 2 n r u + a 2 n u 2 a 2 r 2 s + a 2 r s u a l n u + a l s u + a n r u 2 a n u 2 a r s u + n u 2 a s l n l s + n r + r s Uncertain
Table 3. Initial parameter table.
SymbolNoteInitial ValueUnit
m0Total market potential amount of EV cell—initial 300Unit
mpTotal market potential amount of EV cell—long term 15,000,000Unit
aPatent pool EV cell technology advantage coefficient80%
sTotal number of non-member EV cell producers 1000Unit
nTotal number of patent pool members50Unit
xShare of non-member EV cell producers that adopted the patent pool technology30%
lThe patent royalty an EV cell producer that pays the patent pool produces from each unit1500USD
qProfit for a patent holder in the patent pool that sells one EV cell unit2100USD
rUnit profit for a non-member EV cell producer that adopts the patent pool2100USD
uUnit profit for non-member EV cell producer that does not adopt the patent pool1300USD
The total market logistic formula = mp × m × EXP(Time × 4)/(mp + m × (EXP(Time × 4) − 1)).
Table 4. Local and global optimization object function of EV patent holders in the patent pool.
Object FunctionAdvantage CoefficientPatent RoyaltyPatent Pool MemberDiffusion Ratio
USD 61,138,46260.00%60015052.39%
USD 76,233,33360.00%60010056.06%
USD 33,950,00070.00%60040051.25%
USD 36,514,28670.00%60035053.96%
USD 39,600,00070.00%60030056.67%
USD 43,440,00070.00%60025059.38%
USD 48,471,42970.00%60020062.08%
USD 75,761,53870.00%110015053.49%
USD 55,661,53870.00%60015064.79%
USD 95,825,00070.00%110010057.06%
USD 67,800,00070.00%60010067.50%
USD 33,630,00080.00%110050050.94%
USD 28,420,00080.00%60050064.38%
USD 35,785,96580.00%110045053.40%
USD 30,126,31680.00%60045066.16%
USD 38,283,33380.00%110040055.85%
USD 32,077,77880.00%60040067.95%
USD 41,228,57180.00%110035058.30%
USD 34,342,85780.00%60035069.73%
USD 44,787,50080.00%110030060.75%
USD 37,025,00080.00%60030071.51%
USD 49,240,00080.00%110025063.21%
USD 40,293,33380.00%60025073.29%
USD 55,114,28680.00%110020065.66%
USD 44,457,14380.00%60020075.07%
USD 63,584,61580.00%110015068.11%
USD 50,184,61580.00%60015076.85%
USD 104,100,00080.00%160010052.73%
USD 78,050,00080.00%110010070.57%
USD 59,366,66780.00%60010078.63%
USD 34,380,00090.00%160050055.17%
USD 29,565,00090.00%110050074.76%
USD 26,960,00090.00%60050082.43%
USD 36,470,17590.00%160045057.41%
USD 31,314,03590.00%110045076.02%
USD 28,484,21190.00%60045083.31%
USD 38,866,66790.00%160040059.66%
USD 33,308,33390.00%110040077.28%
USD 30,205,55690.00%60040084.19%
USD 41,657,14390.00%160035061.90%
USD 35,614,28690.00%110035078.54%
USD 32,171,42990.00%60035085.07%
USD 44,975,00090.00%160030064.14%
USD 38,331,25090.00%110030079.81%
USD 34,450,00090.00%60030085.95%
USD 49,040,00090.00%160025066.38%
USD 41,620,00090.00%110025081.07%
USD 37,146,66790.00%60025086.82%
USD 54,257,14390.00%160020068.62%
USD 45,771,42990.00%110020082.33%
USD 40,442,85790.00%60020087.70%
USD 61,507,69290.00%160015070.86%
USD 51,407,69290.00%110015083.59%
USD 44,707,69290.00%60015088.58%
USD 73,300,00090.00%160010073.10%
USD 60,275,00090.00%110010084.85%
USD 50,933,33390.00%60010089.46%
Table 5. Local and global optimization object function of EV patent holders in the patent pool.
Weighted Object FunctionAdvantage CoefficientPatent RoyaltyPatent Pool MemberDiffusion Ratio
0.83060.00%60015052.39%
0.94260.00%60010056.06%
0.68270.00%60040051.25%
0.72270.00%60035053.96%
0.76570.00%60030056.67%
0.81170.00%60025059.38%
0.86370.00%60020062.08%
0.91470.00%110015053.49%
0.92670.00%60015064.79%
1.05070.00%110010057.06%
1.01470.00%60010067.50%
0.67880.00%110050050.94%
0.78680.00%60050064.38%
0.71380.00%110045053.40%
0.81280.00%60045066.16%
0.75080.00%110040055.85%
0.84080.00%60040067.95%
0.78980.00%110035058.30%
0.86980.00%60035069.73%
0.83180.00%110030060.75%
0.90080.00%60030071.51%
0.87880.00%110025063.21%
0.93480.00%60025073.29%
0.93280.00%110020065.66%
0.97380.00%60020075.07%
0.99980.00%110015068.11%
1.01980.00%60015076.85%
1.04880.00%16010052.73%
1.09680.00%110010070.57%
1.08380.00%60010078.63%
0.72490.00%16050055.17%
0.89590.00%110050074.76%
0.95990.00%60050082.43%
0.75690.00%16045057.41%
0.91790.00%110045076.02%
0.97690.00%60045083.31%
0.79190.00%16040059.66%
0.93990.00%110040077.28%
0.99390.00%60040084.19%
0.82790.00%16035061.90%
0.96490.00%110035078.54%
1.01290.00%60035085.07%
0.86690.00%16030064.14%
0.99090.00%110030079.81%
1.03290.00%60030085.95%
0.90990.00%16025066.38%
1.01990.00%110025081.07%
1.05490.00%60025086.82%
0.95790.00%16020068.62%
1.05290.00%110020082.33%
1.07990.00%60020087.70%
1.01690.00%16015070.86%
1.09390.00%110015083.59%
1.10990.00%60015088.58%
1.09890.00%16010073.10%
1.15090.00%110010084.85%
1.14990.00%60010089.46%
Publisher’s Note: MDPI stays neutral with regard to jurisdictional claims in published maps and institutional affiliations.

