
Vehicle to Grid Impacts on the Total Cost of Ownership for Electric Vehicle Drivers

 , , ,
, , ,  , and
, and
Abstract
:1. Introduction
2. Method
2.1. Total Cost of Ownership Calculation
- TCO is the Total Cost of Ownership (TCO) (€/km),
- C are the costs occurring during the ownership (€),
- t is the time expressed as the number of years (years) and
- m is the driven mileage during the ownership time expressed in km (km).
2.2. Relevant Costs
2.3. Net Present Value
- NPV is the net present value (€),
- is the one-time costs at time t (€),
- is the annual reoccurring cost (€/year),
- r is the real discount rate (%p.a.) and
- t is the time expressed as the number of years (years).
2.4. Tariffication
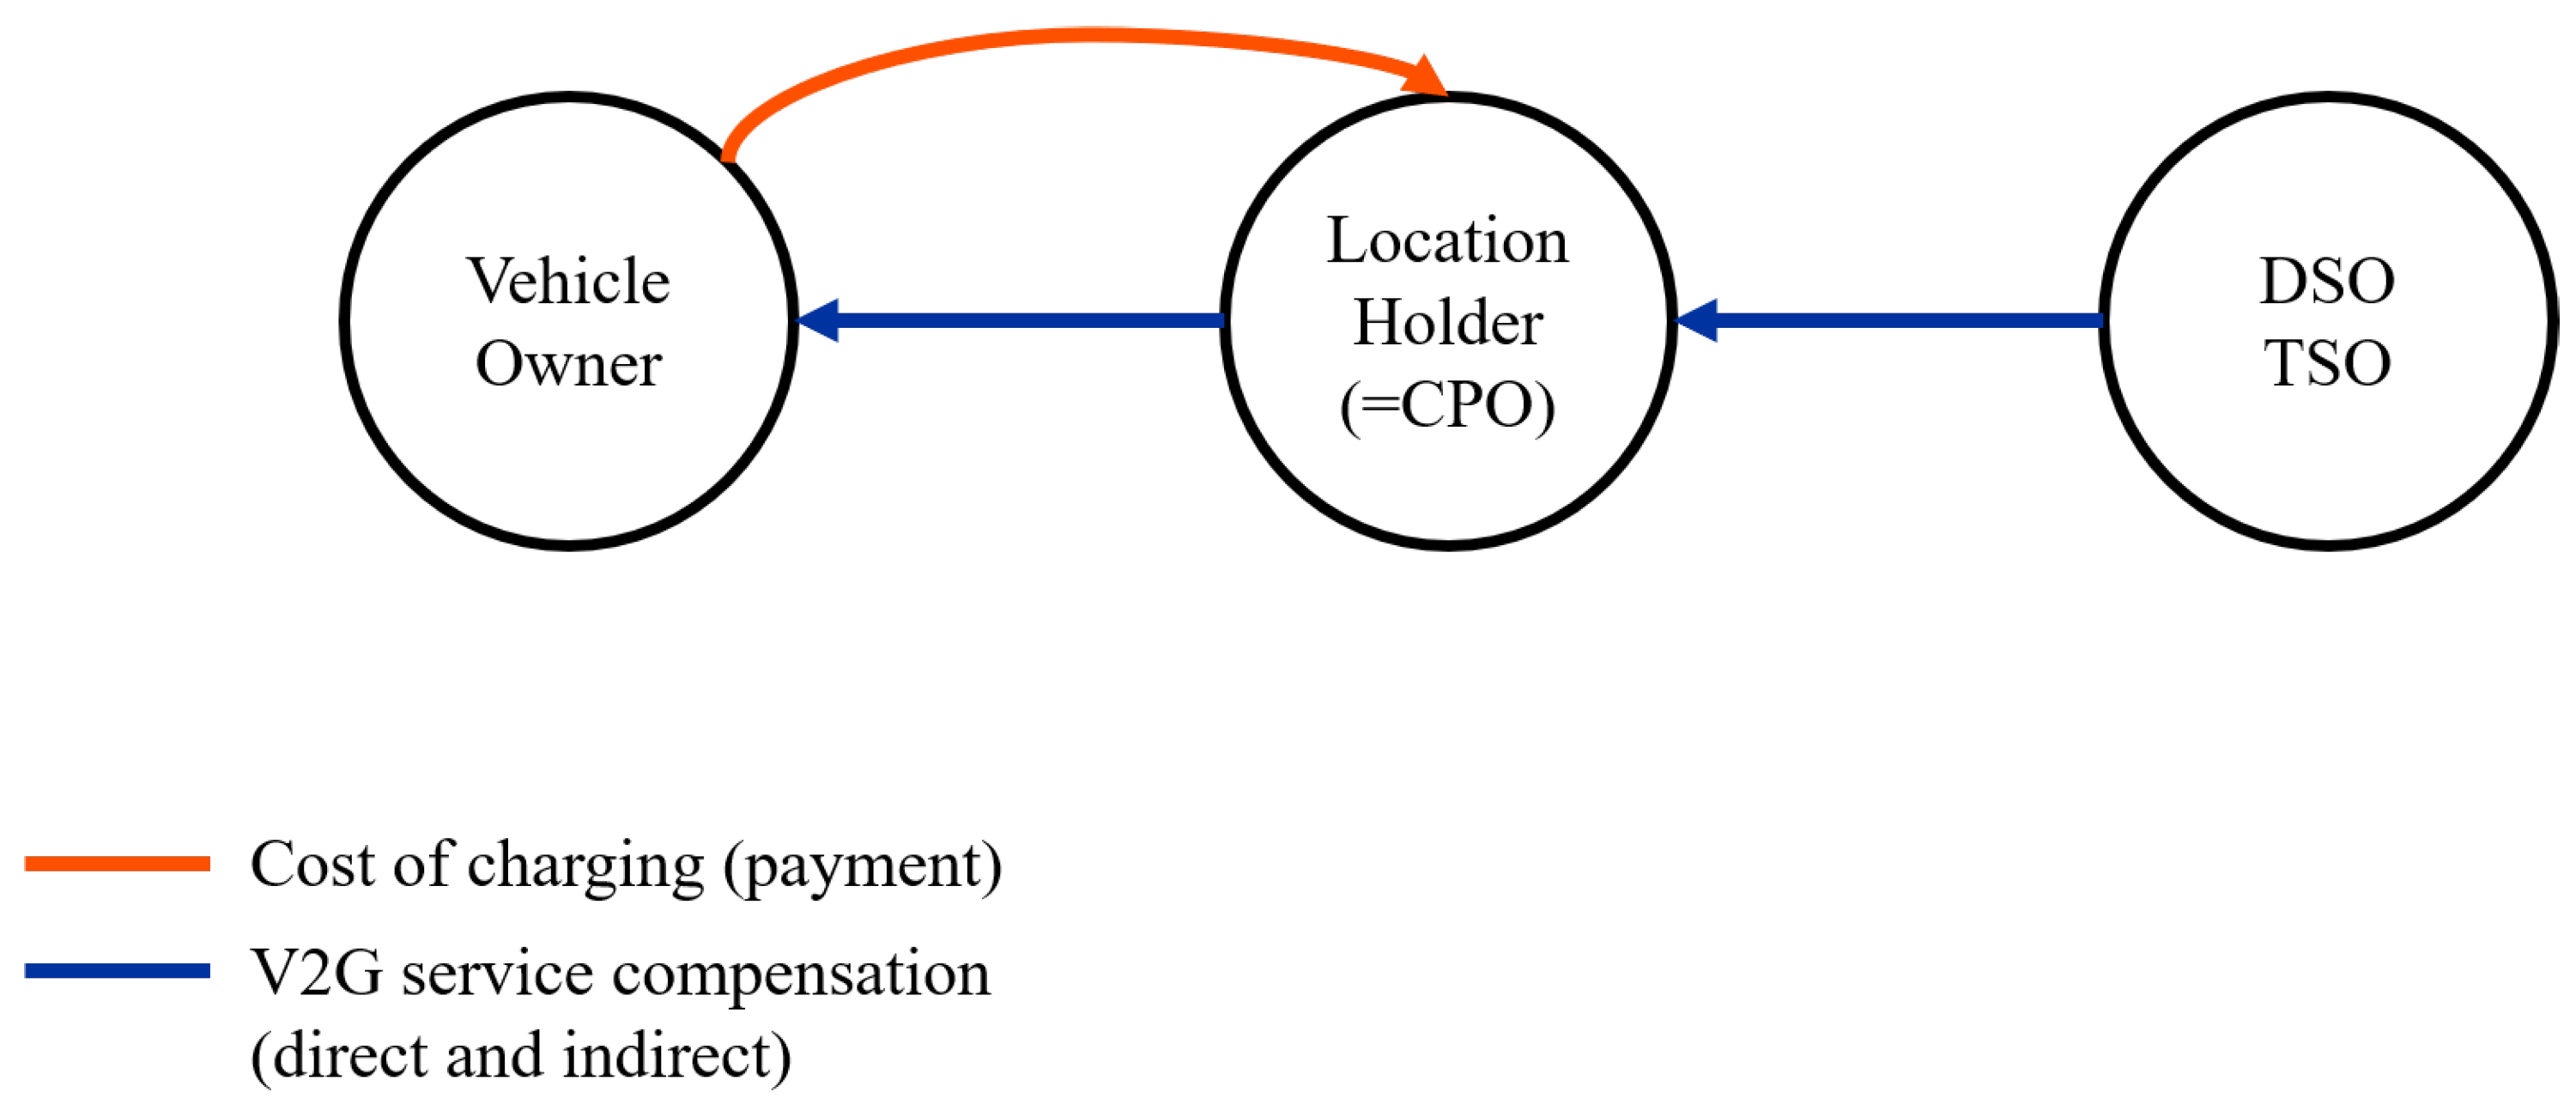
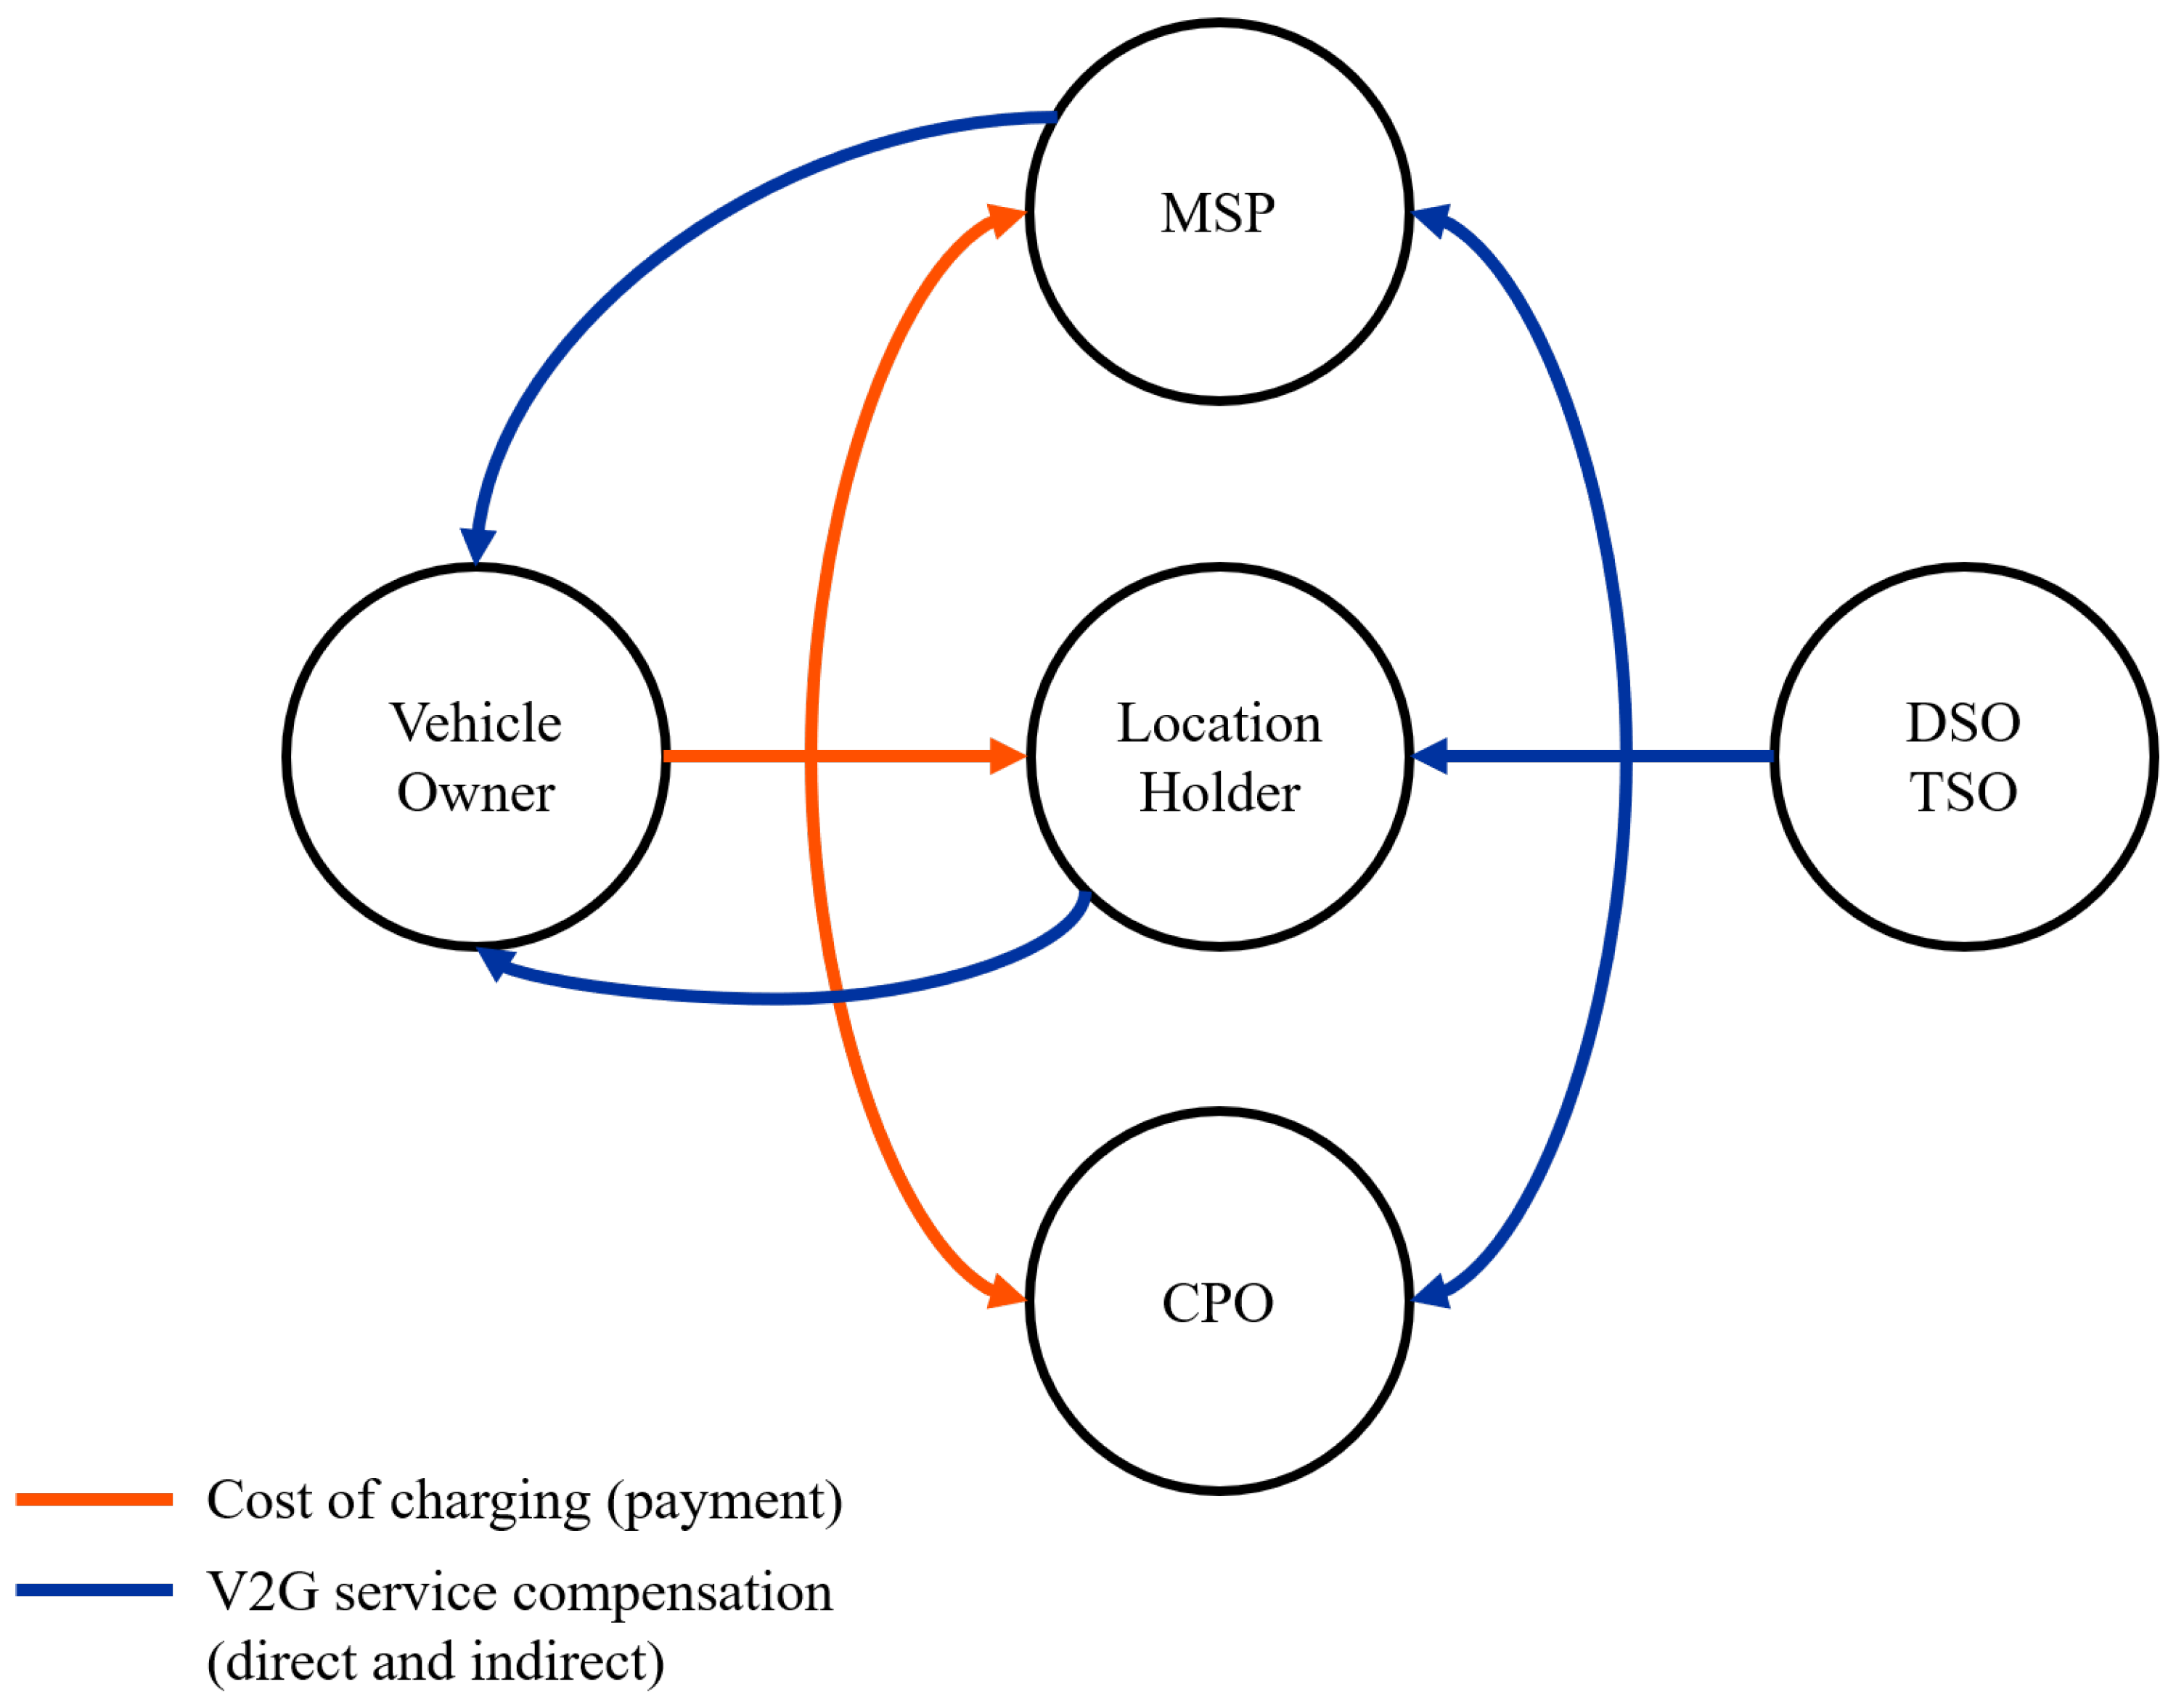
2.4.1. System Description
- is the amount of electricity in kWh that is consumed directly by the charging location (kWh), while
- is the amount of electricity in kWh that is generated by the PV installation at the charging location (kWh).
2.4.2. Tariff Calculation
- one tariff reflects a system where a standard charging situation of EVs is reflected,
- another tariff for a system that allows LLB and
- one tariff for IS.
Load Demand
- represents the amount of electricity that the charging location is requesting from the grid (kWh/year),
- stands for the excess electricity generated by the PV installation and is fed back into the grid (kWh/year), and
- is the amount of electricity that is generated by the PV installations (kWh/year).
PV Costs
- represents the total cost of PV installation (€/year),
- stands for the capital expenditures of the PV installation (€/kWp),
- A is the PV size (kWp),
- is the lifetime of the PV installation (years),
- are the green certificates (€/kWh), and
- is the operational expenditures of the PV installations (€/kWp/year).
Chargers
- is indicating the number of chargers installed at the charging location (Number of chargers),
- is the size of the standard chargers (kW),
- is the capital expenditures of the standard chargers (€/kW) and
- is the lifetime of the chargers (years).
- stands for the numbers of V2G chargers installed at the charging location (Numbers of chargers),
- is the size of the V2G chargers (kW),
- are the capital expenditures of the V2G chargers (€/kW),
- is the maintenance costs for V2G chargers (%) and
- refers to the lifetime of the V2G chargers (years).
Cost of Electricity
Marginal Costs
- are the total costs of the charging location without any chargers (€/year),
- represents the total costs of the charging location with either V2G or standard chargers (€/year) and
- is the electricity demand of the installed charging stations (kWh/year).
Tariffs
- T is the tariff (€/kWh),
- is the cost of electricity (€/kWh),
- is the marginal cost of electricity (€/kWh),
- is the profit margin (PM) of the location holder (LH) (%),
- is the profit margin of the charge point operator (CPO) (%) and
- is the profit margin of the mobility service provider (MSP) (%).
2.5. Vehicle-to-Grid Impact
2.5.1. Vehicle-to-Grid benefits
- is the benefit of saved electricity costs from the grid (€),
- is indirect compensation (€) and
- is direct compensation (€).
- is the self-consumption of PV electricity at a charging location where V2G services is used for LLB (%),
- is the self-consumption of PV electricity at a charging location with standard EV charging (%) and
- represents the average electricity household price in Belgium over the last 10 years (€/kWh).
- is the indirect compensation from providing V2G services (€)
- is the tariff for a charging case, where V2G (LLB/IS) is provided (€/kWh) and
- is the tariff for a standard charging case (€/kWh).
- are the revenues from IS services (€/year).
2.5.2. Vehicle-to-Grid Costs
- represents the costs for the energy manager in a private charging case (€).
3. Case Study
3.1. Charging Cases
3.1.1. Qualitative Description of the Charging Cases
Private Charging
Semi-Public Charging
Public Charging
3.1.2. Quantitative Description of the Charging Cases
3.2. General Assumptions
3.3. Costs at Purchase Time
3.4. Operational Costs
3.5. Non-Operational Costs
4. Results
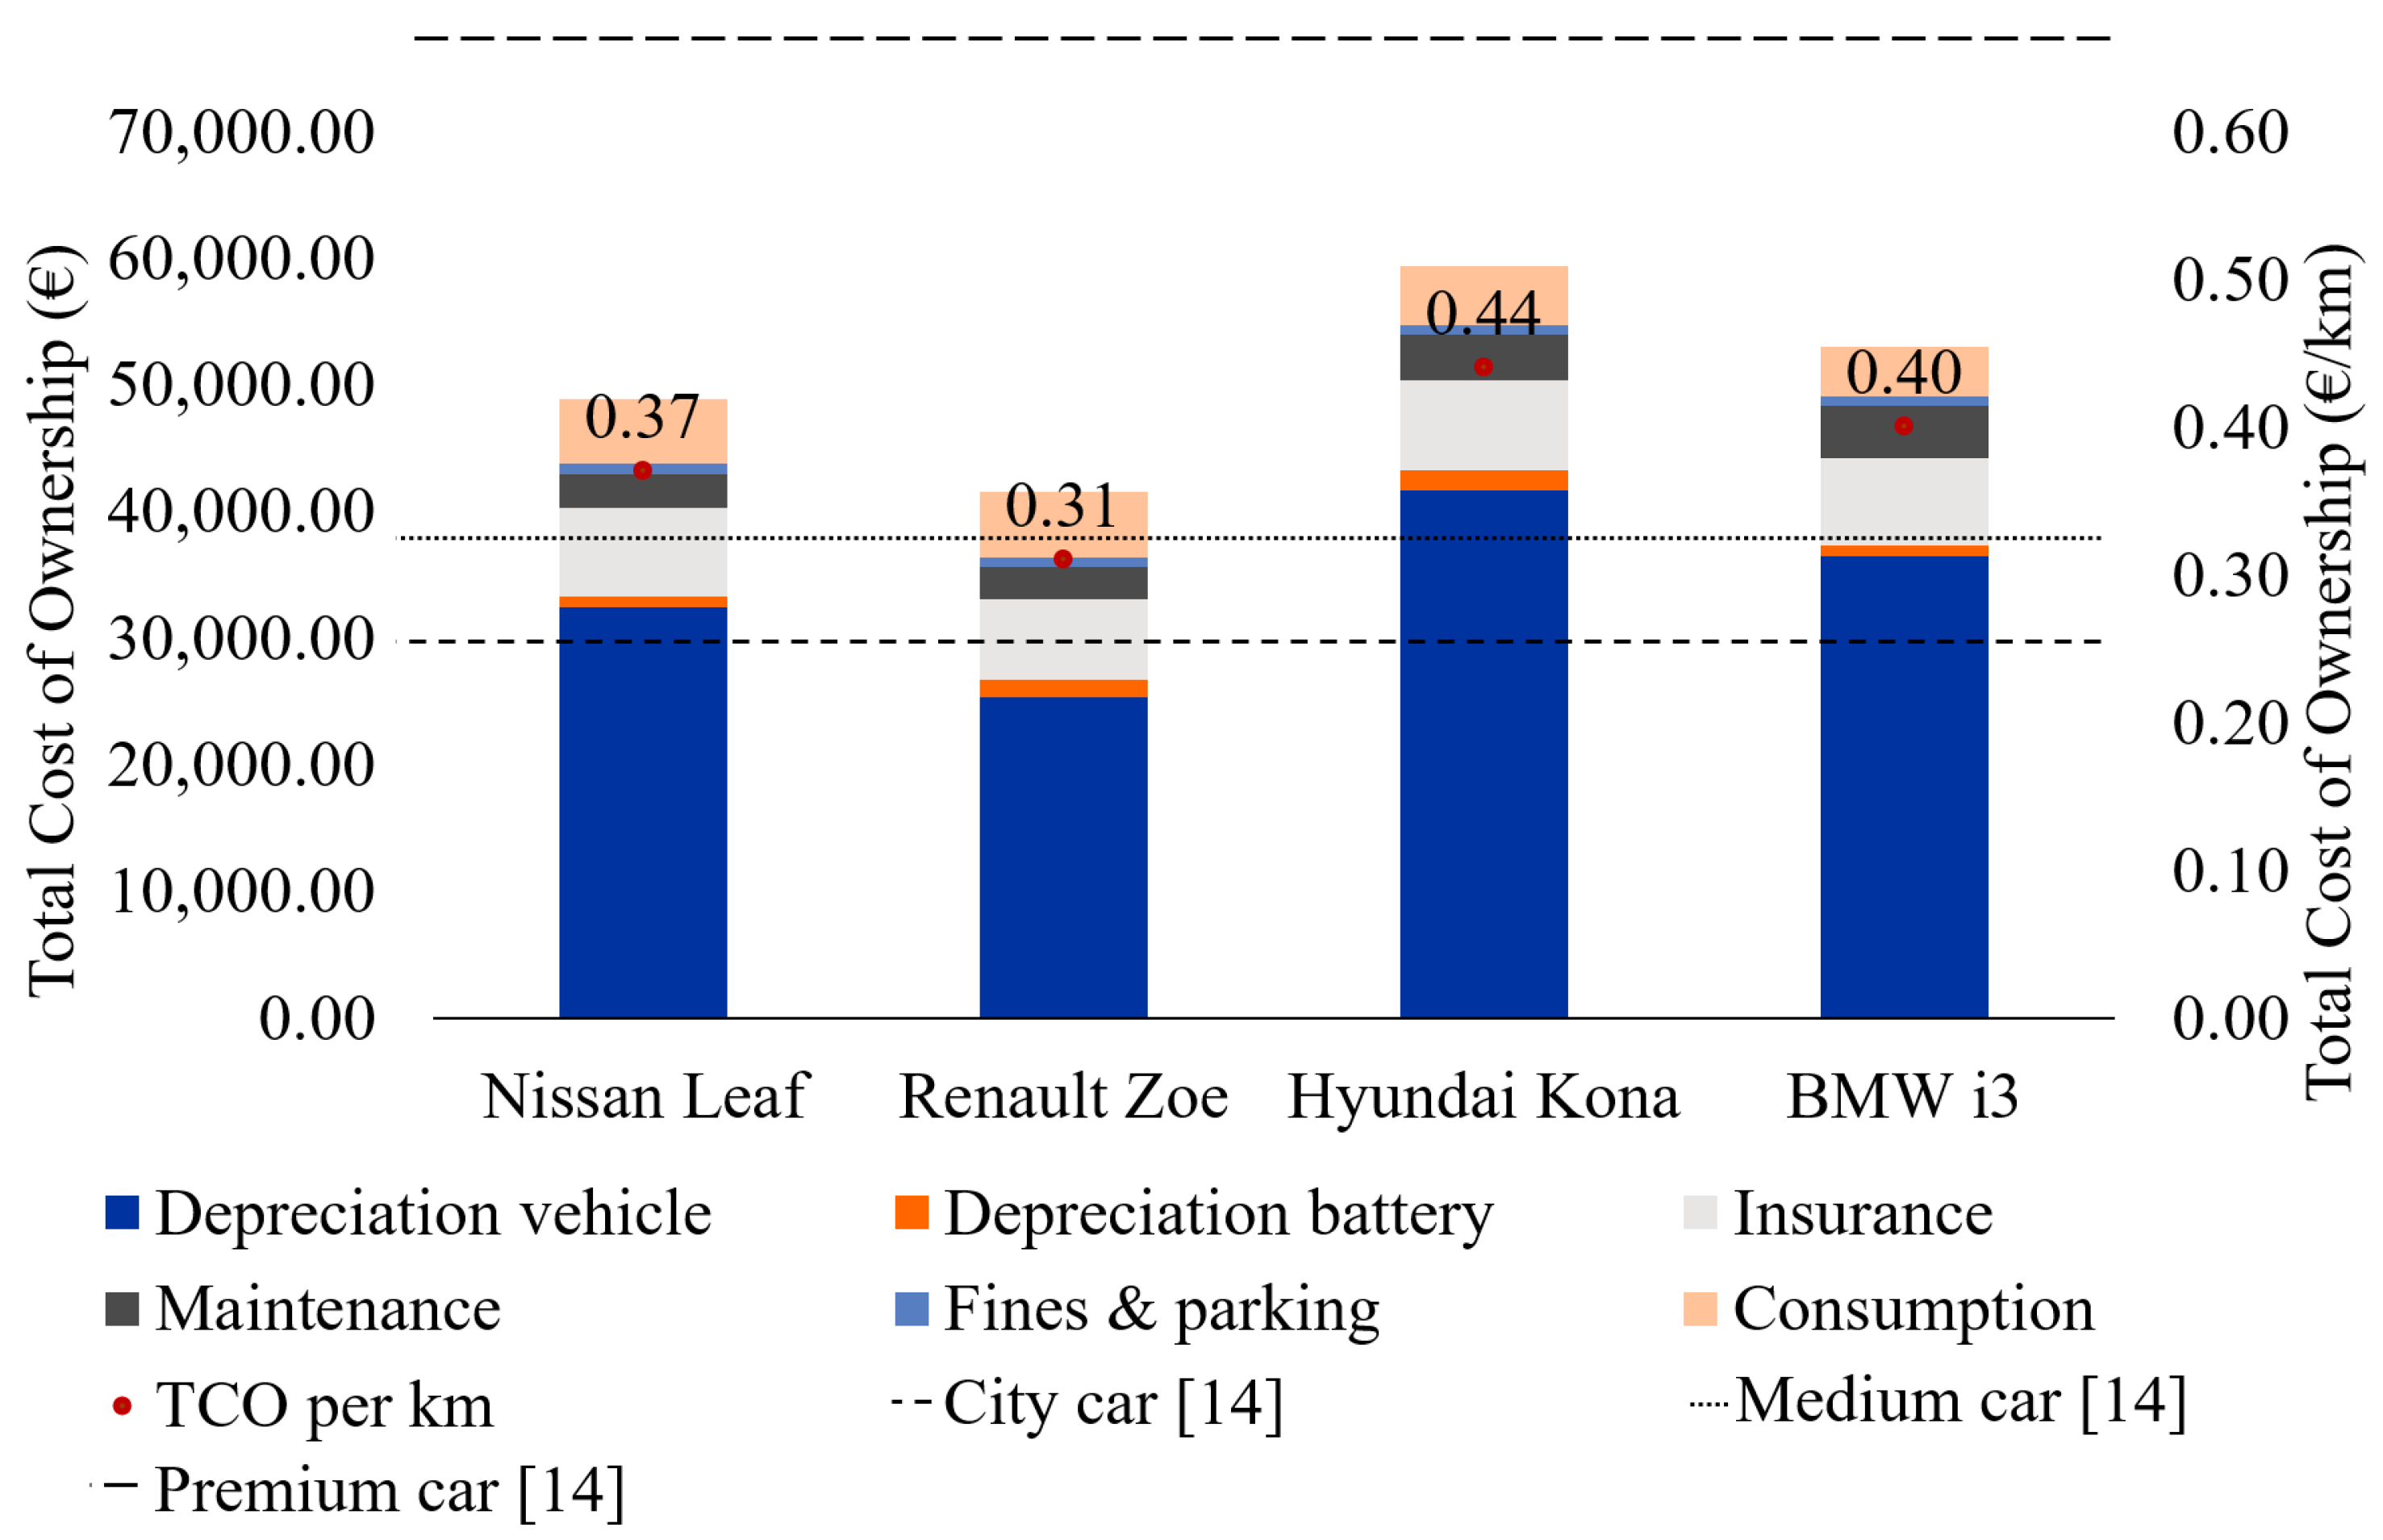
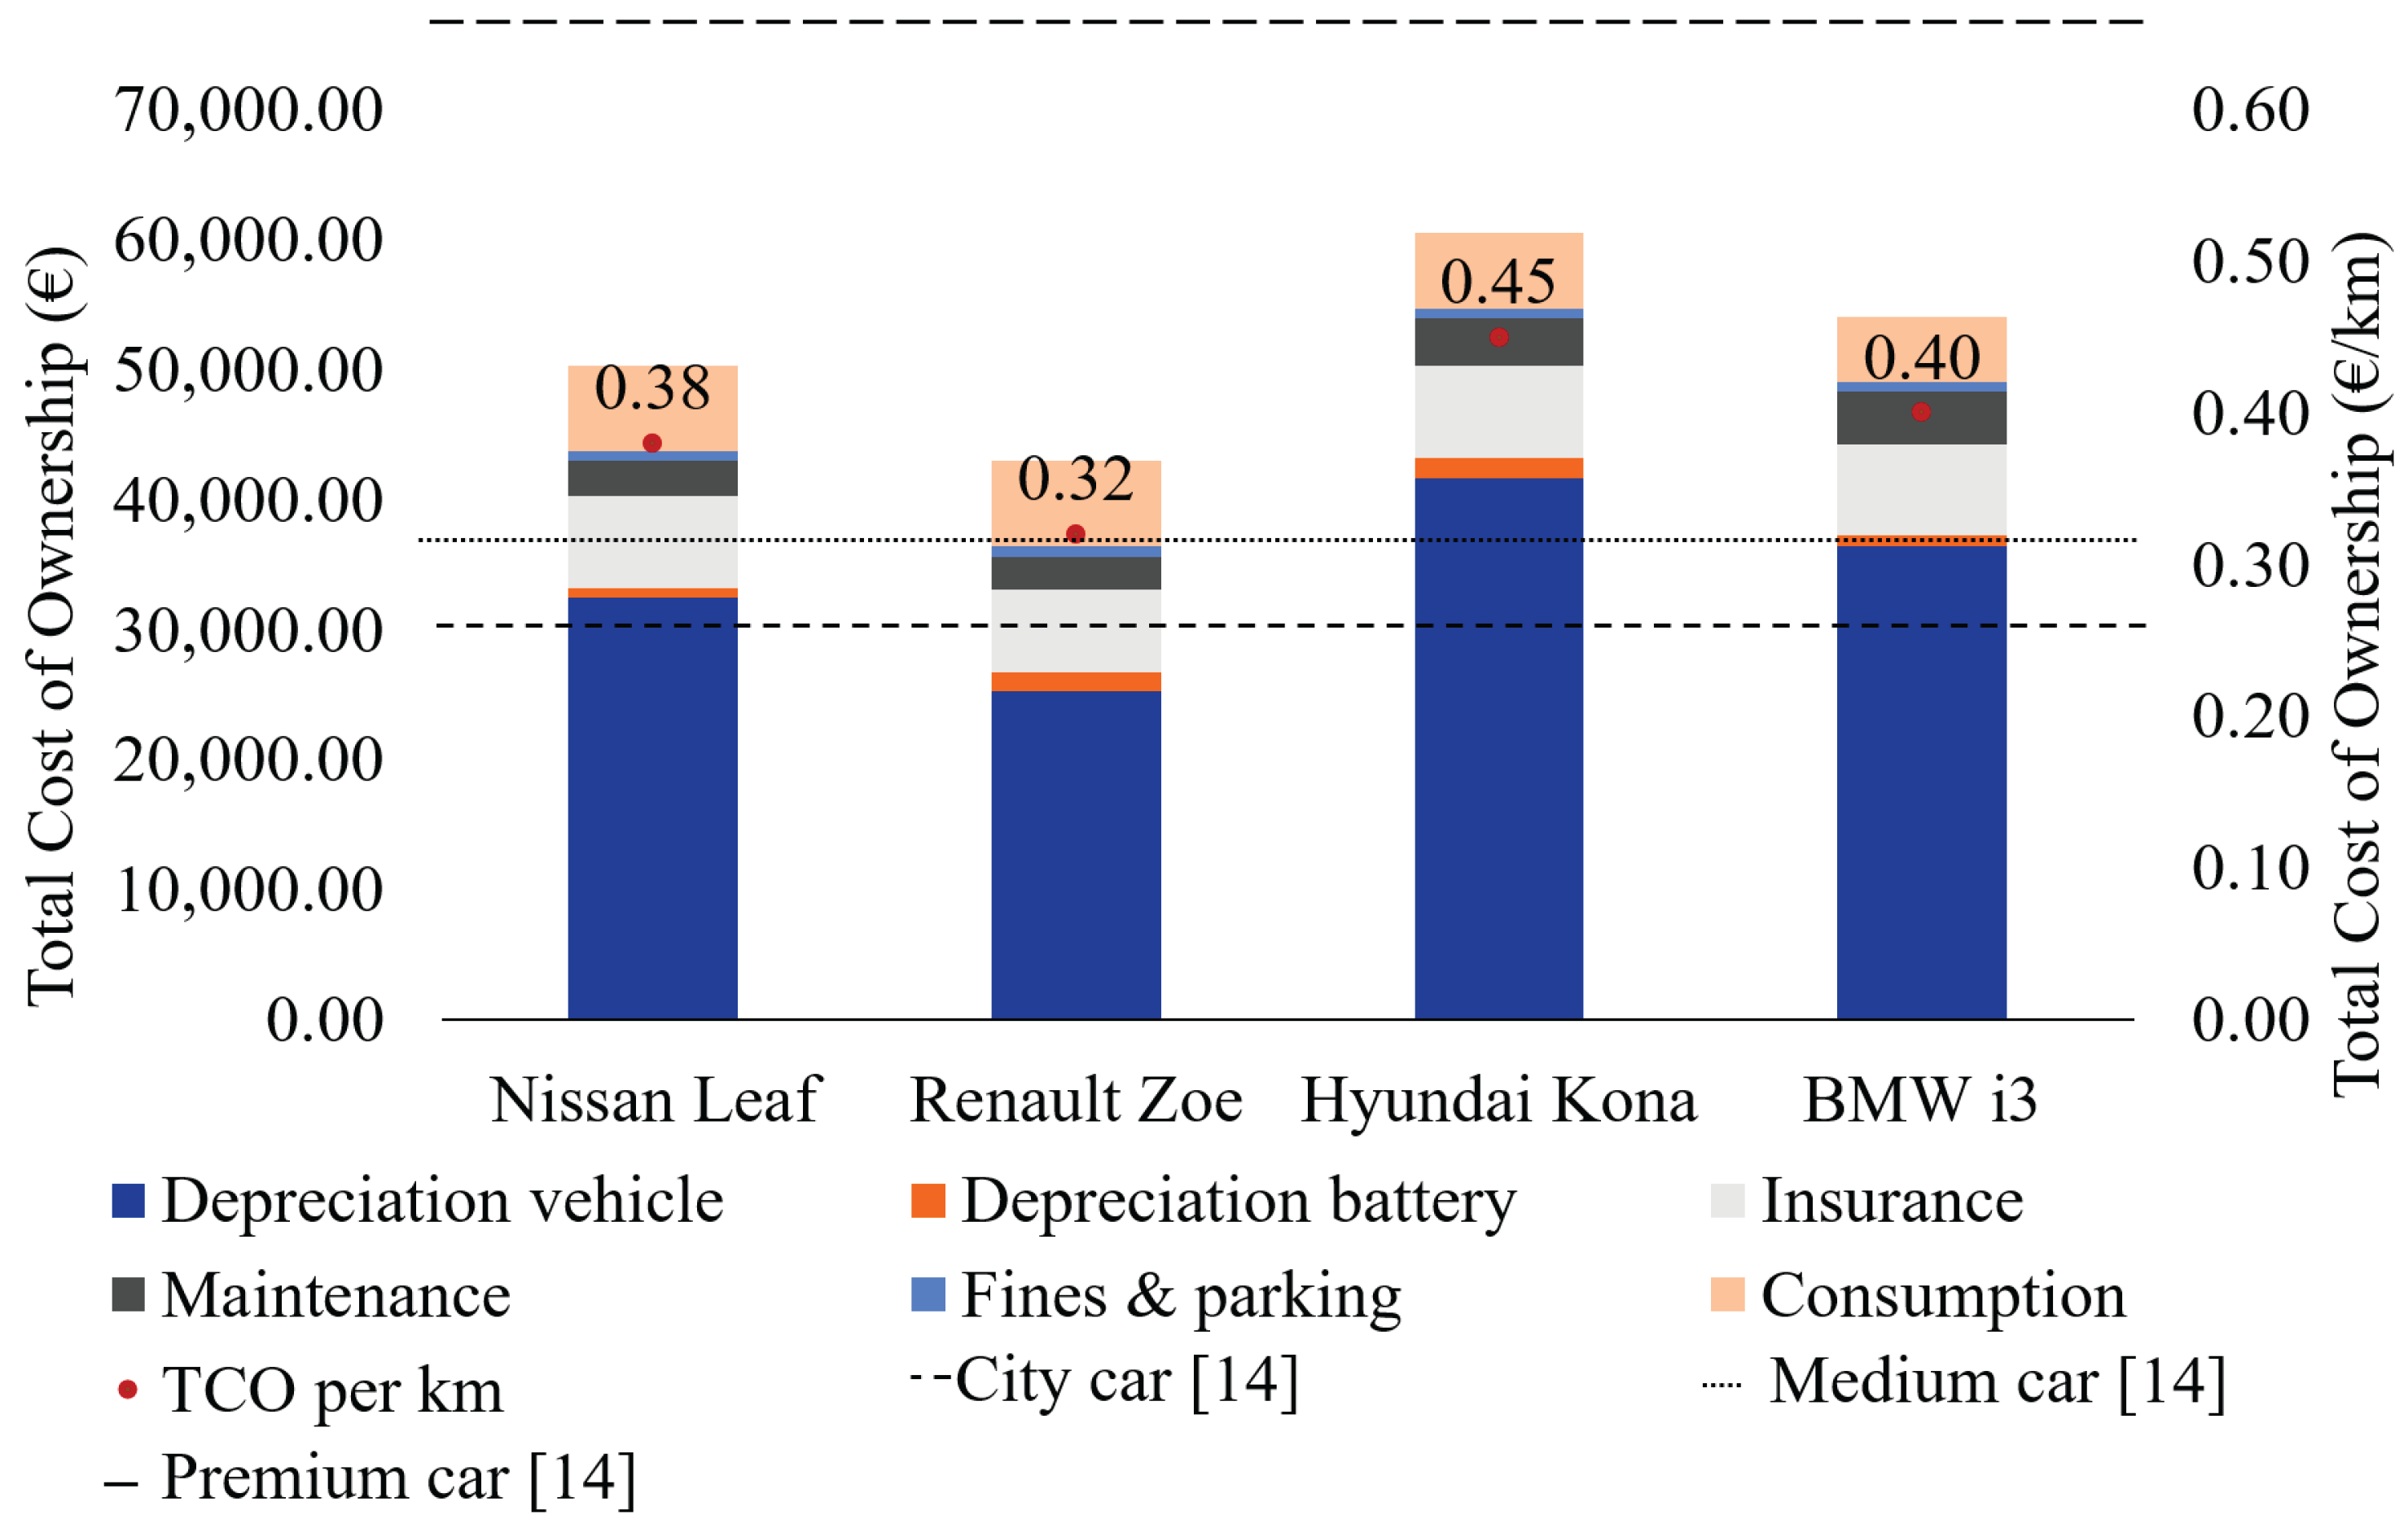
4.1. TCO Results
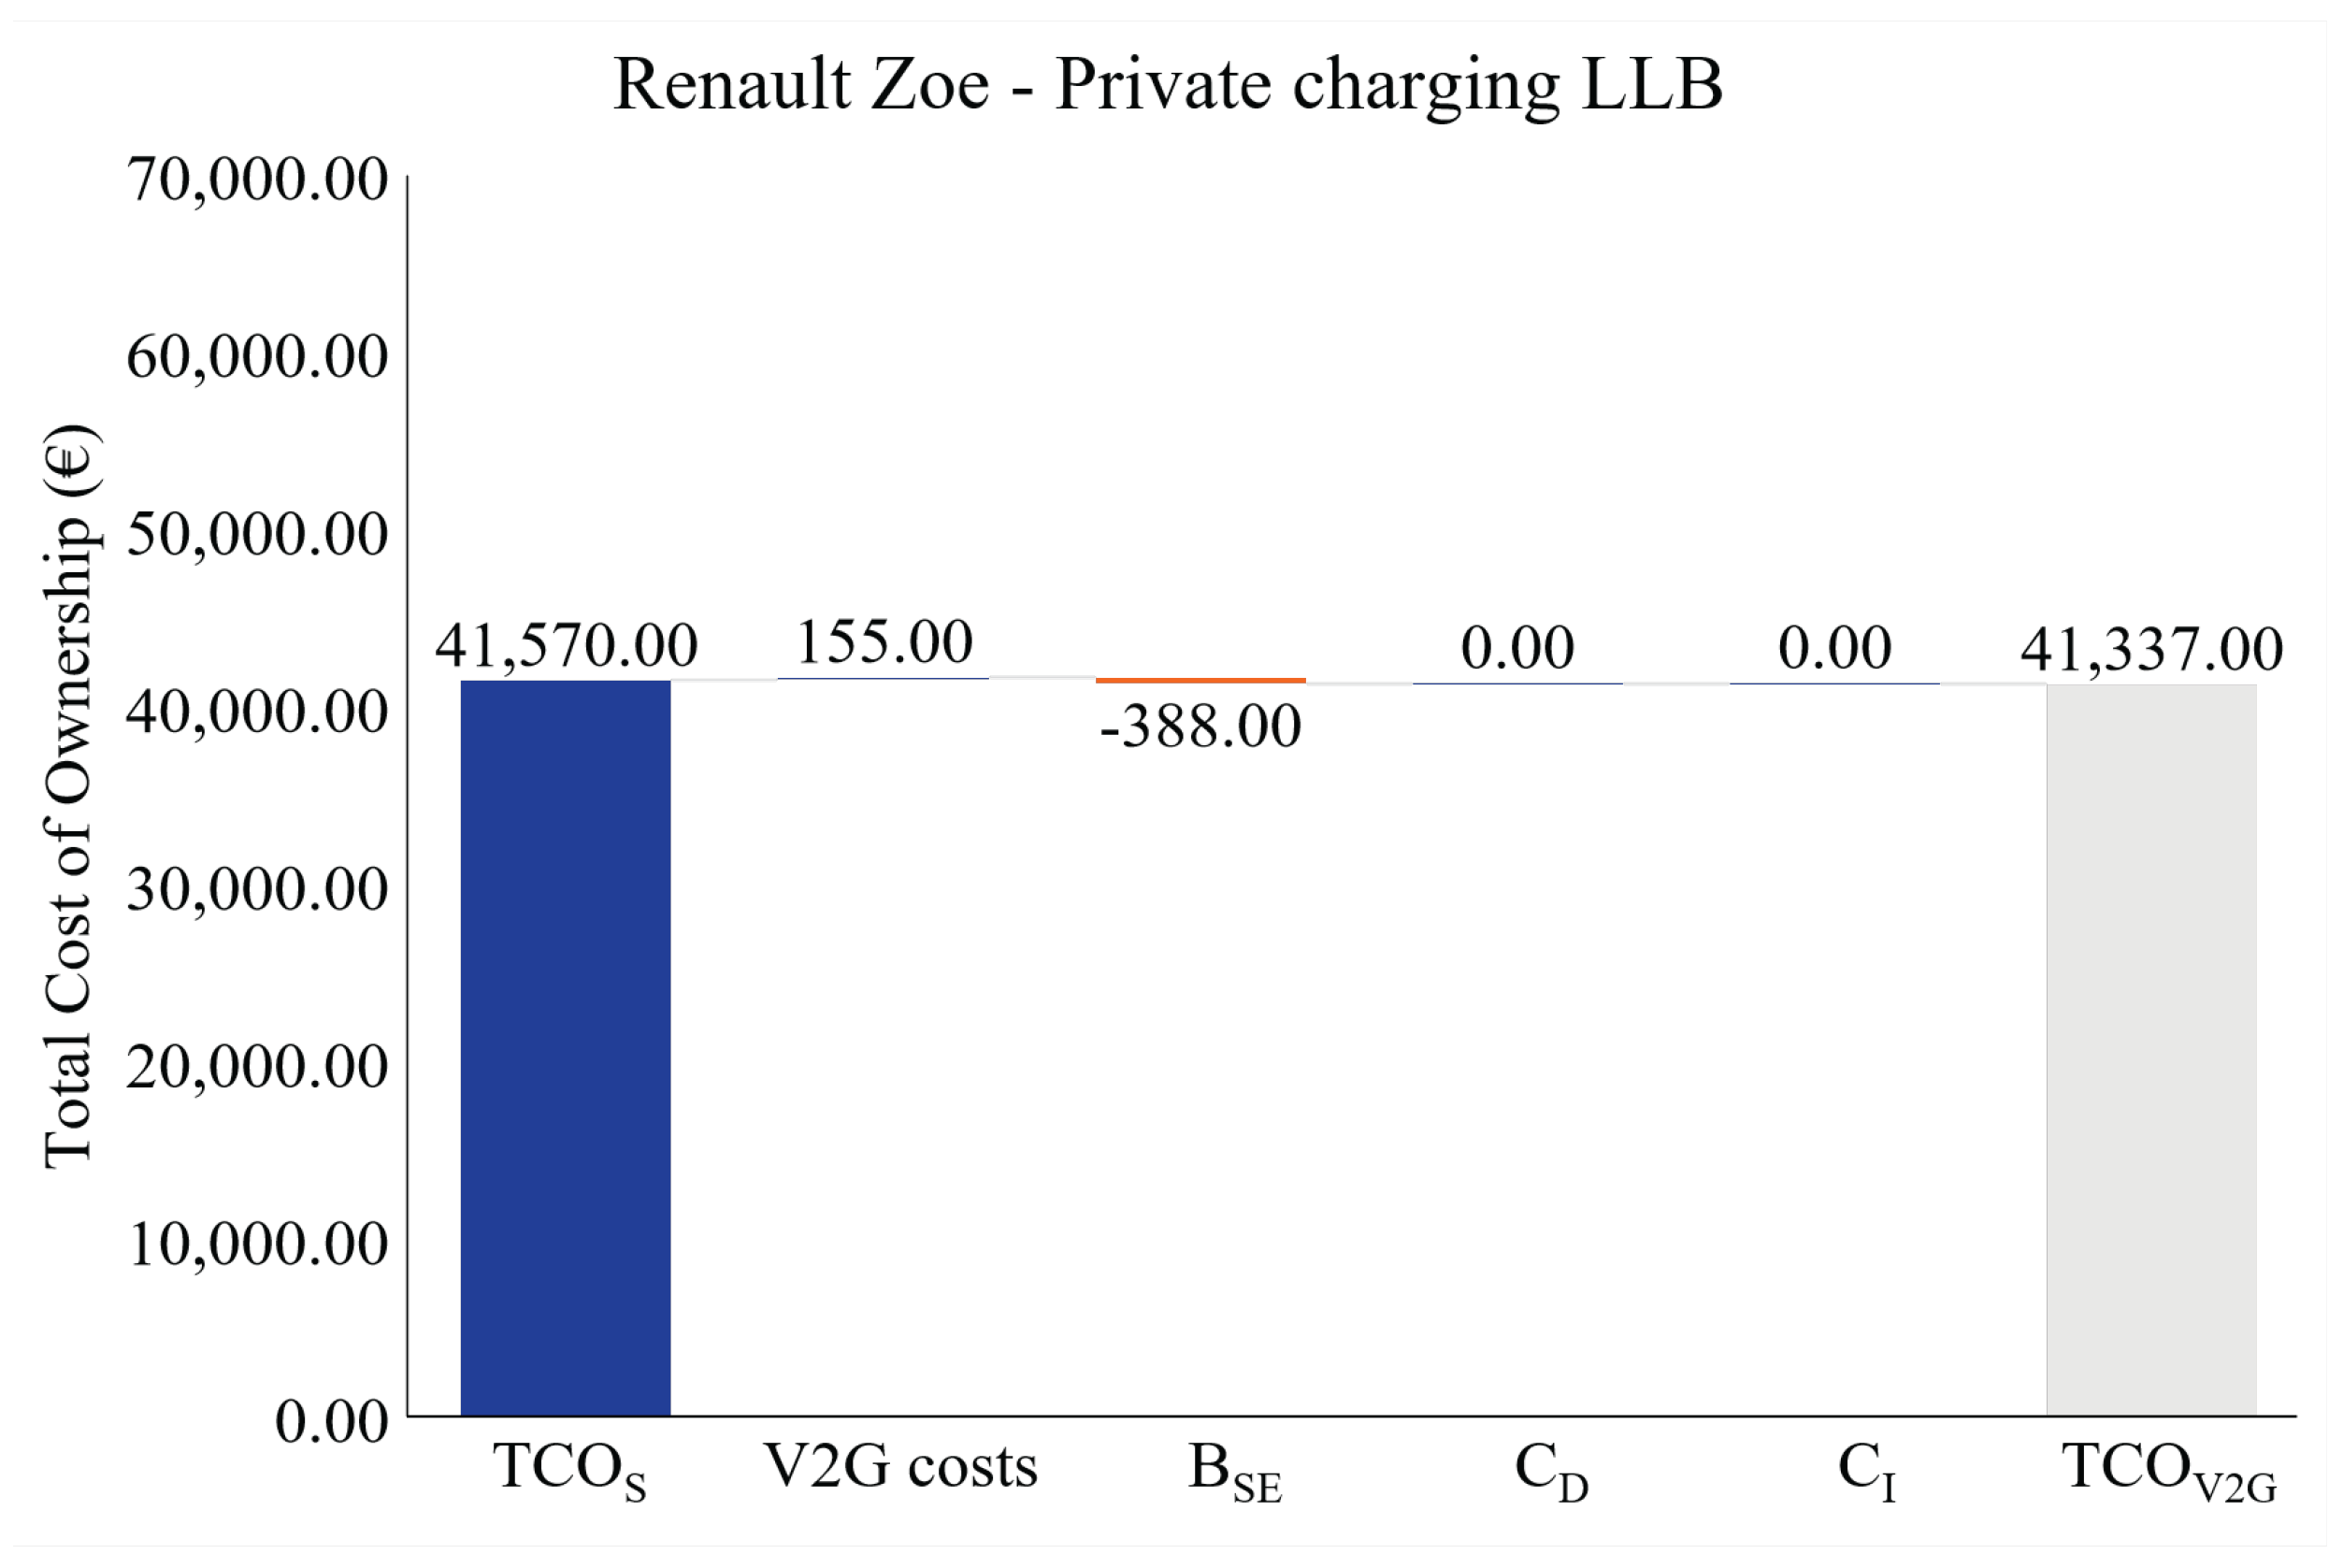
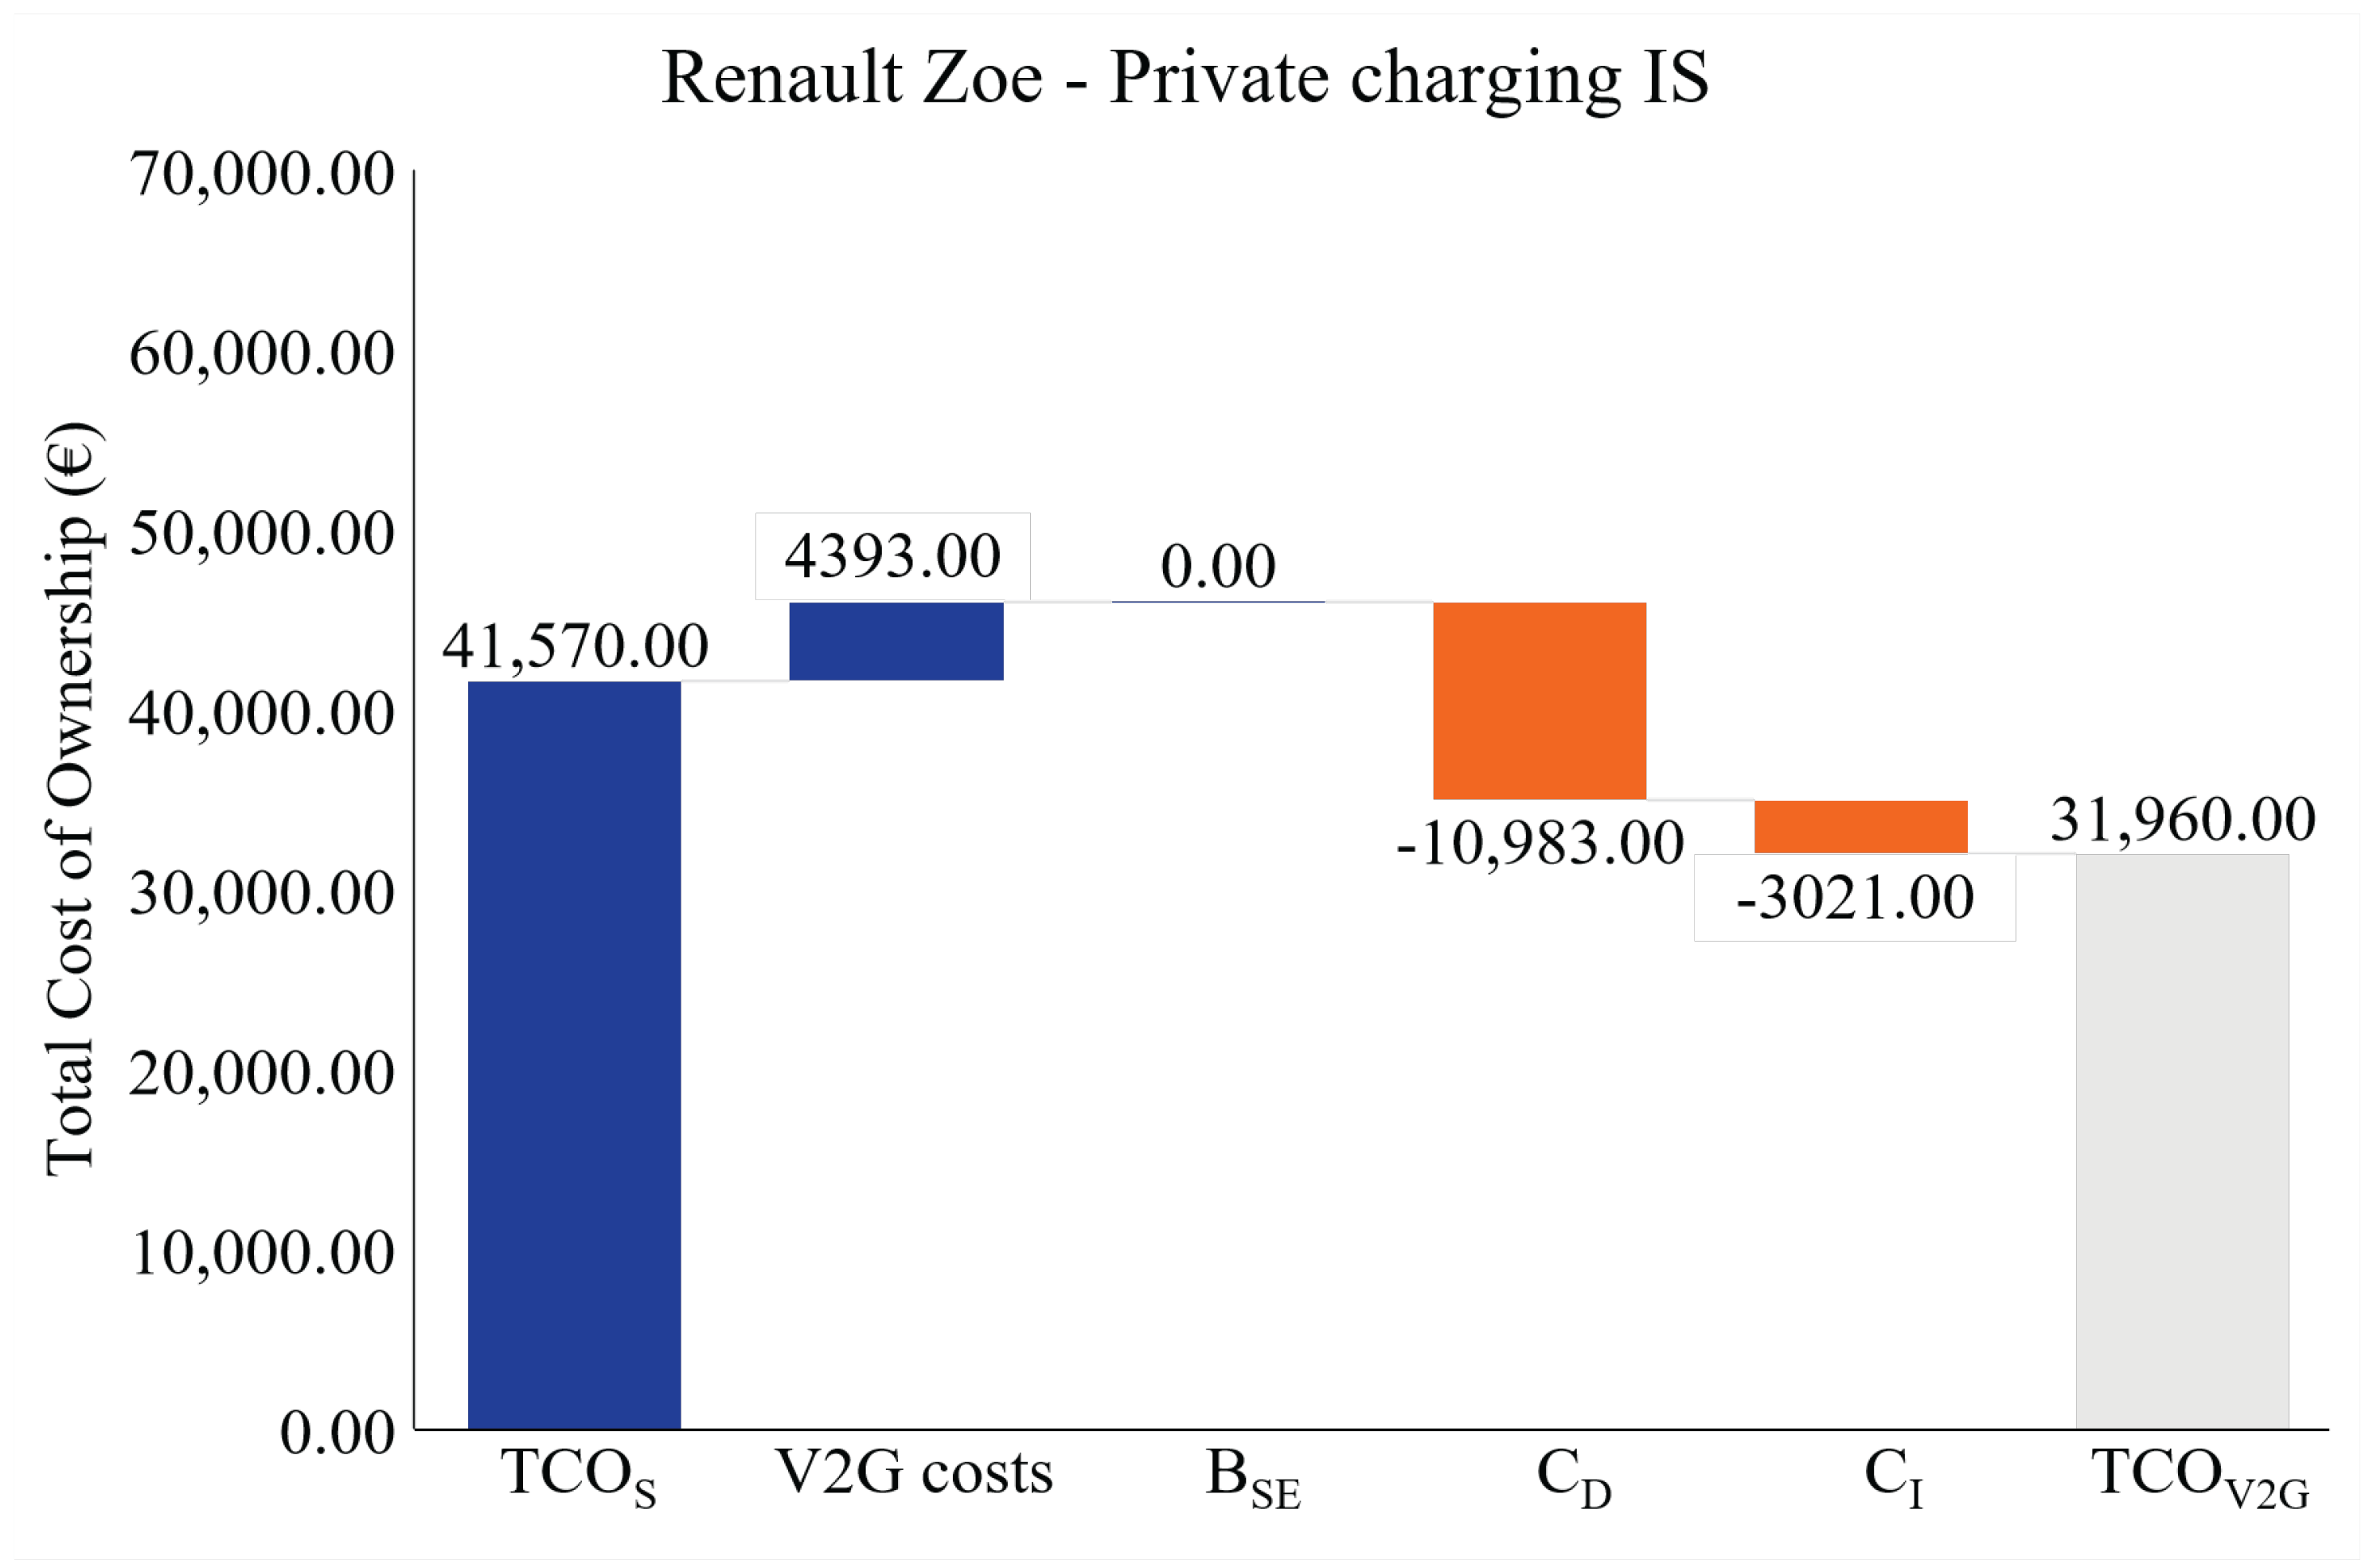
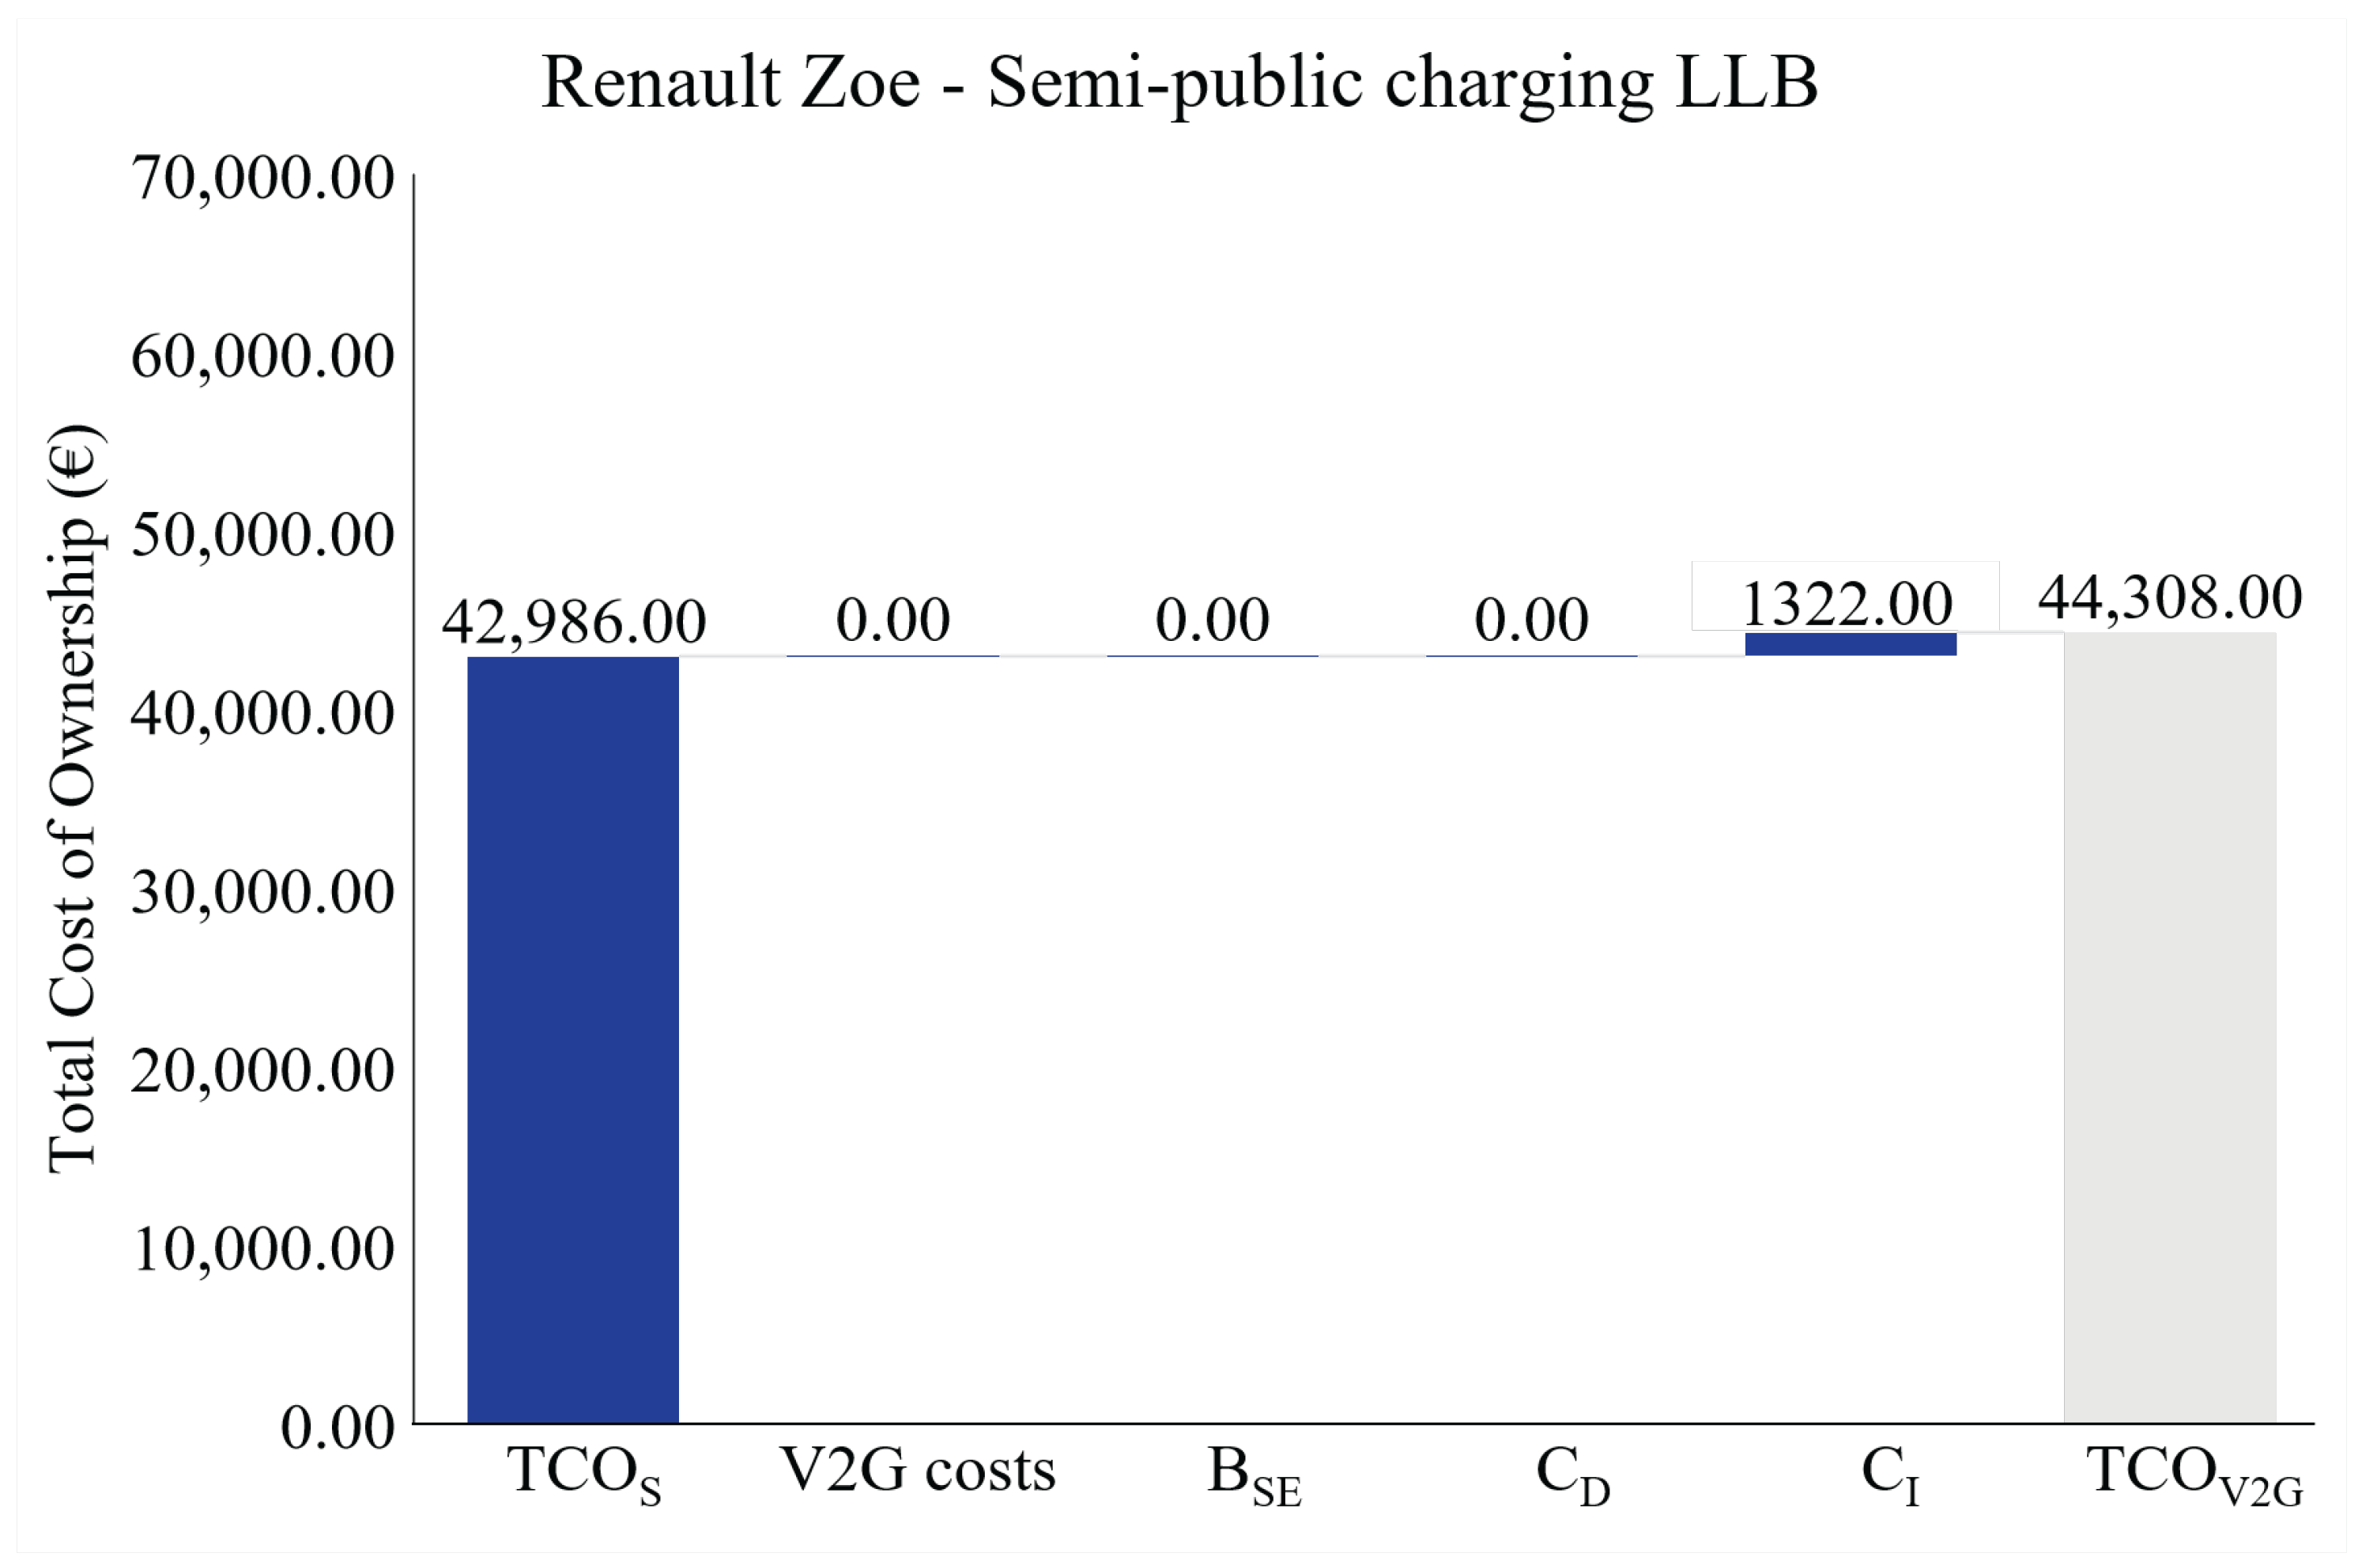
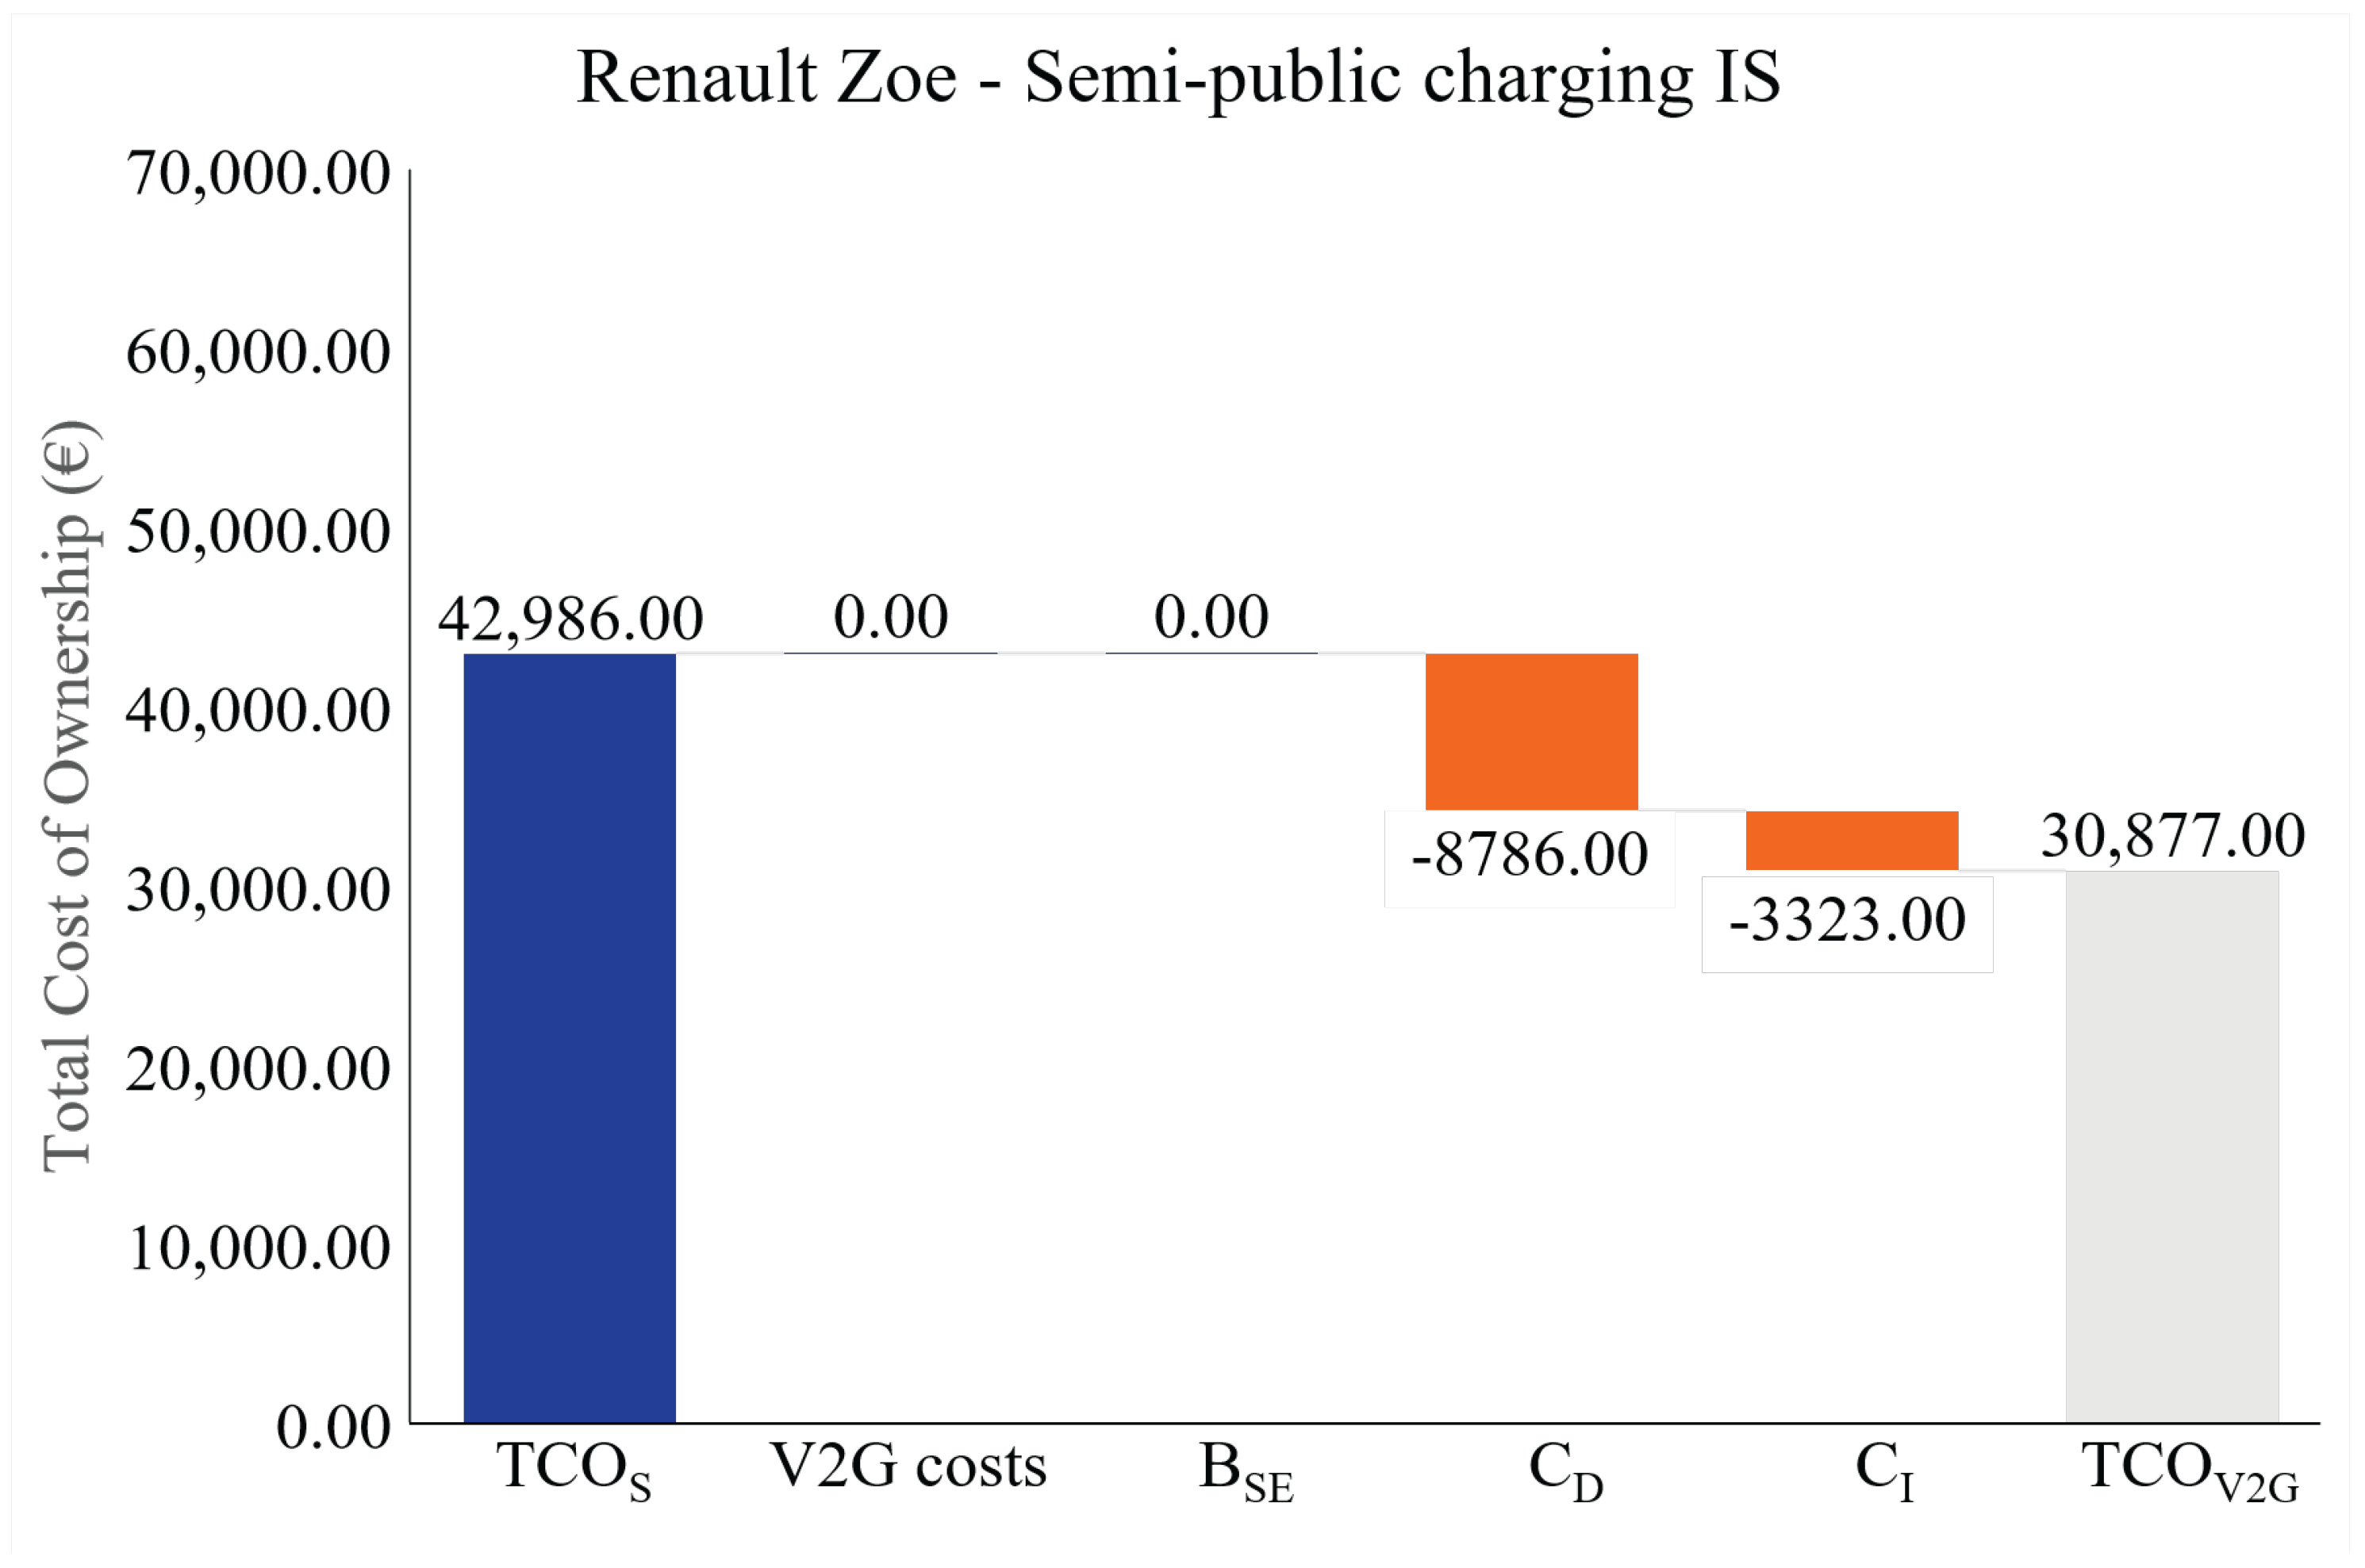
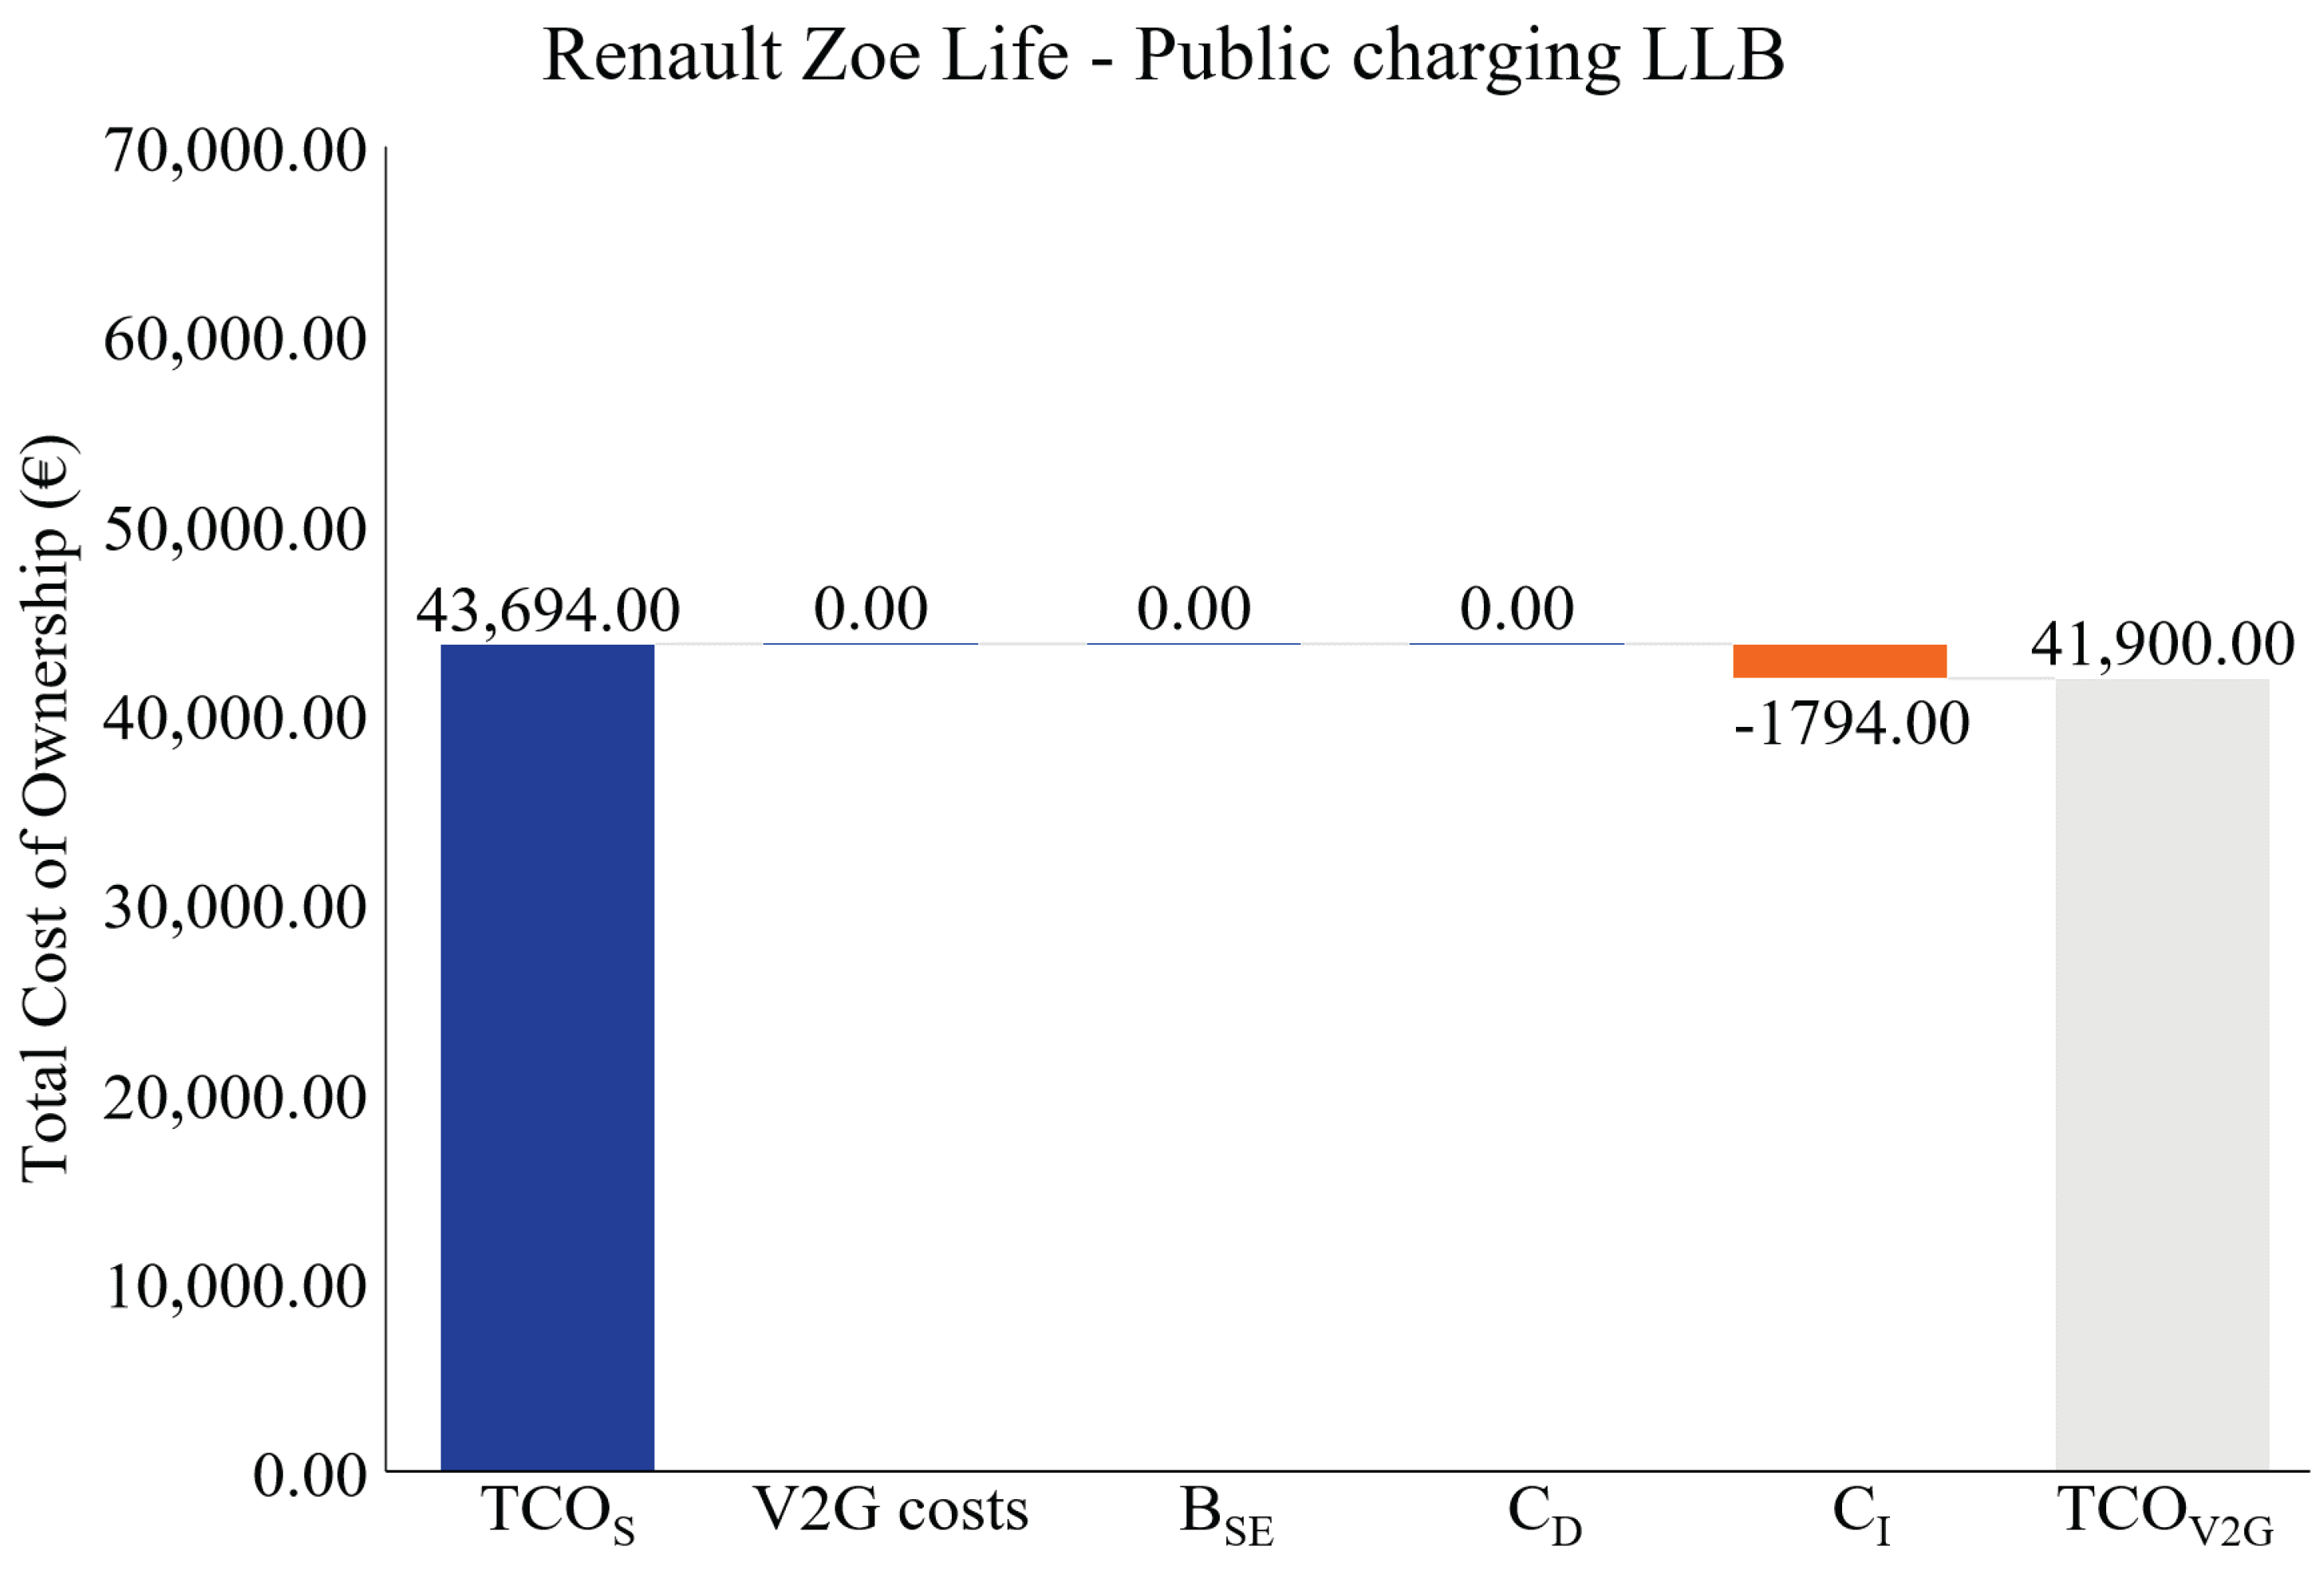
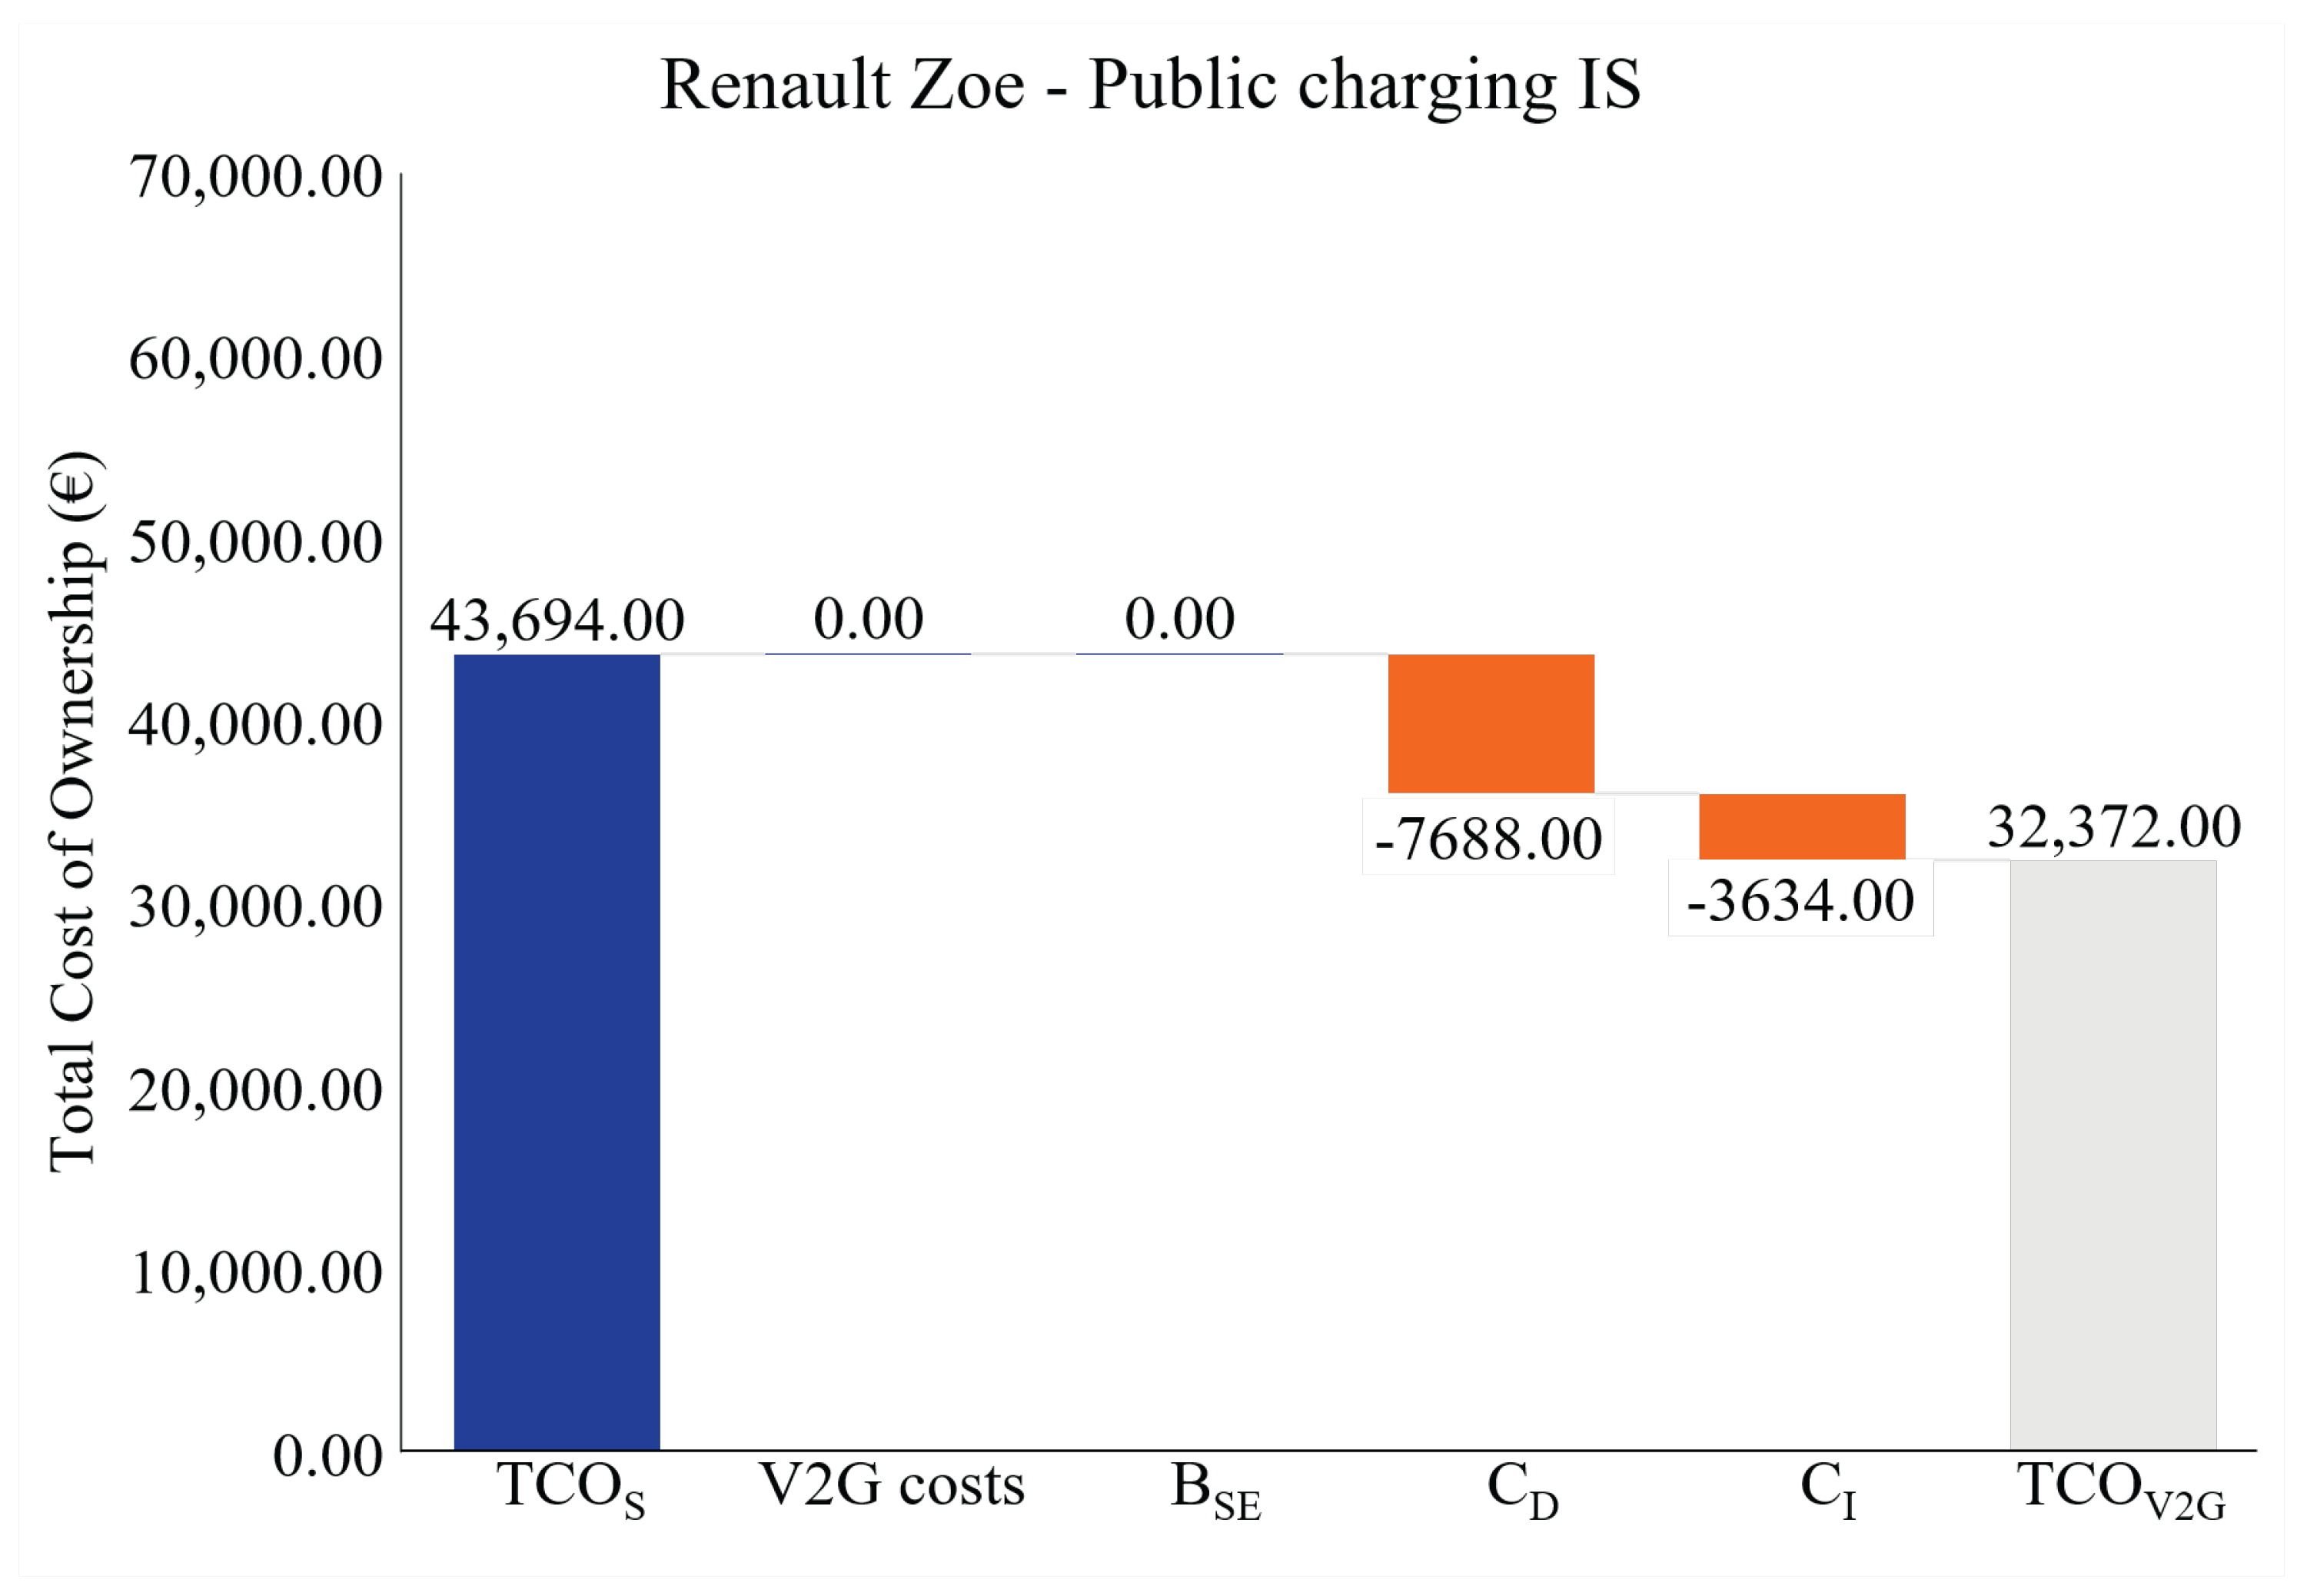
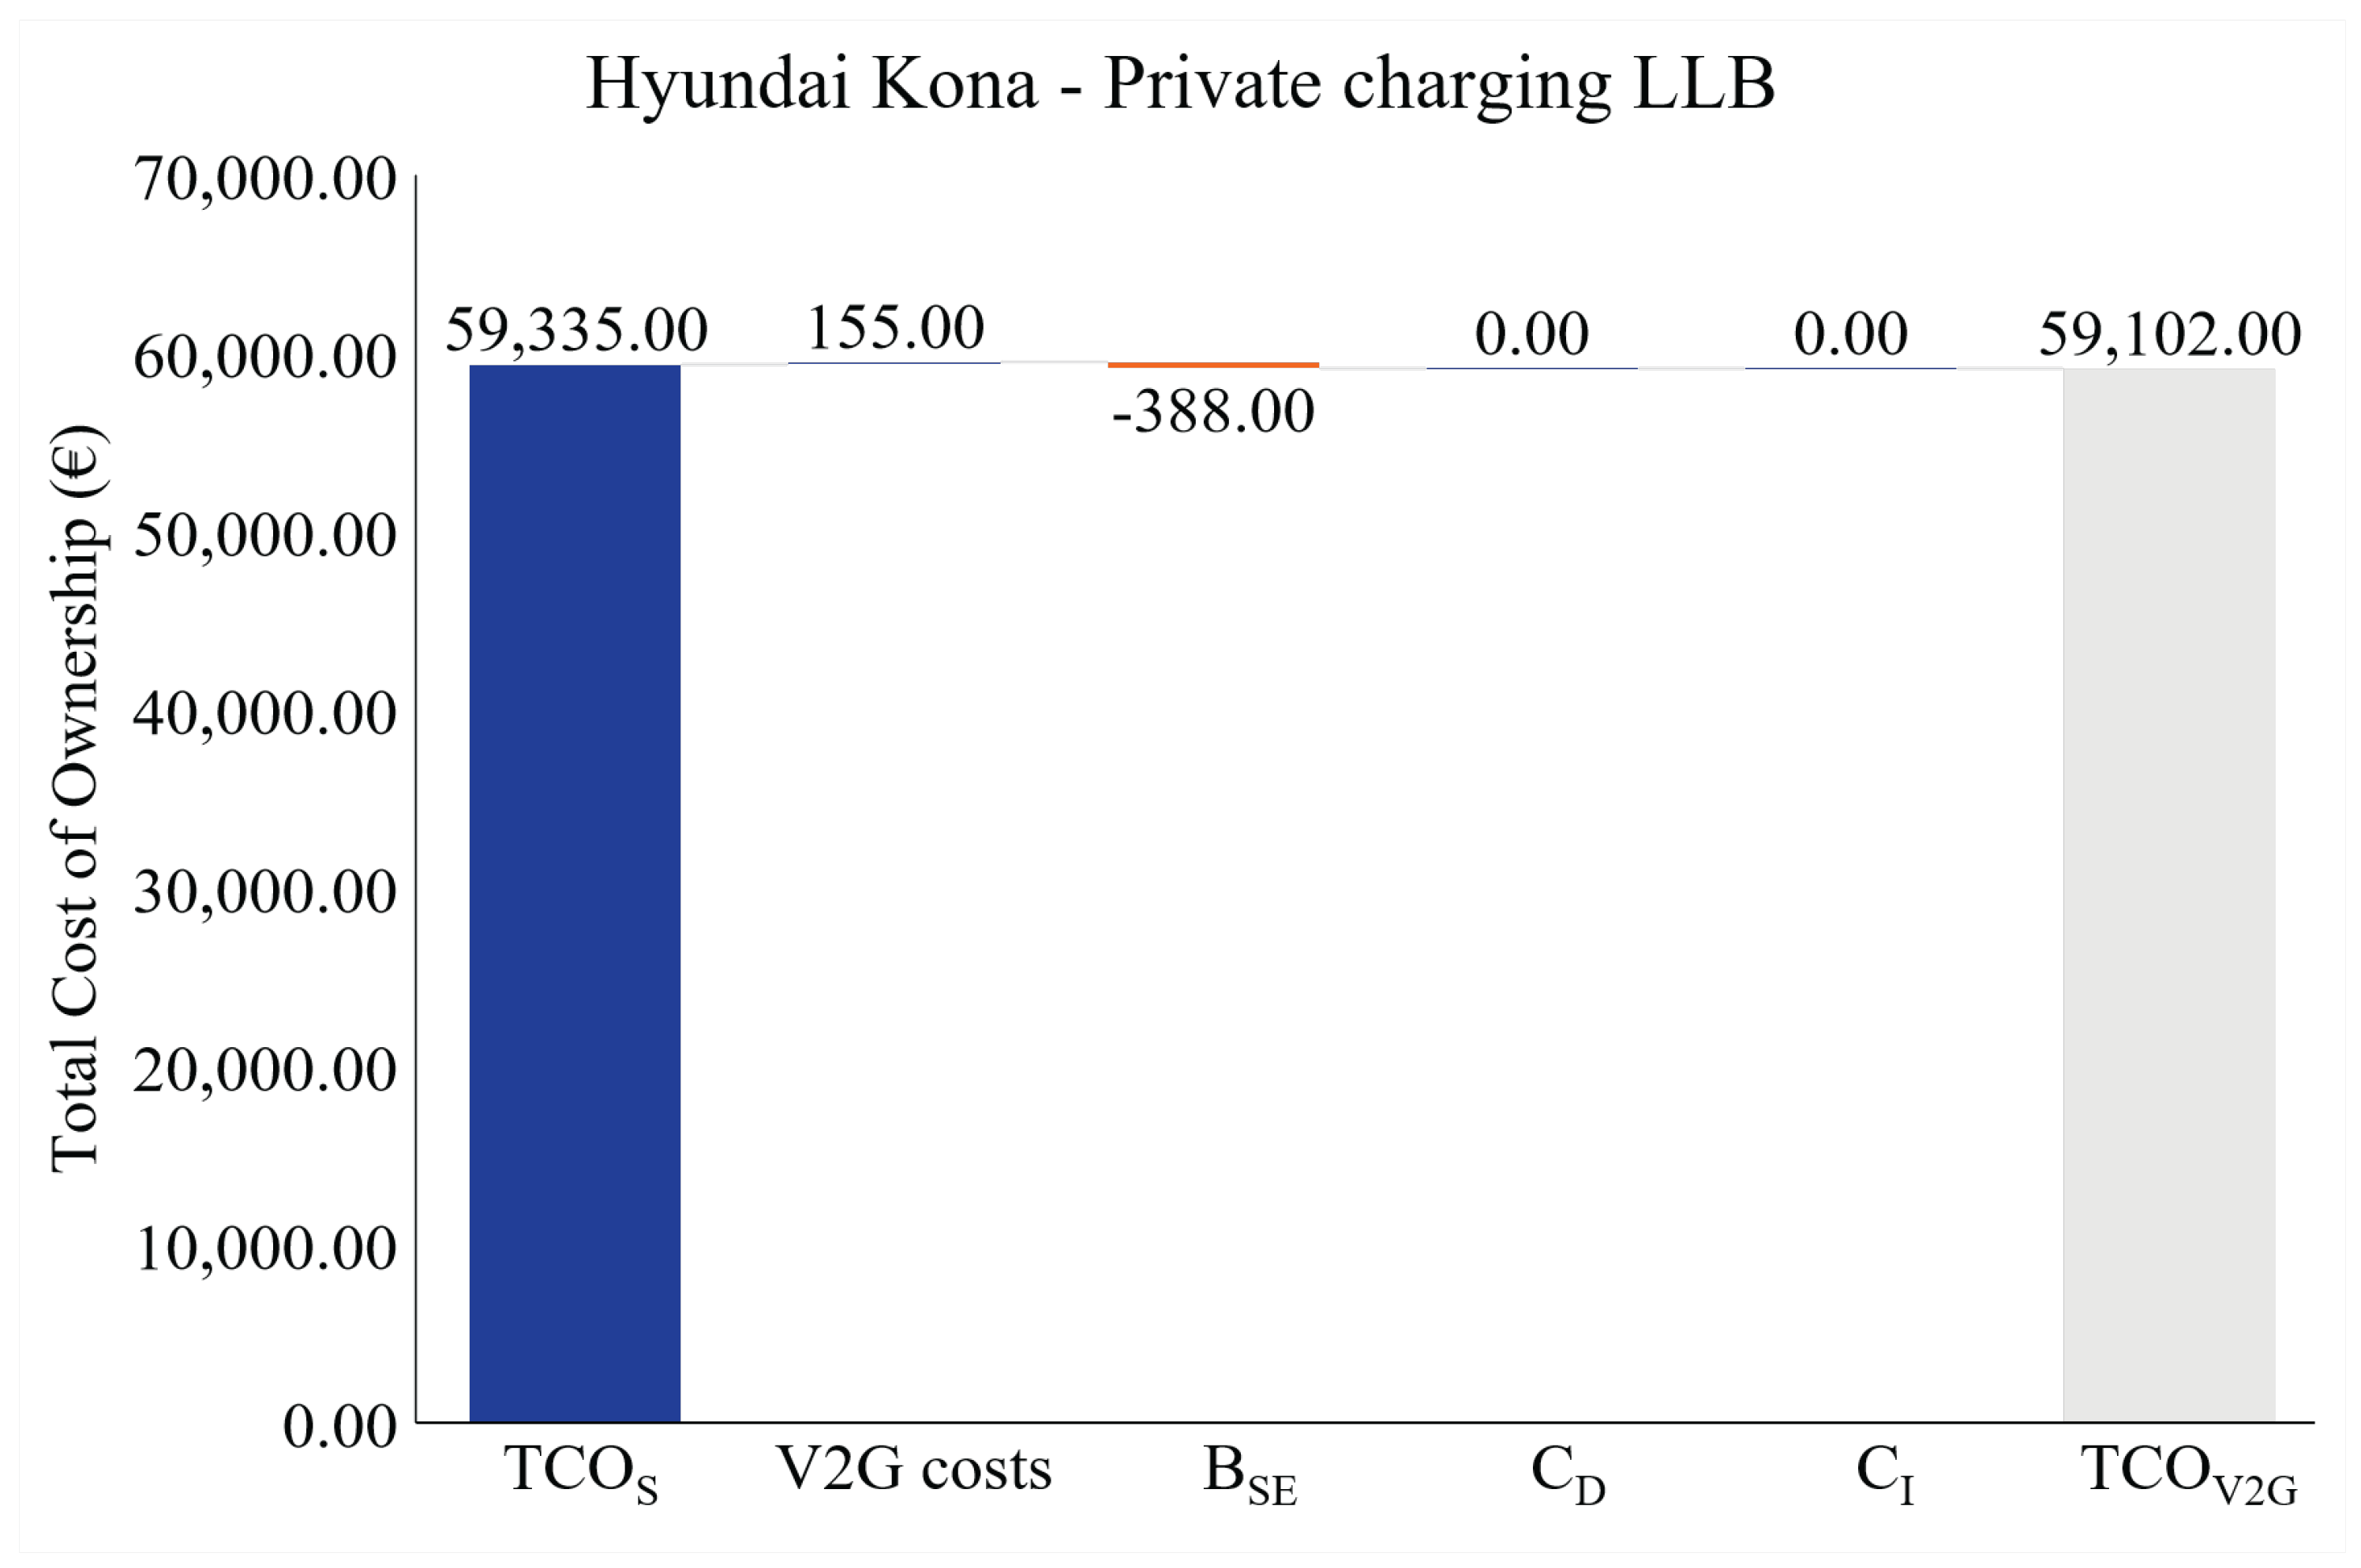
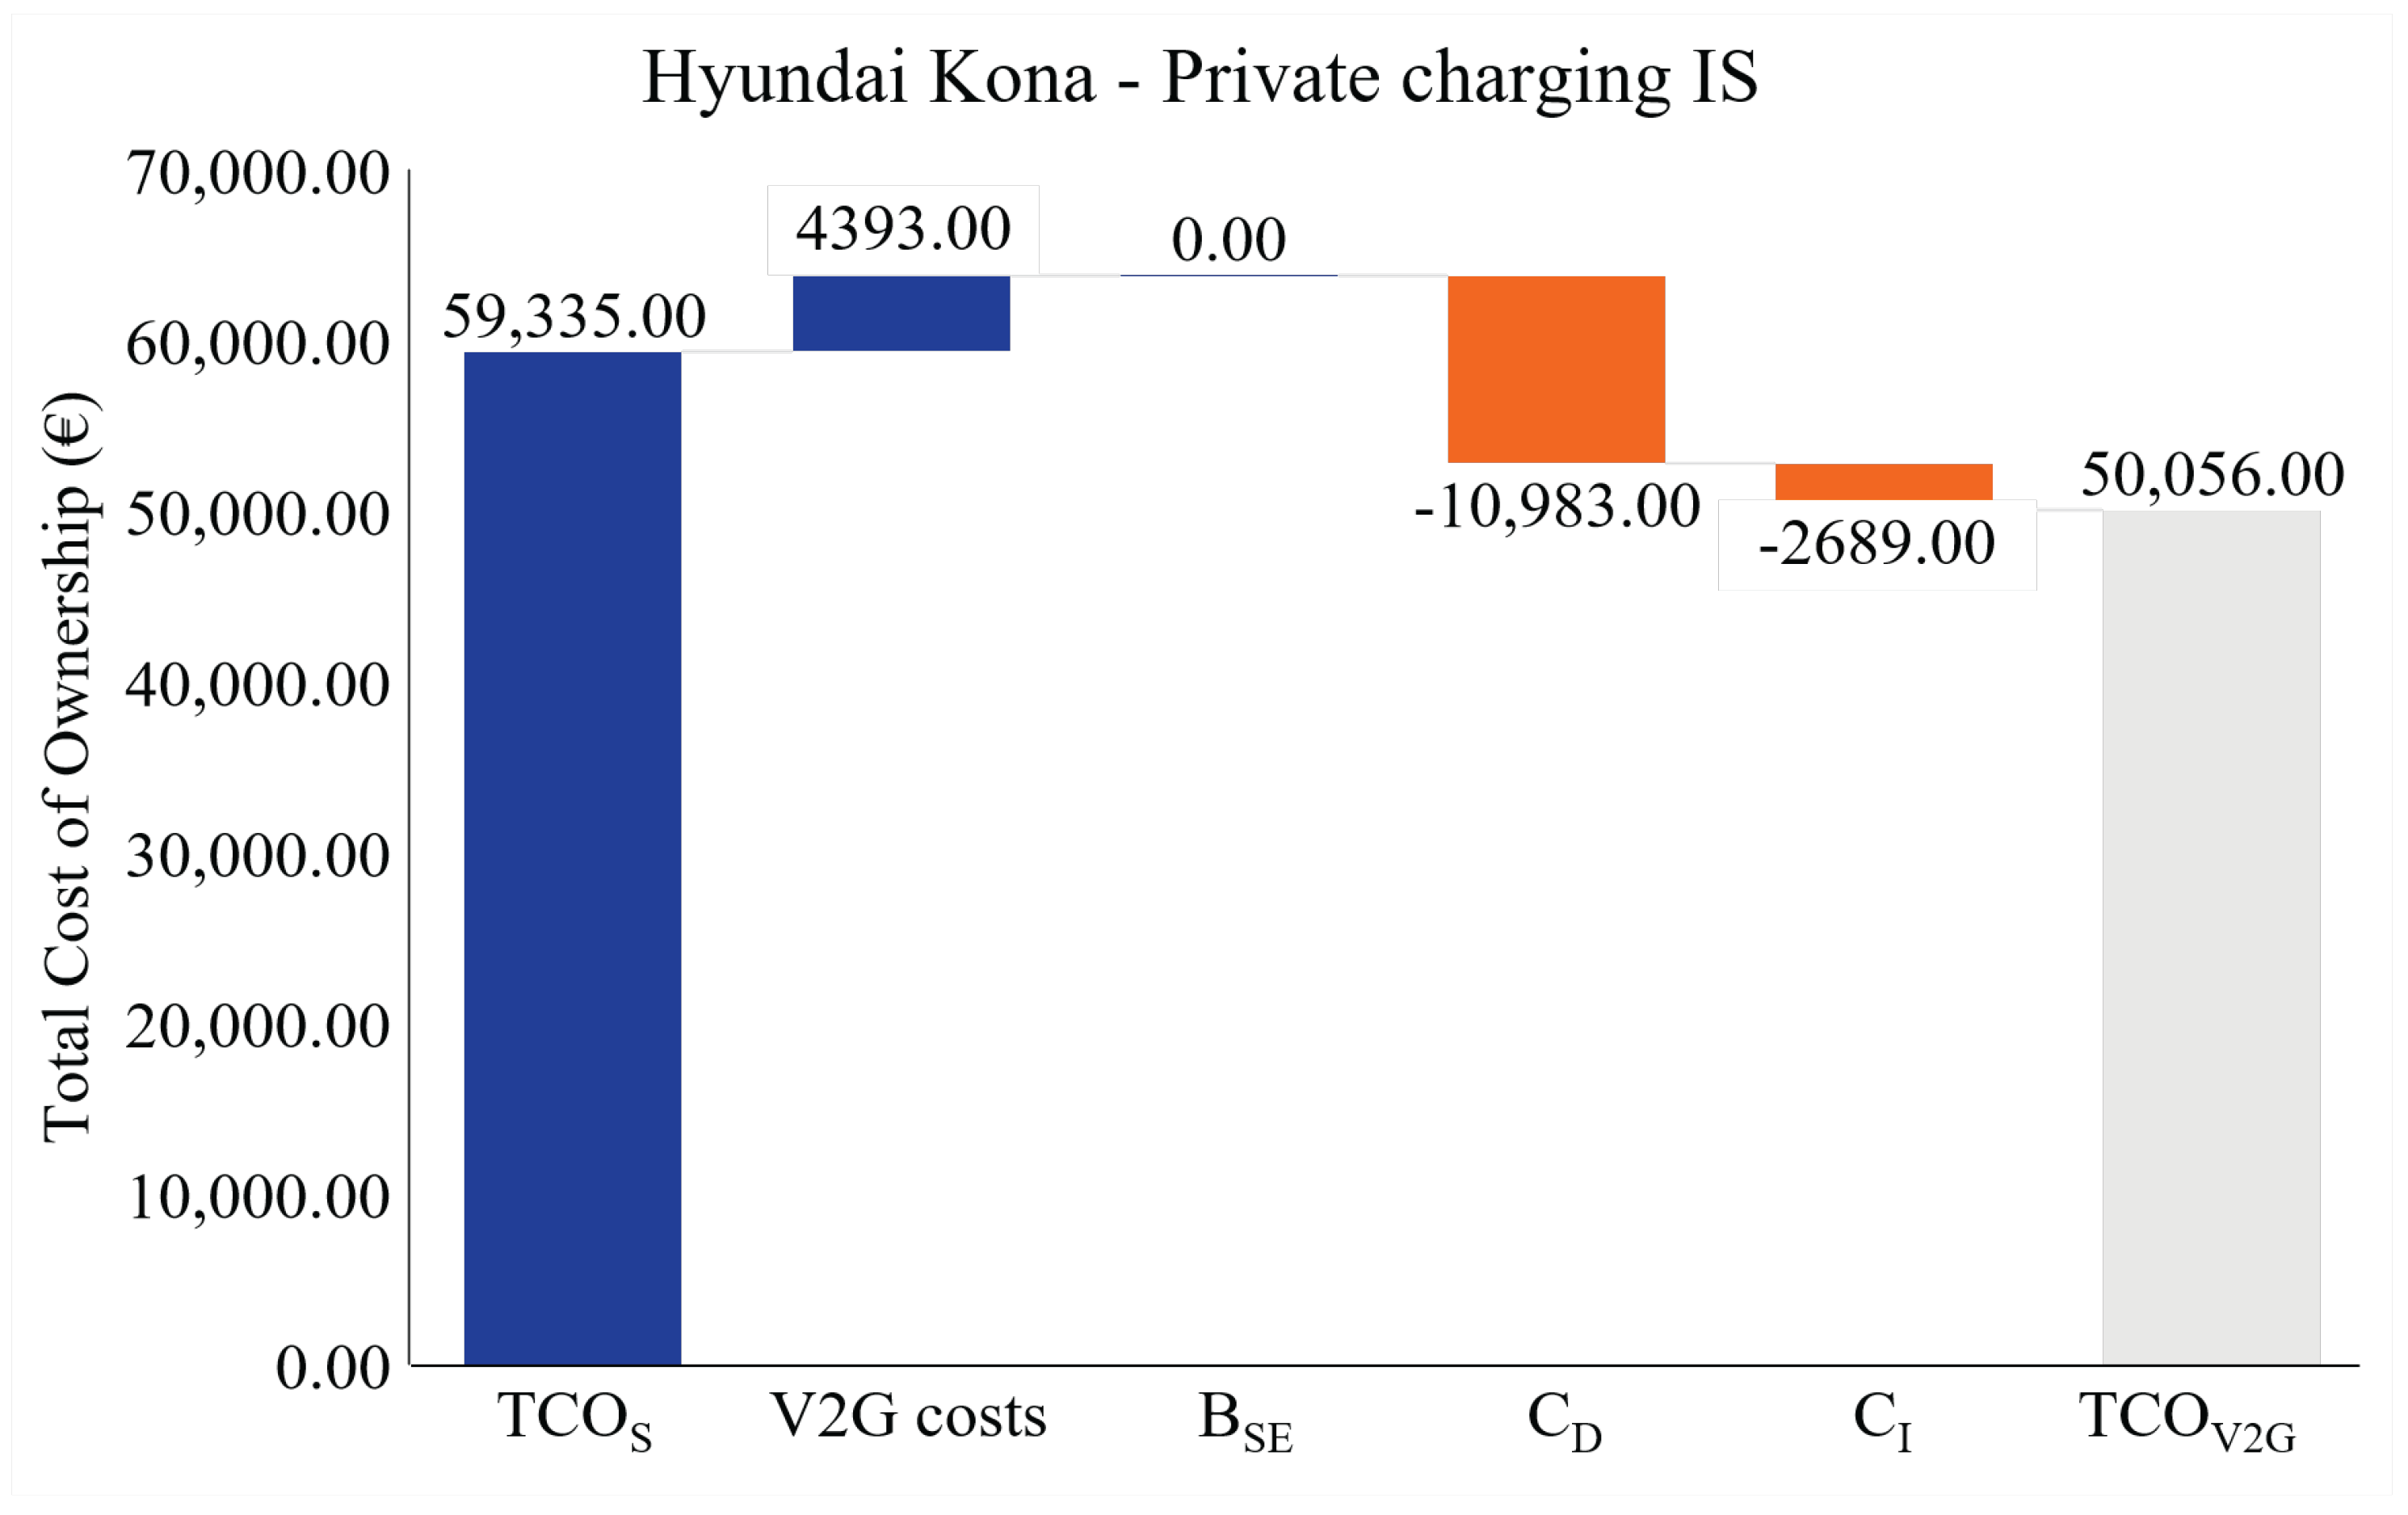
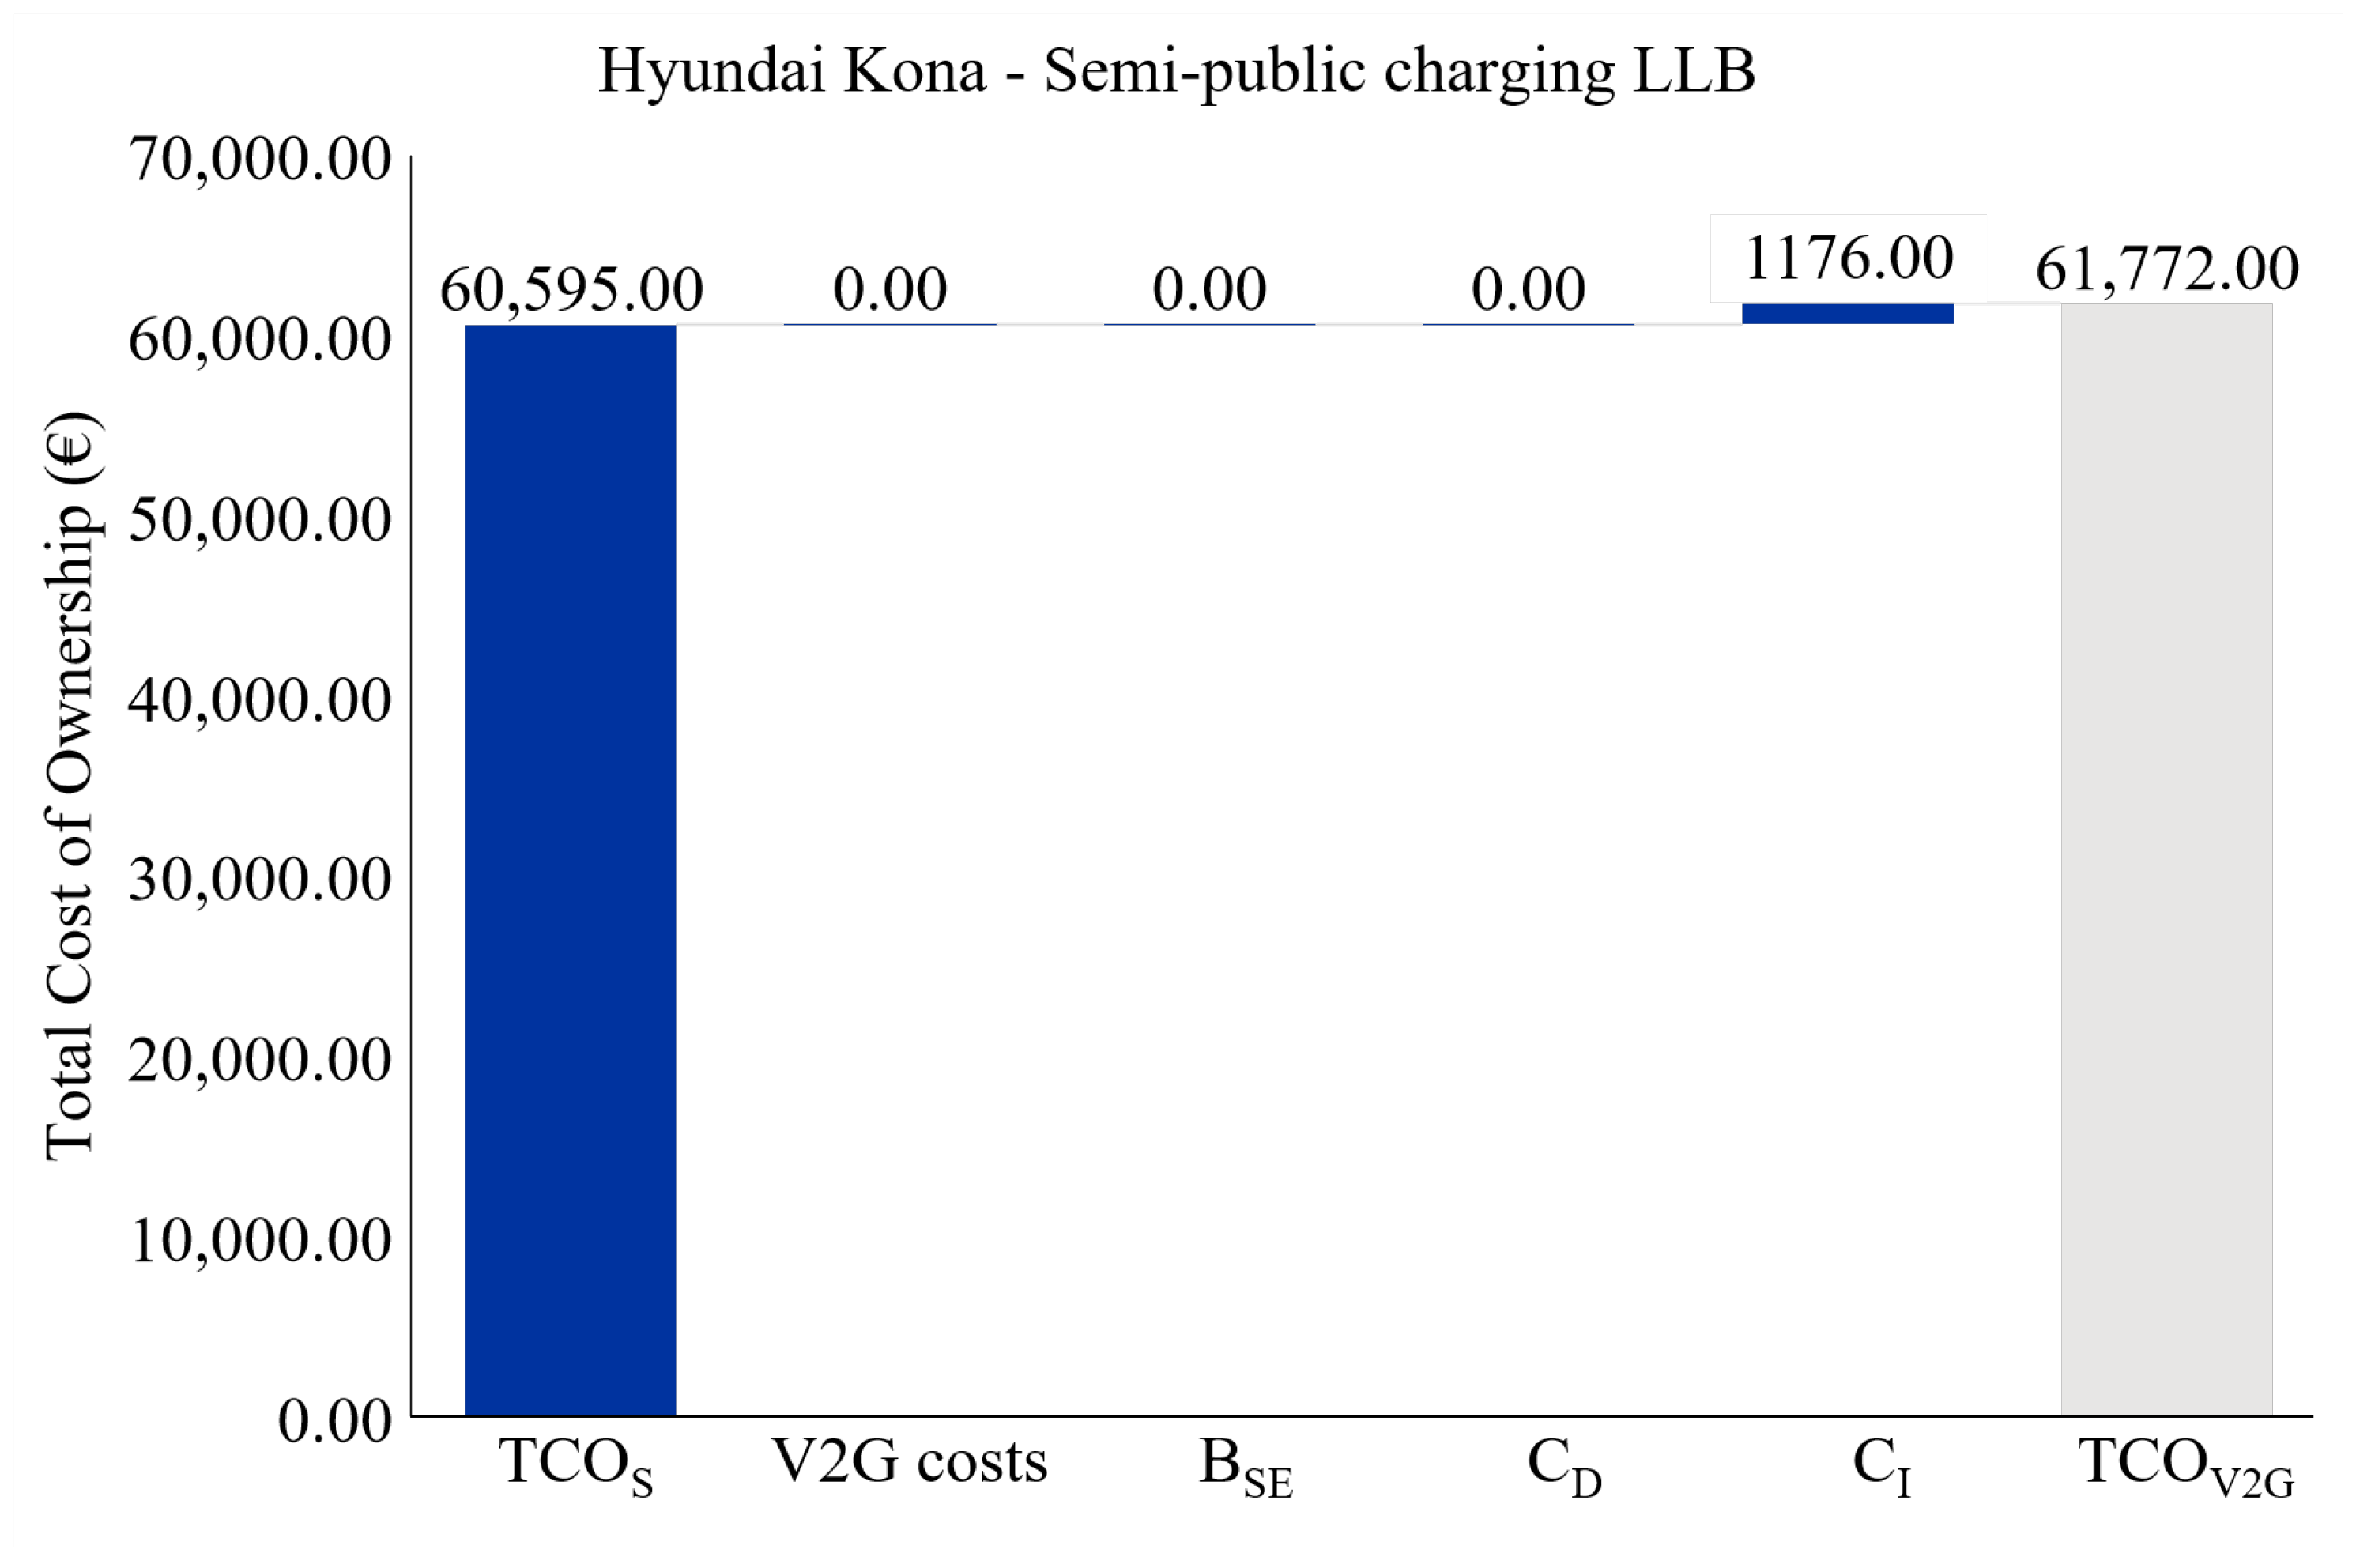
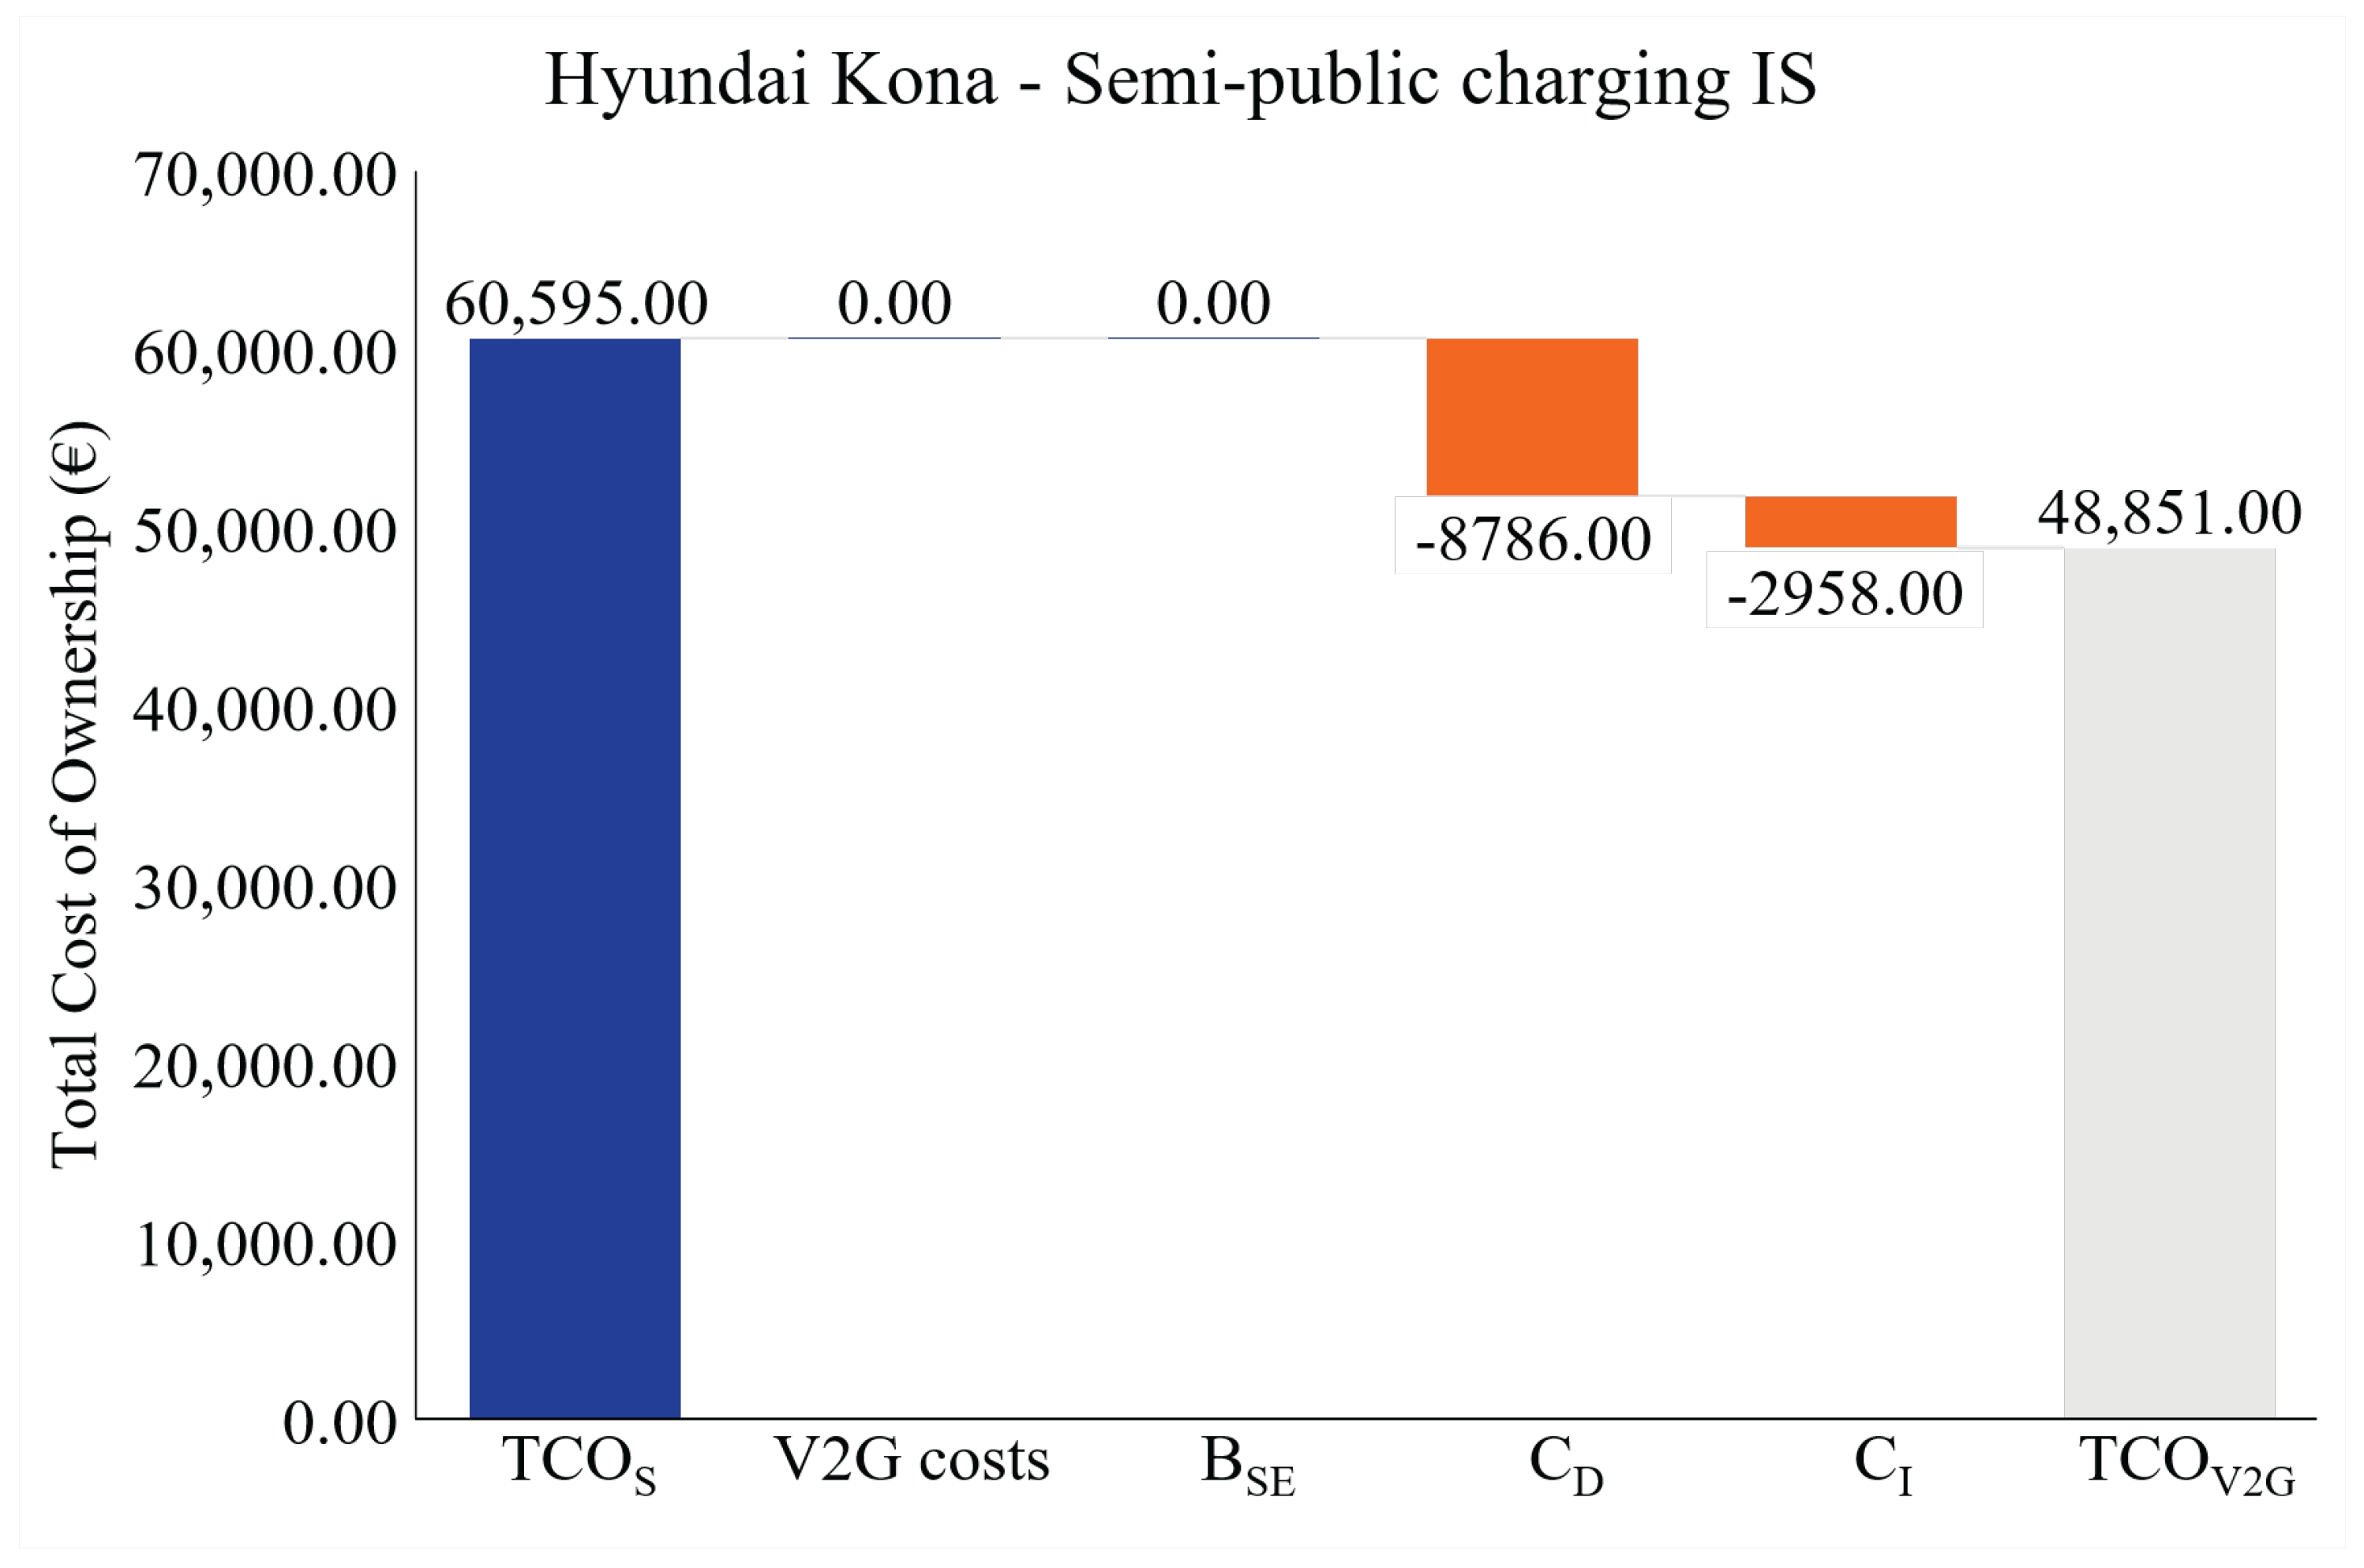
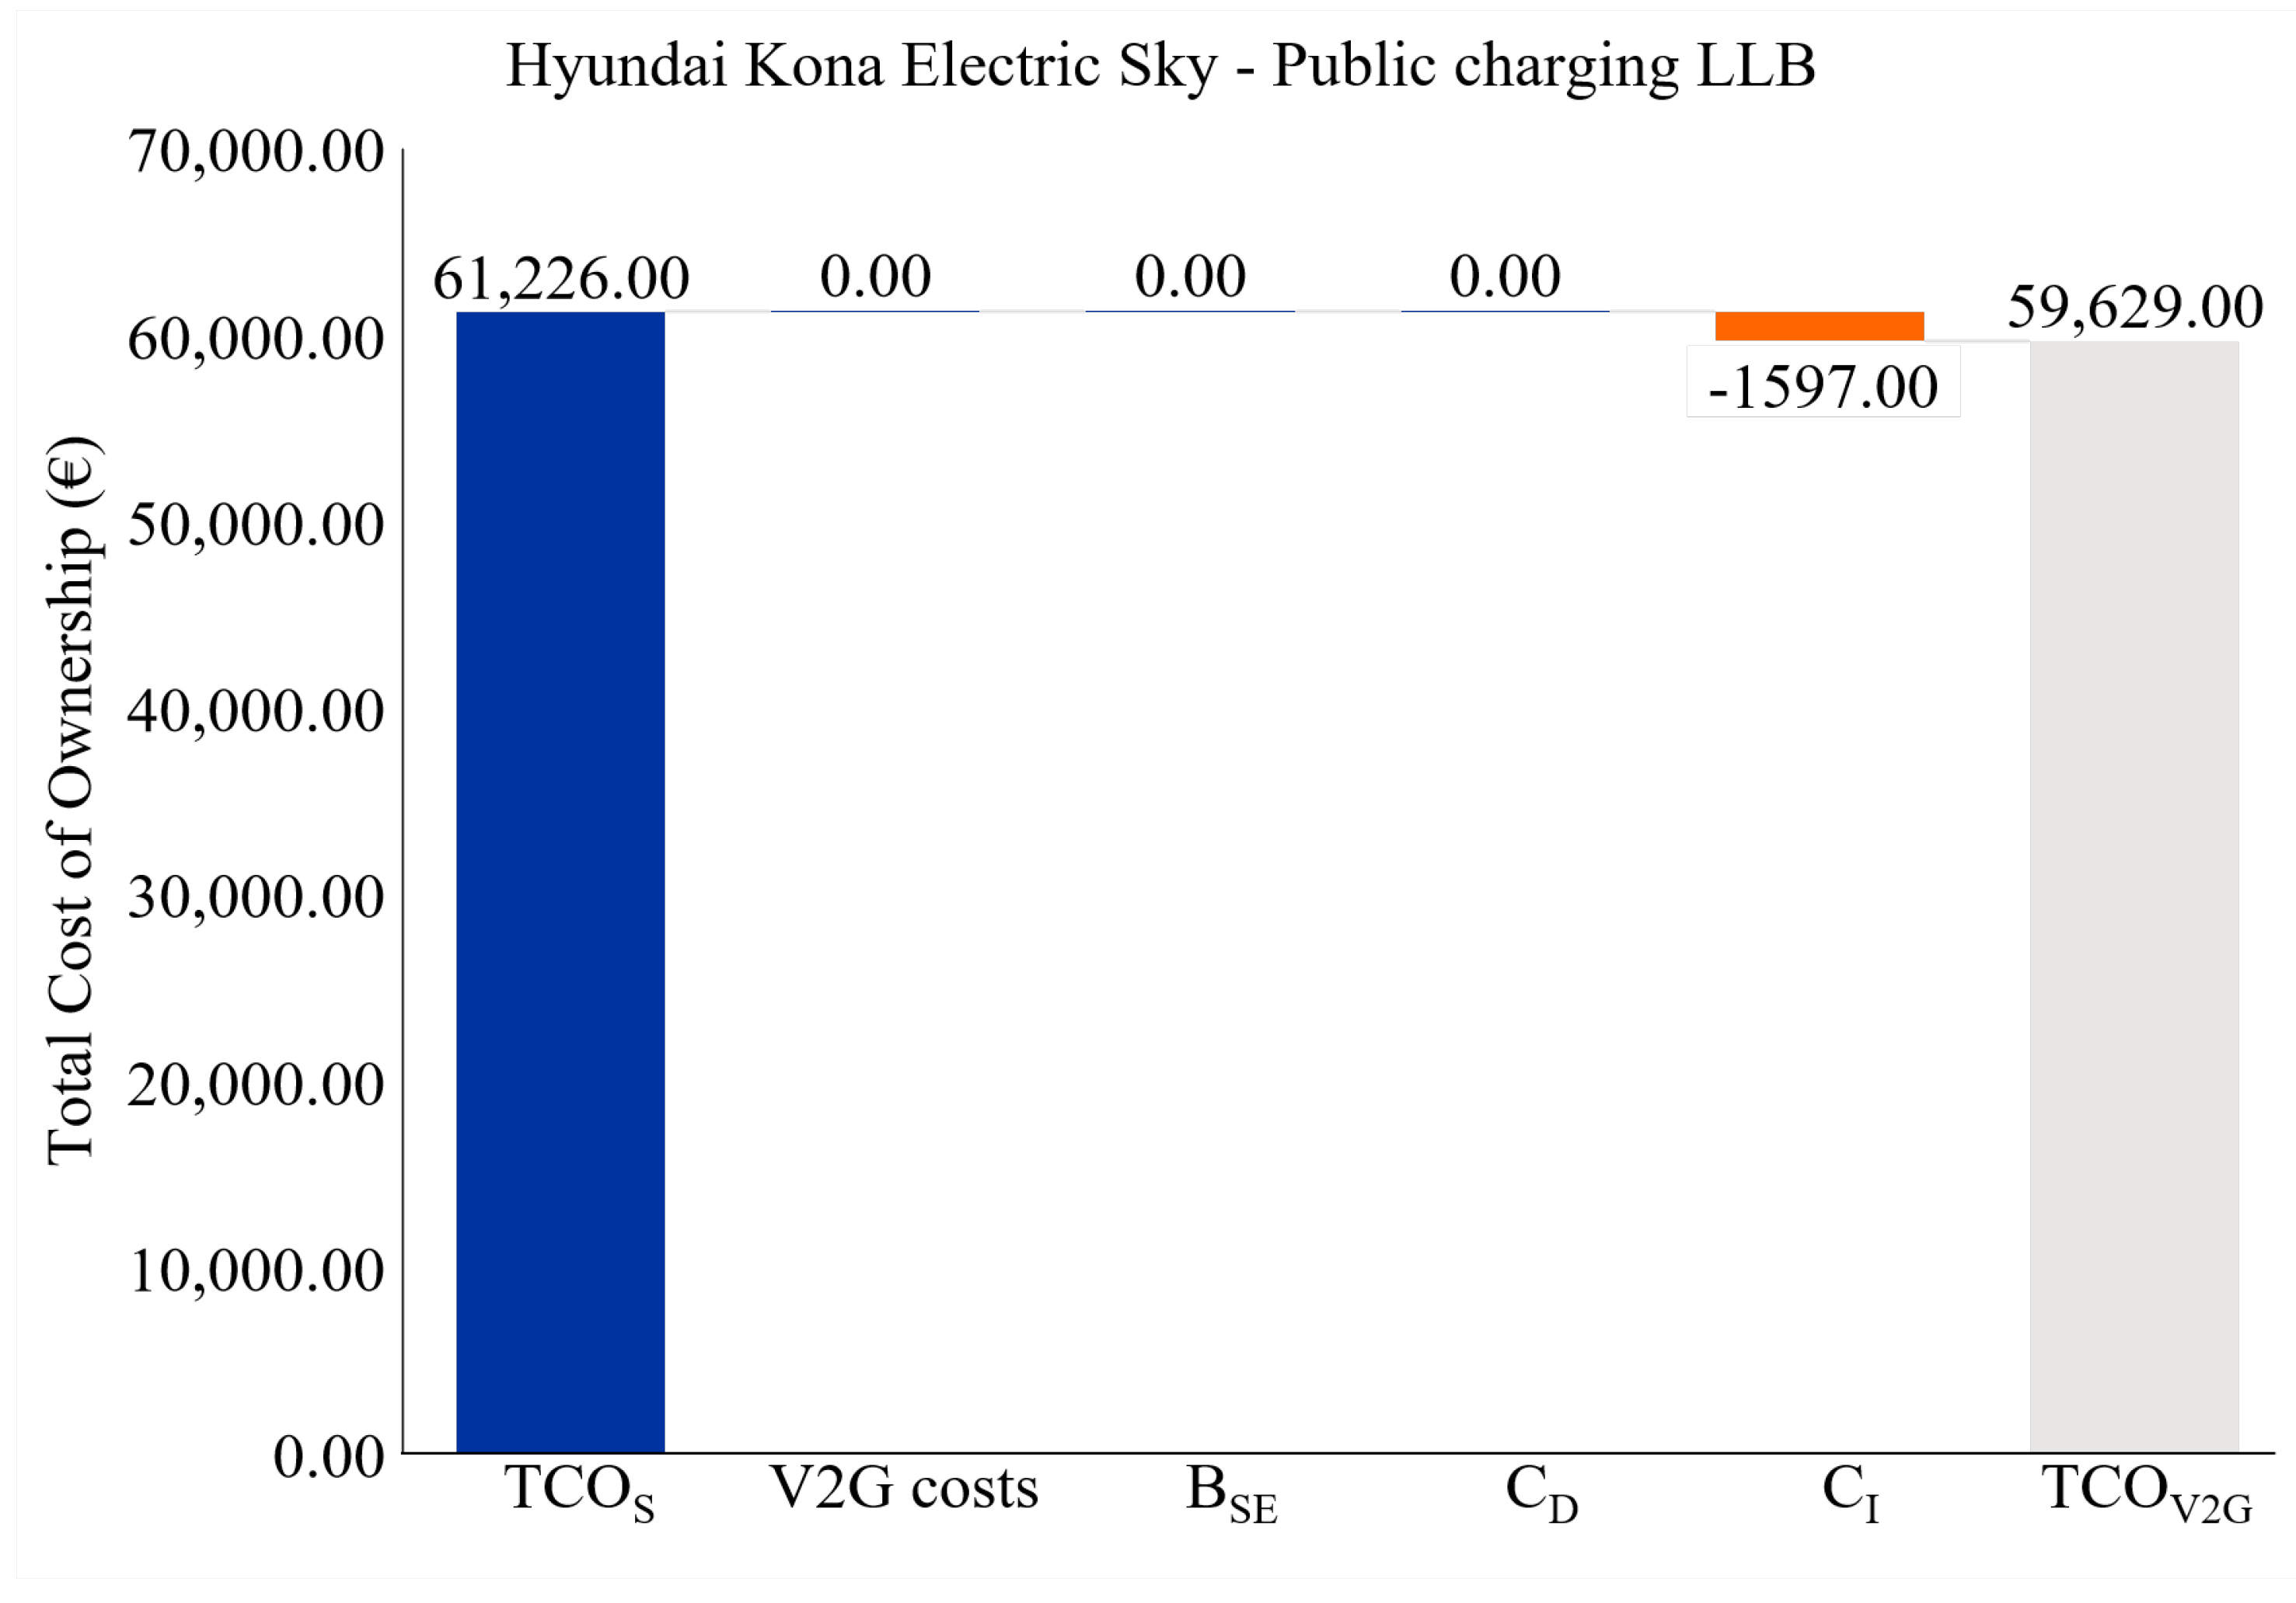
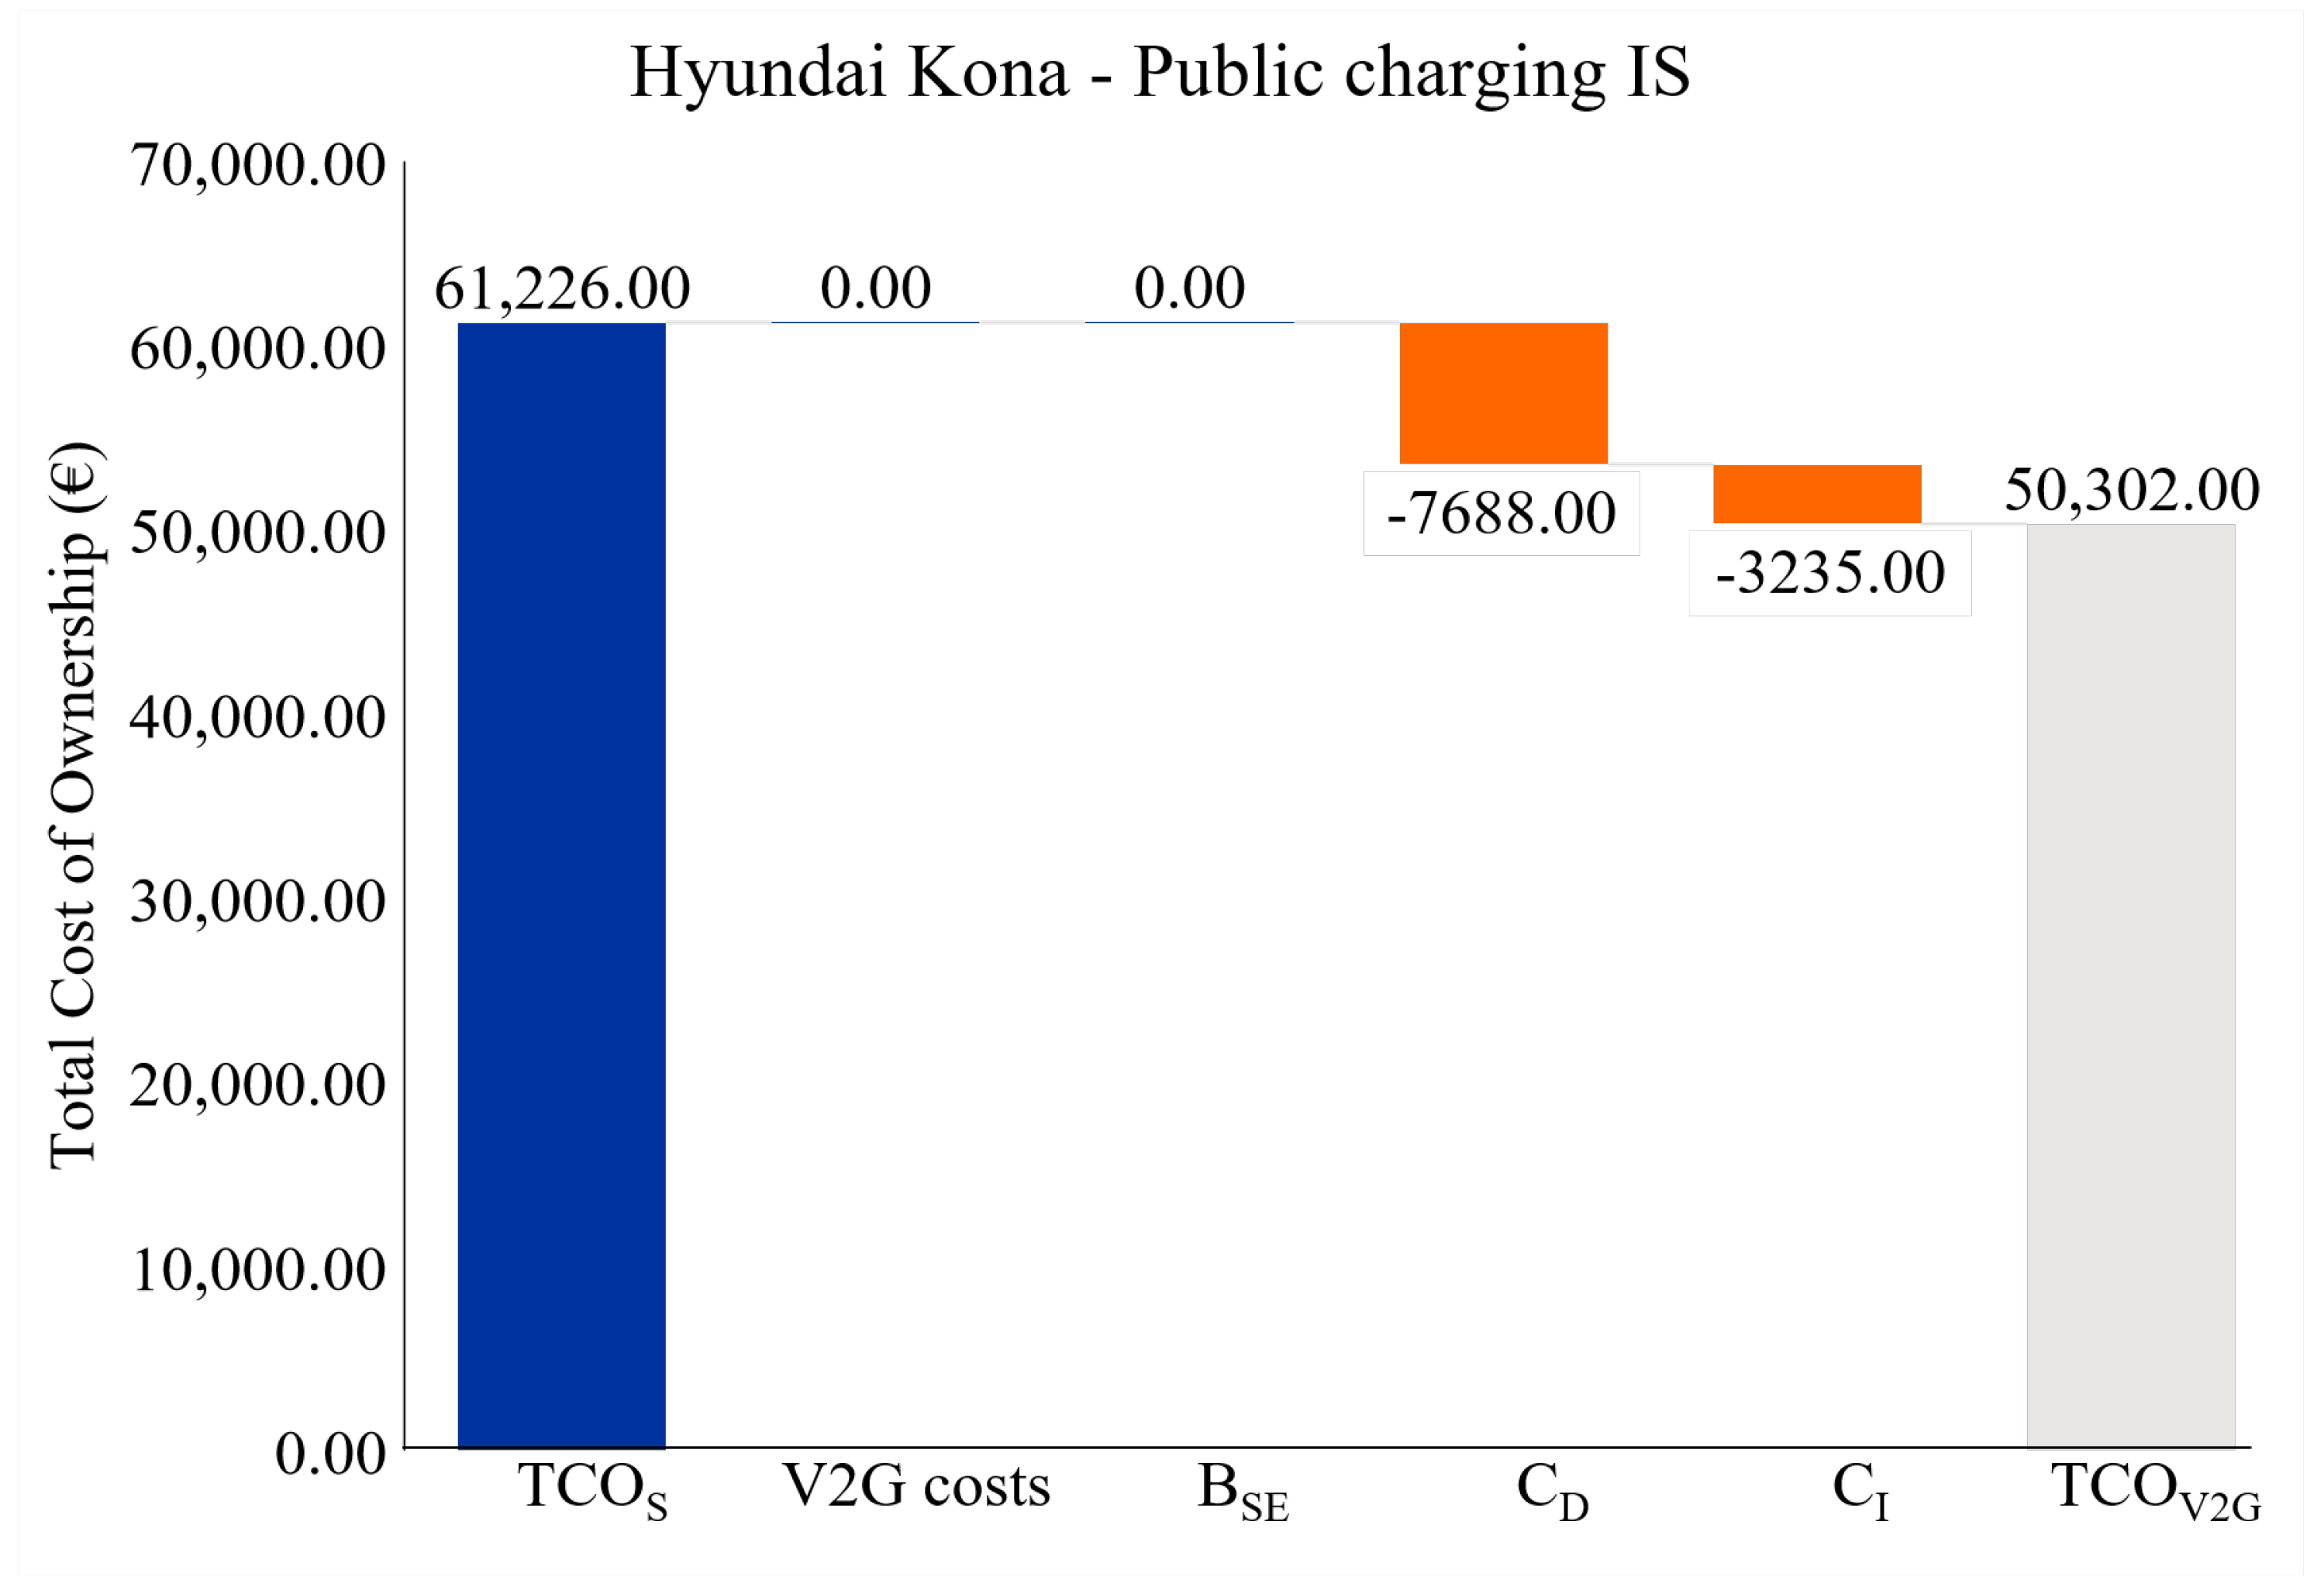
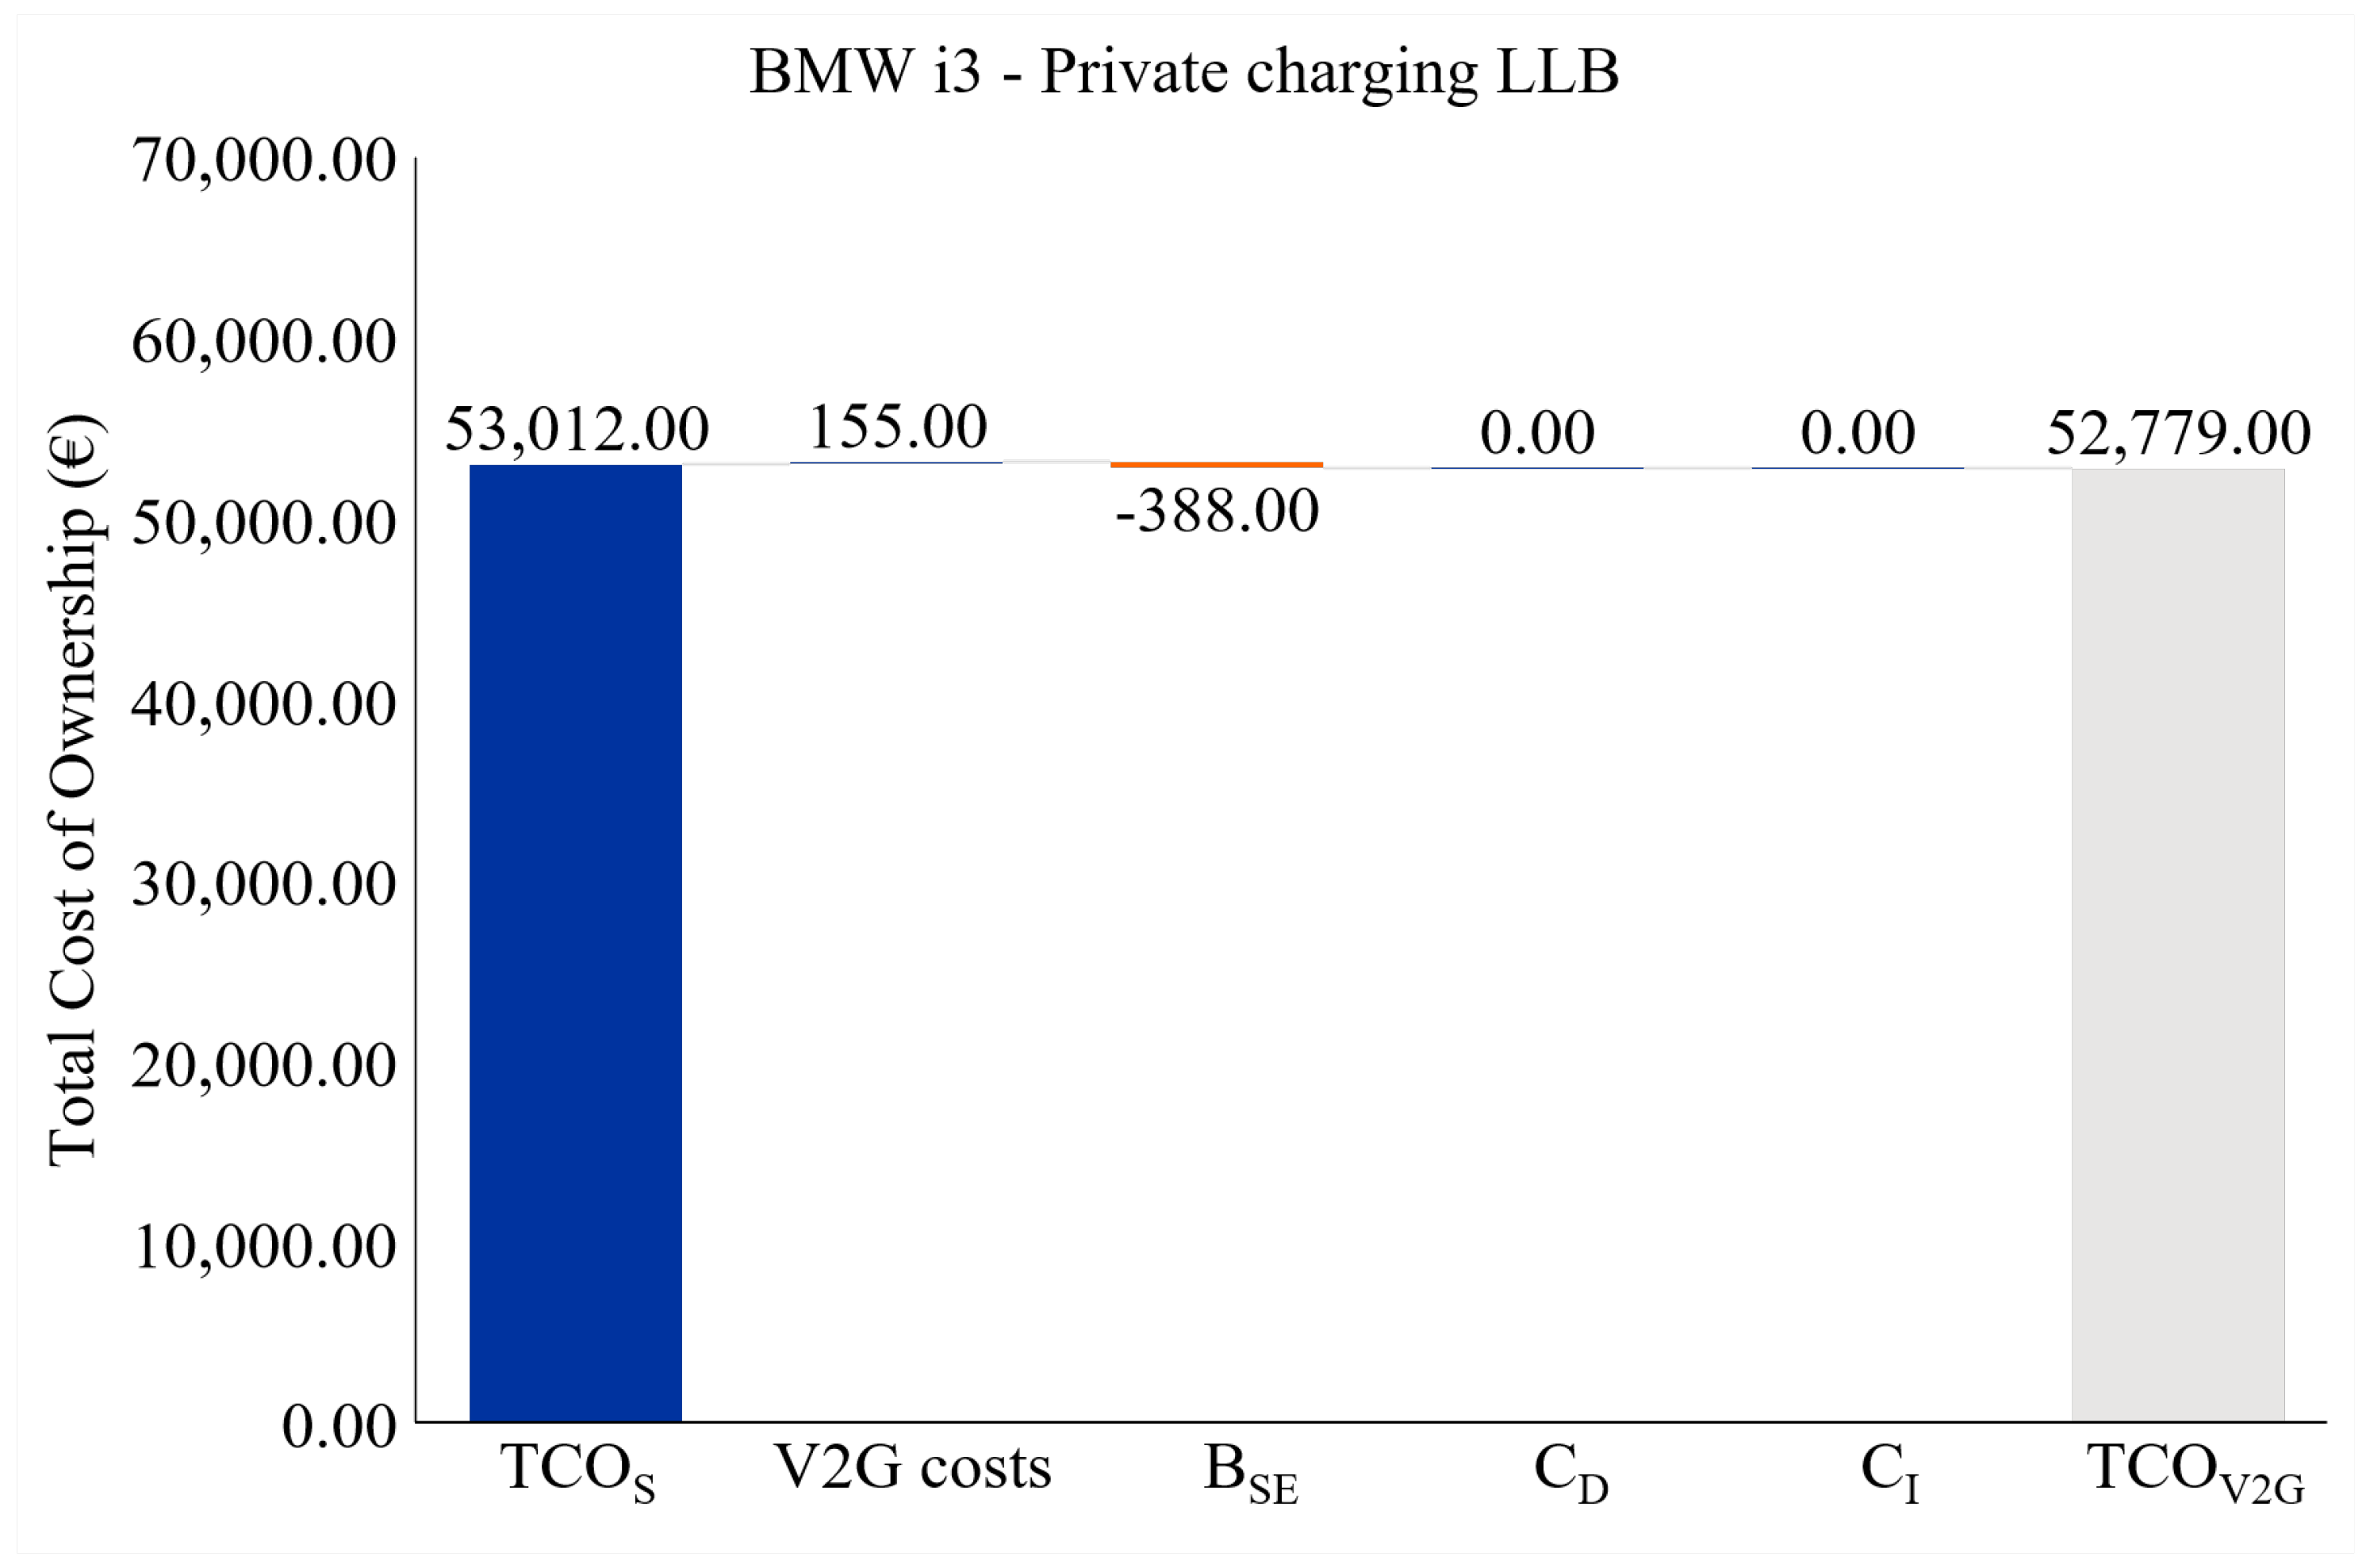
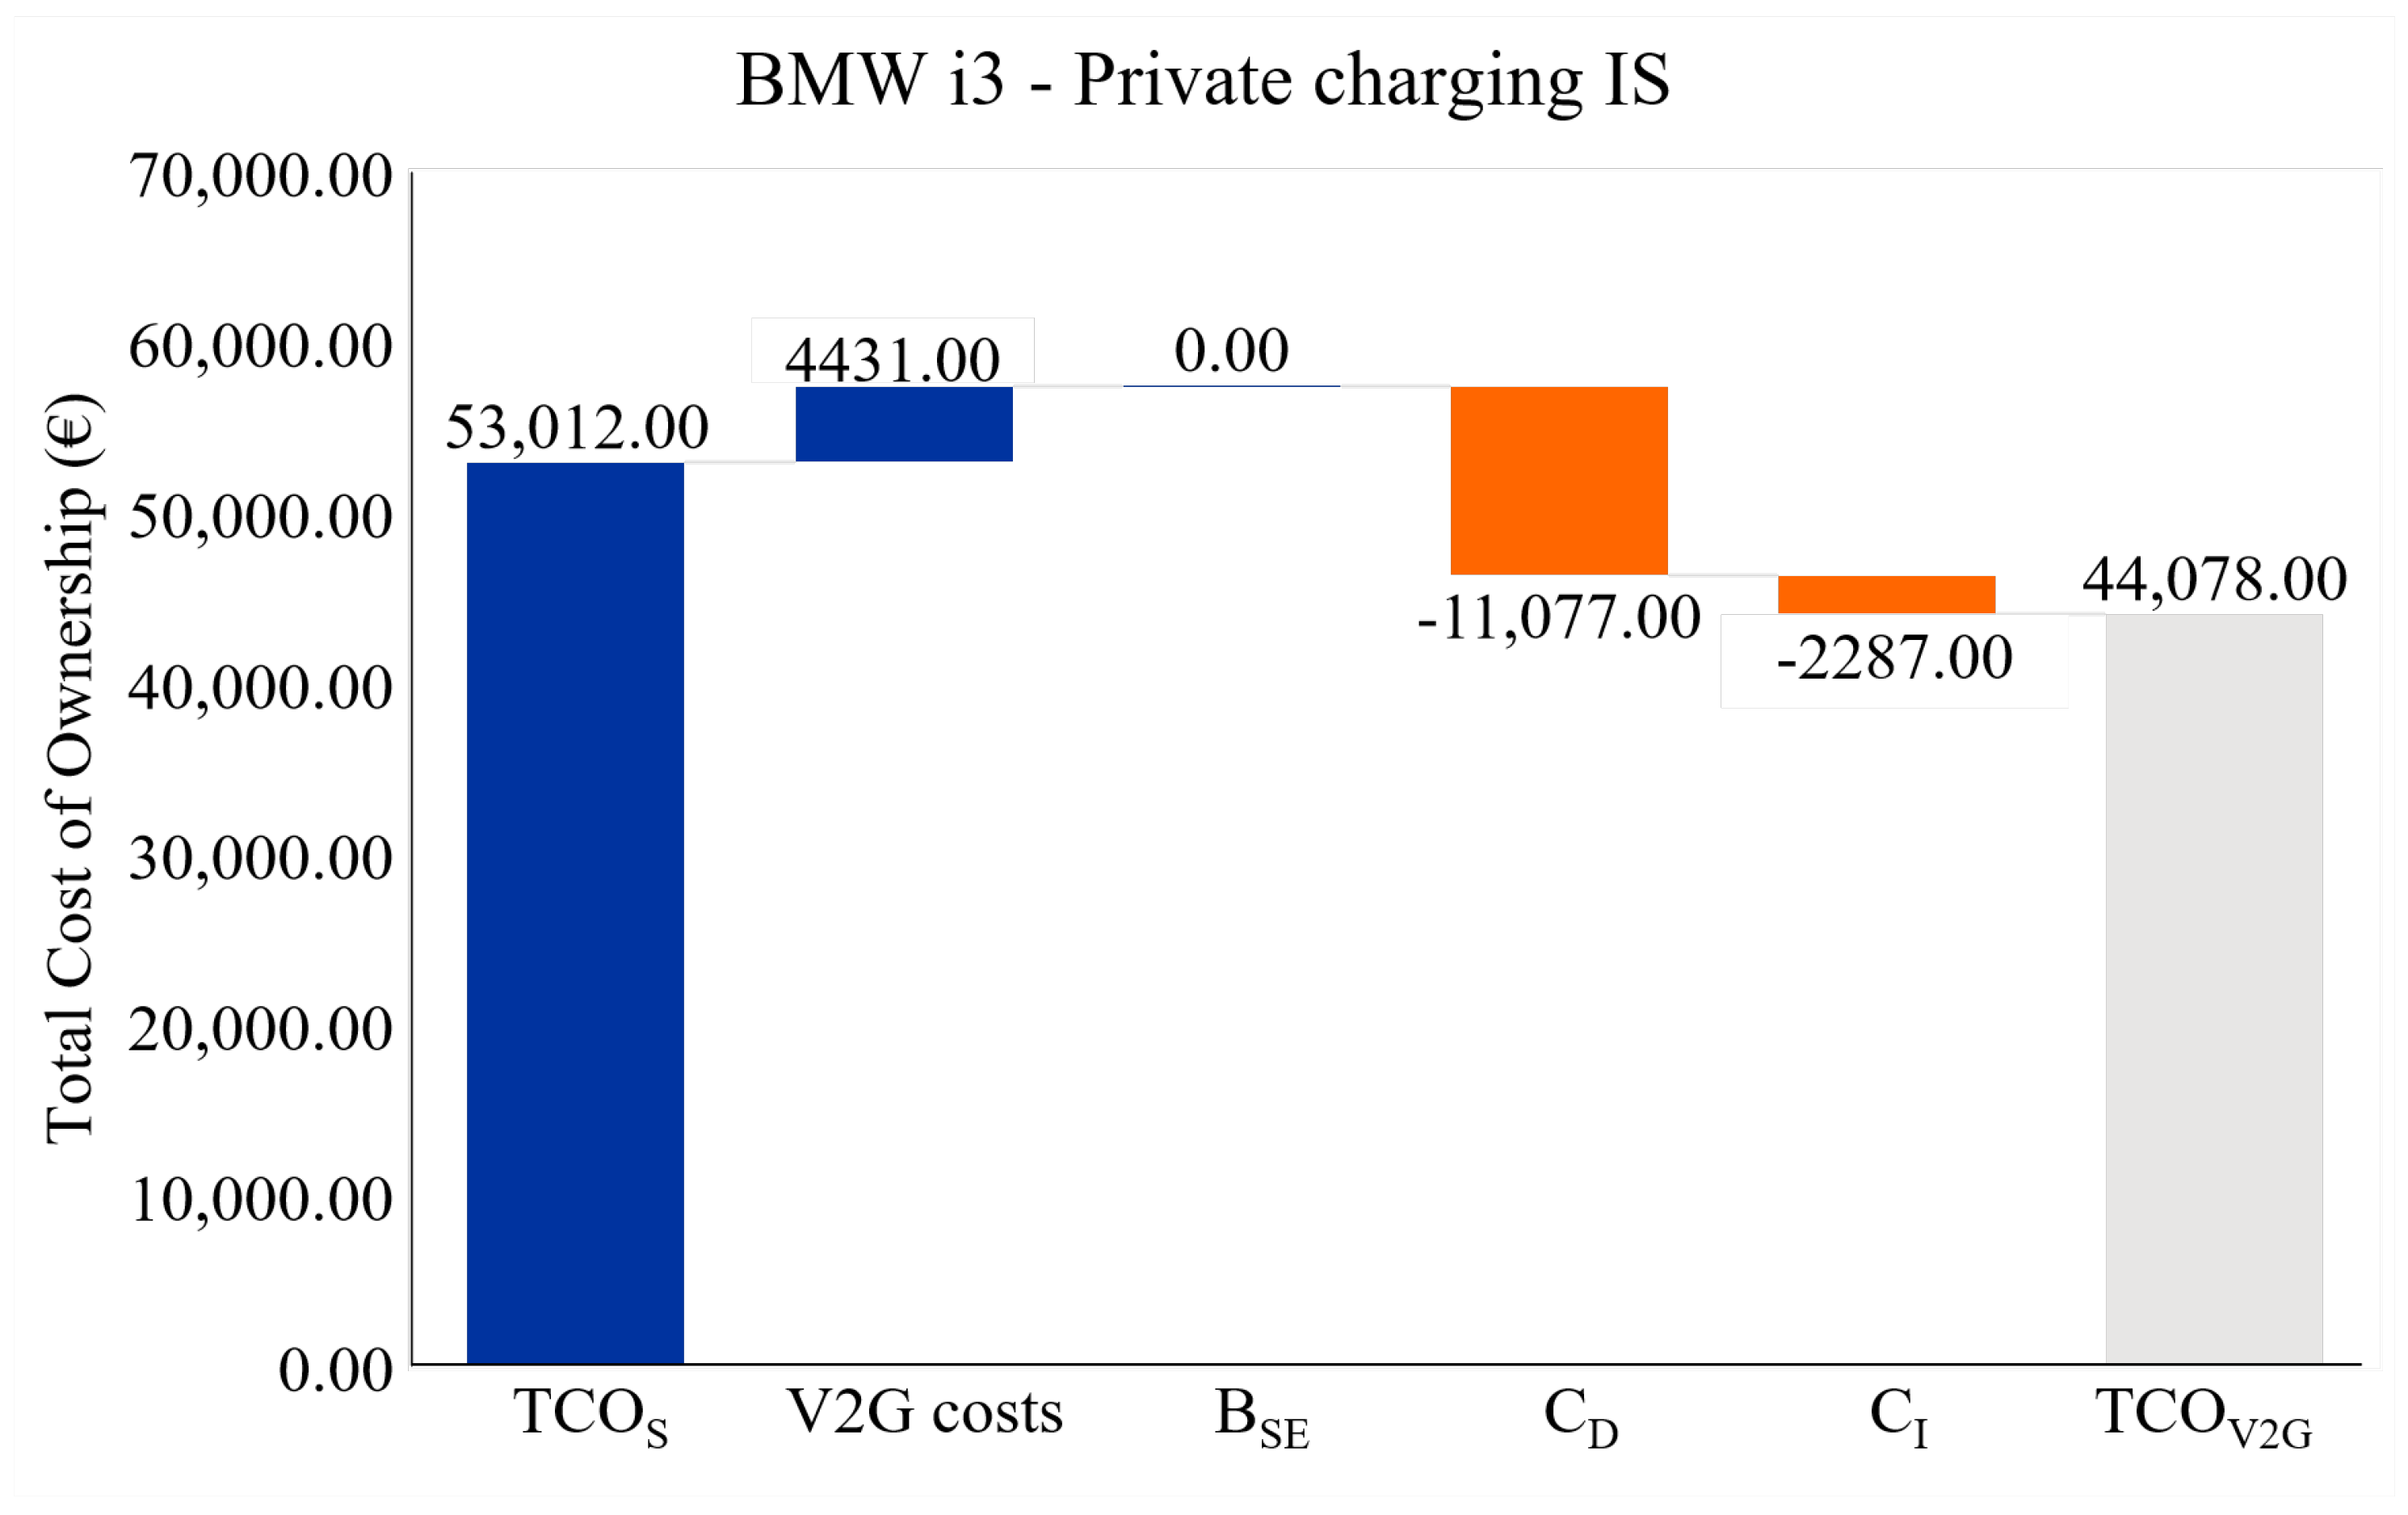
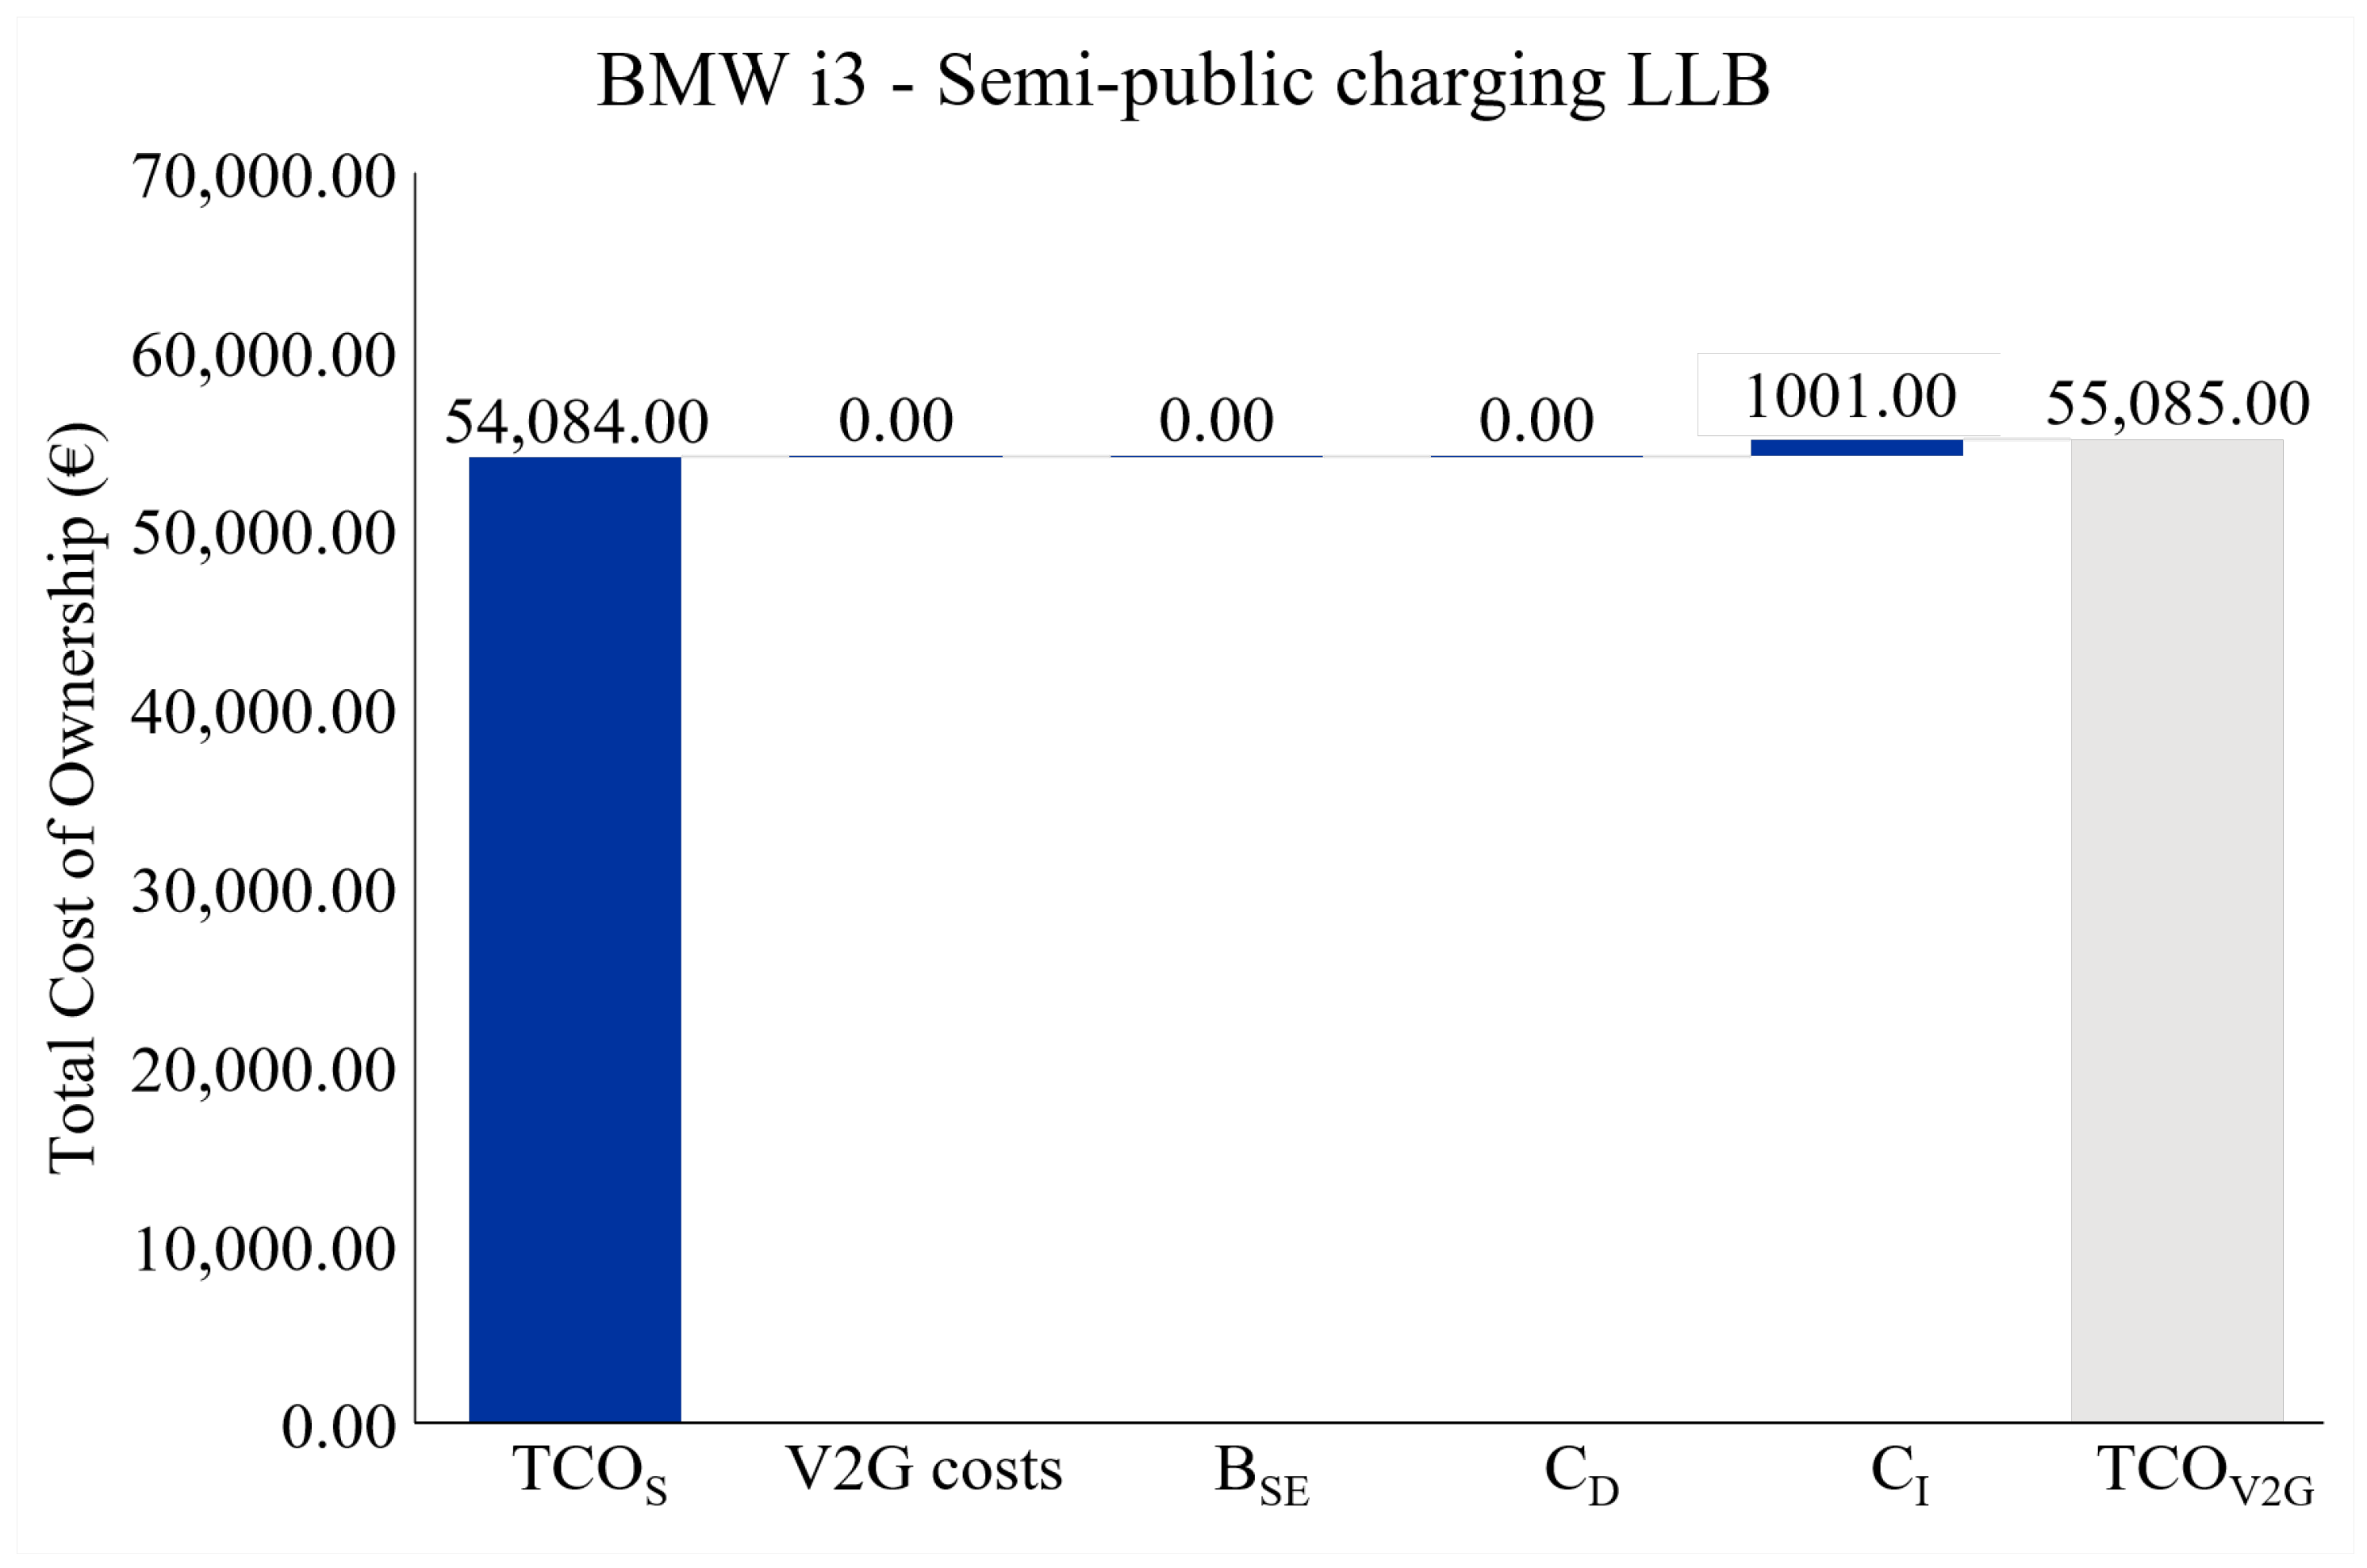
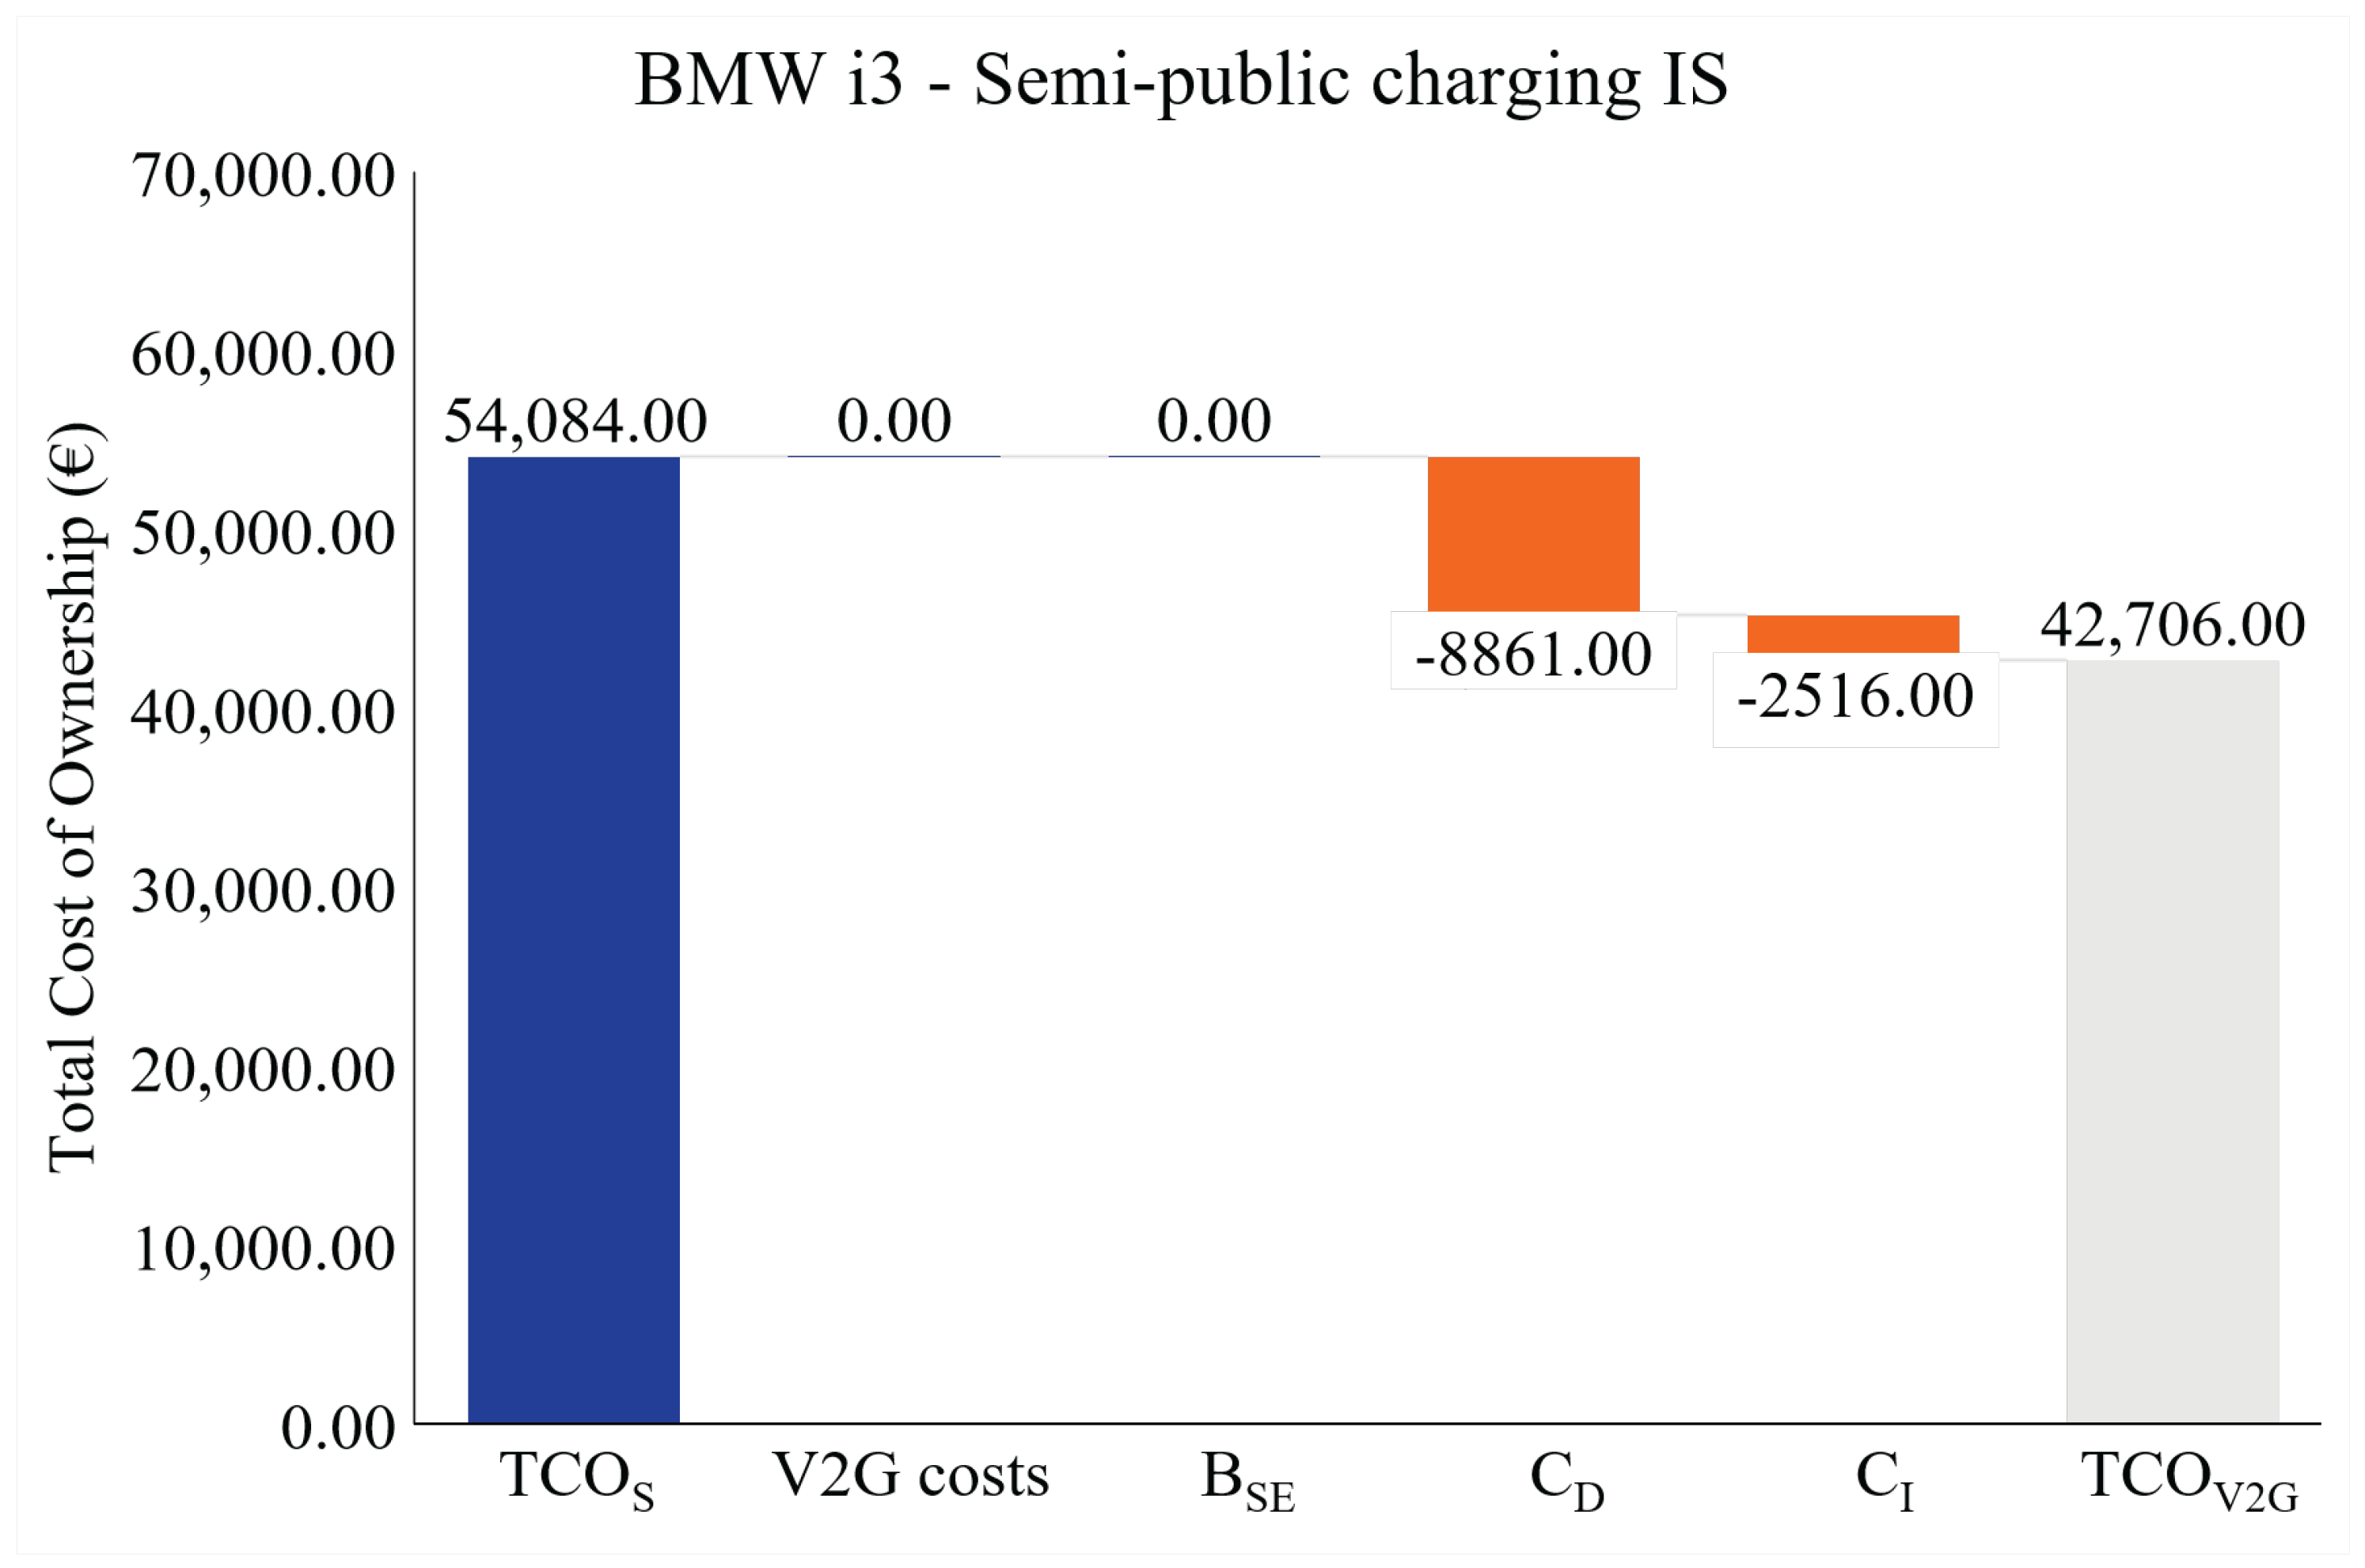
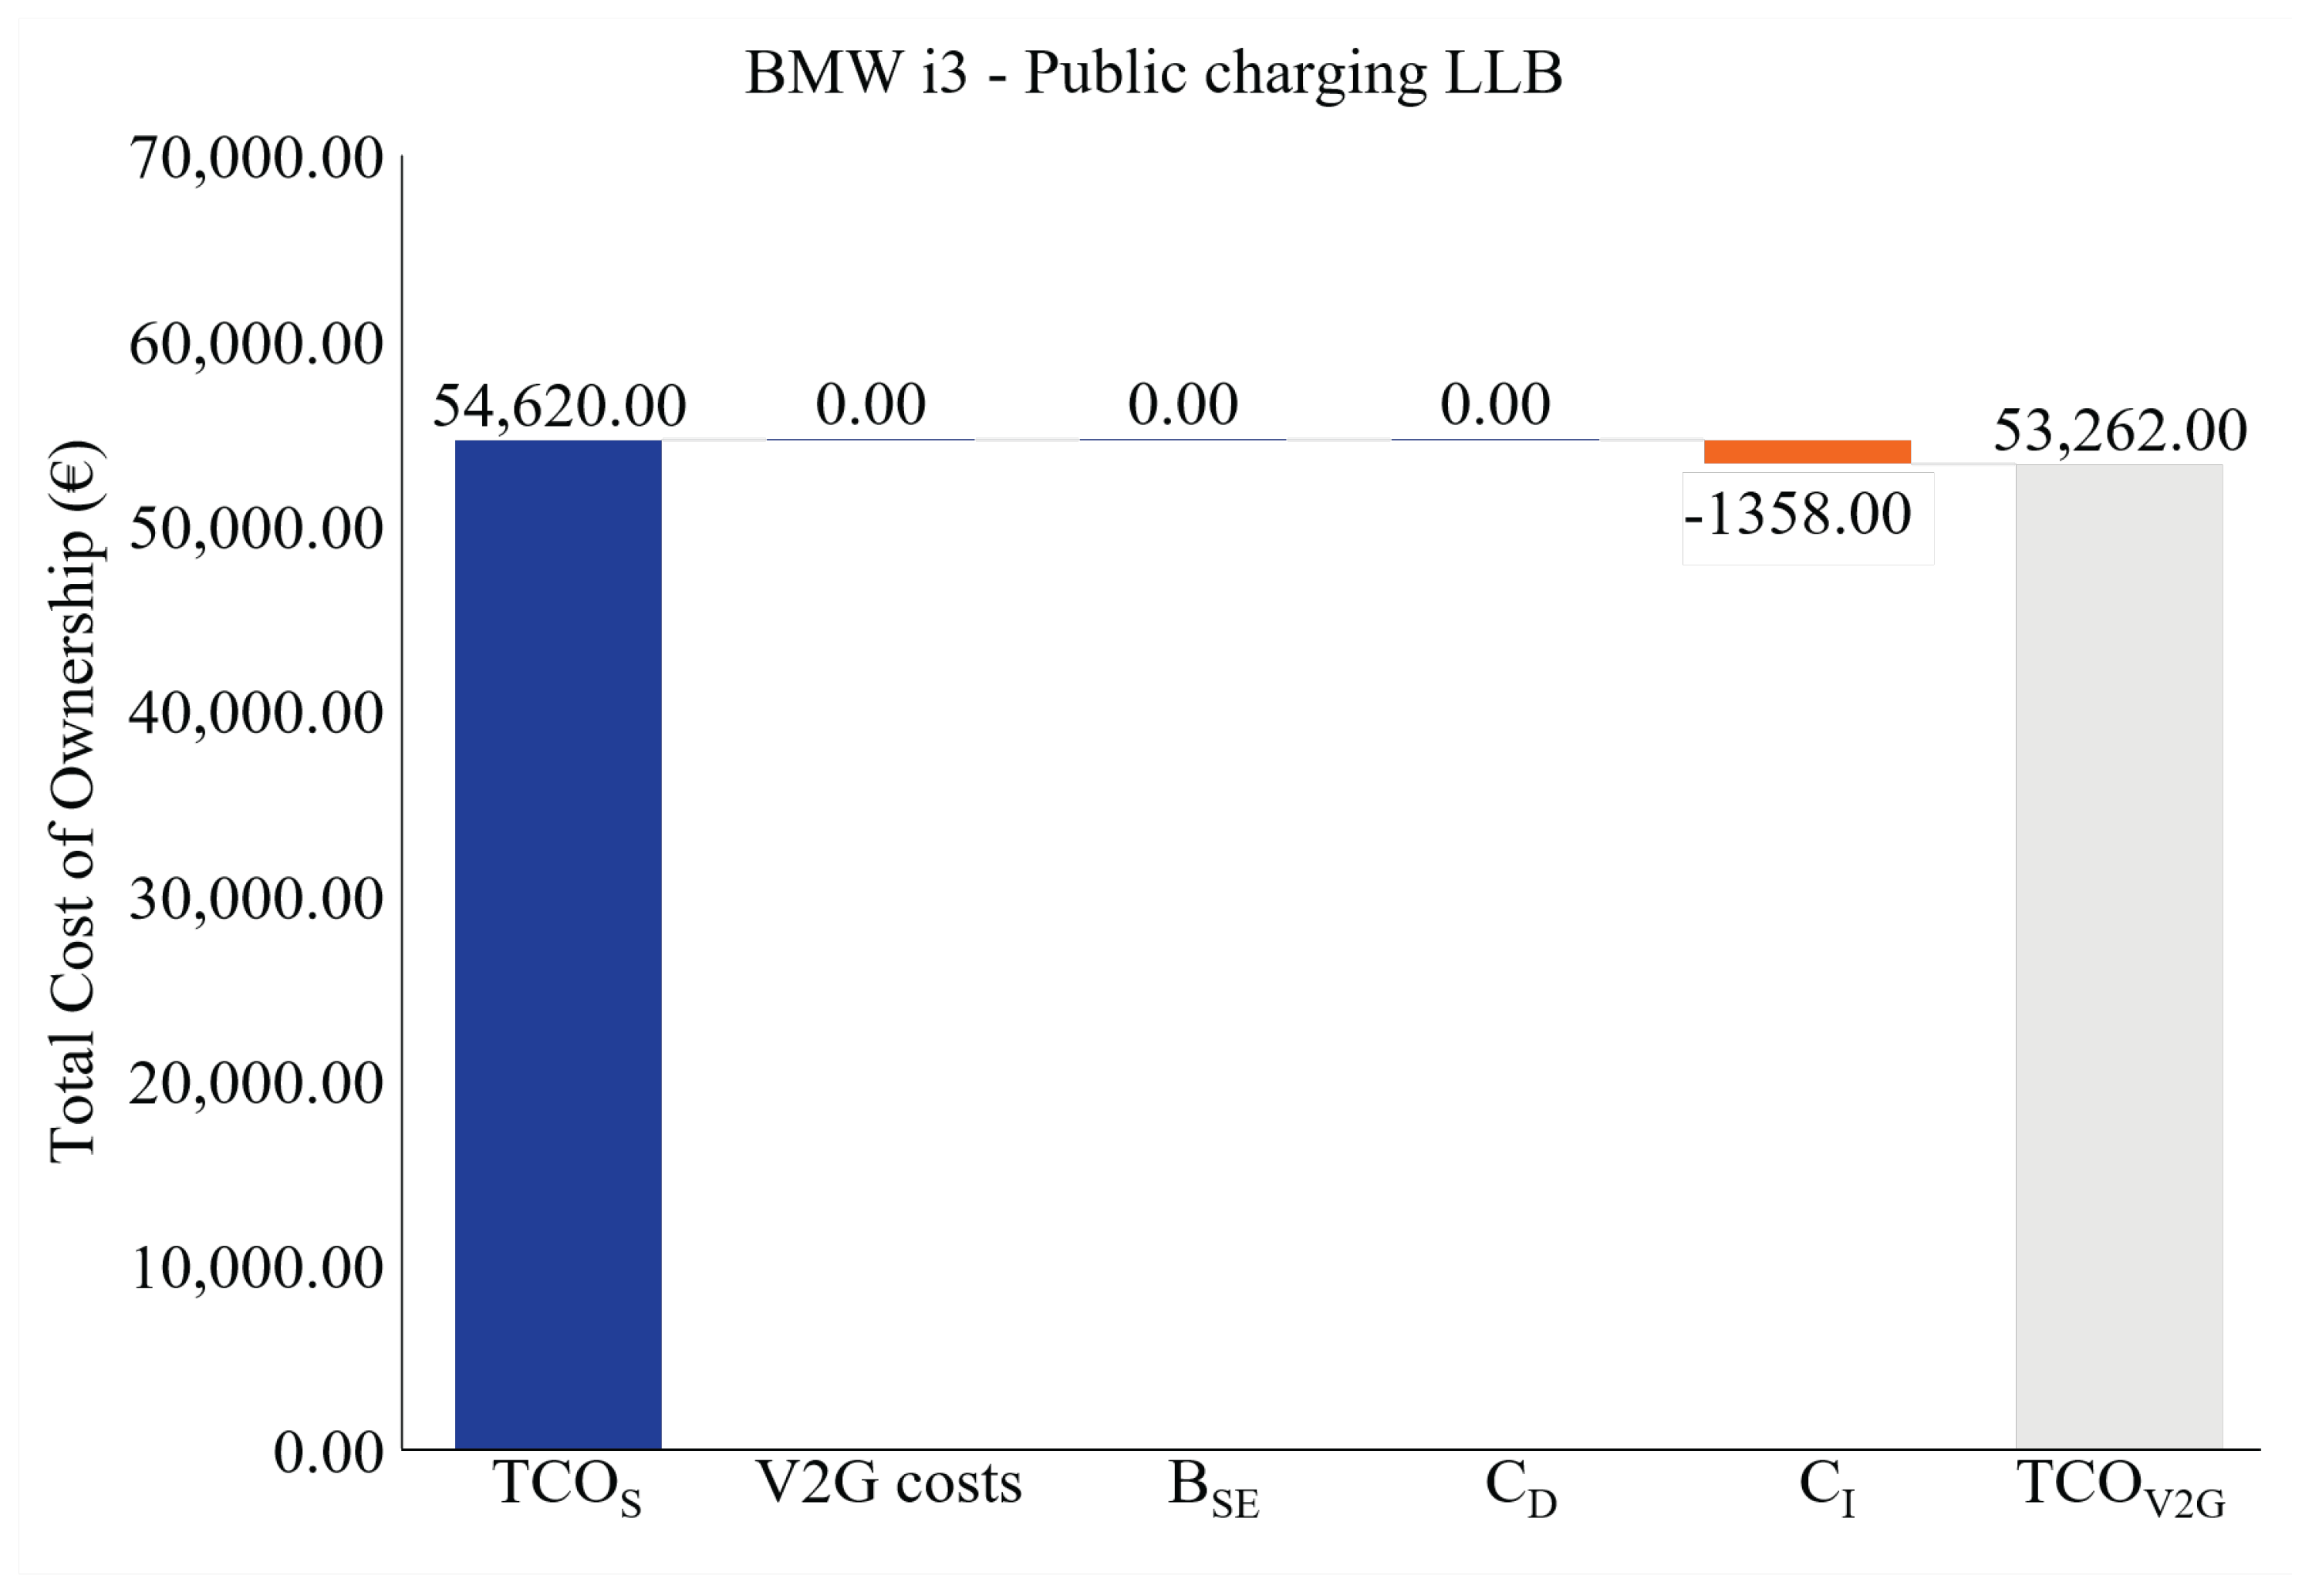
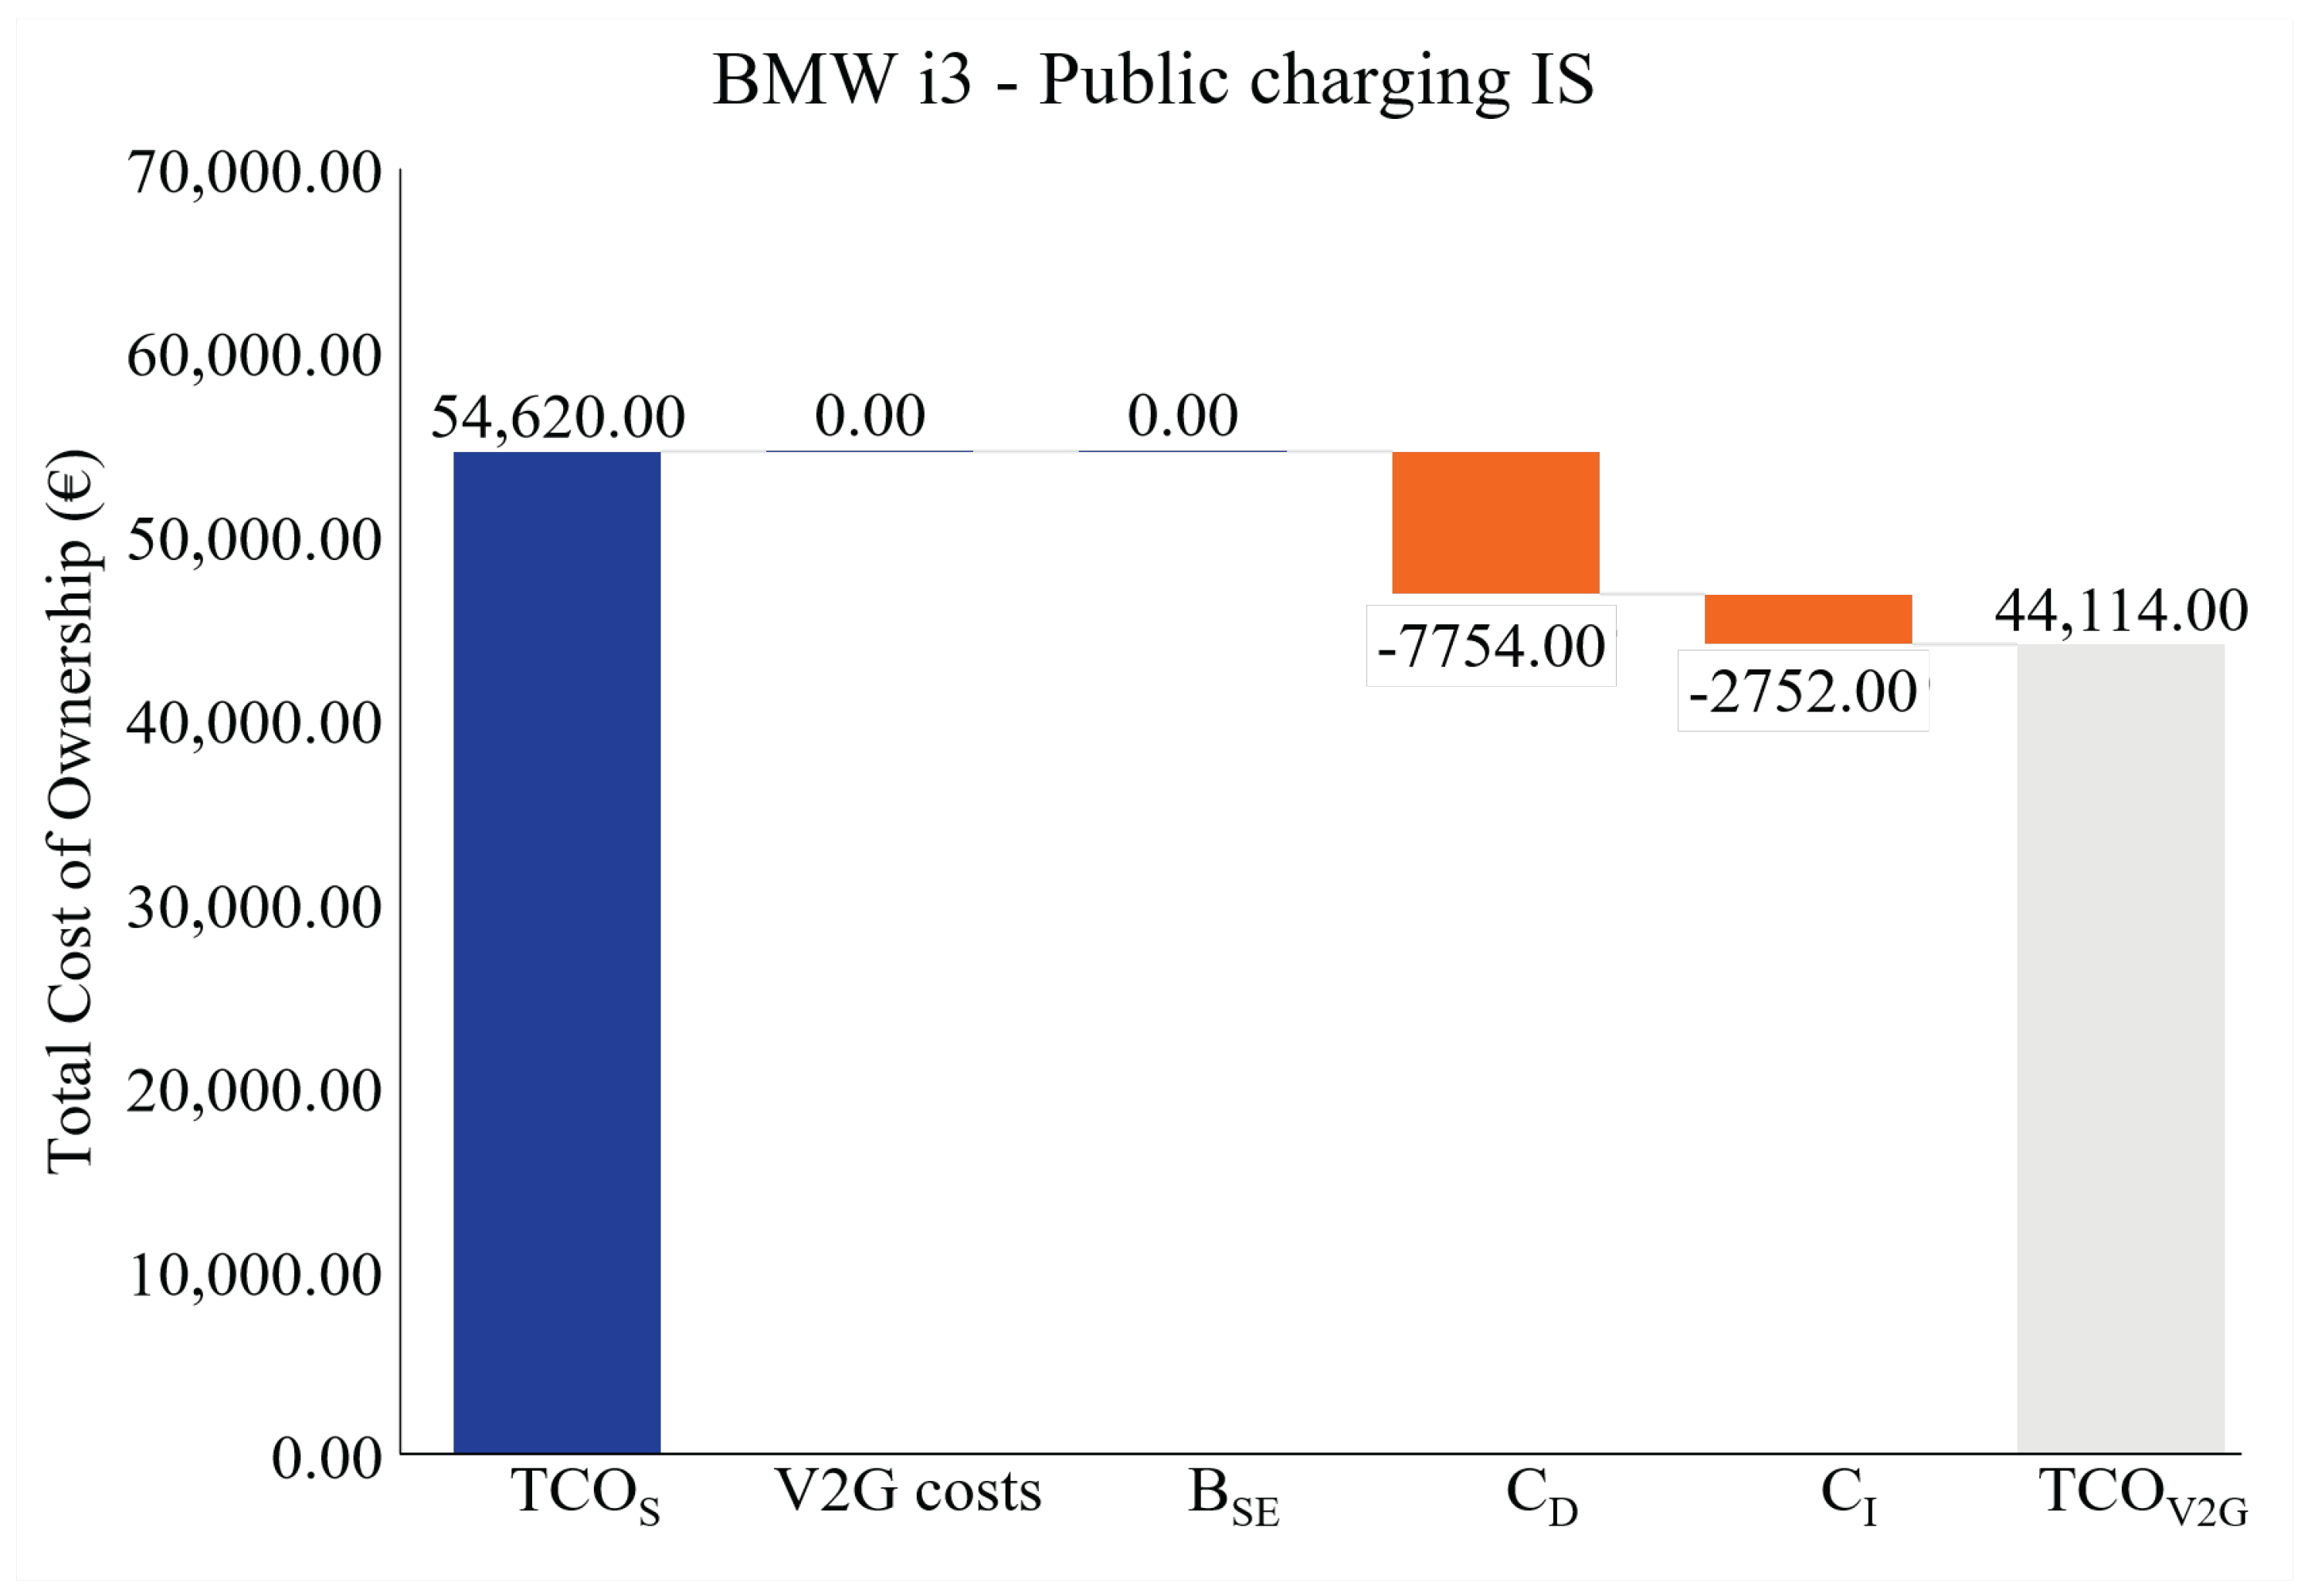
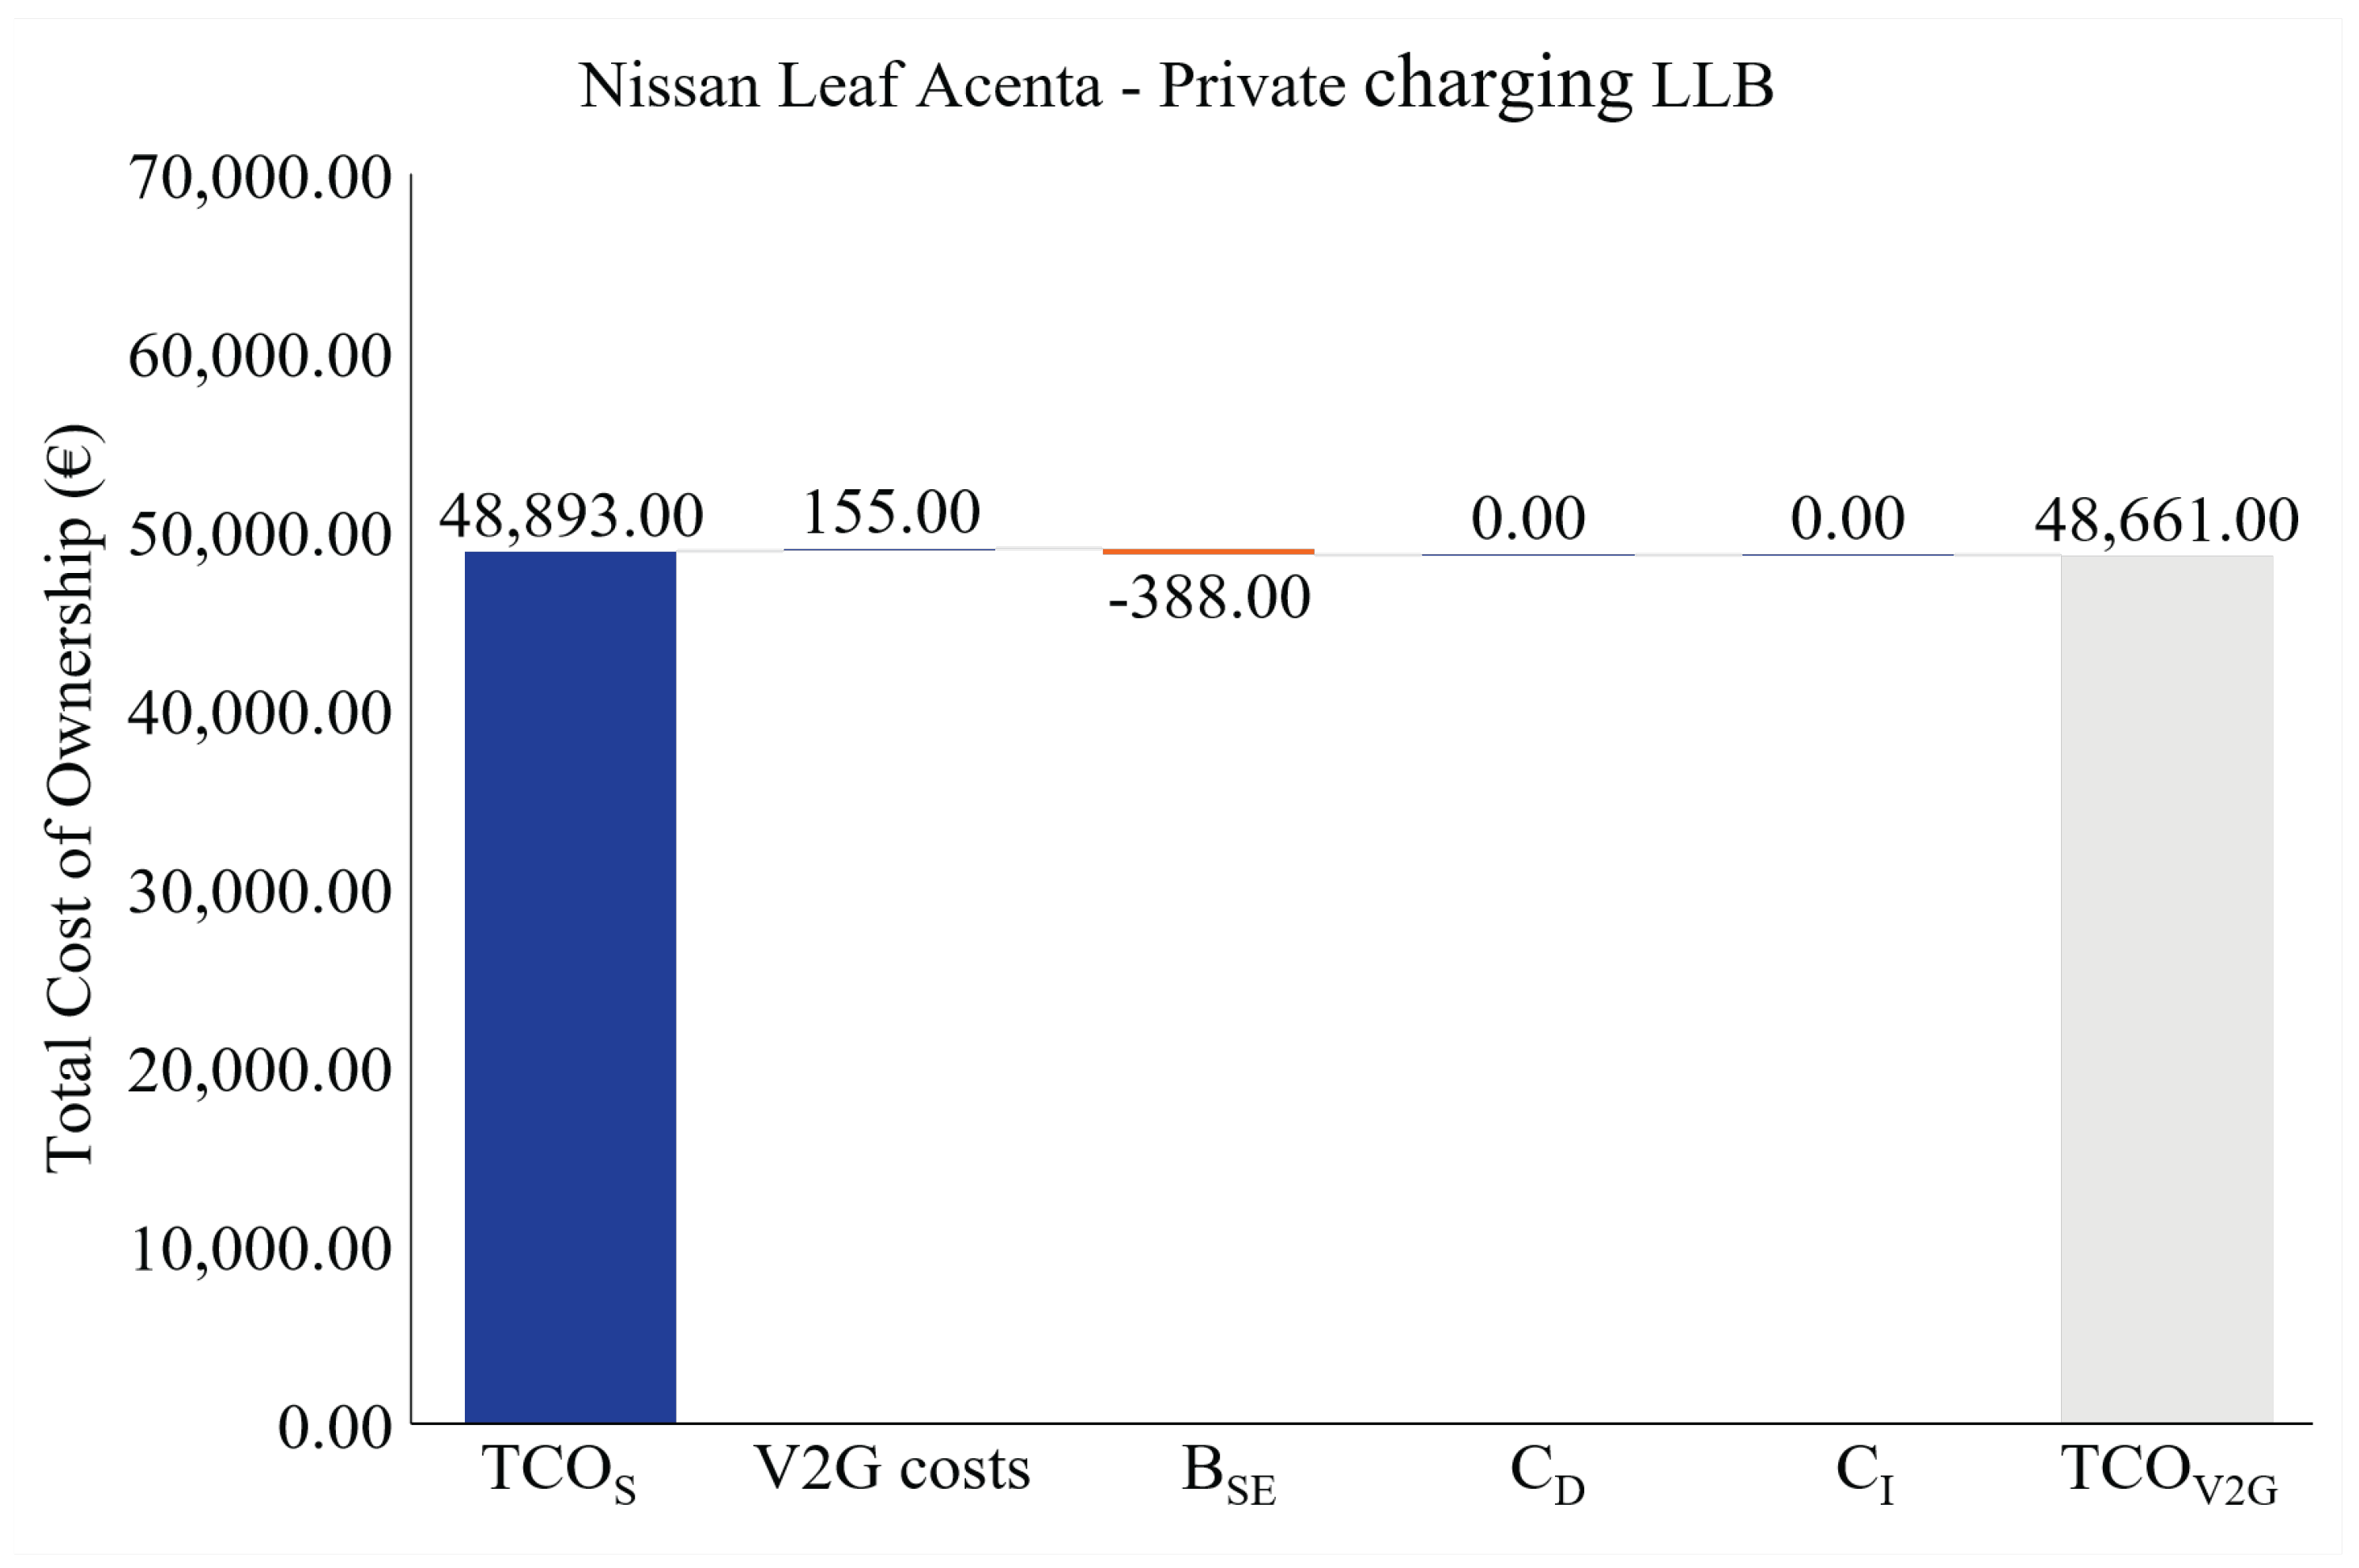
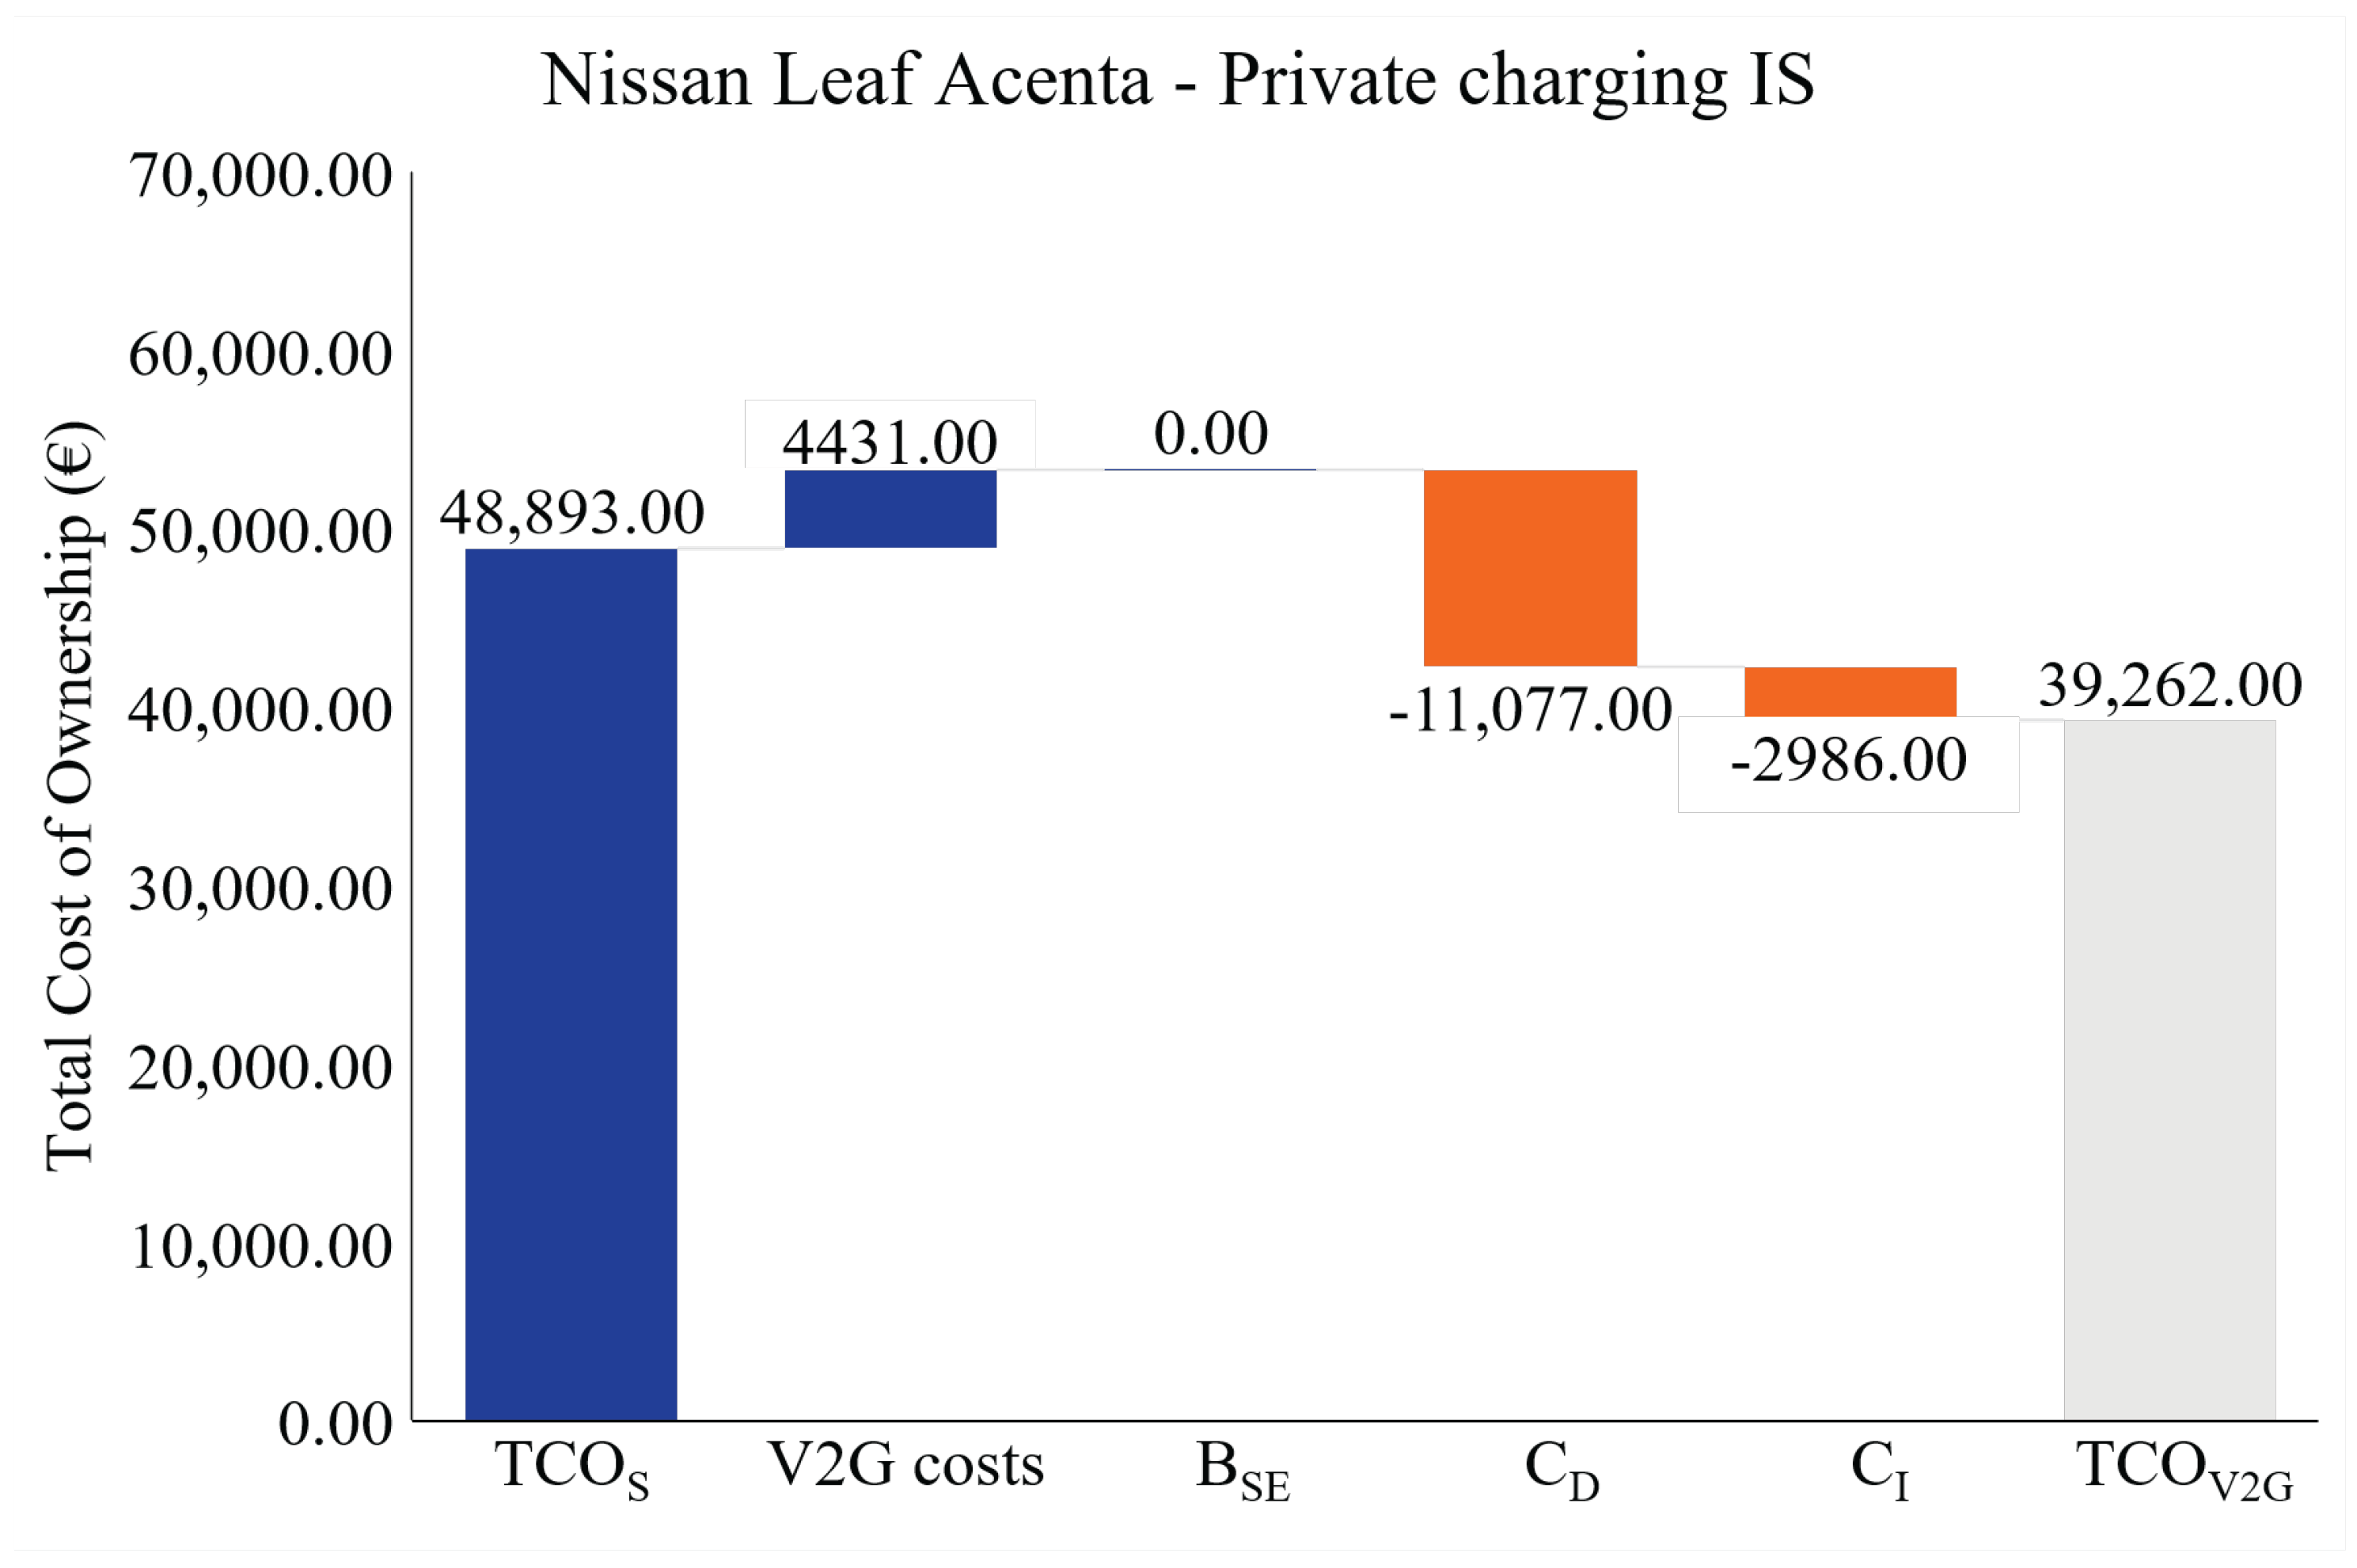
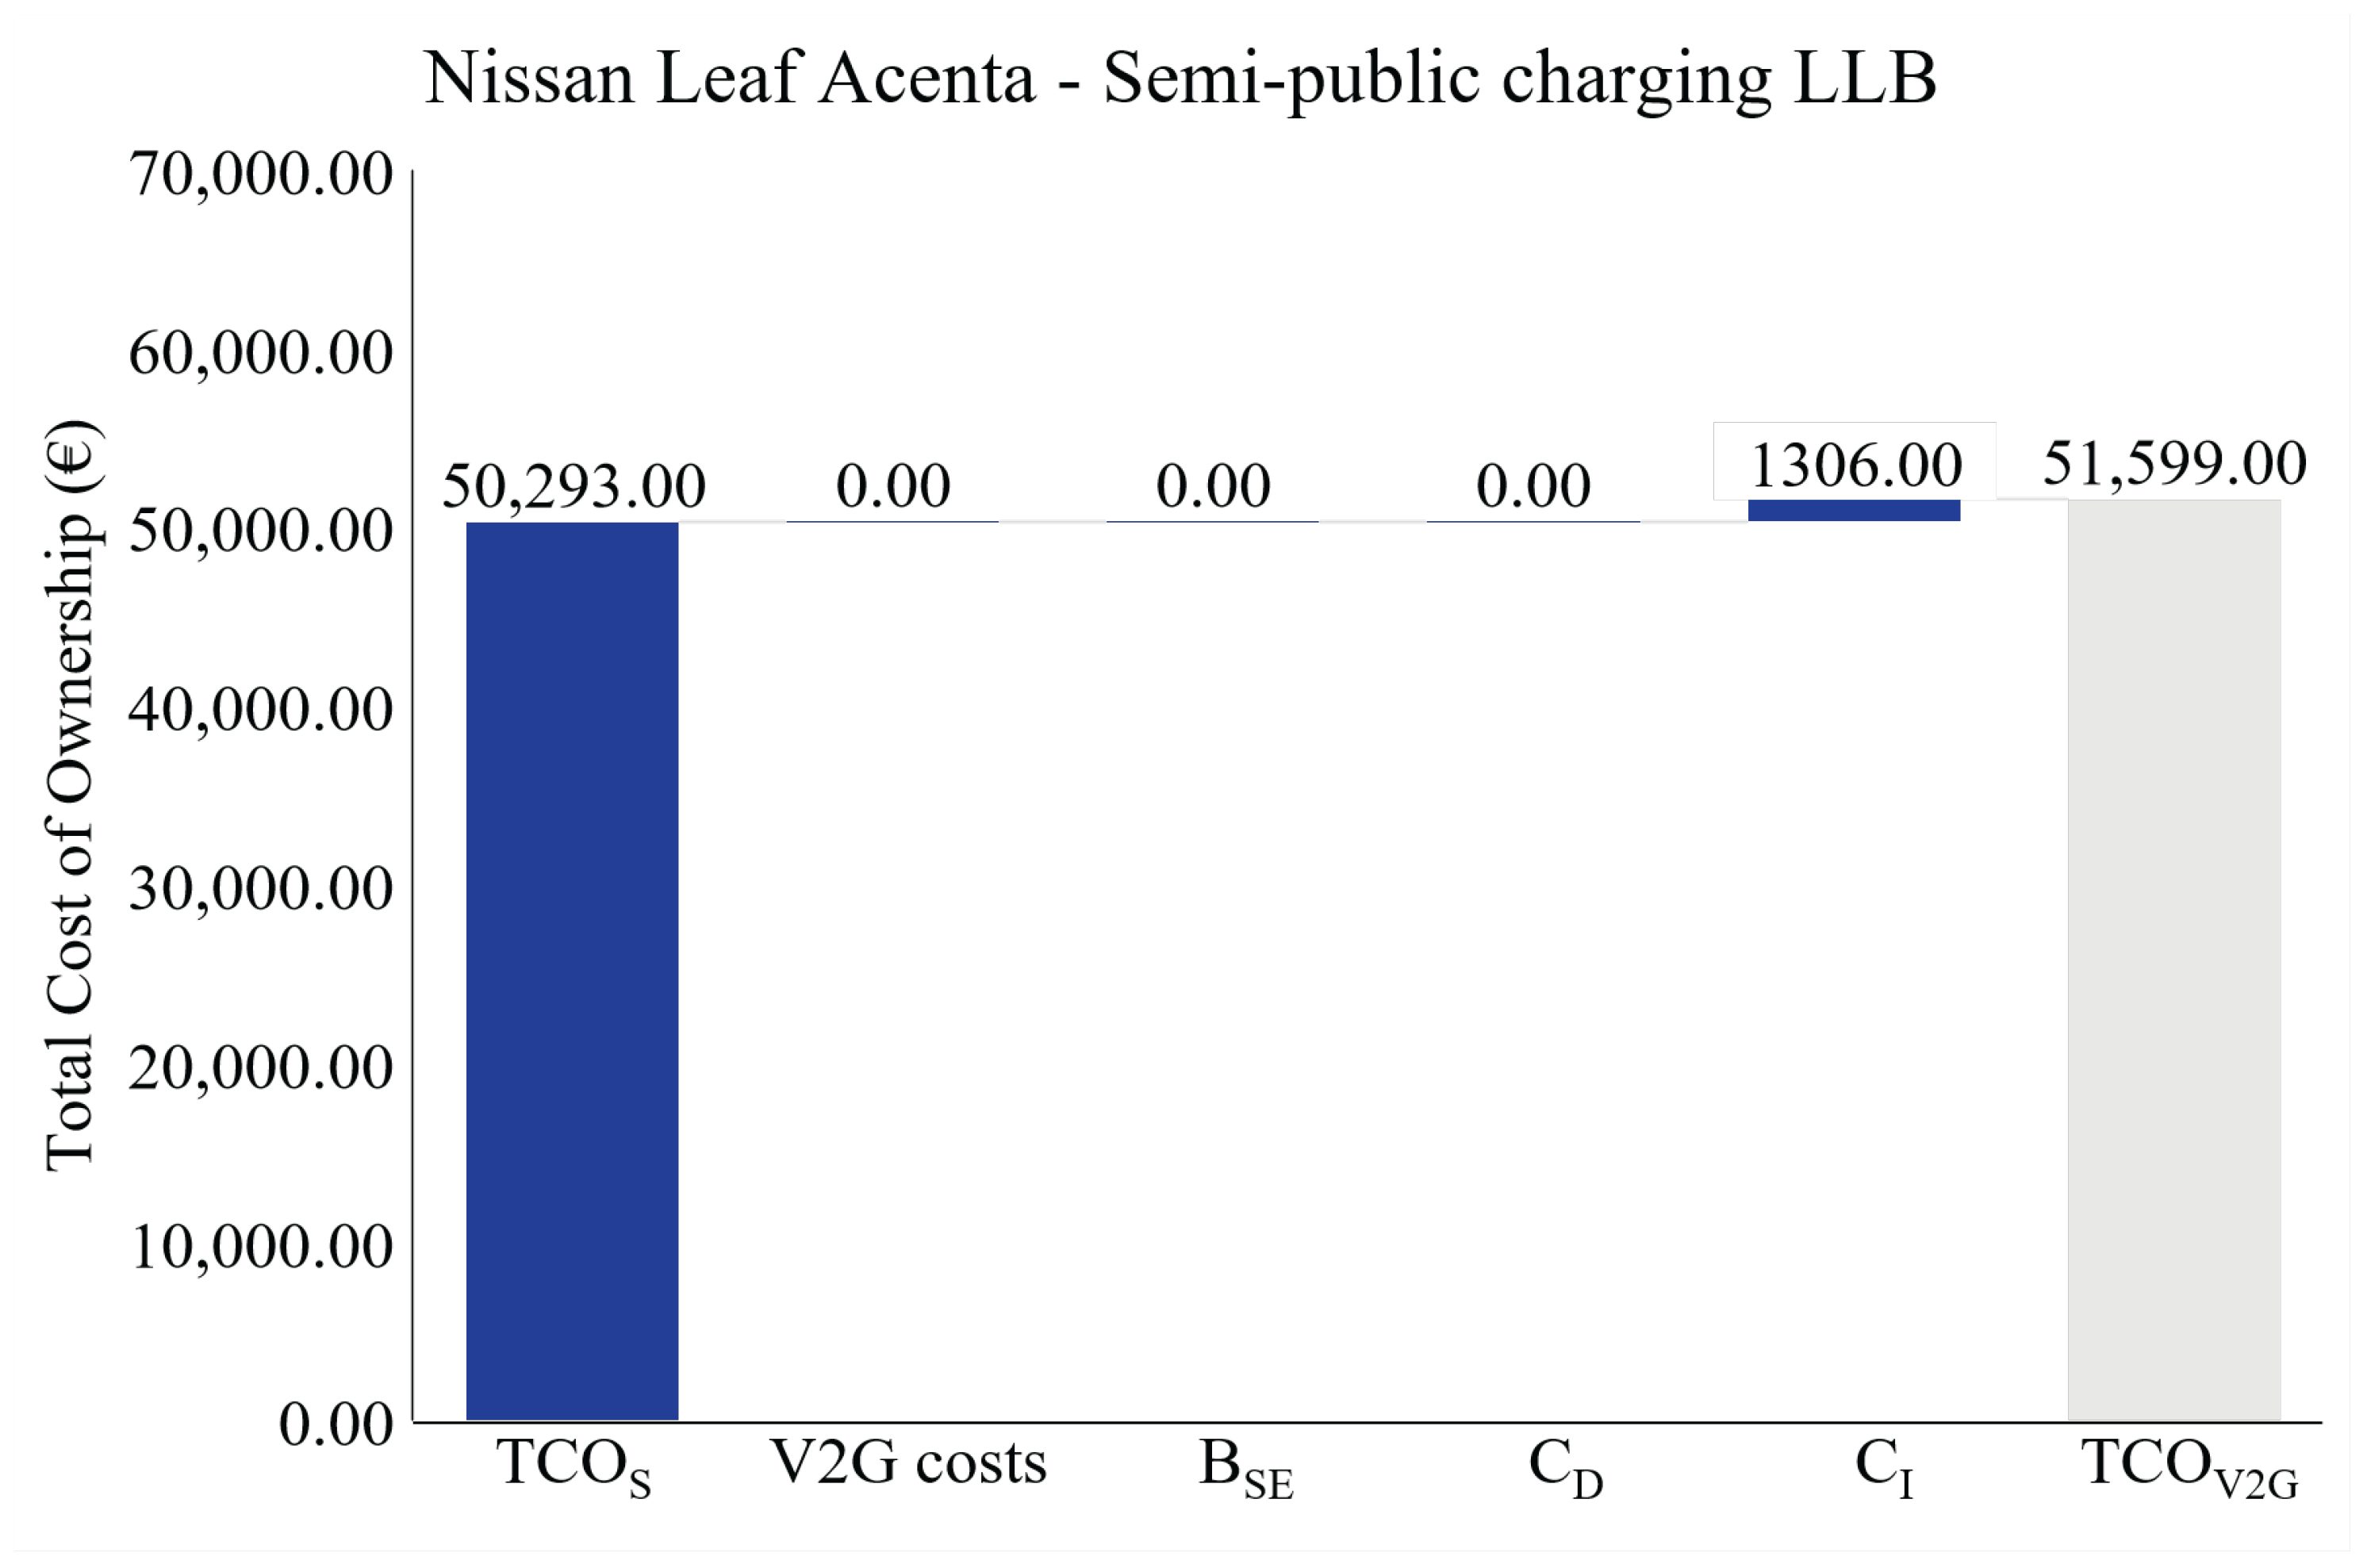
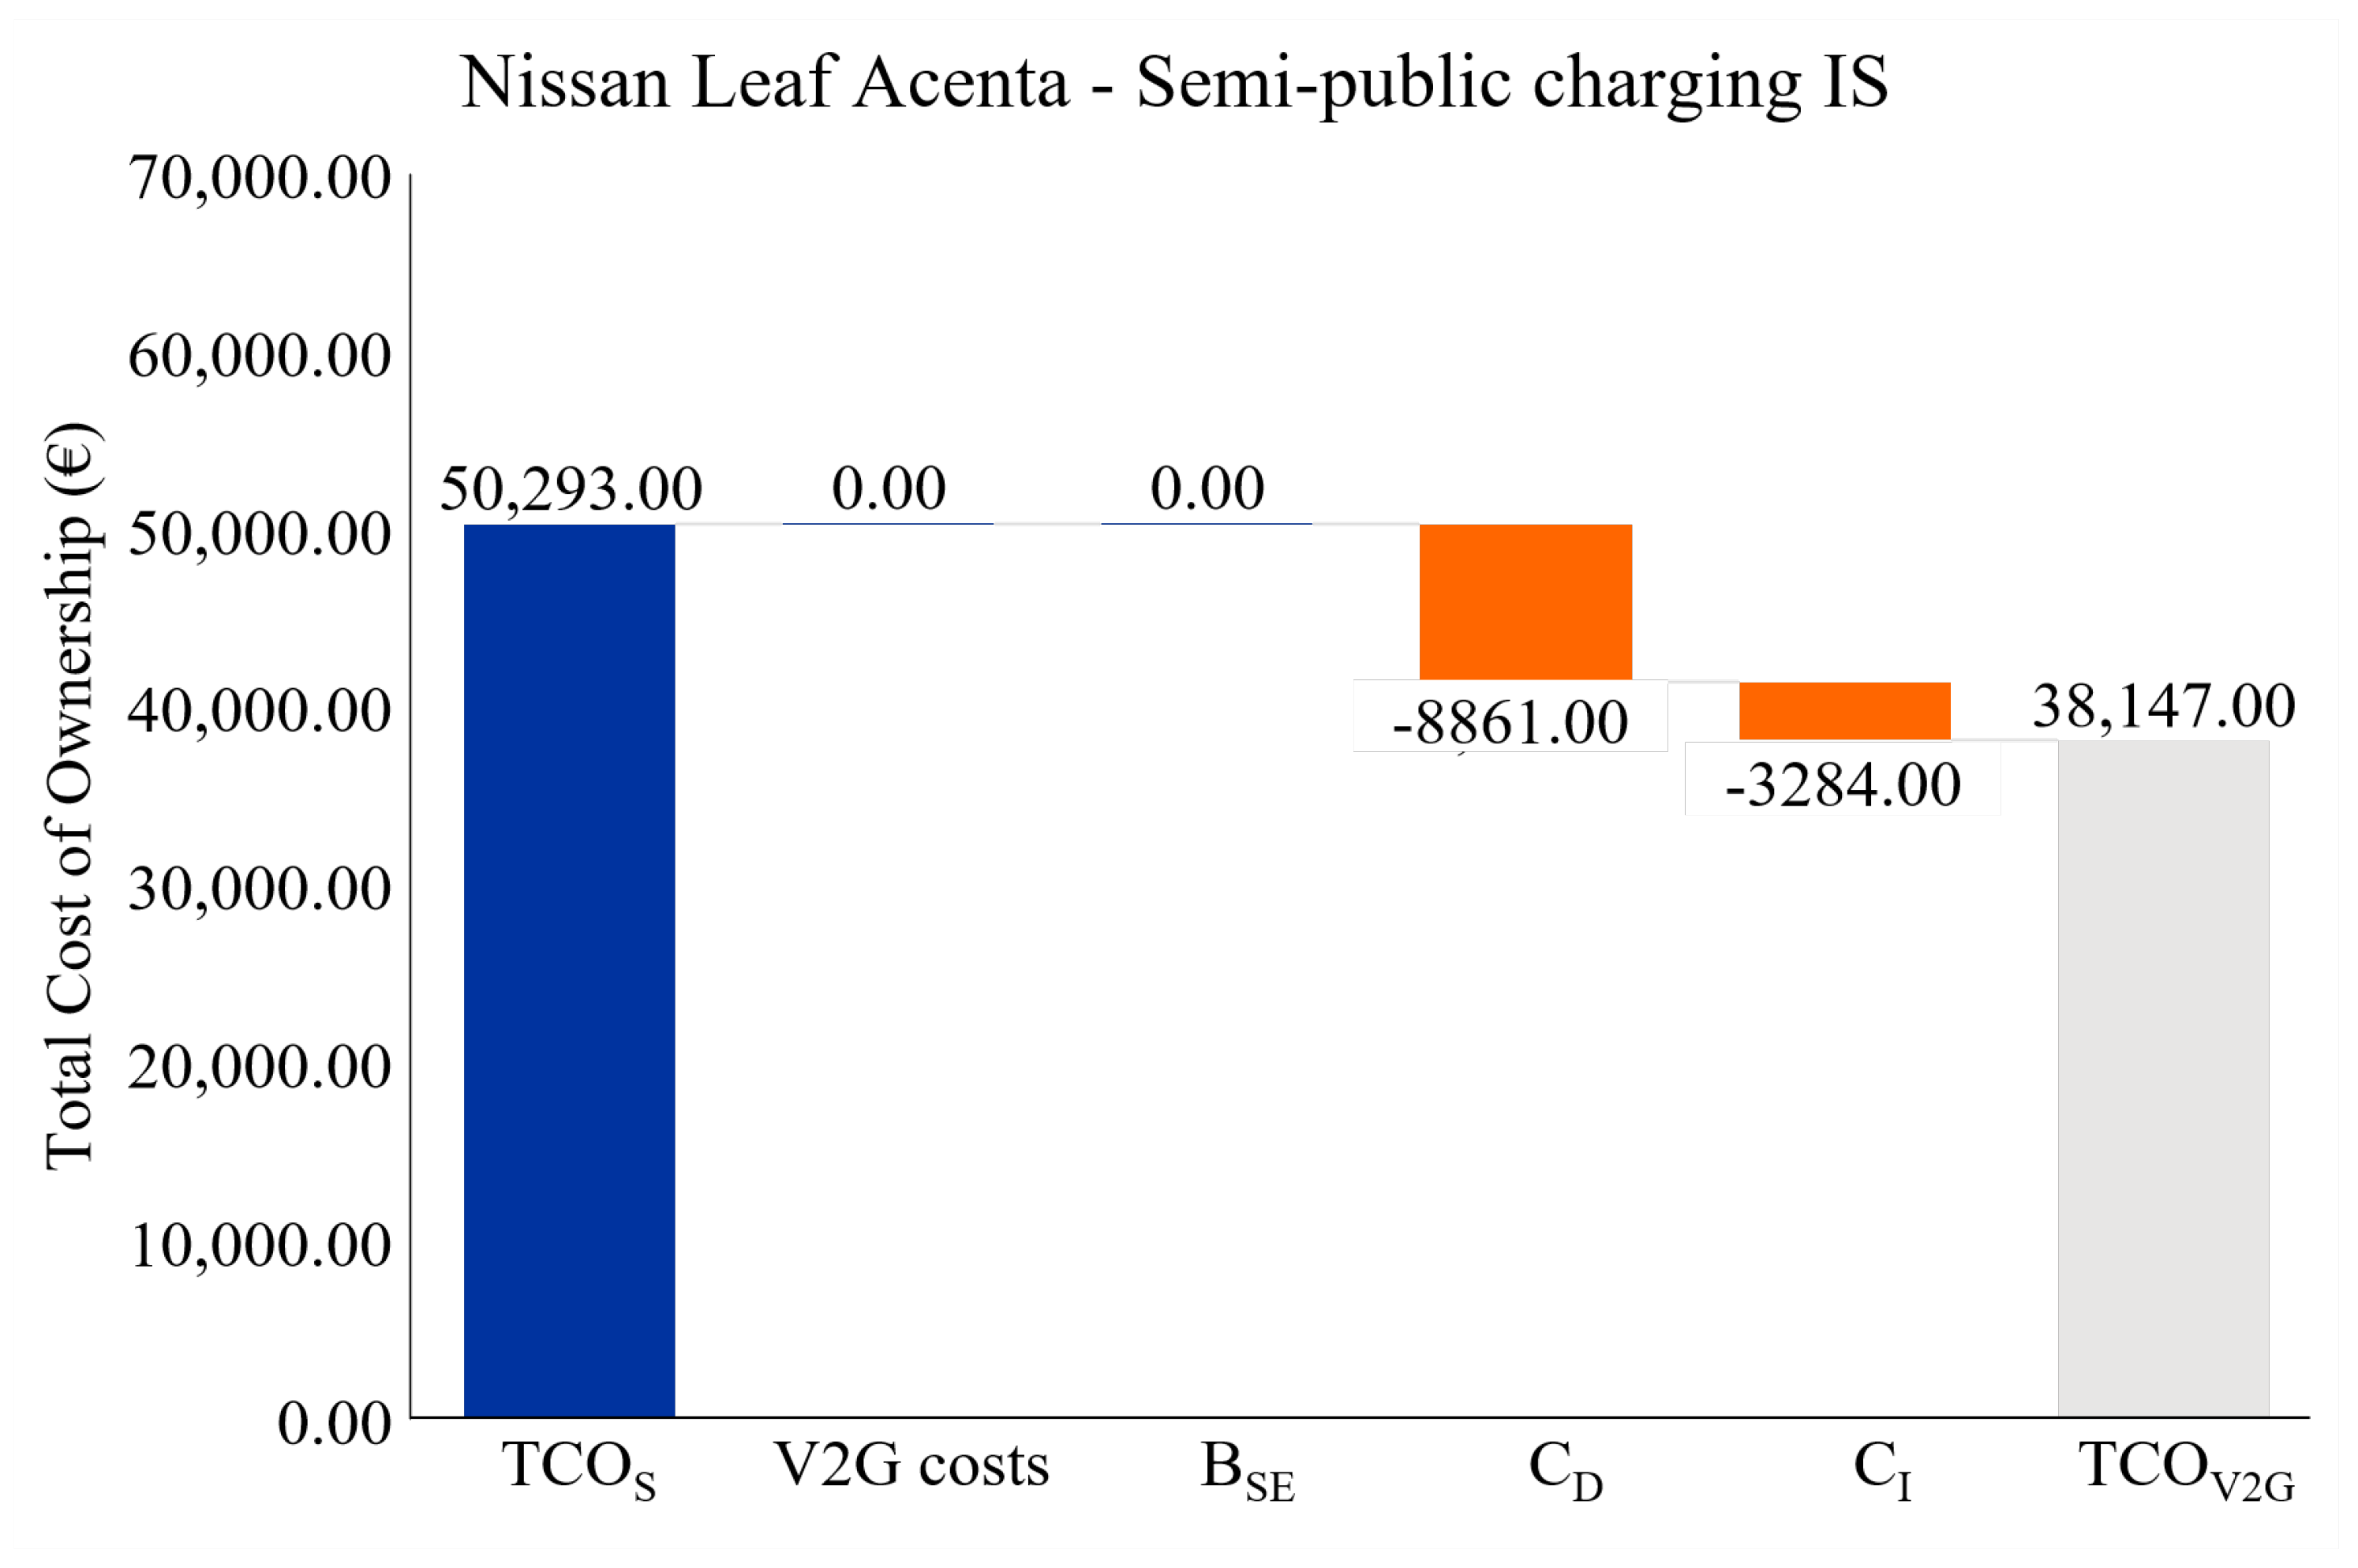
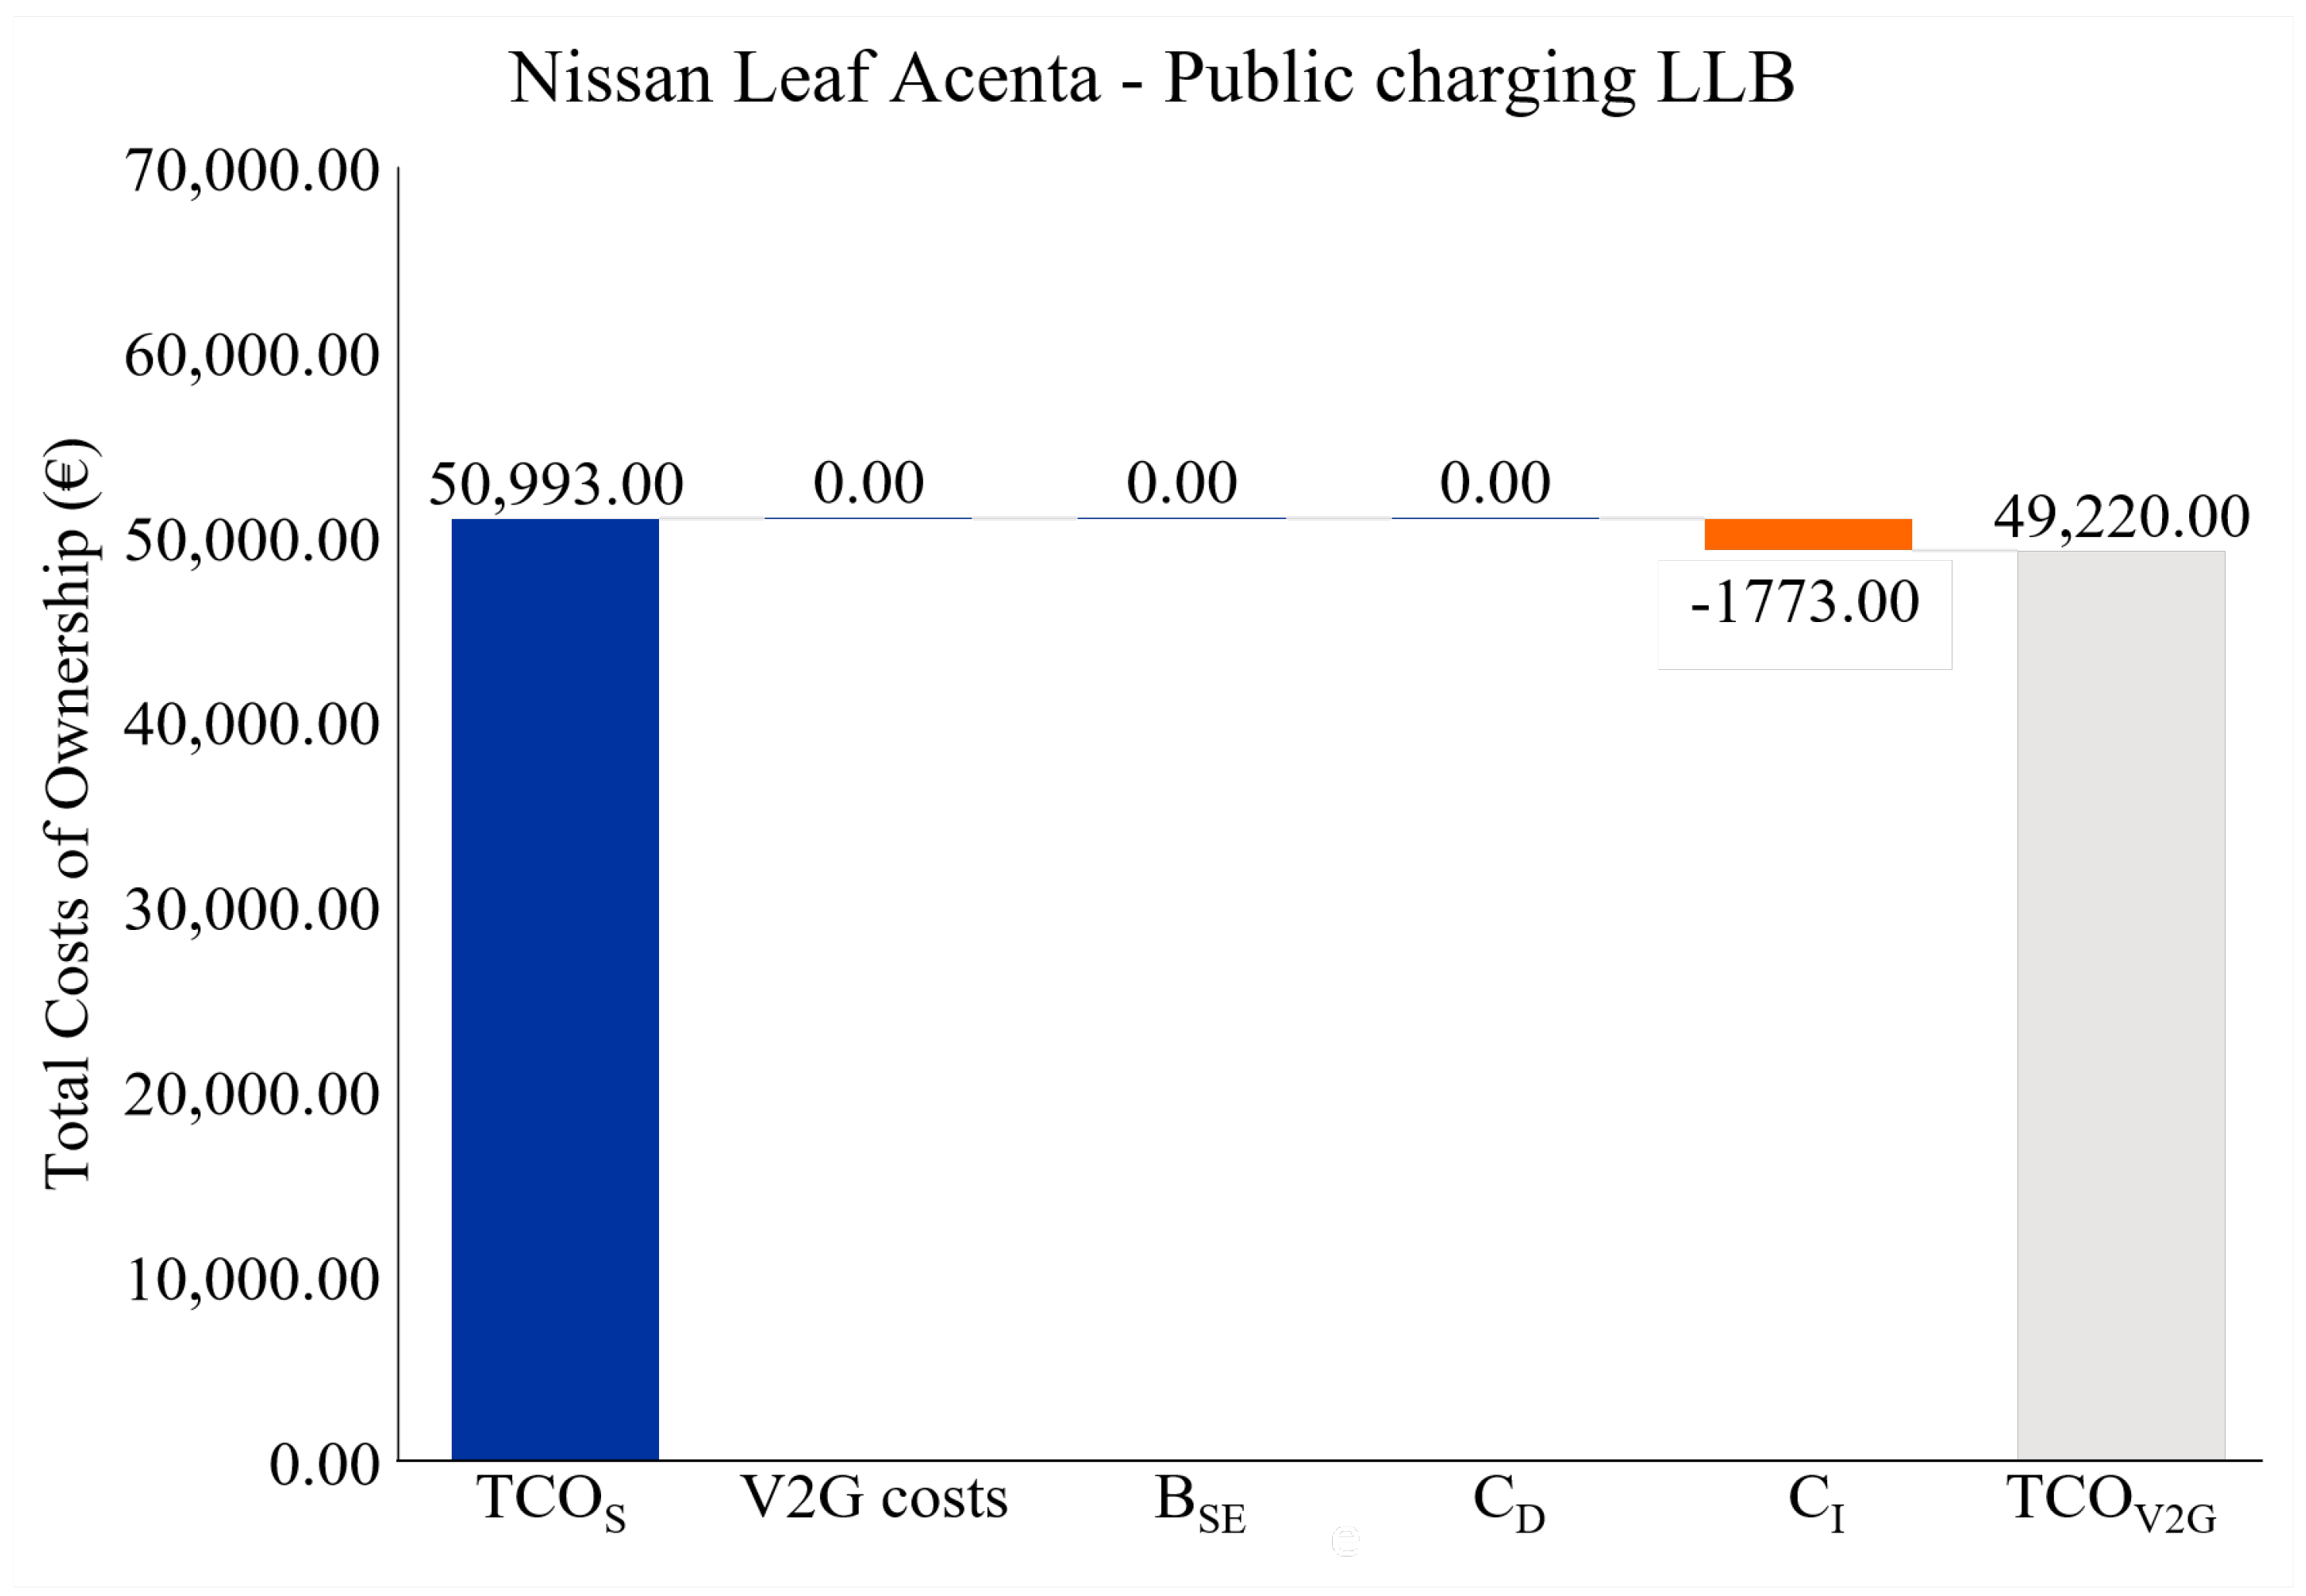
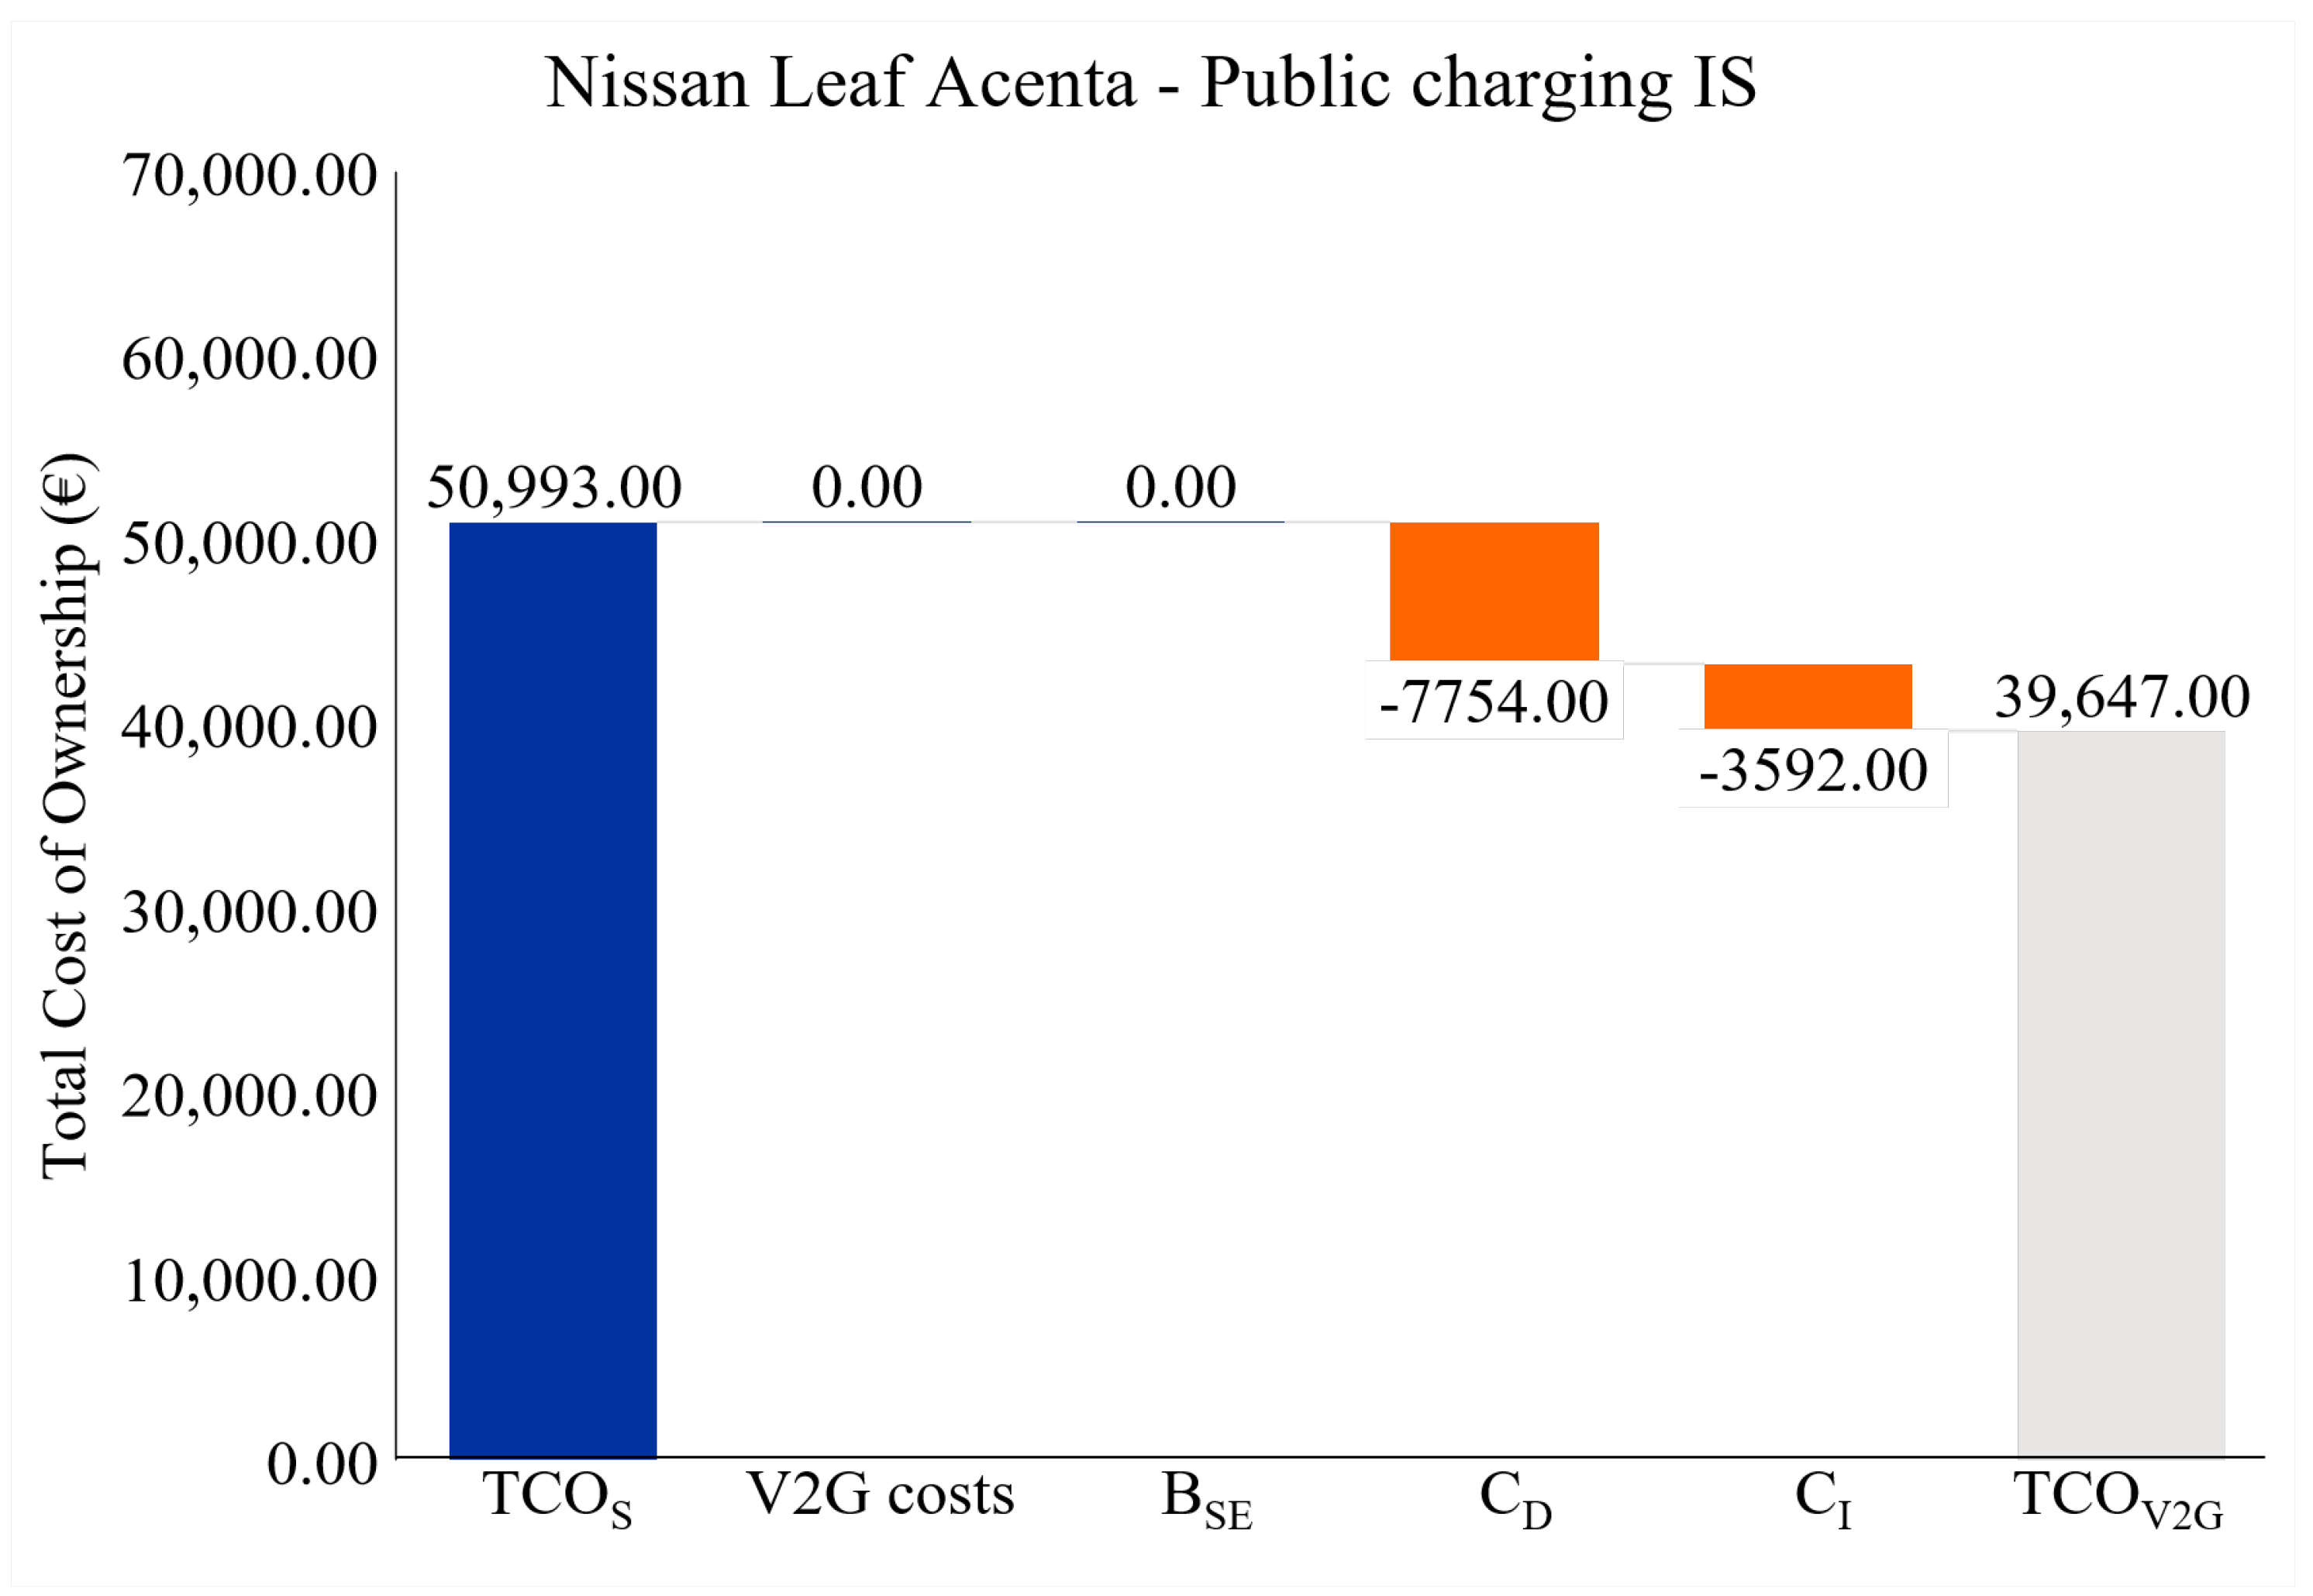
4.2. V2G TCO Results
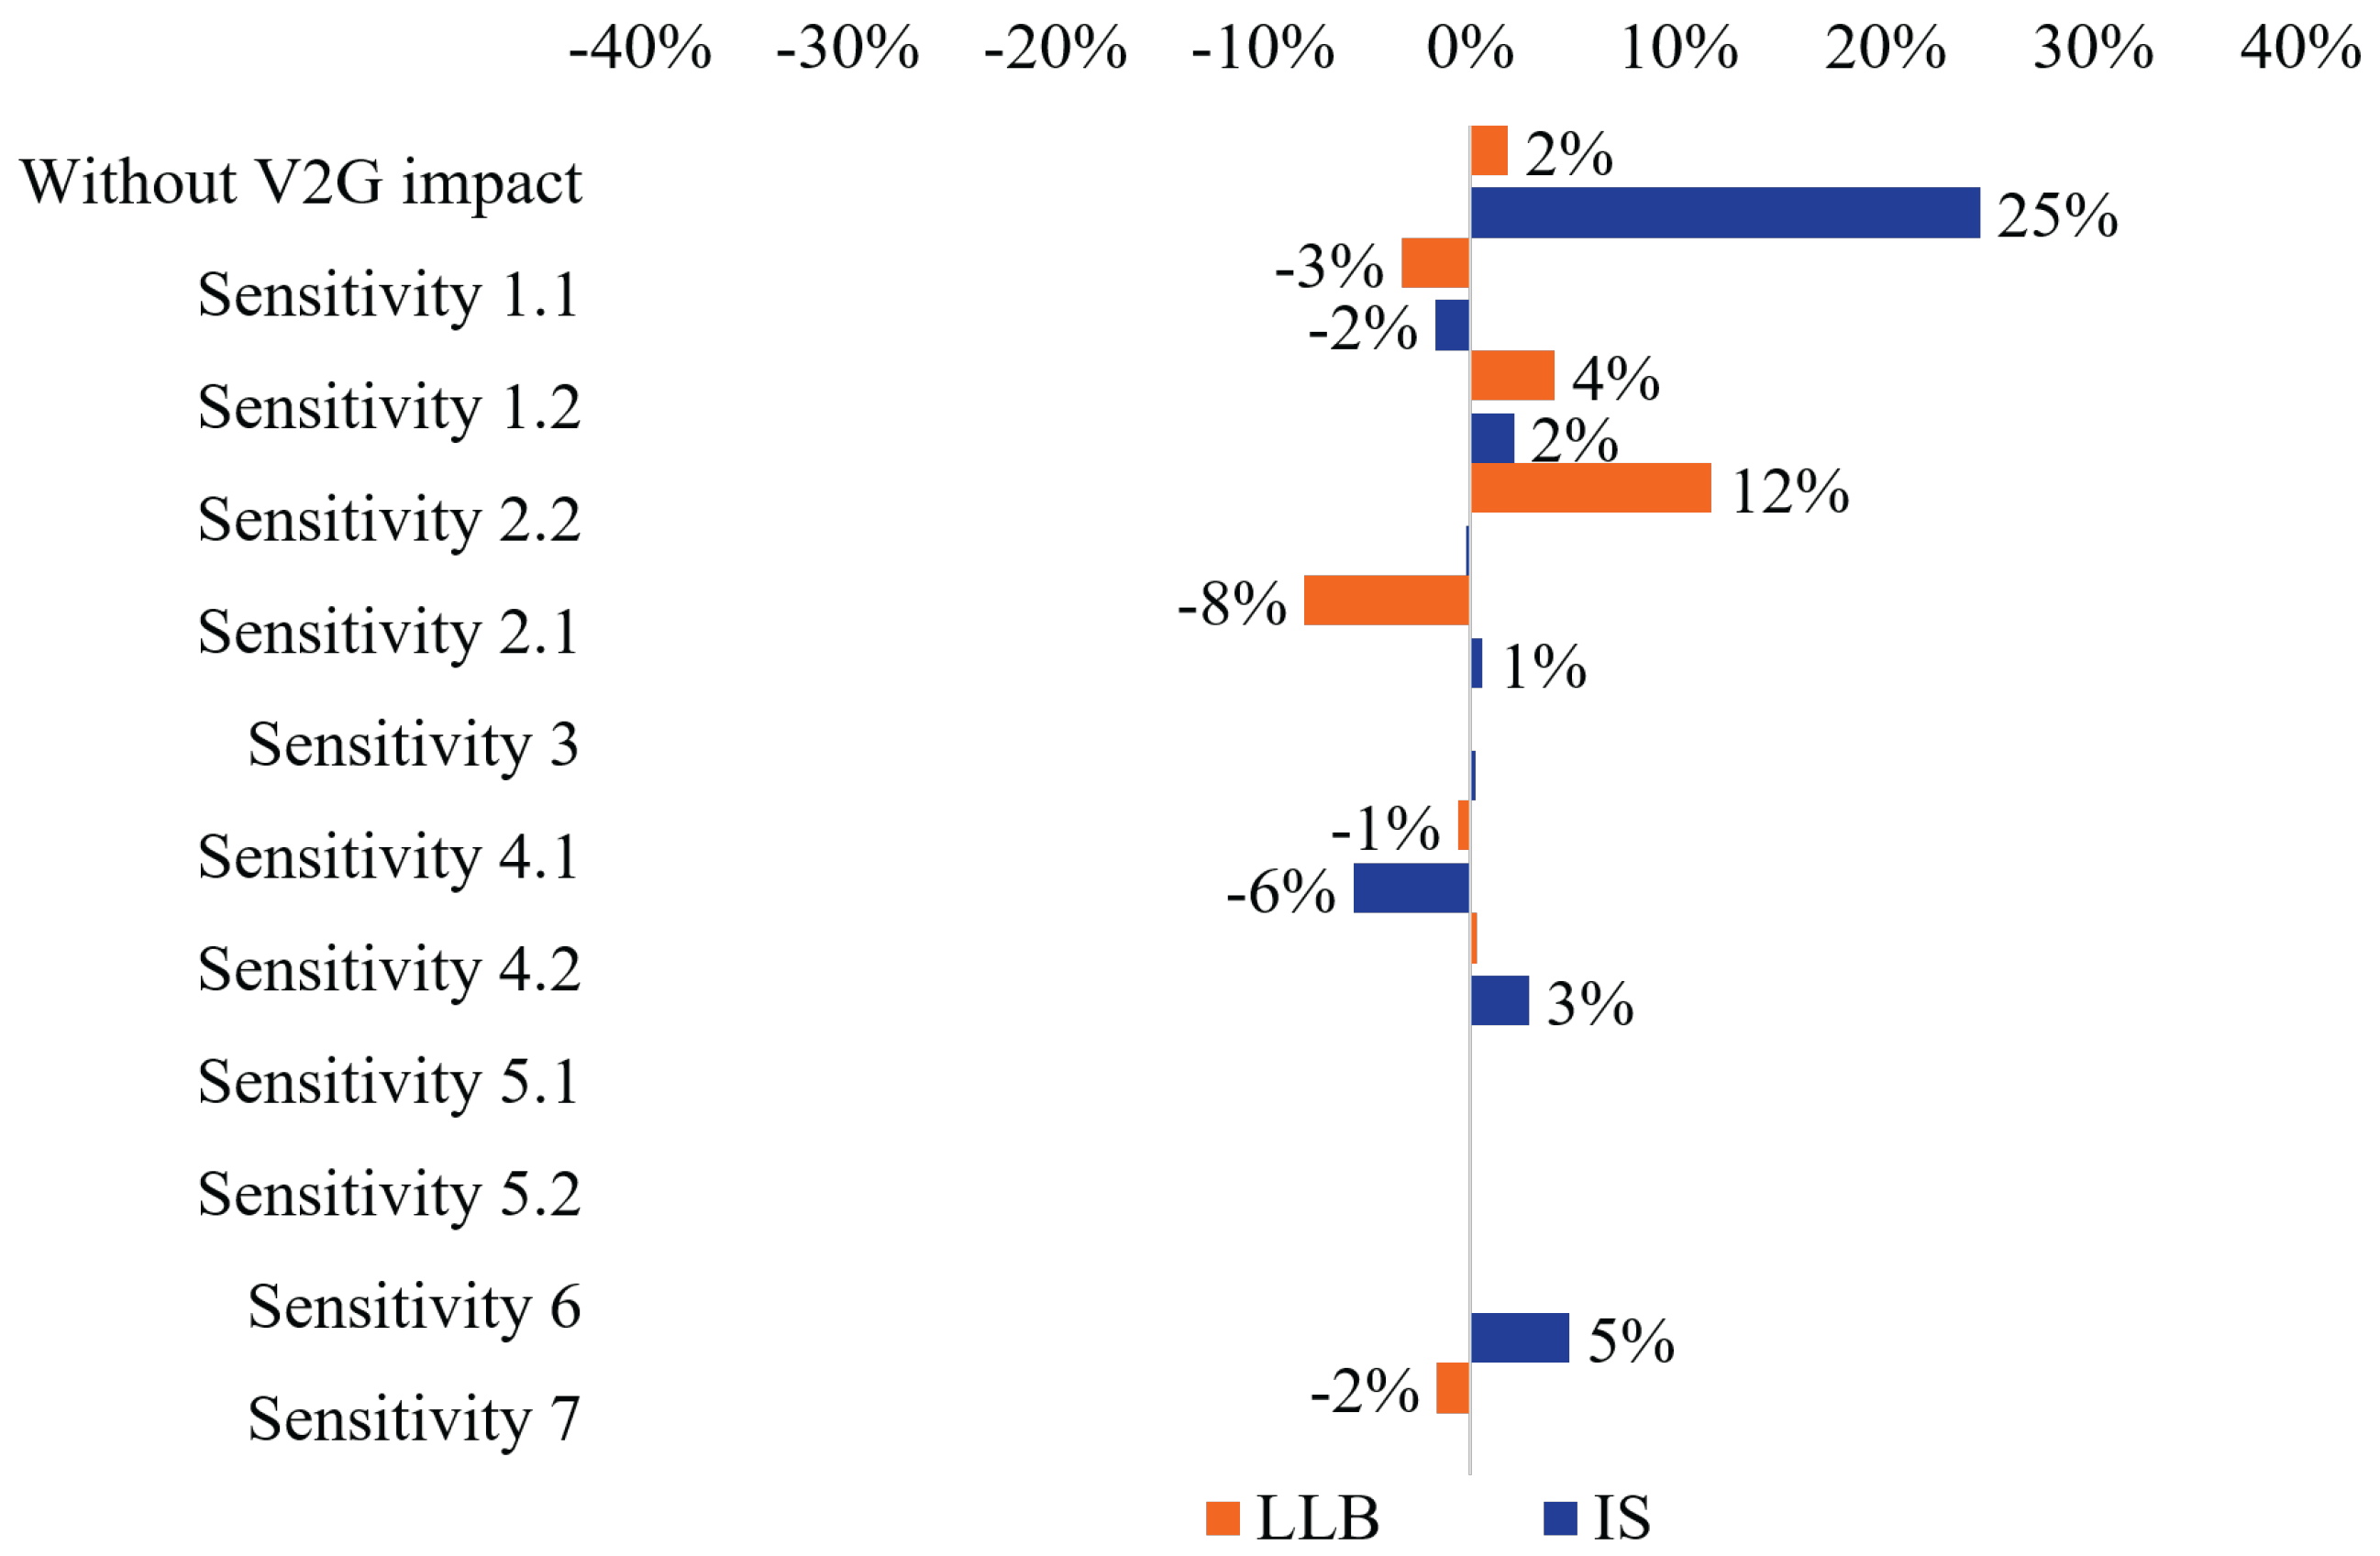
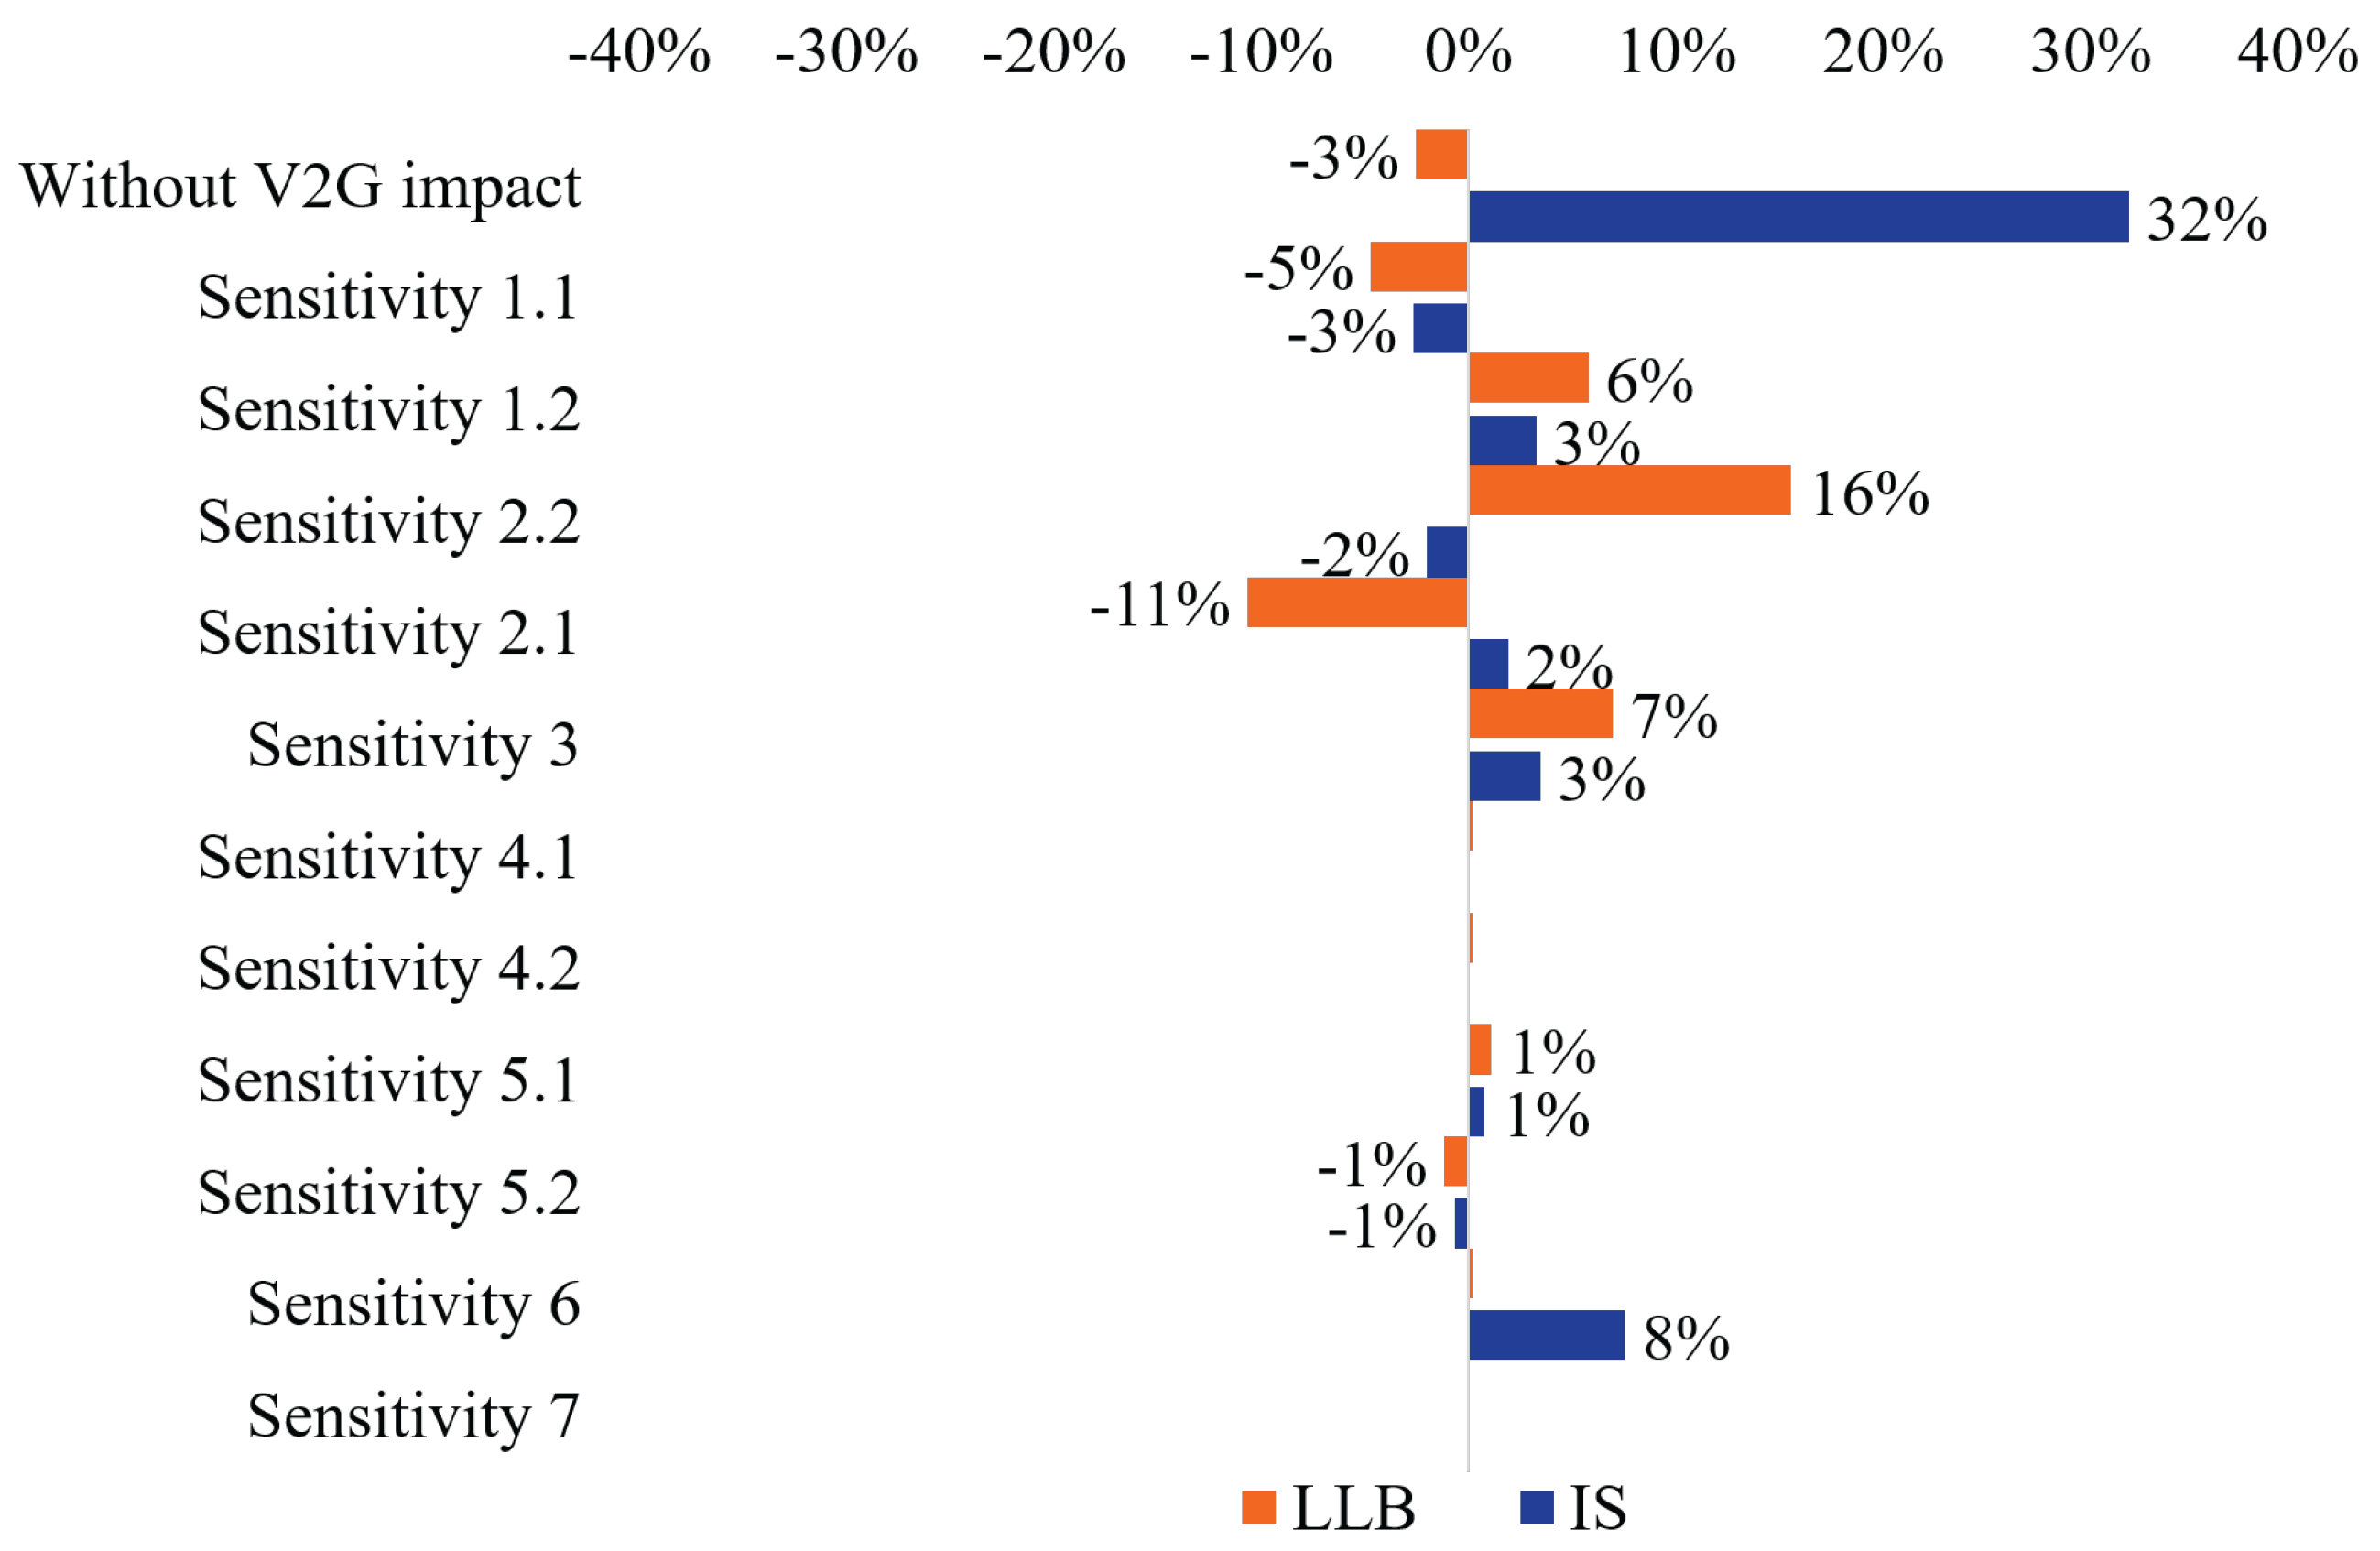
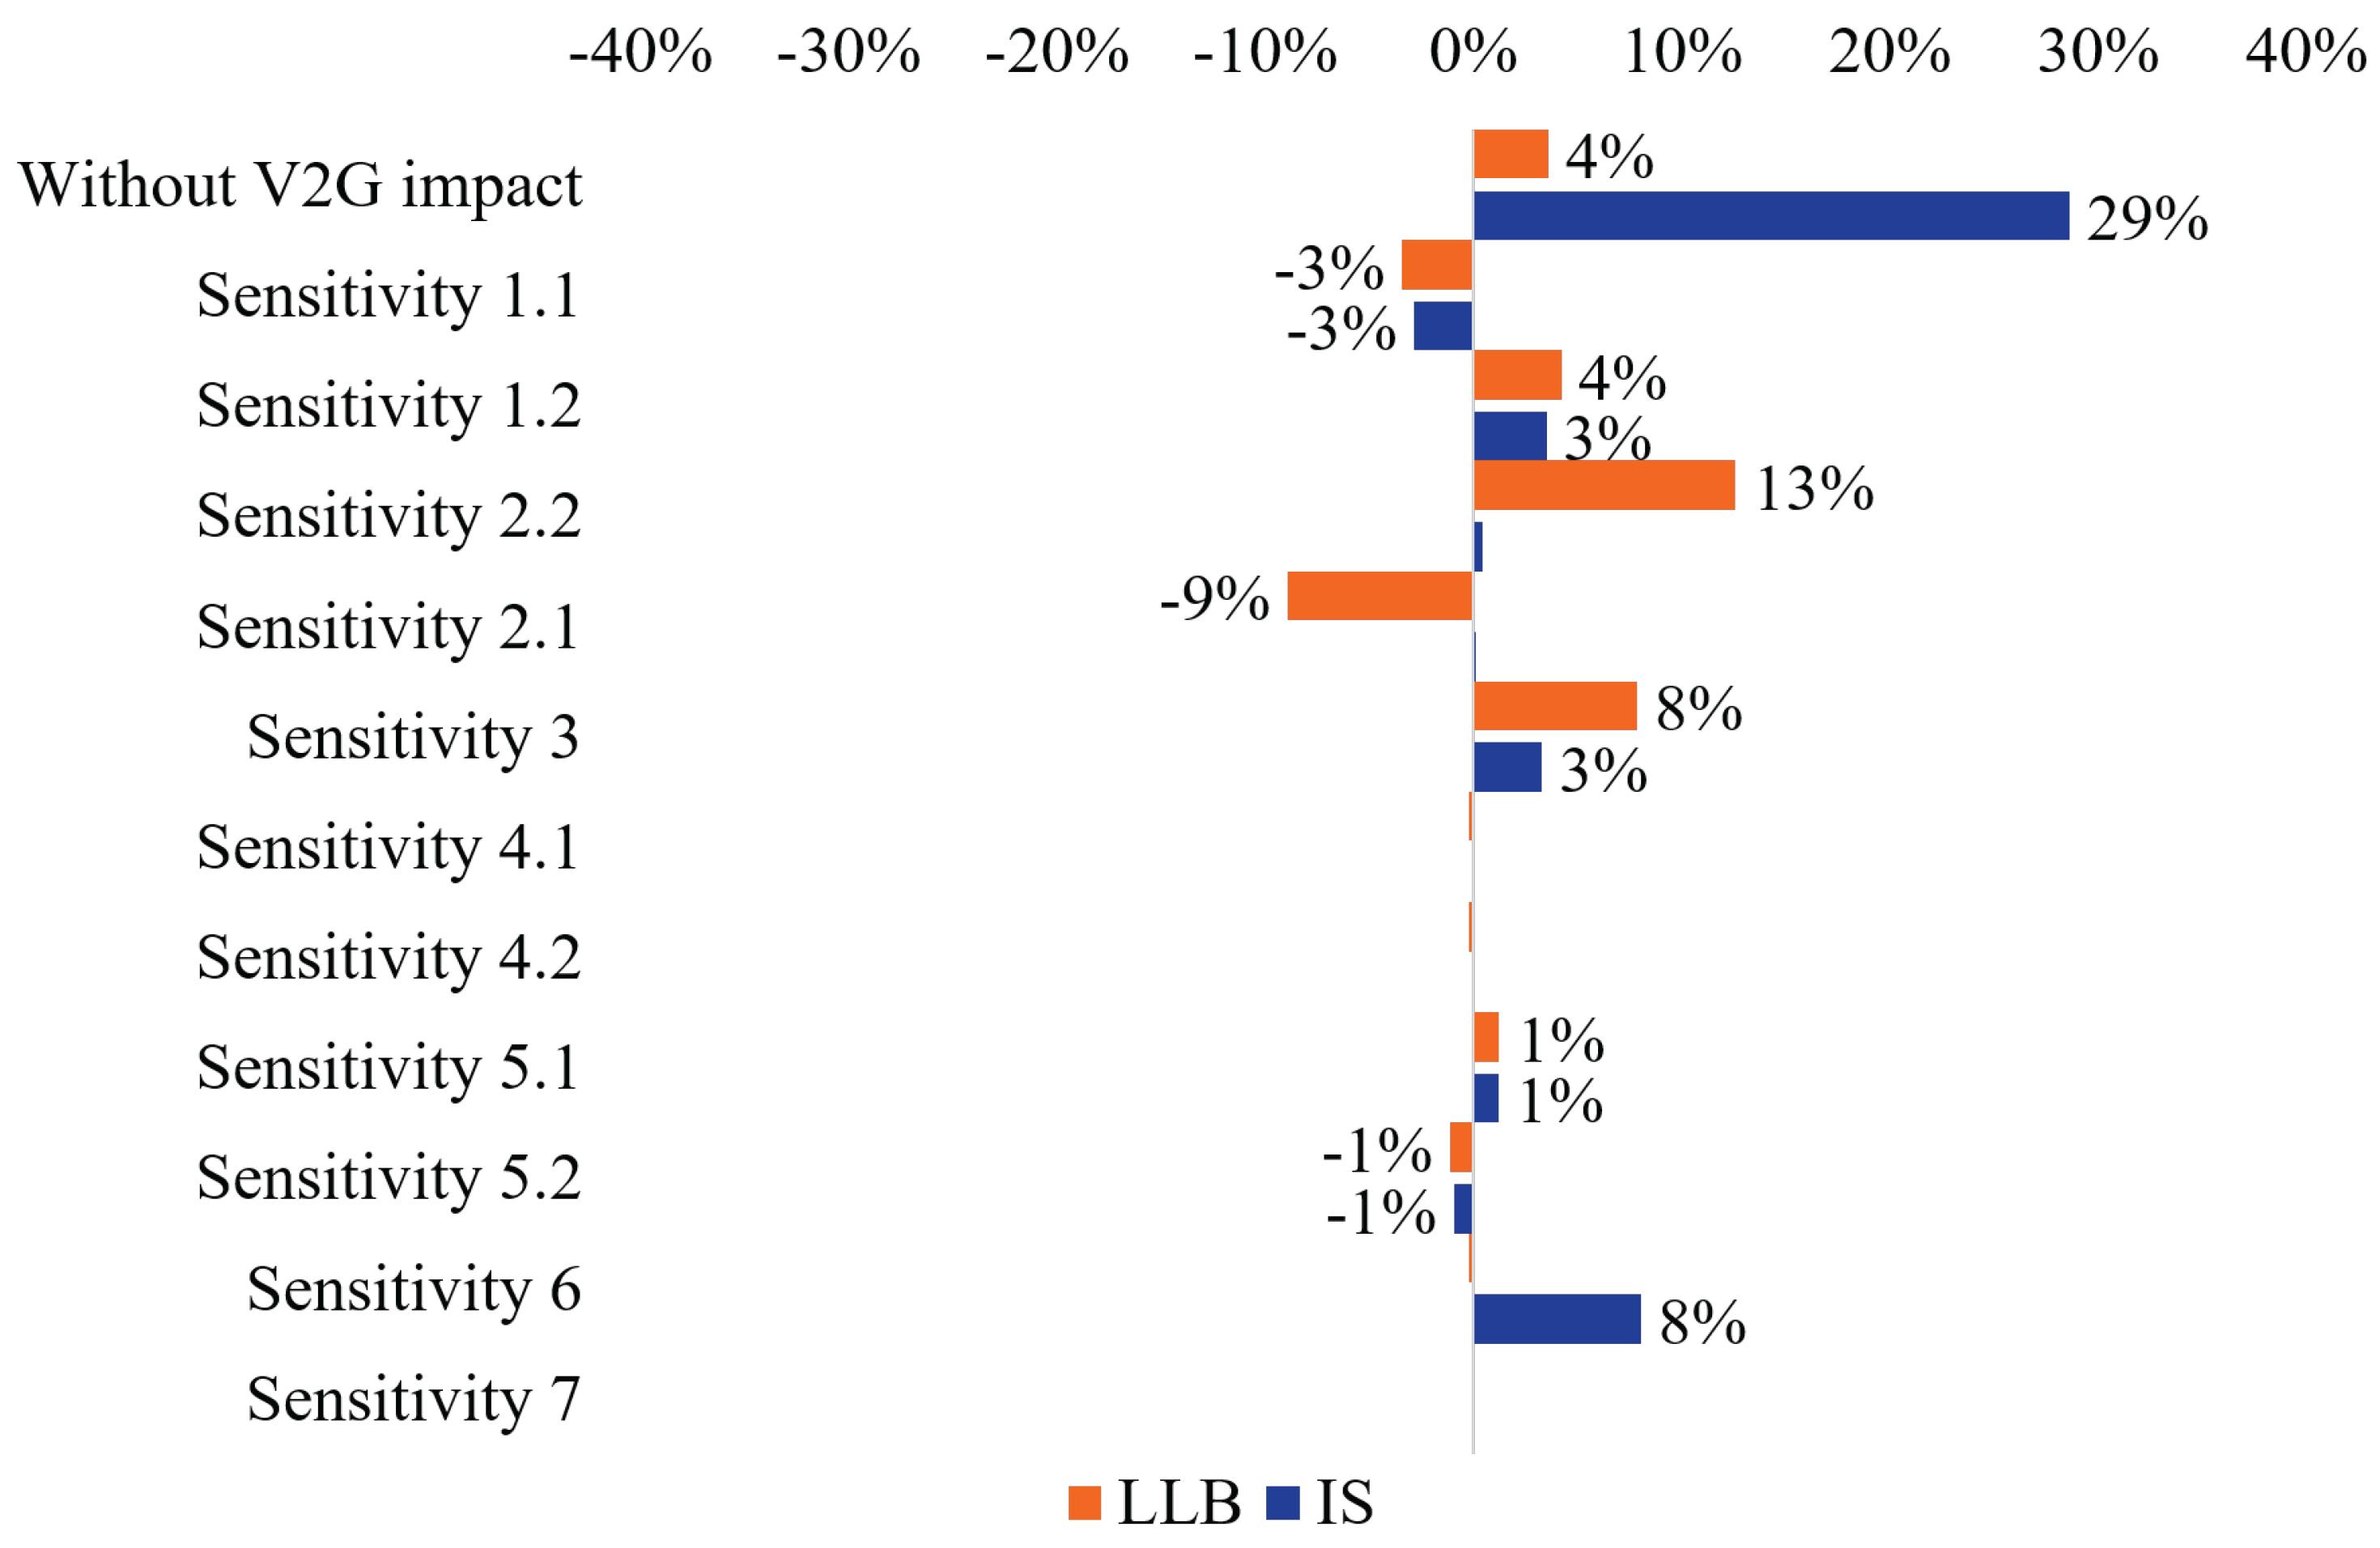
5. Sensitivity Analysis
6. Discussion
7. Conclusions
Author Contributions
Funding
Conflicts of Interest
Abbreviations
| V2G | Vehicle-to-Grid |
| TCO | Total Cost of Ownership |
| EV | Electric vehicle |
| GHG | Greenhouse gas |
| LLB | Local load balance |
| IS | Imbalance service |
| PM | Profit margin |
| LH | Location holder |
| CPO | Charge point operator |
| MSP | Mobility service provider |
| C | Costs occurring during the ownership |
| t | Time expressed as the number of years |
| m | Driven mileage during the ownership time expressed in km |
| CAPEX | Capital expenditures |
| OPEX | Operating expenditures |
| NPV | Net present value |
| One-time costs at time t | |
| Annual reoccurring costs | |
| r | Real discount rate |
| Direct compensation when providing V2G services | |
| Indirect compensation when providing V2G services | |
| Consumption costs when providing certain type of V2G services | |
| Consumption costs in a standard charging case | |
| (without providing any V2G service) | |
| V2G revenues from imbalance service | |
| V2G costs of the energy manager | |
| V2G costs for additional infrastructure maintenance | |
| Purchase costs of a standard charger for EVs | |
| Additional maintenance costs for V2G chargers | |
| Self-consumption | |
| Self-consumption of PV electricity at a charging location where V2G | |
| services is used for LLB | |
| Self-consumption of PV electricity at a charging location with standard EV charging | |
| Amount of electricity in kWh that is consumed directly by the charging location | |
| Amount of electricity in kWh that is generated by the PV installation | |
| at the charging location | |
| Overall load demand of a charging location | |
| Amount of electricity that the charging location is requesting from the grid | |
| Excess electricity generated by the PV installation and is fed back into the grid | |
| Amount of electricity that is generated by the PV installations | |
| Total cost of PV installation | |
| Capital expenditures of the PV installation | |
| A | PV size |
| Lifetime of the PV installation | |
| GC | Green certificates |
| Operational expenditures of the PV installations | |
| Annual costs of standard chargers | |
| Number of chargers installed at the charging location | |
| Size of the standard chargers | |
| Capital expenditures of the standard chargers | |
| Lifetime of the chargers | |
| Costs of the V2G chargers | |
| Numbers of V2G chargers installed at the charging location | |
| Size of the V2G chargers | |
| Capital expenditures of the V2G chargers | |
| Maintenance costs for V2G chargers | |
| Lifetime of the V2G chargers | |
| Total costs of the charging location | |
| Cost of electricity | |
| Marginal costs | |
| Total costs of the charging location without any chargers | |
| Total costs of the charging location with either V2G or standard chargers | |
| Electricity demand of the installed charging stations | |
| T | Tariff |
| Cost of electricity | |
| Marginal cost of electricity | |
| Profit margin of the location holder | |
| Profit margin of the charge point operator | |
| Profit margin of the mobility service provider | |
| Benefit of saved electricity costs from the grid | |
| Average electricity household price in Belgium over the last 10 years | |
| Vehicle-to-Grid indirect compensation | |
| Tariff for a charging case, where V2G (LLB/IS) is provided | |
| Tariff for a standard charging case | |
| Vehicle-to-Grid direct compensation |
Appendix A
References
- The European Environment Agency. EEA Greenhouse Gases–Data Viewer. Available online: https://www.eea.europa.eu/data-and-maps/data/data-viewers/greenhouse-gases-viewer (accessed on 1 October 2021).
- Saldaña, G.; Martin, J.I.S.; Zamora, I.; Asensio, F.J.; Oñederra, O. Electric vehicle into the grid: Charging methodologies aimed at providing ancillary services considering battery degradation. Energies 2019, 12, 2443. [Google Scholar] [CrossRef] [Green Version]
- Pearre, N.S.; Ribberink, H. Review of research on V2X technologies, strategies, and operations. Renew. Sustain. Energy Rev. 2019, 105, 61–70. [Google Scholar] [CrossRef]
- Amamra, S.A.; Marco, J. Vehicle-to-Grid Aggregator to Support Power Grid and Reduce Electric Vehicle Charging Cost. IEEE Access 2019, 7, 178528–178538. [Google Scholar] [CrossRef]
- Kiaee, M.; Cruden, A.; Sharkh, S. Estimation of cost savings from participation of electric vehicles in vehicle to grid (V2G) schemes. J. Mod. Power Syst. Clean Energy 2015, 3, 249–258. [Google Scholar] [CrossRef] [Green Version]
- Falkoni, A.; Pfeifer, A.; Krajačić, G. Vehicle-to-Grid in Standard and Fast Electric Vehicle Charging: Comparison of Renewable Energy Source Utilization and Charging Costs. Energies 2020, 13, 1510. [Google Scholar] [CrossRef] [Green Version]
- Bishop, J.D.; Axon, C.J.; Bonilla, D.; Banister, D. Estimating the grid payments necessary to compensate additional costs to prospective electric vehicle owners who provide vehicle-to-grid ancillary services. Energy 2016, 94, 715–727. [Google Scholar] [CrossRef]
- Su, X.; Yue, H.; Chen, X. Cost minimization control for electric vehicle car parks with vehicle to grid technology. Syst. Sci. Control Eng. 2020, 8, 422–433. [Google Scholar] [CrossRef]
- Heilmann, C.; Friedl, G. Factors influencing the economic success of grid-to-vehicle and vehicle-to-grid applications—A review and meta-analysis. Renew. Sustain. Energy Rev. 2021, 145, 111115. [Google Scholar] [CrossRef]
- Li, X.; Tan, Y.; Liu, X.; Liao, Q.; Sun, B.; Cao, G.; Li, C.; Yang, X.; Wang, Z. A cost-benefit analysis of V2G electric vehicles supporting peak shaving in Shanghai. Electr. Power Syst. Res. 2020, 179, 106058. [Google Scholar] [CrossRef]
- Brown, R.J. A new marketing tool: Life-cycle costing. Ind. Mark. Manag. 1979, 8, 109–113. [Google Scholar] [CrossRef]
- Lebeau, K.; Lebeau, P.; Macharis, C.; Van Mierlo, J. How expensive are electric vehicles? A total cost of ownership analysis. World Electr. Veh. J. 2013, 6, 996–1007. [Google Scholar] [CrossRef] [Green Version]
- Vanhaverbeke, L.; Schreurs, D.; De Clerck, Q.; Messagie, M.; Van Mierlo, J. Total cost of ownership of electric vehicles incorporating Vehicle to Grid technology. In Proceedings of the 2017 Twelfth International Conference on Ecological Vehicles and Renewable Energies (EVER), Monte Carlo, Monaco, 11–13 April 2017; pp. 1–6. [Google Scholar] [CrossRef]
- De Clerck, Q.; van Lier, T.; Messagie, M.; Macharis, C.; Van Mierlo, J.; Vanhaverbeke, L. Total Cost for Society: A persona-based analysis of electric and conventional vehicles. Transp. Res. Part D Transp. Environ. 2018, 64, 90–110. [Google Scholar] [CrossRef]
- Letmathe, P.; Suares, M. A consumer-oriented total cost of ownership model for different vehicle types in Germany. Transp. Res. Part D Transp. Environ. 2017, 57, 314–335. [Google Scholar] [CrossRef]
- Van Velzen, A.; Annema, J.A.; van de Kaa, G.; van Wee, B. Proposing a more comprehensive future total cost of ownership estimation framework for electric vehicles. Energy Policy 2019, 129, 1034–1046. [Google Scholar] [CrossRef]
- Ellram, L.M. Total cost of ownership. Int. J. Phys. Distrib. Logist. Manag. 1995, 25, 4–23. [Google Scholar] [CrossRef]
- Ferrin, B.G.; Plank, R.E. Total Cost of Ownership Models: An Exploratory Study. J. Supply Chain Manag. 2002, 38, 18–29. [Google Scholar] [CrossRef]
- Hagman, J.; Ritzén, S.; Stier, J.J.; Susilo, Y. Total cost of ownership and its potential implications for battery electric vehicle diffusion. Res. Transp. Bus. Manag. 2016, 18, 11–17. [Google Scholar] [CrossRef] [Green Version]
- Department of Education and Early Development, State of Alaska. Life Cycle Cost Analysis Handbook; With Contributions by Tim Mearig, Nathan Coffee, and Michael Morgan; Department of Education and Early Development, State of Alaska: Juneau, AK, USA, 1999; 31p. [Google Scholar]
- Erdogan, N.; Erden, F.; Kisacikoglu, M. A fast and efficient coordinated vehicle-to-grid discharging control scheme for peak shaving in power distribution system. J. Mod. Power Syst. Clean Energy 2018, 6, 555–566. [Google Scholar] [CrossRef] [Green Version]
- Luthander, R.; Widén, J.; Nilsson, D.; Palm, J. Photovoltaic self-consumption in buildings: A review. Appl. Energy 2015, 142, 80–94. [Google Scholar] [CrossRef] [Green Version]
- Elia. Keeping the Balance. Available online: https://www.elia.be/en/electricity-market-and-system/system-services/keeping-the-balance (accessed on 21 October 2021).
- Steward, D. Critical Elements of Vehicle-to-Grid (V2G) Economics; National Renewable Energy Laboratory: Golden, CO, USA, 2017. [Google Scholar]
- De Cauwer, C.; Guillemot, A.; Cragues, G.; Van Mierlo, J.; Coosemans, T.; Messagie, M. Towards EU-wide Interoperability of charging infrastructure for electric vehicles. In Proceedings of the 31st International Electric Vehicle Symposium & Exhibition (EVS31), Kobe, Japan, 30 September–4 October 2018; pp. 1–7. [Google Scholar]
- Statistic Research Department. Electricity Prices for Households in Belgium from 2010 to 2020, Semi-Annually (in Euro Cents per Kilowatt-Hour). Available online: https://www.statista.com/statistics/418067/electricity-prices-for-households-in-belgium/ (accessed on 15 October 2021).
- Syed, A.; Crispeels, T.; Marin, J.J.R.; Cardellini, G.; De Cauwer, C.; Coosemans, T.; Van Mierlo, J.; Messagie, M. A Novel Method to Value the EV-fleet’s Grid Balancing Capacity. In Proceedings of the 33rd Electric Vehicle Symposium (EVS33), Portland, OR, USA, 14–17 June 2020. [Google Scholar]
- Baure, G.; Dubarry, M. Durability and Reliability of EV Batteries under Electric Utility Grid Operations: Impact of Frequency Regulation Usage on Cell Degradation. Energies 2020, 13, 2494. [Google Scholar] [CrossRef]
- Li, Y.; Messagie, M.; Berecibar, M.; Hegazy, O.; Abdel-Monem, M.; Omar, N.; Devroey, L.; Van Mierlo, J. The impact of the vehicle-to-grid strategy on lithium-ion battery ageing process. In Proceedings of the 31st International Electric Vehicle Symposium & Exhibition and International Electric Vehicle Technology Conference (EVS 31 & EVTeC 2018), Kobe, Japan, 30 September–3 October 2018. [Google Scholar]
- Thingvad, A.; Marinelli, M. Influence of V2G Frequency Services and Driving on Electric Vehicles Battery Degradation in the Nordic Countries. In Proceedings of the 31st International Electric Vehicle Symposium & Exhibition and International Electric Vehicle Technology Conference (EVS 31 & EVTeC 2018), Kobe, Japan, 30 September–3 October 2018. [Google Scholar]
- Thingvad, A.; Calearo, L.; Andersen, P.; Marinelli, M. Empirical Capacity Measurements of Electric Vehicles Subject to Battery Degradation from V2G Service. IEEE Trans. Veh. Technol. 2021, 70, 7547–7557. [Google Scholar] [CrossRef]
- Uddin, K.; Dubarry, M.; Glick, M.B. The viability of vehicle-to-grid operations from a battery technology and policy perspective. Energy Policy 2018, 113, 342–347. [Google Scholar] [CrossRef]
- Wang, D.; Coignard, J.; Zeng, T.; Zhang, C.; Saxena, S. Quantifying electric vehicle battery degradation from driving vs. vehicle-to-grid services. J. Power Sources 2016, 332, 193–203. [Google Scholar] [CrossRef] [Green Version]
- Bishop, J.D.; Axon, C.J.; Bonilla, D.; Tran, M.; Banister, D.; McCulloch, M.D. Evaluating the impact of V2G services on the degradation of batteries in PHEV and EV. Appl. Energy 2013, 111, 206–218. [Google Scholar] [CrossRef]
- Elia. Auctions and Sale of Flemish Certificates. Available online: https://www.elia.be/en/customers/green-certificates-and-levies-tariffs/flanders-auctions-for-gc (accessed on 27 October 2021).
- Wallbox. Copper S. Available online: https://wallbox.com/nl_be/opladers/copper-s (accessed on 30 September 2021).
- Fédération Belge et Luxembourgeoise de l’Automobile et du Cycle. Evolution de l’âge Moyen du Parc des Voitures. Available online: http://www.febiac.be/public/statistics.aspx?FID=23%0B&%0Blang=NL (accessed on 24 April 2021).
- Kwanten, M. Kilometers Afgelegd Door Belgische Voertuigen. Available online: https://mobilit.belgium.be/sites/default/files/rapport_kilometers_2017_nl.pdf (accessed on 24 April 2021).
- European Central Bank. Yield Curve Spot Rate, 8-Year Maturity—Government Bond, Nominal, All Issuers Whose Rating Is Triple A—Euro Area (Changing Composition). Available online: https://sdw.ecb.europa.eu/quickview.do;jsessionid=05CF72C1ACE4E251519A89EE4FCF2155?SERIES_KEY=165.YC.B.U2.EUR.4F.G_N_A.SV_C_YM.SR_8Y&start=15-06-2012&end=15-06-2020&submitOptions.x=0&submitOptions.y=0&trans=N (accessed on 24 April 2021).
- European Central Bank. Euro Foreign Exchange Reference Rates: US Dollar (USD). Available online: https://www.ecb.europa.eu/stats/policy_and_exchange_rates/euro_reference_exchange_rates/html/eurofxref-graph-usd.en.html (accessed on 24 April 2021).
- Nissan. Liste de Prix Juin 2020. Available online: https://www.nissan.lu/vehicules/neufs/leaf/configurateur.html#configure/BALw/A/version (accessed on 24 April 2021).
- Renault. Renault Nieuwe ZOE LIFE R110. Available online: https://nl.renault.be/elektrische-wagens/ontdek-nieuwe-zoe/configurator.html?conf=https%3A%2F%2Fbe.co.rplug.renault.com%2Fc%2FBACbi0AhhAjEzE2E1%2FAzpbw (accessed on 24 April 2021).
- Hyundai. KONA Electric. Available online: https://www.hyundai.no/modeller/kona-electric/ (accessed on 24 April 2021).
- BMW. The i3—Prijslijst 03/2020. Available online: https://www.bmw.de/de/neufahrzeuge/bmw-i/i3/2020/bmw-i3-ueberblick.html (accessed on 24 April 2021).
- Overheid, V. Vehicle Registration Tax. Available online: https://www.vlaanderen.be/en/vehicle-registration-tax (accessed on 21 June 2021).
- AXA. Assurance Auto. Available online: https://eauto.axa.be/eauto/default.aspx?ID=mIEzLWOSEMMsU4ZeWfo5uMpKZKVNfnhhiOBA%2BVLS_vgdLv7XtqmjGU%2Baa2VYBI93GsO6MwRIjQWcJP9_prfS9%2BEmmg&U=1A644987EDC1F62DAAF96536F7EB74F6&intid=car_mainpage_banner-cta-right (accessed on 25 June 2021).
- Michelin. Nieuwe Michelin E-Primacy Banden. Available online: https://www.michelin.be/nl/auto/home-auto (accessed on 22 June 2021).
- QTeam. 205/55 R 16 91H CROSSCLIMATE+ TL. Available online: https://www.qteam.be/nl/shop/detail/michelin-crossclimate/3528704554355/?utm_source=click2buy&utm_campaign=manufacturer&utm_medium=referral&utm_term=michelin (accessed on 22 June 2021).
- Overheid, V. Vrijstelling Voor Pure Elektrische en Pure Waterstofvoertuigen. Available online: https://www.vlaanderen.be/vrijstelling-voor-pure-elektrische-en-pure-waterstofvoertuigen (accessed on 6 June 2021).
- Overheid, V. Tarieven Technische Keuring. Available online: https://www.vlaanderen.be/tarieven-technische-keuring (accessed on 6 June 2021).
- Berckmans, G.; Messagie, M.; Smekens, J.; Omar, N.; Vanhaverbeke, L.; Van Mierlo, J. Cost Projection of State of the Art Lithium-Ion Batteries for Electric Vehicles Up to 2030. Energies 2017, 10, 1314. [Google Scholar] [CrossRef] [Green Version]
- Van Heuveln, K.; Ghotge, R.; Annema, J.A.; van Bergen, E.; van Wee, B.; Pesch, U. Factors influencing consumer acceptance of vehicle-to-grid by electric vehicle drivers in the Netherlands. Travel Behav. Soc. 2021, 24, 34–45. [Google Scholar] [CrossRef]
- Kyriakopoulos, G.L. Environmental Legislation in European and International Contexts: Legal Practices and Social Planning toward the Circular Economy. Laws 2021, 10, 3. [Google Scholar] [CrossRef]
- Kyriakopoulos, G.L.; Kapsalis, V.C.; Aravossis, K.G.; Zamparas, M.; Mitsikas, A. Evaluating Circular Economy under a Multi-Parametric Approach: A Technological Review. Sustainability 2019, 11, 6139. [Google Scholar] [CrossRef] [Green Version]


| Cost at Purchase Time | Operational Costs | Non-Operational Costs |
|---|---|---|
| EV purchase price | Costs for electricity consumption | Insurance premiums |
| Charging station purchase price | Maintenance costs | |
| Governmental premium | Tires replacement costs | |
| Registration tax | Battery replacement costs | |
| Annual road tax | ||
| Costs technical control | ||
| Costs fines & parking |
| Price Type | Injection Price | Supply Price | Peak Price |
|---|---|---|---|
| Unit | €/kWh | €/kWh | €/kWh |
| On-peak | −0.035 | 0.128 | 2.35 |
| Off-peak | −0.029 | 0.110 | 2.35 |
| Charging Case | Type of Charging | PV Size kWp | Charger Size kW | Number of Chargers Amount | Grid Supply kWh/Year | Grid Injection kWh/year | PV Production kWh/Year |
|---|---|---|---|---|---|---|---|
| Private | Standard | 3.8 | 22 | 1 | 11,123.00 | −1599.00 | 4063.00 |
| Private | LLB | 3.8 | 22 | 1 | 10,609.00 | −1430.00 | 4063.00 |
| Private | V2G | 3.8 | 22 | 1 | 11,123.00 | −1599.00 | 4063.00 |
| Semi-public | Standard | 12 | 22 | 12 | 229,715.00 | −4282.00 | 60,763.85 |
| Semi-public | LLB | 12 | 22 | 12 | 228,910.00 | −3919.00 | 60,763.85 |
| Semi-public | IS | 12 | 22 | 12 | 229,715.00 | −4282.00 | 60,763.85 |
| Public | Standard | 12 | 22 | 12 | 11,896.37 | −55,898.77 | 60,763.85 |
| Public | LLB | 12 | 22 | 12 | 3788.39 | −48,299.16 | 60,763.85 |
| Public | IS | 12 | 22 | 12 | 11,896.37 | −55,898.77 | 60,763.85 |
| Asset | CAPEX | OPEX | Green Certificates | Lifetime |
|---|---|---|---|---|
| PV installation | 1000.00 €/kWp | 15.00 €/kWp/year | 0.022 €/kWh [35] | 15 years |
| Standard charger | 60.00 €/kW [36] | n.a. | n.a. | 15 years |
| V2G charger | 115.00 €/kW [24,36] | 5.00% p.a. [24] | n.a. | 15 years |
| Charging Case | Type of Charging | Cost of Electricity | Marginal Cost | PM LH | PM CPO | PM MSP | |
|---|---|---|---|---|---|---|---|
| Tariff | |||||||
| Unit | €/Ø kWh | €/extra kWh | % | % | % | €/kWh | |
| Private | Standard | 0.22 | n.a. | n.a. | n.a. | n.a. | 0.22 |
| Private | V2G-LLB | 0.22 | n.a. | n.a. | n.a. | n.a. | 0.22 |
| Private | V2G-IS | 0.23 | n.a. | n.a. | n.a. | n.a. | 0.23 |
| Semi-public | Standard | 0.12 | 0.23 | 10 | n.a. | 10 | 0.28 |
| Semi-public | V2G-LLB | 0.12 | 0.28 | 10 | n.a. | 10 | 0.34 |
| Semi-public | V2G-IS | 0.12 | 0.29 | 10 | n.a. | 10 | 0.35 |
| Public | Standard | 0.24 | n.a. | 10 | 10 | 10 | 0.31 |
| Public | V2G-LLB | 0.18 | n.a. | 10 | 10 | 10 | 0.23 |
| Public | V2G-IS | 0.30 | n.a. | 10 | 10 | 10 | 0.39 |
| No. | Assumption | Value | Unit |
|---|---|---|---|
| 1 | Ø age of vehicle fleet in Belgium [37] | 9.23 | years |
| 2 | Travelled vehicle kilometres [38] | 14.483 | km/year |
| 3 | Lifetime vehicle kilometres | 133.678 | km |
| (assumption 1 × assumption 2) | |||
| 4 | Real discount rate [39] | −0.39 | % p.a. |
| 5 | Real exchange rate [40] | 0.83 | USD/EUR |
| EV Type | Power | Electricity Consumption | Purchase Price Incl. VAT | Omnium | Civil Liability | Tire Replacement |
|---|---|---|---|---|---|---|
| kW(pk) | kWh/km | € | €/year | €/year | €/replacement | |
| Nissan Leaf | 110 (150) | 0.171 | 36,540.00 | 1269.77 | 320.38 | 462.84 |
| Renault Zoe | 80 (108) | 0.173 | 32,600.00 | 1107.37 | 297.15 | 411.44 |
| Hyundai Kona | 150 (204) | 0.154 | 49,999.00 | 1309.43 | 309.72 | 754.88 |
| BMW i3 | 125 (170) | 0.131 | 40,750.00 | 1186.84 | 336.38 | 912.00 |
| Cost Type | Small Maintenance [14] | Large Maintenance [14] | Fines & Parking [14] | Technical Control [50] |
|---|---|---|---|---|
| Unit | €/maintenance | €/maintenance | €/year | €/year |
| Amount | 64.35 | 109.85 | 83.98 | 32.70 |
| EV Type | Unit | Private | Semi-Public | Public |
|---|---|---|---|---|
| Nissan Leaf Acenta MY 19 | € | 48,893.47 | 50,293.10 | 50,992.91 |
| Renault Zoe R110 | € | 41,569.96 | 42,985.96 | 43,693.96 |
| Hyundai Kona Sky | € | 59,334.82 | 60,595.30 | 61,225.54 |
| BMW i3 (120 Ah) | € | 53,011.81 | 54,084.04 | 54,620.16 |
| Parameter | Unit | Private | Semi-Public | Public |
|---|---|---|---|---|
| PV production | kWh/year | 4063.00 | 60,763.85 | 60,763.85 |
| Standard charging | % | 60.64 | 92.95 | 8.01 |
| V2G charging | % | 64.80 | 93.55 | 20.51 |
| Consumption increase | % | 4.16 | 0.60 | 12.51 |
| Avoided grid electricity | kWh/year | 169.00 | 30.25 | 633.30 |
| Obtained benefit | €/year | 40.56 | 7.26 | 151.99 |
| Discounted benefit | €/lifetime | −387.63 | −69.38 | −1452.58 |
| EV Type | V2G | Unit | Private | Semi-Public | Public |
|---|---|---|---|---|---|
| Nissan Leaf Acenta MY 19 | LLB | € | −232.58 | 1959.48 | −1213.01 |
| Nissan Leaf Acenta MY 19 | IS | € | −9631.96 | −11,492.75 | −10,786.30 |
| Renault Zoe R110 | LLB | € | −232.58 | 1982.40 | −1227.20 |
| Renault Zoe R110 | IS | € | −9610.37 | −11,448.17 | −10,755.83 |
| Hyundai Kona Sky | LLB | € | −232.58 | 1764.68 | −1092.42 |
| Hyundai Kona Sky | IS | € | −9278.61 | −11,155.81 | −10,418.89 |
| BMW i3 (120 Ah) | LLB | € | −232.58 | 1501.12 | −929.27 |
| BMW i3 (120 Ah) | IS | € | −8933.51 | −10,877.24 | −10,076.93 |
| Sensitivity | Variable | Value | Unit |
|---|---|---|---|
| Sensitivity 1.1 | Annual mileage | 10,000 | km |
| Sensitivity 1.2 | Annual mileage | 20,000 | km |
| Sensitivity 2.1 | Ownership time | 5 | years |
| Sensitivity 2.2 | Ownership time | 15 | years |
| Sensitivity 3 | Cost of V2G chargers | 4900.00 | € |
| Sensitivity 4.1 | Provision for energy manager | 20 | % |
| Sensitivity 4.2 | Provision for energy manager | 50 | % |
| Sensitivity 5.1 | Profit margin | 5 | % |
| Sensitivity 5.2 | Profit margin | 15 | % |
| Sensitivity 6 | Charged electricity for IS service | 75 | % |
| Sensitivity 7 | Increased PV-selfconsumption | 90 | % |
Publisher’s Note: MDPI stays neutral with regard to jurisdictional claims in published maps and institutional affiliations. |
© 2021 by the authors. Licensee MDPI, Basel, Switzerland. This article is an open access article distributed under the terms and conditions of the Creative Commons Attribution (CC BY) license (https://creativecommons.org/licenses/by/4.0/).
Share and Cite
Huber, D.; De Clerck, Q.; De Cauwer, C.; Sapountzoglou, N.; Coosemans, T.; Messagie, M. Vehicle to Grid Impacts on the Total Cost of Ownership for Electric Vehicle Drivers. World Electr. Veh. J. 2021, 12, 236. https://doi.org/10.3390/wevj12040236
Huber D, De Clerck Q, De Cauwer C, Sapountzoglou N, Coosemans T, Messagie M. Vehicle to Grid Impacts on the Total Cost of Ownership for Electric Vehicle Drivers. World Electric Vehicle Journal. 2021; 12(4):236. https://doi.org/10.3390/wevj12040236
Chicago/Turabian StyleHuber, Dominik, Quentin De Clerck, Cedric De Cauwer, Nikolaos Sapountzoglou, Thierry Coosemans, and Maarten Messagie. 2021. "Vehicle to Grid Impacts on the Total Cost of Ownership for Electric Vehicle Drivers" World Electric Vehicle Journal 12, no. 4: 236. https://doi.org/10.3390/wevj12040236
APA StyleHuber, D., De Clerck, Q., De Cauwer, C., Sapountzoglou, N., Coosemans, T., & Messagie, M. (2021). Vehicle to Grid Impacts on the Total Cost of Ownership for Electric Vehicle Drivers. World Electric Vehicle Journal, 12(4), 236. https://doi.org/10.3390/wevj12040236