Article

Battery Pack State of Health Prediction Based on the Electric Vehicle Management Platform Data

1
College of Physics and Optoelectronic Engineering, Shenzhen University, Shenzhen 518060, China
2
National Engineering Laboratory for Electric Vehicles, School of Mechanical Engineering, Beijing Institute of Technology, Beijing 100081, China
*
Author to whom correspondence should be addressed.
World Electr. Veh. J. 2021, 12(4), 204; https://doi.org/10.3390/wevj12040204
Submission received: 3 September 2021 / Revised: 1 October 2021 / Accepted: 19 October 2021 / Published: 20 October 2021

Abstract

:
In electric vehicle technologies, the state of health prediction and safety assessment of battery packs are key issues to be solved. In this paper, the battery system data collected on the electric vehicle data management platform is used to model the corresponding state of health of the electric vehicle during charging and discharging processes. The increment in capacity in the same voltage range is used as the battery state of health indicator. In order to improve the modeling accuracy, the influence of ambient temperature on the capacity performance of the battery pack is considered. A temperature correction coefficient is added to the battery state of health model. Finally, a double exponential function is used to describe the process of battery health decline. Additionally, for the case where the amount of data is relatively small, model migration is also applied in the method. Particle swarm optimization algorithm is used to calibrate the model parameters. Based on the migration battery pack model and parameter identification method, the proposed method can obtain accurate battery pack SOH prediction result. The method is simple and easy to perform on the electric vehicle data management platform.

1. Introduction

At present, the technological revolution and industrial reform are taking place across the world. The integration of traditional automobile technology, new energy technology and information technology is accelerating. It is a research topic to apply big data, artificial intelligence and other technologies to the new energy vehicle field. In the research of battery management technology of electric vehicles, accurate evaluation and prediction of the state of health (SOH) of battery can guide the reasonable use of a vehicle battery and extend the service life of battery, which is of great significance for the life cycle management and utilization of battery. The data management platform of electric vehicle collects real-time data generated during the driving process of electric vehicles. Using these data to explore the aging law of battery system is an important way of battery safety management and residual value evaluation.
The battery state of health (SOH) is mainly determined by the battery capacity, internal resistance and the number of cycle times. Battery SOH prediction methods can be divided into two types, including the model-based method and data-driven method. SOH of the battery can be predicted according to the model parameters in the model-based method. Many Kalman filtering algorithms are often used to identify parameters and update state variables. The data-driven method does not need to understand the working principle of the battery. However, the reliability and accuracy are more dependent on data. Artificial neural networks and support vector machines are commonly used in the data-driven methods. Severson et al. [1] proposed a battery cycle life prediction method based on capacity aging data. A total of 124 sets of aging data of LiFePO4 battery under fast charging condition were obtained. Based on the characteristics of discharge voltage of early cycles and machine learning method, the battery cycle life can be predicted. The results show the prospects of artificial intelligence and data-driven modeling in battery cycle life assessment. Dubarry et al. [2] proposed an automatic battery state of health assessment based on the battery capacity incremental analysis method. Togasaki et al. [3] predicted that the life attenuation of the battery capacity diving is predicted in advance through the impedance signal analysis method. According to the perspective of electrochemical impedance spectroscopy, the negative electrode metal lithium deposition corresponds to the enhanced impedance signal of the charge transfer impedance and the interface capacitance. Popp et al. [4] proposed a low-cost method for estimating the state of charge (SOC) and SOH of lithium-ion batteries based on the ultrasonic guided wave data processing method of flight time and signal amplitude. Xia et al. [5] proposed a general modelling method for lithium-ion battery modules, which coupled the electrochemical, thermal, SEI formation models, fluid dynamics, and series-parallel circuit models of the battery to establish a battery life model with capacity decay. In order to evaluate the SOH of the lithium-ion battery pack, Liu et al. [6] evaluated a variety of health indicators when the battery is not fully charged or fully discharged. The best indicator is suitable for aerospace application. In the existing researches, the data sources estimating the SOH can be divided into laboratory data and actual vehicle data. A large number of battery cycle aging experiments under different conditions is required for building the laboratory datasets. However, due to the rigorous requirements for the experimental environment, the datasets do not match the actual condition data in practice. Considering the actual vehicle data, Xiao et al. [7] selected the capacity value of the fixed voltage segment to characterize the battery SOH. Chen et al. [8] proposed a circuit model and a Kalman filter for SOH estimation using real vehicle data. However, in the actual vehicle application, because the charging and discharging segments of the vehicle are random, it is often difficult to find the overlapping regions of all segments, leading to the failure of these methods.
The actual vehicle data is collected by the battery management system (BMS), and uploaded to the electric vehicle data management platform. The datasets have the advantages of large amount of data and long-time span, which is suitable for the performance evaluation of battery pack on long-term trend. However, there are some shortcomings, such as data confusion and lack of data, for example. The data need to be cleaned and optimized for SOH prediction method design.
In this paper, the actual driving data of the electric vehicle is used to realize the battery SOH prediction. The organization of the paper is as follows. In Section 2, data cleaning and feature engineering is performed on the original data. In Section 3, two battery equivalent circuit models are established for the charging data and discharging data. Open circuit voltage of the battery is obtained by analyzing the voltage and current data of the battery. The increase in capacity with the same open circuit voltage segment is calculated. Additionally, a temperature correction model is selected to eliminate the influence of temperature on SOH prediction results. A more realistic battery state of health estimation result is obtained in this section. In Section 4, based on the SOH obtained in the previous sections, a SOH prediction model and Particle swarm algorithm is established to obtain the SOH prediction result.

2. Data Cleaning and Feature Engineering

The electric vehicle driving data used in this paper is provided by the National Big Data Alliance of New Energy Vehicles (NDANEV). The data was collected from the national Monitoring and Management Platform for New Energy Vehicles (NEVs). The data format specification adopts GB/T 32960.3-2016 Electric Vehicle Remote Service and Management. The data sampling period is 10s. The electric vehicle dataset includes sample time, charge/discharge status, temperature, total voltage, total current, and SOC, etc. As several data is missing or confusing in wireless transmission process, it is necessary to clean and optimize the original data. As can be seen in Figure 1a, some values of SOCs are null and zeros. The error data should be replaced for the battery SOH assessment. Due to the lack of data in the data acquisition process, the time interval of vehicle data acquisition is not constant. For the convenience of battery SOH analysis, the data is interpolated according to the time stamp. The processed SOC data is shown in Figure 1b.
In the electric vehicle data, the charging and discharging segments should be separate from the data sequence for SOH prediction method design. The difference in SOC and current values during the charging and discharging processes can be used to divide the charging and discharging segments. After the treatments, hundreds of charging/discharging segments can be obtained.

3. Battery Pack SOH Indicator and Estimation

3.1. Battery SOH Calculation

In real vehicle applications, the battery pack is usually not completely discharged. The SOC regions are mainly concentrated between 20% and 90%. The data of each segment is extremely random. As the SOC data is the estimation result, the reliability cannot be ensured. As a result, the battery SOH indicator is calculated based on the capacity fragment and the voltage fragment. The segment with a large charge/discharge voltage span can be selected for SOH evaluation. The capacity Q N e w of the fresh battery is written as:
Δ Q N e w = I N e w Δ t N e w
where I N e w is the charge/discharge current of the first cycle, t N e w is the time difference of the data fragment.
The current capacity Q N o w is written as:
Δ Q N o w = I N o w Δ t N o w
where I N o w is the charge/discharge current of the recent cycle, t N o w is the time difference of the data fragment.
Then, the battery pack SOH is defined as:
S O H N o w = Δ Q N o w Δ Q N e w
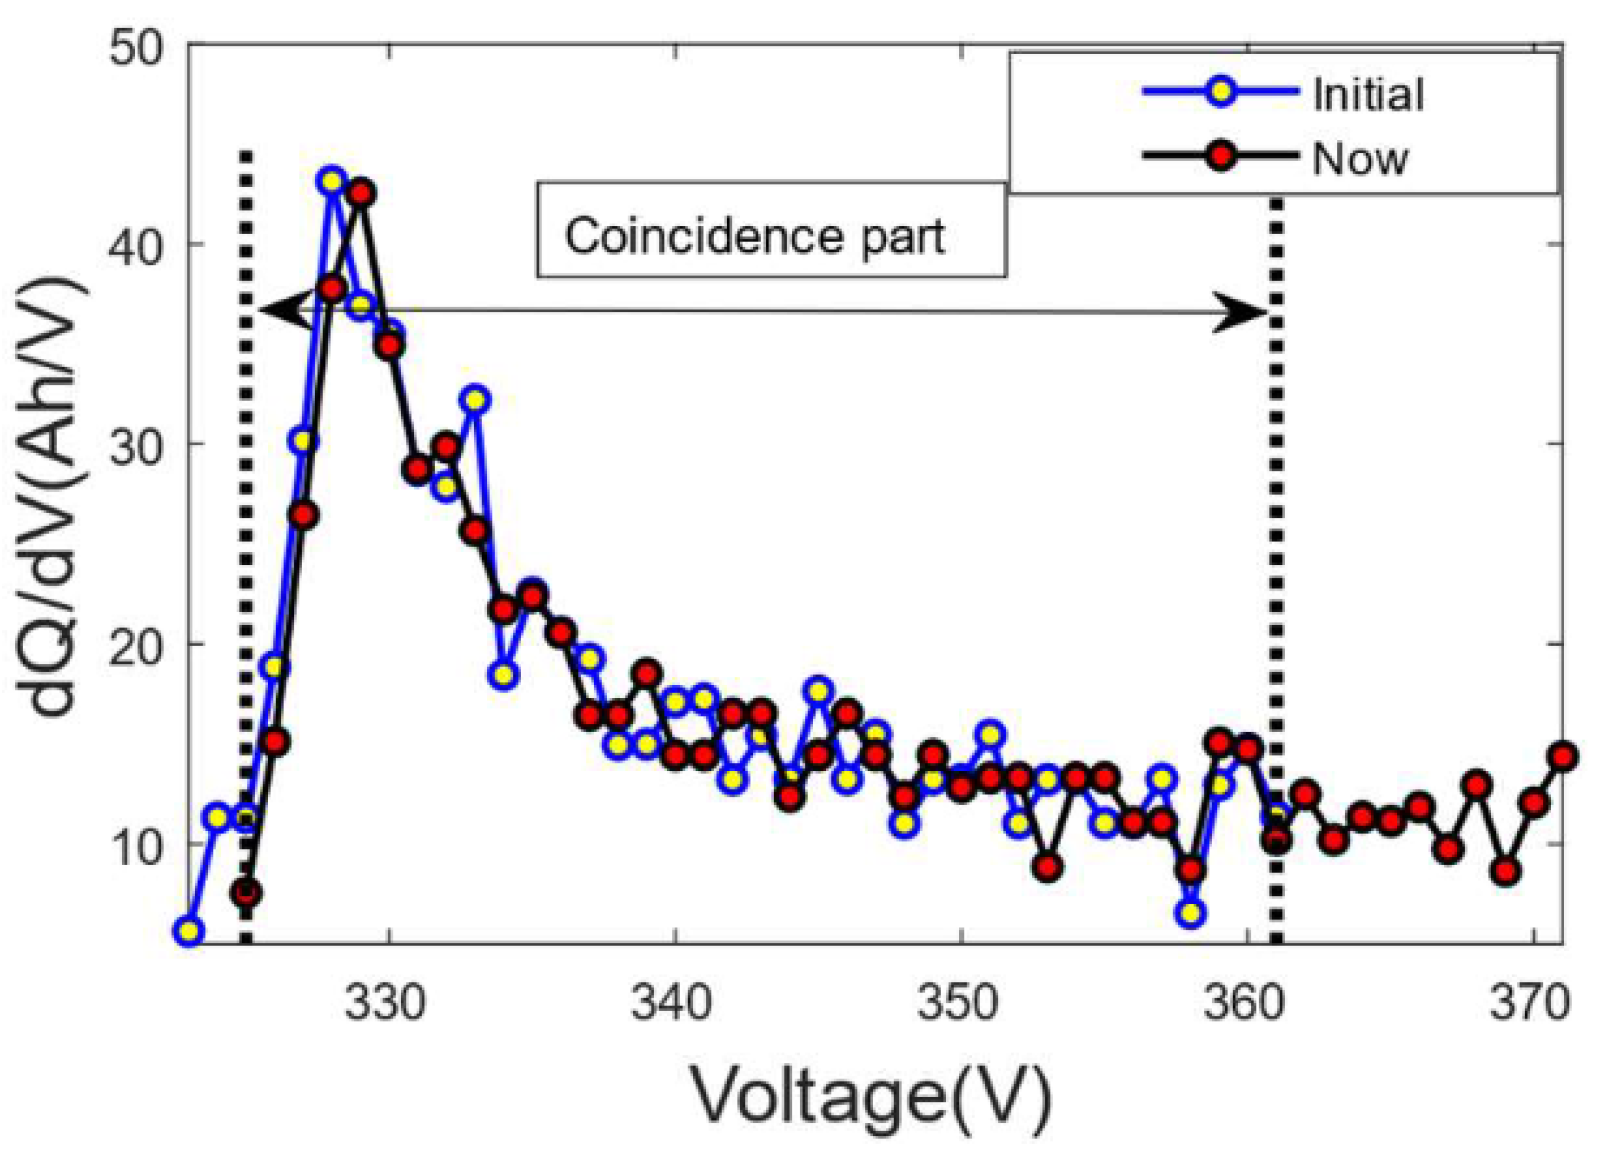
Figure 2 shows the capacity increment curves of the data segments. The two boundaries in the figure are determined according to the overlap between the IC curve at the current time and the reference IC curve. In this paper, the IC curve calculated from the battery data with large charge discharge interval in the early stage is used as the reference IC curve. When calculating the SOH of the current segment, the capacity increment curves of the initial time and the current time are amalgamated. The overlapped section is extracted from the curve, and the capacity value corresponding to the overlapped section is calculated. The current SOH of the battery is expressed as the ratio of the capacity of two fragments. Herein, it should be noted that due to the small amount of data in some data segments, five adjacent data segments are combined in this paper. As a result, the data segments with large voltage range can be constructed.

3.2. Temperature Correction of Battery SOH Indicator

The ambient temperature has a great influence on the electrochemical reaction and energy consumption rate of the lithium battery. In a low temperature environment, the battery capacity is significantly reduced compared the battery capacity in a normal temperature environment. Li et al. [9] carried out a capacity-temperature model and the effectiveness of the model is verified by the experimental results. The relationship between battery capacity correction factor r ( t ) and the ambient temperature t can be written as:
r ( t ) = 1.7 × e 0.005059 t 0.8204 × e 0.01984 t
The battery capacity correction equation can be used to correct the battery capacity to the capacity value when the ambient temperature is 25 degrees:
Δ Q t = Δ Q r ( t )
where Δ Q t is the corrected battery capacity, the temperature corrected battery SOH indicator is written as:
S O H N o w t = Δ Q t , N o w Δ Q t , N e w

3.3. Extraction Methods of Battery Open Circuit Voltage

In Figure 3a, a three-stage charging procedure is often adopted for electric vehicle charging. As the current is not constant during charging, the change in the capacity increment with the voltage fragments cannot be directly calculated. Therefore, it is necessary to extract the stable open circuit voltage (OCV) data from the charging voltage data, and then calculate the battery SOH. Compared with the charging process, seen in Figure 3b, the discharge current in the discharging section is more complicated. It is necessary to calculate the OCV curve for battery SOH evaluation.
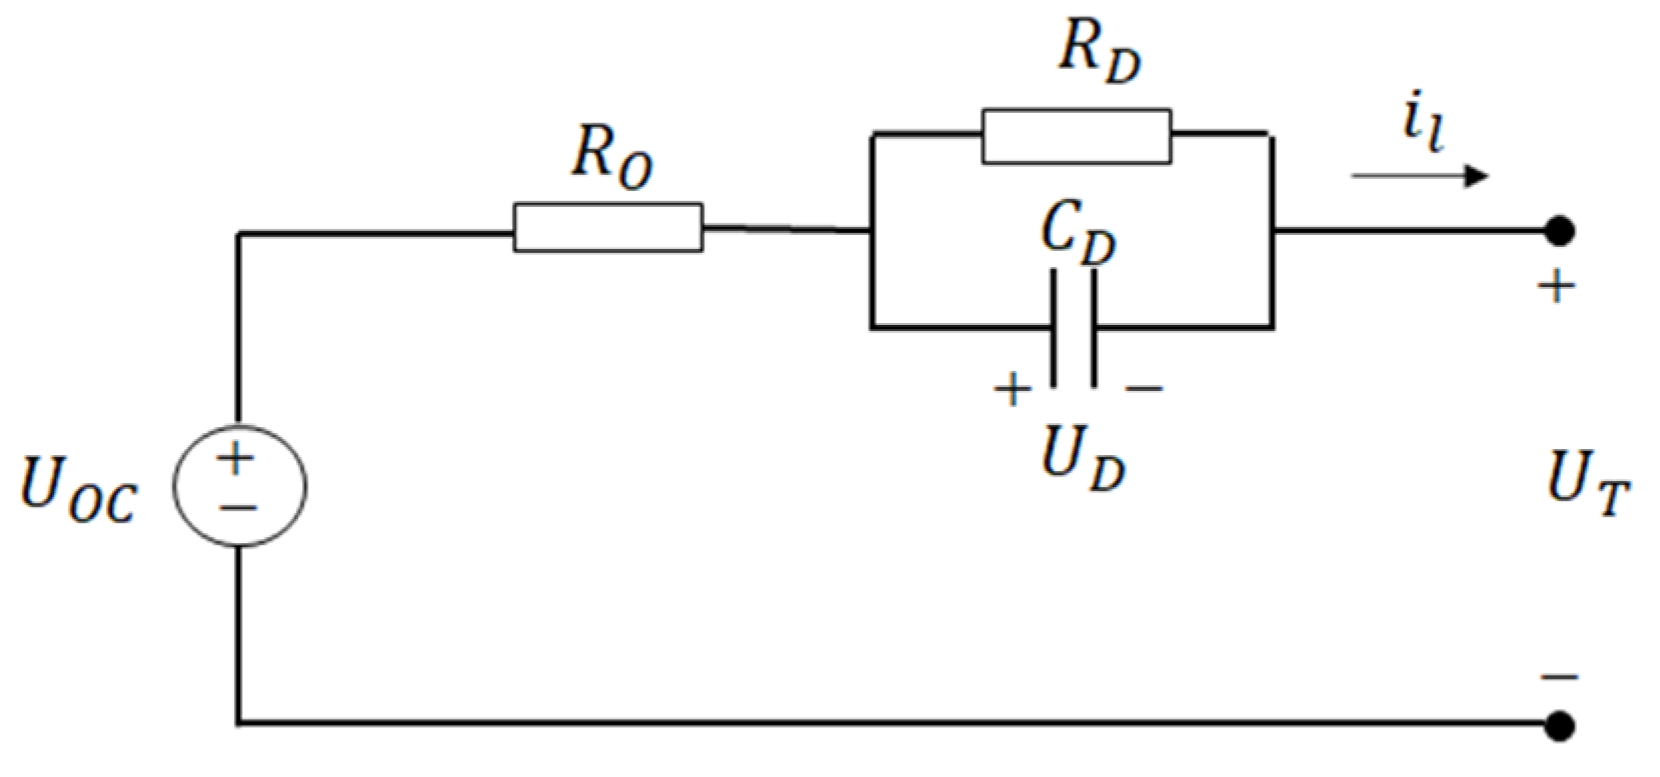
Regarding the battery models, the first-order RC model is commonly used for battery state estimation. In this paper, the first-order RC model is also selected for the OCV curve calculation. The model is shown in Figure 4.
Theorem-type environments (including propositions, lemmas, corollaries etc.) can be formatted as follows:
Among them, R P and C D are polarization internal resistance and polarization capacitance, respectively, U D is the voltage drop of the RC parallel link and R O is the internal resistance of the battery, U T is the terminal voltage of the battery, i l is the current flowing through the circuit. The circuit equation of the model is written as:
U D = i l C D U D R D C D
U T = U O C U D i l R O
Since the discharge current changes continuously according to the driving conditions, the polarization voltage is continuously changed during the battery discharging process. The open circuit voltage U O C of the discharge data segment can be obtained according to the recursive least square (RLS) method.
For the battery charging data, the polarization voltages with constant currents can be regarded as the constant values. As a result, the battery model can be modeled as a Rint model with two electrode open circuit voltages and one internal resistance element. The simple Rint model is shown in Figure 5.
In Figure 5, E O C V , P and E O C V , N are the open circuit potentials of the positive and negative electrodes, respectively. R O is the equivalent internal resistance of the battery, and U T is the terminal voltage of the battery. The relationship between the battery OCV and the terminal voltage U T of the Rint model can be obtained as:
U O C = E O C V , P E O C V , N = U T i l R O
The open circuit voltage U O C of the charge data segment can be obtained according to the voltage curve fitting method.

3.4. Battery Pack SOH Prediction Method

In order to predict the future trend of battery pack SOH, the double exponential polynomial battery remaining useful life model established by Xu et al. [10] is used to describe the aging trend of battery pack SOH. The model is shown as follows:
S O H ( x ) = β 1 e ( β 2 x ) + β 3 e ( β 4 x )
where β 1 , β 2 , β 3 , β 4 are the parameters to be fitted, and x represents the mileage of the electric vehicle. The unit of the mileage in the model is 100 km. In order to obtain the parameters of β 1 ~ β 4 , the optimization algorithm is used to identify the parameters of the model.
In the actual SOH prediction applications, the dataset is always relatively limited. Hence, the migration learning approach [11] is added into the method. Transfer learning has the ability to adapt the original model to new data. Under the constraints of the previous working condition, the current working condition can use less data to predict the SOH result. In this paper, we choose to use the charging data to fit the parameters passed down. Then, the discharge data is regarded as new data. The original battery pack aging model is written as:
S O H c h a r g e ( x ) = β 1 e ( β 2 x ) + β 3 e ( β 4 x ) = f ( x , β )
For the battery pack prediction using discharging data, the migration battery pack model is written as:
S O H d i s c h a r g e ( x ) = k 1 f ( k 2 x + k 3 , β ) + k 4
Equation (12) retains the parameter β fitted by Equation (11). k1, k2, k3, k4 are the new parameters to be fitted. Due to the similarity of the two working conditions, the results can be obtained with less data in the discharge data. It should be noted that due to the limited data resources used in this paper, only the charging data can be used to train the original model. When there are historical data of multiple vehicles, a small number of vehicles driving data can be used to train the original model, and model migration and SOH prediction can be carried out on other vehicles.
Regarding the identification of parameters, the Particle swarm algorithm (PSO) is selected in this article. PSO is an optimization algorithm based on iteration. The system is initialized as a set of random solutions, searching for the optimal value through iteration. The advantage of PSO is that it is easy to implement and does not have many parameters to adjust. Compared with least squares, the algorithm is easier to converge. Therefore, the fitting parameters of this algorithm are selected in this paper. The particle swarm algorithm can be mathematically expressed as follows. Supposing in a D-dimensional target search space, there is a community composed of N particles and the i-th particle is represented as a D-dimensional vector:
X i = ( x i 1 , x i 2 , , x i D ) ,   i = 1 , 2 , , N
The flight speed of the i-th particle is also a D-dimensional vector, and can be denoted by:
V i = ( v i 1 , v i 2 , , v i D ) ,   i = 1 , 2 , , N
The optimal position of the i-th particle to be searched is called the individual extremum:
P i = ( p i 1 , p i 2 , , p i D ) ,   i = 1 , 2 , , N
The flight speed and the optimal position on the path of i-th particle can be updated by:
v i d = ω v i d + c 1 r 1 ( p i d x i d ) + c 2 r 2 ( p g d x i d )
x i d = x i d + α v i d
where i = 1 ,   2 ,   3 , ,   N represents the particle number. d = 1 , 2 , 3 , , D represents the dimension number. ω is the inertia factor. c 1 and c 2 are acceleration constants. r 1 and r 2 are constraint factors with the range of 0 to 1, which are used to control the weight of flight speed.

4. Results and Discussion

4.1. Battery Pack SOH Calibration Results

The SOH in this paper is defined as the ratio of current interval capacity to reference interval capacity. Since there is a certain conversion relationship between interval capacity and battery capacity, to obtain the battery capacity value, please refer to the relevant contents proposed by Tang et al. in paper [12].
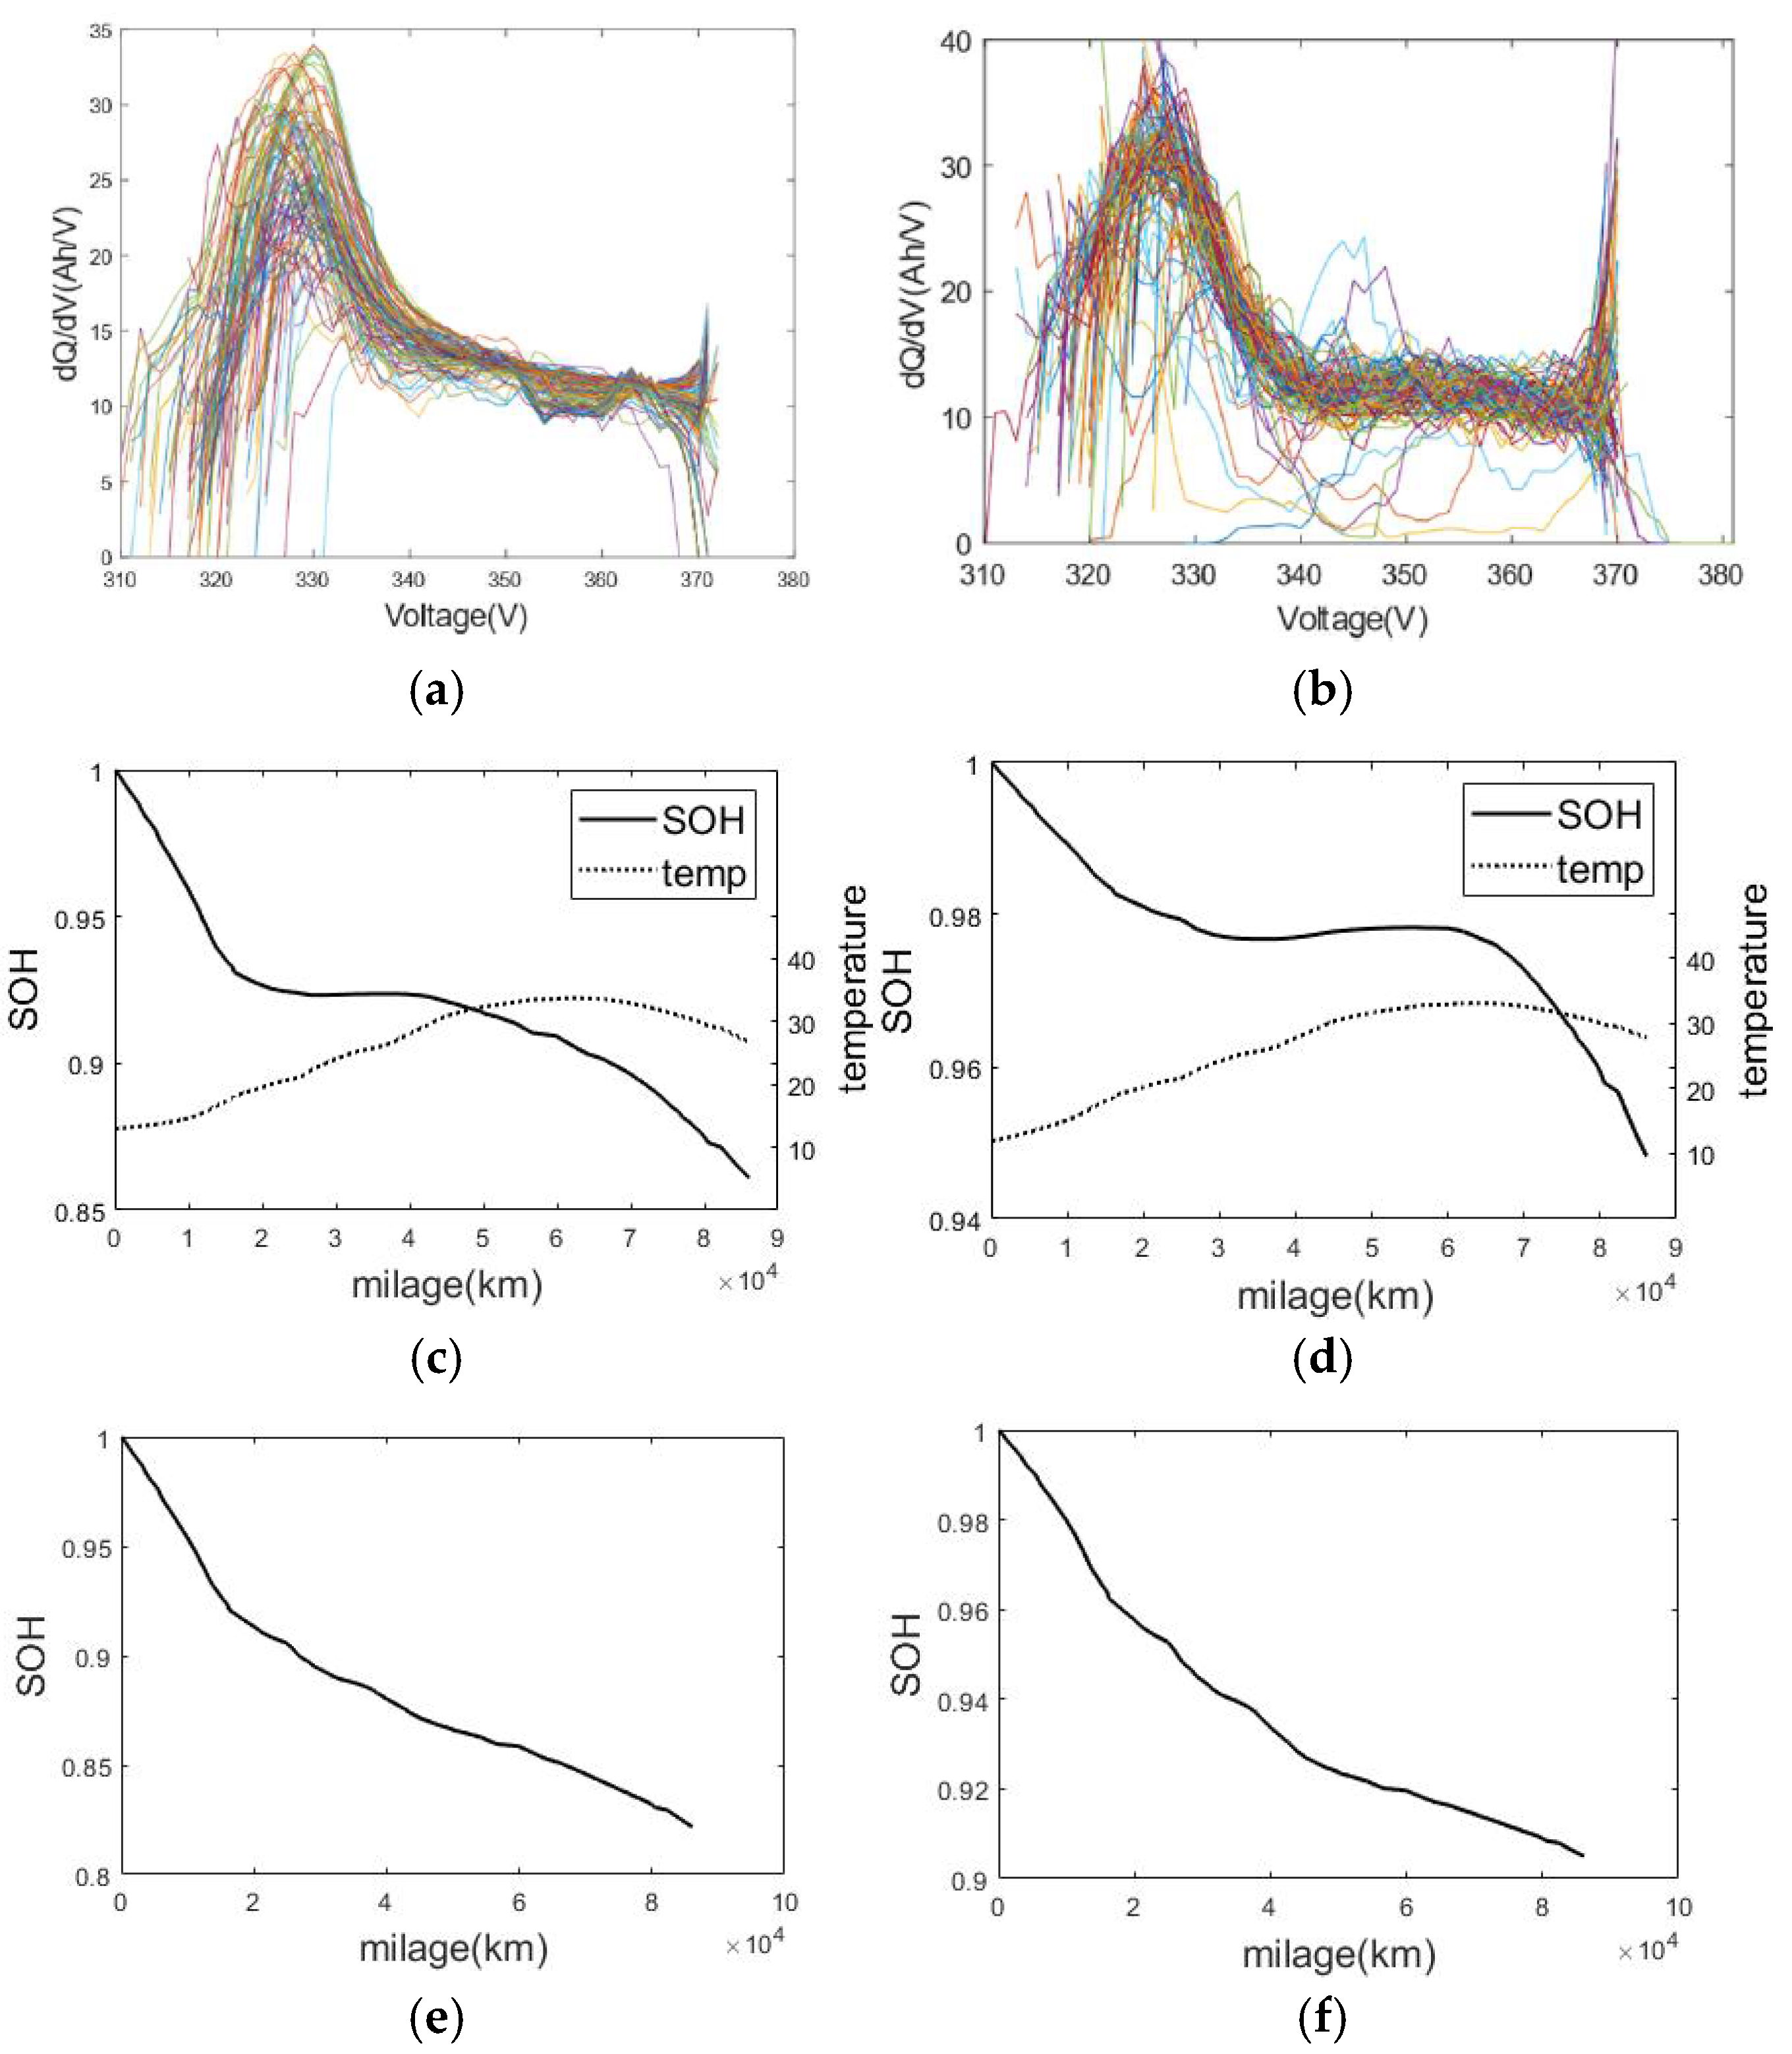
Based on the method designed in this paper, the OCV data of the battery can be extracted. Figure 6a,b show the increment capacity curve of each charge/discharge segment; due to the chaotic real vehicle data, there is a lot of noise in the IC curve. It can be seen that the increment capacity of the battery between 320 V and 330 V increases, indicating that the voltage is charged with more capacity in this interval. Figure 6c,d show the results of the battery SOH estimation without correction. Based on the results, it can be seen that the battery temperature has a great influence on the SOH indicator. Figure 6e,f are the battery pack SOH estimation results after temperature correction. It can be seen that battery pack SOH declined obvious with the electric vehicle milage increase. Moreover, it can be seen from the results that both the results of charging data and discharging data are consistent.

4.2. Battery Pack SOH Prediction Results

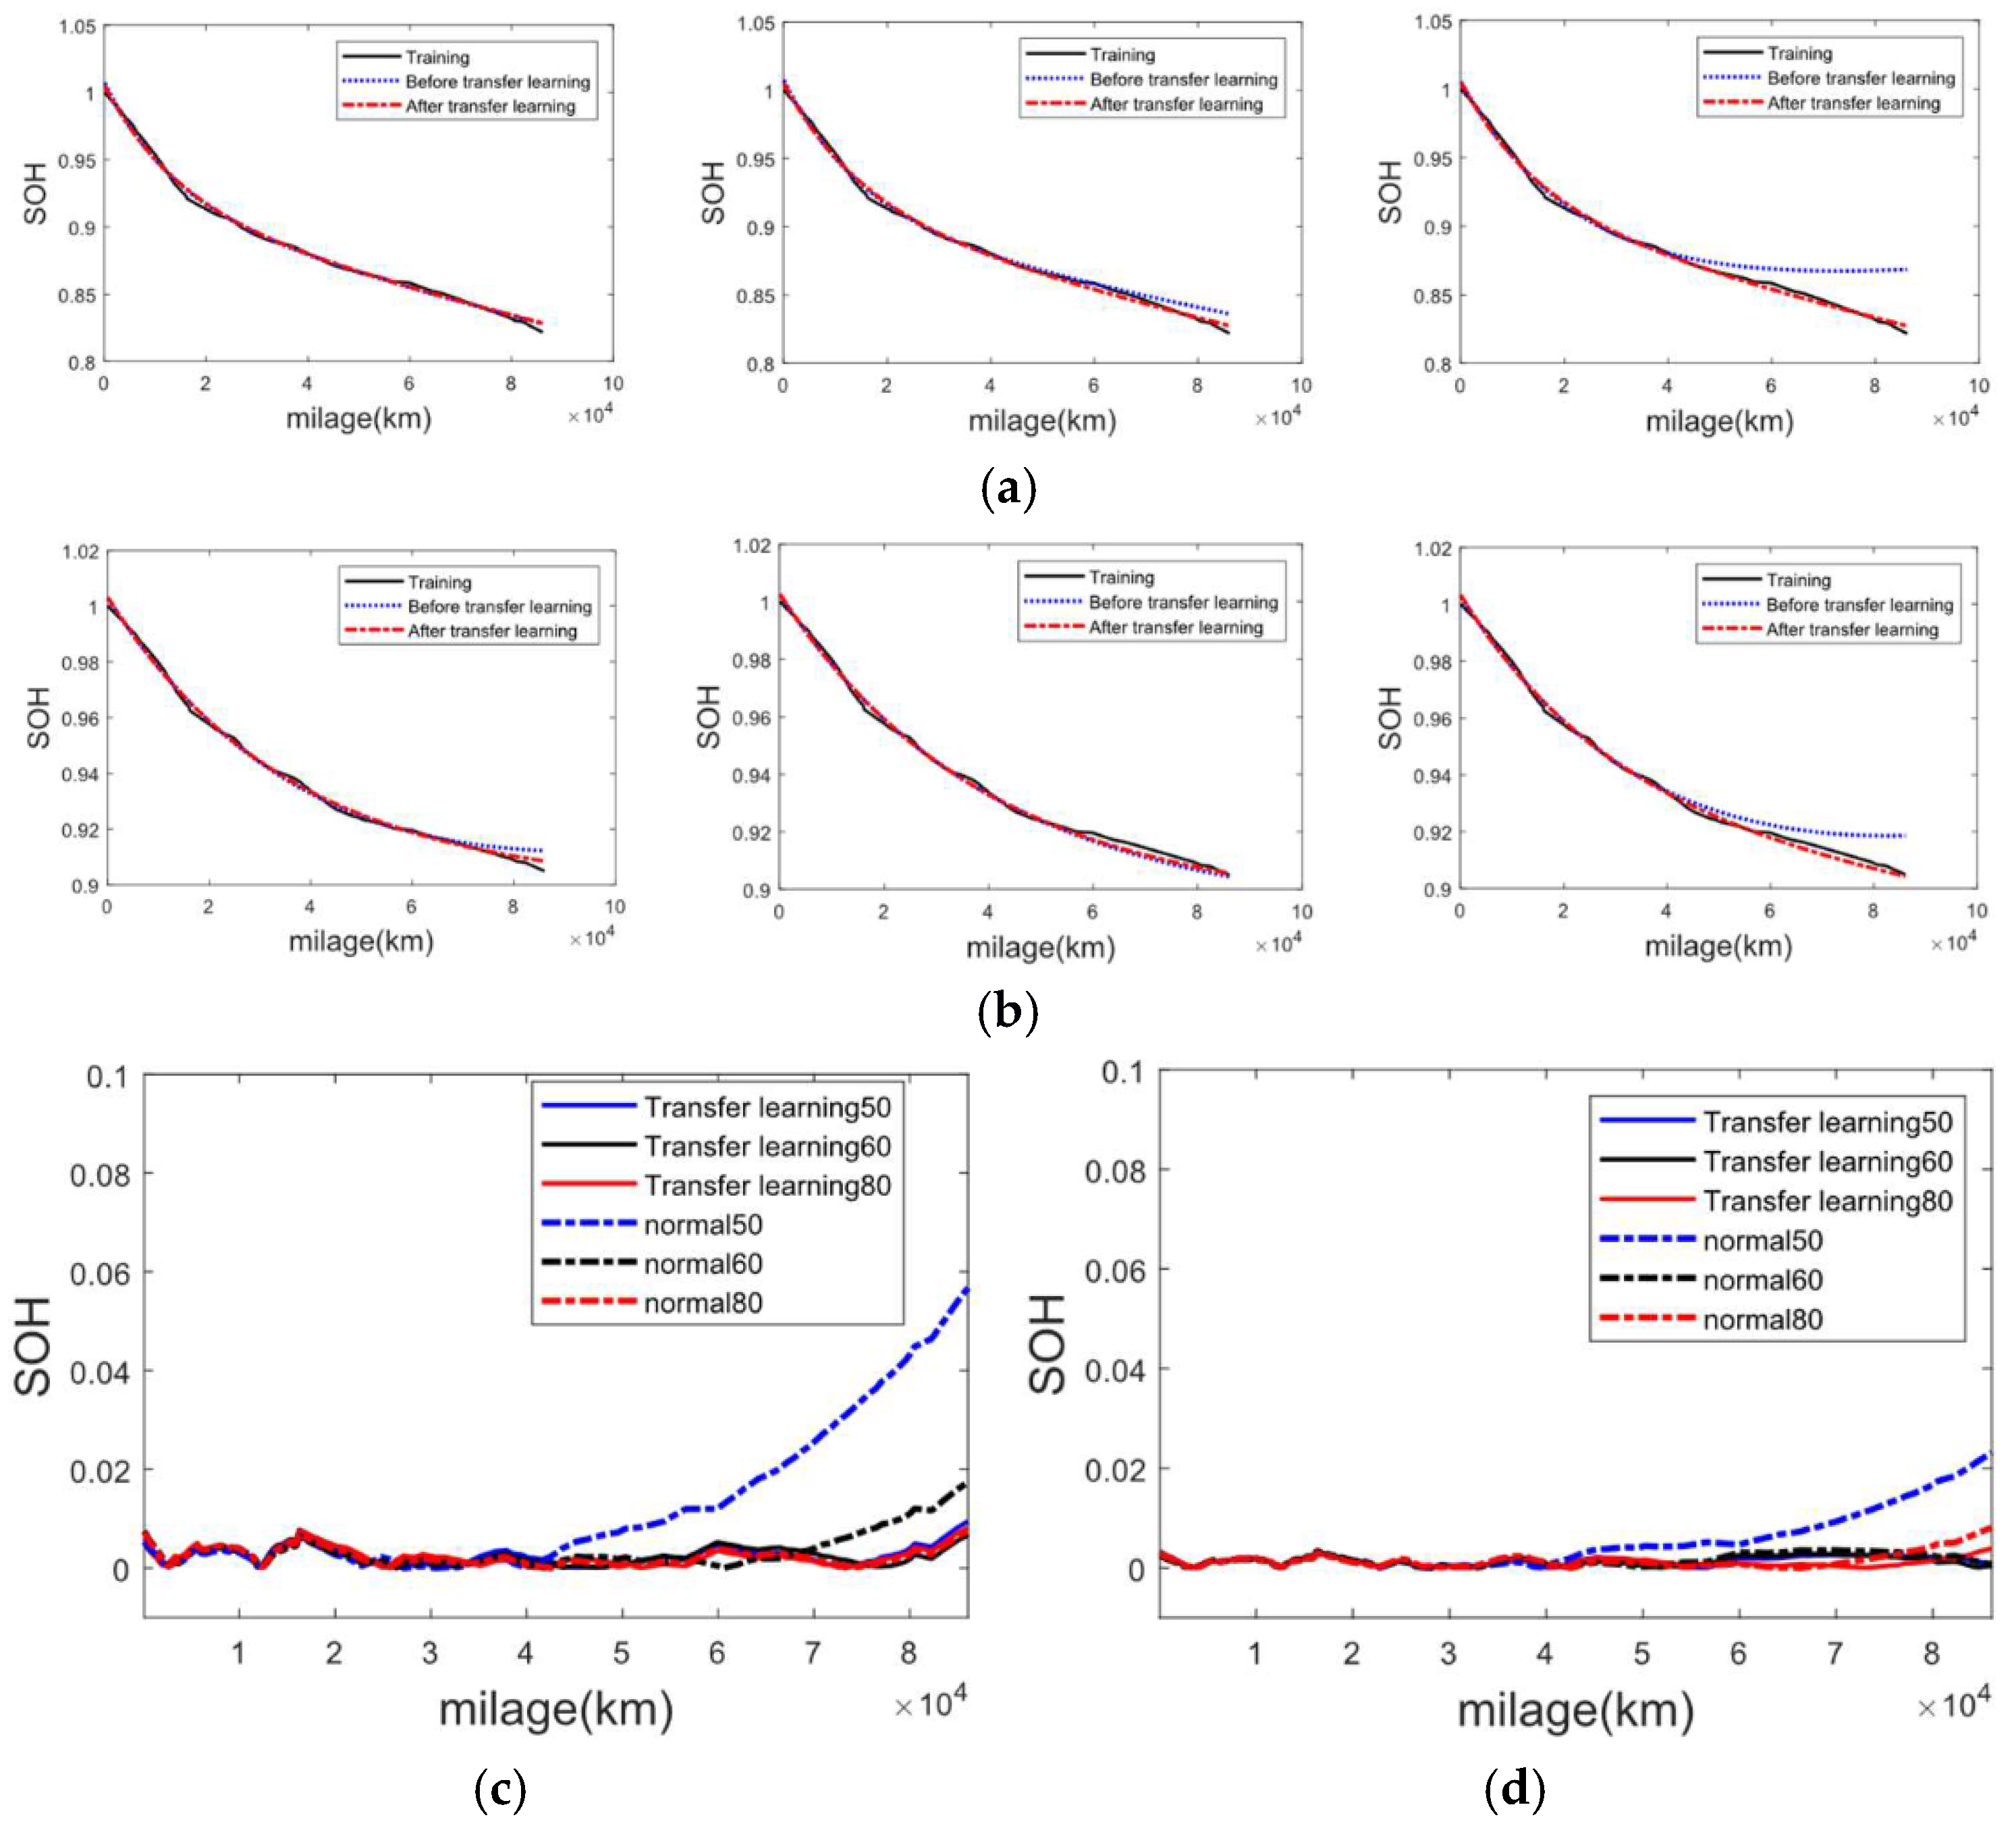
Herein, the temperature corrected SOH is regarded as the reference battery pack SOH. Based on an electric vehicle data with 1.5 years’ usage, there are 105 battery pack SOH points can be obtained. The vehicle mileage ranges from 0 km to 90,000 km. In order to evaluate the effectiveness of SOH prediction method, the first 80, 60 and 50 SOH point were selected as training sets, respectively. The following 25, 45 and 55 SOH points are adopted as the test set to evaluate the model accuracy. The SOH prediction results based the charge data and discharging data are shown in Figure 7. Figure 7a,b shows the results of ordinary fitting and transfer learning. It can be seen that the battery pack SOH prediction results can track the change trend of real data well. For original battery pack model, the relative errors of test sets with 80, 60, and 50 points using the ordinary fitting method are, respectively, 1.0%, 3.1%, 5.7%. However, considering the migration learning approach, the errors of the results obtained with the migration battery pack model and PSO method are below 1.5%. The results show the method proposed in this paper is very suitable for real vehicle applications.

5. Conclusions

In this paper, the battery system data collected on the electric vehicle data management platform is used to model the battery pack state of health of the electric vehicle during charging and discharging processes. The increment in capacity in the same voltage range is used as the battery state of health indicator. The influence of ambient temperature on the capacity performance of the battery pack is also considered in the method. The double polynomial model and the particle swarm optimization algorithm is used to obtain battery pack SOH. Based on an electric vehicle data with one and a half years’ usage, the proposed method can obtain accurate battery pack SOH prediction result. The errors of the results obtained with the migration battery pack model and PSO method are below 1.5%.
In future research, we will further improve the model, such as considering the use of battery aging mechanism model to make the prediction results more convincing. In addition, we also want to verify the method more comprehensively.

Author Contributions

Conceptualization, X.L.; methodology, software, data curation, and validation, X.L., T.W. and C.W.; formal analysis, X.L., J.T. and Y.T.; investigation, C.W.; resources, J.T., Y.T. and X.L.; All authors have read and agreed to the published version of the manuscript.

Funding

This work was supported by the Natural Science Foundation of Guangdong Province (2021A1515010525), the National Natural Science Foundation of China (No. 51807121).

Conflicts of Interest

The authors declare no conflict of interest. The funders had no role in the design of the study; in the collection, analyses, or interpretation of data; in the writing of the manuscript; or in the decision to publish the results.

References

  1. Severson, K.A.; Attia, P.M.; Jin, N.; Perkins, N.; Jiang, B.; Yang, Z.; Chen, M.H.; Aykol, M.; Herring, P.K.; Fraggedakis, D.; et al. Data-driven prediction of battery cycle life before capacity degradation. Nat. Energy 2019, 4, 383–391. [Google Scholar] [CrossRef] [Green Version]
  2. Dubarry, M.; Berecibar, M.; Devie, A.; Anseán, D.; Omar, N.; Villarreal, I. State of health battery estimator enabling degradation diagnosis: Model and algorithm description. J. Power Sources 2017, 360, 59–69. [Google Scholar] [CrossRef]
  3. Togasaki, N.; Yokoshima, T.; Oguma, Y.; Osaka, T. Prediction of overcharge-induced serious capacity fading in nickel cobalt aluminum oxide lithium-ion batteries using electrochemical impedance spectroscopy. J. Power Sources 2020, 461, 228168. [Google Scholar] [CrossRef]
  4. Popp, H.; Koller, M.; Keller, S.; Glanz, G.; Klambauer, R.; Bergmann, A. State Estimation Approach of Lithium-Ion Batteries by Simplified Ultrasonic Time-of-Flight Measurement. IEEE Access 2019, 7, 170992–171000. [Google Scholar] [CrossRef]
  5. Xia, Q.; Yang, D.; Wang, Z.; Ren, Y.; Sun, B.; Feng, Q.; Qian, C. Multiphysical modeling for life analysis of lithium-ion battery pack in electric vehicles. Renew. Sustain. Energy Rev. 2020, 131, 109993. [Google Scholar] [CrossRef]
  6. Liu, D.; Song, Y.; Li, L.; Liao, H.; Peng, Y. On-line life cycle health assessment for lithium-ion battery in electric vehicles. J. Clean. Prod. 2018, 199, 1050–1065. [Google Scholar] [CrossRef]
  7. Xiao, W.; Zhong, W.; Shu, X.; An, J.; Yuan, X. Battery state of health (SOH) estimation method and application based on big data. J. Automot. Saf. Energy 2019, 10, 101–105. [Google Scholar] [CrossRef]
  8. Chen, M.; Wu, J.; Jiao, C.; Chen, J.; Zhang, Z. Multi-Factor online estimation method for health status of lithium-ion battery. J. Xi’an Jiaotong Univ. 2020, 54, 169–175. [Google Scholar] [CrossRef]
  9. Li, M. Research on the Health Status of Electric Vehicle Power Battery Based on Data Mining. Master’s Thesis, Shanghai Jiaotong University, Shanghai, China, 2018. [Google Scholar] [CrossRef]
  10. Xu, C.; Li, L.; Yang, Y. Health state estimation of lithium-ion battery based on improved particle filter. Automot. Technol. 2020, 12, 19–24. [Google Scholar]
  11. Tang, X.; Zou, C.; Yao, K.; Lu, J.; Xia, Y.; Gao, F. Aging trajectory prediction for lithium-ion batteries via model migration and Bayesian Monte Carlo method. Appl. Energy 2019, 254, 254. [Google Scholar] [CrossRef] [Green Version]
  12. Tang, X.; Liu, K.; Li, K.; Widanage, W.D.; Kendrick, E.; Gao, F. Recovering large-scale battery aging dataset with machine learning. Gene Expr. Patterns 2021, 2, 100302. [Google Scholar] [CrossRef] [PubMed]
Figure 1. The SOC data acquired form NEVs, (a) before interpolation, (b) after interpolation.
Wevj 12 00204 g001
Figure 2. The capacity increment curves of the data segments for battery SOH calibration.
Wevj 12 00204 g002
Figure 3. The voltage and current data acquired form NEVs, (a) charging data; (b) discharging data.
Wevj 12 00204 g003
Figure 4. The first-order RC model.
Wevj 12 00204 g004
Figure 5. The Rint model with electrode open circuit voltages.
Wevj 12 00204 g005
Figure 6. Battery pack SOH calibration results, (a) general charging trend, (b) general discharging trend, (c) before temperature correction with charging data, (d) before temperature correction with discharging data; (e) after temperature correction with charging data; (f) after temperature correction with discharging data.
Wevj 12 00204 g006
Figure 7. Battery pack SOH prediction results, (a) training set using 80, 60 and 50 SOH points with charging data, (b) training set using 80, 60 and 50 SOH points with discharging data, (c) SOH prediction error with charging data and (d) discharging data.
Wevj 12 00204 g007
Publisher’s Note: MDPI stays neutral with regard to jurisdictional claims in published maps and institutional affiliations.