
Development of a Remote Monitoring System for Henhouse Environment Based on IoT Technology


Abstract
:1. Introduction
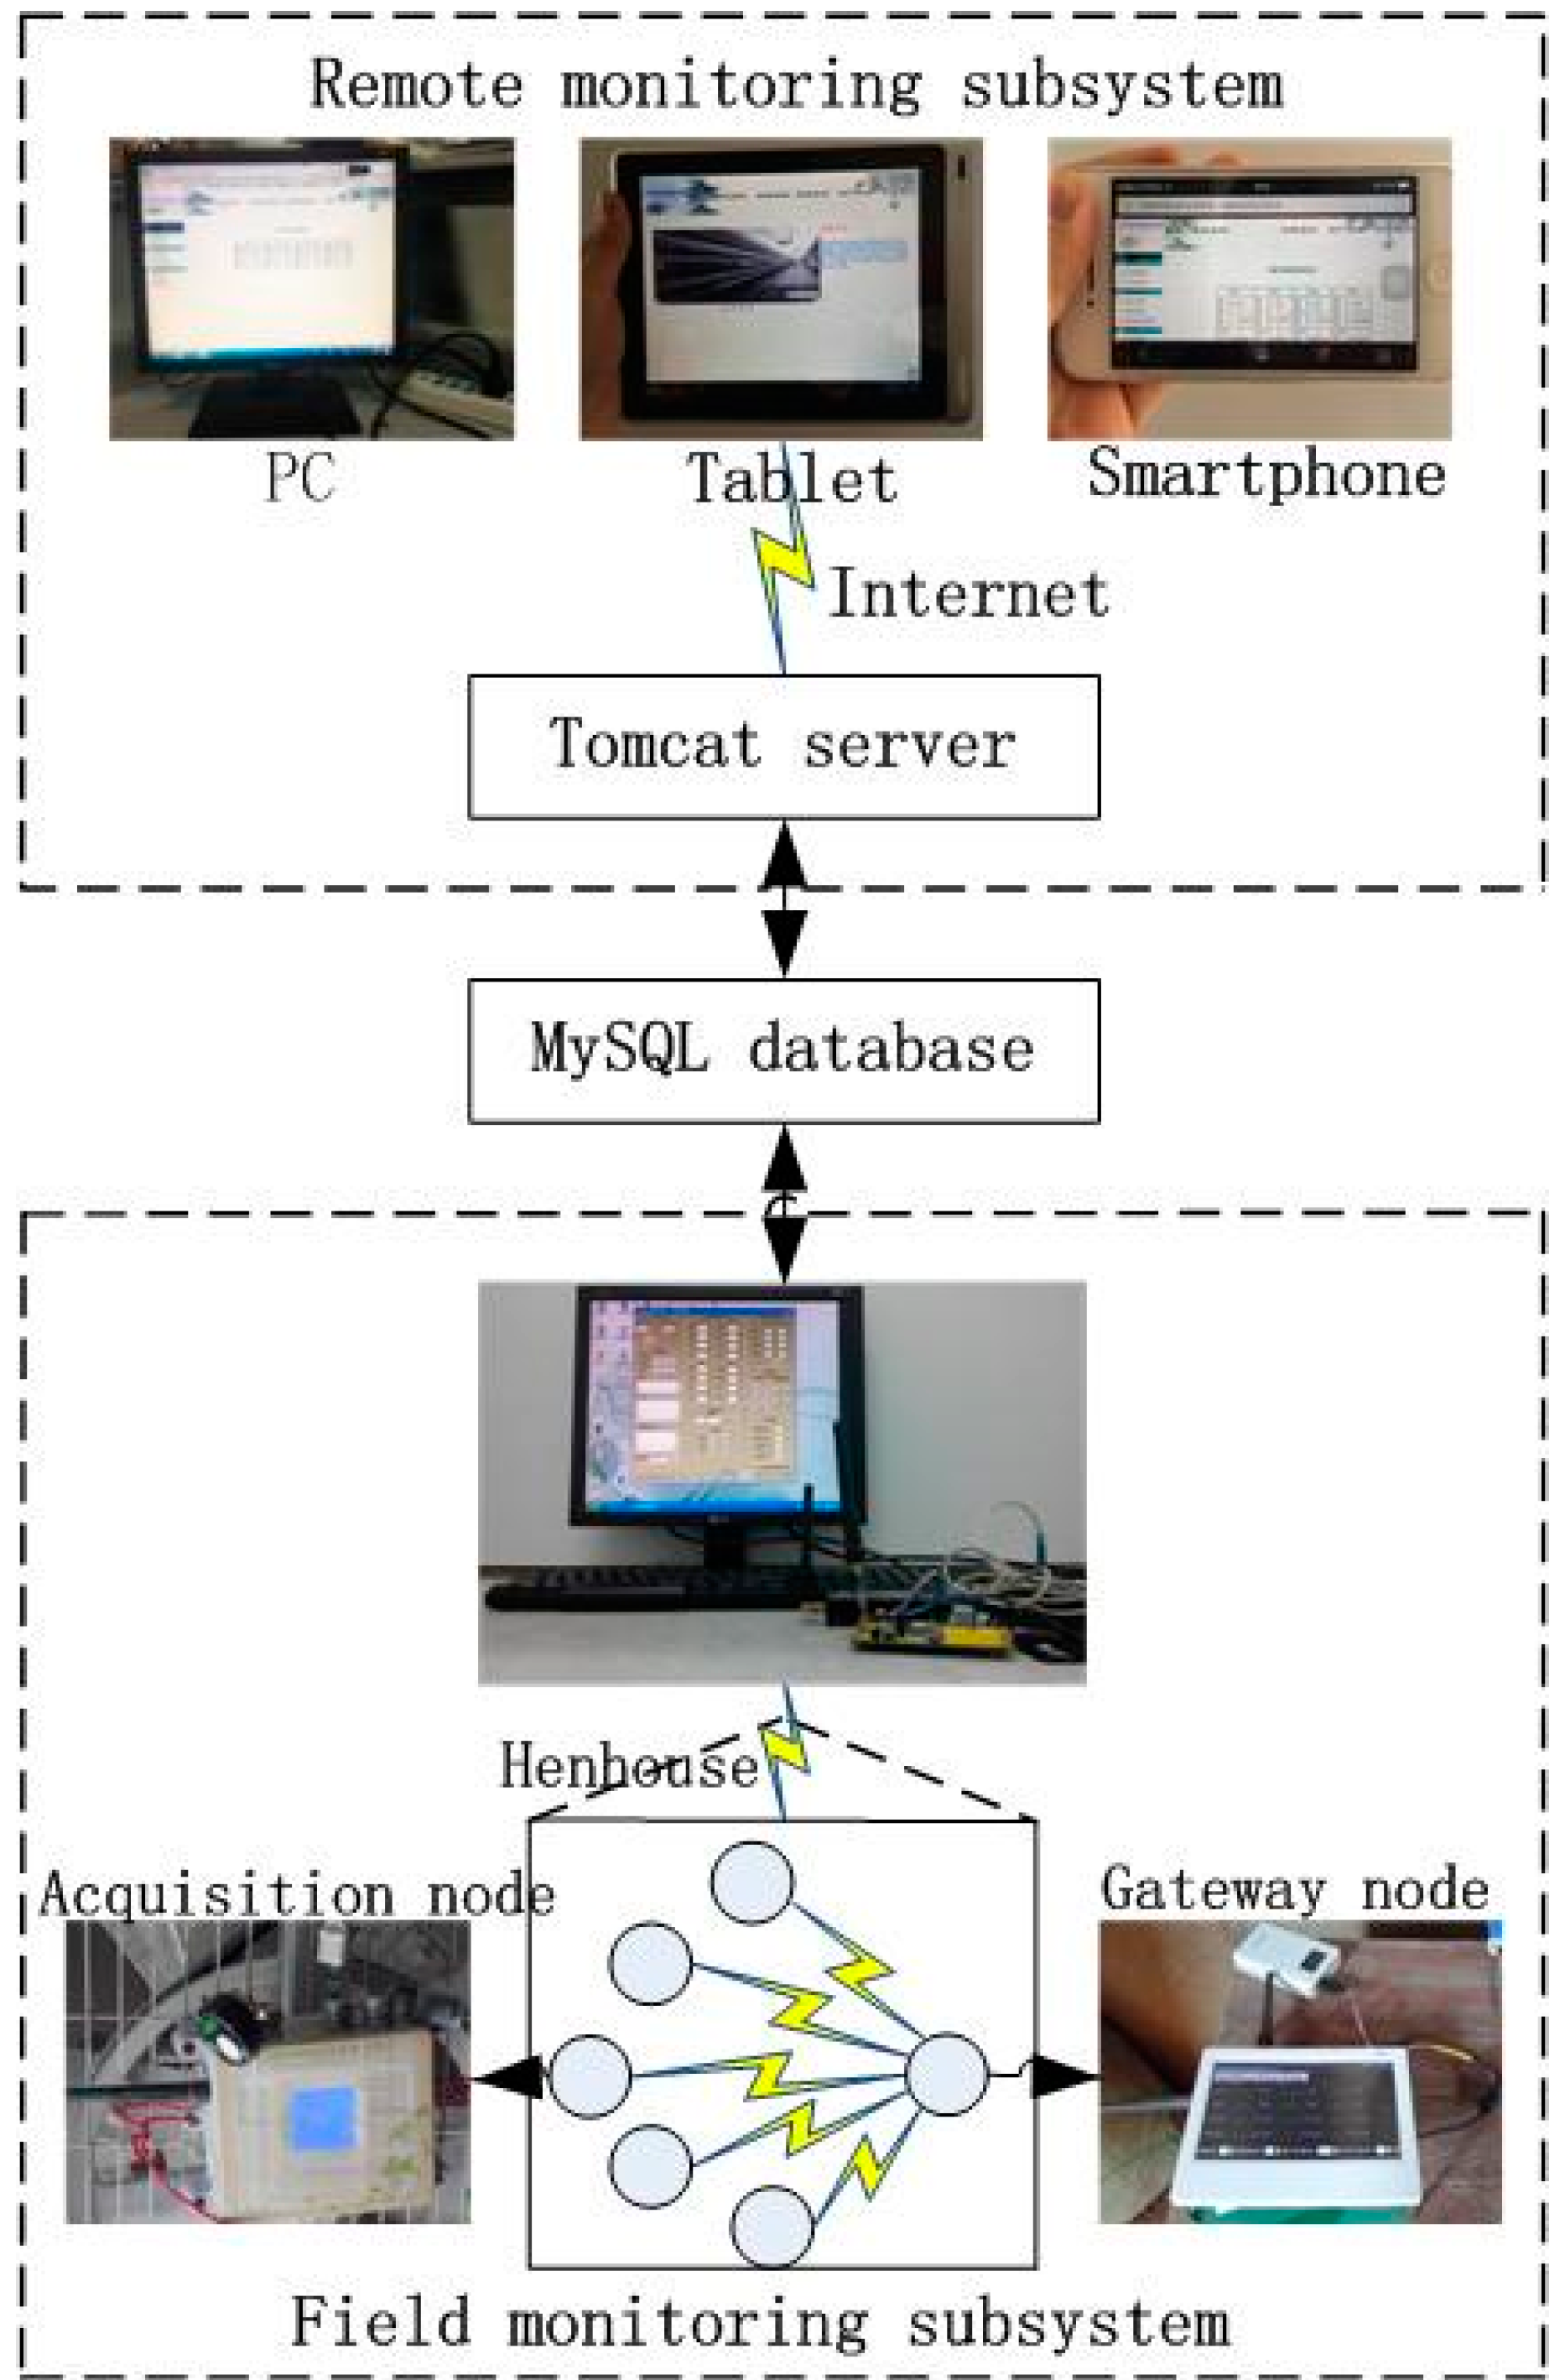
2. The Overall Architecture Design of the System

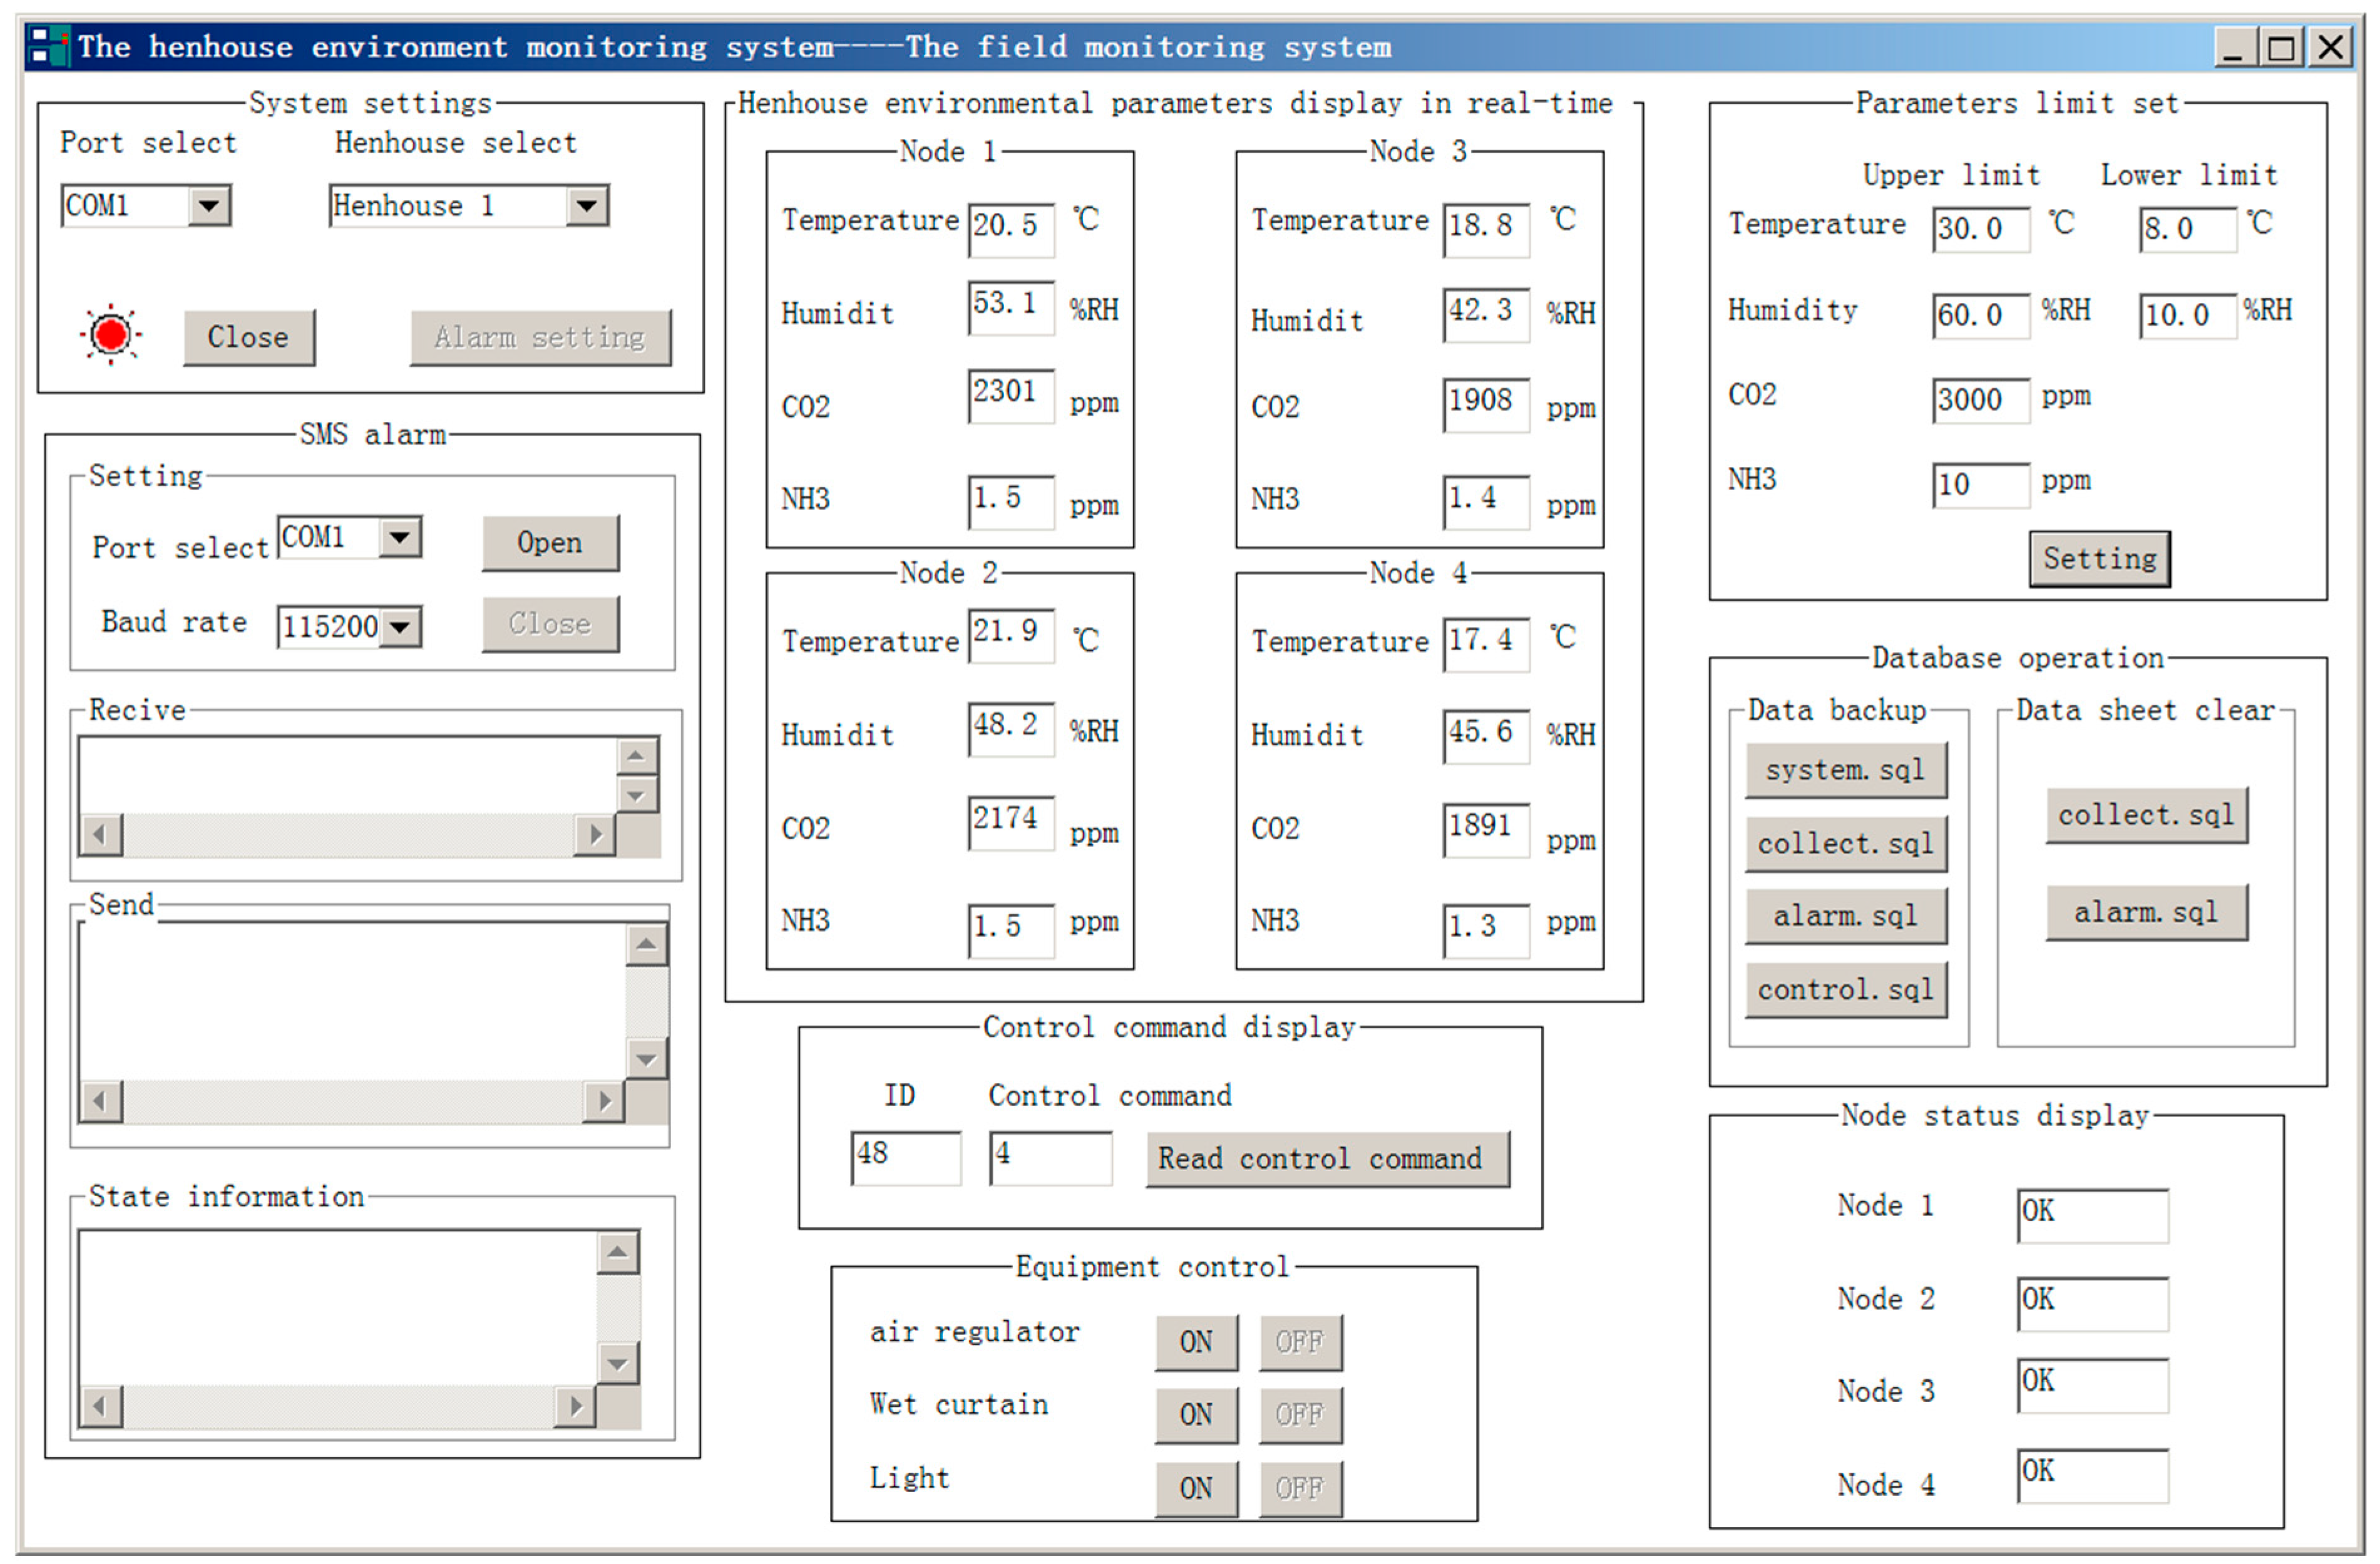
2.1. The Field Monitoring Subsystem
2.2. The Database Subsystem
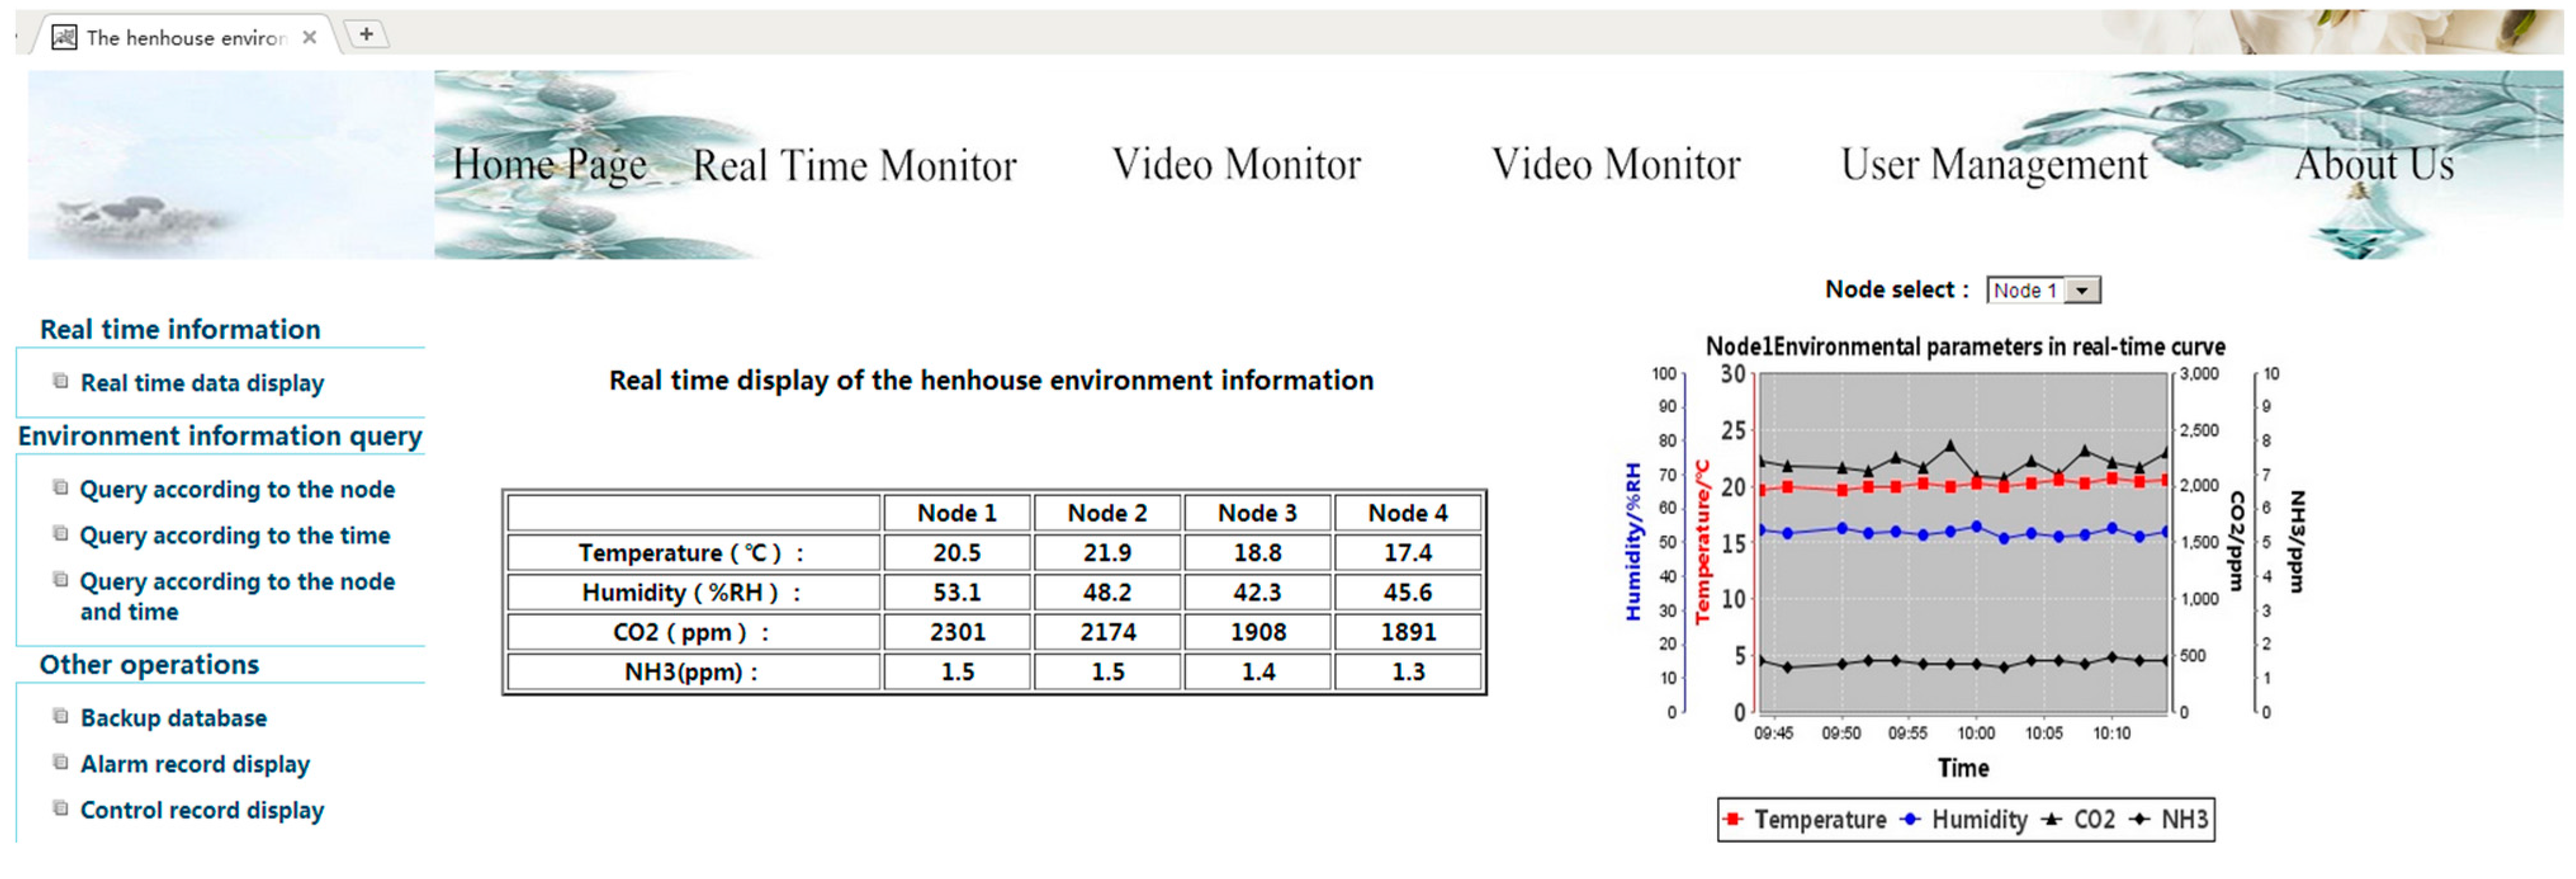
2.3. The Remote Monitoring Subsystem
3. Key Technologies Achieved by the System
3.1. Sensor Data Compensation and Correction
3.1.1. NH3 Concentration Compensation and Correction
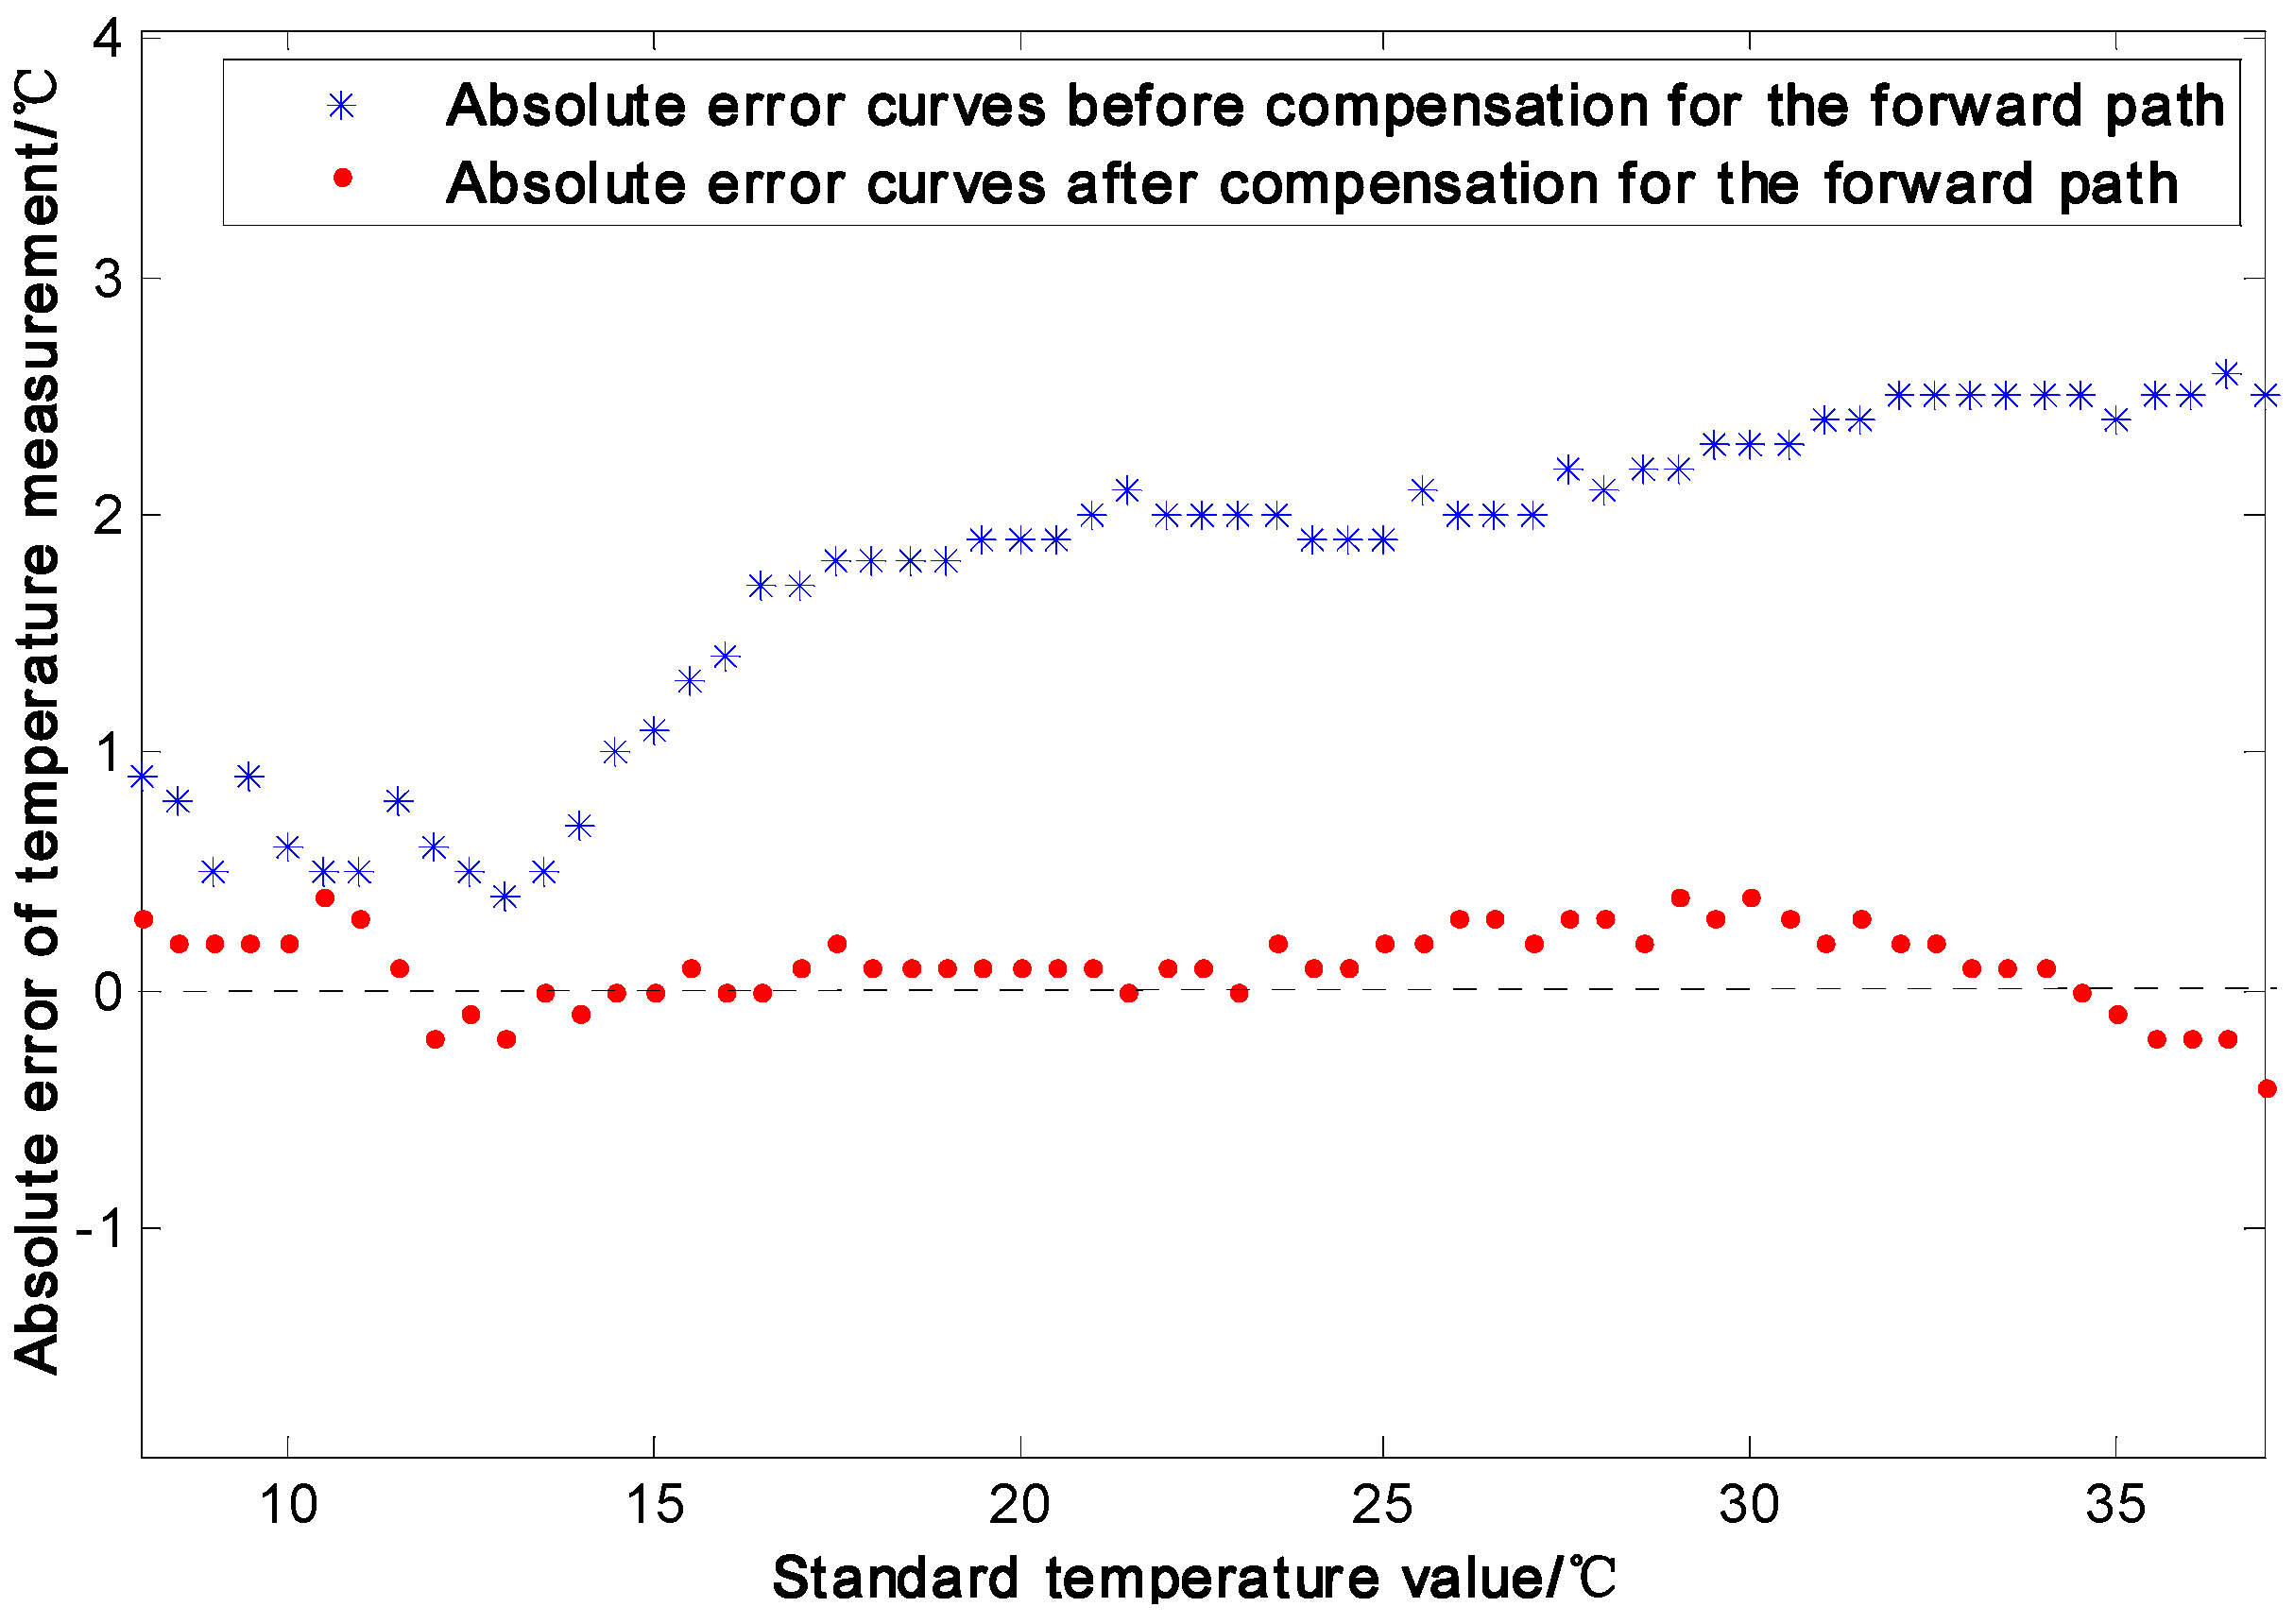
3.1.2. Temperature and Humidity Compensation and Correction
3.2. Design of Acquisition Data Reliable Transmission Based on a Loss Recovery Strategy
3.3. Duplicated Data Filtering and Missing Data On-line Filling
3.3.1. Multiple Regression Analysis Estimation Based on Spatial Correlation
3.3.2. Fitting-Interpolation Combinational Algorithm Estimation Based on Temporal Correlation
3.3.3. Algorithm Fusion and Implementation
4. System Application Experimentation and Analysis
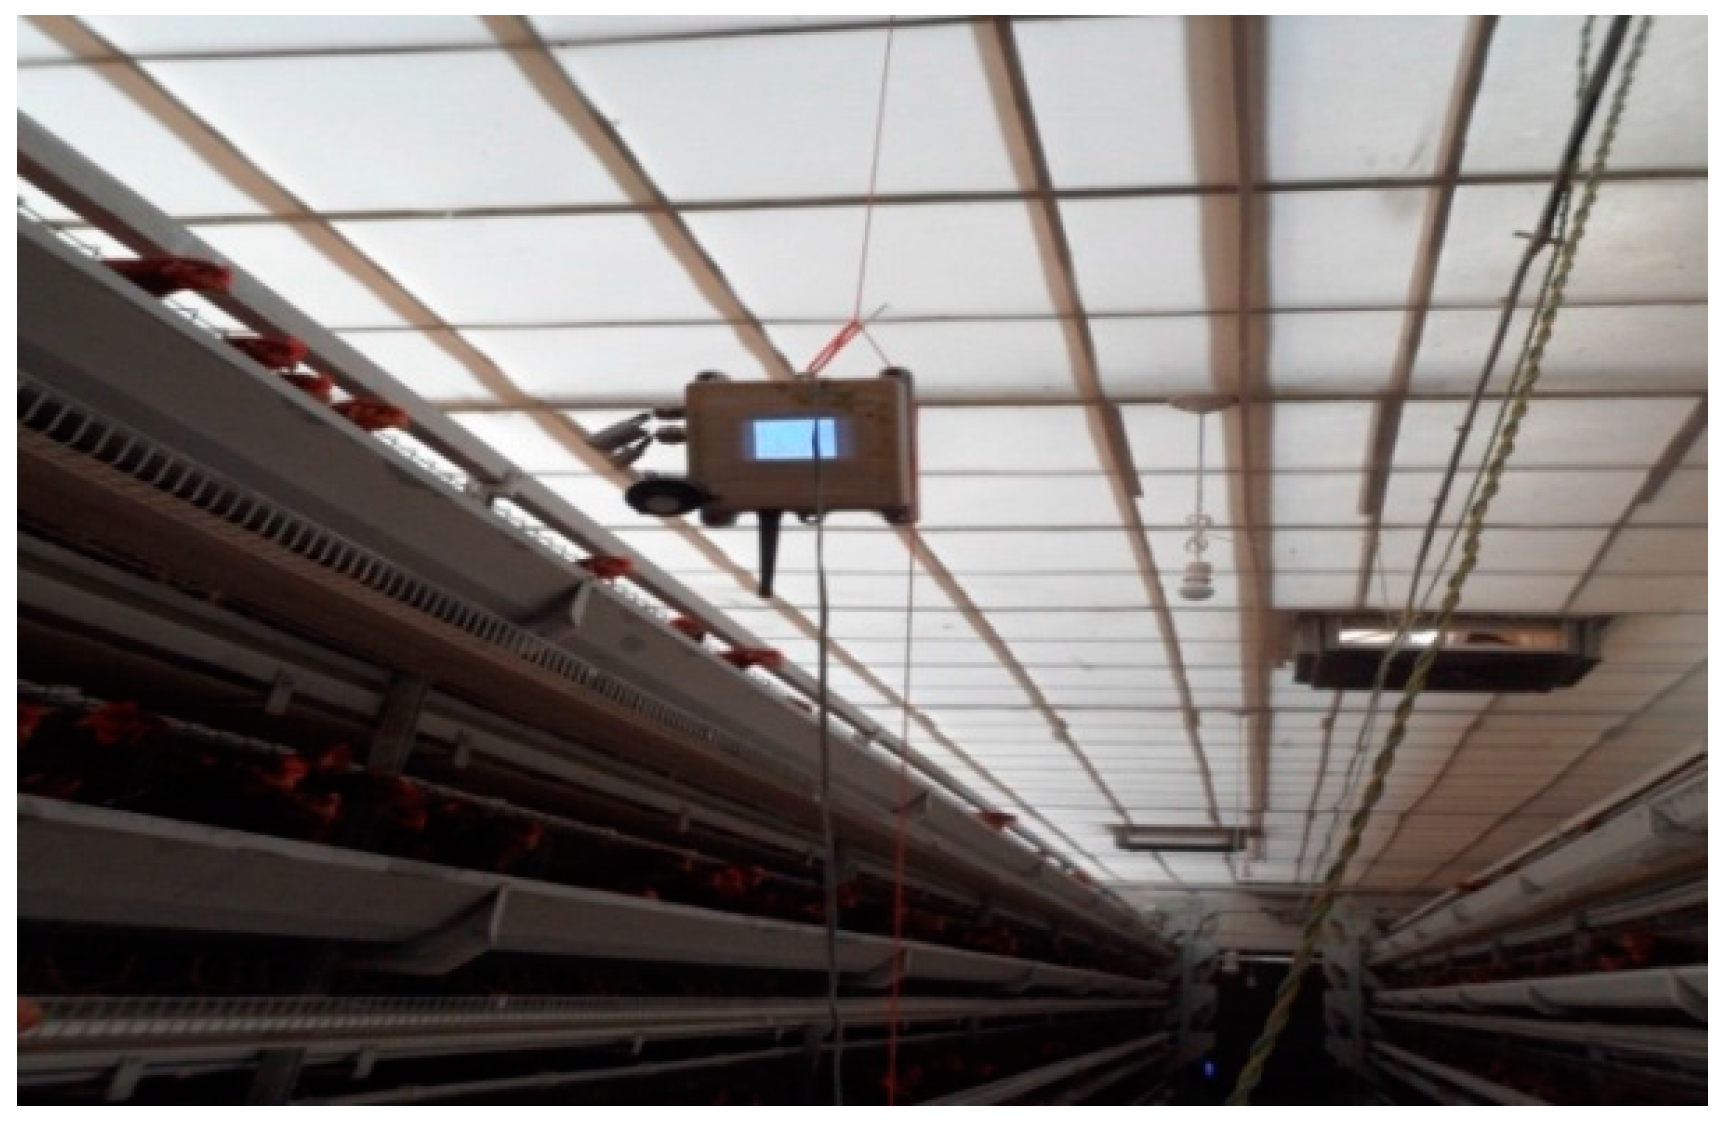
4.1. Experimental Conditions

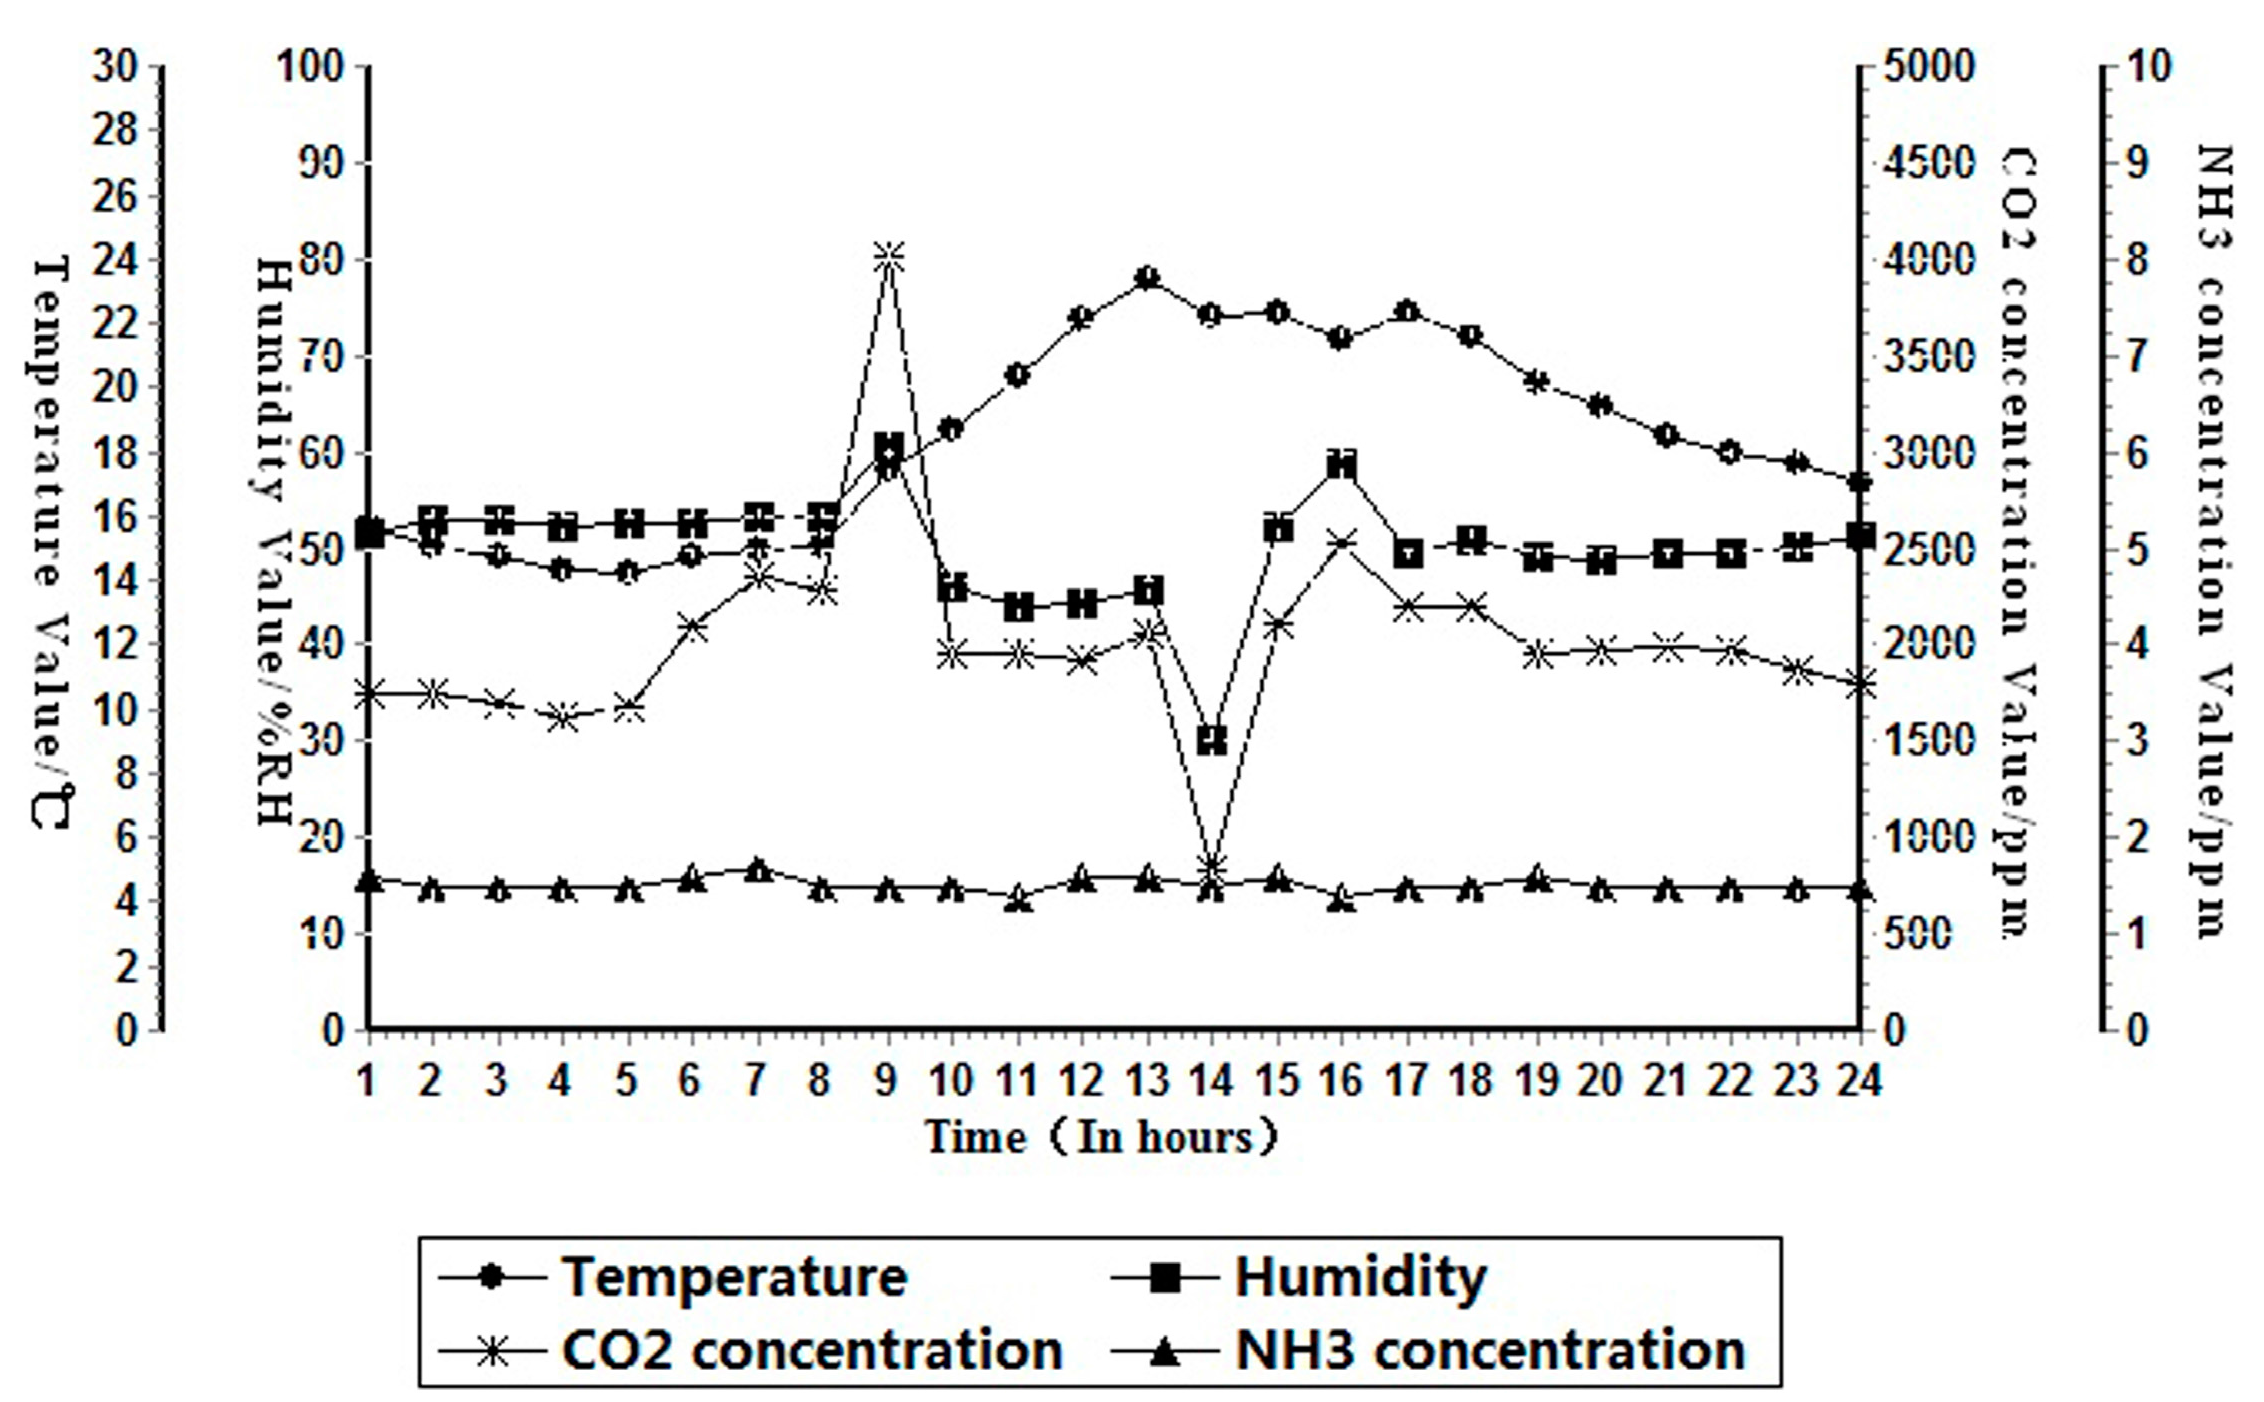
4.2. Pilot Run Results

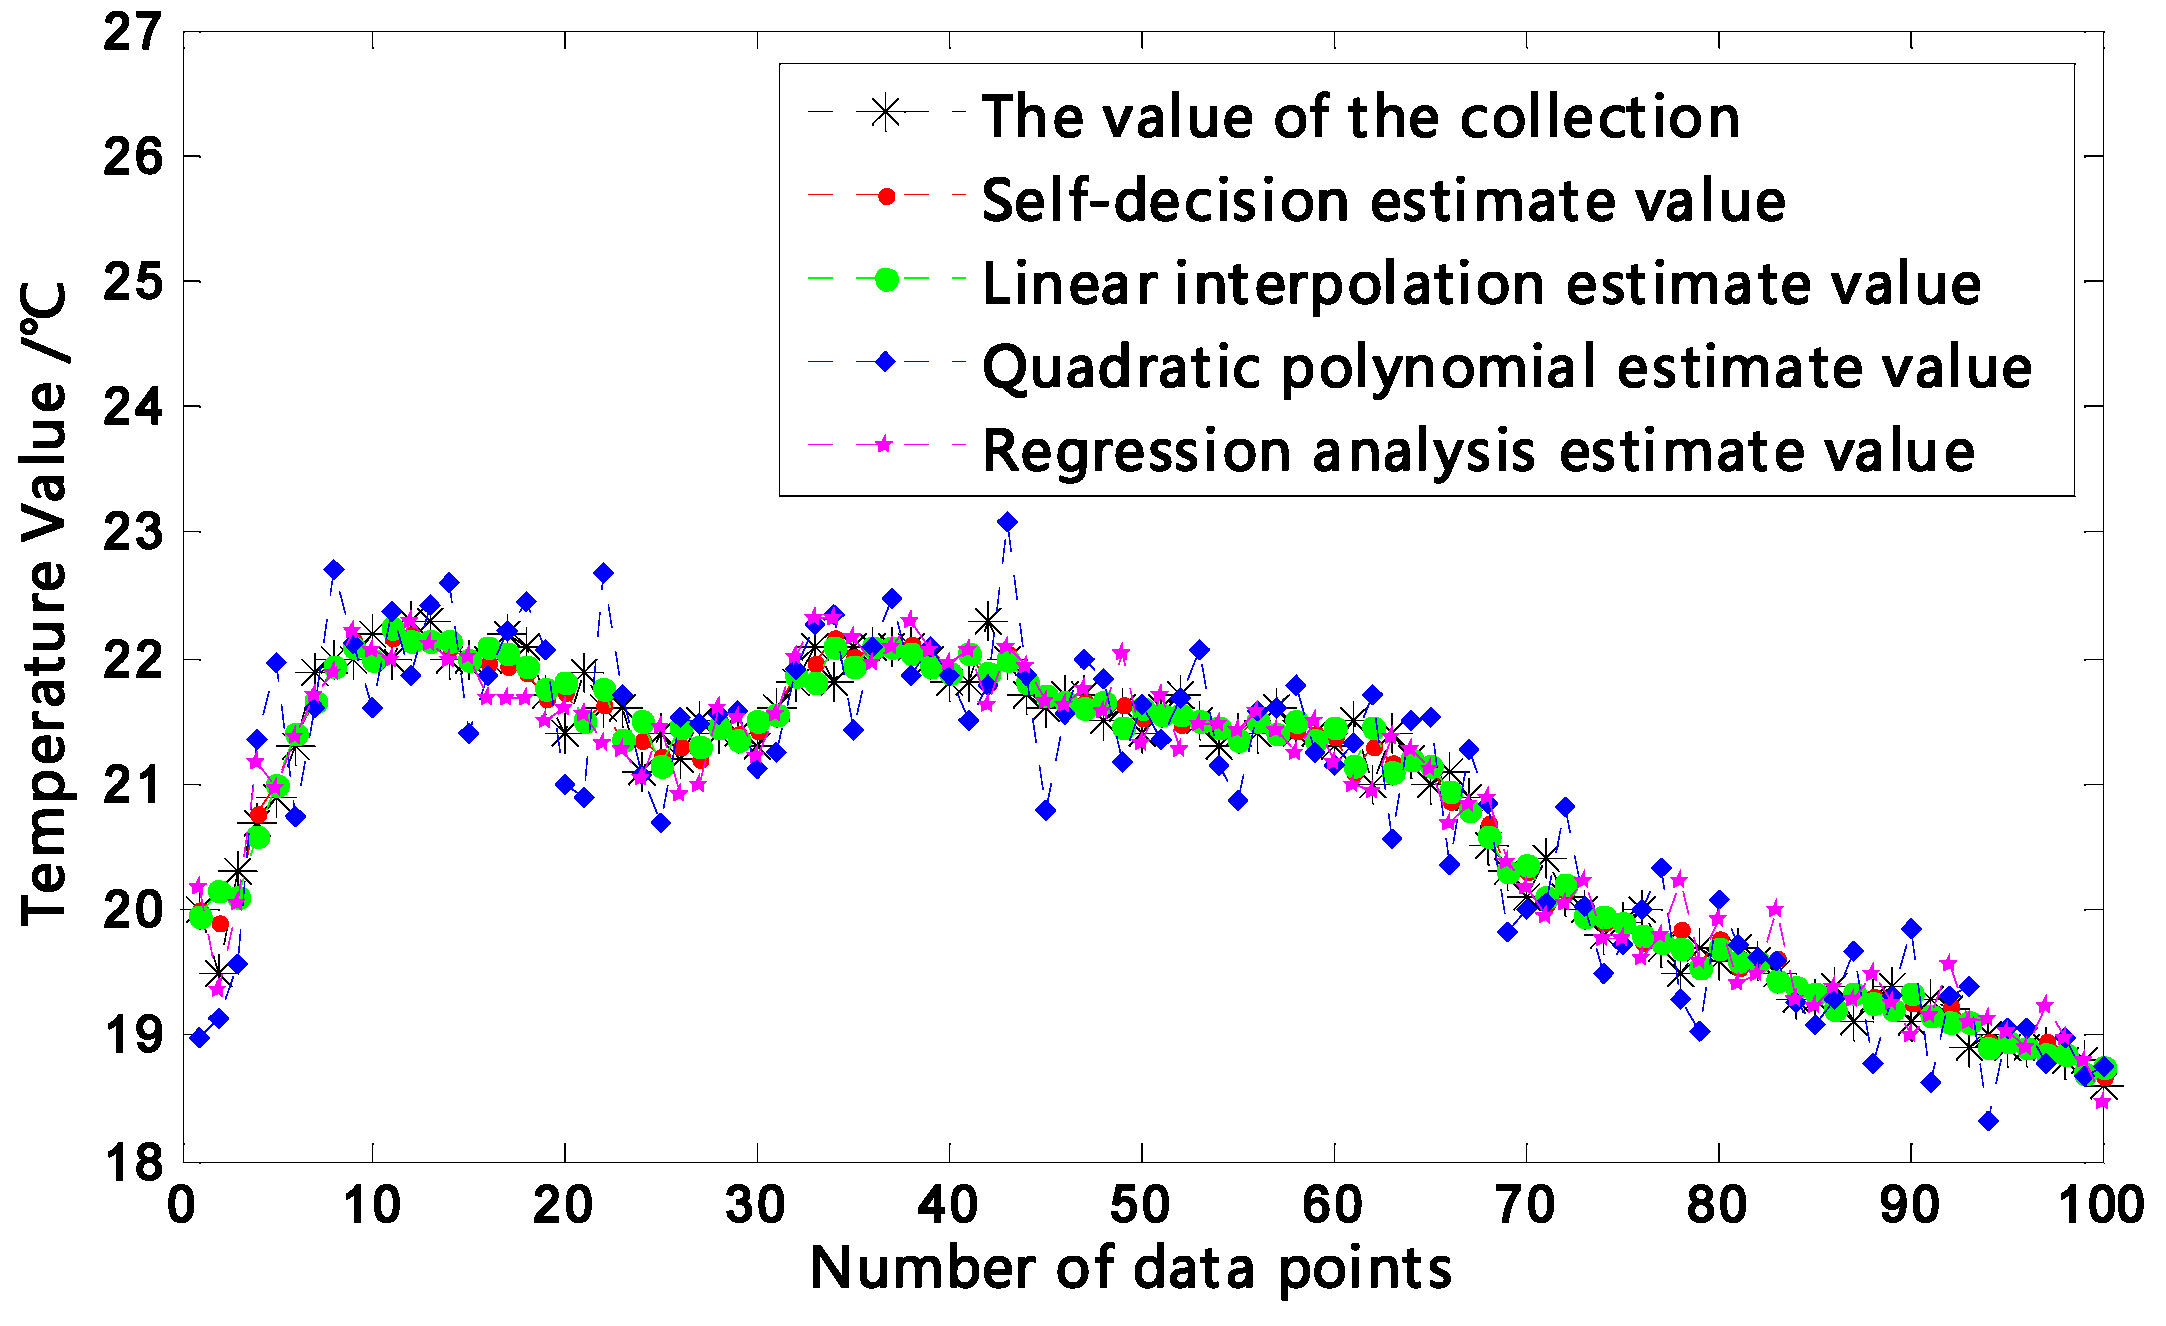
4.3. Experimentation on the Effectiveness of Data Estimation Using the Self-decision and Filling Method
4.3.1. Experimental Methods
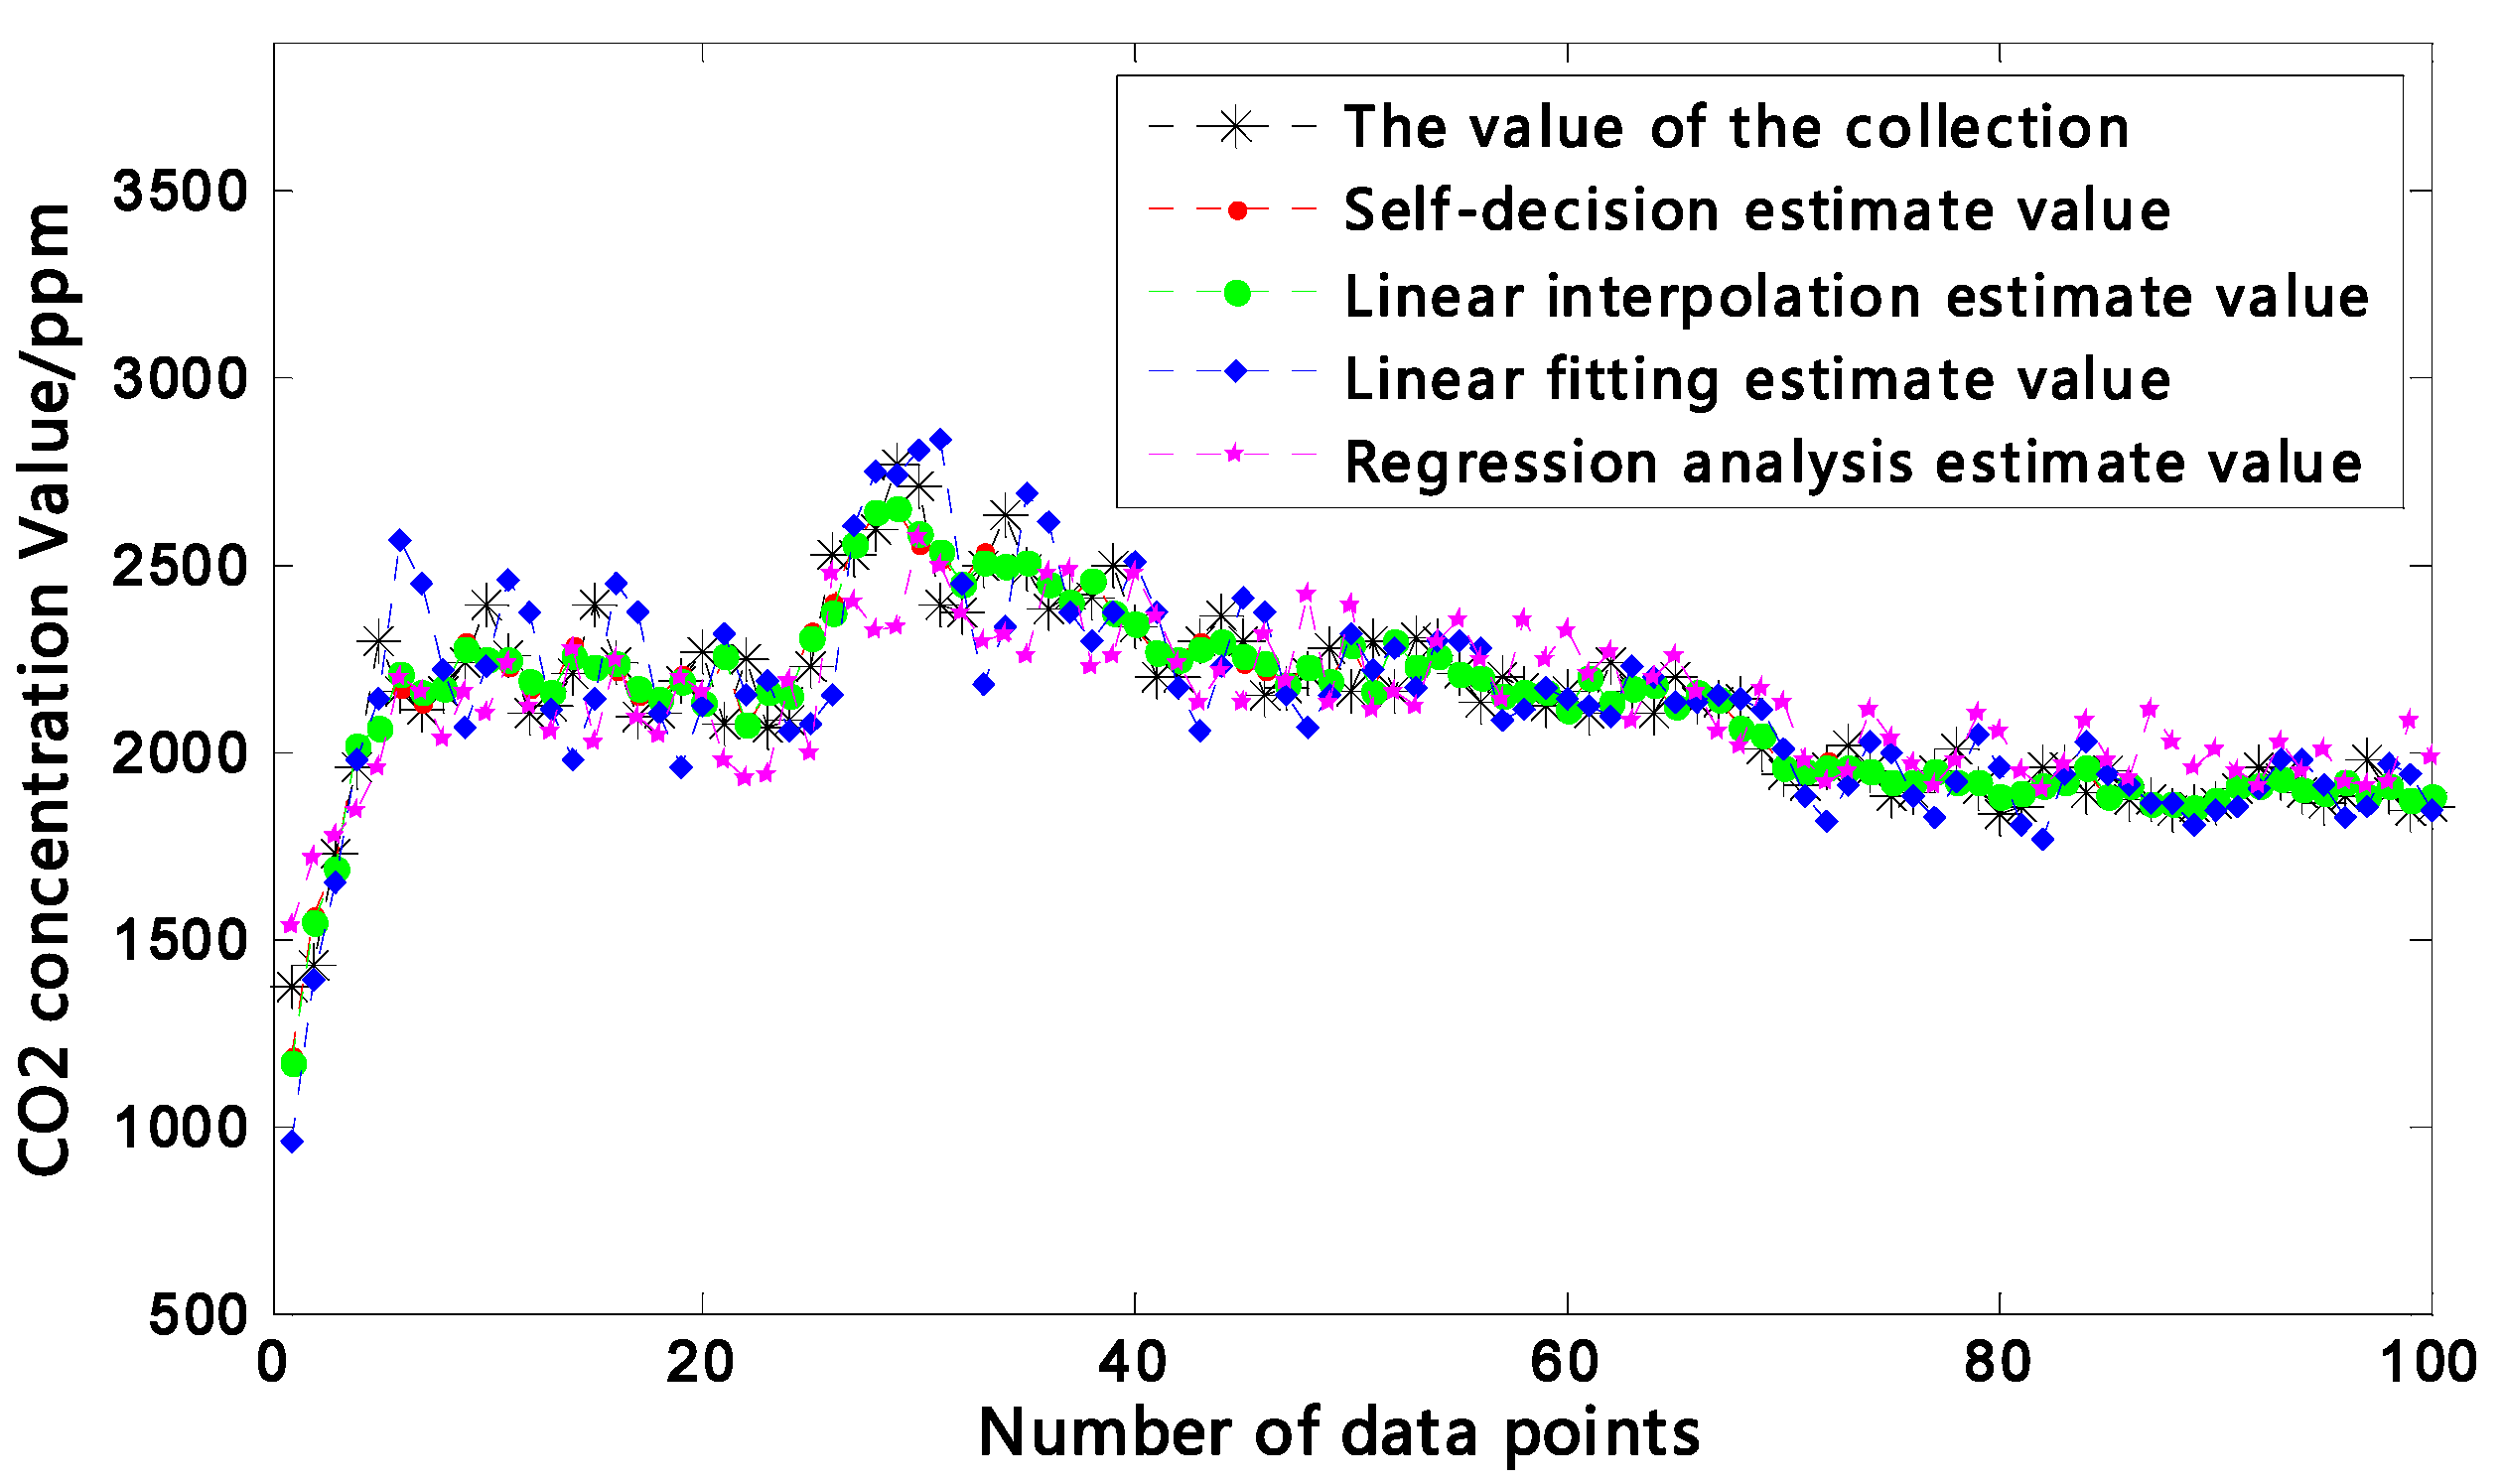
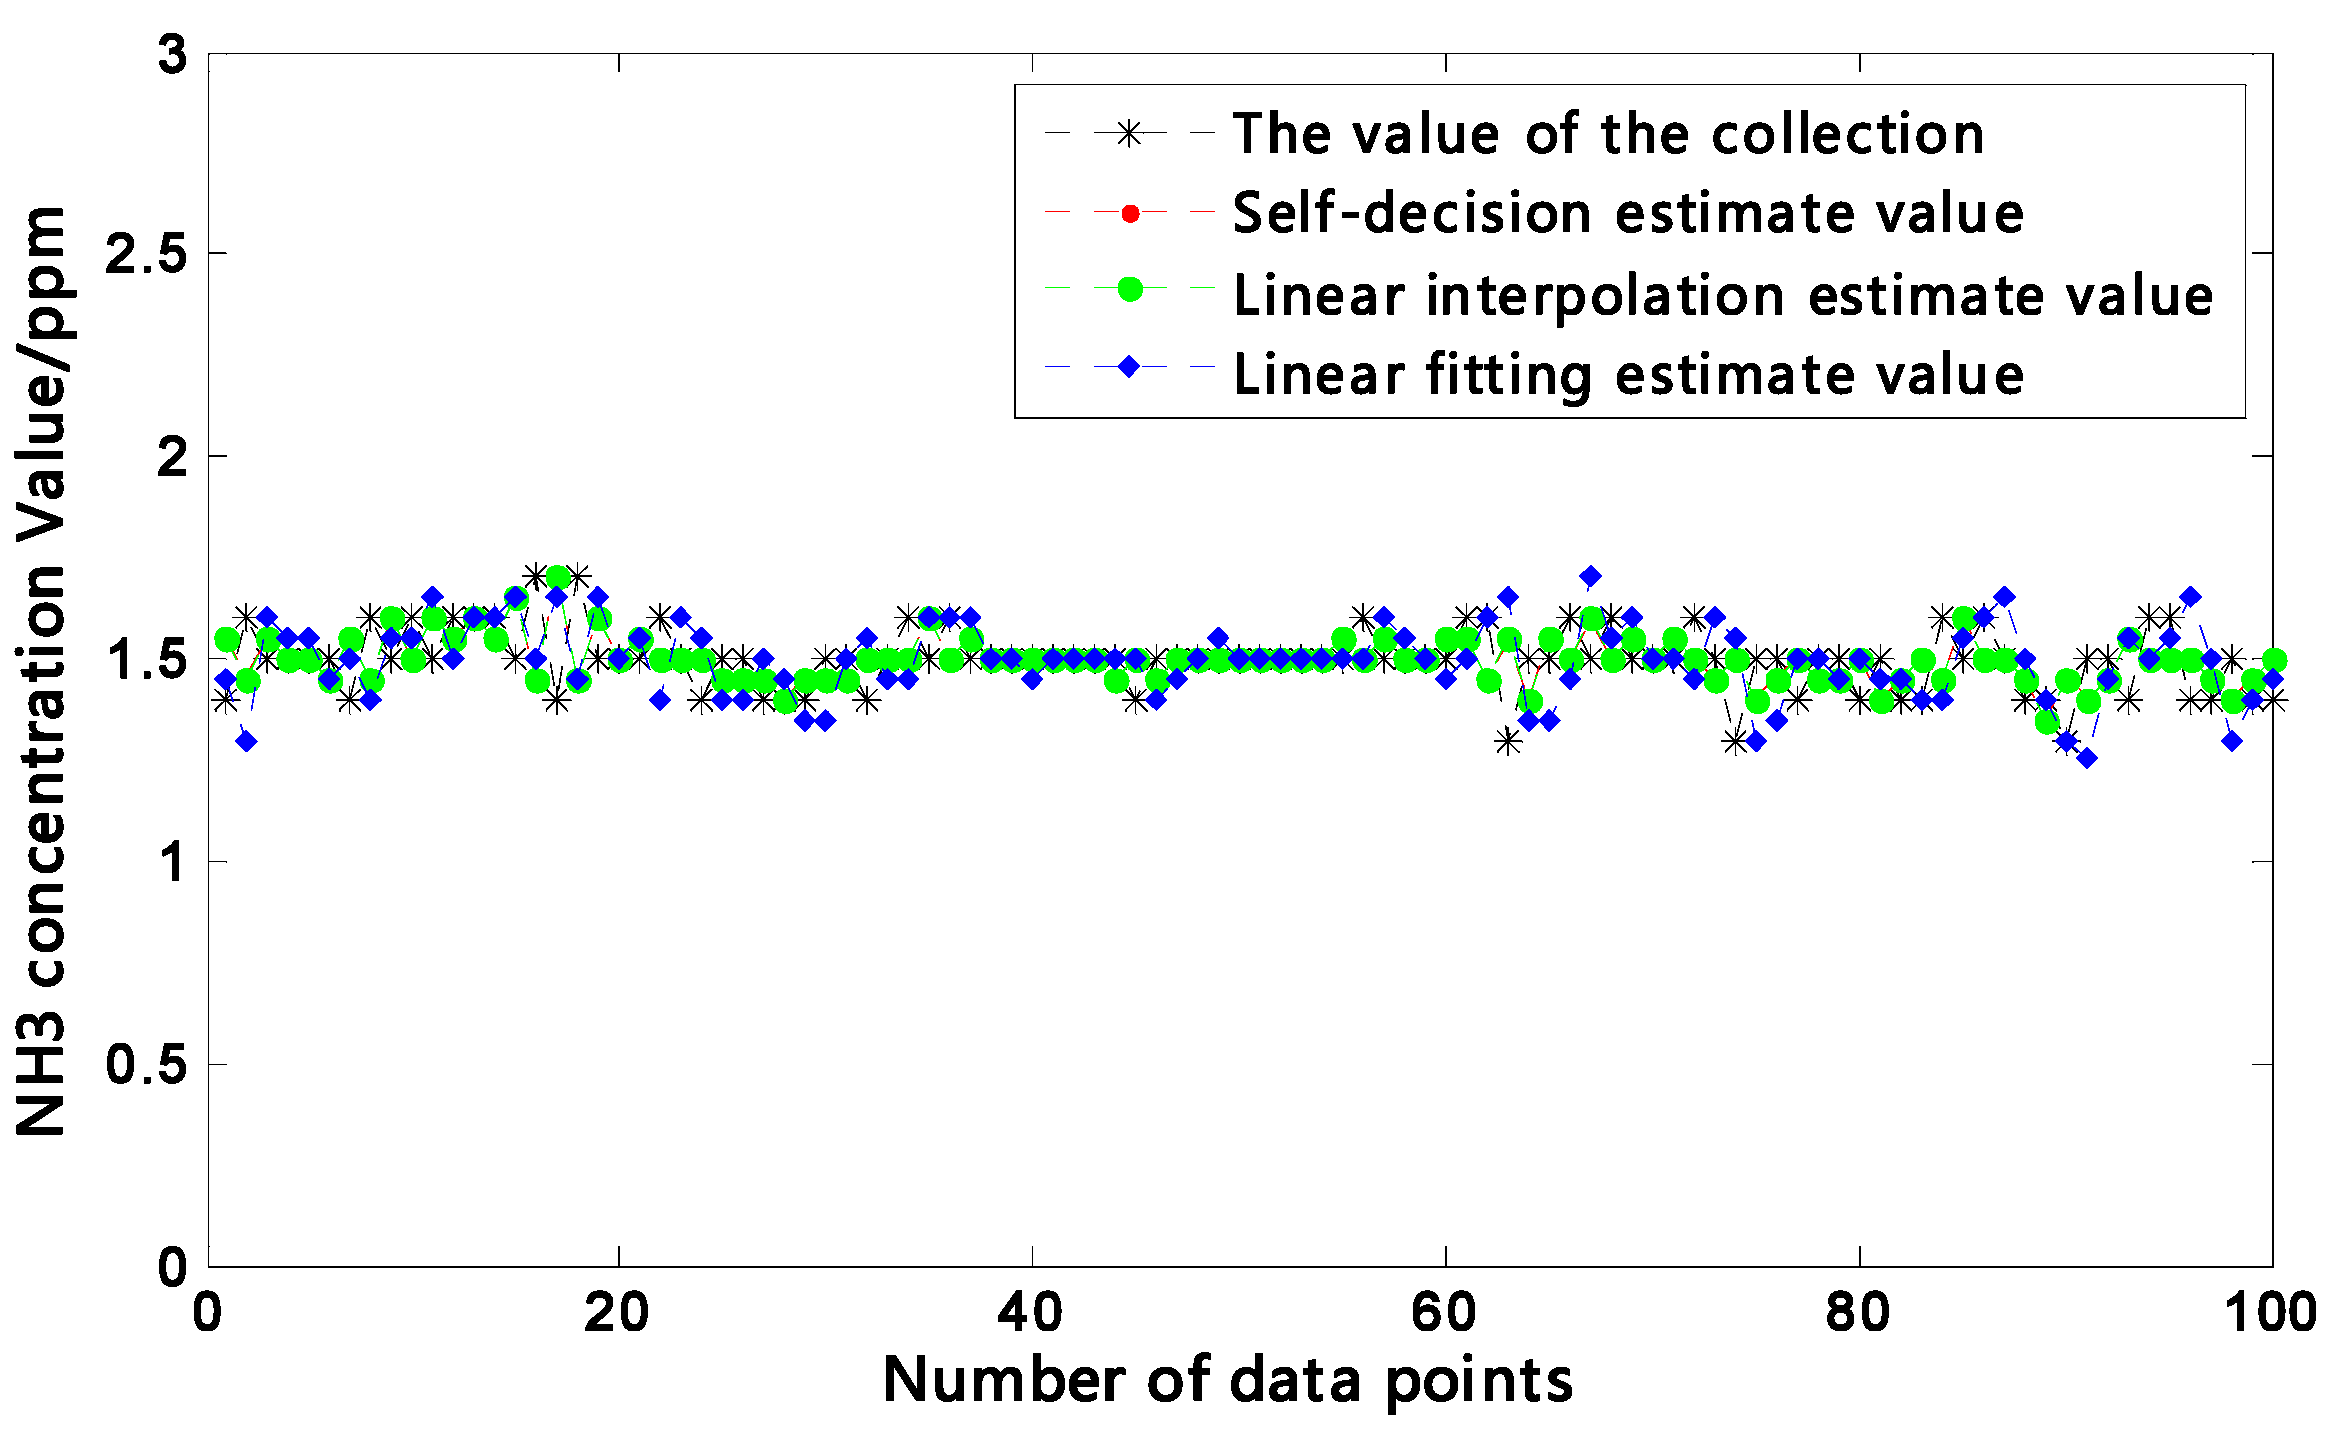
4.3.2. Test results


| Parameter | Self-decision | Interpolation | Fitting | Regression analysis | |
|---|---|---|---|---|---|
| Temperature (°C) | Maximum absolute error | 0.48 | 0.65 | 3.10 | 0.74 |
| RMSE | 0.1698 | 0.1846 | 1.2728 | 0.2447 | |
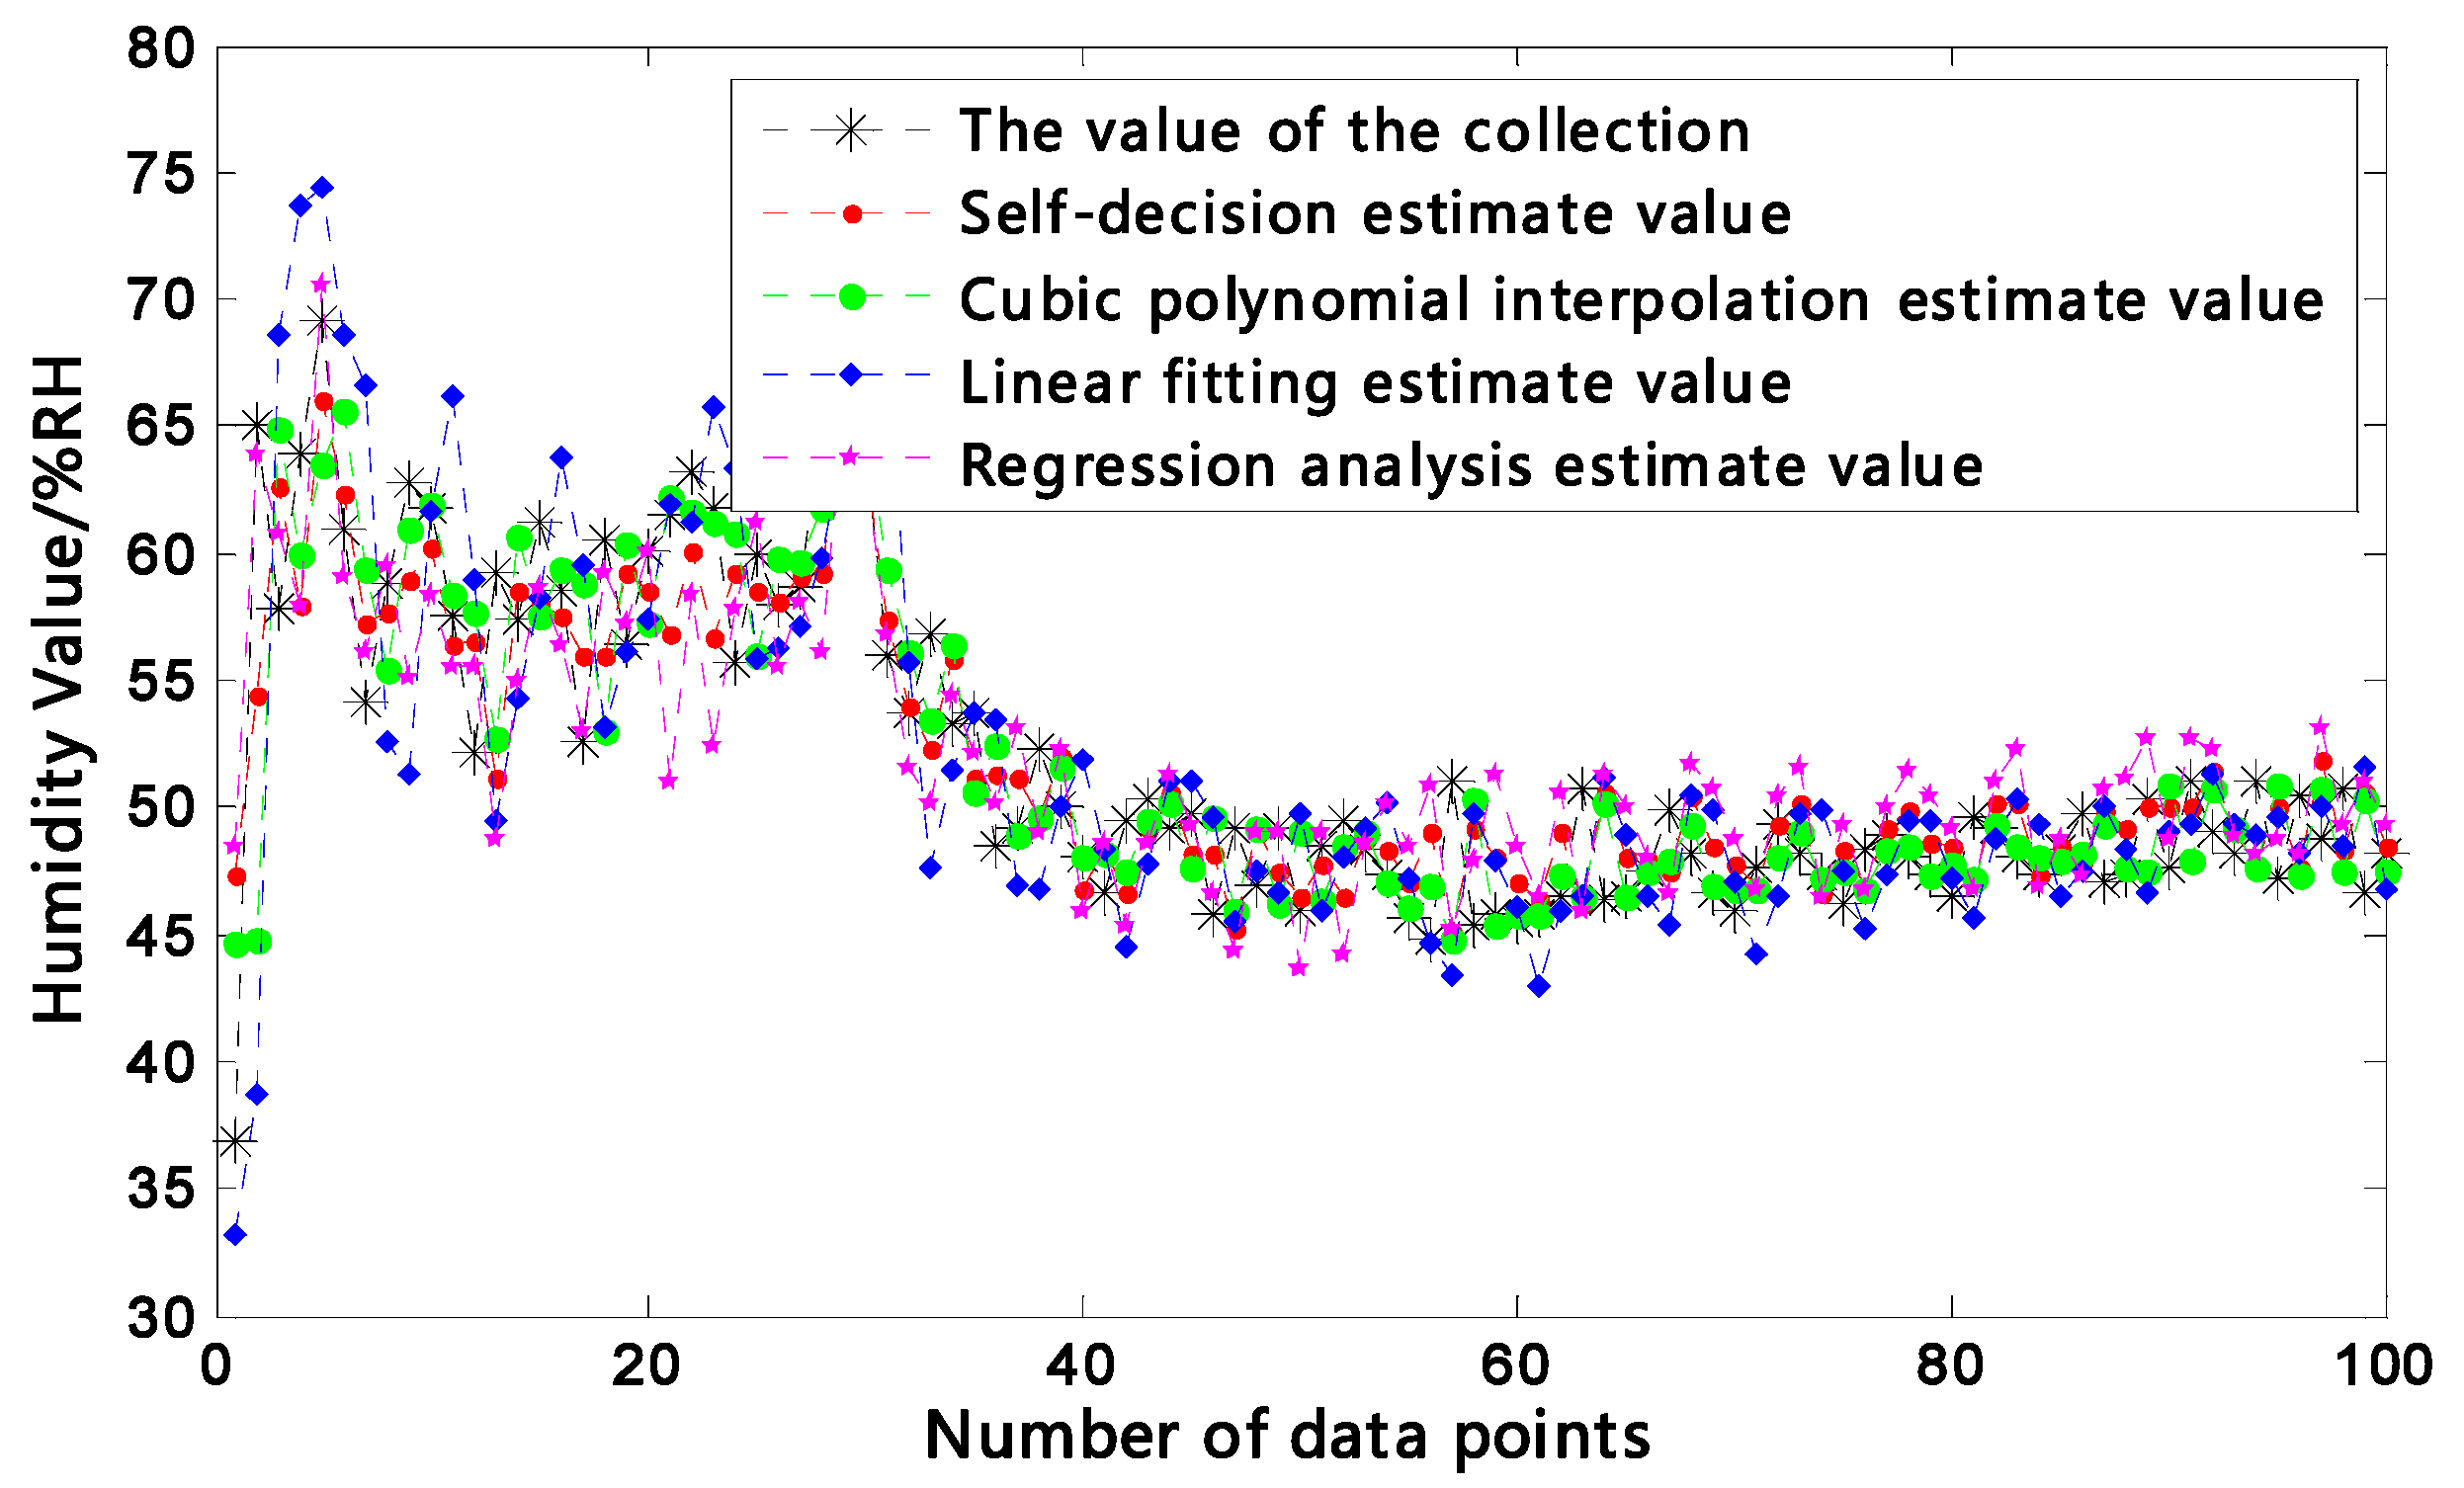
| Humidity (%RH) | Maximum absolute error | 3.84 | 4.21 | 5.12 | 5.32 |
| RMSE | 3.0859 | 3.5910 | 5.1881 | 3.6851 | |
| CO2 concentration (ppm) | Maximum absolute error | 232 | 237 | 238 | 437 |
| RMSE | 77.00 | 77.84 | 77.89 | 153.11 | |
| NH3 concentration (ppm) | Maximum absolute error | 0.30 | 0.30 | 0.35 | - |
| RMSE | 0.094 | 0.102 | 0.118 | - | |
5. Conclusions
- (1)
- In this study, a henhouse environment monitoring system based on IoT was developed according to the environment monitoring and management requirements of henhouses. Reliable monitoring of henhouse temperature, humidity, CO2 concentration and NH3 concentration was realized. Compared with traditional henhouse environment monitoring systems, the system had such advantages as low packet loss rate, high reliability and easiness in extension. In addition, henhouse environment information was released via the Web and corresponding authorized users can remotely check related information via a browser, which met the requirements of the practical production.
- (2)
- Under the condition that the system costs were not raised, data fitting was used for acquisition data compensation and correction based on the features of the sensors. Consequently, the acquisition accuracy of the system was raised.
- (3)
- For the packet loss issue of wireless transmission, a data frame transport protocol for closed henhouse environmental parameters was designed based on loss recovery. Reliability of environmental parameter transport was increased and packet loss rate was decreased. In turn, reliable acquisition of environmental parameters was realized and the practicability and reliability of the system were enhanced.
- (4)
- For the issue of inevitable loss of close henhouse environment monitoring data, a self-decision and on-line filling method was proposed to comprehensively utilize the temporal–spatial correlations of node data to estimate the missing data. Compared with a single estimation algorithm, this method has higher estimation accuracy. Multithread programming was used to realize the on-line identification and real-time filling of missing data. Consequently, the integrity of system monitoring data was raised.
Acknowledgements
Author Contributions
Conflicts of Interest
References
- Wu, J.F.; Zhan, K.; Li, J.Y.; Liu, W.; Chen, G.Y.; Zhu, Y.C.; Tang, Y. Effect of environment parameters of semi-enclosed layer house on production performance and egg quality of primiparity laying hen in winter. China Poult. 2011, 33, 16–20. [Google Scholar]
- Bai, H.W.; Teng, G.H.; Ma, L.; Yuan, Z.D.; Li, C.Y. Layer healthy breeding management information system based on Internet. Trans. CSAE 2006, 22, 171–173. [Google Scholar]
- SerDio, C.; Boaventura, C.J.; Morais, R.; Couto, C.; Monteiro, J. A networked platform for agricultural management systems. Comput. Electron. Agric. 2001, 31, 75–90. [Google Scholar] [CrossRef]
- Liopa-Tsakalidis, A.; Sakkopoulos, R.; Saws, D.; Sideridis, A.; Tzimas, G. HydroNet: An intelligent hydroponics web service environment. Neural Parallel Sci. Comp. 2005, 13, 15–36. [Google Scholar]
- Liopa-Tsakalidi, A.; Tsolis, D.; Barouchas, P.; Chantzi, A.-E.; Koulopoulos, A.; Malamous, N. Application of mobile technologies through an integrated management system for agricultural production. Proced. Technol. 2013, 8, 165–170. [Google Scholar] [CrossRef]
- Sanchez, L.; Muñoz, L.; Galache, J.A.; Galance, J.A.; Sotres, P.; Santana, J.R.; Gutierrez, V.; Ramdhany, R.; Gluhak, A.; Krco, S.; et al. SmartSantander: IoT experimentation over a smart city testbed. Comput. Netw. 2014, 61, 217–238. [Google Scholar] [CrossRef]
- Mirzaee-Ghaleh, E.; Omid, M.; Keyhani, A.; Dalvand, M.J. Comparison of fuzzy and on/off controllers for winter season indoor climate management in a model poultry house. Comput. Electron. Agric. 2015, 110, 187–195. [Google Scholar] [CrossRef]
- Wu, S.; Wu, K.; Liang, J.; Li, Z.M.; Yang, P. Design of remote environment control system of intelligent network henhouse based on ARM9. Proced. Eng. 2011, 15, 1056–1060. [Google Scholar] [CrossRef]
- Kittisut, P.; Pornsuwancharoen, N. Design of information environment chicken farm for management which based upon GPRS technology. Proced. Eng. 2012, 32, 342–347. [Google Scholar] [CrossRef]
- Dong, F.W.; Zhang, N.Q. Wireless sensor networks applied on environmental monitoring in fowl farm. IFIP Adv. Inf. Commun. Technol. 2010, 317, 479–486. [Google Scholar]
- Li, L.H.; Huang, R.L.; Huo, L.M.; Li, J.X.; Chen, H. Design and experiment on monitoring device for layers individual production performance parameters. Trans. CSAE 2012, 28, 160–164. [Google Scholar]
- Sahin, C.; Bolat, E.D. Development of remote control and monitoring of web-based distributed OPC system. Comput. Stand. Interfaces 2009, 31, 984–993. [Google Scholar] [CrossRef]
- Stoica, P.; Xu, L.; Li, J. A new type of parameter estimation algorithm for missing data problems. Stat. Probab. Lett. 2005, 75, 219–229. [Google Scholar] [CrossRef]
- Huang, R.; Zhang, Z.; Xu, G. Predictive model-aided filtering scheme of data-collection in WSN. J. China Univ. Posts Telecommun. 2011, 18, 17–24. [Google Scholar] [CrossRef]
- Halatchev, M.; Gruenwald, L. Estimating missing values in related sensor data streams. In Proceedings of the 11th International Conference on Management of Data, Goa, India, 6–8 January 2005; pp. 83–94.
- Qiu, B.Z.; Zhen, Q.Q.; Tang, Y.H. Estimation algorithm for missing data in wireless sensor network. J. Comput. Appl. 2013, 33, 3457–3459. [Google Scholar] [CrossRef]
© 2015 by the authors; licensee MDPI, Basel, Switzerland. This article is an open access article distributed under the terms and conditions of the Creative Commons Attribution license (http://creativecommons.org/licenses/by/4.0/).
Share and Cite
Li, H.; Wang, H.; Yin, W.; Li, Y.; Qian, Y.; Hu, F. Development of a Remote Monitoring System for Henhouse Environment Based on IoT Technology. Future Internet 2015, 7, 329-341. https://doi.org/10.3390/fi7030329
Li H, Wang H, Yin W, Li Y, Qian Y, Hu F. Development of a Remote Monitoring System for Henhouse Environment Based on IoT Technology. Future Internet. 2015; 7(3):329-341. https://doi.org/10.3390/fi7030329
Chicago/Turabian StyleLi, Hua, Huan Wang, Wenqing Yin, Yongwei Li, Yan Qian, and Fei Hu. 2015. "Development of a Remote Monitoring System for Henhouse Environment Based on IoT Technology" Future Internet 7, no. 3: 329-341. https://doi.org/10.3390/fi7030329
APA StyleLi, H., Wang, H., Yin, W., Li, Y., Qian, Y., & Hu, F. (2015). Development of a Remote Monitoring System for Henhouse Environment Based on IoT Technology. Future Internet, 7(3), 329-341. https://doi.org/10.3390/fi7030329