An Online Landscape Object Library to Support Interactive Landscape Planning

Abstract
: Using landscape objects with geo-visualisation tools to create 3D virtual environments is becoming one of the most prominent communication techniques to understand landscape form, function and processes. Geo-visualisation tools can also provide useful participatory planning support systems to explore current and future environmental issues such as biodiversity loss, crop failure, competing pressures on water availability and land degradation. These issues can be addressed by understanding them in the context of their locality. In this paper we discuss some of the technologies which facilitate our work on the issues of sustainability and productivity, and ultimately support for planning and decision-making. We demonstrate an online Landscape Object Library application with a suite of geo-visualisation tools to support landscape planning. This suite includes: a GIS based Landscape Constructor tool, a modified version of a 3D game engine SIEVE (Spatial Information Exploration and Visualisation Environment) and an interactive touch table display. By integrating the Landscape Object Library with this suite of geo-visualisation tools, we believe we developed a tool that can support a diversity of landscape planning activities. This is illustrated by trial case studies in biolink design, whole farm planning and renewable energy planning. We conclude the paper with an evaluation of our Landscape Object Library and the suite of geographical tools, and outline some further research directions.1. Introduction
Before the advent of geographical information systems (GIS), planners were limited in their ability to simulate and explore what if? scenarios using computer-based digital worlds. It is a difficult task for the brain to look at paper-based maps and mentally overlay and query multiple data layers and visualise the results. Paper based approaches do not enable landscape planners, policy makers and scientists who need to deal with a myriad of datasets and computer simulation models to explore decision spaces interactively and in near-real time. Data driven visualisations are often intended to provide a realistic surrogate for actual environments and can enable planners and decision makers to explore real decisions through simulated space and place. Williams et al. [1] state that the necessary selection of landscape elements to create such landscape visualisations often raises complex psychological, ethical and technical issues. In this paper we will not focus on the psychological and ethical issues of data visualisation, rather on technical issues in building an integrated suite of geo-visualisation tools to support landscape planning.
The advancement in computer technologies, not only in terms of computer networking, but also in hardware support, provides opportunities for landscape visualisation approaches to support planning and decision-making. Landscape visualisation is focused on creating a 3D virtual environment to view and understand the environmental processes in a more informative way in order to recognise and comprehend the unseen relationships between various entities, and the environmental processes. Landscape visualisation has substantial advantages as an investigative and communication medium in designing these new landscapes and enhancing the debate around complex multi-dimensional problems such as climate change [2].
3D virtual environment creation with real data might include both manual and/or automated processes using computers. Looking at the real world where we see millions of entities to be modelled to represent natural and built features there is much to be done in digital object creation. Object creation, not only two dimensional (2D), but also three dimensional (3D), needs expertise and access to good modelling tools and resources. The Google 3D warehouse ( http://sketchup.google.com/3dwarehouse/) is an example of the recent advancements in publically accessible 3D object repositories. Storing these objects in a common repository over a computer network requires a dedicated object data warehouse which enables users to access these objects from anywhere at anytime. MacEachren et al. [3] stated that spatial data access can be supported by the various abstract techniques of geo-visualisation. Incorporating scientific data along with the digital object representations is a challenging task and one which we endeavoured to address in our research.
Landscape management is a complex process and requires multiple stakeholders and experts from a range of disciplines to work together to collaboratively design and evaluate future options. Likewise, landscape perception is multifaceted, and leaves room for improving existing landscapes in a 3D virtual world [4]. Stakeholders from across industries, people from different backgrounds, scientists and planners are all important players in landscape planning. Therefore, supporting a collaborative approach requires having spaces where stakeholders and experts can explore land management futures. There are a number of technology tools that can assist in participatory planning exercises, including spatial information tools such as geographical information systems (GIS) and haptic devices such as touch screens. Touch screens, or touch tables, are very good at recognising finger movement on the screen surface, and allow the user to draw elements using hand gestures and view data, whilst being large enough to provide room for people to physically become involved in the collaboration. In the following sections we discuss some of these technology components, and how we integrated these to support landscape planning as discussed in the context of case study exercises undertaken in Victoria, Australia.
The purpose of this study was to demonstrate the potential of:
The Landscape Object Library–an online secure (requires a username and a password to access it) digital object repository supporting the creation of the 3D virtual environments in Victoria.
A suite of geo-visualisation tools (that act as an interface drawing on the Landscape Object Library) that includes: (i) A Geographical Information Systems (GIS) based customised extension–Landscape Constructor ver. 2.0. The Landscape constructor is an extension in ArcGIS 9.3 which enables users to design landscapes on a 2D surface (modelling real world elements on a X and Y surface by drawing point, line and polygon) and then create 3D scenarios (modelling real world elements on a X, Y and Z surface) by harnessing the objects from the Landscape Object Library; (ii) A Touch enabled screen to engage people in participatory decision-making processes; and (iii) A visualisation tool–Spatial Information Exploration Visualisation Environment (SIEVE) [5]).
The system combining GIS, touch table technology and 3D visualisation would be used by people as a collaborative planning tool. In a typical workshop environment people would interact in the same place and same time (SP/ST) corner of the E-interaction Communication Protocol cube proposed by van Lammeren et al. [6].
Before undertaking a land use planning exercise, for example planning a biolink (as an area of native vegetation established to provide ecological connectivity between existing conservation areas or zones with remnant native vegetation) as described in this paper, a number of fundamental GIS datasets and input parameters are required. For our study this included: density of vegetation, depth to water table, salinity measurements, soil type, Ecological Vegetation Class (EVC) biodiversity data, high resolution aerial photography, land use data and digital elevation model (DEM) data.
This information was obtained from various data custodians (a group of organisations who have access to the Landscape Object Library to upload and download objects) and scientist experts and was brought together in an integrated GIS workspace.
The touch table utilised touch enabled screen technology, which allowed scientists, policy makers, landscape planners and others to view the data and interact with it by pressing the fingers on glass, and subsequently design the land use. The designed land use plan could be labelled with specific plant production types or natural vegetation uses. Once this was done, objects from the Landscape Object Library were imported (through a database call) to populate the designed land use types. The final step was being able to view the 3D virtual environment using SIEVE.
The Landscape Object Library is a prototype repository of digital objects representing vegetation, animals, farm equipments and built infrastructure, which has been hosted in a secure environment through the Victorian eResearch Strategic Initiative (VeRSI) infrastructure. The library was made available online to authorised data custodians and end users to deploy the objects for various other applications. Additionally, the Landscape Constructor (discussed in section 4) has been developed and linked with Landscape Object Library to retrieve and deploy objects remotely in 3D virtual environments. In our case study, these technologies were brought together to communicate and support the exchange of knowledge and exploration of what if? scenarios amongst scientists, policy makers, landscape planners and other stakeholders based on a case study area focusing on the greater Grampian region, southern Victoria, Australia.
2. A Review of Available Landscape Object Resources
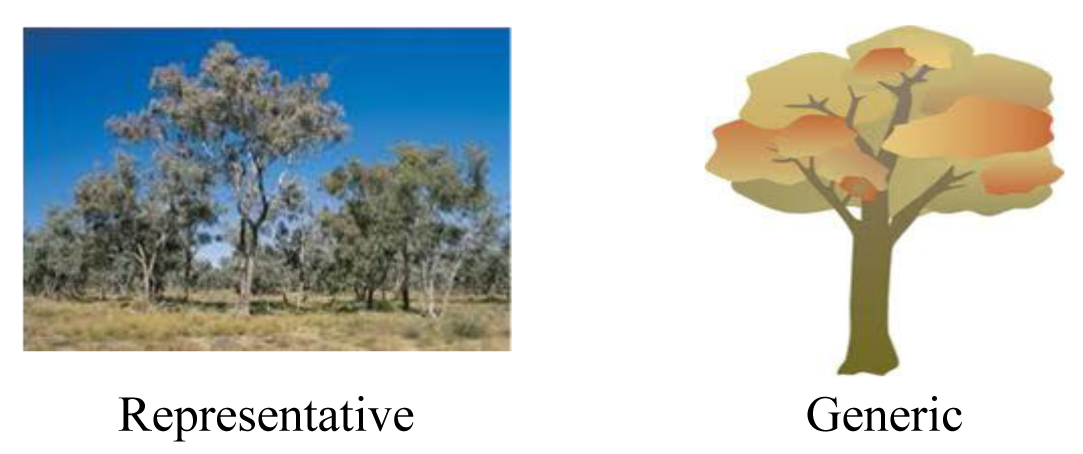
3D virtual environments can be created using a number of landscape objects, which can be viewed in different perspectives and dimensions. These perspectives and dimensions are measured from real world objects. Some objects are location specific (wind turbines), others are more spatially generic and can be found everywhere with little variation (houses). Surface objects are commonly divided into geo-specific (as actually exists at the location) and geo-typical (as can normally be found in the vicinity). This distinction was first articulated by Graf et al. [7]. Bishop et al. [8] extended this distinction to four main classes of landscape objects (Figure 1):
Specific: such as an actual identifiable buildings or trees. For example, the iconic Eureka Tower in Melbourne;
Typical: individually located objects which are of the correct species (e.g., Eucalyptus camaldulensis in the basalt plains north of Melbourne) or building style (e.g., “a Victorian Terrace ” but do not represent each tree or house individually;
Representative: similar to typical but not individually placed. May be scattered within a town or forest boundary;
Generic: randomly located trees or buildings (e.g., house, shed, factory, block of flats) not specific or even necessarily typical to the location.
Typical and representative landscape elements vary with context. In the case of buildings the vernacular architecture changes from country to country, between city to rural areas and over time. As object libraries become populated with greater numbers of typical elements so the mapping on which the landscape simulation is based can become more detailed in its attributes. The same applies to vegetation, which has typical species within mapped bioregions or vegetation classes. Our initial focus was on objects appropriate for Victorian conditions.
Ervin [9] identifies the elements of landscape visualisation as landform, vegetation, water, structures, animals and people. Landform and water form parts of the surface and do not require inputs from an object library. Their geometry is always specific while the textures applied to their surfaces could be any of specific, typical, representative or generic. With the increasing availability of high resolution satellite imagery the land form texture is most commonly specific. The other Ervin elements are therefore the subject of this development. In particular we worked with structures (primarily buildings) and vegetation. At this stage we have paid limited attention to animals and people (avatars), though we have captured some of these in the Landscape Object Library.
Creating and storing these landscape objects with the attribute information (height, width, density of an object in a region–discussed in section 3.2) creates some practical challenges. It is not yet possible that each and every object which comprises the real world would be modelled and stored in a comprehensive attributed digital format. In recent years, some developments towards this aspirational goal have been discussed [10].
The Victorian Department of Primary Industries (DPI) and Department of Sustainability and Environment (DSE) with the University of Melbourne and Royal Melbourne Institute of Technology (RMIT) University, are not only developing a collection of 2D and 3D objects, but are also making these objects openly available to support the creation of 3D virtual environments for past, present and future Victorian landscapes [11].
Such a collection of objects is referred to as a 3D object library. The Victoria Resources Online 3D object library ( http://www.dpi.vic.gov.au/dpi/vro/vrosite.nsf/pages/geovis_3d_object_library) provides a publically accessible resource for downloading such objects. The files are available in a number of different formats. The formats include: .GIF, WRL, .3DS, .MAX, .X3D AND .FLT. There are more than 400 2D and 3D objects that can be downloaded and viewed in different software packages. The Google 3D Warehouse provides an example of a global object library resource, whilst the Victoria Resources Online 3D object library provides a more extensive collection of objects which are more typical and specific to Victoria.
In recent years, there has been an increasing trend toward object creation, sharing, storage and distribution. There are a number of online 3D objects libraries which allow users to download the objects (freely or for a fee). There are also a number of commercial 3D object libraries where objects can be purchased. When conducting a search for available “3D landscape objects” using the Google and Bing search engines, about 1,690,000 and 7,280,000 results were found respectively (09/10/2011). In the table below, we have illustrated a number of key object library resources that contain some of the landscape objects found in the Google and Bing search engine.
All the sources of digital objects outlined in Table 1 have been reviewed according to their cost, proprietary and format source. A main point of difference between the object libraries is the quality of the objects. Typically those organisations providing free services to download objects provide products of lower quality. Whilst those resources where an explicit cost recovery model is in place generally provide higher quality, format and texture of the objects (for example, 3dstudio and lenne3d). There are some exceptions to this finding. The Google 3D Warehouse is one of the examples with a wide range of quality models but texturing can be an issue when exporting objects to other file formats.
After looking at the present developments in the object libraries, we found that there is a shortage of representative, typical or specific 2D and 3D objects suitable for Australian landscapes. Without development of a new objective library the visualisation would have been restricted to use of generic objects which would be unsatisfactory to knowledgeable users. We also needed the objects to be indigested automatically into other geo-visualisation tools. In Victoria, collaborative efforts across government and universities have created objects and stored them in a prototype online library known as the Landscape Object Library. The development, for automatic access, and application of the Landscape Object Library will be discussed in the following sections.
3. The Landscape Object Library
The Landscape Object Library enables object custodians to make a collection of objects and store them in a common repository, from where the objects can be accessed and deployed to render 3D virtual environments through geo-visualisation tools such as a computer game engine by end users (landscape modellers). The Landscape Object Library also enables users to share and reuse the collected landscape object images. This increases efficiency and lessens the time taken when creating new models or when modifying existing landscape models. A web-based object library user interface has been created to facilitate users' access to the library through a web browser. The Landscape Object Library extends the cascading style sheet (CSS) implementation of the Victoria Resources Online 3D object library (discussed above) by providing support to custodians through a secure and permission based data base structure. The library has been developed as a proof-of-concept and is hosted online by the Victorian eResearch Strategic Initiative–see Figure 2. This potentially provides a resource for scientists, landscape planners, policy makers and stakeholders who wish to use such digital objects to create their own 3D virtual environments to explore landscape form, function and critical landscape planning issues such as climate change, forest fire, deforestation, and biodiversity loss.
The Landscape Object Library initially contains approximately 100 objects (a subset of the Victoria Resources Online 3D object library) including plants, human made objects and animal images (to be used as billboards). The application is written in Java 5.0 and abides by Java 2 Enterprise Edition (J2EE) 5.0 standard. The J2EE technologies used in the application are JavaServerFaces (JSF) 1.2, Enterprise Java Bean (EJB) 3.0, OpenMQ and web services. The application is hosted on Glassfish J2EE 3.0 open source application server, which is installed on a Linux operating system at a 2.8 G Intel processor PC. The Object Library Schema is created on an Oracle 11g database where all the object images are stored.
3.1. Purpose
The Landscape Object Library prototype was created to help users manage and share their collections of digital object images and store them in a database repository effectively via the internet. The Landscape Object Library is a web-based application that supports multiple users to access and modify object images concurrently. The web application has been created to support custodian management of object images. A level of control has been developed that supports categorisation, versioning and publication of objects as defined by the custodian.
3.2. Classification Schema and Rule-Based Database
The Landscape Object Library provided three high levels categories for object images-human made, plant and animal (see Figure 3). The human made object category is a collection of buildings, telephone poles, cars and so forth. The plant object category is a collection of trees, shrubs and agricultural production plants such as wheat. The animal object category is a collection of farm and other domestic species. Custodians are granted permission to create multiple new subcategories from the above three main categories to further specify the differences of objects.
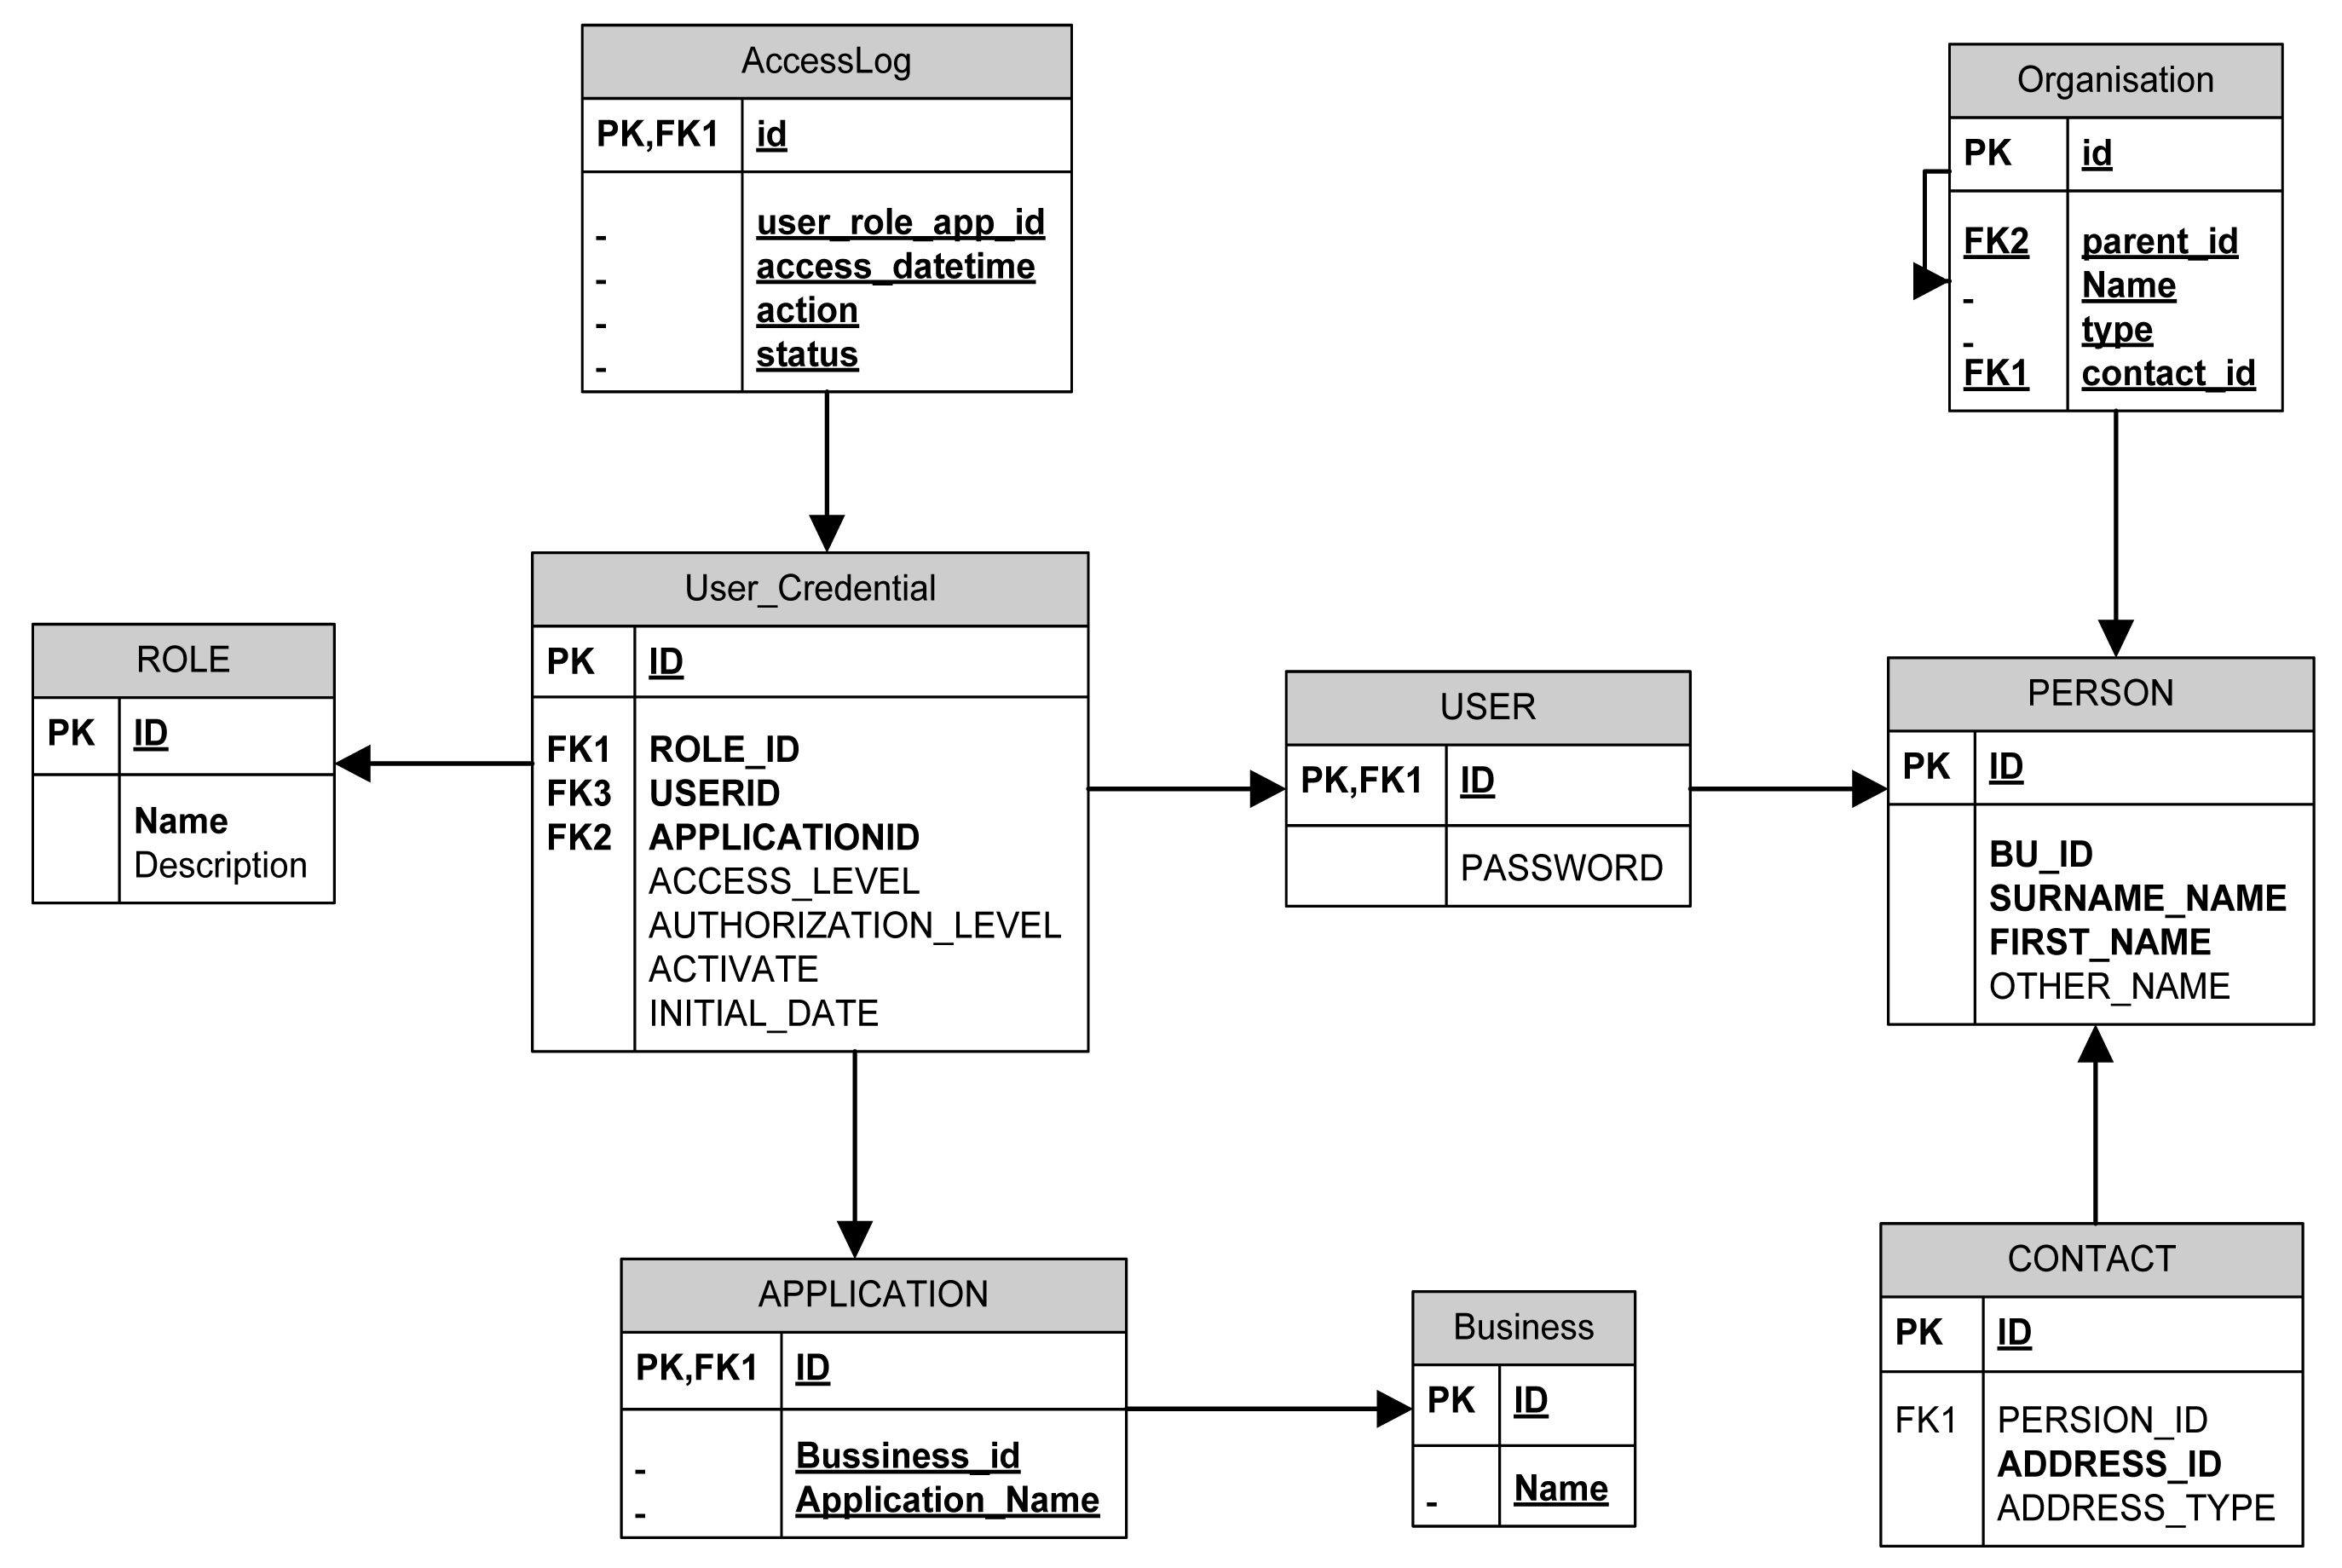
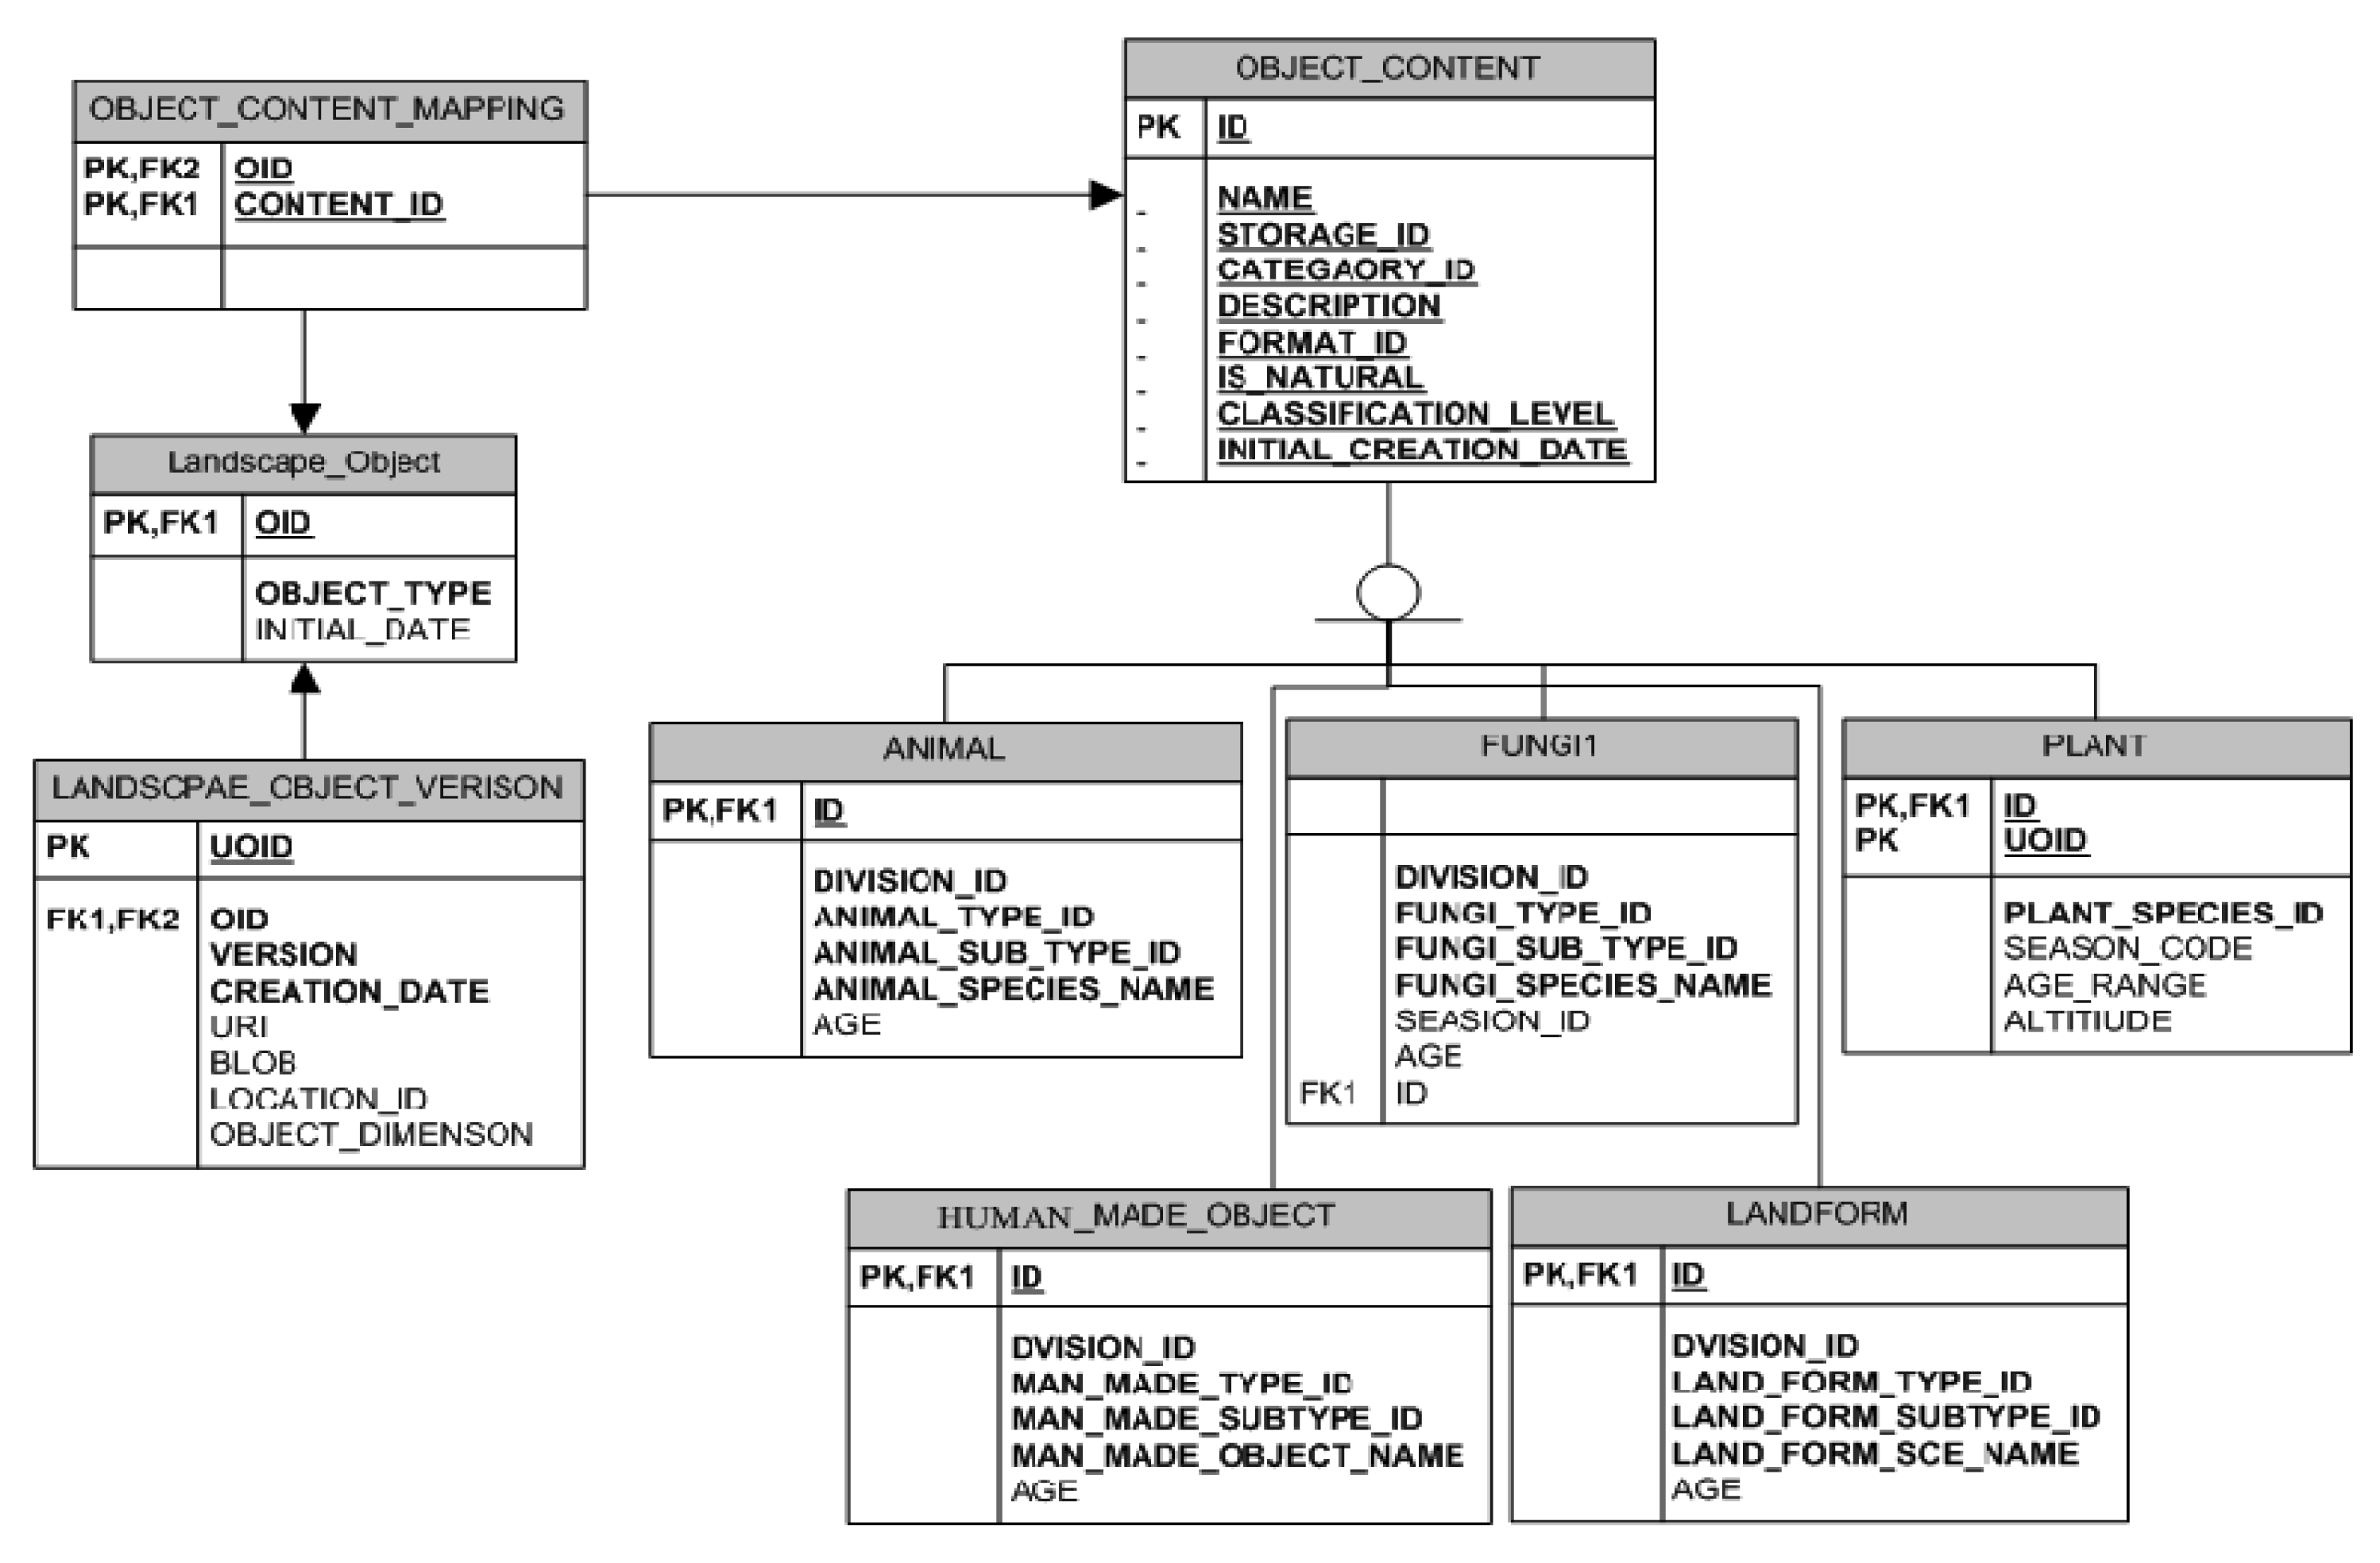
As mentioned (Section 3.1), each role maintains a different access level of application functionality (see Figure 4). The following database schema diagram shows the schematic structure of the Landscape Object Library categories.
Some of the vegetation objects in the Landscape Object Library are stored with specific rules. These rules initially only apply to objects belong into ecological vegetation classes. Figure 5 shows the rule-based database as an integrated component of the Landscape Object Library. The rule-based database comprises information about each ecological vegetation class object, in terms of, what species come under a particular ecological vegetation class, what is the name of each species and attribute information i.e., height, width, density, percentage of coverage and so forth. As ecological vegetation classes cover more of the objects in the database, the rule-based database name is given to the ecological vegetation class section of the database which is considered a part of a generic database; however the whole object collection in the generic database is named as Landscape Object Library. Apart from ecological vegetation class objects, all other objects are stored in the generic database (Landscape Object Library).
At this stage, the rule-based database contains information about the top ten dominant ecological vegetation classes of the study area (stored with rules), which supports the automatic generation of 3D virtual environments by using a set of geo-visualisation tools (discussed in section 4).
Each ecological vegetation class contains multiple types of objects, such as, trees, shrubs, grass and so forth including their attribute information like height, width and density. Apart from this, five types of agricultural production related objects such as, plantings, including windbreak, and some objects related to renewable energy resources are stored in the other parts of the generic database in a generic database structure.
3.3. Functionality
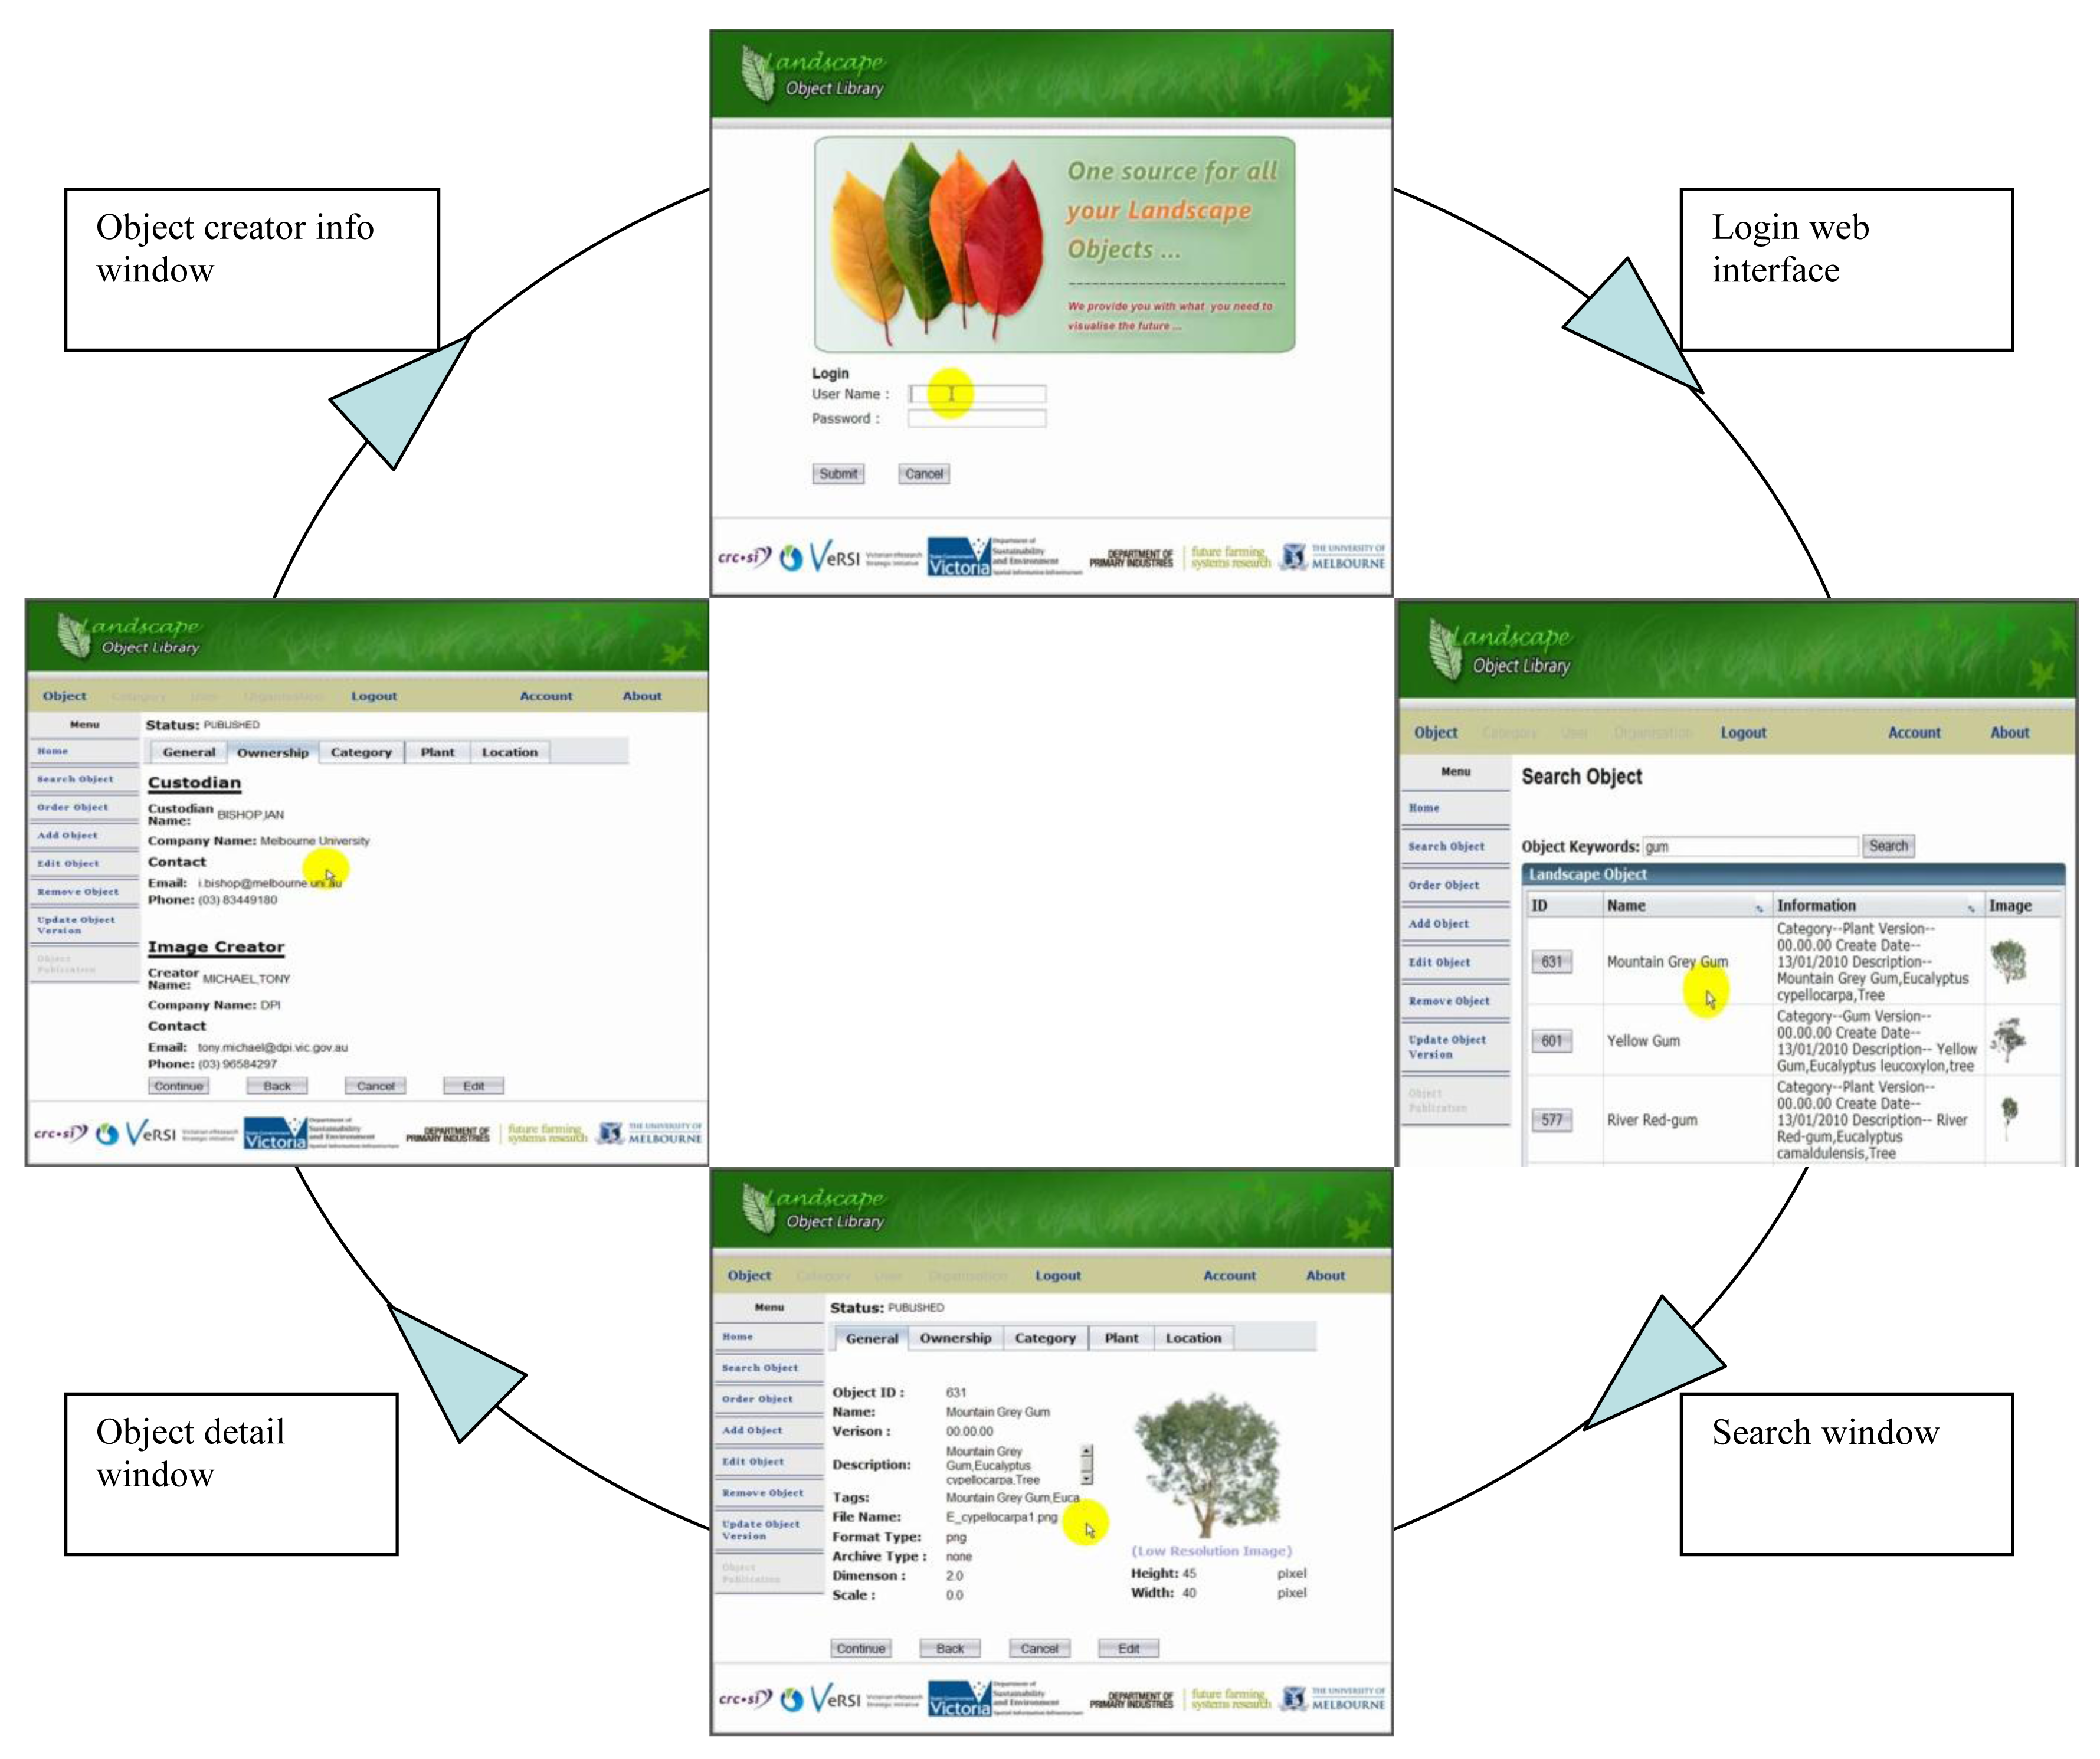
The Landscape Object Library is an object image repository which provides web user interface applications designed to allow users to effectively manage and access the collections of object images through a web browser. The Landscape Object Library is password secured; which means users need to have access rights. The access rights are given to users by the database administrator. Figure 2, shows the workflow of Landscape Object Library. In the first step, users enter their login identity and password, via a web browser and then login into the Landscape Object Library system. Based on the access rights, users can search objects, see the details (metadata) of objects and can download objects (see Figure 4). The following database schema diagram shows the schematic structure of the multi-roles and access level of users. It also shows the relationship between the tables as Primary Key (PK), Foreign Key (FK).As previously mentioned, to better manage the Landscape Object Library, roles are defined. Each role has been assigned a set of specific responsibilities and a set of permissions respectively that control the accessibilities to the object images and manageable rights on the Landscape Object Library. The roles are defined as:
3.3.1. Landscape Object Library User
Metadata keyword search function on Landscape Object Library web application enables the user to find relevant objects which are populated onto the web page for browsing. Users choose image objects of interest from the list and view metadata details and low resolution sample image associated to the object image. The user then orders the object through the web interface. Finally, the user downloads the ordered images from the web interface or receives them attached to an email.
3.3.2. Image Creator
Produces digital object image and gathers metadata information about the object. The image creator uploads object images to the Landscape Object Library and completes the metadata associated to each object image from the Landscape Object Library web interface.
3.3.3. Data Custodian
Utilises browsing and viewing features from Landscape Object Library web interface to review the data quality of uploaded object images and makes modification to associated metadata. The data custodian decides upon which images they wish to upload and publish on the Landscape Object Library (generic database) and also which images to remove (retired) from the library.
3.3.4. Landscape Object Library Administrator
Creates accounts for users, image creators and data custodians. The administrator ensures the data integrity on Landscape Object Library system and the validity of the Landscape Object Library users.
To facilitate users' access to the intended object images, the Landscape Object Library provides a metadata keyword search function that allows users to query and browse object images. Users can acquire the object image from email through the order function. To effectively distribute object images, the application provides web services that allow a web service client to query and acquire object images from the library and use them with applications such as the SIEVE simulation application.
Each uploaded object image in the Landscape Object Library is associated with a version number. An updated object image that replaces a previous version is assigned an incremental version number from the previous version. The Custodian is responsible for determining the versions of the particular object image being published or retired on the object library.
The object images that are uploaded to the Landscape Object Library can also be geotagged by using the Google Map mashup component embedded in the web interface. Alternatively, an Image Creator can edit the latitude and longitude coordinate information to the object image from the web interface.
3.4. Object Creation
3D objects, also known as 3D models, represent real world, living or non-living entities, which are basic elements in the creation of a 3D virtual environment or landscape or scene.
To overcome the challenge in rendering a group of 3D objects in real time (such as tree plantation) in a SIEVE environment, there are two different file formats used to populate objects for the project scene. The built infrastructure 3D models have been created in 3D Studio Max and exported to the Garage game's native .DTS object format to be able to be read within the 3D virtual environment. All other complex plantation species and Ecological Vegetation Classes have been used as groups of .PNG files with transparent backgrounds (billboards) to reduce the object size and overall size of the 3D virtual environment (Figure 6).
The 3D models of a biofuel plant, farm houses, turbines and various avatars depicting farmers, scientists and policy makers have been created and modified within 3D Studio Max and then exported to .DTS format.
The actual geographical location of the 3D virtual environment must be also modelled as a digital terrain surface, usually draped with an aerial image, which is then populated by vegetation species from the existing ten different ecological vegetation classes. Finally, the 3D models and transparent PNGs have been placed into the 3D virtual environment, for example, biolinks and whole farm planning scenarios to illustrate the versatility of the tool to support a range of landscape planning activities.
4. An Integrated Suite of Geo-Visualisation Tools
3D virtual environments can not be created independently by deploying digital objects housed in databases and libraries such as the Landscape Object Library. There is a need for some kind of geo-visualisation viewing and exploration tools to facilitate interactivity with scientists, landscape planners and other stakeholders. Such a suite of geo-visualisation tools will enable active participation and exploration of decision spaces by a number of end users.
To solve this issue we developed and integrated a suite of geo-visualisation tools together that provide an interface to Landscape Object Library. In the next sections we discuss this integrated suite of geo-visualisation tools. The first tool is the Landscape Constructor which is an extension in ArcGIS built on a .NET platform.
4.1. Landscape Constructor Tool Ver. 2.0
The Landscape Constructor tool enables and engages participants in an interactive session bringing together researcher, landscape planners and policy-makers in exploring decision spaces in a participatory way. This interactivity develops and refines the decision-making processes to initially design the landscapes on the 2D surface using a touch enabled screen.
Once the landscape design has been completed, the Landscape Constructor tool exports the designed 2D polygons automatically into the 3D virtual environment by deploying the digital objects remotely from the Landscape Object Library (see Figure 7). It also determines the distribution and position of landscape objects in the SIEVE game engine. The following sections provide a brief description on each of the components.
The Landscape Constructor tool is built using Visual Basic.NET language and is a standalone application that uses ArcObjects (digital object libraries written in C++ language by ESRI's developers), Windows libraries (developed by Microsoft) and remote connectivity with the Landscape Object Library to build past, present and future landscapes on the fly. This tool is also well integrated with voice prompts to help new users to perform steps while they use it. As users start building the scenarios, the voice prompts help them to understand what is happening and what actions they need to take next in applying the tool. Furthermore, the Landscape Constructor tool has the option to establish links with the SIEVE game engine either over the network or locally.
The Landscape Constructor initial design (version 1.0) was focused on supporting polygon drawing functionality using the touch table interface, linkage with a local Access database and with SIEVE (locally). However, after the Landscape Constructor tool was demonstrated in many stakeholder workshops, feedback was taken onboard to incorporate additional functionality. This included: adding voice commands, linkage with a remote data base (Landscape Object Library), viewing 3D scenarios locally or remotely in SIEVE, and setting interface options. The Landscape Constructor is designed for the Windows environment and has been installed and tested with ArcGIS 9.2 and 9.3 versions, with the object library in Oracle and with SIEVE as the 3D visualisation software. Ideally a wider range of platforms would be supported. Work is underway to utilise Google Earth as an interactive viewer.
4.2. Visualisation Using SIEVE
Visualisation has become an integral part in many GIS and their applications. General purpose GIS were originally designed for the classical 2D cartographic representation of points, lines and polygons and raster data. Hence GISs often do not reflect the current state of the art visualisation capabilities. Moreover, within existing GIS it is difficult or even impossible to integrate cutting-edge visualisation technology [12]. In the last few years scientists have started using game engines in their research and development [13]. There are many games which contain highly integrated packages called engines, each with a specific functionality. A terrain engine creates and renders the ground, while a physics engine handles the motion behaviour of characters and objects, such as realistic simulation of gravitational forces and kinetics [14].
The research presented in this paper includes a modified version of a game engine called SIEVE and a real time bidirectional coupling solution with GIS called “live link” [15] by using the Landscape Constructor interface. SIEVE is efficient in rendering micro scale 3D virtual environments; however, it has limitations in rendering macro scale 3D virtual environments. Moreover, SIEVE currently cannot show temporal changes, and also, in terms of total number of objects to be rendered in a 3D virtual environment–it can render up to twenty thousand 3D objects or a much larger number of billboards, in one scenario.
4.3. Touch Technology
Touch table systems can assist in interactively displaying large amounts of digital data, including spatial data, in a manner conducive to discussion and participatory decision-making [16]. A common problem when dealing with large volumes of data for planners and decision-makers is being able to take a “helicopter view” of the entire decision space. When using high resolution GIS data such as satellite imagery, aerial photographs and digital elevation models (DEMs), conventional displays can be too small and limit the number of actors (individual decision-makers) who can access the data and engage in the discussion [17]. In our current technology development the touch table supports single touch and does not support multi-touch functionality. However, in a future version of the tool multi-touch support could be enabled using Application Programming Interface (API) which is supplied with touch table (NEC–LCD 5220).
5. Exploring an Application of the Landscape Object Library Enabled Through an Integrated Suite of Geo-Visualisation Tools
5.1. Case Study Application in South West Victoria
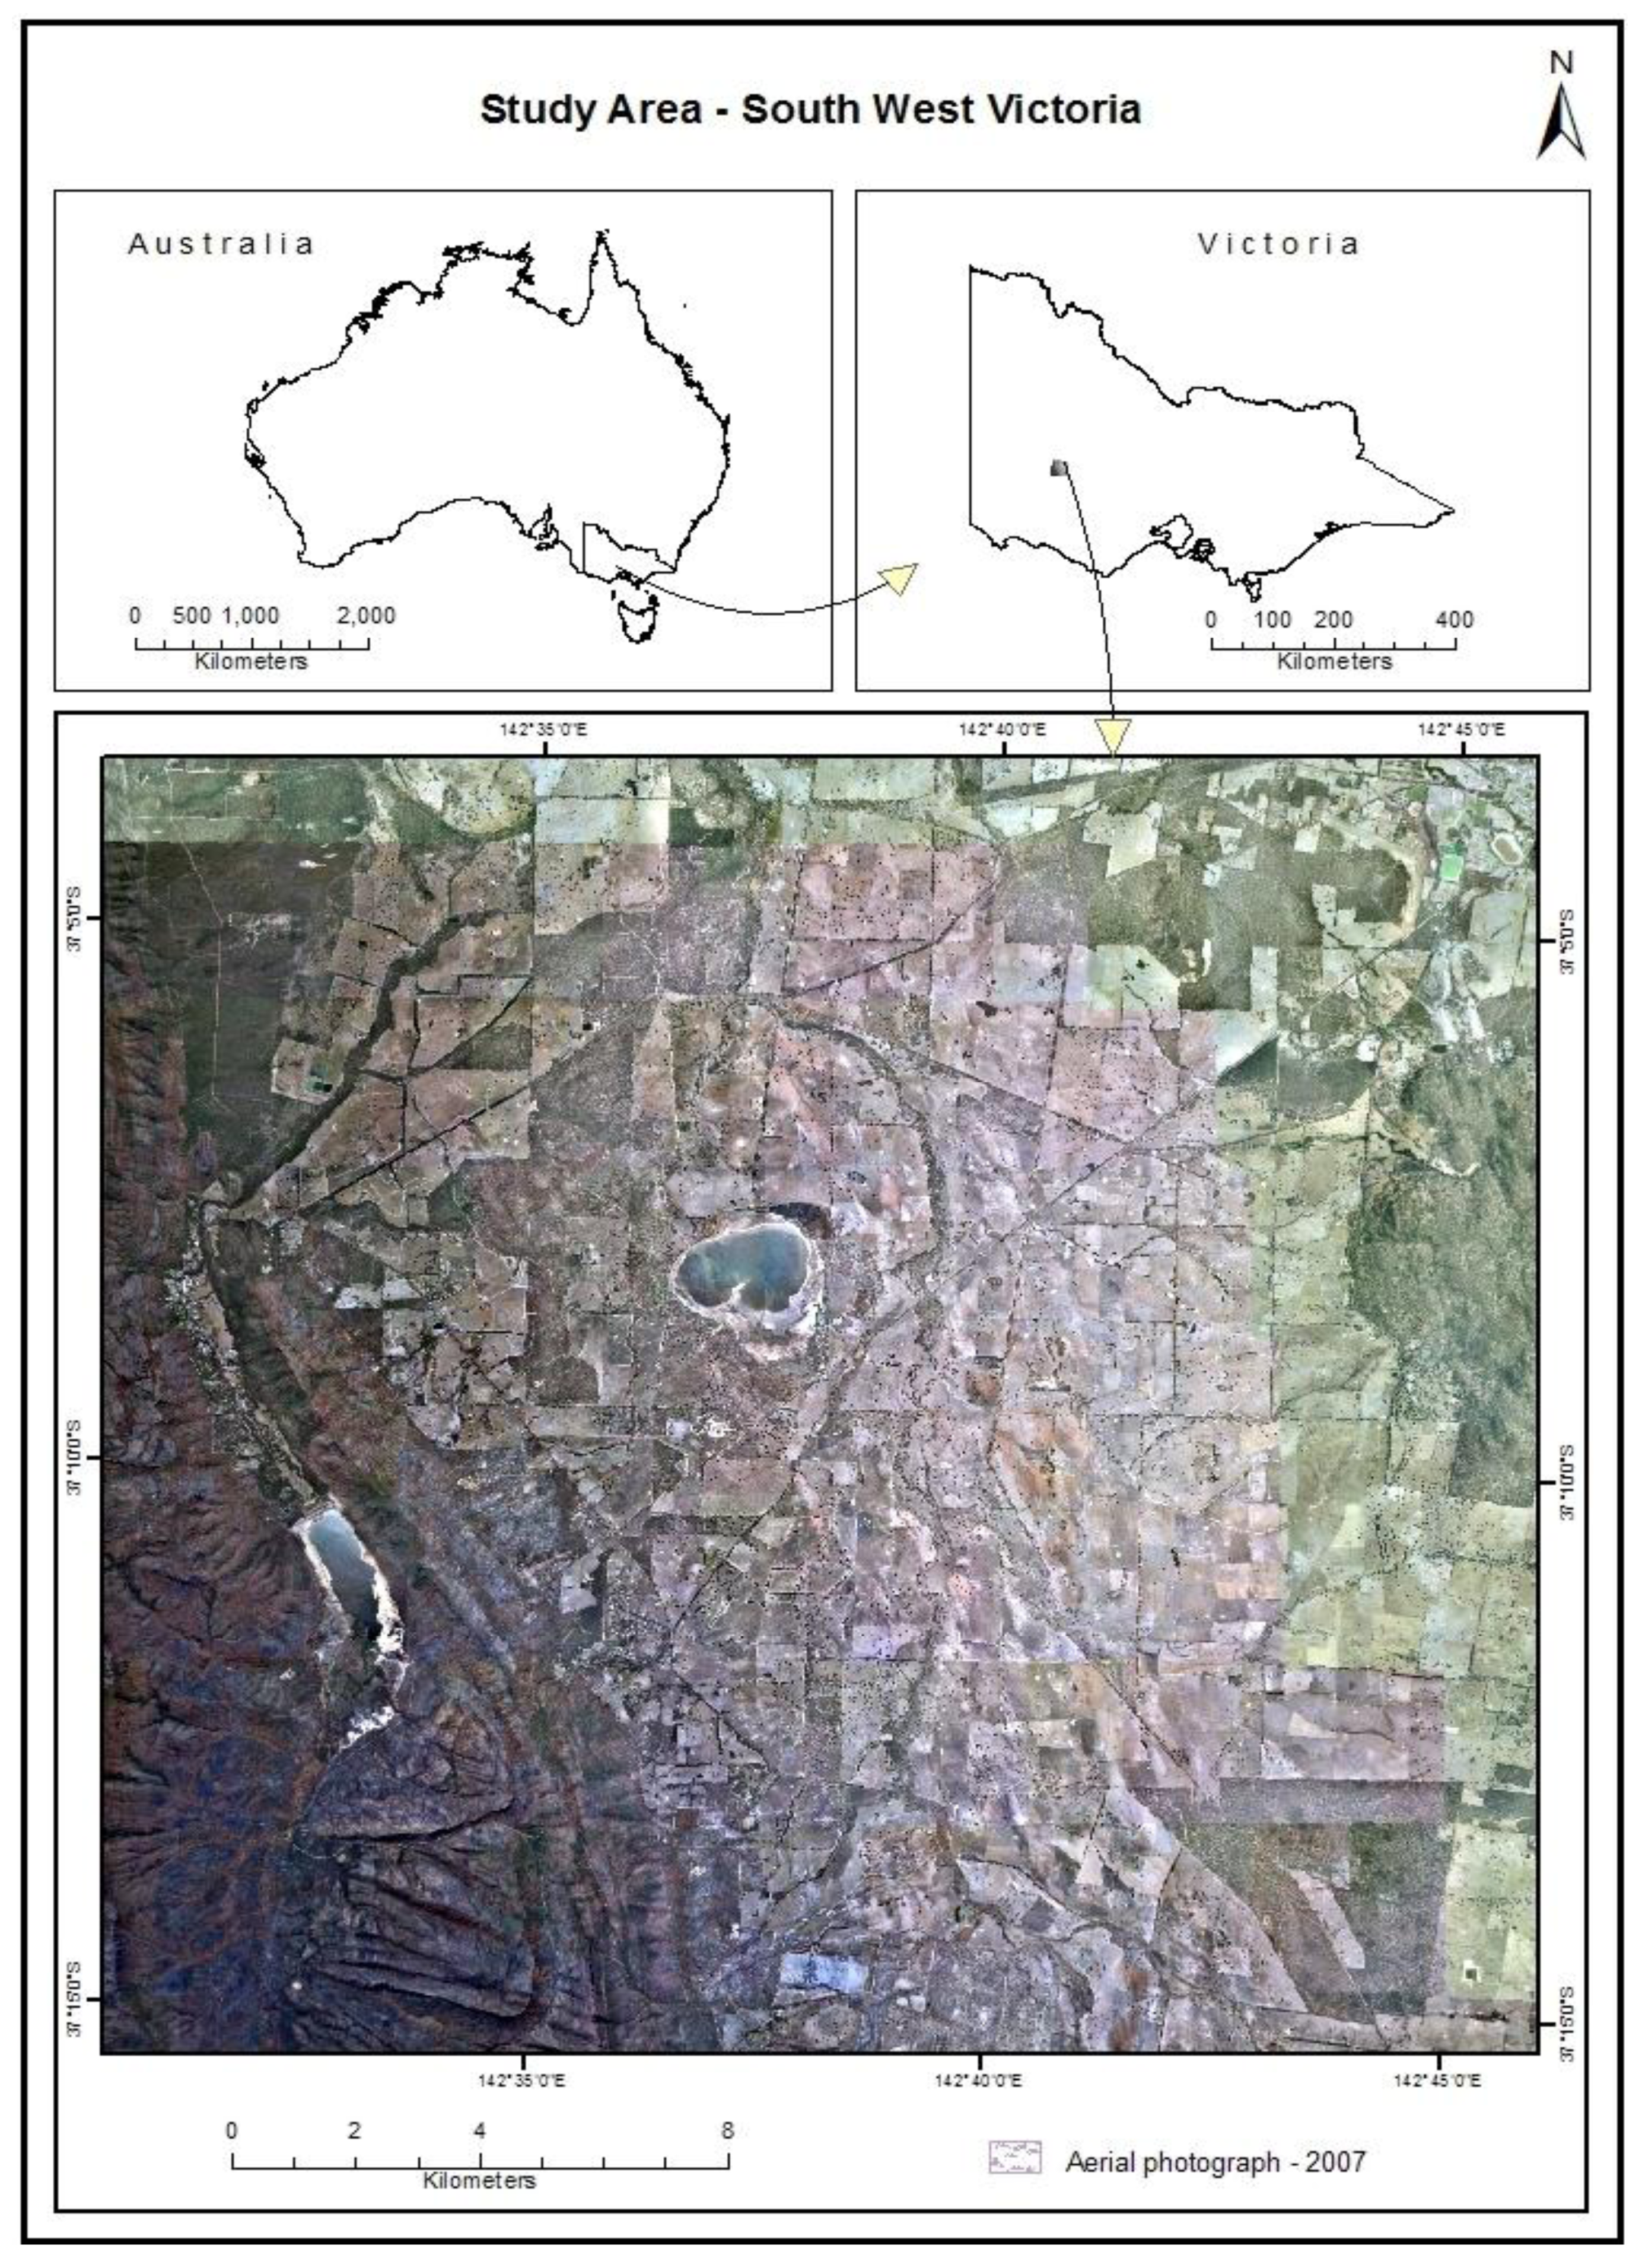
Advancements in 3D virtual environment technologies offer an innovative way to explore real world environmental processes in order to manage resources. The virtual representation of complex phenomena and their information may benefit policy-makers, as well as a range of professional users including foresters, urban and regional planners, and landscape architects. In the following sections, the advantages of generating 3D virtual environments by using the integrated suite of geo-visualisation tools, which provides an interface to Landscape Object Library, have been explored and evaluated in the South West part of Victoria and some preliminary evaluation has been undertaken (Figure 8).
These applications are not part of actual planning studies in the region, although the issues explored in each case are very real. They were chosen to interest particular clients within the government partners and to show the versatility of the system in the context of the rural landscape. The next challenge would be an urban application.
The study area is located approximately 215 km west of Melbourne, near the Grampian Ranges in the Wimmera Catchment Management Authority area. It is approximately 46,000 ha in size and contains various national parks. The elevation range is 185–802 m Above Sea Level (ASL).
In Figure 8, lower left of the study area map shows the eastern boundary to the Grampian Ranges, which is a national park and comes under protected area [18]. The remainder of the area is arable land. Approximately 70% of the arable land, in the study area, is used for mixed farming and grazing practices. Approximately 20%, contains native hardwood and woody vegetation and approximately 10% is used for other activities. In terms of non-endangered wildlife in the Grampians and the surrounding landscape, Kangaroos and Emus are quite common. On the other hand, Sugar Gliders, Bandicoots, Koalas, Wallabies, Black Cockatoo, Boobook Owls etc may be vulnerable or endangered [19].
Various data layers have been brought together to create the underlying geodatabase. The DEM is one of the most significant layers in terms of topography, whereas aerial photographs help to show the landscape homogeneity and heterogeneity in terms of land use type and cover. In addition, out of 16 ecological vegetation classes in the study area, the existing top ten (covering approximately 70% of the study area) were taken into consideration in order to identify the indicative vegetation cover.
The vegetation density has been categorised and mapped as low, moderate and high. Soil salinity and surface water availability layers of the study area were also used. The soil salinity layer describes the salinity component with a scale of low, moderate and high, while the surface water availability layer is obtained via a classified satellite image and shows surface water locations. The reason for bringing together these spatial data layers is to enhance participants' understanding and thinking about the study area.
In the present case, we show how the Landscape Object Library and the support of the integrated suite of geo-visualisation tools could be used to investigate a particular landscape planning scenario. In the past 200 years, many different Australian species have become extinct [20]. One of the reasons that a species becomes endangered is their dependence on a specific food or habitat, and if these disappear, the species will not survive.
Finding a solution requires analysis, planning and action (implementation). Once scientific analysis has been undertaken, planning is done and implementation starts, it takes a long time to realise the impact of the agreed measures. To illustrate an example of the Landscape Object Library and supporting suite of geo-visualisations tools we applied this in these in the context of a hypothetical landscape planning scenario using real data to design a biolink. We selected an area between a water body and a national park (dense vegetation) within our study area. Figure 9 shows there is a gap between the water body (in the upper right) and the dense vegetation cover (in the lower left).
This vegetation gap is an obstacle in terms of access to the water body by native species. To help these species, better connectivity and coverage of the vegetation is required-the vegetation will act as a wildlife corridor to support movement across the landscape. Once this is created, the endangered animal species are better protected and can also make use of the new habitats.
In a participatory planning session (experts from different groups such as scientists, stakeholders, planners and so forth come along and do planning) when users design a number of biolinks (groupings of one or more ecological vegetation classes) they draw polygons and select a vegetation type for each polygon from the selection window (Figure 10). Figure 10 illustrates the top ten dominant ecological vegetation classes of the study area and five plantation types including for example a windbreak. After drawing a biolink in the ArcMap interface, users can select a particular polygon and assign a vegetation type. In Figure 10, each picture under “Chose the EVC” section shows how the ecological vegetation class looks with the group of member objects and their typical distribution.
Figure 11(a) shows a biolink drawn in a participatory planning session using the touch table interface. The user defined design scenario establishes the connectivity between the existing natural vegetation patches. A biolink is generally comprised of multiple ecological vegetation classes. The assignment of ecological vegetation classes to each individual polygon is illustrated to show the functionality of the Landscape Constructor tool and the Landscape Object Library. In Figure 11(b), we extended the biolink by adding the whole farm area to increase the vegetation cover.
In the participatory planning session when the users finish their plan by designing a biolink, after assigning and spatially locating ecological vegetation classes and exporting these, an automated process happens within the software. This automated background process is driven by users and occurs when users start exporting the designed 2D scenarios (biolink or whole farm) to SIEVE. The action is led by a program called “Active 3D Visualisation”, which is a function in the Landscape Constructor toolbar, and triggers when a user clicks this function. As export and conversion from 2D to 3D scenario starts, the software reads the polygons (biolink components) one by one. It first reads the vegetation type, which is assigned during the design session (Figure 10), of the first polygon and establishes the connection with the remote Landscape Object Library. As the Landscape Object Library is secure, needing a username and password to access it, we hardcoded the username and password for demonstration purposes. The program starts querying the rule-based database and retrieves information for the respective ecological vegetation class (Figure 5).
After, retrieving information from the database, the Active 3D Visualisation program not only calculates the density (calculations) for each polygon which is assigned with an ecological vegetation class name or plantation type, but also starts downloading the respective objects from the Landscape Object Library (rule-based database) onto the SIEVE installed machine (network or local, Figure 7). Additionally, Active 3D Visualisation program establishes a link between ArcMap and SIEVE for communicating avatar location through bidirectional information exchange, known as Live Link [15]. Avatar is a virtual representation of a farmer, scientist, policy maker and so forth, and embedded in the SIEVE.
The positioning of objects in SIEVE occurs two ways: (i) random and (ii) row or column. The ecological vegetation class objects are randomly distributed, whereas agricultural plantation type objects follow row or column pattern. The number of the objects, based on a predefined density, is calculated using the polygon area, which is calculated by the software program during export.
For each ecological vegetation class and plantation type, the average density is taken into consideration to calculate the density of objects in each individual polygon [21], which is found in Victoria. Once this conversion is done, the simulated 3D virtual environment can be viewed in SIEVE. Figure 12 depicts the 3D virtual environment in SIEVE, and shows all the polygons with the respective digital objects placed in them as imported from the Landscape Object Library.
Creating a 3D virtual environment using this approach helps the user to make changes in their 2D plan that is developed in the GIS environment and view them interactively in the 3D virtual environment immediately. Figure 12 shows the whole farm and biolink with existing flora in the 3D virtual environment. The extended connecting vegetation corridor can now be observed between the water body and the existing vegetation patches.
The implementation of this landscape planning scenario could potentially support endangered animal species to establish their habitats and move around, and also help the establishment of new ecosystem services in the form of woody vegetation, which could contribute to a drop in the watertable and decrease in salinity.
Moreover, using the suite of integrated geo-visualisation tools and the Landscape Object Library, wind farm planning (for the production of electricity) is a further potential application of this participatory system. There are currently wind turbines captured as digital objects and the DEM data layer is available for the study area. To plan a wind farm effectively, requires scrutiny of some additional data i.e. wind speed, altitude and consideration of environmental and aesthetic impacts, which are currently unavailable in the existing prototype system.
Once all of these parameters are finalised, the Landscape Constructor tool could be used to demarcate the location of each wind turbine on a 2D map using a touch table and view the resulting landscape in the 3D virtual environment by importing the objects from the Landscape Object Library.
Renewable energy planning can potentially provide positive stimulus to the economy of the region and long term sustainability benefits [22]. In Figure 13, we used this approach to simulate the siting of wind turbines as part of a whole farm plan.
In this paper, we have illustrated some possible applications in landscape planning, which demonstrate the functionality of the Landscape Constructor workflow interface and supporting Landscape Object Library. The Landscape Constructor workflow can enable the formulation and exploration of future land use change scenarios through a participatory planning process. However, what is important is the utility of an integrated suite of geo-visualisation tools for ultimately informing real world planning and decision-making.
6. Preliminary Evaluation of Landscape Object Library and Loosely Coupled Geo-Visualisation Tools
The Landscape Object Library and the enabling suite of integrated geo-visualisation tools presented in this paper have been demonstrated to a variety of potential end users in Victoria. These include: farmers, agricultural extension officers, scientists, information and technology experts, biodiversity experts, land and fire response teams, private consultants, urban and regional planners, and policy-makers. A preliminary questionnaire survey was administered at a workshop in July 2010 where around 20 participants were involved primarily from a primary industries knowledge information and technology background. The survey elicited feedback on the potential real world application of the geo-visualisation tools.
A 5 point likert scale was used to ascertain how useful the integrated suite of geo-visualisation tools and supporting Landscape Object Library were perceived for a number of application domains including agriculture and natural resource management, biodiversity planning, participatory decision making processes, urban and regional planning, emergency response and climate change adaptation planning.
The average response value for the 20 participants ranged from 3.8 for biodiversity planning up to 4.45 for agriculture and natural resource management. One participant suggested that “it would be useful to include more datasets, including groundwater data.” Another participant suggested that the geo-visualisation tools could also be useful for risk management, drought assistance and nutrient management planning. Finally, it was suggested that “there may be more advanced tools for 3D rendering”, however the 2D functionality is extremely useful in itself and will lead to broader uptake and support”. Whilst this feedback is only preliminary it does indicate a generally positive response on the potential application for a range of planning and decision support purposes. However, further research is required to undertake more scientifically robust evaluation of the Landscape Object Library and enabling geo-visualisation tools to support participatory planning and decision-making.
7. Conclusions
The Landscape Object Library and the enabling suite of geo-visualisation tools provide a powerful visual communication medium. Such tools can be integrated and utilised for a range of landscape planning tasks as demonstrated in this paper. Pettit et al. [23] identify strengths and weaknesses of future landscape visualisation based on users' feedback. They found that strengths are counted as access to visual information, planning and investment, learning tool, policy development and adjustment and so forth, whereas weaknesses are communication and presentation, stakeholder engagement, capacity to interpret and use, and scale and framing.
In our work, we have developed a loosely coupled workflow of a number of geo-visualisation tools that may support participatory planning and decision-making. In our case study, we have demonstrated the potential of the Landscape Object Library in conjunction with the integrated geo-visualisation tools that include: a GIS based Landscape Constructor tool, a modified version of a 3D game engine SIEVE (Spatial Information Exploration and Visualisation Environment) and an interactive touch table display. However, there remains a number of technical and end user challenges that still need to be addressed.
The next steps in the research include populating additional Victorian landscape digital objects in the Landscape Object Library to support a wider and richer range of landscape planning tasks. Technical development is underway to create a Google Earth 3D visualisation link directly to the ArcGIS Landscape Constructor extension to enable planning scenarios to be viewed within the Google Earth interface.
The potential linkage of the Landscape Object Library with other 3D virtual environment viewers such as ArcScene, NASA Worldwind or other game engines is also a possibility. Furthermore, incorporating multi-touch functionality (by using the NEC Touchscreen (LCD 5220) API) within the touch table would allow multiple simultaneous users around a touch table each developing separate scenarios or components of scenarios, to be compared or integrated as part of the participatory planning processes. Finally, further work is required to undertake usability and usefulness testing with state government planners and policy-makers in Victoria as such technologies become more widely used.


| Web link | Service type | Types of objects | Formats |
|---|---|---|---|
| http://sketchup.google.com/3dwarehouse/ | Free | Aircraft, spacecraft, architecture, textures and environments, weapons, human, materials, military and, etc. | Google SketchUp (.skp) |
| http://artist-3d.com/ | Free | Life forms, nature, architecture, electronics, household, transportation etc. | 3D Studio Max (.3ds) Poser (.pz3, .pp2) |
| http://www.the3dstudio.com/ | Paid | Animals, architecture, furniture industrial lighting science/medical etc. | Autodesk 3D Studio Max Photoshop, Cinema 4D, Lightwave, Maya, Vue, Blender and many others |
| http://www.exchange3d.com/ | Paid | Aircraft, spacecraft, architecture, textures and environments, human, materials, military and weapons, water transport bikes & motorcycles, medical equipment, railroad models | Autodesk 3D Studio Max, Softimage∣XSI, Adobe Photoshop, Cinema 4D, Lightwave, Vue, Blender, and many others |
| http://www.lenne3d.com/ | Paid | Plants | 3D plants (.flora3d) and 3D objects (Collada/.dae) |
| http://www.3d02.com/ | Paid | Insects, weapons, plants, planes, office, cars, animals, sports, toons, planes, music etc. | Autodesk 3D Studio Max, Photoshop, Cinema 4D, Lightwave, Maya, Vue, Blender, OpenFlight(.flt), Poser (.pz3, .pp2) and many others |
| http://www.the3darchive.com/ | Paid | Animals, structure, star track vehicles, toys, shapes, nature, machine, computer, clothes etc. | Quick3D (.q3o and .q3s) |
Acknowledgments
The authors would like to recognize a number of organizations that have provided support in developing the various technology components discussed in this paper. These include: the Collaborative Research Centre for Spatial Information (CRC-SI), the Victorian eResearch Strategic Initiative (VeRSI), the University of Melbourne, the Victorian Department of Sustainability and Environment (DSE) and the Victorian Department of Primary Industries (DPI).
References
- Williams, K.J.H.; Ford, R.M.; Bishop, I.D.; Loiterton, D.; Hickey, J. Realism and selectivity in data-driven visualisations: A process for developing viwer-oriented landscape surrogates. Landsc. Urban Plan. 2007, 81, 213–224. [Google Scholar]
- Mansergh, I.; Lau, A.; Anderson, R. Geographical Landscape Visualisation in Planning Adaption to Climate Change in Victoria, Australia. In Landscape Analysis and Visualisation; Pettit, C., Cartwright, W., Bishop, I., Lowell, K., Pullar, D., Duncan, D., Eds.; Springer: Berlin/Heidelberg, Germany, 2008; pp. 469–487. [Google Scholar]
- MacEachren, A.M.; Pike, W.; Yu, C.; Brewer, I.; Gahegan, M.; Weaver, S.D.; Yarnal, B. Building a geocollaboratory: Supporting Human-Environment Regional Observatory (HERO) collaborative science activities. Comput. Environ. Urban Syst. 2006, 30, 201–225. [Google Scholar]
- Lange, E.; Hehl-Lange, S.; Berwer, M.J. Scenario-Visualization for the assessment of perceived green space qualities at the urban-rural fringe. J. Environ. Manag. 2008, 89, 245–256. [Google Scholar]
- Stock, C.; Bishop, I.D.; O'Connor, A.N.; Chen, T.; Pettit, C.J.; Aurambout, J-P. SIEVE: Collaborative decision-making in an immersive online environment. Cartogr. Geogr. Inf. Sci. 2008, 35, 133–144. [Google Scholar]
- Lammeren, R.V.; Ligtenberg, A.; Serpa, João.; Abreu, J.; Plezier, I. Geo-visualisation–The e-interaction Factor in Spatial Planning. In Imaging the Future; Brink, A.V.D., Lammeren, R.V., Velde, R.V.D., Däne, S., Eds.; Wageningen Academic Publishers: Wageningen, The Netherlands, 2007; Volume 3, Chapter 6; p. 89. [Google Scholar]
- Graf, K.C.; Suter, M.; Hagger, J.; Meier, E.; Meuret, P.; Nuesch, D. Perspective terrain visualization - a fusion of remote sensing, GIS and computer graphics. Comput. Graph. 1994, 18, 795–802. [Google Scholar]
- Bishop, I.D.; O'Connor, A.N.; Stock, C. Representation of Modelling Data in Virtual Worlds. In MODSIM 2007 International Congress on Modelling and Simulation; Oxley, L., Kulasiri, D., Eds.; Modelling and Simulation Society of Australia and New Zealand: Canberra, Australia, 2007; pp. 3091–3097. [Google Scholar]
- Ervin, S.M. Digital landscape modeling and visualization: A research agenda. Landsc. Urban Plan. 2001, 54, 49–62. [Google Scholar]
- Pettit, C.; Wu, Y. A Virtual Knowledge World for Natural Resource Management. In Landscape Analysis and Visualisation; Pettit, C., Cartwright, W., Bishop, I., Lowell, K., Pullar, D., Duncan, D., Eds.; Wichmann: Berlin/Heidelberg, Germany, 2008; pp. 533–550. [Google Scholar]
- Pettit, C.; Sheth, F; Harvey, W; Cox, M. Building a 3D Object Library for Visualising Landscape Futures. Proceedings of 18th World IMACS Congress and MODSIM09 International Congress, Cairns, Australia, 13–17 July 2009.
- Döllner, J.; Hinrichs, K. An object-Oriented Approach for Integration 3D Visualisation Systems -and GIS. Comput. Geosci. 2000, 26, 67–76. [Google Scholar]
- Friese, K.-L.; Herrlich, M.; Wolter, F.-E. Using game engines for visualisation in scientific applications. New Front. Entertain. Comput. 2008, 279, 11–22. [Google Scholar]
- Herwig, A.; Kretzler, E.; Paar, P. Using Games Software for Interactive Landscape Visualisation. In Visualisation in Landscape and Environment Planning: Technology and Application; Bishop, I.D., Lange, E., Eds.; Taylor & Francis: London, UK, 2005; pp. 62–67. [Google Scholar]
- Chen, T.; Stock, C.; Bishop, I.; Pettit, C. Automated Generation of Enhanced Virtual Environments for Collaborative Decision Making Via a Live Link to GIS. In Landscape Analysis and Visualisation; Pettit, C., Cartwright, W., Bishop, I., Lowell, K., Pullar, D., Duncan, D., Eds.; Wichmann: Berlin/Heidelberg, Germany, 2008; pp. 571–589. [Google Scholar]
- Arciniegas, G.A.; Janssen, R. Using a Touch Table to Support Participatory Land Use Planning. Proceedings of 18th World IMACS Congress and MODSIM09 International Congress, Cairns, Australia, 13–17 July 2009.
- Bhandari, C.; Sharma, S.C.; Bishop, I.D.; Pettit, C. Visualizing future Biolinks using touchtable – New dimensions in planning. Proceedings of Joint International Conference on Theory, Data Handling and Modelling in GeoSpatial Information Science, Hong Kong, China, 26–28 May 2010.
- Protected Matters Search Tool. Available online: http://www.environment.gov.au/arcgisframework/apps/pmst/pmst.jsf (accessed on 11 July 2011).
- Wildlife–Grampians. Available online: http://www.visitvictoria.com/displayobject.cfm/objectid.0002D50C-9AA4-1FDF-991080C476A90000/ (accessed on 11 July 2011).
- Short, J; Smith, A. Mammal Decline and Recovery in Australia. J. Mammal. 1994, 75, 288–297. [Google Scholar]
- EVC DSE. Available online: http://www.dse.vic.gov.au/conservation-and-environment/ecological-vegetation-class-evc-benchmarks-by-bioregion (accessed on 15 December 2011).
- Bhatt, V.; Friley, P; Lee, J. Integrated energy and environmental systems analysis methodology for achieving low carbon cities. J. Renew. Sustain. Energy 2010, 2, 031012. [Google Scholar]
- Pettit, C.; Raymond, C; Bryan, B; Lewis, H. Identifying strengths and weaknesses of landscape visualization for effective communication of future alternatives. Landsc. Urban Plan. 2011, 100, 231–241. [Google Scholar]
© 2011 by the authors; licensee MDPI, Basel, Switzerland. This article is an open access article distributed under the terms and conditions of the Creative Commons Attribution license (http://creativecommons.org/licenses/by/3.0/).
Share and Cite
Sharma, S.; Pettit, C.; Bishop, I.; Chan, P.; Sheth, F. An Online Landscape Object Library to Support Interactive Landscape Planning. Future Internet 2011, 3, 319-343. https://doi.org/10.3390/fi3040319
Sharma S, Pettit C, Bishop I, Chan P, Sheth F. An Online Landscape Object Library to Support Interactive Landscape Planning. Future Internet. 2011; 3(4):319-343. https://doi.org/10.3390/fi3040319
Chicago/Turabian StyleSharma, Subhash, Christopher Pettit, Ian Bishop, Pang Chan, and Falak Sheth. 2011. "An Online Landscape Object Library to Support Interactive Landscape Planning" Future Internet 3, no. 4: 319-343. https://doi.org/10.3390/fi3040319
APA StyleSharma, S., Pettit, C., Bishop, I., Chan, P., & Sheth, F. (2011). An Online Landscape Object Library to Support Interactive Landscape Planning. Future Internet, 3(4), 319-343. https://doi.org/10.3390/fi3040319