Article

Intercepting and Monitoring Potentially Malicious Payloads with Web Honeypots

by
Rareș-Mihail Visalom
1,*,
Maria-Elena Mihăilescu
1,
Răzvan Rughiniș
1 and
Dinu Țurcanu
2
1
Computer Science and Engineering Department, Faculty of Automatic Control and Computers, National University of Science and Technology POLITEHNICA Bucharest, 060042 Bucharest, Romania
2
Faculty of Electronics and Telecommunications, Technical University of Moldova (UTM), MD-2004 Chisinau, Moldova
*
Author to whom correspondence should be addressed.
Future Internet 2025, 17(9), 422; https://doi.org/10.3390/fi17090422
Submission received: 8 August 2025 / Revised: 1 September 2025 / Accepted: 8 September 2025 / Published: 17 September 2025
(This article belongs to the Section Cybersecurity)

Abstract

The rapid development of an increasing volume of web apps and the improper testing of the resulting code invariably provide more attack surfaces to potentially exploit. This leads to higher chances of facing cybersecurity breaches that can negatively impact both the users and providers of web services. Moreover, current data leaks resulting from breaches are most probably the fuel of future breaches and social engineering attacks. Given the context, a better analysis and understanding of web attacks are of the utmost priority. Our study provides practical insights into developing, implementing, deploying, and actively monitoring a web application-agnostic honeypot with the objective of improving the odds of defending against web attacks.

1. Introduction

More and more web applications are being developed and deployed on the Internet. This phenomenon dramatically increased in intensity with the rise of Internet of Things (IoT) devices [1]. In other words, more and more web applications, APIs and devices are connecting to the Internet, sometimes in unsafe configurations.
There is a fine balance between security, functionality, and usability that developers need to satisfy before launching a product. This topic is commonly known as the usability triangle [2,3]. The pressure to deliver is often what makes finding the balance a very difficult objective. More code is being developed under pressure, which might provide attackers with the entry points they need to critically exploit a system or whole infrastructures.
However, the need to have secure assets is widespread throughout the industry. The Verizon 2025 Data Breach Investigations Report [4] states that there has been a 34% increase in attackers who exploit vulnerabilities to gain an initial foothold over a system. This indicates that attackers are becoming better at first discovering and then exploiting vulnerabilities. The same source also states that ransomware was present in 44% of the breaches analyzed and that the average payout for ransomware was USD 115,000. The real cost of a data breach is very hard to estimate, since the total cost involves reputation damage, potential fines (e.g., GDPR), disaster recovery costs, and others. Moreover, the breach itself might lead to a data leak that discloses Personally Identifiable Information (PII) of real people. This PII (social security numbers, phone numbers, email addresses, etc.) could then be used by attackers to carry out social engineering attacks [5] and directly affect victims, as opposed to the owner of the breached system.
In such an adversarial environment, it is essential to maintain a robust cybersecurity posture and not compromise security in favor of functionality or usability. However, deliberately insecure web applications are deployed throughout the Internet with the intention of luring attackers into disclosing their modus operandi (M.O.). This type of system is usually called a honeypot and is frequently used by security researchers to uncover new attack steps performed by attackers.
Our research focuses on developing a web application honeypot capable of providing a configurable and easily customizable process for filtering web application-agnostic logs with the aim of detecting particular classes of attack vectors. Custom filtering via specialized queries performed within a centralized dashboard is the strength of our research idea. The attack vectors that our research focuses on are detailed in Section 5 and are only a subset of the total possible web application attack classes. In addition, we provide future work ideas that could further enhance the detection capabilities in Section 6. We will first discuss the alternatives available in Section 2 to understand the context in which web application honeypots operate. We then discuss our design in Section 3 and highlight the objectives we have set for our desired infrastructure in terms of deployment, monitoring capabilities, and overall security. We then provide a detailed discussion on the technologies we employed. Section 4 touches on the topics of how log analysis is performed and how this benefits the threat intelligence sharing process. The results of our work are presented in Section 5.

2. State of the Art

The core idea of exposing a honeypot to the Internet implies that the owners of the honeypot want attackers to interact and attempt to actively exploit it. The attack vectors employed by the attackers could be known exploits or, in rare cases, totally novel methods that could be seen for the first time. Security researchers should be able to closely monitor the activity and actions performed in the honeypots. Moreover, the degree of interactivity between attacker and honeypot needs to satisfy a threshold that would make the honeypot appear as a realistic target to attack [6]; otherwise, attackers might avoid it.
The dynamics of the constantly improving detection capabilities of both defenders and attackers have led to indicators of deception (IoDs) being used as a metric of how easy it is to reveal a honeypot system [7]. This implies that unless certain measures are implemented by defenders, honeypots are easily uncovered. In this context, one of the challenges is maintaining a realistic posture while taking advantage of the control that a honeypot should offer. This conflict between defenders constantly improving detection rates and attackers attempting to avoid detection has been observed in the context of password attacks [8] and has been called an “adversarial arms race”. Another byproduct of this battle is the rise of anti-honeypot technologies [9].
As a consequence, the prerequisites of a secure honeypot could be formalized as three main components: security, logging, and threat intelligence sharing. Security should be ensured so that the presence of the honeypot does not compromise third-party components or the infrastructure inside which it is hosted. Logging allows logs to be collected from multiple sources to ensure the proper monitoring of attacker actions. Threat intelligence sharing allows logs to be correlated with the information originating from other providers also monitoring their assets. It is very important to note that the concept of honeypots could be applied to a potentially unlimited range of fields. The honeypot could monitor widely accessible web technology such as a web server or it could be geared towards Industrial Control Systems (ICSs) and SCADA systems [10]. The same methods could also be used to detect malicious activity at the hardware level in the context of Internet of Things (IoT) devices [11].
A brief introduction to the various alternatives of web application honeypots is discussed in Section 2.1. Then each of the three prerequisites will be analyzed in detail in the context of the ELK Stack in Section 2.2, Section 2.3 and Section 2.4.

2.1. Web Application Honeypots

The concept of honeypots is vast and implies using any service as a potential bait for attackers. The more services are used on the same host, the more complex the infrastructure becomes. There is a fine balance between the set of services that the honeypot can expose and the amount of logs that the monitoring process needs to instrument. This is one of the reasons why our research focuses on web honeypots only.
The majority of the multi-platform honeypots offer a set of choices of services to expose. Instead, our research focuses on designing and deploying an infrastructure that is not centered on a definite set of technologies. We aim to offer a highly customizable infrastructure that users could adapt to their needs by using the type of web app they need.
In our research, we considered some of the available alternatives for potential inspiration. The requirements on which we based our research were as follows:
  • To design a honeypot focused on analysis of HTTP activity.
  • The exposed web application should be as realistic as possible, ideally a fully fledged web application that offers varied interaction to the users.
  • Integrated monitoring capabilities to perform queries over the logged HTTP activity.
  • Honeypot infrastructure should be web application-agnostic, replacing the web app with any other choice but keeping the logs in the same locations should work as expected initially.
To respect all the requirements, especially the last one, the infrastructure needs to be designed with loosely coupled components, as described in Section 3. This requirement enables us to replace components if needed and still maintain functionality.
The available honeypots were evaluated based on the following criteria:
  • Geared towards either a certain service or to a collection of services.
  • Limited to a single technology for the HTTP service.
  • Focused on detecting certain vulnerabilities.
  • Loosely coupled components enabling future customization of the infrastructure.
The honeypots that we assessed were DShield [12], SNARE [13], OpenCanary [14] and T-Pot [15]. Before we discuss each of them in order, Table 1 summarizes the differences between them and how they relate to the criteria we defined above.
DShield is a multi-platform honeypot that exposes SSH, Telnet and HTTP. So, it offers slightly more than what our research aims to offer, but nevertheless it is a good candidate. It has a single HTTP server, which means that it is limited in the number of HTTP technologies that can be instrumented. Moreover, this also implies that it is tightly coupled to the web server technology being used. The monitoring part is different from any other solution. The logs will be sent remotely to a central third-party server hosted at isc.sans.edu. The dashboard will list all activity intercepted by the honeypot. This process requires an individual account to be able to send logs to the server. If on-site storage of sensitive logs is a requirement, then this solution might not be well suited. Also, past evaluation of DShield detection capabilities revealed that it might not be efficient at detecting certain classes of attacks, like SQL Injection Attacks [16].
The next candidate we evaluated was SNARE, which offers HTTP as the single service it monitors. This is in line with the needs of our research, although it is limited to this single HTTP service technology. Where our requirements diverge is the structure of the web application being exposed. SNARE clones a target website up to a specified depth. The cloning process will result in various .html pages, without the server-side functionality that the pages would handle. A consequence is that the web application will not be a fully fledged website. This might cause attackers to identify the deployment as a honeypot and completely avoid it. SNARE does not adopt a narrow view of particular vulnerabilities. The events are evaluated by another component, TANNER [17], which is out of the scope of this current research. The fact that threats are identified by another component adds to the loosely coupling requirement, but the solution is tightly coupled in relation to the type of web application it can expose (only HTTP-based pages).
OpenCanary provides more coverage in terms of services it exposes, and it includes SSH, Telnet, FTP and HTTP. Regarding the HTTP technology, it does not offer a selection of multiple servers and is focused on detecting only login attempts against the HTTP service. Although the first limitation might be accepted as a compromise, detecting only one single type of attack might limit the honeypot capabilities that we want. Changing the web server technology would require a refactoring of the code, which means that this solution is not loosely coupled to the web server technical stack.
The last candidate was T-Pot which is a multi-honeypot platform. This means that it bundles together multiple honeypots and aggregates the information collected by each of them. The amount of information being generated is of considerable proportions and it is displayed visually using Elastic Stack. There is no limit in terms of HTTP technology or web server and the focus is not narrowed on detecting certain types of vulnerabilities. The possibilities are very broad because of the use of so many individual honeypot technologies. This also means that it is loosely coupled to a particular web server technology, since it offers the choice of selecting between a wide range of honeypots to enable. The cost of such customization is a more complex installation process compared to other more simple solutions such as Honeytrap [18]. Another benefit of using T-Pot is the opportunity to implement automation to identify threats more quickly [19], by leveraging the enhanced logging capabilities of T-Pot.
For a more exhaustive list of open-source honeypots for various platforms, community-driven efforts [20] are a great starting point and more formal studies are also available [21].

2.2. Infrastructure Security Aspects

Analysis of any kind of malware or malicious activity demands highest level of security throughout the whole process. Since securing the infrastructure supporting the honeypot is non-negotiable, secure means of deployment are required.
To investigate a solution, we used a very basic threat model. We assumed that the honeypot is a vulnerable software deployed in the Internet. Moreover, attackers would connect to the honeypot and have a wide range of actions available to them, like trying to access various application endpoints and using any payload at their disposal when trying to submit forms. An abstracted top-level design of the infrastructure is summarized in Figure 1.
Any actor from the Internet would be able to access the web application directly. This includes both non-malicious users and attackers.
The web application sends access information and various other parameters to the monitoring stack. The objective of the monitoring stack is to collect, store and search these logs to be able to correlate meaningful information that will later reveal attack vectors.
Both the web application and the monitoring stack are located inside of the cloud infrastructure. The cloud infrastructure is what we want to protect at all costs in case the web application is compromised.
Under this threat model, the challenge becomes safely hosting an insecure web application without compromising the underlying infrastructure or any of its components. The answer is isolation of the unsafe application through various means.
Two brief examples of isolation will be discussed before moving forward. Various resources of a computational system can be isolated, but we will focus on filesystem isolation Isolation and network isolation as a starting point.
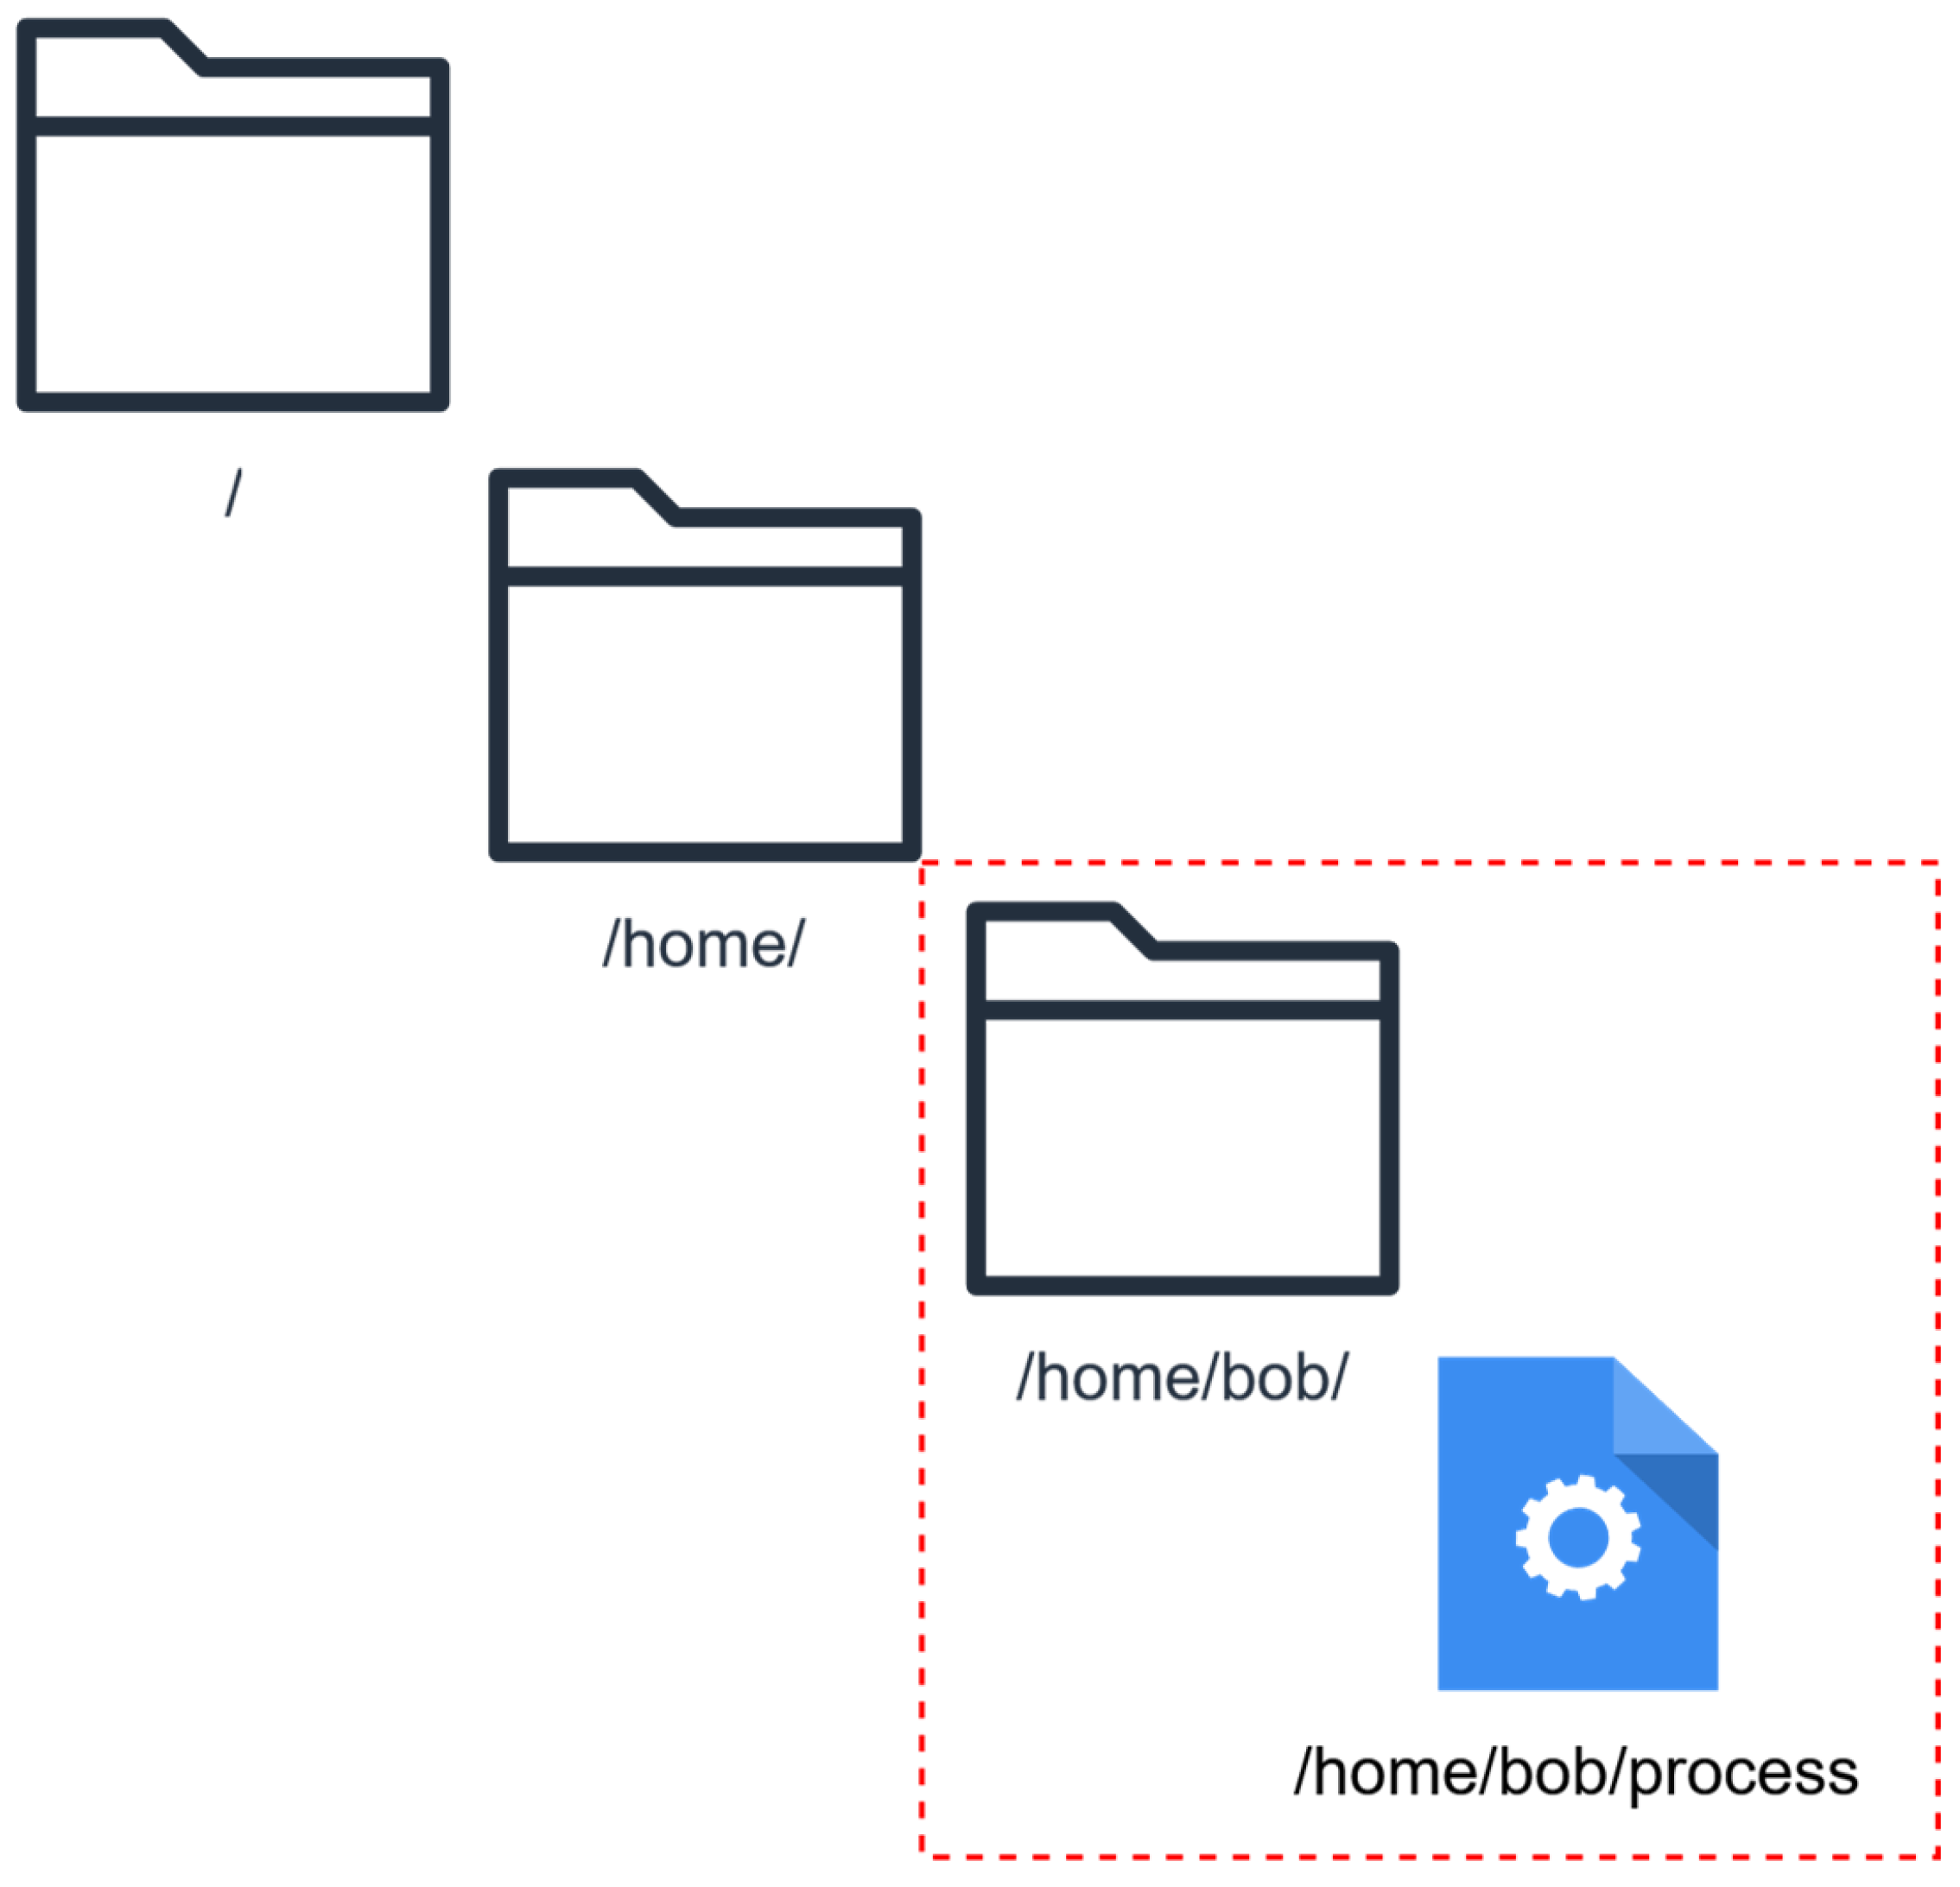
An example of filesystem isolation (also called sandboxing) is illustrated in Figure 2.
Figure 2 shows a filesystem that exists on the host operating system. Inside of this host filesystem, there is a sandbox located in the /home/bob/ directory. The /home/bob/process process is isolated within /home/bob/. The host operating system enforces the isolation and ensures that /home/bob/process cannot access any filesystem path outside the sandbox perimeter.
Filesystem isolation is very important for ensuring that a compromised process does not access sensitive files from the host operating system. Moreover, it ensures that a compromised process that drops malware on the filesystem does this in certain controlled locations that it is allowed to access and write to.
Network isolation is similar in the sense that it controls which networks are accessible and which are not. In other words, network traffic can be controlled and Internet access can be allowed or completely blocked at will. Again, this job of controlling network access falls under the responsibility of the host operating system. In Figure 3, two completely segregated networks are illustrated.
The networks are virtualized, so there is no hardware required to implement them. Instead, the networks are emulated in software and the host operating system prohibits packets from one network reaching the other.
Filesystem isolation and network isolation are the most important concepts used to secure our presumably unsafe web application. There is another form of isolation that is probably more subtle than either of them, and that is process isolation. In this form of isolation, the host operating system ensures that memory address spaces of isolated processes cannot access the memory address spaces of other processes. Moreover, processes running in the isolated space will not be able to communicate with processes outside of this space.
To date, we can summarize the resources that we want to isolate or abstract:
  • Filesystem.
  • Network.
  • Processes.
All three forms of isolation could be manually implemented through tools that use the Operating System Kernel API. An example of a basic sandbox implemented on a Linux system would be using chroot to confine a process inside a certain filesystem path. Similarly, Network Namespaces could be used to segregate networks.
Using each individual tool available to implement various types of isolation could be useful when granular control is required. Nevertheless, an automated, dedicated technology that is already using best practices to implement such functionality should be used, as it is most often more productive, efficient and secure.
At the same time, the performance trade-offs should be kept at a minimum. Taking into account all the aspects leads us to using containers as a means of deploying our infrastructure. Another potential candidate would have been using virtual machines. Although offering more isolation, the performance trade-off is costly and more resources are required to provide virtualization.
For our research, we concluded that using containers fits our use cases better than using virtual machines. The main advantages of using a Container Engine (also called a Container Runtime) are the following:
  • Cross-platform operability to deploy on a wide range of underlying host operating systems.
  • Automated deployments are instantiated most often by just running a script or a few commands.
  • Reproducible builds to create fresh environments if older ones get compromised.
  • Enhanced security via isolation of resources to ensure that the attacked web app does not compromise the rest of the infrastructure.
In terms of Container Engines (also called Container Runtimes), we have identified three main potential candidates:
  • Docker.
  • Podman.
  • LXC.
Docker is probably the most popular in the industry and has proven itself to be robust enough to be widely used in production environments. It is user-friendly, offers very good user experience and enjoys the support of a very wide community.
The alternative to Docker is Podman. Podman is almost identical in terms of user experience, the CLI interface is mostly compatible with that of Docker. Podman can use Dockerfiles with almost total interoperability and can also make use of Docker Compose. Containers exported from Docker can be imported into Podman and deployed seamlessly. Podman can take advantage of all the benefits offered by Docker.
LXC stands for Linux Containers and as its name suggests, it is deeply integrated within the Linux Kernel. The caveat of LXC versus Docker and Podman is that it offers less portability but more fine-grained control in the interaction with the host operating system.
Since our use case involves the deployment of lightweight containerized applications, the choice we faced was between Docker and Podman. Their interfaces might be almost identical, but the two engines have important implementation differences.
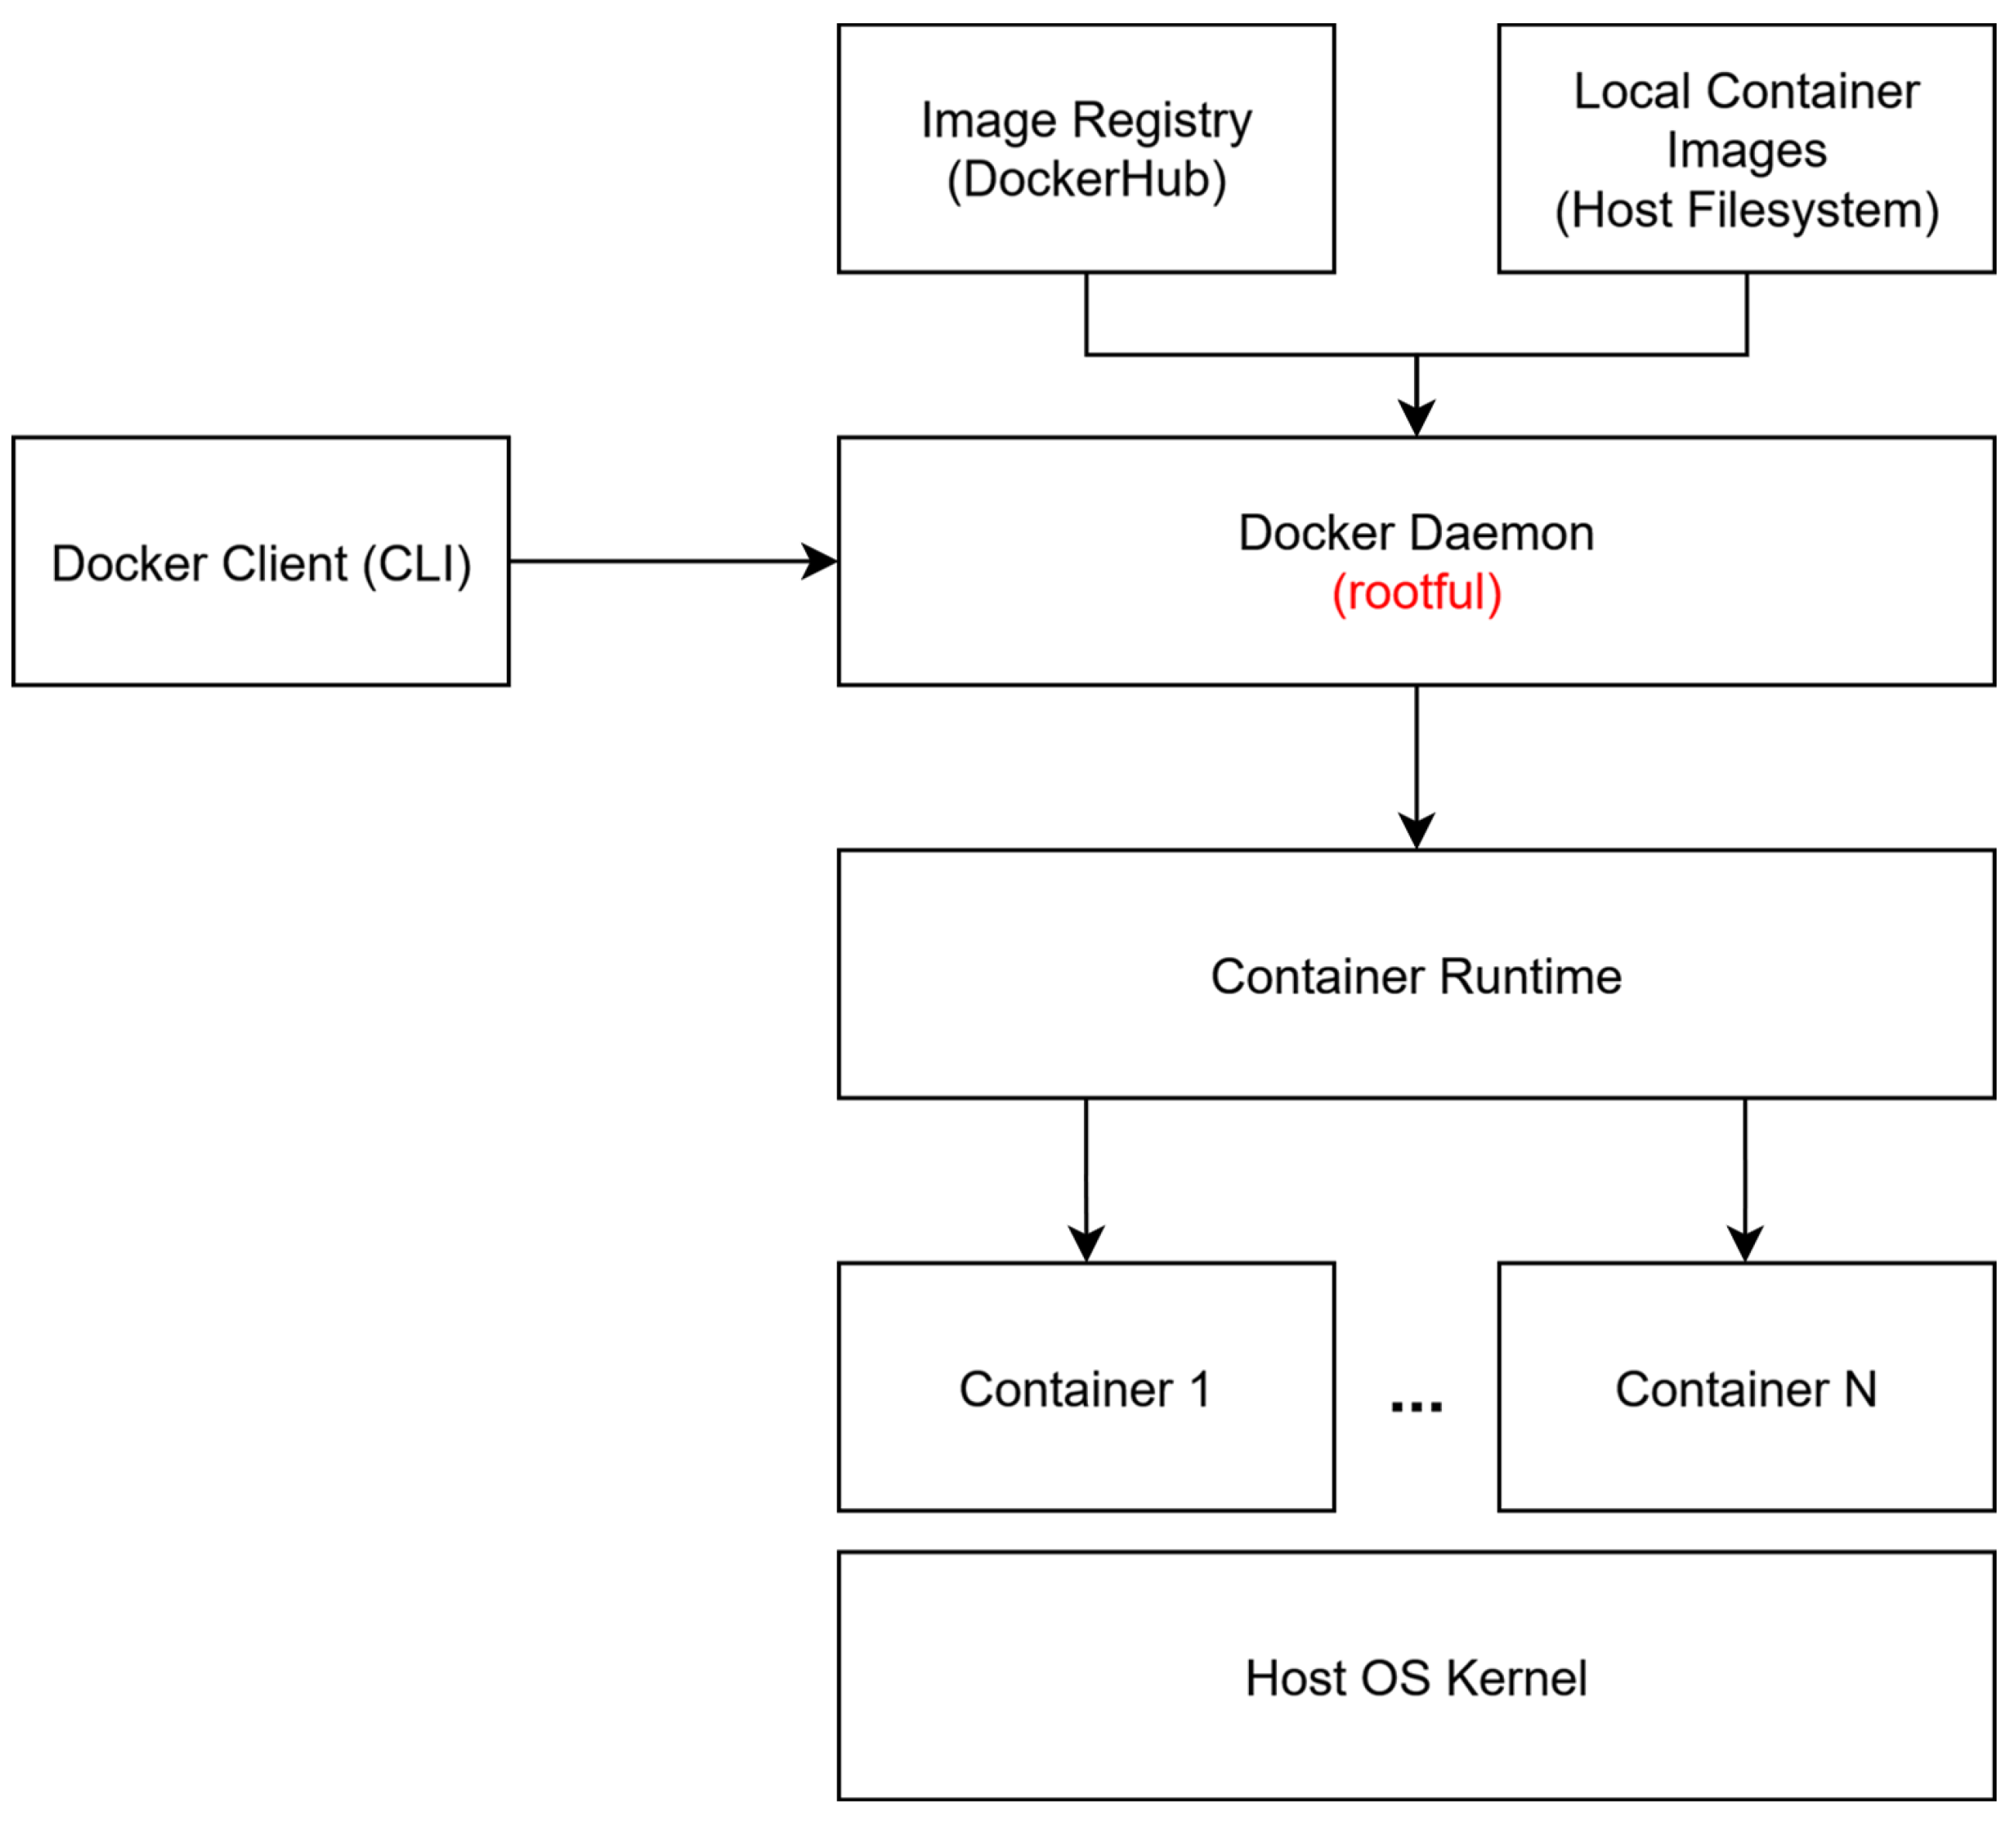
The key security concern of a default Docker installation is the use of the Docker Daemon. Figure 4 shows the architecture of Docker.
By default, the Docker Daemon runs with elevated privileges, also called Rootful Mode. This can negatively affect the security of the host operating system in case the container or the Container Engine is compromised. This is the main disadvantage of a default Docker installation.
By contrast, Figure 5 highlights a similar diagram, but with the benefit of not having a Daemon.
By default, Podman runs in Rootless Mode and without a Daemon.
To balance the differences, it is worth mentioning that Docker also offers Rootless Mode as an option. This still uses a Daemon, but without elevated privileges. This makes Podman and Docker Rootless almost identical alternatives from the user’s point of view.
Since the security implications of choosing between the two options are limited, we decided to use Docker Rootless as part of our research.

2.3. Logging Aspects

Elastic Stack is one of the most frequently used technology stacks to visualize logs of security events. One cause for this large adoption is its open-source license, which automatically marks it as a candidate for any project that requires a centralized dashboard for data aggregation. An added benefit is how easy it is to set up an instance and ingest logs into the system.
The logging process starts with the agents that monitor resources and create log entries based on how the resources change over time. These are called log shippers and are frequently used to monitor how certain files change. The deltas between two successive versions of the same file are then sent to another component that aggregates those log entries and stores them in a database for persistency. Then, the third component needed to complete the stack is the data visualization component that displays graphs and dashboards of the collected data.
In our research, the log shippers are Filebeat and Metricbeat. The component that aggregates the logs is Logstash which provides data to Elasticsearch. Elasticsearch enables users to perform queries over their data. Finally, the data visualization functionality is handled by Kibana.
More details about all the components are discussed in Section 3.

2.4. Correlate the Logs

Our analysis began with a simple process that first examined the URL of each request. The purpose of looking at the URL was to identify any malicious payload. A malicious payload is classified as an attempt to perform an attack. A nonexhaustive list of popular attacks is SQL Injection, Cross-Site Scripting, Command Injection and Remote Code Execution.
If the URL contained malicious payloads, then that request would be further examined. The user agent of the request would then be examined to see if it reveals any information about the origin or purpose of the request. Sometimes, well-known entities on the Internet will use certain values for the user agent HTTP Request Header to make it clear that they are scanning on purpose. This could be considered a basic fingerprinting mechanism. However, in other cases the user agent value is not to be trusted, since attackers frequently alter this value to try and mask their actions.
The next part of the evaluation of the request will focus on examining the source of the traffic. This starts with a look at the source IP through a Whois service. The Whois service might reveal details about the organization that owns the domain. When the IP is owned by a reputable organization, such as a hosting company, the Whois output will reveal this. The information coming from Whois can be coupled with the information coming from the ASN containing the source IP. This might make it even more probable that the source IP is owned by a certain company. In other cases, the ASN information might not confirm the ownership, but it might give details about the origin country of the source IP.
Reputation analysis is what follows next, and it is performed via querying third-party services that maintain up-to-date information about malicious activity on the Internet. These services will be able to tell if the source IP has been part of malware campaigns, malicious email campaigns, or any other form of malicious behavior in the Internet. Such third-party services are usually offered by cybersecurity companies that perform threat intelligence sharing of the data they collect with their own honeypots or sensors.
The above steps are the basis of our workflow when deciding if a given request is malicious or not. Based on these steps, we might perform further analysis or, if the evidence is conclusive enough, the request is marked as malicious. This would mean that it should be translated into an event that could be shared easily with other partner organizations.
To perform threat intelligence sharing, we chose to use MISP [22,23]. MISP stands for Malware Information Sharing Platform and is an open-source effort to provide a standard for sharing malware events between different organizations. Events are created, updated and then shared publicly so that other entities might benefit from early detection of particular malware. This enables real-time, collaborative improvement of the overall cybersecurity posture of the Internet.

3. Proposed Solution Design

Figure 1 illustrated a very abstracted, top-level design view of the architecture. We now need to provide a more detailed view that takes into account the technological details discussed in Section 2. Figure 6 adds another layer of complexity to the initial diagram and offers a glimpse of the main building blocks of our infrastructure.
The components in the diagram will be deployed using Docker as the Container Engine operating in Rootless Mode for enhanced security. Comparing Figure 6 to Figure 1, we notice that the web application is not an entire isolated network called Application Network. Similarly, the monitoring stack component is another isolated network called Monitoring Network. Since neither the web application nor the monitoring stack is monolithic, it makes perfect sense to implement them as multi-container systems. The overall complexity will be increased; however, this design decouples main functionalities into separate, specialized containers that each perform their own duties with upmost performance and accuracy.
The cloud infrastructure component from Figure 1 is now represented by the Docker Container environment. This is an abstraction of the underlying hosts where the Docker Containers run on. We will not dive deeper into Cloud Environments or Physical Infrastructures, as those topics are standalone research projects.
What remains constant between Figure 6 and Figure 1 is the overall interaction between the various networks. Attackers and users reach the Application Network via the Internet and the Application Network provides logs and detailed access information to the Monitoring Network that aggregates, correlates and displays information.
The technologies used to deploy infrastructure components will be detailed in Section 3.1. Then, Section 3.2, Section 3.3 and Section 3.4 focus on the Application Network, Log Shipping and Monitoring Network, respectively. Finally, the advantages of our design are discussed in Section 3.5.

3.1. Deployment Technologies

The deployment process must ensure one key requirement: the safety of the infrastructure in case of total compromise of the honeypot. The following key points make it clear that we need a solid disaster recovery plan:
  • The honeypot is reachable from the Internet.
  • Attackers will most certainly interact with the honeypot at some point.
  • The honeypot will be scanned for vulnerabilities.
  • The honeypot might use software that will become vulnerable in the future.
Based on the above model, we stress the importance of having reproducible builds that can always replace damaged or compromised ones. Moreover, having the ability to tweak or even remove vulnerable software before deploying a new image is highly important. Therefore, we want to be able to carry out the following:
  • Reproduce previous builds.
  • Update current builds.
  • Script the deployment of new builds to be as efficient as possible.
One added benefit of our design is that it is web application-agnostic, meaning that we could swap the web application exposed by the honeypot anytime before deploying a new image. More details about this property of our design can be found in Section 3.2.
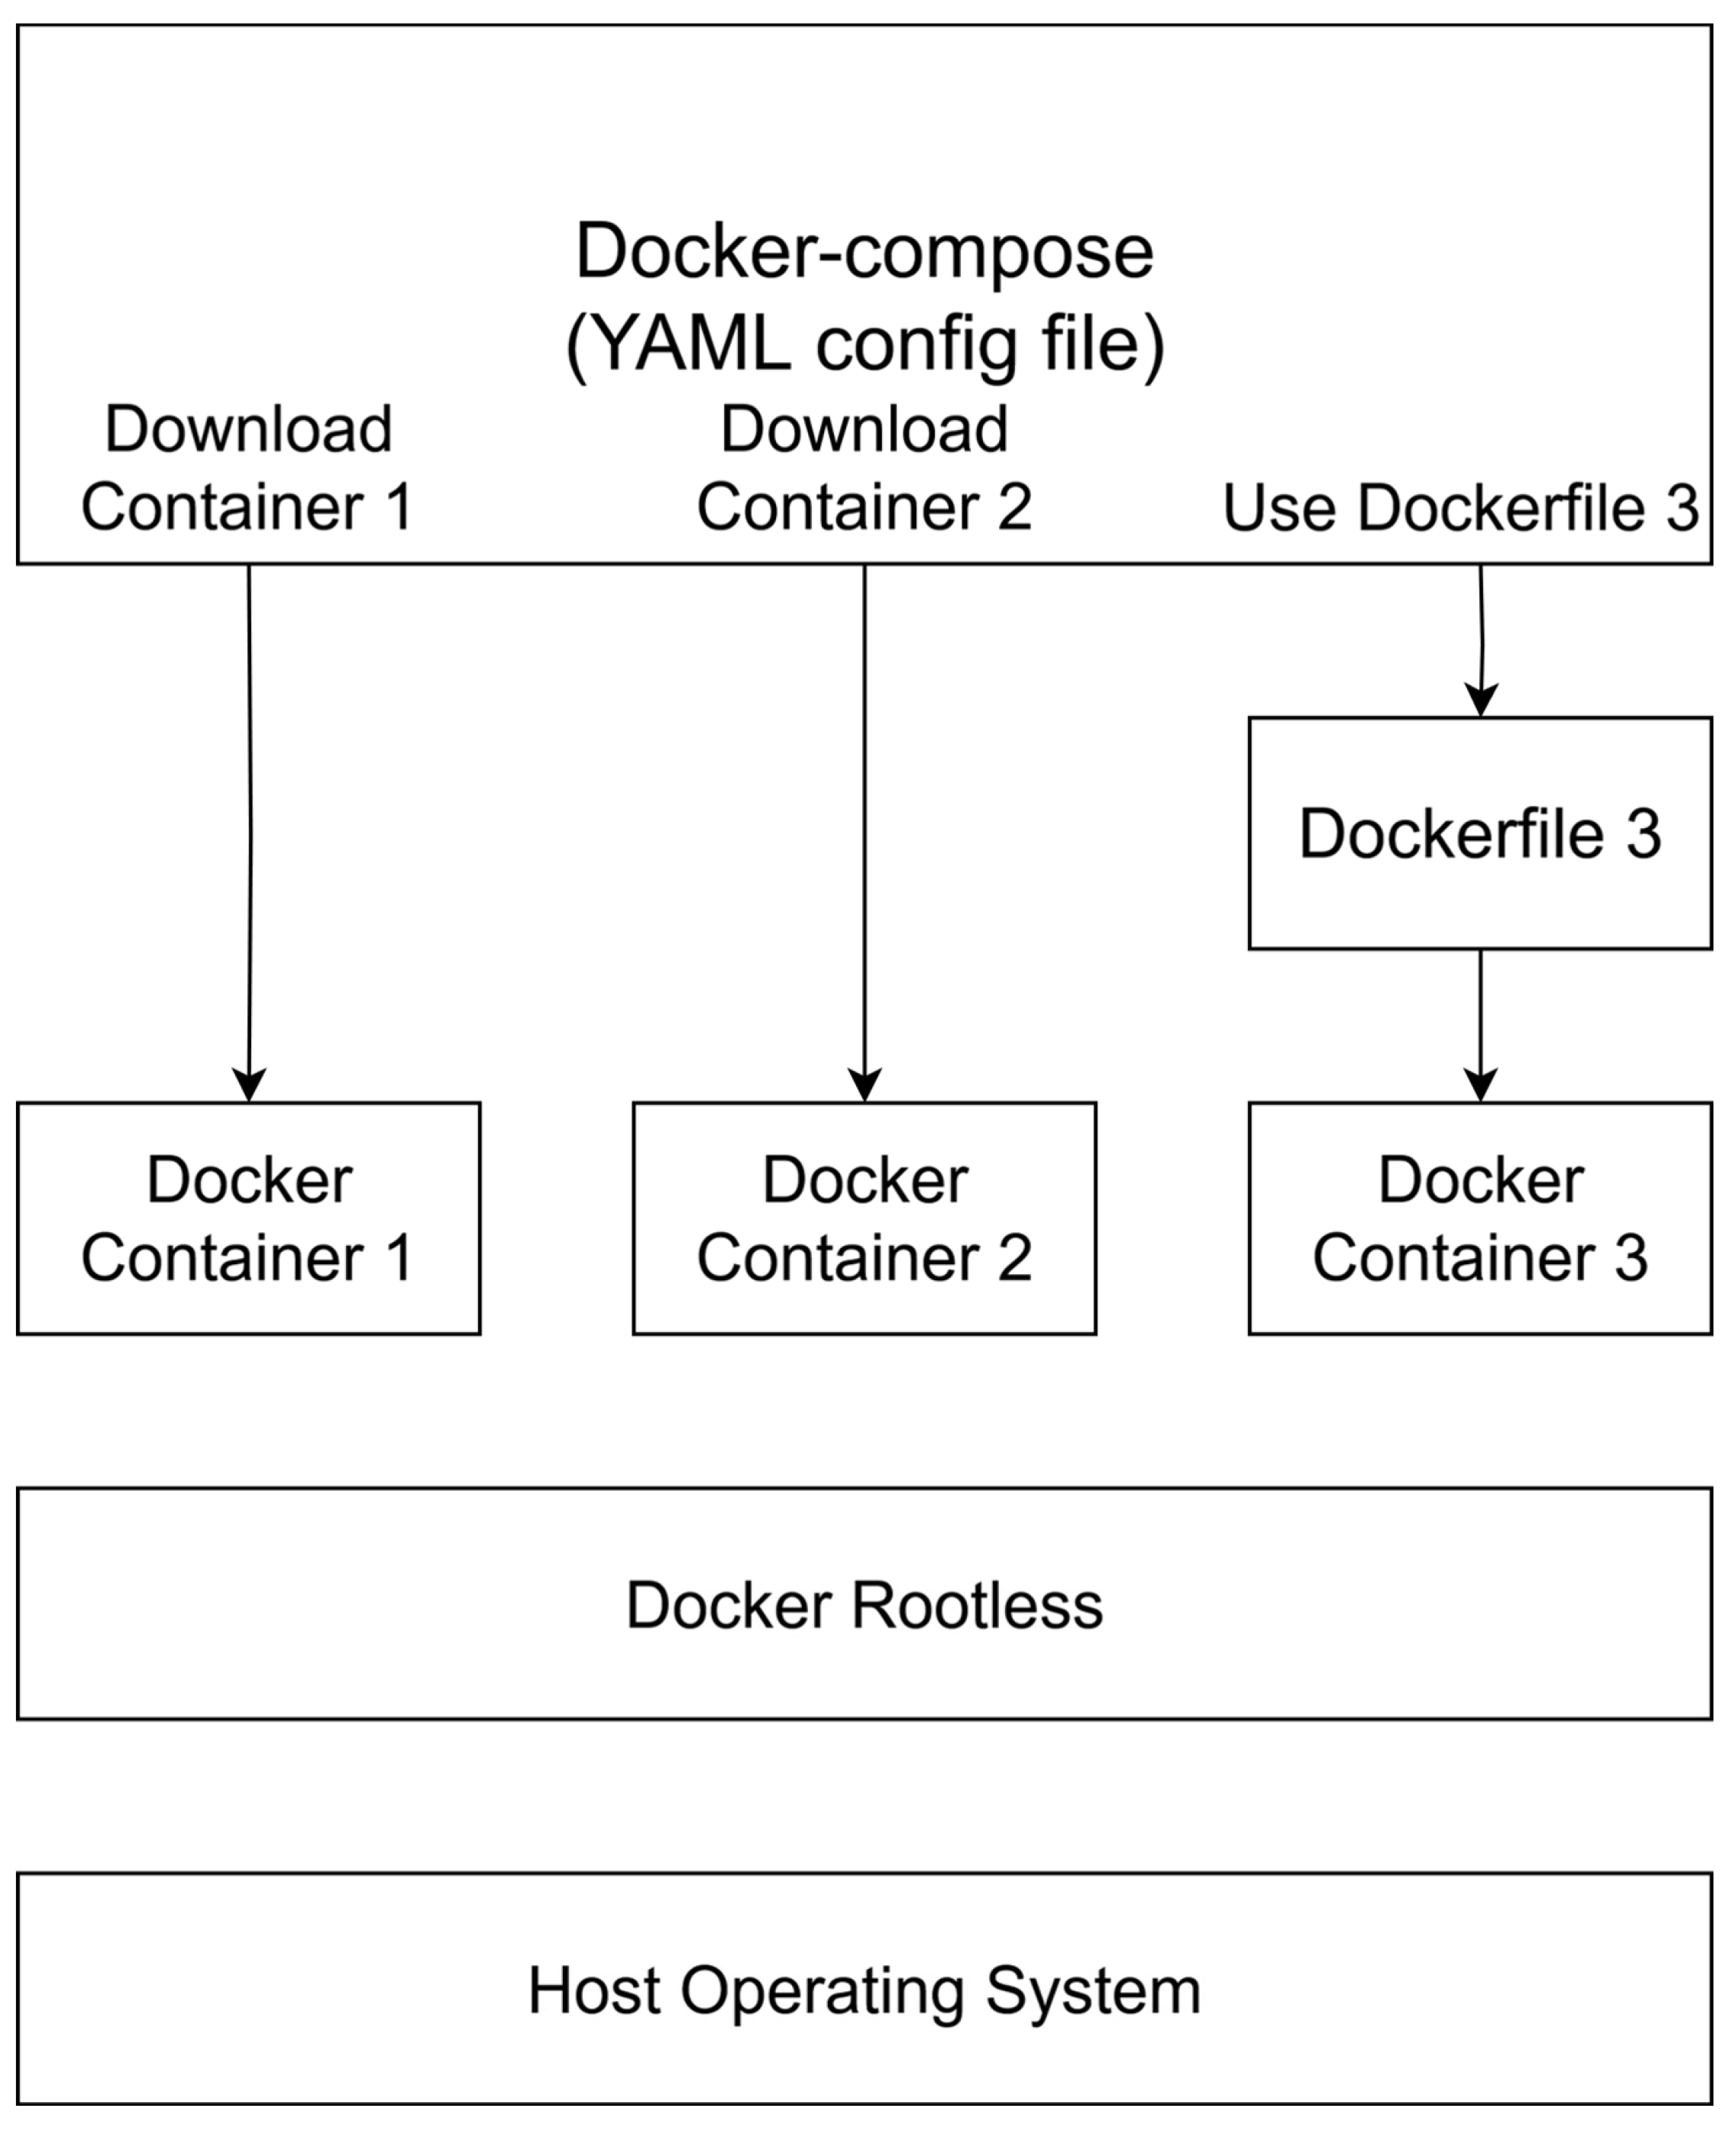
Our safe deployment is based on the technological stack described in Figure 7.
From top to bottom, the first technology is Docker Compose. Docker Compose is a YAML configuration file that contains a detailed map of the containers that we want to instantiate. It also contains information about shared volumes, network interfaces, environment variables and others. For the most part, Docker Compose either downloads container images from repositories it has access to, or it instantiates local container images. The most common public repository used by Docker is Dockerhub [24].
Local container images can be created via a Dockerfile. While Docker Compose can make use of multiple images and how they relate to one another, the Dockerfile is concerned with building only one single image. The build process can start from a fresh image of an operating system and build on top of that by adding new tools, packages and system-wide configuration. Alternatively, there is also the option of downloading an existing container from an accessible registry and tweaking its parameters or defining new ones to customize it. The flexibility offered by Dockerfiles is one of the reasons why they have a very high adoption rate in the industry.
In Figure 7, Container 1 and Container 2 are pulled from a public repository, while Container 3 is custom-built via a Dockerfile.
After the container images are created, the containers are then instantiated by the Docker Engine and launched into execution. The Docker Engine will run in Rootless Mode. This setting means that Docker will not need elevated privileges to manage containers, which greatly limits the damage that a totally compromised container could inflict on the rest of the infrastructure. In other words, using Rootless Mode adds great security, especially in the context of running a potentially unsafe containerized application.
Section 3.2 dives deeper into the Application Network and the internals that allow the web application to function properly.

3.2. The Application Network

The web application is a collection of three components that each work together to comprise the honeypot that attackers will interact with. The three components are implemented as individual Docker Containers running in Rootless Mode.
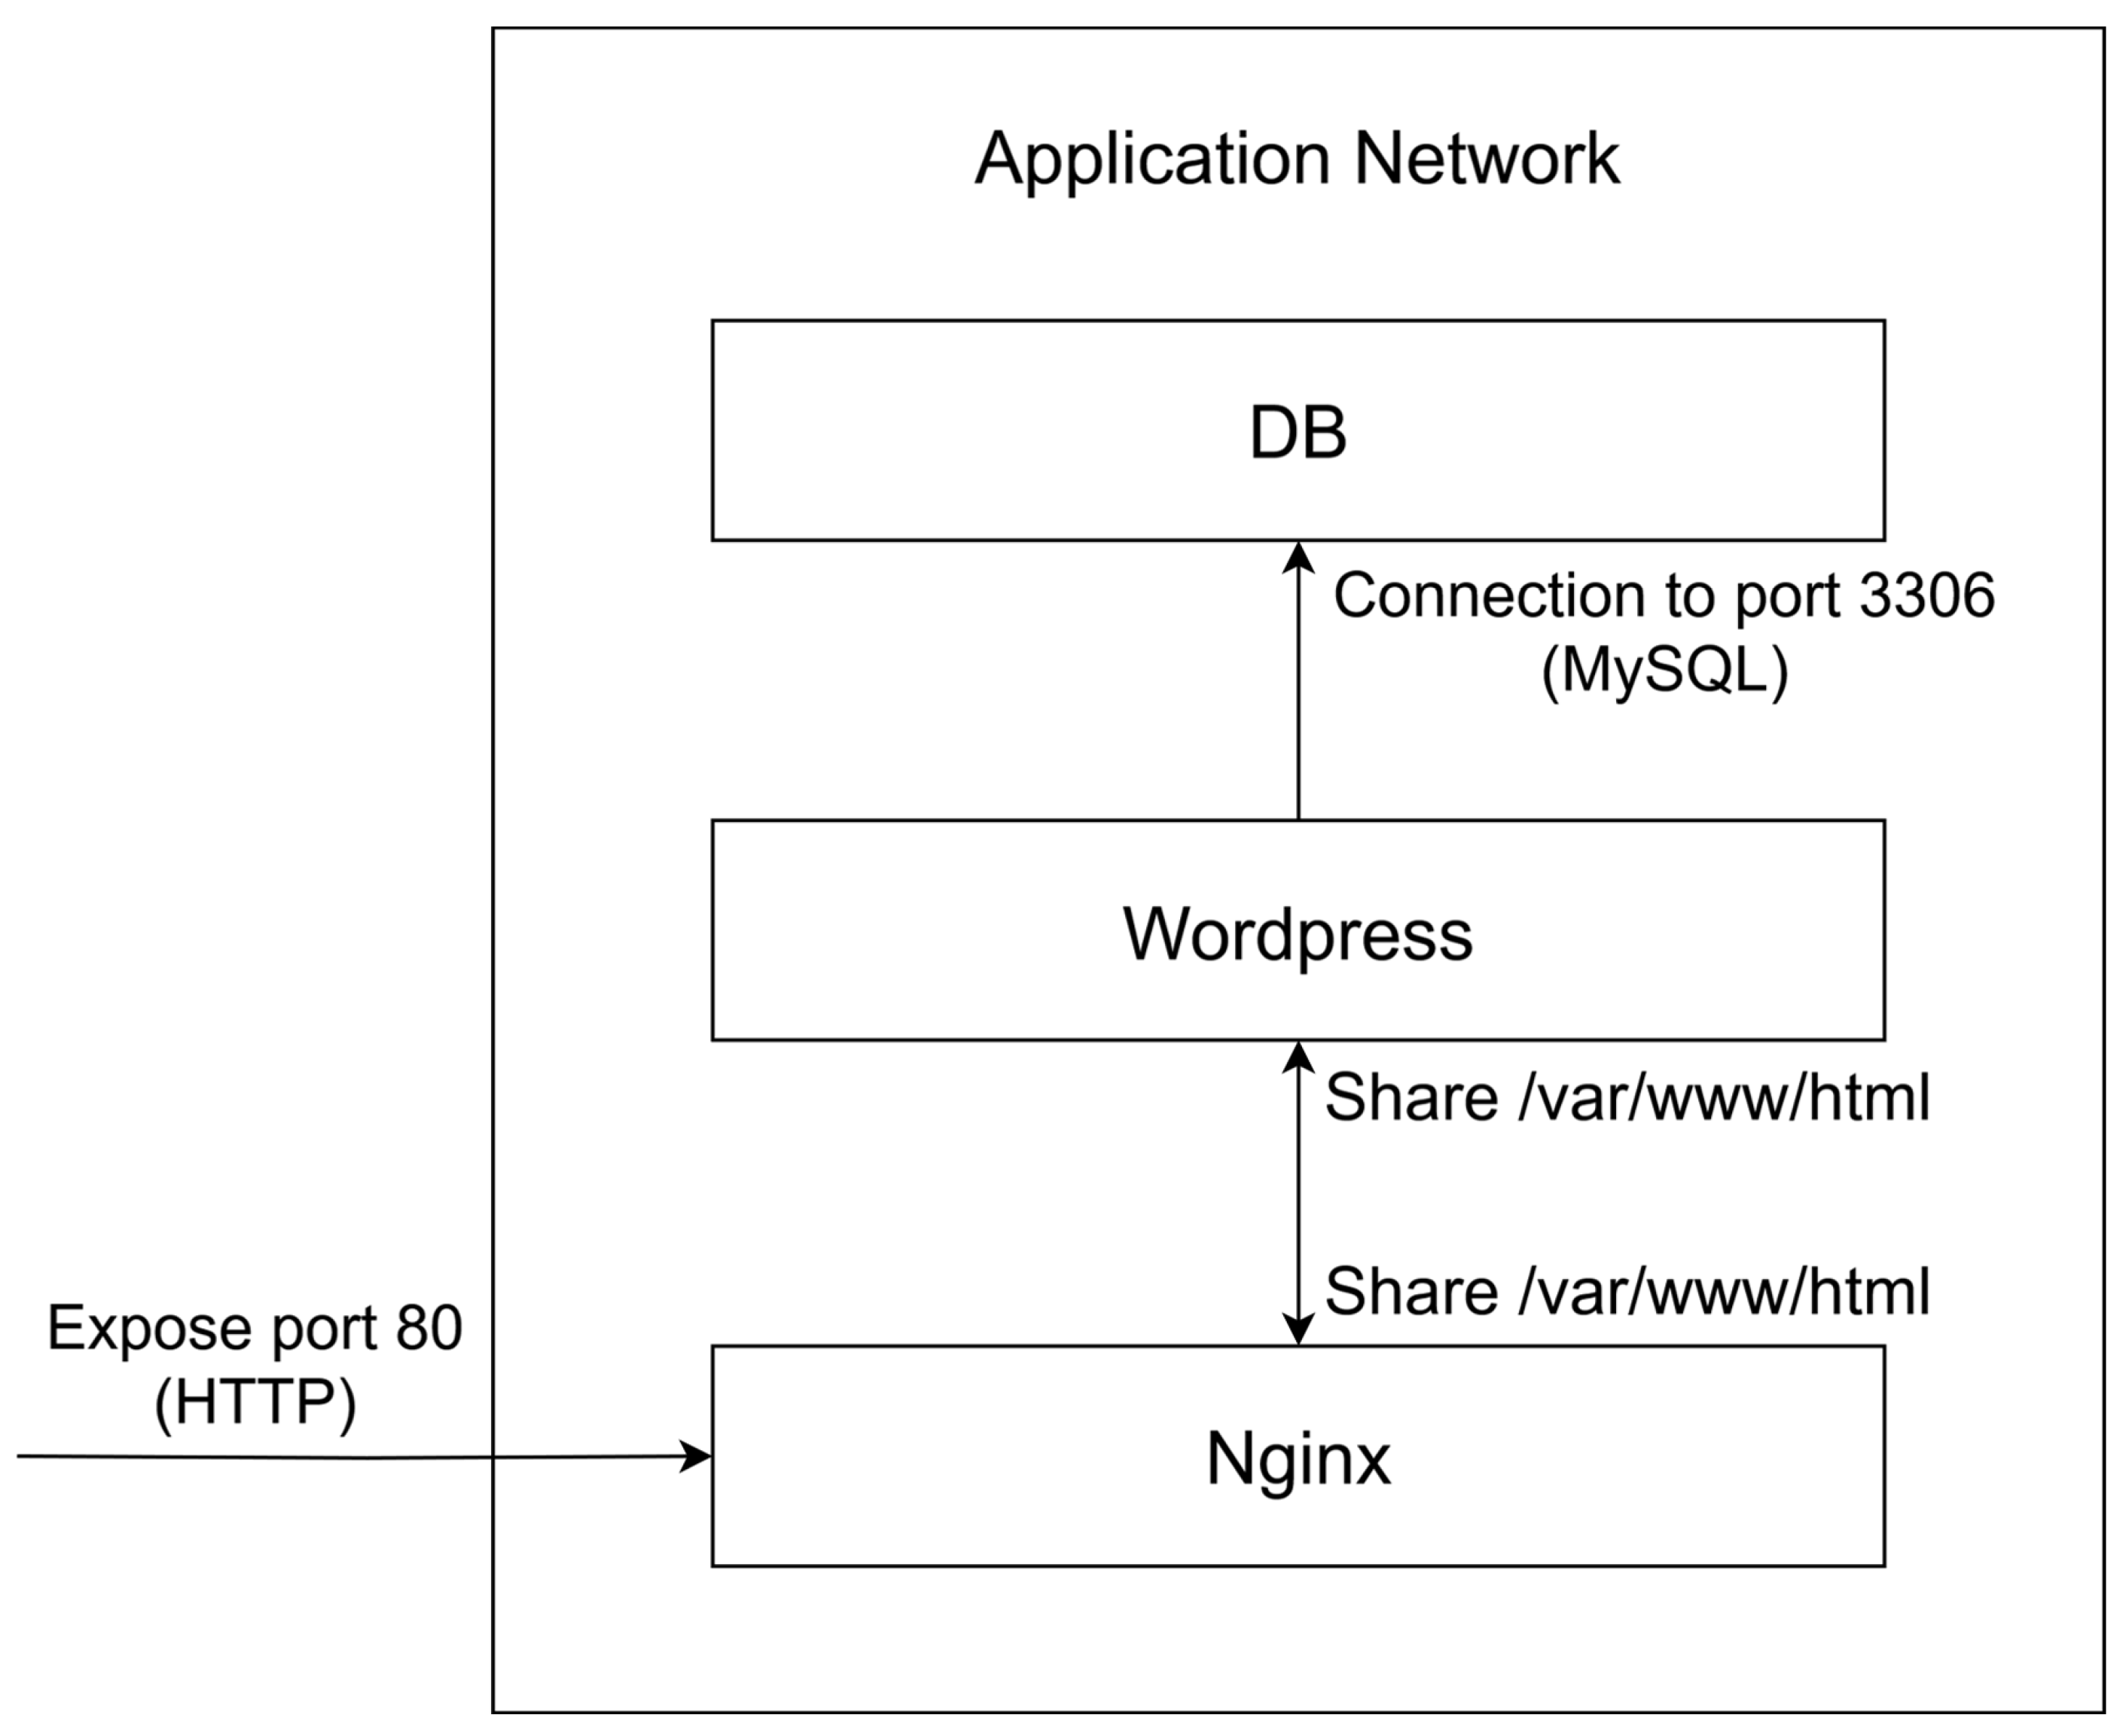
Figure 8 focuses on the containers and how they communicate with the Internet and within the Application Network.
The only port that is exposed to the outside world is port 80 which exposes an HTTP server. The HTTP server is an instance of Nginx [25], which is a very popular, lightweight, high-performance and flexible web server. Nginx itself can also have multiple roles apart from web server, like reverse proxy and load balancer. The various functions of Nginx are beyond the scope of this paper and we will focus only on its role as a web server.
When used as a simple web server, Nginx serves a web application located somewhere on the filesystem. For our current research, we used the default location of /var/www/html to serve the application from. However, the web files served by Nginx are not hosted within the Nginx container. Instead, the /var/www/html directory is a shared volume between the Nginx and Wordpress containers. This means that the /var/www/html directory is mounted in both containers and is synchronized between the two containers.
The Wordpress container is responsible for hosting the script files of a Wordpress instance. In other words, the Wordpress container contains the PHP files and all the other files necessary for Wordpress to work. It does not contain the database containing custom information, as we will see further in this section. Once shared via the shared volume, the files become available inside the Nginx container.
The separation between Nginx and Wordpress can be seen here [26]. This simple mechanism is the basis for decoupling the web application from the server that serves it to clients. Moreover, this is also why our infrastructure is web application-agnostic. The web application stored in /var/www/html can always change. The Nginx container can serve any web application, even if the Wordpress container is swapped with any other container that stores files of a totally different web application inside the /var/www/html shared volume.
To complete the setup, a database is required and this role is handled by the database container. The database container is concerned with storing data of Wordpress users, blog posts, and all other data required for Wordpress to work properly. Again, storing the database separately further ensures that the system is decoupled. The database container is accessed by the Wordpress container via an internal network shared between the containers of the Application Network. This network is entirely isolated between the three containers with no external access.
This section has shown how the three containers, namely Nginx, Wordpress and database, can work together to provide a robust application infrastructure. Moreover, the infrastructure is flexible, loosely coupled, highly configurable and capable of high-performance.
The next section continues the process of describing the infrastructure by focusing on the Log Shipping process.

3.3. The Log Shipping Process

Log Shipping is the logical process linking the Application Network to the Monitoring Network. A log shipper is the basis of this process.
A log shipper is an agent installed on a system with the purpose of shipping logs out of that system and to a server that centralizes the information. Log shippers make sure to ship the latest updates of the files that they monitor. So, most of the time, they will ship a delta of changes, rather than the full file all at once. This adds great efficiency while providing a constant up-to-date view of the monitored files.
Figure 9 provides a glimpse of the Log Shipping process and the link between the Application Network and the Monitoring Network.
Hence, if you have a file that you want to monitor, the Log Shipping Agent will do it for you. If the file is updated, the log shipper will monitor the change and will ship the update. Only shipping deltas with high frequency ensures that the latest version of the logs is available with as few delays as possible.
The agents used were as follows:
  • Filebeat [27].
  • Metricbeat [28].
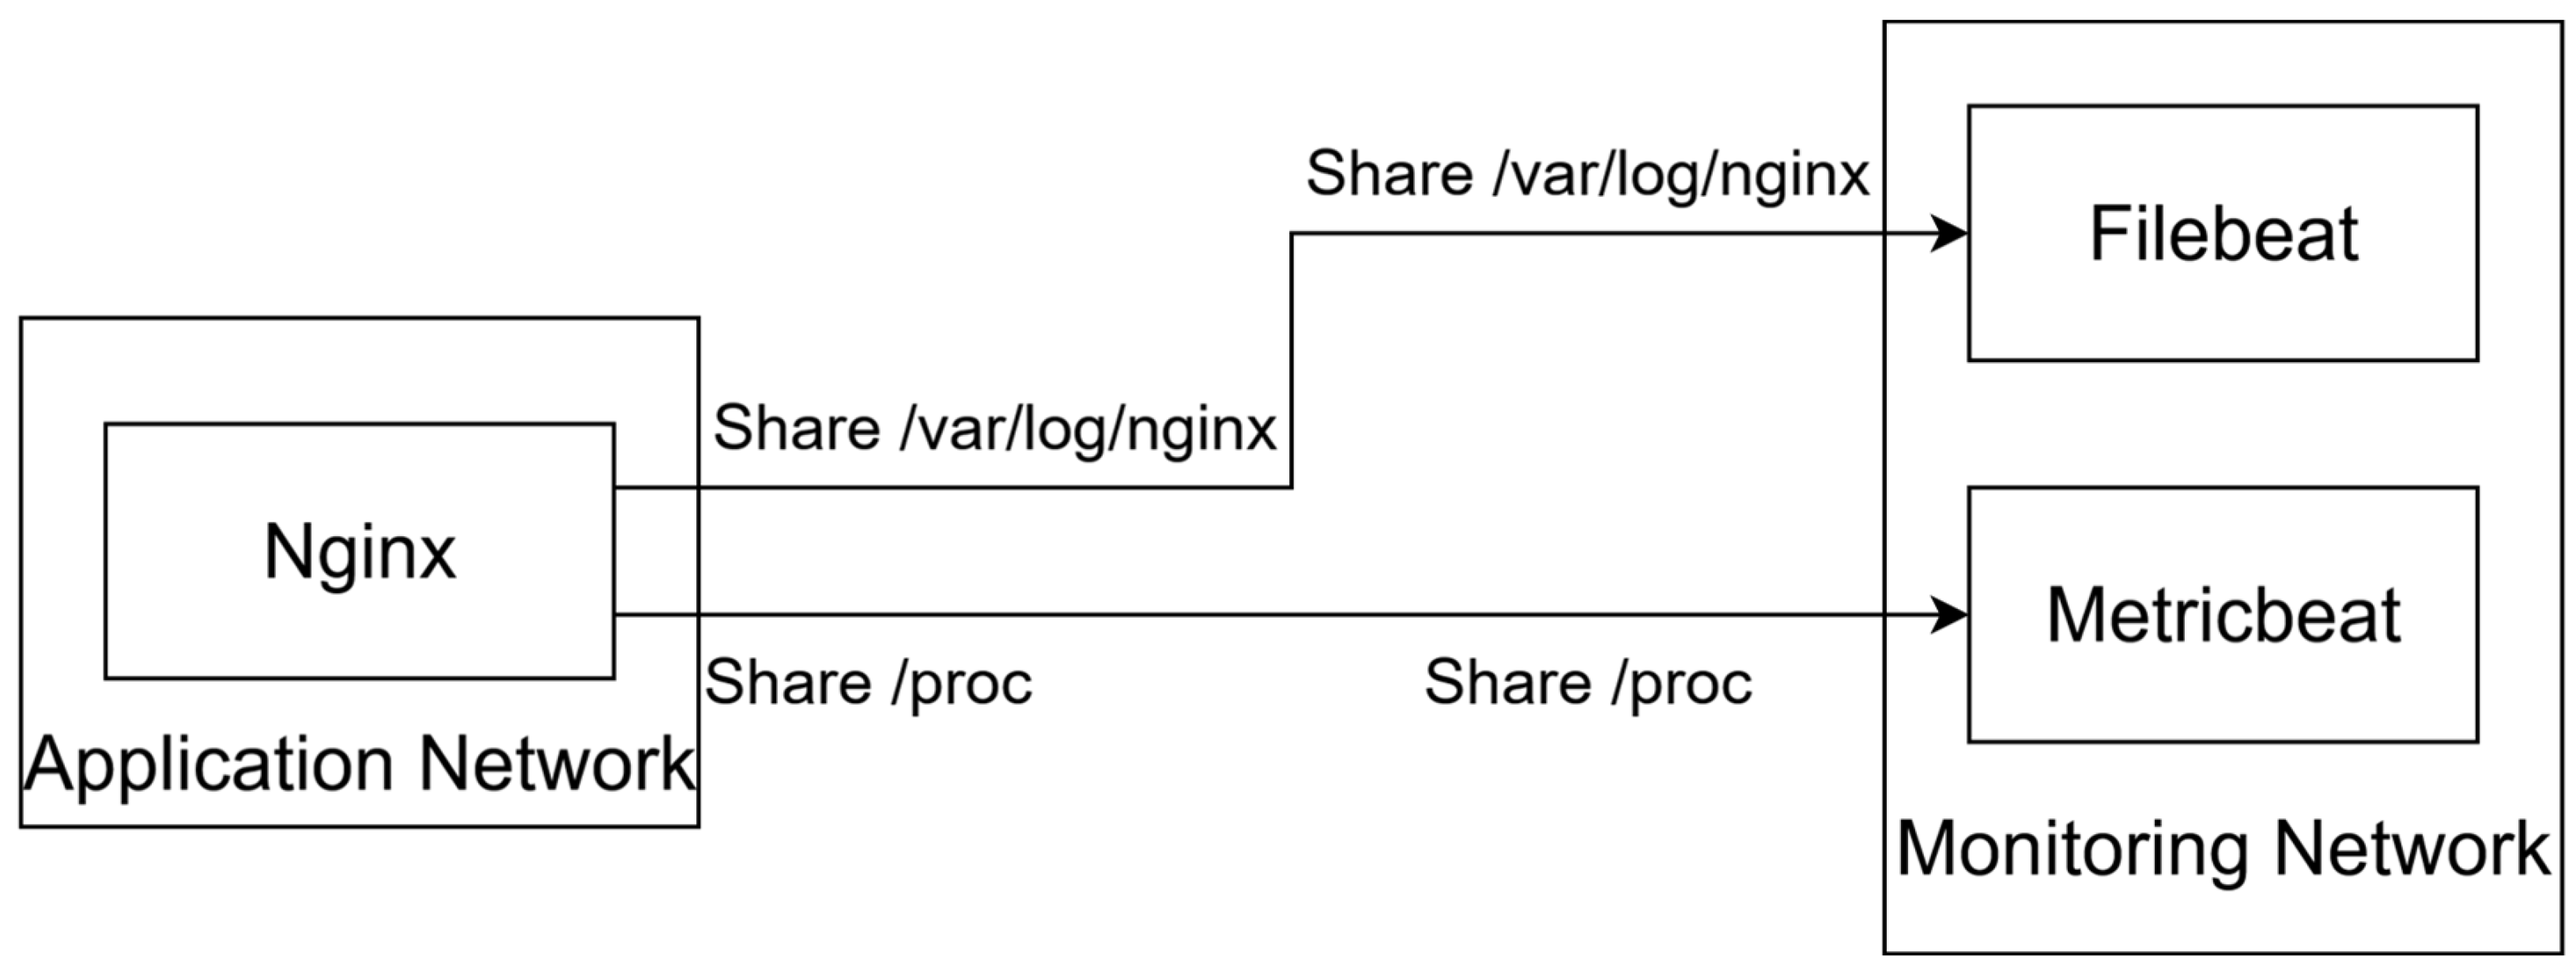
Filebeat has the role of monitoring files on disk and ensuring that the server to which it ships logs has an up-to-date view of the file. Metricbeat does the same, but with system metrics, not files. The system metrics are actually read from virtual files stored inside the /proc virtual filesystem of the host operating system.
Just as the Application Network uses shared volumes, the Log Shipping process uses the same mechanism to share log files between the following:
  • Nginx container and the Filebeat container.
  • Host operating system and Metricbeat container.
The most basic configuration is to install the Filebeat and Metricbeat agents inside the Nginx container and ship logs from there. However, this would not be a flexible approach and the components would be too tightly coupled.
Instead, Filebeat and Metricbeat are two separate containers. Access to the monitored files is shared between the Nginx, Filebeat, host operating system and Metricbeat via shared volumes. This is the same mechanism used by the Application Network to share the Wordpress files between the Nginx and the Wordpress containers.
The shared volumes offer access in the following way:
  • /var/log/nginx is shared from the Nginx container to the Filebeat container so that Filebeat can collect access.log and error.log logs and ship them further.
  • /proc is shared from within the host operating system to Metricbeat so that system metrics can be shipped further.
This design makes the Log Shipping infrastructure loosely coupled: log shippers can be changed without interfering with the Nginx container or the underlying host operating system.
The current section describes how the Log Shipping process is designed to be robust and decoupled so that it can provide accurate information to the Monitoring Network. The Monitoring Network will be discussed in the next section.

3.4. The Monitoring Network

The Monitoring Network has a dual role: it first aggregates the logs and then provides a means to analyze those logs. The Log Shipping process described in Section 3.3 provides the information necessary for the Monitoring Network. The Monitoring Network is by far the most complex part of the infrastructure, as it contains the most components.
Figure 10 provides a top-view of the Monitoring Network.
More precisely, the Filebeat and Metricbeat containers are responsible for shipping the logs. Both log shippers use the Lumberjack Protocol (or Beats Protocol) to ship the logs efficiently.
As mentioned in Section 2.3, the ELK Stack is used to aggregate, analyze and display the logs collected by Filebeat and Metricbeat. This stack is split into three main components (the initials of which give the ELK name) with very clear roles. The roles are discussed in logical order as they appear in Figure 10:
  • Logstash: Aggregates logs from various sources (Metricbeat, Filebeat) and sends them to Elasticsearch.
  • Elasticsearch: Enables easy exploration and querying of data that is already collected and stored in the database.
  • Kibana: Enables easy visualization of data.
The logs are collected into Logstash [29] from both sources. Collecting all logs into Logstash allows for centralized management, enrichment and translation of the information so that later analysis is supported [30,31]. This is achieved using the Logstash Pipelines [32,33] that can be defined to offer great control over the ingested data. Alternatively, both Filebeat and Metricbeat could send data directly to Elasticsearch [34], but the current research does not focus on this arrangement. However, this approach would remove the control offered by using Logstash Pipelines.
Our research uses Pipelines for the following specific purposes:
  • Filter access logs from Nginx.
  • Enrich logs (e.g., via geolocation of source IPs).
  • Transform the access logs into JSON for better control in Kibana.
Elasticsearch [35] is the engine that powers the data correlation process of our research. It pulls data from Logstash and instruments it to offer results for various queries. This component is not visually represented for the end user. Instead, Kibana [36] is the visual component that offers the dashboard and a gateway to using Elasticsearch.
The interactions between components of the Monitoring Network are all isolated within this private network. However, Kibana exposes Port 5601 on the localhost interface of the host operating system. From a security perspective, to access the monitoring dashboard of Kibana, a user first requires access to the host operating system. This adds security in the sense that the dashboard is not reachable from the network to which the host operating system is connected. The inner workings of the ELK Stack are contained within the network and only the resulting dashboards and the ability to query the logs are exposed.
Having discussed the Application Network in Section 3.2, the Log Shipping process in Section 3.3 and now the Monitoring Network in the current section, we can discuss the design advantages that our current research offers in the next section.

3.5. Design Advantages

The infrastructure is designed so that the web application is accessible from the Internet and that eventually it will be attacked at some point. In some cases, depending on the web application, it might even become compromised. The infrastructure needs to be Secure By Design and plan ahead for an eventual compromise.
This implies that the infrastructure needs to remain secure in case the web app gets compromised. This aspect is handled by multiple layers of isolation inside the infrastructure:
  • Network segregation between Application Network and Monitoring Network.
  • Filesystem segregation between containers, apart from instances where shared volumes are used for specific resources on purpose.
  • Process isolation between main processes (web server, database, etc.) since each container runs processes in separate isolated namespaces.
Having such granular isolation in place means that any compromise is self-contained within the perimeter of the compromised container.
The use of shared volumes for specific resources is the mechanism that provides loose coupling between the following:
  • Nginx and Wordpress.
  • Nginx and Filebeat.
  • Host operating system and Metricbeat.
These shared volumes imply that our design is web application-agnostic and log shipper-agnostic. The web application (Wordpress) could be replaced at any moment and the infrastructure will run accordingly if the relevant files are provided via the shared volumes. Likewise, the log shippers could be replaced with similar ones and logs will be monitored as long as the shared volumes respect the same paths.
The use of Docker Compose provides multiple important advantages, the first being the complete automation of the setup process. This allows for a very easy disaster recovery process in case of a compromise, since the entire infrastructure could be rebuilt with just one command. This includes containers and the software running inside of them, along with any necessary configuration files, network configuration, or shared volume configuration. The isolation of resources is easily configurable via the Docker Compose YAML file. The YAML file provides an easy means to extend the current infrastructure or update fine details of its operation in the future.
Apart from the practicable disaster recovery process being easy to run, the Container Engine can guarantee that the builds are reproducible, if the configuration file is used properly. Moreover, the containers are cross-platform, meaning that the deployment is not affected and should run properly regardless of the underlying host operating system.
The same configuration file offers great control in terms of exposed network ports:
  • TCP port 80 exposes the web application to the Internet.
  • TCP port 5601 is exposed on the localhost interface of the host operating system, as it would be dangerous to expose it in the Internet.
  • TCP port 22 exposes the SSH Service to the Internet and provides management capabilities to log into the host operating system and interact with the infrastructure; SSH Authentication is conducted via SSL Certificates and Password Authentication is disabled, thus increasing security.
One of the inherent benefits of using containers is that the user usually has the option of choosing very lean base images for the containers. This implies less bloatware software, which means less extra processes running when the container image is instantiated. In some cases, this could mean serious performance gains, as only the necessary processes are spawned and consume resources.
Having enumerated the relevant advantages of our infrastructure, we can assume that the overall security of the deployment is satisfactory for the purpose of our research.

4. Implementation Details

Our design is centered around the assumption that the web application will eventually be attacked and exploited. We wanted to expose the application while making sure that the infrastructure remains secure. Consequently, we tried to reduce the attack surface of our deployment while making sure that the web application worked accordingly.
Figure 11 details the final version of our deployment. The configuration we adopted provides a secure way to remotely manage the infrastructure while maintaining security. Should the attackers manage to compromise the web application, then the damage is contained within the Application Network. At most, the attackers might compromise parts of the Monitoring Network, but this would be very hard, as the Application Network and Monitoring Network communicate via shared volumes. Compromising the Monitoring Network might mean using access gained after compromising the web application to write malicious files into the shared volume that are then ingested by the Monitoring Network. As another prerequisite, software running on the Monitoring Network would need to be vulnerable to malicious files. This scenario is very complex and requires many assumptions to be valid. Even in this improbable scenario, we could just rebuild the infrastructure using automated scripts as described in Section 3.
A summary of the security considerations of our final deployment design is presented below:
  • Port 80 exposes a web application and this is the main entry point for attackers.
  • Port 22 is secured via Public Key Authentication and provides management access to the underlying Cloud VM where everything is deployed.
  • Access to the Kibana UI is achieved via Port Forwarding port 5601 through the SSH Tunnel.
  • The web application is purposely created to be attacked and even successfully exploited if possible.
  • Damage is contained within the internal networks and certain filesystem sandboxes.
  • The disaster recovery plan can be easily implemented via running a script in case of a compromise.
While port 80 allows attackers access to the web application, it is the gateway for security researchers to manage and monitor the honeypot.
An example of an SSH Tunnel configuration in MobaXTerm, on a Windows system, is shown in Figure 12. Local port 5601 is forwarded via the SSH Tunnel into remote port 5601 on the same server that we connect to via SSH. The same configuration can be achieved via command line on Linux systems.

4.1. Log Analysis

Before we describe the log analysis phase, we need to briefly discuss the format of an HTTP Request and its building blocks, from the point of view of the server. The structure of a basic HTTP Request is presented in Figure 13.
Likewise, the structure of an HTTP Response is shown in Figure 14.
Both the request and response are in plain text and both adhere to the conventions of the HTTP Protocol.
The first step in the log analysis phase was to ensure that the logs were structured in a format that would allow easy parsing and interoperability with third-party systems. The log files our research aimed to instrument were the entries of the access.log log file. The format of access.log entries [37] is very simple:
  • 127.0.0.1 - Bob [08/Jul/2025:14:45:34 +0000] "GET / HTTP/1.1" 301 207
A breakdown of the above access.log entry is below:
  • 127.0.0.1: Source IP address of the client.
  • -: Lack of information about user identity, usually unreliable field.
  • Bob: Userid of the client, determined via HTTP Authentication, - if not present.
  • [08/Jul/2025:14:45:34 +0000]: Timestamp of the request.
  • “GET / HTTP/1.1”: HTTP Request Method (GET), Request path or endpoint requested by the user (/) and Request Protocol (HTTP/1.1).
  • 301: HTTP Response Code.
  • 207: Size of the response returned by the server.
The format contains valuable information that our research aimed to access as efficiently as possible. Consequently, we opted to transform the above entry into JSON.
Two resources with the technical details needed to perform the transformation of the access.log entry from initial to JSON format are presented here [38,39]. The resulting log file will be called access.json.
The previous access.log entry converted to JSON format and without any data enrichment being applied to it is shown in Appendix A.
The translation from normal access.log format to JSON is performed using a nginx configuration file using the log_format directive of the ngx_http_log_module.
To enrich the initial entry, geolocalization is added as an extra JSON field. This field pinpoints the client based on the source IP address used to perform the request. The geoip module of Logstash is responsible for computing the location based on the IP address. It is worth noting that the geoip module relies on a database that may sometimes provide outdated results if not updated frequently.
Our research used the OWASP TOP 10 [40] resource |hlas an initial list of potential vulnerability classes to inspect. Then we focused our research on a few of the classes. Before moving on to the triage steps, our research defined the main vulnerabilities or malicious requests that we needed to pinpoint.
The web application vulnerabilities that our research focused on are Injection Attacks (Remote Command Execution), Directory Discovery/Directory Brute-Forcing and Targeted Vulnerability Scanning. We focused on a relatively small subset of attack classes to prove our idea and to demonstrate the extensibility of our design. Table 2 provides a complete view of the most popular web application attack classes and whether or not our research supports their detection. The Only Queries Needed label assigned to an attack class signals that their detection could be fairly easily implemented using our infrastructure. The only requirement is to write customized queries similar to those shown in Section 5. Enhanced logging capabilities are needed to support the Deserialization, POST Attacks, HTTP/2 Attacks and WebSocket Anomalies. This is a consequence of the particular nature of the underlying systems that the attack classes exploit. HTTP/2 Attacks involving HTTP Request Headers can be implemented trivially via custom queries; however, exploitation of more complex HTTP/2 attacks might require extra implementation. Deserialization Attacks require the use of server-side modules that deserialize binary data. The structure of this binary data is difficult to generalize and create detection patterns for it. To support detection of POST Attacks, better logging capabilities are required to log HTTP Request Payloads. This dramatically increases storage requirements, which could be problematic if resources are scarce.
The next step in our research was to have a minimal checklist to triage incoming requests. The algorithm is used to assess whether or not a request is malicious and then whether or not to perform threat intelligence sharing of that particular event. More details about the process of threat intelligence sharing are presented in Section 4.2.
The checklist we used looks at the following fields and performs the following checks:
  • HTTP Verb: We mostly looked at GET requests as the main target for identifying Directory Discovery/Directory Brute-Forcing, although POST requests were also analyzed.
  • Resource Path: This is the first relevant field for the purpose of our research, as it details the path that the client requests.
  • URL Parameters: Both parameters and the value of those parameters are used very frequently to send malicious payloads to the server or even test for certain vulnerabilities.
  • Host HTTP Request Header: The host of the request might sometimes be malformed and might contain relevant payloads that need to be inspected. This is especially important if there is no hostname associated with the honeypot and might hint at attempts to discover hostnames if the attacker assumed that the honeypot was actually a reverse proxy.
  • User Agent: The user agent might sometimes reveal that the request is issued by a known Internet scanner, in which case we would not inspect it further.
  • HTTP Response Code: A 404 response would mean that the client tried to access a non-existing resource and this behavior might qualify as Directory Discovery/Directory Brute-Forcing. Any response in the 4XX class could signal a potentially malicious request that was not fulfilled by the server.
  • Source IP: No geoblocking measures were put in place to restrict traffic based on geographical criteria; however, this field was used for statistical purposes.
    WHOIS: The IP would be verified through a WHOIS service to see if there is any information about the ownership of the IP.
    ASN Analysis: The Autonomous System Number containing the IP would be checked to see if the geoip module correctly assigned the country and then the IP ownership details would be cross-checked with those originating from the WHOIS service.
    IP/Hostname Online Reputation: Online reputation services would be queried to see if any malicious activity originating from the source IP has been detected. Examples of such services are VirusTotal [41], Cisco Talos [42], and SANS Internet Storm Center [43].
    If the Source IP issued a malicious request, but it is owned by a major cloud provider, then we might not propagate it via threat intelligence sharing.
The analysis process described above is performed through the Kibana Dashboad. An example of such an entry can be seen in Figure 15.
The naming convention of the parameters shown in in Figure 15 respects a well-defined hierarchy. The nginx. prefix defines the origin technology of the entire log entry. What follows is the access. part which specifies that the entries are imported from the access.log file located on the Nginx server. There are seven pinned values in Figure 15. The response_code is the only parameter that defines the HTTP Response and not the request. It is used to assess the HTTP Response Code and identify if the server responded correctly or with an error. Our research identified that most malicious attempts are either identified by the url or, less often, the agent parameters. After identifying the attempt as malicious, the process advances to the threat intelligence sharing step, described in the next section.

4.2. Threat Intelligence Sharing

When one organization is attacked, it can decide to treat the event internally and do not disclose how the malware behaved or what actions it performed. The actions that malware performs are called indicators of compromise (IoCs for short). Disclosing IoCs helps secure the Internet and is one of the main ways to protect against novel attacks.
To be able to share threat intelligence between different parties, a common means of sharing this information is required. One of the open-source efforts to standardize this process led to the creation of MISP [23]. MISP is a platform that allows different entities to share threat intelligence between themselves. It is a collaborative approach to tackling the complex problem of securing the digital space and the Internet. Each organization could deploy a self-managed instance of MISP and then use it to store and distribute IoCs of malicious events. IoCs are detected by third-party components such as Intrusion Detection Systems (IDSs) or Intrusion Prevention Systems (IPSs). Then IoCs are ingested into MISP either automatically or manually by Security Engineers.
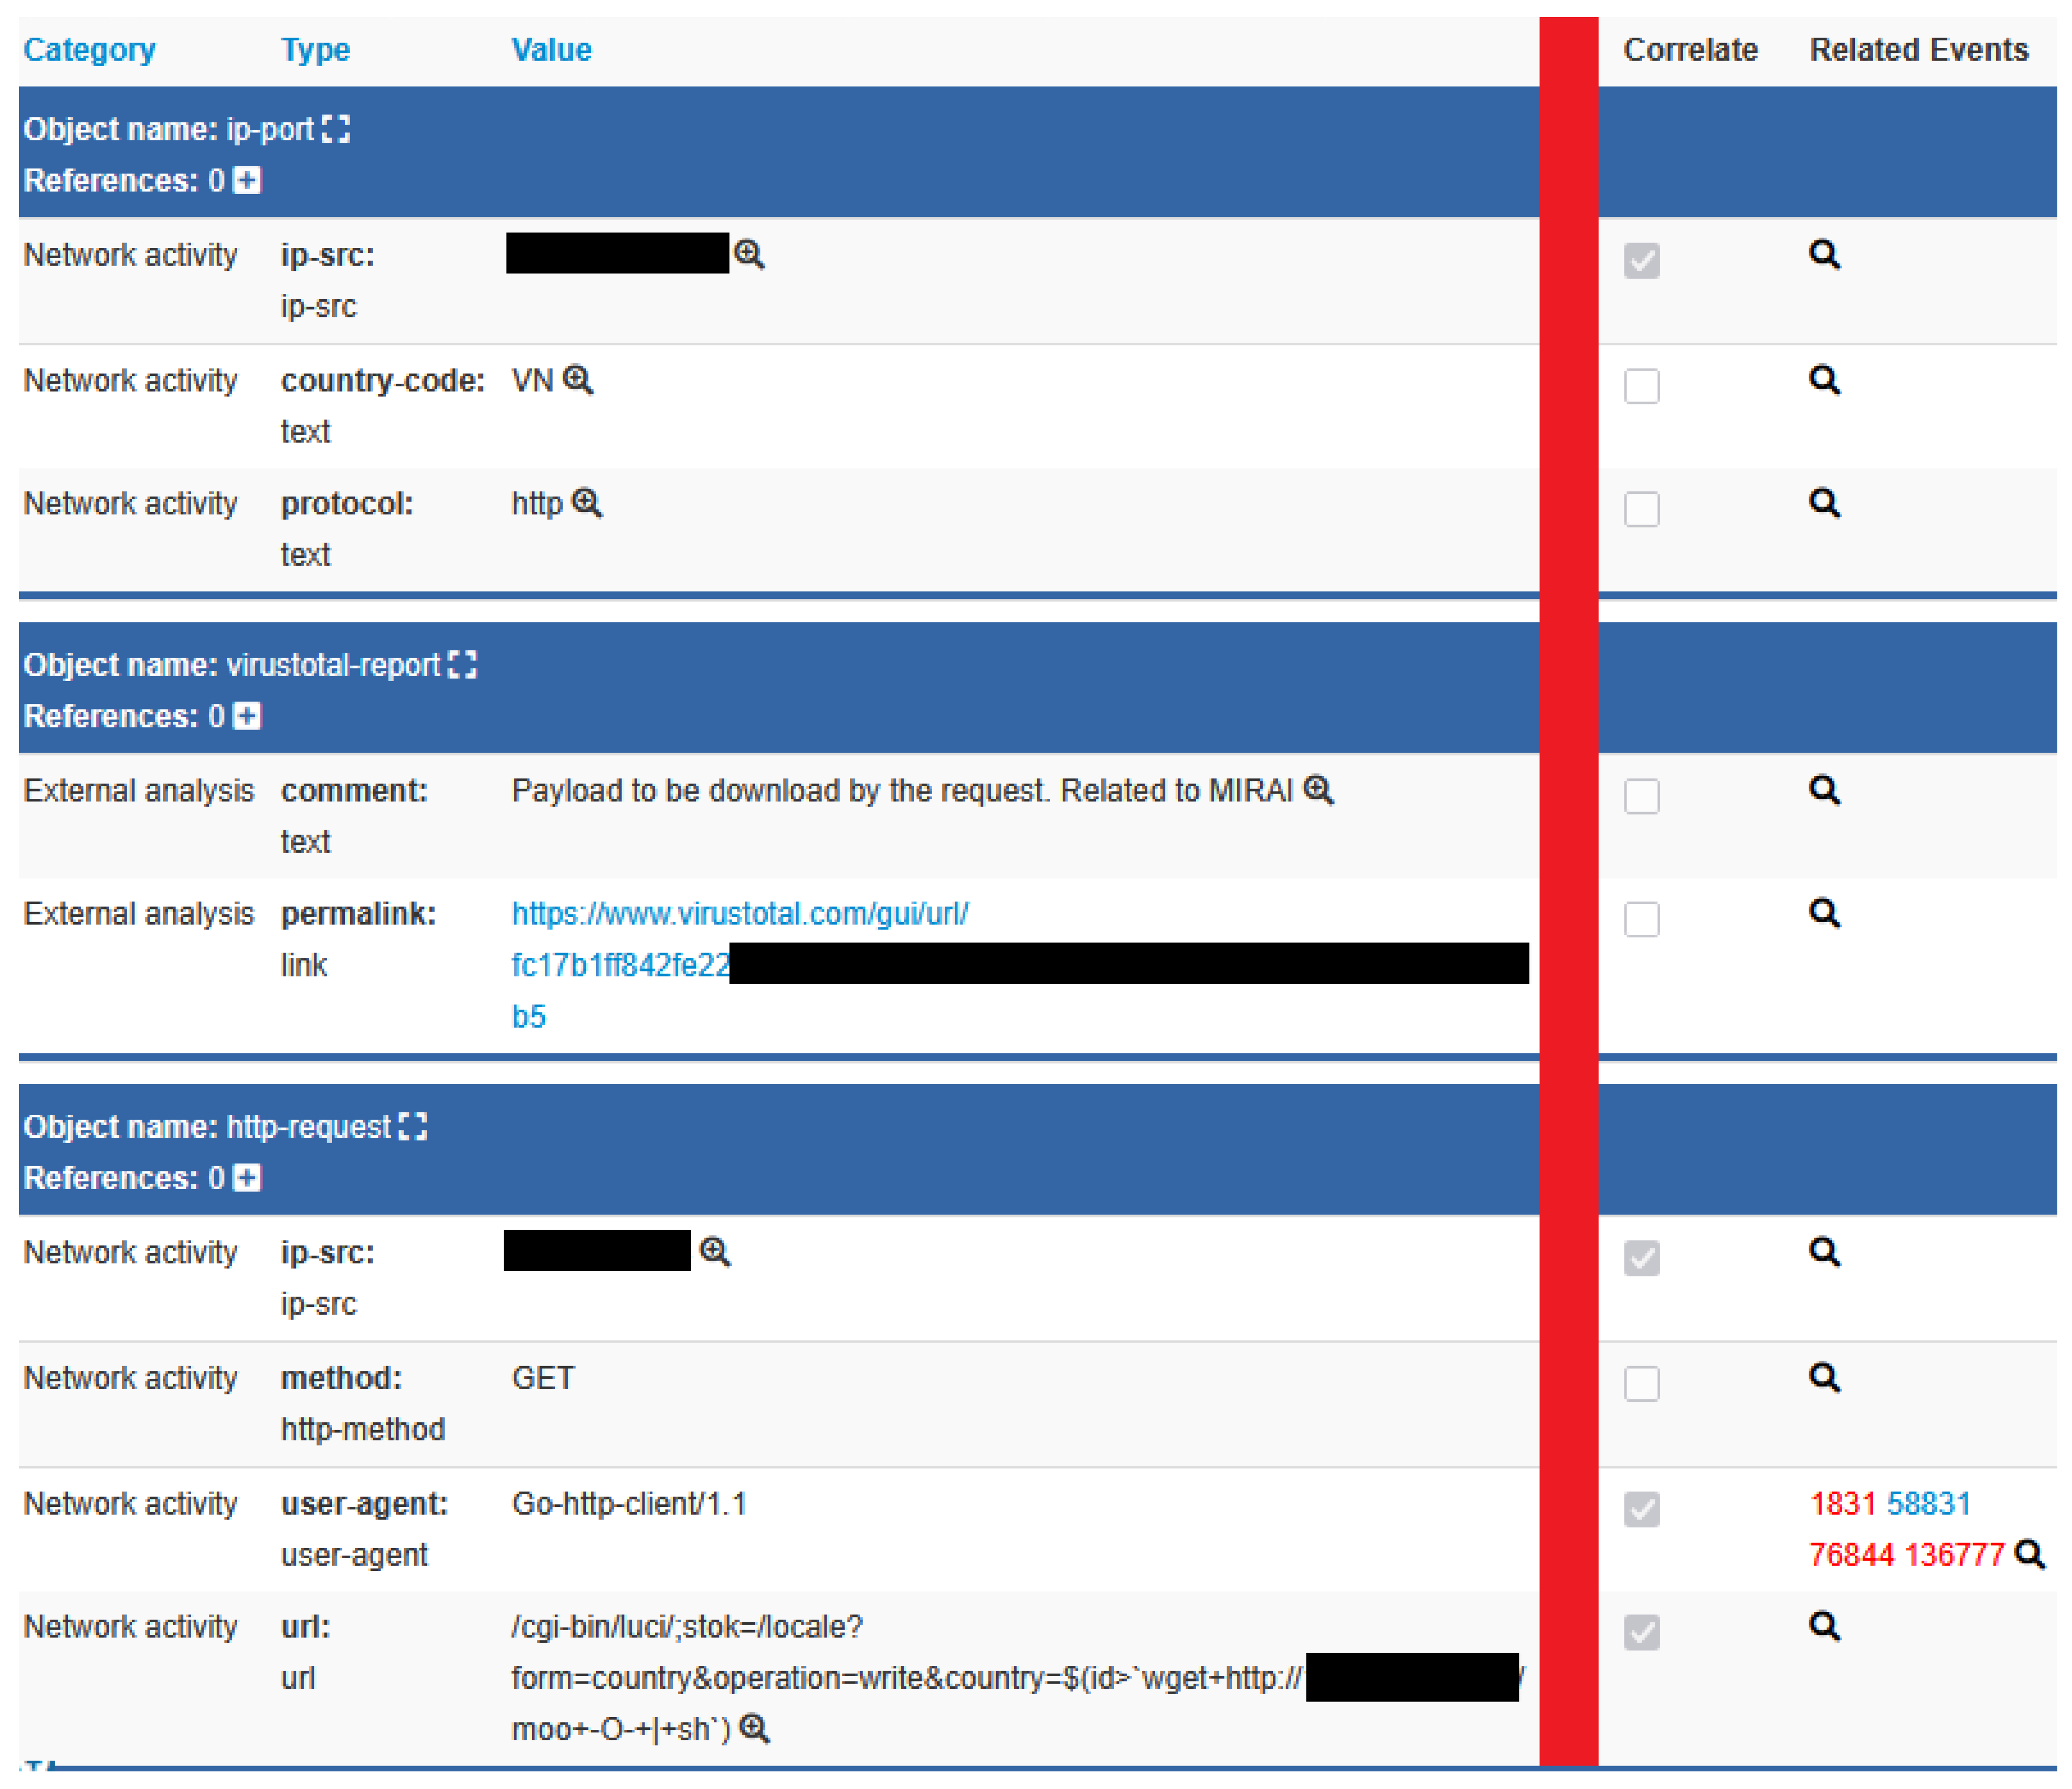
The end result of creating a MISP Event based on the malicious attempt described in Section 4.1 can be seen in Figure 16.
The parameters are ingested from entries similar to the one detailed in Figure 15. The MISP entry is also enriched with a VirusTotal report to signal the malicious nature of the request. An important note is that Figure 15 and Figure 16 detail two separate malicious events, but with the exact same set of parameters. The authors made this choice to discuss the analysis process while also offering variety in terms of actual, real malicious data.
One of the most useful features of MISP is the automatic correlation of this new event with other past events. This can be seen in the rightmost column of Figure 16 (the red line represents redacted information that was not relevant). This helps specialists match similar behaviors of different events and identify related attacks. The attacks could be shared by other third parties like partner organizations or companies.
Our research enabled us to aid the process of securing the Internet by first detecting malicious attempts with the honeypot and then performing threat intelligence sharing via MISP. Our results are presented in Section 5.

5. Testing and Evaluation

A prerequisite to discussing the results of our research is first to describe the experimental setup that we used to achieve the results. The setup is described in detail in Section 5.1. We present our results and malicious attempts in Section 5.2.

5.1. Experimental Setup

Our research used a virtual machine running on an underlying cloud infrastructure. The technical specifications of the cloud infrastructure will be abstracted and we will only focus on the specifications that directly influence the performance of our components. The server hardware allocated 4 CPU cores for our virtual machine, each with a Base Clock Frequency of 3.6 Ghz. We experimented with only 8 GB of memory which proved to be enough for the purpose of our research. The operating system installed on the virtual machine was AlmaLinux 9.5 with 30 GB of storage space.
As mentioned in Section 3, the software stack we are using is based on Docker and Docker Compose as deployment technologies. The ELK Stack is deployed in a multi-container fashion and it exposes network ports on the virtual machine only to maximize security.
The resource available to us did not limit the capabilities of our implementation in terms of functionality. The only occurrence of resource consumption happened because of an initial misconfiguration, which led to the complete usage of the storage space. By default, the Rollover feature [44] is disabled, which means that new data associated with Kibana indexes is created without first deleting older data. The feature is part of the Index LifeCycle Policies that Kibana offers and should be enabled to ensure that indexes created by Kibana are not permanently stored on the virtual machine.
Completely using the storage space might lead to a malfunctioning of the ELK Stack or even compromise the virtual machine. Recovery from such a situation could be achieved by manually deleting indexes, but this is not advised as it might permanently and irreversibly damage the ELK Stack. As a consequence, mitigating this risk was a priority from the moment it was identified.
To improve user experience for the researchers, the Discover Settings of Kibana needed to be adjusted. More specifically, the discover:sampleSize parameter had to be increased from the default value of 500. This value limits the number of records fetched from Elasticsearch and having it too low could limit visibility when exploring intercepted requests in Kibana.
The web application honeypot instrumented by the ELK Stack is a basic Wordpress instance. The Wordpress instance is default, with no additional plugins installed. Hence, there are no vulnerable plugins intentionally installed for attackers to exploit. The view that attackers see when accessing the web application honeypot can be seen in Figure 17. We chose Wordpress as the honeypot because of the prevalence of vulnerabilities in the past, especially in the context of Wordpress plugins [45]. We assumed that this would attract the attention of attackers who attempt to probe for vulnerabilities in the Wordpress ecosystem.
We want our honeypot to eventually be exploited to allow us to inspect the attack vectors without employing active preventive measures against malicious actors. In other words, in case we detect a live attack, we would not want to lower the success rate of the attack, as this would lead to us having incomplete information about the full vector. We rely on our disaster recovery capabilities to recreate the honeypot instance in case we detect total compromise. We did not focus on minimizing the indicators of deception (IoDs) exposed by our honeypot, as our monitoring stack does not affect them in any way. Due to our loosely coupled design, we can improve the credibility of our honeypot in parallel with maintaining our monitoring capabilities. It is essential to note that the degree to which attackers are deceived is strictly influenced by how realistic our web application looks and that this degree is unaffected by our monitoring stack.
Traffic to and from the web application honeypot was not secured via SSL/TLS certificates. The protocol used was plain HTTP, which would normally raise questions to a basic user. However, the lack of encryption was an intended decision to ideally retain or attract attackers as opposed to basic users.
Even without a proper domain name associated with the deployment, Internet users were still able to access the Wordpress instance. Moreover, attackers scanned and interacted with our deployment, as we will describe in Section 5.2.

5.2. Research Results

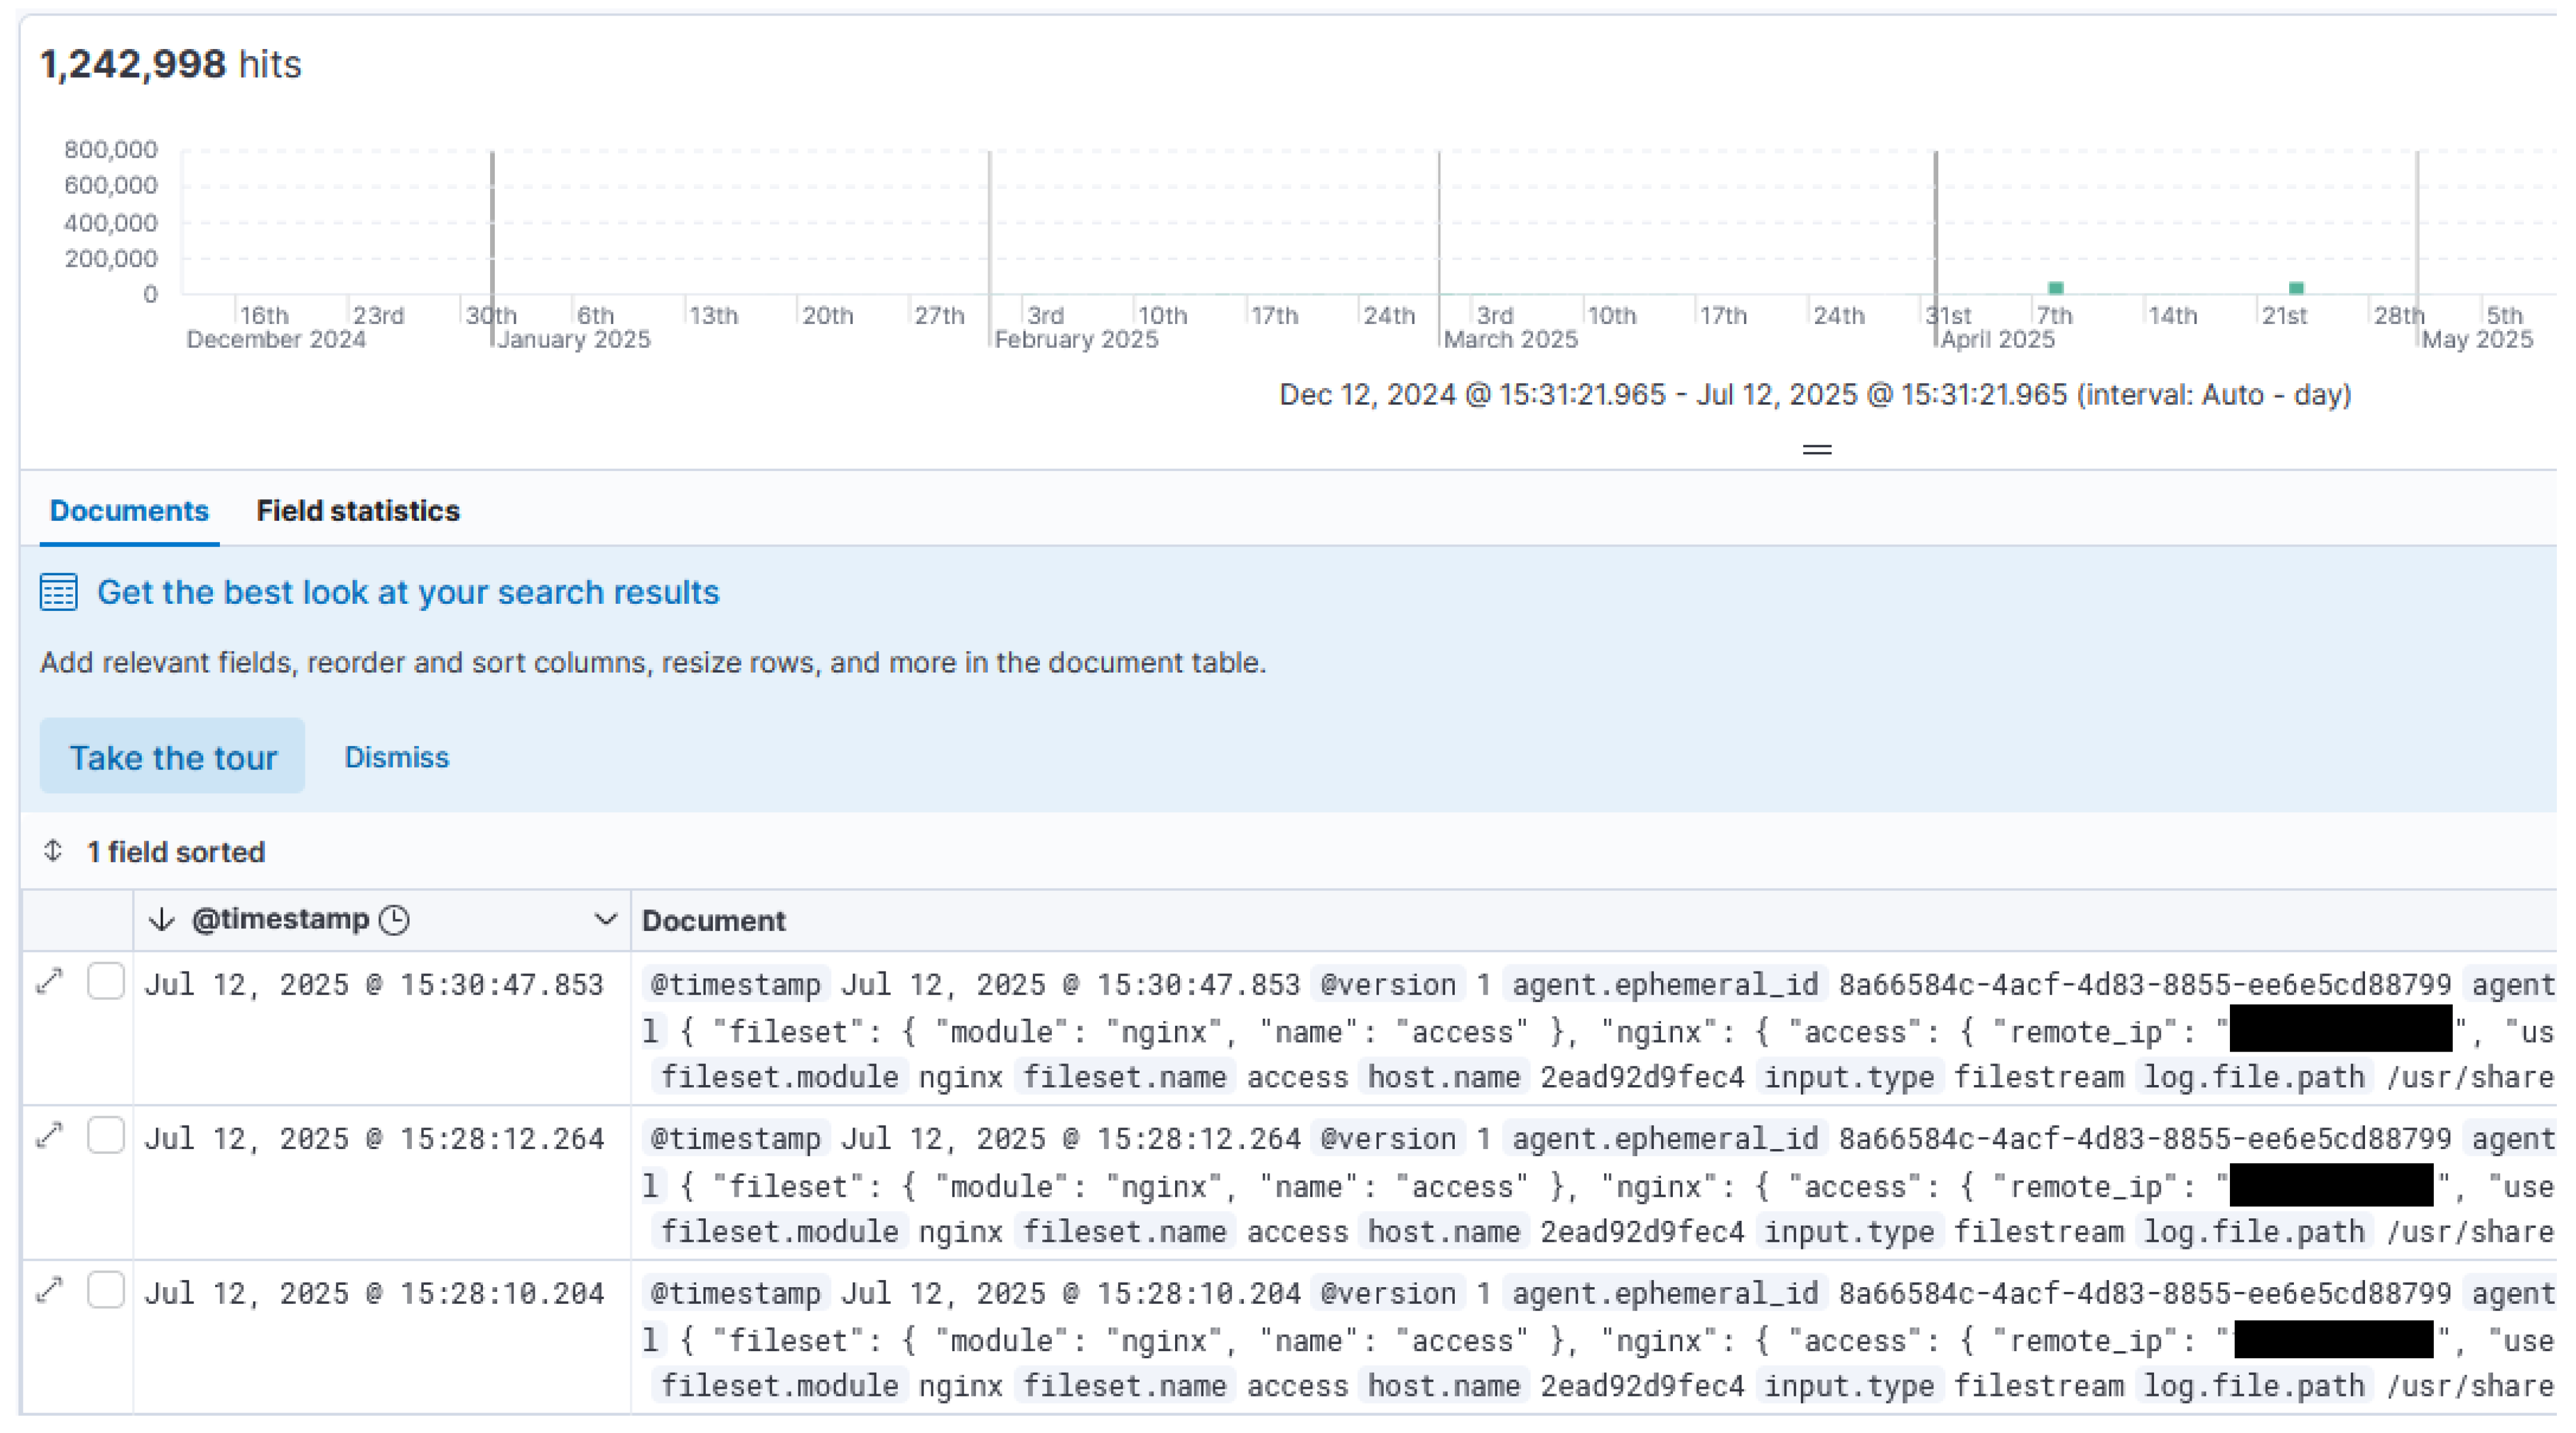
The main dashboard used for our research can be seen in Figure 18. Our research started in February 2025 and, during a period of six to seven months, we collected 1,242,998 total requests with our infrastructure. Using the dashboard we can perform various Kibana Query Language (KQL) queries to narrow down the total number of requests. Such queries allow us to focus on the interesting requests while removing noise or benign requests.
The top 5 countries according to the number of requests can be seen in Table 3. We can clearly see that the United States and Canada represent more than half of the total number of requests. This could be attributed to both high population numbers and the developed IT sector that offers many hosting services.
Previous research attempted to evaluate whether the popularity of the cloud provider affected the volume of malicious activity aimed at the honeypots deployed in the cloud, but results are not conclusive enough to suggest such influences [46].
Our research also tried to observe whether total traffic varies on a monthly basis. Traffic increased constantly during the first three months of operation and then there was a decrease followed by a potentially abnormal, very sharp increase. This very sharp increase occurred in July 2025, which is an obvious outlier. Figure 19 highlights the evolution of total traffic on a monthly basis.
Incidentally, July 2025 shows that multiple scanning attempts overlapped and amounted to more than 840,000 requests. We did not correlate this behavior with known malware or an increase in attacks across the Internet. However, we took advantage of this situation to show that our infrastructure behaves well under very high volumes of traffic.
Our research first attempted to infer how much of the scan volume could be attributed to Content Discovery attempts. Content Discovery is also called Directory Discovery or Directory Brute-Forcing. When performing such a procedure, attackers often use widely available, well-known wordlists. The wordlist contains paths normally found on web servers running certain technologies (e.g., Apache as web server or Wordpress as Content Management System). Since one single wordlist targets multiple technologies at the same time, a natural effect is that some, if not most, of the paths will not exist on the server. Thus, the number of 200 Response Codes from the server will be fewer than 400 or 301 codes. To mitigate the risk of Content Discovery attacks, the most general solution is to employ a web application firewall (WAF) that will restrict future incoming requests from certain sources marked as malicious. The distribution of the top five Response Codes offered by our honeypot over time is presented in Figure 20.
The 404 HTTP Response Code signals that the requested resource does not exist on the server. This concludes that at least 35.85% of the total volume of request could be attempts to perform Content Discovery against the honeypot.
The next class of attacks that we wanted to observe is the Path Traversal attempts. These attacks attempt to access resources, usually files located on the filesystem, outside the web server context. For example, on Linux systems, the /etc/passwd file might be accessed via Path Traversal vulnerabilities. An example of a Path Traversal payload would be ../../../etc/passwd, which takes advantage of repeatedly accessing the parent directory until reaching the root directory /. Then the /etc/passwd file is accessed directly. A common way to mitigate this issue is to enforce a filesystem sandbox around the web server, as described in Section 2. This measure would prevent resources outside the web server from being accessed by any client.
This class of attacks requires inspection of the URL of the initial request. The nginx.access.url.keyboard parameter is used to access the contents of the URL. The wildcard character * is used to match any sequence of characters before or after the parts of the URL that interest us. As an example, if we wanted to look for URLs that contain the string abc, we would have used the *abc* query. The same principle is used to look for certain, well-known malicious payloads. To search for Path Traversal attempts using our infrastructure, we used the following KQL query in the Kibana dashboard:
  • nginx.access.url.keyword : *..*
  • or nginx.access.url.keyword : *%2e%2e*
  • or nginx.access.url.keyword : *%252e%252e*
  • or nginx.access.url.keyword : *%u002e%u002e*
The query found 5315 matches, out of the 1,242,998 total requests. This means that over a period of 6 months, approximately 0.427% were Path Traversal attempts.
The third and final class of attacks that we focused on was Command Injection. This class of attacks was the most difficult to assess because of how complex and varied the payloads can be. Our research wanted to divide this attack into two phases: malicious file download and malicious payload execution. The download phase is usually performed via operating system tools like curl, wget, nc or certutil. The execution phase usually involves either executing the payload downloaded previously or executing Command Line instructions that gather information, like whoami, hostname, id or sysinfo. In particular instances, attackers attempt to use the php:// scheme to access the PHP input streams. This attack is potentially successful on web servers running PHP engines, which applies in our research.
To search for the elements we highlighted above, we used the following payload:
  • nginx.access.url.keyword : *curl*
  • or nginx.access.url.keyword : *wget*
  • or nginx.access.url.keyword : *certutil*
  • or nginx.access.url.keyword : *whoami*
  • or nginx.access.url.keyword : *hostname*
  • or nginx.access.url.keyword : *sysinfo*
  • or nginx.access.url.keyword : *chmod*
  • or nginx.access.url.keyword : *php\://*
This revealed 1151 matches out of the 1,242,998 total requests. Therefore, over a period of 6 months, approximately 0.0926% were Command Injection attempts.
A summary of our findings can be seen in Table 4, all values are relative to the total volume of requests and we might have overlapping values (e.g., same payload being used for both Content Discovery and Command Injection).
It is worth mentioning that the requests were subject to manual triage. In case of unique results, MISP Events were created and threat intelligence sharing was performed based on the events.
In Table 1 we discuss other honeypot alternatives that cybersecurity specialists could deploy. Since OpenCanary and T-pot are more complex than just simple-service honeypots, we compared our work with DShield and SNARE, which are more closely related in scale. We evaluated how feasible it is to detect attacks through custom queries or to label attacks automatically. We discovered that DShield offers a dashboard similar to our research but with no automatic attack classification. SNARE on the other hand, offers attack classification with limited support (via TANNER [17]), but no filtering or means to run queries. The comparison is summarized in Table 5. An important mention is that the attacks that each tool classifies were not the main element we focused on during our evaluation. Instead, the comparison focused on whether the tools had automatic attack labeling capabilities and not which attacks they were able to label.
We believe that extensibility provides substantial room for further research. Our aim is to use future efforts to automate detection, attack classification and alerting to improve incident response times.

6. Conclusions

Our research aimed to provide a customizable, application-agnostic, web application honeypot along with the means to monitor and filter the activity recorded by the honeypot. We compared the alternatives that we have in the open source community and detailed the results in Section 2. We took advantage of the comparison to justify our customized needs and argument our objectives.
We also detail our proposed architecture in Section 3 and we then provide a deep dive into the technical details of both our deployment strategy and the final implementation in Section 4.
We also support the collective, world-wide efforts to aggregate indicators of compromise (IoCs) into a common, standardized format using the MISP platform. We provide a basic checklist of items to use when deciding if an event should be shared via MISP in Section 4.1.
We also provided a quantitative analysis of the indicators we observed as being part of certain attack classes in Section 5. The results conclude our research efforts of designing, implementing, deploying and actively using our infrastructure to help identify threats that could be widely used to compromise assets exposed in the Internet. Throughout our evaluation phase, we also proved the reliability and robustness of our infrastructure when faced with very high volumes of Internet traffic. Moreover, we showed that the deception capabilities of our honeypot are independent of the monitoring functionality and that both can be improved in parallel.
We believe that our research could provide a reliable basis for further research and could be improved by adding functionality over the current codebase. One potential research direction could be to improve detection rates by leveraging automation and the use of Kibana Query Language and Lucene queries via the Elasticsearch API. Scripting such automation could provide an increase in detection times of malicious activities against the honeypot. Another research direction is the coverage of multiple attack classes. In most cases, this does not require more development efforts, as the only requirement is to write more Kibana Query Language queries aimed at specific attacks. Alternatively, Large Language Models (LLMs) could be trained with wordlists containing malicious payloads specific to different attack classes and could then be asked if certain URLs contain payloads belonging to any known pattern. However, there are certain situations that require extra components before obtaining the logs necessary to detect new attack classes. Such situations are discussed in Section 4.
A good addition would be monitoring of abnormal outbound connections originating from the web application. Such connections signal successful Remote Command Execution attempts executed by malicious users. Detection of such attempts could trigger automatic notifications that require immediate incident response actions as well as the disaster recovery plan, which would recreate the web application to remove the immediate threat. To improve the inspection and detection of time-based attacks, we could employ organized placement of honeypots in different geographical regions to minimize server response latency [47].
To fully benefit from lower detection times, an alerting mechanism could be implemented to improve the reaction times of researchers and promote rapid threat intelligence sharing of identified malicious events. The coverage of multiple technologies could be increased by providing examples of other web server technologies along with the current use of Wordpress as a web application honeypot.

Author Contributions

Conceptualization, R.-M.V. and M.-E.M.; methodology, R.-M.V. and M.-E.M.; writing—original draft preparation, R.-M.V.; project administration, M.-E.M.; funding acquisition, M.-E.M.; supervision, R.R. and D.Ț.; All authors have read and agreed to the published version of the manuscript.

Funding

This research was funded by SOCcare Project, Grant Agreement No. 101145843. The APC was funded by SOCcare Project, Grant Agreement No. 101145843.

Data Availability Statement

The original contributions presented in this study are included in the article. Further inquiries can be directed to the corresponding author.

Acknowledgments

The work is funded under the SOC digital artifact analysis and threat intelligence sharing maturity buildout and operation in East Europe (Romania, Lithuania, and beyond) (SOCcare) Project, with the support of the European Commission and Digital Europe Programme (DIGITAL), under Grant Agreement No. 101145843. This project is funded by the European Union. Views and opinions expressed are however those of the authors only and do not necessarily reflect those of the European Union or the European Cybersecurity Competence Centre. Neither the European Union nor the European Cybersecurity Competence Centre can be held responsible for them.

Conflicts of Interest

The authors declare no conflicts of interest. The funders had no role in the design of the study; in the collection, analyses, or interpretation of data; in the writing of the manuscript; or in the decision to publish the results.

Appendix A

The structure of an access log entry converted into JSON is shown below:
  • {
  •   "fileset": {
  •     "module": "nginx",
  •     "name": "access"
  •   },
  •   "nginx": {
  •     "access": {
  •       "remote_ip": "<redacted>",
  •       "user_name": "",
  •       "time": "08/Jul/2025:14:45:34 +0000",
  •       "method": "GET",
  •       "host": "<redacted>",
  •       "url": "/",
  •       "http_protocol": "HTTP/1.1",
  •       "response_code": "301",
  •       "body_sent": {
  •         "bytes": "5"
  •       },
  •       "referrer": "",
  •       "agent": ""
  •     },
  •     "request": "GET / HTTP/1.1",
  •     "connection": "506126",
  •     "pipe": ".",
  •     "connection_requests": "1",
  •     "time": {
  •       "iso8601": "2025-07-08T14:45:34+00:00",
  •       "msec": "1751985934.778",
  •       "request": "0.008"
  •     },
  •     "bytes": {
  •       "request_length": "43",
  •       "body_sent": "5",
  •       "sent": "277"
  •     },
  •     "http": {
  •       "x_forwarded_for": "",
  •       "x_forwarded_proto": "",
  •       "x_real_ip": "",
  •       "x_scheme": ""
  •     },
  •     "upstream": {
  •       "addr": "<redacted>:9000",
  •       "status": "301",
  •       "response_time": "0.007",
  •       "connect_time": "0.000",
  •       "header_time": "0.007"
  •     }
  •   }
  • }

References

  1. Alyasiri, H.; Clark, J.; Malik, A.; de Fréin, R. Grammatical Evolution for Detecting Cyberattacks in Internet of Things Environments. In Proceedings of the 2021 International Conference on Computer Communications and Networks (ICCCN), Athens, Greece, 19–22 July 2021. [Google Scholar] [CrossRef]
  2. Attaallah, A.; Khan, P.R. Estimating Usable-Security Through Hesitant Fuzzy Linguistic Term Sets Based Technique. Comput. Mater. Contin. 2021, 70, 5683–5705. [Google Scholar] [CrossRef]
  3. Akinlade, E.; Adeleye, E. Designing a Secure Interactive System: Balancing the Conflict Between Security, Usability, and Functionality. 2022, 1, 1–12. Available online: https://www.researchgate.net/publication/366252638_Designing_a_secure_interactive_system_balancing_the_conflict_between_security_usability_and_functionality (accessed on 1 August 2025).
  4. Verizon. 2025 Data Breach Investigations Report. Available online: https://www.verizon.com/business/resources/reports/dbir/ (accessed on 6 August 2025).
  5. Fuertes, W.; Arévalo, D.; Castro, J.; Ron, M.; Estrada, C.; Andrade, R.; Peña, F.; Benavides, E. Impact of Social Engineering Attacks: A Literature Review. In Developments and Advances in Defense and Security: Proceedings of MICRADS; Springer: Singapore, 2022; pp. 25–35. [Google Scholar] [CrossRef]
  6. Yang, X.; Yuan, J.; Yang, H.; Kong, Y.; Zhang, H.; Zhao, J. A Highly Interactive Honeypot-Based Approach to Network Threat Management. Future Internet 2023, 15, 127. [Google Scholar] [CrossRef]
  7. Papazis, K.; Chilamkurti, N. Hydrakon, a Framework for Measuring Indicators of Deception in Emulated Monitoring Systems. Future Internet 2024, 16, 455. [Google Scholar] [CrossRef]
  8. Rabzelj, M.; Sedlar, U. Beyond the Leak: Analyzing the Real-World Exploitation of Stolen Credentials Using Honeypots. Sensors 2025, 25, 3676. [Google Scholar] [CrossRef] [PubMed]
  9. Krawetz, N. Anti-honeypot technology. IEEE Secur. Priv. 2004, 2, 76–79. [Google Scholar] [CrossRef]
  10. Mesbah, M.; Elsayed, M.S.; Jurcut, A.D.; Azer, M. Analysis of ICS and SCADA Systems Attacks Using Honeypots. Future Internet 2023, 15, 241. [Google Scholar] [CrossRef]
  11. Omar, A.H.E.; Soubra, H.; Moulla, D.K.; Abran, A. An Innovative Honeypot Architecture for Detecting and Mitigating Hardware Trojans in IoT Devices. IoT 2024, 5, 730–755. [Google Scholar] [CrossRef]
  12. DShield Inc DShield. Available online: https://isc.sans.edu/honeypot.html (accessed on 1 August 2025).
  13. Mushorg. SNARE. Available online: https://snare.readthedocs.io/en/latest/index.html (accessed on 1 August 2025).
  14. Canary, T. OpenCanary. Available online: https://opencanary.readthedocs.io/en/latest/ (accessed on 1 August 2025).
  15. Deutsche Telekom Security GmbH T-Pot. Available online: https://github.com/telekom-security/tpotce?tab=readme-ov-file#honeypots-and-tools (accessed on 1 August 2025).
  16. Boparai, A. The Behavioural Study of Low Interaction Honeypots: DShield and Glastopf in Various Web Attacks. 2014. Available online: https://ualberta.scholaris.ca/items/291066b4-ea95-47c6-b143-a70cc8460a28 (accessed on 1 August 2025).
  17. Mushorg. TANNER. Available online: https://tanner.readthedocs.io/en/latest/ (accessed on 1 August 2025).
  18. Biswa, S.; Wangmo, P.; Rangdel, T.; Wangchuk, T.; Tshering, Y.; Yangchen, T. Securing Network using Honeypots: A Comparative Study on Honeytrap and T-Pot. JNEC Thruel Rig Sar Toed 2024, 7, 12–20. [Google Scholar]
  19. Aslan, C.B.; Turksanli, E.; Erkan, R.E.; Ozturk, M.; Akdeniz, C. Unveiling Hidden Patterns in T-Pot Honeypot Logs: A Latent Topic Analysis. In Proceedings of the 2024 17th International Conference on Information Security and Cryptology (ISCTürkiye), Ankara, Turkiye, 16–17 October 2024; pp. 1–6. [Google Scholar] [CrossRef]
  20. Paralax. Awesome Honeypots. Available online: https://github.com/paralax/awesome-honeypots?tab=readme-ov-file (accessed on 1 August 2025).
  21. Nawrocki, M.; Wählisch, M.; Schmidt, T.C.; Keil, C.; Schönfelder, J. A survey on honeypot software and data analysis. arXiv 2016, arXiv:1608.06249. [Google Scholar] [CrossRef]
  22. Wagner, C.; Dulaunoy, A.; Wagener, G.; Iklody, A. Misp: The design and implementation of a collaborative threat intelligence sharing platform. In Proceedings of the 2016 ACM on Workshop on Information Sharing and Collaborative Security, Vienna, Austria, 24 October 2016; pp. 49–56. [Google Scholar]
  23. MISP Project MISP. Available online: https://www.misp-project.org/ (accessed on 1 August 2025).
  24. Docker. Dockerhub. Available online: https://hub.docker.com/ (accessed on 1 August 2025).
  25. Sysoev, I. Nginx. Available online: https://nginx.org/ (accessed on 1 August 2025).
  26. Juell, K. How to Install WordPress with Docker Compose. Available online: https://www.digitalocean.com/community/tutorials/how-to-install-wordpress-with-docker-compose (accessed on 1 August 2025).
  27. Elastic. Filebeat. Available online: https://www.elastic.co/beats/filebeat (accessed on 1 August 2025).
  28. Elastic. Metricbeat. Available online: https://www.elastic.co/beats/metricbeat (accessed on 1 August 2025).
  29. Elastic. Logstash. Available online: https://www.elastic.co/logstash (accessed on 1 August 2025).
  30. McDonnell, M. FileBeat Directly to ELS or via LogStash? Available online: https://stackoverflow.com/questions/39873791/filebeat-directly-to-els-or-via-logstash (accessed on 1 August 2025).
  31. Diab, D. Logs from Filebeat to Logstash to Elasticsearch—2. Available online: https://www.dbi-services.com/blog/logs-from-filebeat-to-logstash-to-elasticsearch-2/ (accessed on 1 August 2025).
  32. Lopchan, N. Sending Logs to Elasticsearch Using Filebeat and Logstash. Available online: https://medium.com/@lopchannabeen138/sending-logs-to-elasticsearch-using-filebeat-and-logstash-5fbfae64c0ad (accessed on 1 August 2025).
  33. Lopchan, N. Deploying ELK Inside Docker Container: Docker-Compose. Available online: https://medium.com/@lopchannabeen138/deploying-elk-inside-docker-container-docker-compose-4a88682c7643 (accessed on 1 August 2025).
  34. Mitchell, E. Docker Compose: Part 2. Available online: https://www.elastic.co/blog/getting-started-with-the-elastic-stack-and-docker-compose-part-2 (accessed on 1 August 2025).
  35. Elastic. Elasticsearch. Available online: https://www.elastic.co/elasticsearch (accessed on 1 August 2025).
  36. Elastic. Kibana. Available online: https://www.elastic.co/kibana (accessed on 1 August 2025).
  37. Foundation, A.S. Log Files. Available online: https://httpd.apache.org/docs/2.4/logs.html#page-header (accessed on 1 August 2025).
  38. (NiceGuyIT), D.R. Nginx JSON to Filebeat to Logstash to Elasticsearch. Available online: https://gist.github.com/NiceGuyIT/58dd4d553fe3017cbfc3f98c2fbdbc93 (accessed on 1 August 2025).
  39. HeadTea. Send Logs with Filebeat to Logstash. Available online: https://stackoverflow.com/questions/62950008/send-logs-with-filebeat-to-logstash (accessed on 2 August 2025).
  40. OWASP. OWASP TOP 10. Available online: https://owasp.org/www-project-top-ten/ (accessed on 2 August 2025).
  41. VirusTotal. VirusTotal. Available online: https://www.virustotal.com/gui/ (accessed on 2 August 2025).
  42. Cisco. Cisco Talos Intelligence Group. Available online: https://talosintelligence.com/ (accessed on 2 August 2025).
  43. SANS. SANS Internet Storm Center. Available online: https://isc.sans.edu/ (accessed on 2 August 2025).
  44. Elastic. Kibana Rollover. Available online: https://www.elastic.co/docs/manage-data/lifecycle/index-lifecycle-management/rollover (accessed on 1 August 2025).
  45. Mohamed Mohideen, M.A.; Nadeem, M.S.; Hardy, J.; Ali, H.; Tariq, U.U.; Sabrina, F.; Waqar, M.; Ahmed, S. Behind the Code: Identifying Zero-Day Exploits in WordPress. Future Internet 2024, 16, 256. [Google Scholar] [CrossRef]
  46. Kelly, C.; Pitropakis, N.; Mylonas, A.; McKeown, S.; Buchanan, W.J. A Comparative Analysis of Honeypots on Different Cloud Platforms. Sensors 2021, 21, 2433. [Google Scholar] [CrossRef] [PubMed]
  47. Zhou, Z.; Abawajy, J. Reinforcement Learning-Based Edge Server Placement in the Intelligent Internet of Vehicles Environment. IEEE Trans. Intell. Transp. Syst. 2025, 1–11. [Google Scholar] [CrossRef]
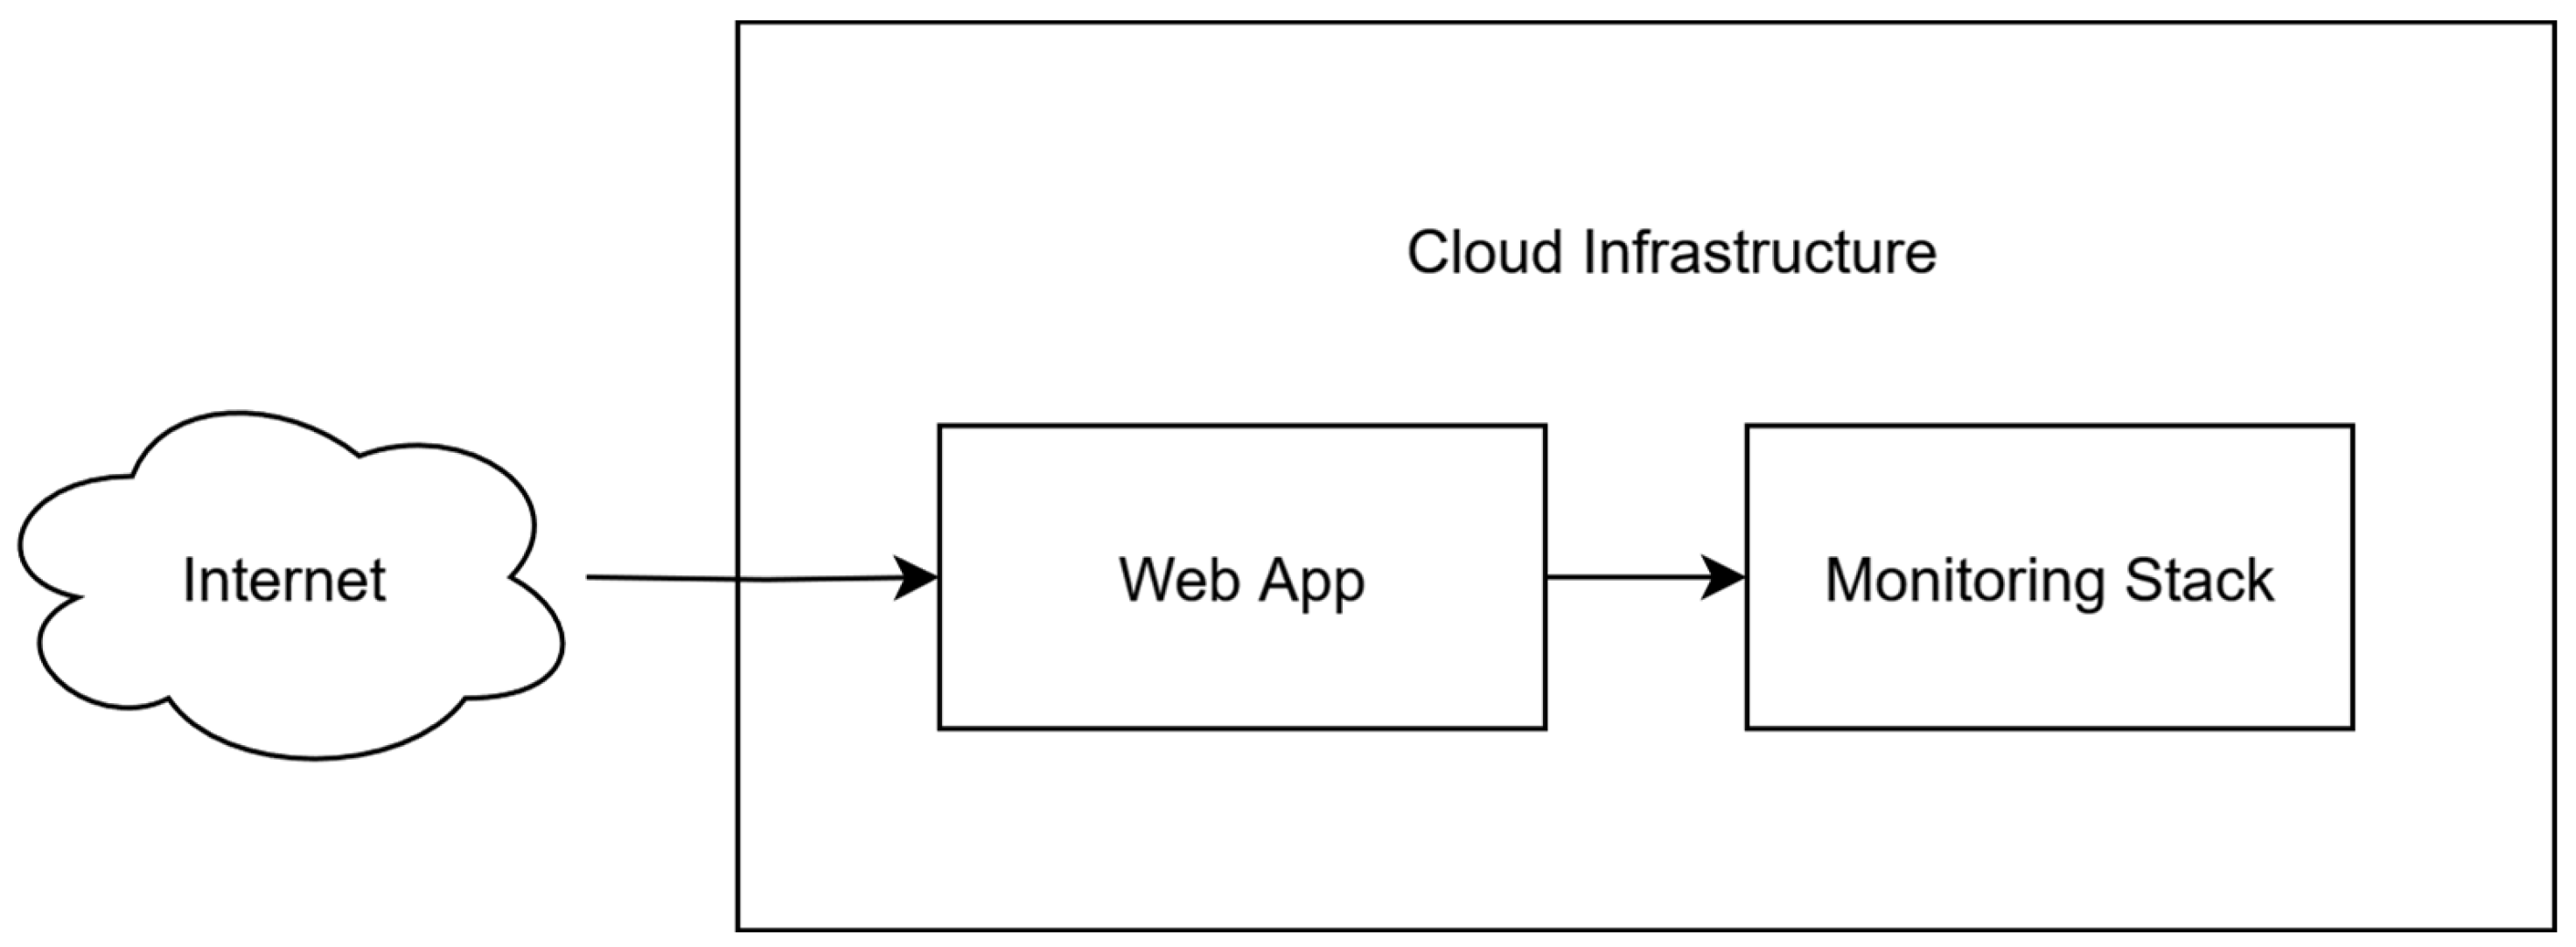
Figure 1. Top-level design view of the infrastructure.
Futureinternet 17 00422 g001
Figure 2. An example of filesystem isolation (filesystem segregation).
Futureinternet 17 00422 g002
Figure 3. Network isolation example.
Futureinternet 17 00422 g003
Figure 4. Docker architecture.
Futureinternet 17 00422 g004
Figure 5. Podman architecture.
Futureinternet 17 00422 g005
Figure 6. Detailed diagram of the infrastructure.
Futureinternet 17 00422 g006
Figure 7. Deployment technological stack.
Futureinternet 17 00422 g007
Figure 8. Application Network.
Futureinternet 17 00422 g008
Figure 9. Log Shipping process.
Futureinternet 17 00422 g009
Figure 10. Monitoring Network.
Futureinternet 17 00422 g010
Figure 11. The final diagram of the deployment.
Futureinternet 17 00422 g011
Figure 12. SSH Tunnel configuration in MobaXTerm on Windows.
Futureinternet 17 00422 g012
Figure 13. Structure of a simple HTTP Request.
Futureinternet 17 00422 g013
Figure 14. Structure of a simple HTTP Response.
Futureinternet 17 00422 g014
Figure 15. An example of an event in Kibana Dashboard.
Futureinternet 17 00422 g015
Figure 16. IoCs of MISP Event.
Futureinternet 17 00422 g016
Figure 17. The web application honeypot Wordpress instance.
Futureinternet 17 00422 g017
Figure 18. Timeline and event data shown in Kibana.
Futureinternet 17 00422 g018
Figure 19. Evolution of traffic on a monthly basis.
Futureinternet 17 00422 g019
Figure 20. Top 5 most frequent HTTP Response Codes.
Futureinternet 17 00422 g020
Table 1. Comparison of various open-source honeypots.
Criteria CandidateDShieldSNAREOpenCanaryT-Pot
ServicesSSH, Telnet, HTTPHTTP10+ services10+ honeypots
Single HTTP TechnologyYESYESYESNO
Certain vulnerabilitiesNONOYESNO
Loosely coupledNOYESNOYES
Table 2. Summary of supported attack classes.
Attack ClassesSupported/Only Queries NeededExtra Implementation Needed
Remote Command ExecutionSupportedNO
Directory DiscoverySupportedNO
Targeted Vulnerability ScanningSupportedNO
SQL InjectionOnly Queries NeededNO
Cross-Site ScriptingOnly Queries NeededNO
Server-Side Request ForgeryOnly Queries NeededNO
Template InjectionOnly Queries NeededNO
HTTP/2*Only Queries NeededYES
DeserializationNot SupportedYES
POST Body PayloadsNot SupportedYES
WebSocket AnomaliesNot SupportedYES
Table 3. Top 5 countries interacting with the web application honeypot.
Country% Requests
US55.04%
CA10.35%
Others9.86%
GB9.47%
RU9%
DE6.26%
Table 4. Proportions of each attack class out of total volume of requests.
Attack Class% of Total Requests
Content Discovery35.85%
Path Traversal0.427%
Command Injection0.0926%
Table 5. Extensibility comparison with existing tools.
HoneypotQueries via DashboardAttack Class Assignation
Our ResearchYESVia Queries
DShieldYESVia Queries
SNARE (via TANNER)NOAutomatic Via Scripts
Disclaimer/Publisher’s Note: The statements, opinions and data contained in all publications are solely those of the individual author(s) and contributor(s) and not of MDPI and/or the editor(s). MDPI and/or the editor(s) disclaim responsibility for any injury to people or property resulting from any ideas, methods, instructions or products referred to in the content.