1. Introduction
Security remains a critical concern throughout the software development life cycle and is likely to become even more challenging in the future. Currently, there is no simple solution to the problem of software security [
1]. In this context, assessing software security becomes essential for building robust and secure systems. One important metric for evaluating security is the software attack surface, which represents the potential entry points an attacker could exploit to compromise a system [
2]. Generally, systems with smaller attack surfaces are considered to be less vulnerable and, therefore, more secure than those with larger attack surfaces.
The fact that it takes a lot of configuration even to measure a simple software makes determining the attack surface difficult. Most attack surface concepts include attack surface components such as entry points, exit points, and channels. Since these components are not general and must be worked on individually, following the nature of the program and the security objective of the institution, identifying them can be highly challenging, time-consuming, and involve a lot of human labor. Hence, in this research, we present a mechanism for calculating the attack surface of an application with minimal configuration by analyzing the source code. We have used a more all-encompassing method to calculate the attack surface score, which is based on the flaws that the static analysis tool has identified as well as the common weakness enumerations (CWE) and common vulnerabilities and exposures (CVE) connected to those concerns. Since CWEs are general to software vulnerabilities, using them to calculate the score will give the software a general attack surface score and help to understand the status of software vulnerabilities or compare two different software in terms of exposure to attack surfaces without requiring any configuration. Even though CVEs are specific to a vulnerability and not generic, we included them in our computation to obtain a general understanding of CWE. To obtain a more comprehensive understanding of the impact caused by the CWE in terms of CVE, we averaged a list of CVEs that are connected to CWE rather than utilizing just one.
Though we have taken a different approach to analyzing the software, i.e., using generic CWEs instead of analyzing every component specifically in terms of entry points, exit points, and channels, we have based our score on the traditional metric, Damage-Potential-to-Effort ratio, which is a quantitative attack surface measurement provided by Mandhandta et al. [
3]. They clarify that not all resources contribute equally to a system’s attack surface assessment because not all resources are equally likely to be accessed by an attacker. Damage potential in our context refers to the amount of harm that an attacker can cause by using a resource in an assault, while effort is the acquisition of the required access rights in order to be able to use the resource in an assault. The effort is based on the privileges needed to access each issue. The final result of the entire process is a score, which is an indicator of the attack surface of the software application.
This paper presents a novel scoring framework and demonstrates its viability through a proof-of-concept implementation that integrates with SonarQube, a widely-used and representative static analysis tool. Our goal is to establish a methodology that is, by design, adaptable to the outputs of other analysis tools.
The remainder of the paper is organized as follows.
Section 2 presents the related works. The methodology is described in
Section 3.
Section 4 describes the experiments that we conducted. We compare various projects and do the analysis in
Section 5. The limitations and future work are in
Section 6. Finally,
Section 7 concludes the paper.
2. Related Works
Attack surface has been studied for quite some time, and one of the pioneer studies was performed by Manadhata et al. [
3] in their article “An Attack Surface Metric”. Our model builds on their proposed Damage-Potential-to-Effort (D/E) ratio, which provides a foundational and pragmatic approach to software security measurement. A key takeaway from their work is the categorization of system resources and the importance of identifying both contributing and non-contributing components of the attack surface. Their model also introduces formal definitions for entry/exit points, communication channels, and untrusted data items, defining the attack surface as a function of the sets
M,
C, and
I (entry/exit points, channels, and untrusted data). However, the model is complex, requires deep domain knowledge, and depends heavily on manually constructed I/O models, making it difficult to scale or upgrade. To address these limitations, our approach leverages static analysis and structured vulnerability data (CWE/CVE), enabling a more automated, maintainable, and up-to-date scoring system supported by the MITRE databases [
4].
A complementary qualitative approach was proposed by Moshtari et al. [
5], who used grounded theory to identify the main components of attack surfaces: entry points, targets, and mechanisms through a systematic coding process applied to CVE and CWE data. They utilized data collection, memo writing, and axial coding to group vulnerabilities based on descriptive similarity. While insightful, their method relies heavily on text descriptions and often fails to match many CWEs to meaningful categories. We also use CWE/CVE data, but instead of qualitative grouping, we rely on structured CWE properties directly for scoring, thus avoiding the issue of unmatched vulnerabilities and ensuring better consistency across diverse projects.
The notion of attack surface has also been explored in the context of networks. Zhang et al. [
6] proposed a model that maps attack surface attributes like access rights and privileges to CVSS base scores, aggregating risk across an entire software system. While effective for probability estimation in network environments, their method may not translate well to source-code-level software risk. Our approach addresses this gap by applying static analysis to extract code-level vulnerabilities and by computing scores based on multiple real-world CVEs associated with each CWE, leading to a more generalizable and software-specific scoring model.
More recent studies have applied machine learning to vulnerability detection. In 2024, Atiiq et al. [
7] employed machine learning to detect software vulnerabilities by training separate classifiers for each CWE, rather than using a single binary classifier across all vulnerability types. While their detection approach differs from ours, their work similarly leverages CWE and CVE data to identify vulnerabilities, highlighting a shared reliance on structured vulnerability intelligence. It is important to distinguish between vulnerability detection and attack surface quantification. While Atiiq et al. [
7] focus on accurately identifying specific CWEs in source code, our work addresses the next step: quantifying the collective risk of identified vulnerabilities. Instead of introducing a new detection method, we propose a scoring framework that processes outputs from detection tools like SonarQube, making our approach complementary to methods such as those in [
7].
Static analysis continues to be central to modern security efforts. Rahaman et al. [
8] performed a systematic review of static analysis-based security methods for microservices and cloud-native applications. Their findings confirm that static tools are widely adopted in practice, consistent with our use of SonarQube for vulnerability extraction. In a separate effort, Xie et al. [
9] proposed a network attack surface evaluation model based on optimal attack strategies. Although network-centric, their emphasis on identifying critical system components aligns with our software-focused approach to quantifying exposure and attack potential using static code metrics and vulnerability intelligence. Efforts to enrich the CWE/CVE ecosystem have also contributed valuable insights. Shi et al. [
10] proposed threat knowledge graphs that connect software weaknesses, specific vulnerabilities, and affected products. While their focus is on knowledge representation, our method uses this structured data to compute actionable metrics for attack surface scoring.
Over the years, a wide variety of approaches have been proposed for vulnerability classification and detection. Traditional rule-based static analyzers—such as SonarQube, PMD, and Fortify—detect known patterns by applying manually curated rules to source code. Recent advancements in static analysis and CWE/CVE-based scoring further strengthen the context of our work. Shihab and Alanezi [
11] enhanced static code analysis by integrating detection for the top 25 CWEs into tools such as Bandit, utilizing abstract syntax tree (AST) traversal to significantly improve vulnerability coverage. NLP-based approaches, like the automated CWE base-score generation presented by researchers in [
12], which is a critical component of our methodology, demonstrates this effectively. They employ NLP techniques to compute the semantic similarity between the descriptive text of a CWE and the texts of many associated CVEs. This process enables the creation of a ranked list of CVEs that are most representative of a given weakness. Our methodology leverages their NLP-based ranking algorithm to select the top five most relevant CVEs for our effort calculation, ensuring that our metric is based on pertinent, real-world exploitability data. On a similar path, the transformer-based hierarchical classifier V2W-BERT [
13] facilitates precise mappings between CWEs and CVEs, emphasizing the practical utility of structured vulnerability intelligence.
In addition to NLP, deep-learning techniques have been employed to refine vulnerability detection. Chakraborty et al. [
14] developed LineVul, a transformer-based model that identifies vulnerabilities at the line level using contrastive learning. Zhou et al. [
15] proposed Devign, a GNN-based model that captures semantic relationships through control and data flow graphs. While these tools improve detection accuracy, they do not offer integrated risk scoring. The ability to bridge vulnerability detection with actionable scoring remains relatively underexplored, and our work addresses this gap by introducing a configurable and reproducible method that integrates structured intelligence, static analysis, and real-world exploitability insights to guide software risk assessment more effectively.
3. Methodology
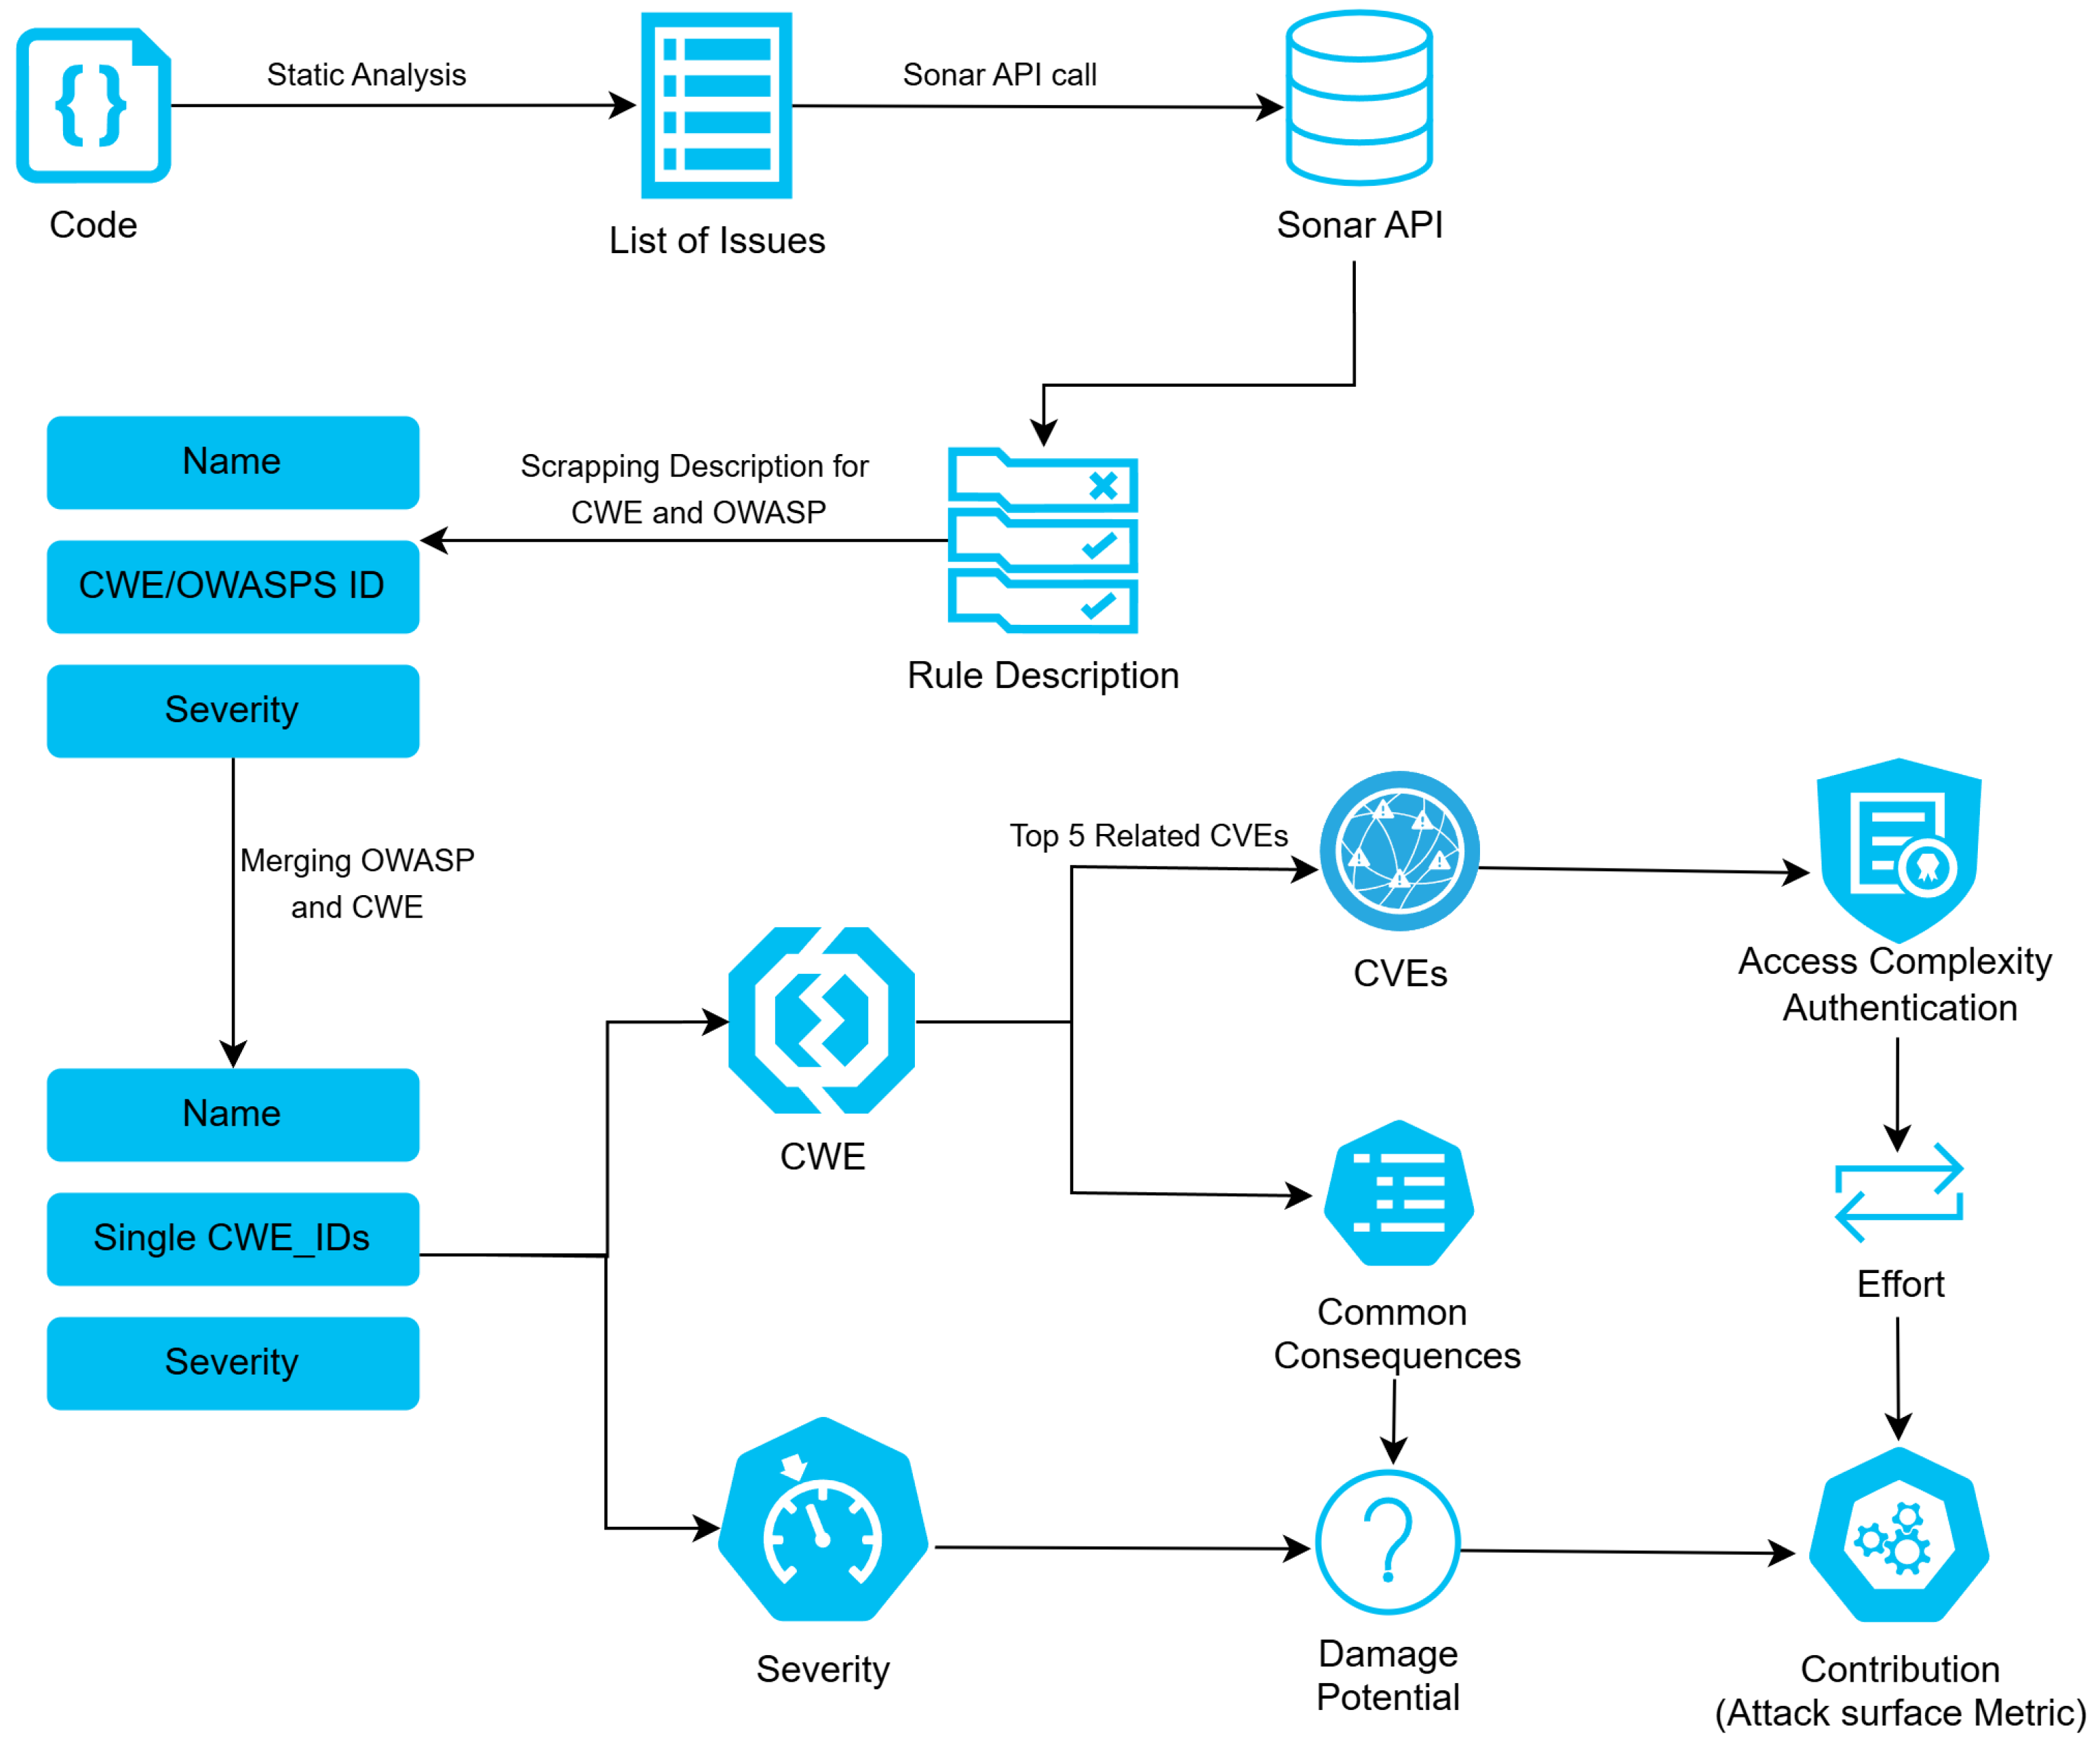
To evaluate the application and assign scores to it, we first performed static code analysis on the source code. We then pre-processed the data collected from the analysis. Finally, we generated metrics based on the pre-processed data. Each step is further explained in detail in the subsequent sections. Additionally, the whole process is shown in
Figure 1.
3.1. Data Collection
3.1.1. Initial Code Analysis
Code analysis can be performed using various techniques, including code reviews and threat modeling. Among these, static code analysis is considered one of the most effective methods for identifying issues early in the development process [
16]. Our methodology is founded on static code analysis, a cornerstone of modern software security and an effective practice for identifying vulnerabilities early in the development life cycle. The mature static application security testing (SAST) landscape encompasses many tools, from commercial solutions like Veracode and Checkmarx to open-source analyzers like PMD. For this study, we selected SonarQube (8.9 LTS) [
17], a widely adopted tool, for its robust support of over 29 programming languages, its extensible plugin architecture, and its web API, which was essential for programmatically extracting the detailed vulnerability findings required by our scoring pipeline. In our study, we used the community edition of SonarQube, installed locally as a server, to scan Java code and retrieve the analysis results via its web API. The tool provided detailed reports on vulnerabilities and other security-related insights. The initial code scan was performed using the SonarQube command-line tool, which analyzes the code and uploads the results to the locally hosted SonarQube server. To retrieve the analysis results, we accessed SonarQube’s web API.
3.1.2. Selecting Data from SonarQube Result
The output was retrieved using the API provided by Sonar [
18] to access data from its static analysis. This API provides a list of issues and the Java rules they correspond to. Then again, for each Java rule, we queried the Sonar API, which provides more details about the Java rule. The details consist of many fields, available at SonarSource [
18]. Among them, we chose three fields: name, description, and severity. Name is a short description of the issue. Description is a longer description of the issue in HTML format with relevant CWE/OWASP information, examples, and compliant coding practice. Severity consists of a severity level and has 5 levels: BLOCKER, CRITICAL, MAJOR, MINOR, and INFO. This is the risk analysis performed by Sonar on the code on impact and likelihood, as shown in
Table 1. To make it easy to quantify, we assigned impact scores to severity as shown in
Table 2.
Another important metric in evaluating software quality is technical debt, which refers to the additional cost incurred in future development or maintenance due to shortcuts or suboptimal decisions made during software design and implementation [
19]. Technical debt accumulates over time and can significantly impact software maintainability, reliability, and security.
Tools like SonarQube provide an automated way to estimate technical debt based on static code analysis [
18]. SonarQube defines technical debt using the following formula as shown in Equation (
1):
where
R is the remediation cost,
C is the cost to develop one line of code, and
N is the total number of lines of code.
Consequently, a higher level of technical debt is typically associated with an increased attack surface score. The buildup of technical debt, often driven by factors such as tight project deadlines, threatens not only software quality, budgets, and schedules, but also the overall cybersecurity of a system [
20]. Therefore, we incorporate this concept into our hypothesis in
Section 4.
3.2. Data Processing
The data provided by SonarQube must be processed, as they can associate each vulnerability with one or more CWEs or OWASP categories. However, our processing pipeline is designed to handle only a single CWE per issue. Therefore, we standardize the data by selecting a single representative CWE for each vulnerability to ensure compatibility with our system.
Merging OWASP and CWEs
One of the challenges we faced was that one issue can be linked with multiple CWEs, multiple OWASP, or both. So we performed the following steps to overcome those:
- 1.
Only one CWE: That CWE was considered as the parent CWE and is assigned to that issue.
- 2.
- 3.
Multiple CWE: If multiple CWEs were linked to a single issue, then, research mapping from MITRE was used to link them to one common parent. There are many parent-child mappings; among them, we used View-1000 (
https://cwe.mitre.org/data/definitions/1000.html, accessed on 29 June 2025) to map one issue to one CWE.
3.3. Metrics Quantification
We determine the damage potential of each CWE by combining two metrics: a consequence score, derived from MITRE’s impact descriptors, and a severity score, taken from the Sonar report. The impact weights used in the calculation can be configured externally via a properties file, enabling teams to tailor the metric to specific security goals.
3.3.1. Consequence Score
MITRE lists common consequences for each CWE in the form
Each identified impact is mapped to one of the CIA dimensions—confidentiality (
C), integrity (
I), or availability (
A)—and assigned a numeric weight according to
Table 3.
Given a multi-scope consequence, e.g.,
the consequence score is the sum of the corresponding weights:
3.3.2. Severity Score
We map the qualitative
Severity field from Sonar into a numeric Impact Score as shown in
Table 2.
3.3.3. Damage Potential Calculation
The final damage potential is the product of the two scores as shown in Equation (
2):
For example, consider a vulnerability tagged as CWE-79 (Cross-Site Scripting) with
From
Table 2, a Critical rating maps to
Thus the damage potential is
The final damage potential is computed as
This formulation ensures that both the breadth of a vulnerability’s effect (via the consequence score) and its criticality (via the severity score) are jointly captured in the resulting metric.
3.3.4. Quantifying Effort
We have leveraged OPENCVE (
https://www.opencve.io/, accessed on 29 June 2025) as a data source. We use their endpoint to retrieve the authentication and access complexity metrics needed to compute the effort score. A sample response is shown in
Table 4.
Effort reflects the privileges an attacker must obtain to exploit a vulnerability. We compute it by combining the access complexity and authentication scores for the CVEs linked to each CWE. We have assigned them scores as shown in
Table 5 and
Table 6.
For each CWE, we collect all associated CVEs via MITRE’s View 1003 (
https://cwe.mitre.org/data/definitions/1003.html, accessed on 29 June 2025) and the Kaggle dataset by Demirturek [
21]. When many CVEs are found, we apply the NLP-based ranking algorithm of Nourin et al. [
12] to select the top 5 most semantically related CVEs. The selection of the top 5 most semantically related CVEs reflects a methodological balance between relevance and stability. Limiting the set ensures that the chosen CVEs are highly representative of the parent CWE, as determined by the NLP ranking, while avoiding semantic noise from less-related entries. At the same time, averaging across five CVEs prevents volatility that could arise from relying on a single outlier. Although N = 5 is a heuristic choice, optimizing this parameter remains a direction for future work.
So, for each selected CVE,
The CWE’s overall effort score is the average of its CVE’s effort scores.
Calculation Example
Consider a CVE whose CWE report accessComplexity = “LOW” and authentication = “SINGLE”. From
Table 5 and
Table 6,
Similar CWE-level scoring approaches—using CVE exploitability metrics—have been proposed by Nourin et al. [
12] and Yanan et al. [
22].
3.3.5. Attack Surface Metric
For each vulnerability, we have already computed both its damage potential and the effort required to exploit it. To synthesize these into a single metric, we note that higher damage potential indicates a more severe (stronger) attack, whereas greater required effort corresponds to a less likely (weaker) attack [
3]. Therefore, the contribution of each issue can be expressed as
Combining these relationships yields
The overall attack surface score for a codebase is the sum of the contributions across all issues as shown in Equation (
6):
To enable comparisons between different codebases, we normalize the aggregate score. This normalization is based on the theoretical maximum contribution of a single, worst-case vulnerability.
We define the maximum possible DamagePotential for a single vulnerability to be 300. This value is derived from a theoretical ConsequenceScore cap of 30 (representing multiple severe impacts) multiplied by the maximum ImpactScore of 10 (for a `BLOCKER’ severity). The theoretical minimum Effort is 1, representing a vulnerability requiring no privileges and no authentication. Therefore, the maximum possible contribution from a single issue is 300/1 = 300. We normalize the total score against this value as shown in Equation (
7):
This produces a risk score where a value of 1.0 indicates that the project’s aggregate risk is equivalent to one “worst-case” vulnerability. This approach provides a consistent baseline for comparing different projects.
To ensure the reproducibility of our scoring methodology and facilitate future research, we describe in detail how we integrated static analysis results from SonarQube with external vulnerability databases—primarily CWE and CVE repositories from MITRE and OpenCVE. It is explained in Algorithm 1. All scripts used for SonarQube data extraction, CWE/CVE mapping, and scoring are available in our public repository:
https://github.com/yudeep-rajbhandari/attackSurfaceMetric, accessed on 29 June 2025. The repository includes instructions for setting up SonarQube locally to enable full pipeline reproduction.
| Algorithm 1 Attack surface score calculation. |
- Require :
Source code of a software project - Ensure :
A normalized attack surface score in the range
- 1:
Perform static analysis on the input source code using SonarQube to generate issue reports. - 2:
For each issue found, call the SonarQube web API to retrieve its severity and HTML description. - 3:
Weakness Unification - 4:
for each issue identified do - 5:
Parse the HTML description (using regular expressions) to extract all CWE and OWASP identifiers. - 6:
if issue has OWASP identifiers then - 7:
Map OWASP identifiers to corresponding CWEs using MITRE’s official OWASP–CWE mapping (View-1344). - 8:
end if - 9:
if issue has multiple CWE children then - 10:
Find the single common parent using MITRE’s View-1000 hierarchy. - 11:
end if - 12:
end for - 13:
Compile a final list of unique parent CWEs present in the project. - 14:
for each unique CWE in the list do
- 15:
Set value from SonarQube severity ( Table 2). - 16:
Set sum of impact weights of CWE’s common consequence mapped via ( Table 3). - 17:
Set .
- 18:
Compile a list of all related CVEs from MITRE’s View-1003 and the Kaggle dataset. - 19:
Select the top 5 most semantically related CVEs using the algorithm from Nourin et al. [ 12] - 20:
Initialize an empty list . - 21:
for each of the 5 selected CVEs do - 22:
Call the OPENCVE API (`GET /api/cve/cve_id`). - 23:
Extract `accessComplexity` and `authentication` scores. - 24:
- 25:
Add to . - 26:
end for - 27:
Set . - 28:
Calculate Contribution - 29:
Set . - 30:
Add to a list of all contribution scores. - 31:
end for - 32:
Final Score Calculation - 33:
Set . - 34:
Set , where 300 is the theoretical maximum damage potential. - 35:
return NormalizedScore
|
3.4. Generalizability Across Security Contexts
A key strength of our scoring model is its adaptability to different security contexts and organizational risk priorities. In our framework, the security context is defined by the weight assigned to each type of impact (e.g., read, modify, execute), which correspond to impacts on confidentiality, integrity, and availability. These weights are configurable via an external application properties file, allowing the scoring logic to remain unchanged while enabling the metric to be re-tuned for various security objectives.
To evaluate the generalizability of our approach, we compared the score of a representative vulnerability—CWE-79 (Cross-Site Scripting)—under two different security contexts: one prioritizing integrity, and another prioritizing confidentiality as shown in
Table 7.
CWE-79 has documented consequences of confidentiality: read and integrity: modify. If its SonarQube severity is marked as Critical, we assign an impact score of 7.
This example demonstrates that under a confidentiality-focused setting, the same vulnerability yields a 54.5% higher DamagePotential, thus contributing more substantially to the overall attack surface score. By allowing the weights to be externally configurable, our framework supports flexible prioritization across different domains—whether integrity (e.g., embedded systems), confidentiality (e.g., healthcare), or availability (e.g., cloud services) and enhances the generalizability of the scoring system as shown in
Table 8.
4. Experimental Evaluation
In order to run the experiments, we built a proof-of-concept using Java (
https://github.com/yudeep-rajbhandari/attackSurfaceMetric, accessed on 29 June 2025) and Node.js (v23.11.0) (
https://github.com/yudeep-rajbhandari/NodeJSCWEE, accessed on 29 June 2025). We performed four different experiments with different types of projects. In each experiment, we compare two projects with varying attributes. Each experiment was performed five times, and the results—including both score and time—were averaged to ensure consistency and reliability.
More details about the experiments are described in the subsequent sections.
4.1. Hypotheses
- 1.
When comparing two projects, the one with substantially less code exhibiting CWE-related vulnerabilities will exhibit a lower attack surface score.
- 2.
Projects with fewer lines of code will require less time for analysis.
- 3.
The attack surface score should correlate with the project’s technical debt as measured by SonarQube [
18].
4.2. Experiment 1
Two repositories, PR1 and PR2, were generated with nearly identical code size (LOC). PR1 contains code deliberately seeded with CWEs, while PR2 is derived from PR1 by remediating those vulnerabilities. PR1 includes 14 unique CWE instances, whereas PR2 retains only 2.
The goal of this experiment is to verify that our analysis tool produces higher attack surface scores for the more vulnerable codebase.
Configuration and Results
The CWE distributions for PR1 and PR2 are listed in
Table 9.
Table 10 provides a comparative overview of PR1 and PR2, including lines of code (LOC), technical debt, average analysis times, and normalized attack surface scores.
Although PR1 contains seven times more CWE instances than PR2, suggesting a similar factor in score difference, the exact ratio is moderated by the individual damage potential and effort values for each issue.
4.3. Experiment 2
We compared two substantially different codebases: Apache IoTDB (
https://github.com/apache/iotdb.git, accessed on 29 June 2025), referred to as PR3, which contains approximately 356,000 lines of code, and Jsoup (
https://github.com/jhy/jsoup, accessed on 29 June 2025), referred to as PR4, with around 14,000 lines. This experiment evaluates how analysis time scales with project size.
Configuration and Results
Table 11 provides a consolidated comparison of PR3 and PR4, including lines of code (LOC), measured technical debt (expressed as analysis duration), average analysis runtimes, and normalized attack surface scores.
As expected, the larger codebase PR3 requires significantly more processing time than the smaller one PR4. This aligns with the fact that PR3 exhibits over 340 detected issues, compared to only 15 in PR4, driving longer analysis durations.
4.4. Experiment 3
In this experiment, we compared two codebases of similar size: one seeded with CWEs drawn from the MITRE Top 20 list, referred to as PR5, and the other containing an equivalent number of CWEs not featured in that list, referred to as PR6. The objective is to determine whether CWEs ranked among the top 20 exhibit a larger attack surface under our methodology.
Configuration and Results
Table 12 lists the CWEs included in PR5 and PR6.
Table 13 provides a comparative summary of PR5 and PR6, including lines of code (LOC), analysis durations (as a measure of technical debt), average execution times, and normalized attack surface scores.
Contrary to expectations, the codebase containing MITRE top-20 CWEs (PR5) yielded a lower attack surface score than the non-top-20 codebase (PR6). This highlights a key distinction between our scoring method and MITRE’s ranking, which is based on aggregated prevalence and average exploit severity across a broad range of real-world systems [
4]. Our approach, by contrast, is context-sensitive, prioritizing the top five semantically relevant CVEs per CWE and incorporating exploit effort into the scoring.
Several factors explain this divergence. First, top-20 CWEs such as SQL Injection (CWE-89) or XSS (CWE-79) may be absent in backend or CLI projects, reducing their practical relevance. Second, our model down-weights high-impact CWEs when their associated CVEs require high effort to exploit, such as requiring authentication or physical access. Finally, limitations in CVE coverage for some CWEs may result in lower scores despite theoretical severity.
4.5. Experiment 4
In this experiment, we compare two well-known, vulnerable Java libraries: Log4j (
https://github.com/qos-ch/slf4j, accessed on 29 June 2025) (PR7) and Jadx (
https://github.com/skylot/jadx, accessed on 29 June 2025) (PR8). Our aim is to evaluate how our attack surface metric rates two real-world libraries with differing vulnerability profiles.
Configuration and Results
Table 14 provides a consolidated view of PR7 and PR8, including their code size (LOC), technical debt (measured as analysis duration), average execution times, and normalized attack surface scores.
Based on our scoring method, Log4j and Jadx exhibit nearly equivalent attack surfaces. This aligns with the fact that Log4j vulnerabilities average a CVSS3 score of 7.2 compared to 6.53 for Jadx, indicating comparable risk levels and consistent results from our algorithm.
5. Comparison and Analysis
Traditional approaches to estimating a software system’s attack surface often rely on indirect proxies such as codebase size (LOC) [
23], technical debt [
24], or raw vulnerability counts [
25]. While these metrics are readily available and widely used in practice, they do not necessarily provide an accurate measure of a system’s true exploitability or security exposure. This is because they treat all parts of the codebase—and all issues—as equally important, without accounting for the impact or accessibility of individual vulnerabilities.
For instance, codebase size may grow due to internal logic, tests, or backend services that are not externally exposed, thereby contributing little to the system’s actual attack surface. Similarly, technical debt often reflects maintainability or design complexity rather than exploitable security flaws. Many static analyzers calculate debt based on estimated time to fix code smells or violations of coding standards, which do not directly correlate with vulnerability severity. Likewise, raw issue counts fail to distinguish between informational warnings and critical security flaws, potentially misleading stakeholders about the true risk profile of the system.
In contrast, our method integrates structured vulnerability intelligence from CWE and CVE databases, enabling a more nuanced measurement that weighs each identified weakness by both its damage potential and the effort required for exploitation. By empirically testing our score across a range of projects and comparing it with these traditional metrics, we demonstrate the limitations of relying solely on LOC, debt, or issue volume as indicators of security risk.
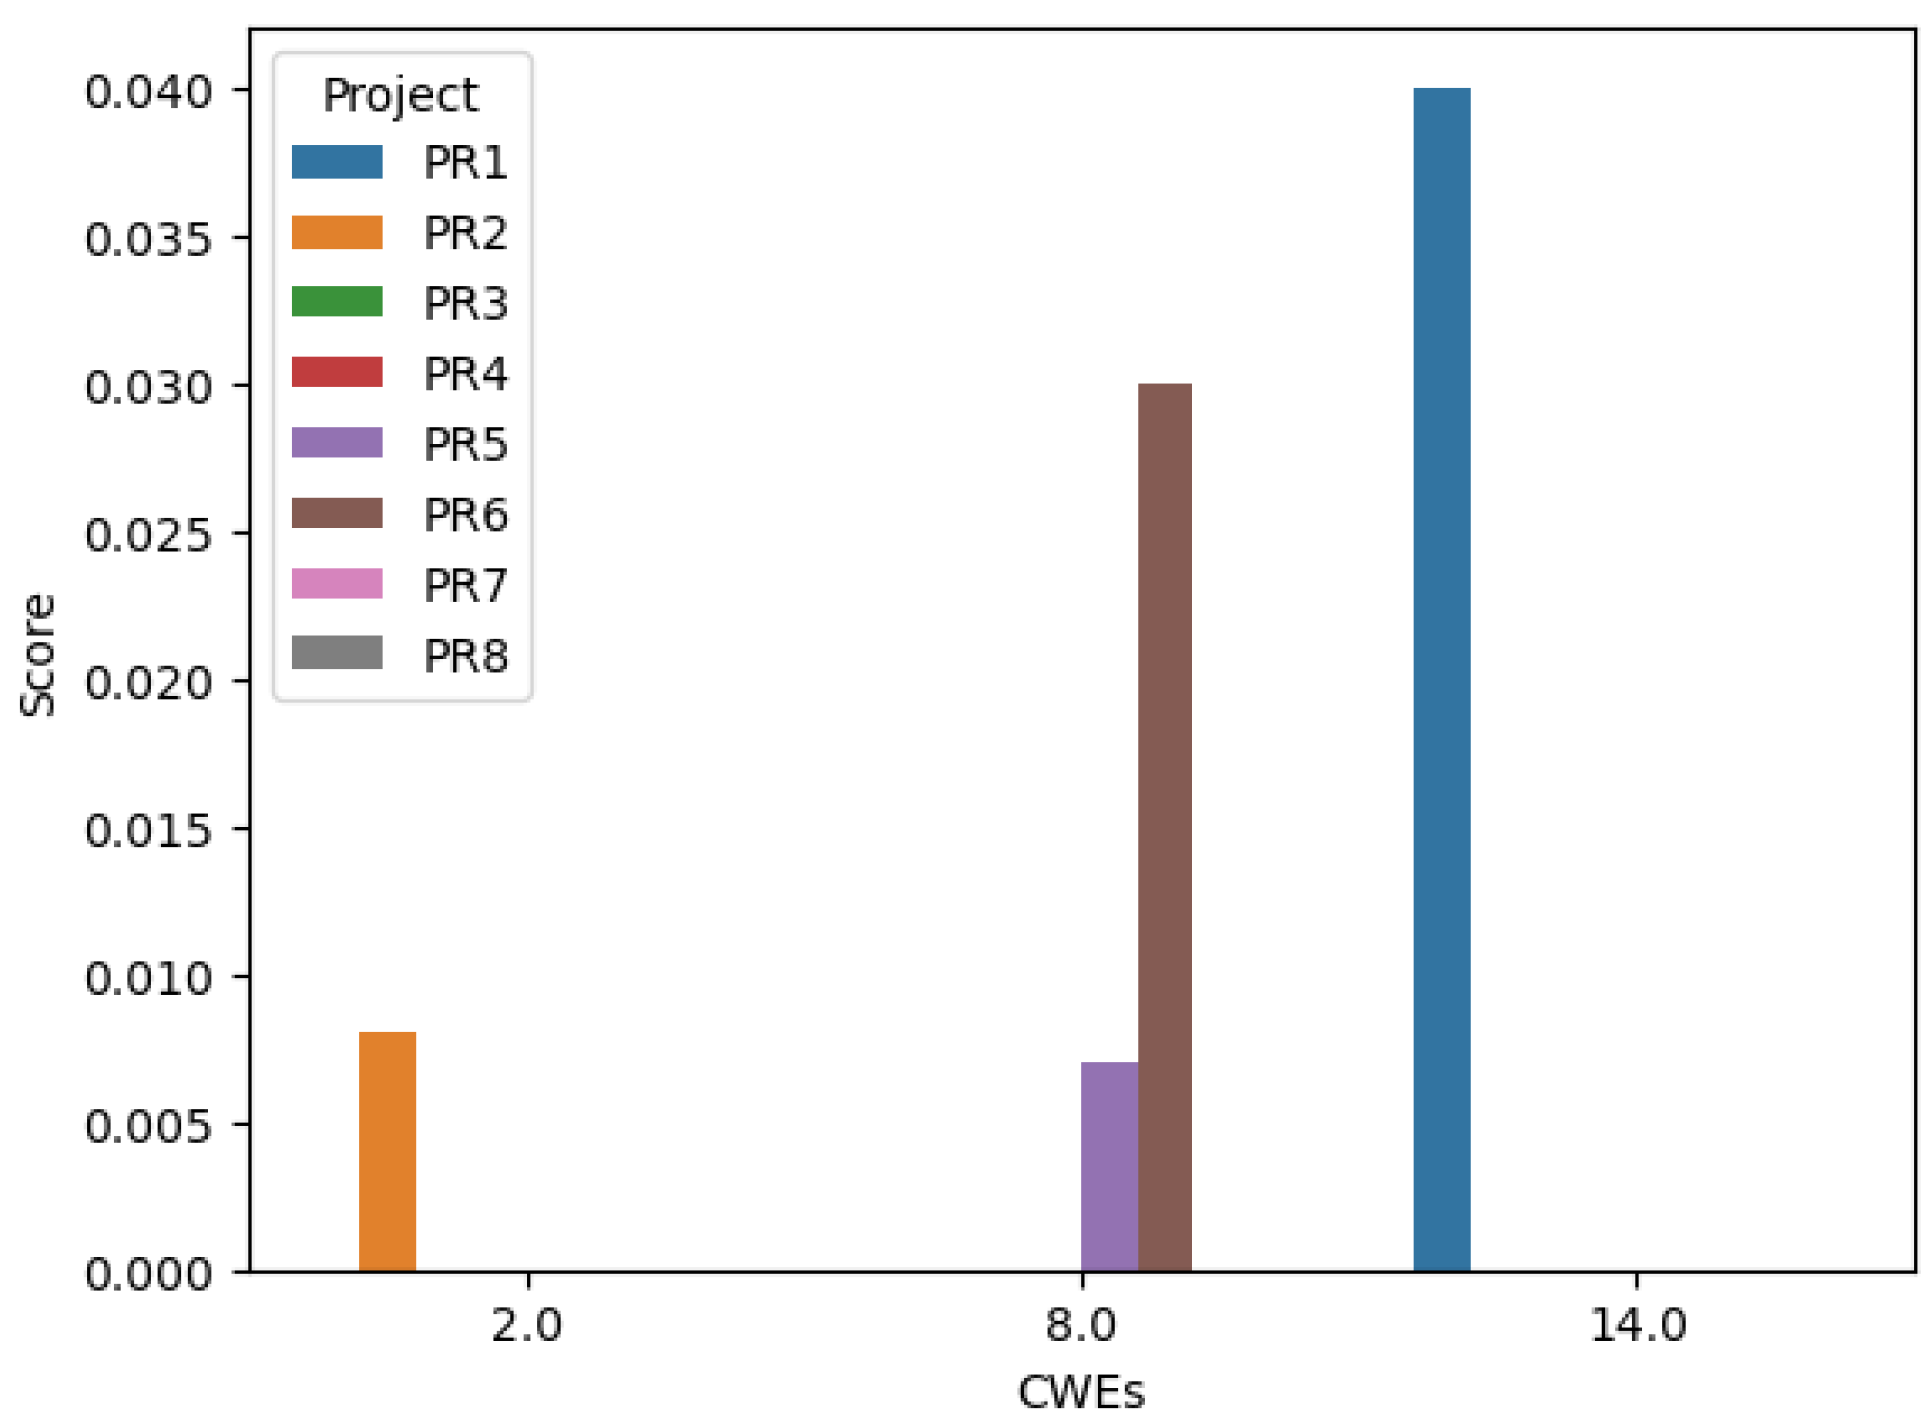
5.1. Hypothesis 1
If two projects are compared and one contains substantially fewer vulnerable code segments than the other, it should yield a lower attack surface score as shown in
Figure 2.
Our experiments with the four custom test projects support this hypothesis: as we increased the number of injected CWEs, the calculated attack surface score rose correspondingly. Although we have not yet validated this trend on externally sourced repositories from GitHub, the results from our controlled cases indicate that the hypothesis holds for our custom scenarios.
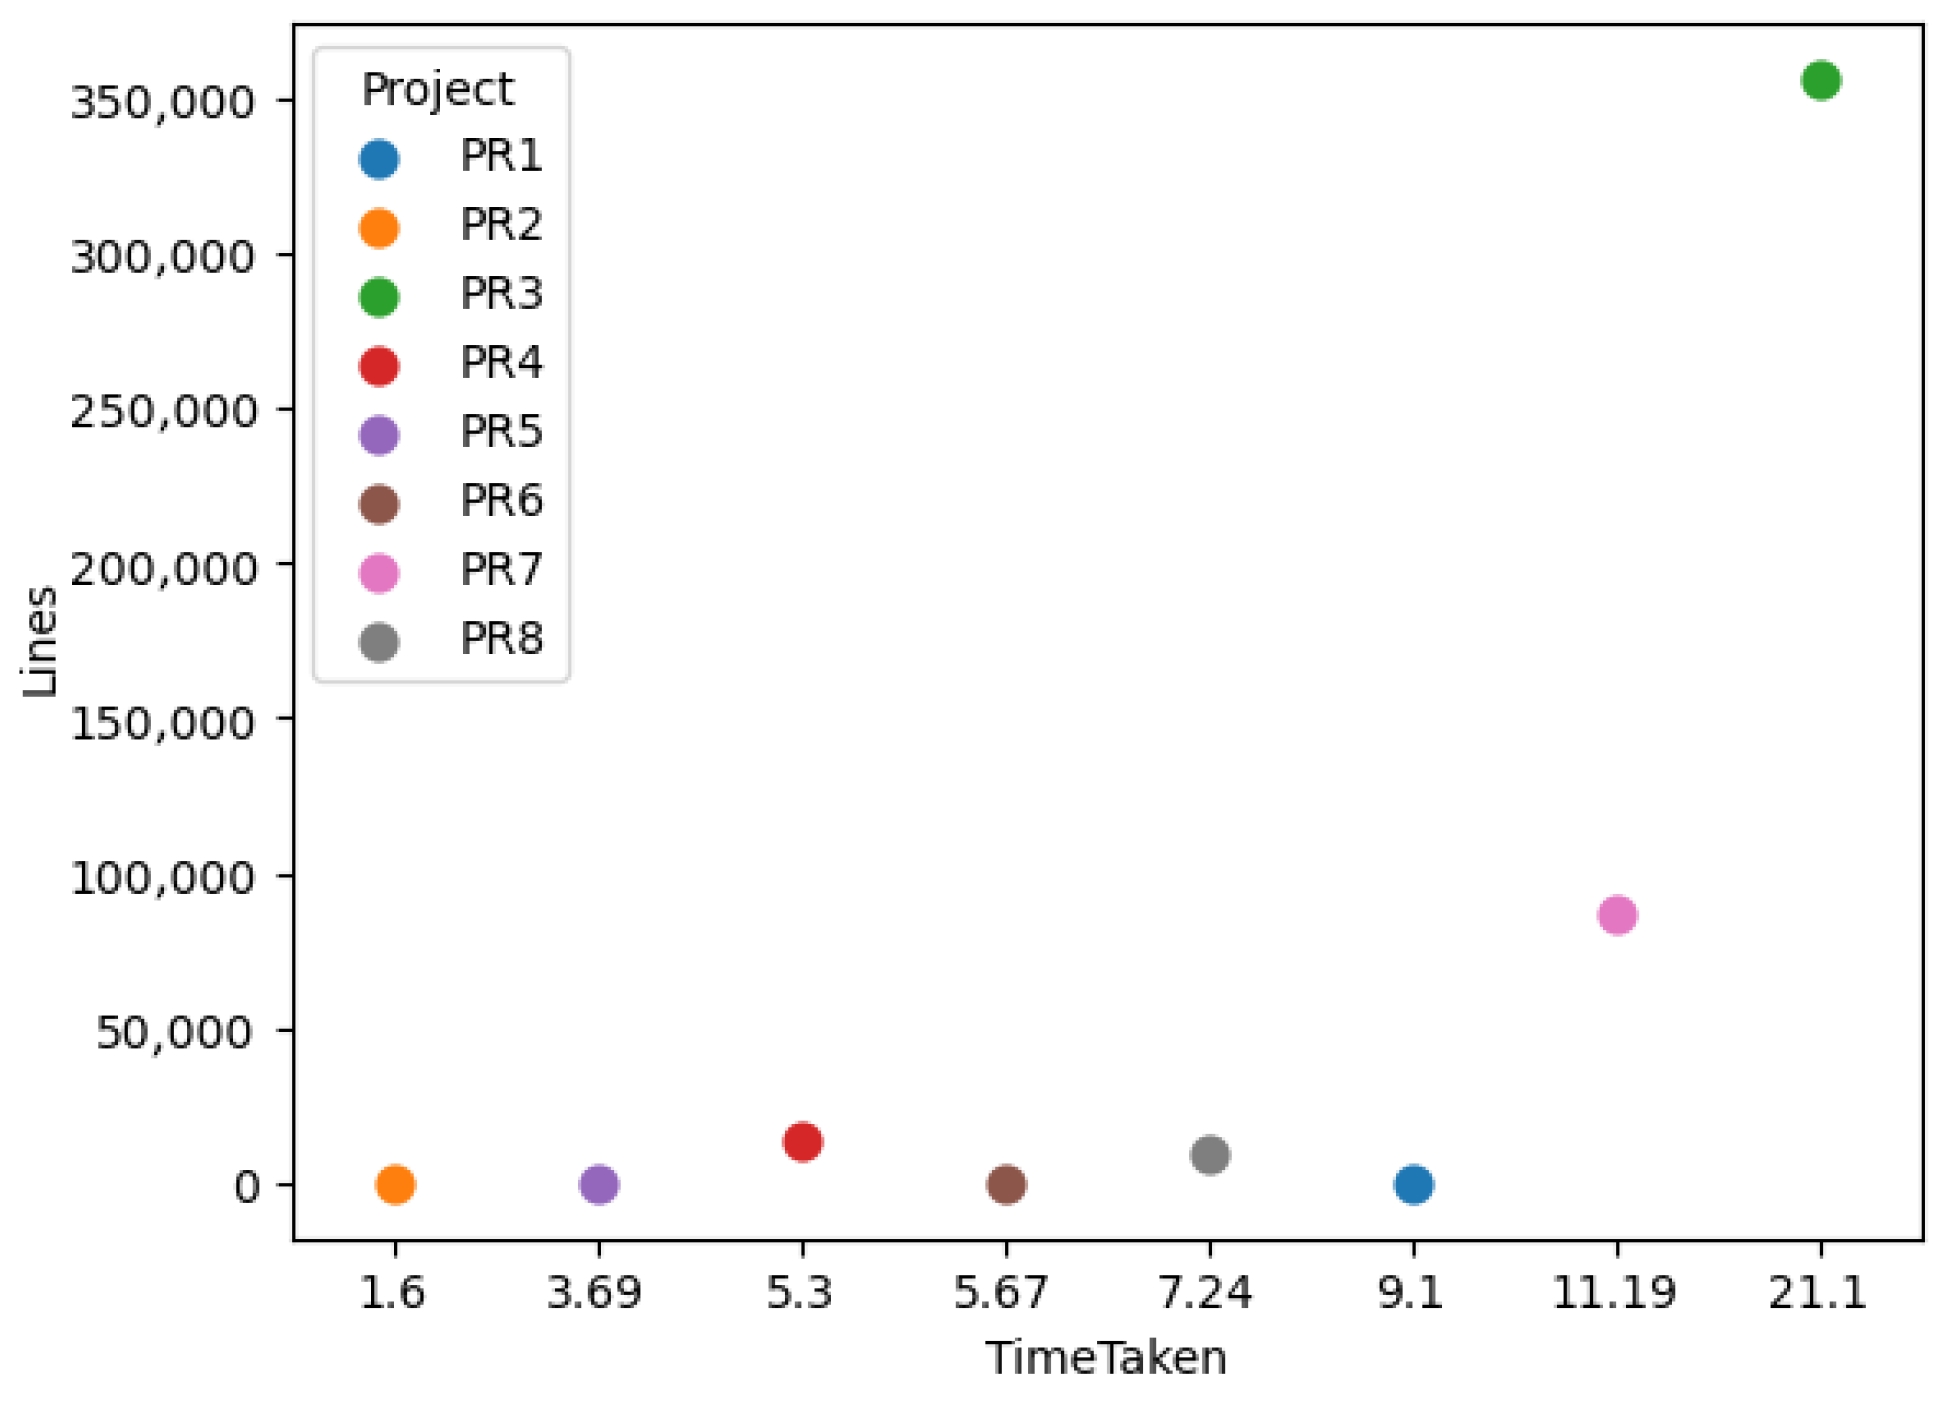
5.2. Hypothesis 2
Analysis time should decrease for projects with fewer lines of code.
While small projects with very low LOC counts exhibited some variability in runtime, overall we observed that as project size increases, analysis time tends to grow in proportion to the number of lines, as shown in
Figure 3.
Our results show that a larger codebase does not necessarily imply a larger attack surface score. For instance, Project PR3, with approximately 356,000 lines of code, yielded a moderate score of 0.021, whereas the much smaller PR1 (250 LOC) produced the highest score of 0.04 in some experiments. This demonstrates that our metric successfully moves beyond simple “bug counting” or equating code volume with risk. The AttackSurfaceScore is sensitive to the severity and exploitability of the vulnerabilities present, not the sheer size of the application. It correctly identifies that a small amount of highly critical, easily exploitable code can pose a significantly greater security risk than a massive codebase with only minor, difficult-to-exploit flaws. This distinction is fundamental to a meaningful security assessment.
5.3. Hypothesis 3
We also expected a positive correlation between the attack surface score and the project’s technical debt as measured by Sonar.
However, our results do not support this as show in
Figure 4: there is no clear relationship between higher scores and greater technical debt. Despite anticipating that projects with more vulnerabilities (and thus higher scores) would exhibit increased remediation effort, the data did not reflect this trend.
This is because “technical debt” and “security risk” are related but distinct concepts. As defined by SonarQube, technical debt often quantifies the remediation cost or effort to fix all code quality issues, which includes non-security-related “code smells,” maintainability problems, and violations of coding conventions.
Our AttackSurfaceScore, however, is specifically engineered to measure security risk by incorporating the Damage-Potential-to-Effort ratio. It prioritizes vulnerabilities based on their potential impact and the effort required for an attacker to exploit them. A project could have high technical debt due to complex, hard-to-maintain logic that is otherwise secure. Conversely, a project could have low technical debt but contain a single, critical vulnerability, such as a hardcoded password, that is easy to fix but presents a significant security risk.
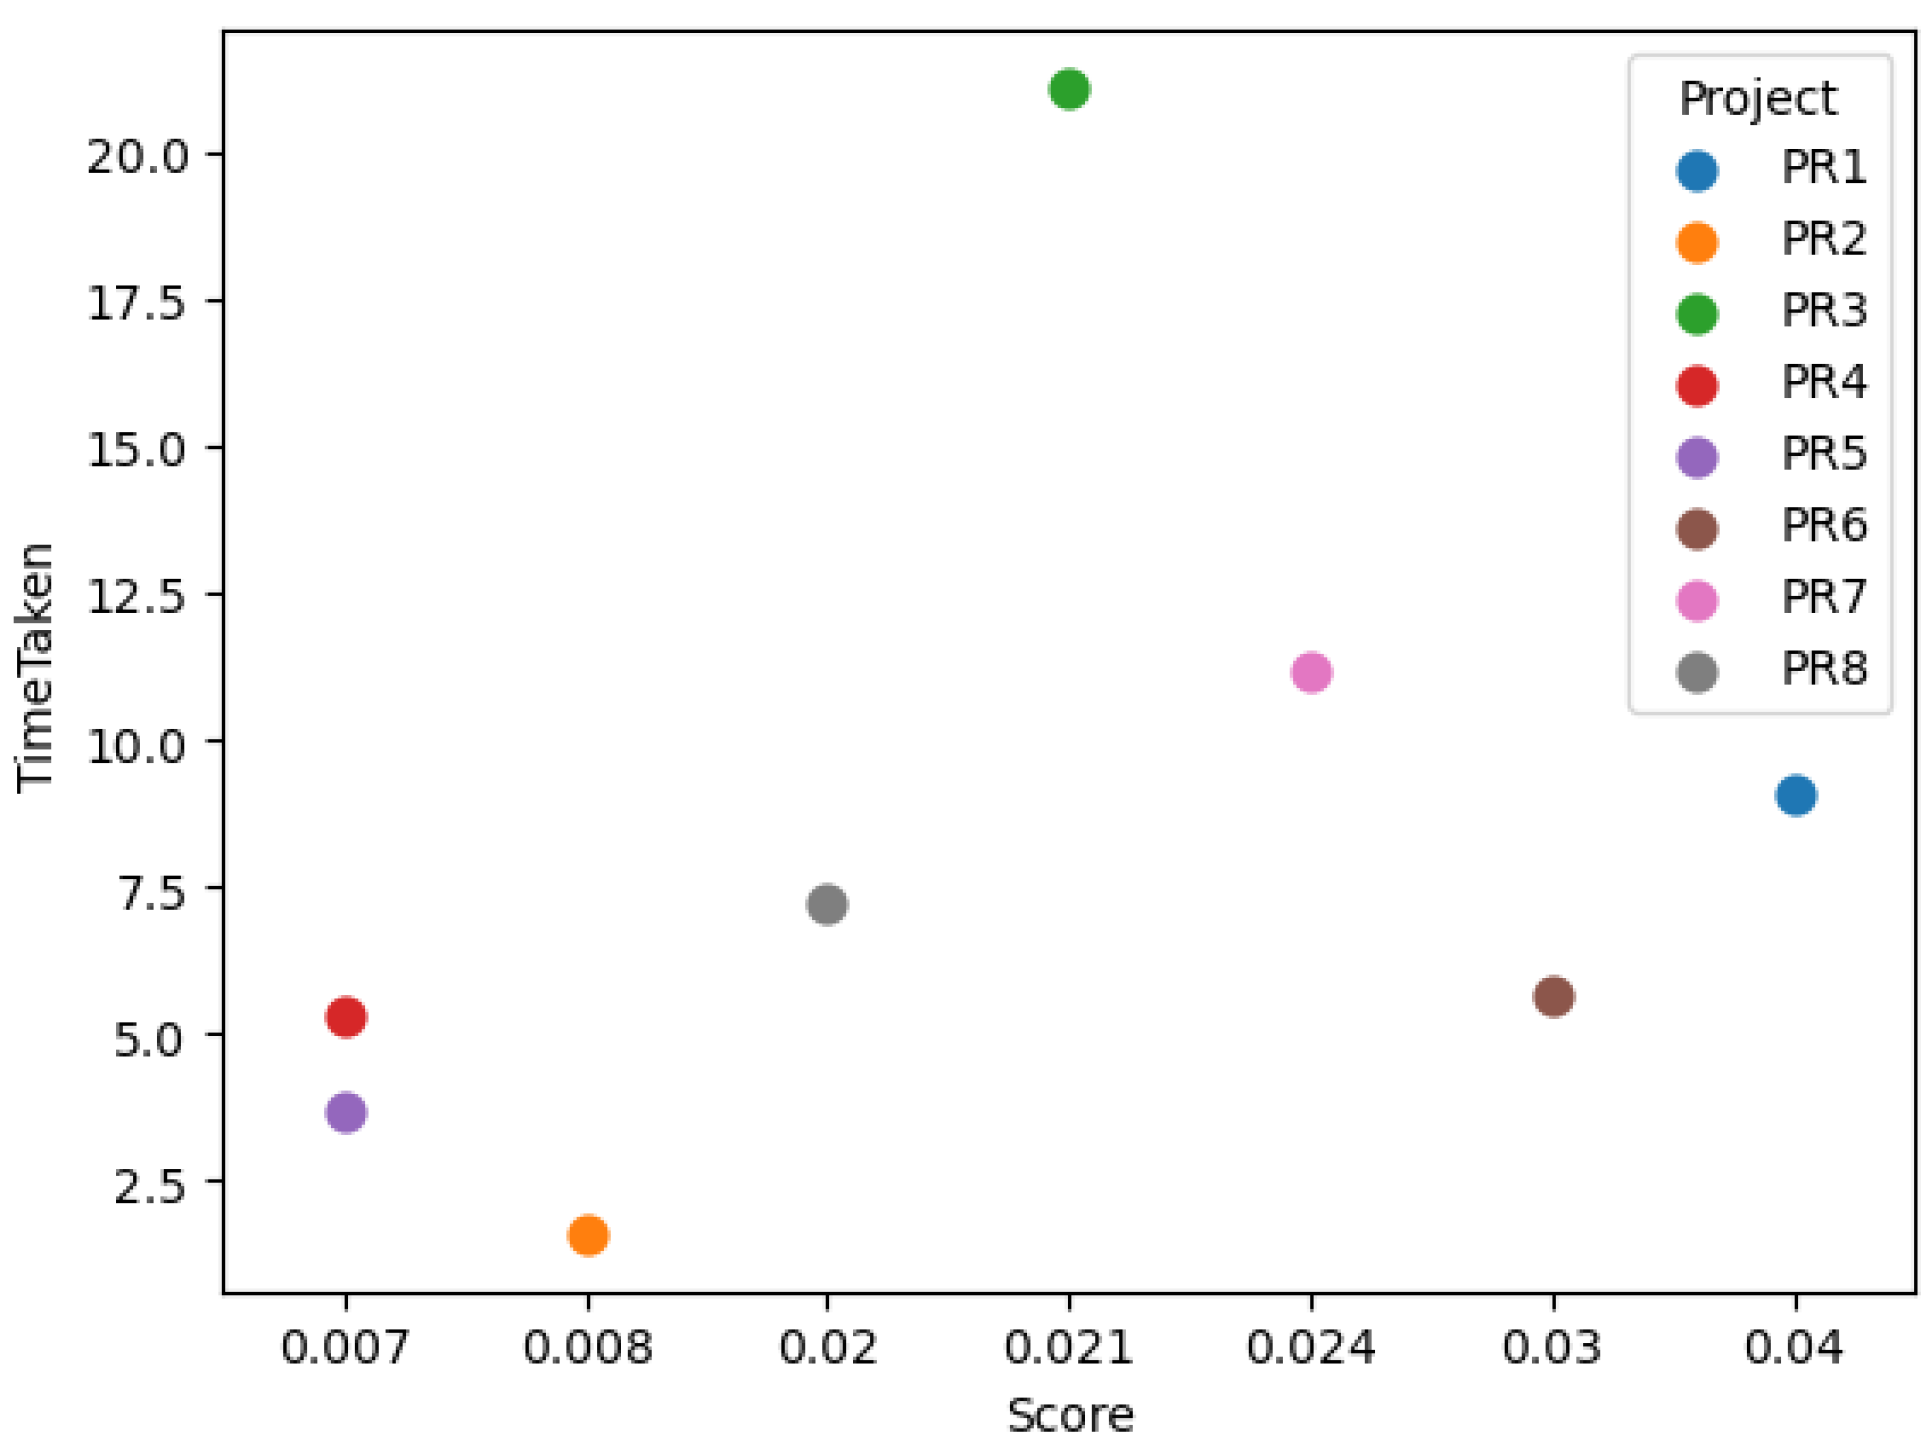
5.4. Other Analysis
From the two plots shown in
Figure 5 and
Figure 6, it is clear that the attack surface score does not correlate with either analysis time or LOC. For example, PR3 has a very large codebase but only a moderate score, while PR1—despite its relatively small size—yields the highest score among PR1, PR3, and PR7.
6. Limitations and Future Work
While our approach currently utilizes a single static analysis tool, this decision was made to establish a consistent and controlled baseline. We recognize the potential benefits of leveraging multiple tools to improve coverage and reduce analysis variance. In future iterations, we aim to enhance robustness by integrating an additional analyzer such as PMD, a flexible, multi-language static analysis tool that is compatible with SonarQube via existing plugins. Furthermore, prior research by Siavvas et al. [
26] has demonstrated promising mappings between SonarSource rules and PMD, which we plan to build upon.
Another promising direction is refining our metric weight assignments to support a broader range of security objectives. For example, in our current design, we prioritize execution access in our damage potential scoring. However, in confidentiality-focused systems, read operations may carry higher risk. To address this, we envision a flexible configuration mechanism that allows metric tuning based on the specific security context or organizational priorities.
Our approach supports reweighting of impact types, enabling adaptation to different security priorities. Future work can explore domain-specific tuning, such as emphasizing availability for cloud platforms or confidentiality for healthcare systems.
Our current implementation retrieves CVE exploitability metrics via real-time API calls to the OPENCVE service, providing up-to-date data but introducing a major performance bottleneck, especially for large or repeated analyses. To address this, a promising future enhancement is the introduction of a local caching mechanism, where CVE data are stored after initial retrieval and reused in subsequent runs. This would reduce latency, lower dependency on external services, and improve performance and reliability—key for integration into CI/CD security pipelines.
Our use of CVE-derived exploitability metrics offers a practical proxy for real-world vulnerability severity. While CVEs are often tailored to specific applications, our averaging approach aims to generalize these insights. Future work includes a more comprehensive analysis of cross-CVE patterns to validate the consistency of access vectors and complexity metrics across different systems and domains.
Overall, these planned enhancements aim to further improve the adaptability, precision, and relevance of our method across a wide range of software systems.
7. Conclusions
We present a generic, easy-to-use attack surface scoring application that delivers a comprehensive risk metric with minimal configuration. Our three-phase workflow—scanning, mapping, and scoring leverages mature static analyzers like Sonar to detect issues and automatically associate them with their corresponding CWEs. By grounding our scoring model in MITRE’s authoritative CVE and CWE datasets, this tool provides developers and security teams with a reliable measure of exposure that can be applied immediately across diverse projects. We used Manadhata et al.’s Damage-Potential-to-Effort ratio approach as the foundation for our score. Through extensive experimentation on projects of varying size and complexity, we verified the accuracy and reliability of our scoring system. Applications with fewer vulnerable code segments consistently received lower attack surface scores, and analysis time decreased with reduced code size. These results confirm that our application successfully calculates a meaningful metric that reflects vulnerability presence and overall risk—providing developers and security teams with a practical, interpretable measure of application exposure.
Author Contributions
Conceptualization, Y.R.; methodology, Y.R.; software, Y.R.; validation, Y.R., R.M., S.S. and T.C.; formal analysis, Y.R. and R.M.; investigation, Y.R. and R.M.; resources, Y.R., R.M., S.S. and T.C.; data curation, Y.R.; writing—original draft preparation, Y.R. and R.M.; writing—review and editing, Y.R., R.M., S.S. and T.C.; visualization, Y.R., R.M., S.S. and T.C.; supervision, Y.R. and T.C.; project administration, T.C.; funding acquisition, T.C. All authors have read and agreed to the published version of the manuscript.
Funding
This research was funded by the National Science Foundation under grant no. 2409933.
Data Availability Statement
Conflicts of Interest
The authors declare no conflicts of interest.
References
- Deylami, H.; Ardekani, I.; Muniyandi, R.; Sarrafzadeh, A. Effects of Software Security on Software Development Life Cycle and Related Security Issues. Int. J. Comput. Intell. Inf. Secur. 2015, 6, 1–9. [Google Scholar]
- Stuckman, J.; Purtilo, J. Comparing and Applying Attack Surface Metrics. In Proceedings of the 4th International Workshop on Security Measurements and Metrics, MetriSec’12, Lund, Sweden, 21 September 2012; pp. 3–6. [Google Scholar] [CrossRef]
- Manadhata, P.; Wing, J. An Attack Surface Metric. IEEE Trans. Softw. Eng. 2011, 37, 371–386. [Google Scholar] [CrossRef]
- Common Weakness Enumeration. Available online: https://cwe.mitre.org/ (accessed on 29 June 2025).
- Moshtari, S.; Okutan, A.; Mirakhorli, M. A Grounded Theory Based Approach to Characterize Software Attack Surfaces. arXiv 2021, arXiv:2112.01635. [Google Scholar]
- Zhang, M.; Wang, L.; Jajodia, S.; Singhal, A. Network Attack Surface: Lifting the Concept of Attack Surface to the Network Level for Evaluating Networks’ Resilience Against Zero-Day Attacks. IEEE Trans. Dependable Secur. Comput. 2021, 18, 310–324. [Google Scholar] [CrossRef]
- Atiiq, S.A.; Gehrmann, C.; Dahlén, K.; Khalil, K. From Generalist to Specialist: Exploring CWE-Specific Vulnerability Detection. arXiv 2024, arXiv:2408.02329. [Google Scholar]
- Rahaman, M.S.; Islam, A.; Cerny, T.; Hutton, S. Static-Analysis-Based Solutions to Security Challenges in Cloud-Native Systems: Systematic Mapping Study. Sensors 2023, 23, 1755. [Google Scholar] [CrossRef] [PubMed]
- Xie, P.; Zhang, L.; Lian, Z.; Yang, J. A Network Attack Surface Evaluation Method Based on Optimal Attack Strategy. Electronics 2025, 14, 274. [Google Scholar] [CrossRef]
- Shi, Z.; Matyunin, N.; Graffi, K.; Starobinski, D. Uncovering CWE-CVE-CPE Relations with Threat Knowledge Graphs. ACM Trans. Priv. Secur. 2024, 27. [Google Scholar] [CrossRef]
- Shihab, A.; Alanezi, M. Tailoring Static Code Analysis for Top 25 CWE in Python. Al-Noor J. Inf. Technol. Cyber Secur. 2024, 1, 113–138. [Google Scholar] [CrossRef]
- Nourin, S.M.; Karabatis, G.; Argiropoulos, F.C.; Measuring Software Security Using Improved CWE Base Scores. Proceedings of the CIKM 2021 Workshops, Gold Coast, QLD, Australia, 1–5 November 2021. Available online: http://ceur-ws.org/Vol-3052/paper16.pdf (accessed on 29 June 2025).
- Das, S.S.; Serra, E.; Halappanavar, M.; Pothen, A.; Al-Shaer, E. V2W-BERT: A Framework for Effective Hierarchical Multiclass Classification of Software Vulnerabilities. arXiv 2021, arXiv:2102.11498. [Google Scholar]
- Fu, M.; Tantithamthavorn, C. LineVul: A Transformer-based Line-Level Vulnerability Prediction. In Proceedings of the 2022 IEEE/ACM 19th International Conference on Mining Software Repositories (MSR), Pittsburgh, PA, USA, 23–24 May 2022; pp. 608–620. [Google Scholar] [CrossRef]
- Zhou, Y.; Liu, S.; Siow, J.; Du, X.; Liu, Y. Devign: Effective vulnerability identification by learning comprehensive program semantics via graph neural networks. In Advances in Neural Information Processing Systems 32 (NeurIPS 2019); Curran Associates Inc.: Red Hook, NY, USA, 2019. [Google Scholar]
- Stefanović, D.; Nikolić, D.; Dakic, D.; Spasojević, I.; Ristic, S. Static Code Analysis Tools: A Systematic Literature Review. In Proceedings of the 31st DAAAM International Symposium; DAAAM International: Vienna, Austria, 2020; Volume 31, pp. 565–573. [Google Scholar] [CrossRef]
- Campbell, G.A.; Papapetrou, P.P. Sonarqube in Action; Manning: Shelter Island, NY, USA, 2014. [Google Scholar]
- Rules Overview. Available online: https://docs.sonarqube.org/latest/user-guide/rules/ (accessed on 29 June 2025).
- Li, Z.; Avgeriou, P.; Liang, P. A systematic mapping study on technical debt and its management. J. Syst. Softw. 2015, 101, 193–220. [Google Scholar] [CrossRef]
- Nord, R.L.; Ozkaya, I. Software Vulnerabilities, Defects, and Design Flaws: A Technical Debt Perspective. In Proceedings of the 2016 IEEE Cybersecurity Development (SecDev), Boston, MA, USA, 3–4 November 2016; p. 165. [Google Scholar] [CrossRef]
- DB, K. CVE and CWE Mapping Dataset (2021). Available online: https://www.kaggle.com/datasets/krooz0/cve-and-cwe-mapping-dataset (accessed on 29 June 2025).
- Du, Y.; Lu, Y. A Weakness Relevance Evaluation Method Based on PageRank. In Proceedings of the 2019 IEEE Fourth International Conference on Data Science in Cyberspace (DSC), Hangzhou, China, 23–25 June 2019; pp. 422–427. [Google Scholar] [CrossRef]
- Shin, Y.; Williams, L. Evaluating complexity, code churn, and developer activity metrics as indicators of software vulnerabilities. In Proceedings of the Second ACM-IEEE International Symposium on Empirical Software Engineering and Measurement, Kaiserslautern, Germany, 9–10 October 2008; pp. 69–78. [Google Scholar]
- Tom, E.; Aurum, A.; Vidgen, R. Technical debt in practice: How tools support refactoring. IEEE Softw. 2013, 29, 44–51. [Google Scholar]
- Zimmermann, T.; Premraj, R.; Bettenburg, N.; Just, R.; Schröter, A.; Weiss, C. What makes a good bug report? IEEE Trans. Softw. Eng. 2010, 36, 618–643. [Google Scholar] [CrossRef]
- Siavvas, M. Static Analysis for Facilitating Secure and Reliable Software. Ph.D. Thesis, Imperial College London, London, UK, 2019. [Google Scholar] [CrossRef]
| Disclaimer/Publisher’s Note: The statements, opinions and data contained in all publications are solely those of the individual author(s) and contributor(s) and not of MDPI and/or the editor(s). MDPI and/or the editor(s) disclaim responsibility for any injury to people or property resulting from any ideas, methods, instructions or products referred to in the content. |
© 2025 by the authors. Licensee MDPI, Basel, Switzerland. This article is an open access article distributed under the terms and conditions of the Creative Commons Attribution (CC BY) license (https://creativecommons.org/licenses/by/4.0/).


