
Measurement of the Functional Size of Web Analytics Implementation: A COSMIC-Based Case Study Using Machine Learning


Abstract
1. Introduction
- Standard implementation is performed by adding JavaScript snippet code to a website to track basic metrics such as pageviews. This is often insufficient for decision makers, as they typically measure only basic metrics, such as pageviews, number of users, sessions, and events.
- To fully leverage Google Analytics and derive actionable insights, web analytics practitioners must go beyond standard implementation and customize the setup for specific functional requirements.
2. Background
2.1. Technical Fundamentals of Web Analytics
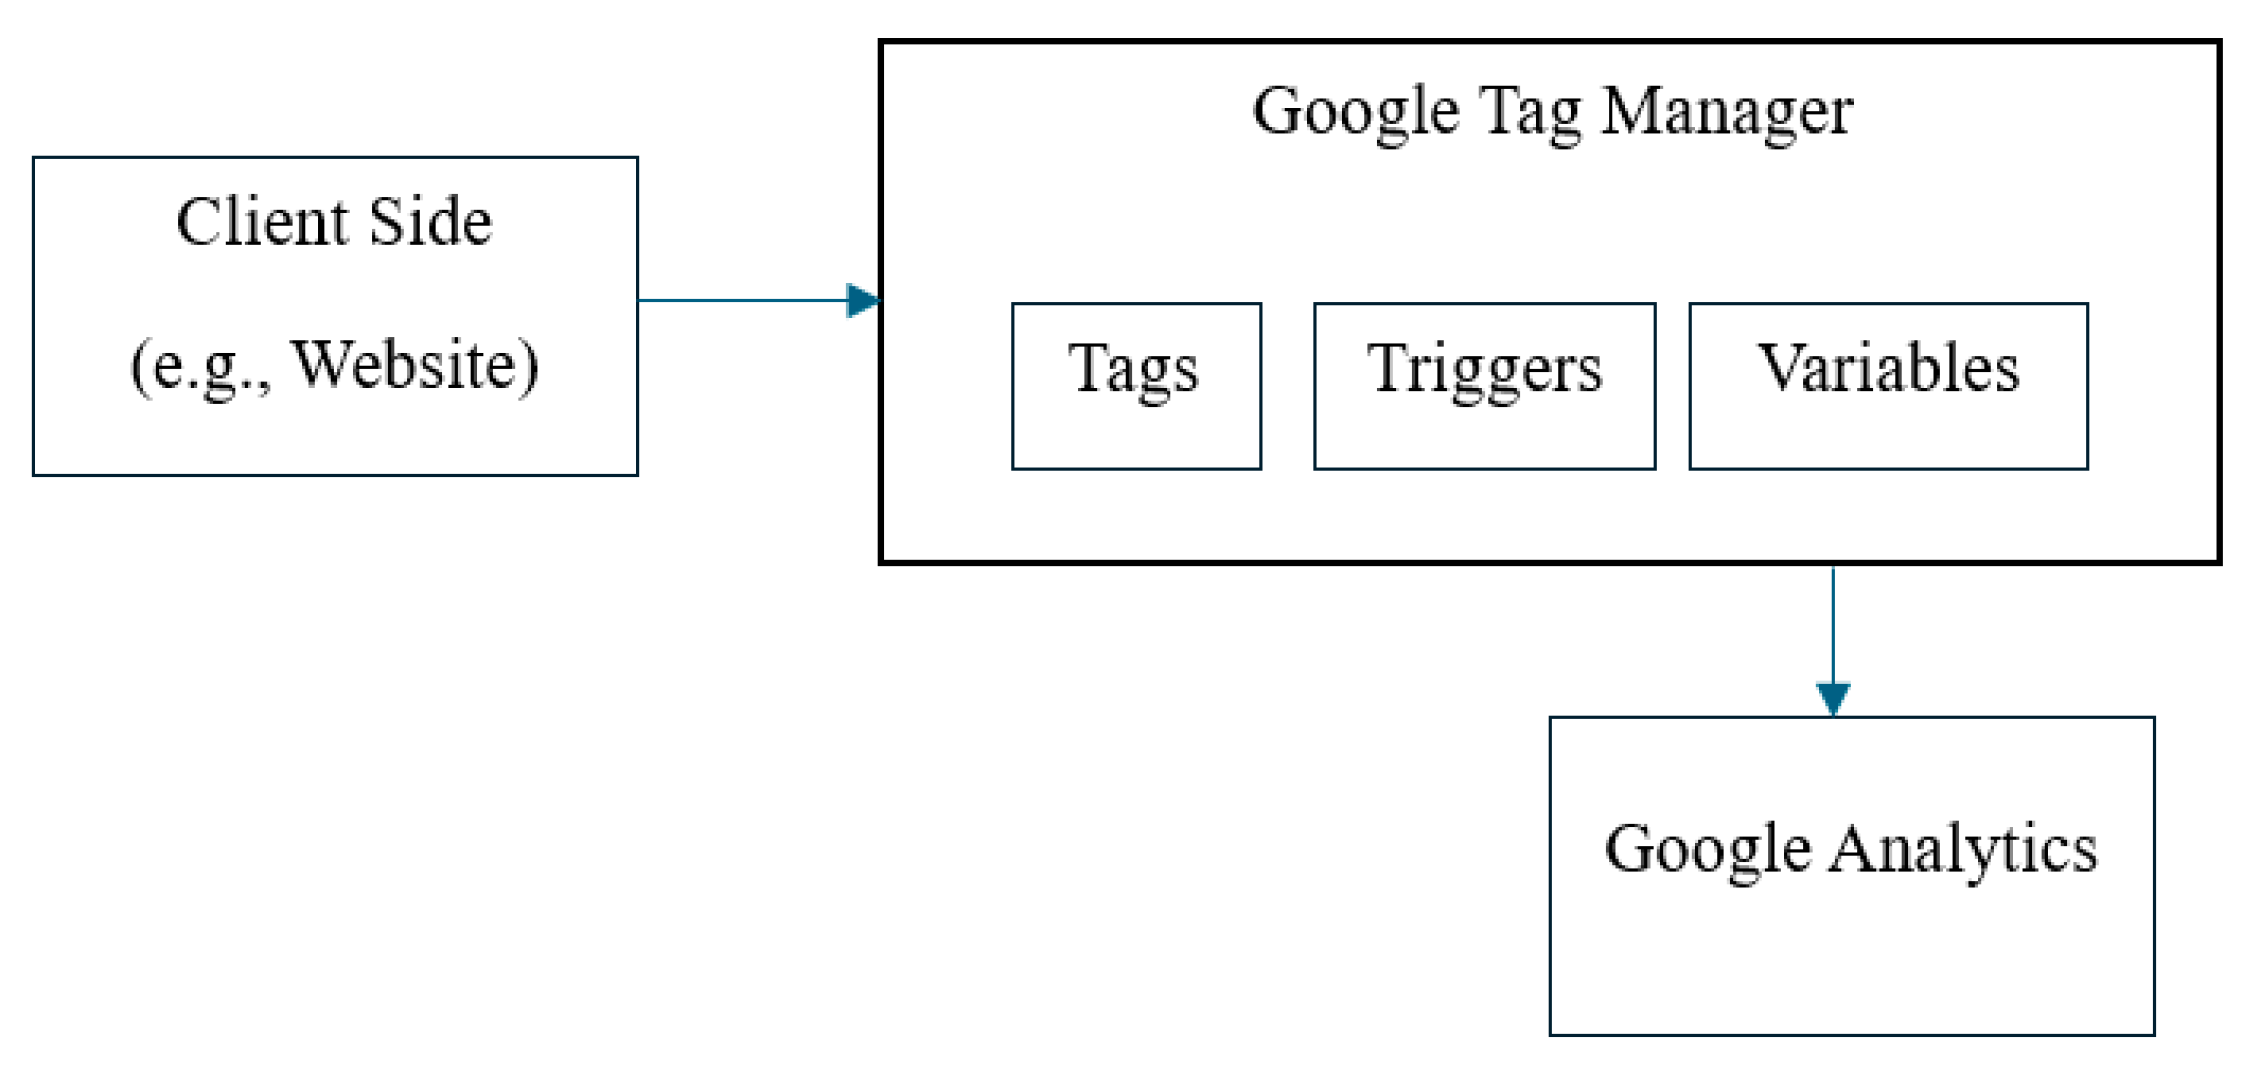
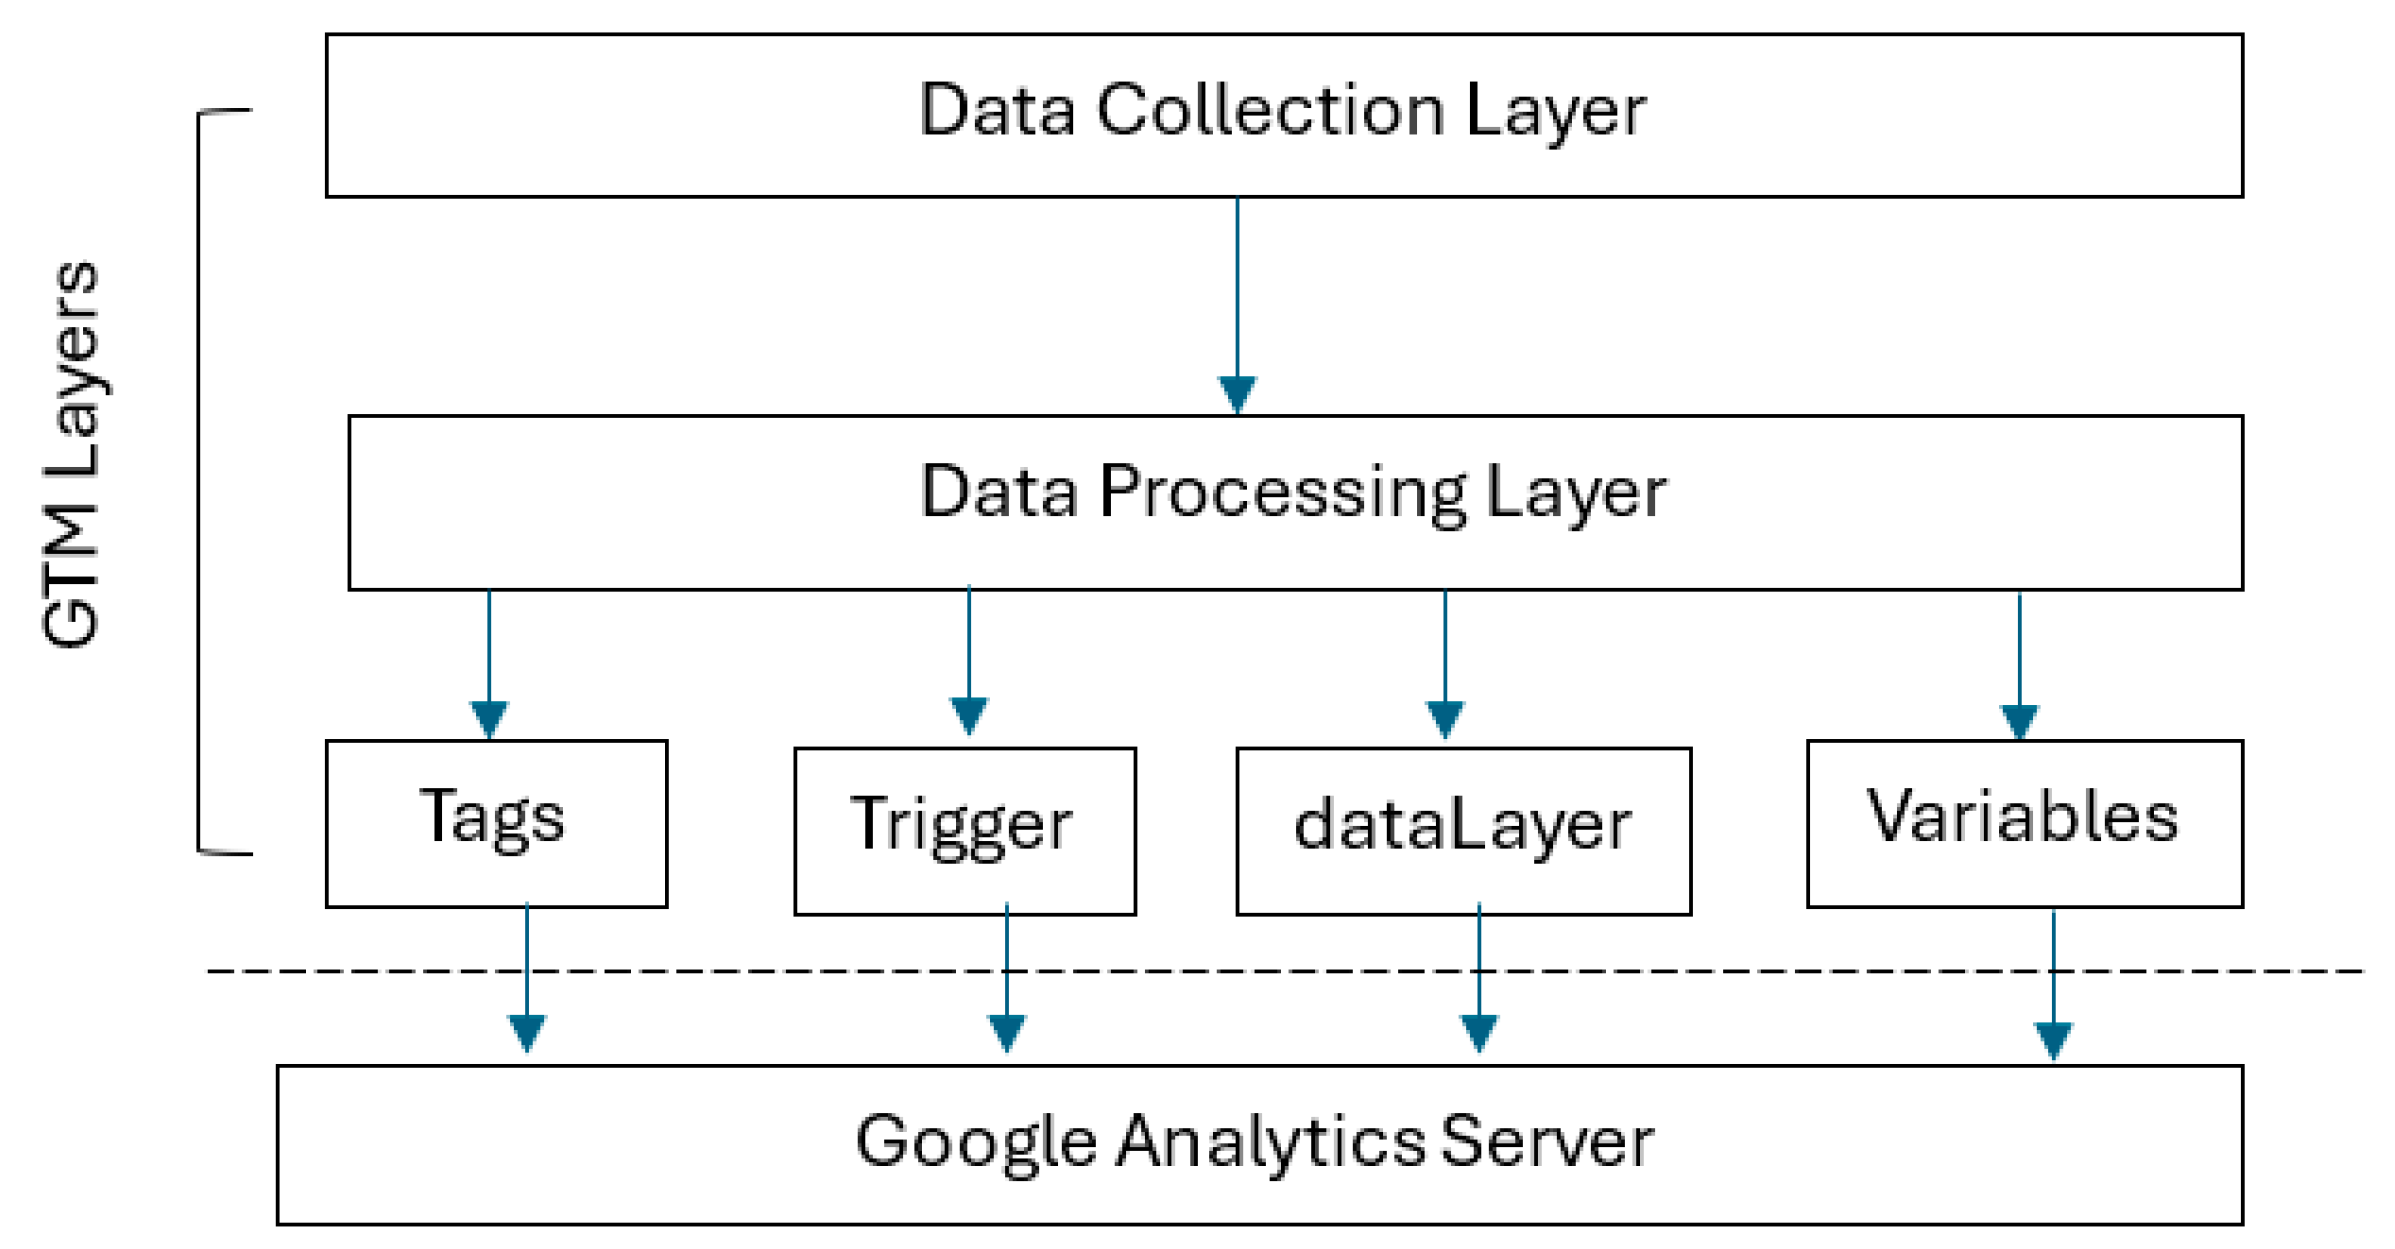
- Client Side (Website): User interactions (e.g., page views, clicks, and other actions) on the website generate data. These data are passed to the dataLayer, which is an array that organizes and manages data before sending them to other systems.
- Google Tag Manager (GTM): This acts as an intermediate system that collects data from the website through the dataLayer and sends the data to analytics systems such as Google Analytics and other third-party analytics systems.
- Tags, Triggers, and Variables: Tags are snippets of the JavaScript code that GTM fires based on certain events or conditions to send data to analytics platforms, known as triggers. Triggers define when and under what conditions tags should fire (e.g., a page view or specific user action such as a click). The variables store dynamic data that collects custom information (e.g., user click details) and can be retrieved by tags and triggers.
2.2. Recent Studies on Web Size Metrics and Effort Estimation
- The authors in [7] posit that COSMIC surpassed IFPUG Function Points (ISO 20926) in providing significantly better estimations when combined with Simple Linear Regression (SLR) and Case-Based Reasoning (CBR) as estimation techniques.
- The authors in [16] investigated the effectiveness of IFPUG Function Points (FPAs) and web objects (WOs) in measuring web application size and subsequently web effort estimation. The WO is an extended version of the FPA with four more web-specific components: multimedia files, web building blocks, scripts, and links [25]. The results indicate that the WO was more accurate than the FPA.
- The authors in [17] proposed Web Points to measure the functional size of web applications by adapting FPA and including components such as multimedia files, scripts, links, and web building blocks. The results showed that Web Points could be valuable tools for project management.
- limitations of traditional metrics in these contexts;
- emergence of the usage of FSM in these contexts;
- adaptation and refinements in these contexts to date.

| Application in Web Development | Application in Web Analytics Implementation | |
|---|---|---|
| Limitations of Traditional Metrics | The traditional metrics for estimating web application size, such as the number of web pages, lines of code, and media files, are widely recognized as insufficient for accurately predicting development effort. These fail to account for the functional complexity and variability in web applications, leading to unreliable estimates. This highlights the need for more sophisticated approaches that can better capture the true scope and functionality of web projects. | Web analytics involve complex interactions; data flows and user behavior tracking are not adequately captured by basic counting metrics such as the number of pages, lines of code, or media files; applying similar simplistic metrics to web analytics implementation would likely lead to inaccurate and unreliable assessments. |
| Emergence of Functional Size Measurement (FSM) | The literature demonstrates the emergence of more advanced functional size measurement techniques, particularly using the COSMIC method. COSMIC has been shown to be more adaptable and effective in measuring the functional size of web applications, offering a more reliable basis for estimating development effort. | There is no reported usage yet of COSMIC FSM in the context of web analytics implementation projects. Web analytics implementation should be sized using function-based measurement approaches, similar to how COSMIC is applied to web applications. |
| Adaptation and Refinement of FSM | Researchers have worked on adapting and refining the COSMIC method to specific types of web applications such as the Object-Oriented Hypermedia (OO-H) method or the UML-based Web Engineering (UWE) approach. These adaptations ensure the accurate application of FSM in the unique context of web applications. | Research is needed to explore how to measure web analytics implementations effectively with functional size measurement (FSM) approaches such as COSMIC. |
2.3. Sizing Software with COSMIC—ISO 19761
- Measurement Strategy Phase: The purpose (e.g., estimate the size as an input to a project effort estimation) of the measurement and the scope (e.g., single software application) of the software to be measured are identified.The outcome of this phase is the Software Context Model, which includes components such as functional users (e.g., software or hardware devices), the software being measured, and persistent storage.
- Mapping Phase: This is the process that translates each Functional User Requirement (FUR) into the format required by the COSMIC Generic Model of Software using concepts, such as the following.
- A Triggering Event is the action of a functional user of software that initiates one or more functional processes.
- A Data Group is a distinct, non-empty, and unordered set of data attributes, with each attribute describing a complementary aspect of the same object of interest.
- A Data Attribute is the smallest piece of information within an identified data group that carries meaning from the perspective of a relevant FUR.
As shown in Figure 2, COSMIC data movements are defined as follows:- Entry (E) transfers a data group from a functional user across the boundary into a functional process, where it is needed.
- An Exit (X) transfers a data group from a functional process across the boundary to the functional user that requires it.
- A Read (R) retrieves a data group from persistent storage within a functional process that requires it.
- Write (W) stores a data group from within a functional process into persistent storage.
- Measurement Phase: This involves identifying and counting the data movements within each functional process. Each data movement is counted as one COSMIC Function Point (CFP). Therefore, the total size of software within a defined scope is determined by summing the sizes of all the functional processes included in that scope, as follows:
3. Research Methodology: The Application of COSMIC for the Measurement of Web Analytics Implementation
3.1. Measurement Strategy Phase
- (1)
- Purpose and Scope of FSM for Google Analytics Implementation
- Estimate the effort required to implement, maintain, or extend a Google Analytics setup, particularly in terms of tracking user interactions (e.g., page views and button clicks) and event-based data collection.
- Estimate Resources and Costs: Estimate the resources, time, and costs associated with deploying and managing analytics tags, triggers, and variables on a website or application.
- Provide Benchmarking for Optimization: benchmark different implementations (e.g., different websites) for optimization and improve analytics accuracy and efficiency.
- Software Being Measured: The software being measured is Google Tag Manager (GTM) and consists of the following components:
- Tags: These are code snippets or tracking scripts that collect data and send them to various platforms (e.g., Google Analytics). Tags are essential components of GTM that define what data are collected and where they are sent. However, they do not constitute a functional process in the COSMIC context. Instead, tags are invoked (i.e., fired) as part of a functional process when certain conditions are met, such as user interactions including button clicks or page views.
- Triggers: These conditions specify when a tag is fired. For example, a trigger can specify that a tag should fire when a user clicks a button or visits a page. Triggers are also considered components of GTM, as they define the conditions under which functional processes are activated (e.g., user interactions such as button clicks or page views).
- Persistent Storage: Persistent storage in GTM in the COSMIC sense is defined as follows:
- dataLayer: This is a structured JavaScript object that holds information on user interactions and website data. It serves as storage that transfers information between the website and GTM.
- Variables: Variables in GTM are dynamic placeholders that store values (such as page URLs, button names, and form field values) and pass them to tags and triggers during the data collection process. Variables are components that provide the necessary data to tags and triggers, but do not execute the functional processes themselves. Variables help define the conditions for when a trigger should fire or what data a tag should send.
- (2)
- Identification of the Functional User Requirements (FURs)
- (3)
- Identification of the Software Architecture Layers
- (4)
- Identification of the Functional Users
- Website Users: Human users who interact with websites by performing actions such as page views, button clicks, or form submissions. Their interactions trigger events that are captured by Google Analytics.
- Client-Side Devices (browsers): Software (e.g., web browsers) through which users access a website. These devices execute JavaScript tags and send data to Google Analytics when events (e.g., page loads and button clicks) are triggered.
- Google Analytics: The external system receives data from the website and processes them for analytics. This can be considered as a functional user in terms of its role in receiving and storing analytical data.
- (5)
- Identification of Software Boundaries
3.2. Mapping Phase
- (1)
- Identification of functional processes
- (2)
- Identification of objects of interest and data groups
- (3)
- Identification and classification of data movements
3.3. Measurement Phase
- Size of data movement: Based on Rule 21 of the COSMIC Measurement Manual [63], “a unit of measurement, one CFP, shall be assigned to each data movement (Entry, Exit, Read or Write) identified in each functional process.”Size of a functional process: Based on Rule 22 of the COSMIC Measurement Manual [63], “data movements within the identified functional process shall be aggregated into a single functional size value for that functional process multiplied by the number of data movements of each type by its unit size, and totaling the sizes for each of the data movement types in the functional process.”
- Functional size of the identified FUR of each piece of software to be measured: Based on Rule 23 of the COSMIC Measurement Manual [63], “the size of each piece of software to be measured within a layer is obtained by aggregating the size of the functional processes within the identified FUR for each piece of software.”
4. Examples of COSMIC Measurement in Web Analytics Implementation
- JavaScript snippet to capture and collect data on user interaction.
- Product view tags track when a user views the product. Triggers should be implemented to evaluate whether a tag has to be fired.
- Add a cart tag that tracks when a user adds a product to the cart. Triggers should be implemented to evaluate whether a tag has to be fired.
- Remove from the cart tag tracks when the user removes a product from the cart. Triggers should be implemented to evaluate whether a tag has to be fired.
- Purchase tags track when a user completes a purchase. Triggers should be implemented to evaluate whether a tag has to be fired.
- JavaScript snippet to capture and collect data on user interaction.
- The view policy plan details the tag that tracks when the user views the plan. Triggers should be implemented to evaluate whether a tag has to be fired.
- Download document tags that track when a user clicks on a document related to the policy plan. Triggers should be implemented to evaluate whether a tag has to be fired.
- Submit a form tag that tracks when a user submits a request for a quoted application. Triggers should be implemented to evaluate whether a tag has to be fired.
5. Empirical Study
5.1. Machine Learning Concepts and Techniques
- Regression in Machine Learning: Regression is a fundamental concept in machine learning used to predict continuous numerical values based on attributes [74]. Linear Regression (LR) is one of the most widely used regression techniques. It captures the linear relationship between data points in the data [75], particularly between independent and dependent dimensions. This empirical study employed Linear Regression to predict effort in hours on the dataset.
- Extra Trees Regressor: Extra Trees are ensemble learning models based on a collection of decision tree models for regression tasks [76]. The extra tree regressor aggregates tree predictions by averaging them to generate a final prediction. This Regressor is robust to overfitting and performs well with high-dimensional data. Capturing the non-linear relationship between data features makes it a powerful model for complex regression tasks.
- AdaBoost Regressor: AdaBoost is a boosting regressor that sequentially combines more than one learner to generate a strong predictive model [77]. AdaBoost can capture non-linear relationships between data points, which demonstrates a powerful regressor against complex and high-dimensional data.
- Random Forest Regressor: Random Forest is an ensemble learning method constructed using multiple decision trees combined by outputting the average prediction from all individual trees [78]. This approach helps avoid overfitting and results in a more robust model. The Random Forest model can be used for both classification and regression (i.e., supervised learning tasks). Each tree in the forest is trained using a random subset of data, which excels in handling large datasets and can capture non-linear relationships between features and target variables.
- Support Vector Machine: Support Vector Machine (SVM) can handle Linear and Non-Linear Regression relationships between independent and dependent targets. SVM can be used for regression or classification tasks. It starts by representing the data points around a line called the hyperplane, and the points nearest to the line are called support vectors. The SVM aims to maximize the margin between the vector points through kernel functions to capture the relationships between features.
- Decision Tree: A Decision tree is a supervised learning algorithm that can be used for regression and classification. The algorithm generates a tree structure in which nodes represent decisions and the leaves represent the prediction output [79]. The model approach works recursively to split data based on a root node to minimize the variance or error within each subset. The information Gain and Gini Index can be used to determine the optimal node splitter as the root. The model can handle numerical and categorical data to capture the complex relationships between the data features.
- K-Nearest Neighbors: K-Nearest Neighbors (KNN) is a supervised model that can handle forecasting and prediction tasks [80]. Here, K represents several values. The default value is five and represents a specific number of neighbors, which allows the model to measure the distance between the data point and other data points and determine the neighbors. The model then starts by taking the average prediction value for the neighbors. Neighbors are determined based on a distance metric, typically Euclidean Distance. KNN can handle non-linear relationships between data features, particularly when data are high-dimensional.
- Gradient Boosting: Gradient Boosting is an ensemble-based model generated by sequentially combining decision trees [81]. Unlike Random Forest, which is generated based on a bagging ensemble, gradient boosting focuses on reducing the bias by optimizing the model performance through the gradient descent approach. The gradient boosting algorithm computes the loss function at each step to compare the actual and predicted values and then optimizes the algorithm during training to achieve the minimum loss, which represents the optimal generalization. It can handle numerical and categorical data and is useful for non-linear relationships between data features.
- Bagging Regressor: The bagging regressor is a model generated based on ensemble learning that combines base models to improve model stability and reduce variance [82]. In this study, we applied a bagging regressor with Linear Regression as the base model to enhance the model performance in forecasting. The model was configured with ten estimators (ten individual Linear Regression models), every single one trained on different subsets of training data samples using the bootstrapping technique for sampling with replacement. Each independent model fitted a Linear Regression model to a unique subset of data. The final prediction was obtained by measuring the average of all the outputs. This approach reduces model overfitting and leverages the diversity of the predictions from diverse models.
- Ensemble Techniques: Ensemble learning combines the predictions of base models to build a more robust and accurate model [83]. Ensemble techniques include several methods such as Bagging, Boosting, and Stacking. These methods improve predictive performance by averaging the prediction values or by using metamodels to combine the predictions of the base models. In our empirical study, we propose the following two ensemble techniques.
- (1)
- The regressor models were then combined using a stacking ensemble. Stacking involves training a new model that combines a list of base models with the final estimator. The base model list includes an extra tree regressor, AdaBoost Regressor, and the Linear Regression and then feeds these models into the final estimator Linear Regression model, which learns how to combine them by learning how to weigh the predictions of the base models. Stacking leverages the strengths of each base model and achieves better performance.
- (2)
- The second ensemble technique combines the prediction models with Voting Regressors. The Voting method aggregates the predictions of the multiple individual models. A voting regressor was used to enhance the effort estimation. The predictions of the three individual models (extra-tree, linear, and AdaBoost regressors) were aggregated. The Voting Regressor combines predictions using an averaging mechanism. The final prediction was the mean of each model’s predictions. This approach leverages the strength of the individual models and reduces the impact of errors on each model.
5.2. Evaluation Metrics
5.3. Data Collection
5.4. Empirical Study Setup
- We applied a Linear Regression model with its default parameters, where fit_intercept = True, to ensure that the model calculated the intercept.
- Other parameters at their default include n_estimators = 100 and bootstrap = True for Random Forest.
- The Support Vector Machine was employed with default settings, such as Kernel = ‘rbf’, c = 1.0, and epsilon = 0.1.
- The Decision Tree Regressor had random_state = 42, with default values for the criterion = ‘squared_error’ and splitter = ‘best’.
- The K-nearest neighbor regressor was used with default n_neighbors = 5 and weights = “uniform”.
- The Gradient Boosting Regressor utilized AdaBoost Regressor was set with n_estimators = 50, keeping its default learning_rate = 1.0 and loss = ‘linear’.
- The Bagging regressor was applied using the following default values: estimator = Linear Regression (), n_estimator = 10, and random_state = 42.
- The Voting Regressor combines the ExtraTreesRegressor, AdaBoost Regressor, and Linear Regression. All individual models were run at their default settings.
- Stacking-employed base models (ExtraTreesRegressor, AdaBoost, and Linear Regression) used Linear Regression as the final estimator.
5.5. Performance of the ML Effort Estimation Models
- Comparison based on the prediction accuracy and generalization:
- Extra Trees had the best test RMSE (0.46) and highest accuracy (98%), making it the most accurate predictor.
- Voting Regressor also achieved a strong performance (RMSE = 0.46, accuracy = 98%), demonstrating robust generalization.
- Linear Regression had the lowest MAE (0.35), indicating that it provided more stable predictions, on average.
- Comparison based on the error analysis (MBRE, MIBRE, MDBRE)
- Linear Regression consistently had the lowest error values, making it a highly reliable model.
- The Voting Regressor has a moderate MBRE (1.74) and MIBRE (1.13), showing a good balance between precision and generalization.
- Extra Trees had slightly higher MBRE (2.10) and MDBRE (1.70) but compensated for lower RMSE and high Testing Accuracy.
- Comparison based on the Standard Accuracy (SA):
- Linear Regression (0.86) had the highest SA, indicating that it provided correct predictions more frequently.
- Voting Regressor (0.86) matched Linear Regression in SA, reinforcing its reliability.
- Extra Trees (0.83) is slightly behind but remains effective.
6. Discussion
- Feasibility of applying COSMIC to web analytics: COSMIC functional size measurement is feasible and effective for web analytics. Practitioners who use Google Tag Manager in web analytics implementations can use COSMIC across diverse web analytics projects to measure their software functional size and plan projects accordingly.
- Effort prediction using functional size measurements: The results illustrate that the effort of web analytics implementation can be predicted using the COSMIC-based functional size. This supports practitioners with data-driven decisions rather than ad hoc decisions.
- Benchmarking and comparison between projects: The COSMIC functional size measurement allows practitioners to compare web analytics projects based on their functional sizes. This supports informed decisions by identifying which projects require more effort and justifies budget and staffing decisions. Stakeholders can understand the reasons for allocating more time and budget to certain projects.
- Guidance on model selection for effort estimation: Using COSMIC as inputs, the evaluation of the machine learning models provides insights into the most suitable model for predicting web analytics implementation efforts:
- Practitioners interested in stable and interpretable models can use Linear Regression, as the empirical results show that it has the lowest error rate and highest Standard Accuracy (SA = 0.86).
- Practitioners interested in high accuracy can use Extra Trees and the Voting Regressors because the empirical results show 98% accuracy, offering strong predictive performance on unseen data.
- 5.
- Extends the application of COSMIC to emerging domains: This study contributes to the software engineering body of knowledge by demonstrating a feasible adoption of COSMIC in web analytics, an unaddressed domain in COSMIC literature. While COSMIC has been widely applied in software projects, its application in tag-based, configurable systems, such as Google Tag Manager (GTM), has not been previously explored.
- 6.
- Offers conceptual mapping between COSMIC and GTM concepts: This study provides a clear mapping between GTM concepts (tags, triggers, variables, and dataLayer) and COSMIC concepts (functional processes, Entry, Exit, Write and Read). This offers a novel theoretical mapping, not addressed previously in the literature, that models web analytics setups as measurable software components.
- 7.
- Offers interdisciplinary research that integrates software engineering, software measurement theories, and web analytics.
- 8.
- Offers a COSMIC-based framework for measurement and effort estimation in web analytics. This can serve as a reference and reusable framework for other analytics systems (e.g., Adobe Analytics).
7. Conclusions
- The proposed COSMIC-based framework focuses on web analytics implementation through client-side tagging in GTM. In future work, we aim to extend this framework to address web analytics implementation through server-side tagging in GTM.
- The proposed COSMIC-based framework focuses on the implementation of Google Analytics. In future work, we aim to extend this framework to address other analytics platforms, such as Adobe Analytics.
- The proposed COSMIC-based framework is applied to 50 projects. In future studies, we aim to extend this application to a larger dataset to evaluate its generalizability and external validity.
- The proposed COSMIC-based framework is based on expert-driven steps depending on the COSMIC manual documentation. In future work, we aim to extend this application to reduce manual work (e.g., automating data movement classification and mapping to E, W, R, X, and their counts) to increase its scalability and consistency across projects.
- It was not within the scope of the current study to conduct a comparative analysis between COSMIC and multi-criteria decision-making methods such as the Analytic Hierarchy Process (AHP). In future work, we aim to extend this study by comparing the effectiveness and accuracy of the COSMIC-based framework with those of AHP-based approaches.
- The proposed COSMIC-based framework can be developed further to encompass additional areas of investigation. This includes automating the application of COSMIC in web analytics and proposing reusable templates across different projects to minimize manual mapping and identification of functional processes or data movements.
Author Contributions
Funding
Data Availability Statement
Conflicts of Interest
References
- Fundingsland, E.L.; Fike, J.; Calvano, J.; Beach, J.; Lai, D.; He, S. Methodological Guidelines for Systematic Assessments of Health Care Websites Using Web Analytics: Tutorial. J. Med. Internet Res. 2022, 24, e28291. [Google Scholar] [CrossRef] [PubMed]
- Hartman, K. Digital Marketing Analytics: In Theory and in Practice, 2nd ed.; Independently Published: Chicago, IL, USA, 2020; p. 263. [Google Scholar]
- Alby, T. Popular, but hardly used: Has Google Analytics been to the detriment of Web Analytics? In Proceedings of the 15th ACM Web Science Conference 2023 (WebSci ‘23), Austin, TX, USA, 30 April–1 May 2023; Association for Computing Machinery: New York, NY, USA, 2023; pp. 304–311. [Google Scholar] [CrossRef]
- Almatrafi, A.M.; Alharbi, Z.H. The impact of web analytics tools on the performance of small and medium enterprises. Eng. Technol. Appl. Sci. Res. 2023, 13, 11753–11762. [Google Scholar] [CrossRef]
- Naprawski, T. The impact of web analytics tools on knowledge management. Procedia Comput. Sci. 2023, 225, 3404–3414. [Google Scholar] [CrossRef]
- W3Techs. Usage Statistics and Market Share of Google Analytics for Websites. March 2022. Available online: https://w3techs.com/technologies/details/ta-googleanalytics (accessed on 21 April 2025).
- Di Martino, S.; Ferrucci, F.; Gravino, C.; Sarro, F. Web effort estimation: Function point analysis vs. COSMIC. Inf. Softw. Technol. 2016, 72, 90–109. [Google Scholar] [CrossRef]
- Abran, A. Software Project Estimation: The Fundamentals for Providing High Quality Information to Decision Makers; Wiley-IEEE Computer Society Press: Hoboken, NJ, USA, 2015; pp. 1–288. [Google Scholar]
- Goswami, D.K.; Chakrabarti, S.; Bilgaiyan, S. Effort estimation of web-based applications using ERD, use case point method and machine learning. In Automated Software Engineering: A Deep Learning-Based Approach; Satapathy, S.C., Jena, A.K., Singh, J., Eds.; Springer International Publishing: Cham, Switzerland, 2020; Volume 8, pp. 19–37. [Google Scholar] [CrossRef]
- Subbiah, C.; Hupman, A.C.; Li, H.; Simonis, J. Improving software development effort estimation with a novel design pattern model. INFORMS J. Appl. Anal. 2023, 53, 192–206. [Google Scholar] [CrossRef]
- Abran, A.; Fagg, P.; Lesterhuis, A. Principles, definitions & rules. In COSMIC Measurement Manual for ISO 19761, Version 5.0; COSMIC: Montreal, QC, Canada, 2021; Part 1; pp. 1–17. Available online: https://cosmic-sizing.org/wp-content/uploads/2020/06/Part-1-MM-Principles-Definitions-Rules-v5.0-Feb-2021.pdf (accessed on 2 September 2024).
- Costagliola, G.; Di Martino, S.; Ferrucci, F.; Gravino, C.; Tortora, G.; Vitiello, G. A COSMIC-FFP approach to predict web application development effort. J. Web Eng. 2006, 5, 93–120. [Google Scholar]
- Ferrucci, F.; Gravino, C.; Di Martino, S. A case study using web objects and COSMIC for effort estimation of web applications. In Proceedings of the 2008 34th Euromicro Conference on Software Engineering and Advanced Applications (SEAA ‘08), Parma, Italy, 3–5 September 2008; IEEE Computer Society: Hoboken, NJ, USA, 2008; pp. 441–448. [Google Scholar] [CrossRef]
- Abrahão, S.; De Marco, L.; Ferrucci, F.; Gomez, J.; Gravino, C.; Sarro, F. Definition and evaluation of a COSMIC measurement procedure for sizing web applications in a model-driven development environment. Inf. Softw. Technol. 2018, 104, 144–161. [Google Scholar] [CrossRef]
- Thair, A.; Taha, D.B. Webapp effort estimation using COSMIC method. Int. J. Comput. Appl. 2018, 182, 33–40. [Google Scholar] [CrossRef]
- Saif, S.M.; Wahid, A. Web effort estimation using FP and WO: A critical study. In Proceedings of the 2018 Second International Conference on Computing Methodologies and Communication (ICCMC 2018), Erode, India, 15–16 February 2018; IEEE: Piscataway, NJ, USA, 2018; pp. 357–361. [Google Scholar] [CrossRef]
- Salgado, A.S.M.; Ribeiro, P.M.G.A. Characterization of a metric for web applications (Web Points). In Proceedings of the 16th Iberian Conference on Information Systems and Technologies (CISTI 2021), Chaves, Portugal, 23–26 June 2021; IEEE: Piscataway, NJ, USA, 2021; pp. 1–7. [Google Scholar] [CrossRef]
- Holmes, L. Google Analytics Solutions: Digital Marketing Made (Much) Easier: Introducing Google Tag Manager. Google Tag Manager. Available online: https://analytics.googleblog.com/2012/10/google-tag-manager.html (accessed on 18 September 2024).
- Hart, D. The Google Analytics 4 and Google Tag Manager Cookbook: A Simple Step-by-Step Pictorial Guide to Implementing Google Analytics and Google Tag Manager for Your Websites; Independently Published: Chicago, IL, USA, 2022. [Google Scholar]
- Batra, A. Google Tag Manager Zero to Hero: Step-by-Step Guide for Learning Google Tag Manager; Independently Published: Chicago, IL, USA, 2019. [Google Scholar]
- Tag Manager. Introduction to Tag Manager—Tag Manager Help. Available online: https://support.google.com/tagmanager/answer/6102821?hl=en (accessed on 18 September 2024).
- Cowderoy, A. Measures of size and complexity for web-site content. In Proceedings of the 11th ESCOM Conference and the 3rd SCOPE Conference on Software Product Quality, Munich, Germany, 18–20 April 2000; pp. 423–431. [Google Scholar]
- Mendes, E.; Mosley, N. Web metrics—Authoring effort, design and estimating. IEEE Multimed. 2001, 8, 50–57. [Google Scholar] [CrossRef]
- Cleary, D. Web-based development and functional size measurement. In Proceedings of the IFPUG Annual Conference, San Diego, CA, USA, September, 2000; pp. 1–55. [Google Scholar]
- Reifer, D.J. Web development: Estimating quick-to-market software. IEEE Softw. 2000, 17, 57–64. [Google Scholar] [CrossRef]
- Rollo, T. Sizing e-commerce. In Proceedings of the Australian Conference on Software Measurement, Sydney, Australia, 1–3 November 2000; IEEE Press: Piscataway, NJ, USA, 2000. [Google Scholar]
- Mendes, E.; Mosley, N.; Counsell, S. Comparison of web size measures for predicting web design and authoring effort. IEE Proc. Softw. 2002, 149, 86–92. [Google Scholar] [CrossRef]
- Conallen, J. Building Web Applications with UML, 2nd ed.; Addison-Wesley Professional: Boston, MA, USA, 2003. [Google Scholar]
- Ferrucci, F.; Gravino, C.; Di Martino, S. Estimating web application development effort using Web-COBRA and COSMIC: An empirical study. In Proceedings of the 35th Euromicro Conference on Software Engineering and Advanced Applications (SEAA 2009), Patras, Greece, 27–29 August 2009; pp. 306–312. [Google Scholar] [CrossRef]
- Buglione, L.; Ferrucci, F.; Gencel, C.; Gravino, C.; Sarro, F. Which COSMIC Base Functional Components are Significant in Estimating Web Application Development?—A Case Study. In Proceedings of the IWSM/Mensura/Metrikon 2010 Conference, Stuttgart, Germany, 10–12 November 2010; pp. 205–224, ISBN 978-3-8322-9618-6. [Google Scholar]
- Abrahão, S.; De Marco, L.; Ferrucci, F.; Gravino, C.; Sarro, F. A COSMIC measurement procedure for sizing Web applications developed using the OO-H method. In Proceedings of the Workshop on Advances in Functional Size Measurement and Effort Estimation (FSM’10), Maribor, Slovenia, 21–22 June 2010; ACM: New York, NY, USA, 2010; pp. 1–8. [Google Scholar] [CrossRef]
- Ceke, D.; Durek, M.; Kasapovic, S. Web application functional size estimation based on COSMIC method and UWE approach. In Proceedings of the 36th International Convention on Information and Communication Technology, Electronics and Microelectronics (MIPRO 2013), Opatija, Croatia, 20–24 May 2013; IEEE: Piscataway, NJ, USA, 2013; pp. 396–403. [Google Scholar]
- De Marco, L.; Ferrucci, F.; Gravino, C. Approximate COSMIC size to early estimate web application development effort. In Proceedings of the 39th Euromicro Conference on Software Engineering and Advanced Applications (SEAA 2013), Santander, Spain, 4–6 September 2013; pp. 349–356. [Google Scholar] [CrossRef]
- Ahadi, A.; Singh, A.; Bower, M.; Garrett, M. Text mining in education—A bibliometrics-based systematic review. Educ. Sci. 2022, 12, 210. [Google Scholar] [CrossRef]
- Amalina, F.; Hashem, I.A.T.; Azizul, Z.H.; Fong, A.T.; Firdaus, A.; Imran, M.; Anuar, N.B. Blending big data analytics: Review on challenges and a recent study. IEEE Access 2020, 8, 3629–3645. [Google Scholar] [CrossRef]
- Zhang, M. Understanding the relationships between interest in online math games and academic performance. J. Comput. Assist. Learn. 2015, 31, 254–267. [Google Scholar] [CrossRef]
- Ailawadi, K.L.; Farris, P.W. Managing multi- and omni-channel distribution: Metrics and research directions. J. Retail. 2017, 93, 120–135. [Google Scholar] [CrossRef]
- Leitner, P.; Grechenig, T. Scalable social software services: Towards a shopping community model based on analyses of established web service components and functions. In Proceedings of the 42nd Hawaii International Conference on System Sciences (HICSS 2009), Waikoloa, HI, USA, 5–8 January 2009; IEEE Computer Society: Hoboken, NJ, USA, 2009; pp. 1–10. [Google Scholar] [CrossRef]
- Tao, Y.; Guo, S.; Shi, C.; Chu, D. User behavior analysis by cross-domain log data fusion. IEEE Access 2020, 8, 400–406. [Google Scholar] [CrossRef]
- Kagan, S.; Bekkerman, R. Predicting purchase behavior of website audiences. Int. J. Electron. Commer. 2018, 22, 510–539. [Google Scholar] [CrossRef]
- Hazrati, N.; Ricci, F. Recommender systems effect on the evolution of users’ choices distribution. Inf. Process. Manag. 2022, 59, 102766. [Google Scholar] [CrossRef]
- Tangmanee, C. Comparisons of website visit behavior between purchase outcomes and product categories. Int. J. Res. Bus. Soc. Sci. 2017, 6, 1–10. [Google Scholar] [CrossRef]
- Sun, T.; Wang, M.; Liang, Z. Predictive modeling of potential customers based on the customers’ clickstream data: A field study. In Proceedings of the 2017 IEEE International Conference on Industrial Engineering and Engineering Management (IEEM 2017), Singapore, 10–13 December 2017; pp. 2221–2225. [Google Scholar] [CrossRef]
- Harika, B.; Sudha, T. Extraction of knowledge from web server logs using web usage mining. Asian J. Comput. Sci. Technol. 2019, 8, 12–15. [Google Scholar] [CrossRef]
- Severeyn, E.; La Cruz, A.; Huerta, M.; Matute, R.; Estrada, J. Prediction of clients based on Google Analytics income using support vector machines. In Proceedings of the 2023 IEEE Colombian Caribbean Conference (C3), Barranquilla, Colombia, 8–10 November 2023; pp. 926–931. [Google Scholar] [CrossRef]
- Kang, S. Factors influencing intention of mobile application use. Int. J. Mob. Commun. 2014, 12, 360–379. [Google Scholar] [CrossRef]
- Bansal, H.; Kohli, S. Trust evaluation of websites: A comprehensive study. Int. J. Adv. Intell. Paradig. 2019, 13, 101–112. [Google Scholar] [CrossRef]
- Gunawan, A.B. Socialization of terms of use and privacy policy on Indonesian e-commerce websites. J. Sos. Sci. 2020, 1, 41–45. [Google Scholar] [CrossRef]
- Singal, H.; Kohli, S. Trust necessitated through metrics: Estimating the trustworthiness of websites. Procedia Comput. Sci. 2016, 85, 133–140. [Google Scholar] [CrossRef]
- Bakaev, M.; Khvorostov, V.; Heil, S.; Gaedke, M. Web intelligence linked open data for website design reuse. In Web Engineering; Lecture Notes in Computer Science; Bieliková, M., Mikkonen, T., Franch, X., Liu, H., Eds.; Springer: Cham, Switzerland, 2017; Volume 10360, pp. 370–377. [Google Scholar] [CrossRef]
- Chakrabortty, K.; Jose, E. Relationship analysis between website traffic, domain age and Google indexed pages of e-commerce websites. IIM Kozhikode Soc. Manag. Rev. 2018, 7, 171–177. [Google Scholar] [CrossRef]
- Vyas, C. Evaluating state tourism websites using search engine optimization tools. Tour. Manag. 2019, 73, 64–70. [Google Scholar] [CrossRef]
- Suksida, T.; Santiworarak, L. A study of website content in Webometrics ranking of world universities by using SimilarWeb tool. In Proceedings of the 2017 IEEE 2nd International Conference on Signal and Image Processing (ICSIP 2017), Singapore, 13–15 August 2017; IEEE: Piscataway, NJ, USA, 2017; pp. 480–483. [Google Scholar] [CrossRef]
- Kumar, B.; Roy, S.; Sinha, A.; Iwendi, C.; Strážovská, Ľ. E-commerce website usability analysis using the association rule mining and machine learning algorithm. Mathematics 2023, 11, 25. [Google Scholar] [CrossRef]
- Önder, I.; Berbekova, A. Web analytics: More than website performance evaluation? Int. J. Tour. Cities 2022, 8, 603–615. [Google Scholar] [CrossRef]
- Kumar, V.; Ogunmola, G.A. Web analytics for knowledge creation: A systematic review of tools, techniques, and practices. Int. J. Cyber Behav. Psychol. Learn. 2020, 10, 1–14. [Google Scholar] [CrossRef]
- FitzGerald Quintel, D.; Wilson, R. Analytics and privacy: Using Matomo in EBSCO’s discovery service. Inf. Technol. Libr. 2020, 39, 1–10. [Google Scholar] [CrossRef]
- Jansen, B.J.; Jung, S.G.; Salminen, J. Measuring user interactions with websites: A comparison of two industry standard analytics approaches using data of 86 websites. PLoS ONE 2022, 17, e0268212. [Google Scholar] [CrossRef] [PubMed]
- Hasan, S.B. Web analyzer software tool in order to identify and know the behavior of users that visit website. Acad. J. Nawroz Univ. 2022, 11, 75–81. [Google Scholar] [CrossRef]
- Jain, V.; Kashyap, K.L. An efficient algorithm for web log data preprocessing. In Machine Vision and Augmented Intelligence—Theory and Applications; Springer: Singapore, 2021; Volume 796, pp. 505–514. [Google Scholar] [CrossRef]
- Gamalielsson, J.; Lundell, B.; Katz, A.; Söderberg, J. Towards open government through open source software for web analytics: The case of Matomo. eJournal eDemocracy Open Gov. 2021, 13, 133–153. [Google Scholar] [CrossRef]
- Abran, A. Software Metrics and Software Metrology; John Wiley & Sons, Inc.: Hoboken, NJ, USA, 2010. [Google Scholar]
- ISO/IEC 19761:2011; Software Engineering—COSMIC: A Functional Size Measurement Method. International Organization for Standardization (ISO): Geneva, Switzerland, 2011. Available online: https://www.iso.org/standard/54849.html (accessed on 2 September 2024).
- ISO/IEC 20926:2009; Software and Systems Engineering—Software Measurement—IFPUG Functional Size Measurement Method. 2nd ed. ISO: Geneva, Switzerland, 2009. Available online: https://www.iso.org/standard/51717.html (accessed on 2 September 2024).
- ISO/IEC 20968:2002; Software Engineering—Mk II Function Point Analysis—Counting Practices Manual. ISO: Geneva, Switzerland, 2002. Available online: https://www.iso.org/standard/35603.html (accessed on 2 September 2024).
- ISO/IEC 24570:2018; Software Engineering—NESMA Functional Size Measurement Method—Definitions and Counting Guidelines for the Application of Function Point Analysis. International Organization for Standardization (ISO): Geneva, Switzerland, 2018. Available online: https://www.iso.org/standard/72505.html (accessed on 2 September 2024).
- ISO/IEC 29881:2010; Information Technology—Systems and Software Engineering—FiSMA 1.1 Functional Size Measurement Method. International Organization for Standardization (ISO): Geneva, Switzerland, 2010. Available online: https://www.iso.org/standard/56418.html (accessed on 2 September 2024).
- Symons, C.; Abran, A.; Ebert, C.; Vogelezang, F. Measurement of software size: Advances made by the COSMIC community. In Proceedings of the 26th International Workshop on Software Measurement (IWSM 2016) and 11th International Conference on Software Process and Product Measurement (Mensura 2016), Berlin, Germany, 5–7 October 2016; IEEE: Piscataway, NJ, USA, 2017; pp. 75–86. [Google Scholar] [CrossRef]
- Abdallah, A.; Abran, A. Towards the Adoption of International Standards in Enterprise Architecture Measurement. In Proceedings of the Second International Conference on Data Science, E-Learning and Information Systems (DATA 2019), Dubai, United Arab Emirates, 2–5 December 2019; Association for Computing Machinery: New York, NY, USA, 2019; pp. 1–8. [Google Scholar] [CrossRef]
- Fehlmann, T.; Gelli, A. Functional Size Measurement in Agile Development: Velocity in Agile Sprints. In Proceedings of the 27th International Conference on Evaluation and Assessment in Software Engineering (EASE 2023), Oulu, Finland, 14–16 June 2023; ACM: New York, NY, USA, 2023; pp. 200–204. [Google Scholar] [CrossRef]
- Moulla, D.K.; Kitikil, A.A.; Mnkandla, E.; Soubra, H.; Abran, A. Functional Size Measurement for X86 Assembly Programs. In Proceedings of the Joint 32nd International Workshop on Software Measurement and 17th International Conference on Software Process and Product Measurement (IWSM-Mensura 2023), Rome, Italy, 14–15 September 2023; CEUR Workshop Proceedings. Volume 3543, pp. 1–8. [Google Scholar]
- Valdes-Souto, F.; Perez-Gonzalez, H.G.; Perez-Delgado, C.A. Q-COSMIC: Quantum Software Metrics Based on COSMIC (ISO/IEC19761). arXiv 2024, arXiv:2402.08505. [Google Scholar]
- Rajapaksha, P.; Wijayasiriwardhane, T.K. Functional Size Measurement of IoT Devices using COSMIC Function Point: A Novel Set of Guidelines. In Proceedings of the 2024 International Research Conference on Smart Computing and Systems Engineering (SCSE 2024), Colombo, Sri Lanka, 3–4 April 2024; IEEE: New York, NY, USA, 2024; pp. 1–7. [Google Scholar] [CrossRef]
- Wei, P.; Beer, M. Regression models for machine learning. In Machine Learning in Modeling and Simulation: Methods and Applications; Rabczuk, T., Bathe, K.-J., Eds.; Springer International Publishing: Cham, Switzerland, 2023; pp. 341–371. [Google Scholar]
- Jørgensen, M. Regression models of software development effort estimation accuracy and bias. Empir. Softw. Eng. 2004, 9, 297–314. [Google Scholar] [CrossRef]
- Geurts, P.; Ernst, D.; Wehenkel, L. Extremely randomized trees. Mach. Learn. 2006, 63, 3–42. [Google Scholar] [CrossRef]
- Duffy, N.; Helmbold, D. Boosting methods for regression. Mach. Learn. 2002, 47, 153–200. [Google Scholar] [CrossRef]
- Jin, Z.; Shang, J.; Zhu, Q.; Ling, C.; Xie, W.; Qiang, B. RFRSF: Employee turnover prediction based on random forests and survival analysis. In Lecture Notes in Computer Science (Including Subseries Lecture Notes in Artificial Intelligence and Lecture Notes in Bioinformatics); Springer: Cham, Switzerland, 2020; Volume 12343, pp. 503–515. [Google Scholar] [CrossRef]
- Podgorelec, V.; Zorman, M. Decision tree learning. In Encyclopedia of Complexity and Systems Science, 2nd ed.; Meyers, R.A., Ed.; Springer: Berlin/Heidelberg, Germany, 2014; pp. 1–28. [Google Scholar]
- Kramer, O. K-Nearest Neighbors. In Dimensionality Reduction with Unsupervised Nearest Neighbors, 1st ed.; Kramer, O., Ed.; Springer: Berlin/Heidelberg, Germany, 2013; pp. 13–23. [Google Scholar]
- Schapire, R.E. The boosting approach to machine learning: An overview. In Nonlinear Estimation and Classification; Denison, D.D., Hansen, M.H., Holmes, C.C., Mallick, B., Yu, B., Eds.; Springer: New York, NY, USA, 2003; pp. 149–171. [Google Scholar]
- Richman, R.; Wüthrich, M.V. Bagging predictors. Risks 2020, 8, 83. [Google Scholar] [CrossRef]
- Liapis, C.M.; Karanikola, A.; Kotsiantis, S. A multivariate ensemble learning method for medium-term energy forecasting. Neural Comput. Appl. 2023, 35, 21479–21497. [Google Scholar] [CrossRef]
- Miyazaki, Y.; Takanou, A.; Nozaki, H.; Nakagawa, N.; Okada, K. Method to estimate parameter values in software prediction models. Inf. Softw. Technol. 1991, 33, 239–243. [Google Scholar] [CrossRef]
- Jørgensen, M.; Halkjelsvik, T.; Liestøl, K. When should we (not) use the mean magnitude of relative error (MMRE) as an error measure in software development effort estimation? Inf. Softw. Technol. 2022, 143, 106784. [Google Scholar] [CrossRef]
- Myrtveit, I.; Stensrud, E.; Shepperd, M. Reliability and validity in comparative studies of software prediction models. IEEE Trans. Softw. Eng. 2005, 31, 380–391. [Google Scholar] [CrossRef]
- Foss, T.; Stensrud, E.; Kitchenham, B.; Myrtveit, I. A simulation study of the model evaluation criterion MMRE. IEEE Trans. Softw. Eng. 2003, 29, 985–995. [Google Scholar] [CrossRef]
- Hosni, M.; Idri, A.; Abran, A. Investigating heterogeneous ensembles with filter feature selection for software effort estimation. In Proceedings of the ACM International Conference on Software Engineering and Knowledge Engineering (SEKE 2017), Pittsburgh, PA, USA, 10–12 July 2017; ACM: New York, NY, USA, 2017; pp. 207–220. [Google Scholar] [CrossRef]
- Shepperd, M.; MacDonell, S. Evaluating prediction systems in software project estimation. Inf. Softw. Technol. 2012, 54, 820–827. [Google Scholar] [CrossRef]
- Wen, J.; Li, S.; Lin, Z.; Hu, Y.; Huang, C. Systematic literature review of machine learning-based software development effort estimation models. Inf. Softw. Technol. 2012, 54, 41–59. [Google Scholar] [CrossRef]
- Idri, A.; Amazal, F.A.; Abran, A. Analogy-based software development effort estimation: A systematic mapping and review. Inf. Softw. Technol. 2015, 58, 206–230. [Google Scholar] [CrossRef]
- Kane, J.V.; Barabas, J. No harm in checking: Using factual manipulation checks to assess attentiveness in experiments. Am. J. Pol. Sci. 2018, 63, 234–249. [Google Scholar] [CrossRef]


| Functional User Requirement (FURs) | Description | |
|---|---|---|
| Page View Tracking | The system must track when a user visits a page on the website. | Every time a user loads a new page, the page view event must be recorded in Google Analytics. |
| Button Click Tracking | The system must track when a user clicks specific buttons on the website. | Button click events (e.g., “Submit” buttons, “Add to Cart” buttons) need to be captured and sent to Google Analytics. |
| Form Submission Tracking | The system must track when a user submits a form on the website. | Every time a form is submitted (e.g., contact forms, checkout forms), the event must be recorded and sent to Google Analytics. |
| Custom Event Tracking | The system must track custom events such as video plays, file downloads, or other unique user interactions. | Specific interactions, such as playing a video or downloading a file, must be captured and sent to Google Analytics for analysis. |
| E-commerce Tracking | The system must track e-commerce transactions such as product views, add-to-cart actions, and completed purchases. | E-commerce interactions, such as product purchases, must be tracked and sent to Google Analytics for revenue and conversion analysis. |
| Object of Interest | Description | Related Data Groups | Example |
|---|---|---|---|
| User Interaction Event | Represents any interaction by a user on the website or app, such as clicks, page views, form submissions, etc. | Button ID, Timestamp of interaction, Page URL, Event type (e.g., “click”, “view”, “submit”). | A user clicks a button, generating event details like button ID, time of click, and page URL, which GTM captures and processes. |
| Tag | A snippet of JavaScript that sends collected data to external analytics platforms (e.g., Google Analytics). A tag is fired based on trigger conditions. | Tag ID, Data sent by the tag (e.g., page URL, button name), Trigger ID (identifying which condition led to the tag firing). | A tag fires when a page view occurs and sends the page URL and timestamp to Google Analytics. |
| Trigger | Defines the conditions under which a tag is fired (e.g., a button click, form submission, or page view). | Trigger ID, Condition (e.g., event type, scroll depth, form ID), Associated tag ID. | A trigger fires when a user submits a form, leading GTM to send form data to an analytics system. |
| Variable | A dynamic data element that holds specific information (e.g., button name, form value, or user ID) used by tags or triggers. | Variable name, Variable value (e.g., “Submit” button name, form value, or user ID), Reference to the tag or trigger using this variable. | A variable holds the name of a clicked button, which is used by a tag to send the correct button data to Google Analytics. |
| dataLayer | A structured array used by GTM to collect and manage data from user interactions, acting as an intermediary. | Event type (e.g., click, submit), Data attributes (e.g., button name, form field values), Associated user ID. | The dataLayer stores data about a form submission, including the user’s input and the time of submission, until GTM processes it. |
| Analytics System | Analytics systems (e.g., Google Analytics) that receive data from GTM after the tags are fired. | Data sent by tag (e.g., page URL, button name), Analytics ID (e.g., the property ID of Google Analytics), Timestamp of data transfer. | Google Analytics receives data about a page view, including the URL and timestamp, for reporting purposes. |
| Functional Process | Data Movement | Classification | Description | Example |
|---|---|---|---|---|
| JavaScript Snippet Capturing a User Interaction Event | Entry | Entry (Rule 16) | User interaction data (e.g., button click, page view) enters GTM from the client-side via the dataLayer. | User clicks “Submit”, and the event data (button ID, timestamp) enter GTM. |
| Trigger Evaluation | Read | Read (Rule 18) | GTM reads data (e.g., button ID, page URL) from the dataLayer or variables to evaluate trigger conditions. | GTM reads the button ID to check if it meets the condition for firing a tag. |
| Variable Processing | Read | Read (Rule 18) | GTM retrieves a dynamic variable value (e.g., button name) for use in tags or triggers. | GTM reads a variable value (button name) to use in trigger evaluation or tag firing. |
| Tag Firing | Read + Exit | Read (Rule 18) + Exit (Rule 17) | GTM reads evaluated conditions, and if met, fires the tag, sending data (e.g., page URL, button name) to an external analytics platform (Google Analytics). | GTM reads trigger results and then fires the tag to send data to Google Analytics. |
| Setting a cookie through JavaScript | Read + Write | Read (Rule 18) + Write (Rule 19) | GTM writes session information to browser cookies. |
| Functional Process | Data Movement | Description |
|---|---|---|
| JavaScript snippet to capture users’ interaction | Entry | A user landed on the website, and tracking data enter GTM (tags, dataLayer, Variables, triggers) |
| Product view tag | Read | If the user views a product, then GTM will read the conditions to fire the tag |
| Exit | GTM sends the data of the product view to Google Analytics | |
| Add to cart tag | Read | If the user adds a product to the cart, then GTM will read the conditions to fire the tag |
| Exit | GTM sends the data of the product added to the cart to Google Analytics | |
| Remove from cart tag | Read | If the user removes a product from the cart, then GTM will read the conditions to fire the tag |
| Exit | GTM sends the data of the product removed from the cart to Google Analytics | |
| Purchase tag | Read | If the user completes a purchase, then GTM will read the conditions to fire the tag |
| Exit | GTM sends the data of the purchase to Google Analytics |
| Functional Process | Data Movements | Number of Movements | Functional Size (CFP) |
|---|---|---|---|
| JavaScript snippet to capture users’ interaction | Entry | 1 | 1 |
| Product view tag | Read + Exit | 2 | 2 |
| Add to cart tag | Read + Exit | 2 | 2 |
| Remove from cart tag | Read + Exit | 2 | 2 |
| Purchase tag | Read + Exit | 2 | 2 |
| The functional size of the Google Analytics implementation | Total = 9 CFP |
| Functional Process | Data Movement | Description |
|---|---|---|
| JavaScript snippet to capture users’ interaction | Entry | A user landed on the website, and tracking data enters to GTM (tags, dataLayer, Variables, triggers) |
| View policy tag | Read | If the user views a policy plan, then GTM will read the conditions to fire the tag |
| Exit | GTM sends the data of the view policy to Google Analytics | |
| Download documents tag | Read | If the user downloads a document, then GTM will read the conditions to fire the tag |
| Exit | GTM sends the data of the download to Google Analytics | |
| Submit a form tag | Read | If the user submits a form, then GTM will read the conditions to fire the tag |
| Exit | GTM sends the data of the form submission to Google Analytics |
| Figure 1 | Data Movements | Number of Movements | Functional Size (CFP) |
|---|---|---|---|
| JavaScript snippet to capture users’ interaction | Entry | 1 | 1 |
| View policy tag | Read + Exit | 2 | 2 |
| Download documents tag | Read + Exit | 2 | 2 |
| Submit a form tag | Read + Exit | 2 | 2 |
| The functional size of the Google Analytics implementation | Total = 7 CFP |
| Project | ENTRY Movements | READ Movements | WRITE Movements | EXIT Movements | COSMIC Functional Size (CFP) | Actual Effort (Hours) | Functional Processes |
|---|---|---|---|---|---|---|---|
| P1 | 1 | 3 | 1 | 2 | 7 | 13.6 | 3 |
| P2 | 1 | 4 | 2 | 3 | 10 | 19.5 | 4 |
| P3 | 2 | 5 | 1 | 4 | 12 | 22.4 | 5 |
| P4 | 1 | 3 | 2 | 2 | 8 | 15.6 | 4 |
| P5 | 2 | 2 | 1 | 3 | 8 | 16.0 | 3 |
| P6 | 1 | 4 | 2 | 4 | 11 | 21.9 | 4 |
| P7 | 1 | 3 | 1 | 2 | 7 | 13.8 | 3 |
| P8 | 1 | 5 | 2 | 4 | 12 | 23.8 | 5 |
| P9 | 2 | 3 | 2 | 3 | 10 | 19.1 | 4 |
| P10 | 1 | 4 | 1 | 2 | 8 | 15.7 | 3 |
| P11 | 1 | 5 | 2 | 4 | 12 | 23.6 | 5 |
| P12 | 2 | 3 | 1 | 3 | 9 | 17.0 | 4 |
| P13 | 1 | 4 | 2 | 2 | 9 | 18.2 | 4 |
| P14 | 2 | 5 | 1 | 4 | 12 | 22.9 | 5 |
| P15 | 1 | 3 | 2 | 3 | 9 | 17.6 | 4 |
| P16 | 1 | 4 | 1 | 4 | 10 | 20.4 | 5 |
| P17 | 1 | 5 | 2 | 3 | 11 | 21.8 | 4 |
| P18 | 2 | 3 | 1 | 2 | 8 | 16.3 | 3 |
| P19 | 1 | 4 | 2 | 4 | 11 | 22.1 | 5 |
| P20 | 2 | 3 | 2 | 3 | 10 | 19.5 | 4 |
| P21 | 1 | 5 | 1 | 2 | 9 | 17.8 | 4 |
| P22 | 1 | 3 | 2 | 4 | 10 | 20.7 | 5 |
| P23 | 2 | 4 | 1 | 3 | 10 | 19.2 | 4 |
| P24 | 1 | 3 | 2 | 2 | 8 | 15.8 | 3 |
| P25 | 1 | 5 | 2 | 4 | 12 | 24.1 | 5 |
| P26 | 2 | 4 | 1 | 3 | 10 | 19.4 | 4 |
| P27 | 1 | 3 | 2 | 3 | 9 | 17.9 | 4 |
| P28 | 1 | 4 | 1 | 4 | 10 | 20.5 | 5 |
| P29 | 2 | 5 | 2 | 4 | 13 | 25.8 | 5 |
| P30 | 1 | 3 | 1 | 2 | 7 | 14.0 | 3 |
| P31 | 1 | 4 | 2 | 3 | 10 | 19.6 | 4 |
| P32 | 2 | 5 | 1 | 4 | 12 | 24.3 | 5 |
| P33 | 1 | 3 | 1 | 2 | 7 | 14.2 | 3 |
| P34 | 1 | 4 | 1 | 3 | 9 | 18.2 | 4 |
| P35 | 2 | 3 | 2 | 3 | 10 | 20.5 | 4 |
| P36 | 1 | 5 | 2 | 4 | 12 | 24.1 | 5 |
| P37 | 2 | 4 | 1 | 3 | 10 | 19.4 | 4 |
| P38 | 1 | 3 | 1 | 2 | 7 | 14.7 | 3 |
| P39 | 1 | 5 | 2 | 4 | 12 | 24.2 | 5 |
| P40 | 2 | 4 | 1 | 3 | 10 | 19.6 | 4 |
| P41 | 1 | 3 | 2 | 2 | 8 | 15.8 | 3 |
| P42 | 1 | 5 | 1 | 4 | 11 | 22.8 | 5 |
| P43 | 2 | 4 | 2 | 3 | 11 | 22.0 | 4 |
| P44 | 1 | 3 | 2 | 4 | 10 | 20.3 | 5 |
| P45 | 1 | 4 | 1 | 2 | 8 | 16.3 | 4 |
| P46 | 2 | 5 | 2 | 4 | 13 | 25.4 | 5 |
| P47 | 1 | 4 | 1 | 3 | 9 | 18.4 | 4 |
| P48 | 1 | 3 | 1 | 2 | 7 | 14.6 | 3 |
| P49 | 2 | 5 | 2 | 3 | 12 | 24.6 | 5 |
| P50 | 1 | 4 | 2 | 4 | 11 | 22.3 | 4 |
| Model | Train RMSE | Test RMSE | Train Accuracy | Testing Accuracy | MAE |
|---|---|---|---|---|---|
| Linear Regression | 0.41 | 0.51 | 0.98 | 0.97 | 0.35 |
| Random Forest | 0.32 | 0.50 | 0.99 | 0.97 | 0.39 |
| Support Vector Machine | 0.70 | 0.69 | 0.95 | 0.95 | 0.50 |
| Decision Tree | 0.27 | 0.59 | 0.99 | 0.96 | 0.49 |
| KNN | 0.72 | 0.89 | 0.95 | 0.927 | 0.71 |
| Gradient Boosting | 0.27 | 0.57 | 0.99 | 0.97 | 0.41 |
| AdaBoost | 0.39 | 0.51 | 0.98 | 0.97 | 0.43 |
| Extra Trees | 0.27 | 0.46 | 0.99 | 0.980755 | 0.41 |
| Bagging | 0.42 | 0.52 | 0.98 | 0.97 | 0.34 |
| Voting | 0.32 | 0.46 | 0.99 | 0.980522 | 0.35 |
| Stacking | 0.39 | 0.49 | 0.98 | 0.97 | 0.34 |
| Model | MBRE | MIBRE | LSD | SA | MdAt | MDBRE | MDIRE |
|---|---|---|---|---|---|---|---|
| Linear Regression | 1.75 | 0.92 | 0.02 | 0.86 | 0.15 | 0.92 | 0.92 |
| Random Forest | 1.97 | 1.62 | 0.02 | 0.84 | 0.30 | 1.62 | 1.65 |
| Support Vector Machine | 2.45 | 1.75 | 0.03 | 0.80 | 0.34 | 1.75 | 1.78 |
| Decision Tree | 2.47 | 2.00 | 0.02 | 0.81 | 0.4 | 2.00 | 2.00 |
| KNN | 3.55 | 3.67 | 0.04 | 0.72 | 0.82 | 3.67 | 3.81 |
| Gradient Boosting | 2.08 | 1.08 | 0.02 | 0.84 | 0.20 | 1.08 | 1.09 |
| AdaBoost | 2.15 | 1.92 | 0.02 | 0.83 | 0.37 | 1.92 | 1.89 |
| Extra Trees | 2.10 | 1.70 | 0.02 | 0.83 | 0.36 | 1.70 | 1.72 |
| Bagging | 1.72 | 0.83 | 0.02 | 0.86 | 0.13 | 0.83 | 0.84 |
| Boosting | 2.15 | 1.92 | 0.02 | 0.83 | 0.37 | 1.92 | 1.89 |
| Voting | 1.74 | 1.13 | 0.02 | 0.86 | 0.25 | 1.13 | 1.12 |
| Stacking | 1.70 | 0.91 | 0.02 | 0.86 | 0.16 | 0.91 | 0.91 |
Disclaimer/Publisher’s Note: The statements, opinions and data contained in all publications are solely those of the individual author(s) and contributor(s) and not of MDPI and/or the editor(s). MDPI and/or the editor(s) disclaim responsibility for any injury to people or property resulting from any ideas, methods, instructions or products referred to in the content. |
© 2025 by the authors. Licensee MDPI, Basel, Switzerland. This article is an open access article distributed under the terms and conditions of the Creative Commons Attribution (CC BY) license (https://creativecommons.org/licenses/by/4.0/).
Share and Cite
Abdallah, A.; Abran, A.; Qasaimeh, M.; Qasaimeh, M.; Abdallah, B. Measurement of the Functional Size of Web Analytics Implementation: A COSMIC-Based Case Study Using Machine Learning. Future Internet 2025, 17, 280. https://doi.org/10.3390/fi17070280
Abdallah A, Abran A, Qasaimeh M, Qasaimeh M, Abdallah B. Measurement of the Functional Size of Web Analytics Implementation: A COSMIC-Based Case Study Using Machine Learning. Future Internet. 2025; 17(7):280. https://doi.org/10.3390/fi17070280
Chicago/Turabian StyleAbdallah, Ammar, Alain Abran, Munthir Qasaimeh, Malik Qasaimeh, and Bashar Abdallah. 2025. "Measurement of the Functional Size of Web Analytics Implementation: A COSMIC-Based Case Study Using Machine Learning" Future Internet 17, no. 7: 280. https://doi.org/10.3390/fi17070280
APA StyleAbdallah, A., Abran, A., Qasaimeh, M., Qasaimeh, M., & Abdallah, B. (2025). Measurement of the Functional Size of Web Analytics Implementation: A COSMIC-Based Case Study Using Machine Learning. Future Internet, 17(7), 280. https://doi.org/10.3390/fi17070280