4.3.1. Quantification of Multi-Dimensional Correlation Strength
Referring to the “2024 Annual Commuting Monitoring Report of China’s Major Cities” [
46], 5 km and 20 min are set as the thresholds for commuting distance and time. Under this threshold, 2110 proximity relationships are obtained, which account for about 7% of the all-connected network.
Based on the review texts and their entity recognition results, a dictionary of attraction names and keywords is constructed. Association and co-occurrence frequencies are then extracted using regular expression matching. Finally, the association resonance degree between each pair of attractions is calculated. To excavate fine-grained association relations, low-frequency associations are also taken into consideration, and the minimum support degree (Support) is set to 0.0001. To ensure practical value, the minimum lift degree (Lift) is set to 2.0, and the confidence degree (Confidence) of the association rules is taken as the resonance degree of the associations. This yields 836 association relations, accounting for about 2.6% of the whole connection network.
The Jensen–Shannon (JS) divergence quantifies the dissimilarity between two sentiment-weighted thematic feature vectors, followed by computing thematic-sentiment similarity via Equation (13) in
Section 3.2. Given that POI types inherently reflect the functional essence of attractions and tourists’ primary visitation intentions, and noting the long-tailed distribution of global JS divergence values, the similarity threshold is derived based on intra-POI homogeneity. This strategy ensures semantic consistency while preserving inter-category heterogeneity [
47]. The average Jensen–Shannon divergence among attractions with the same scenic POI type serves as the thematic-sentiment distance threshold to calculate the thematic-sentiment similarity between attractions. Consequently, 10,684 thematic-sentiment correlations are identified, accounting for about 34% of the fully connected network.
4.3.2. Analysis of the Structural Characteristics of MAN-SRT
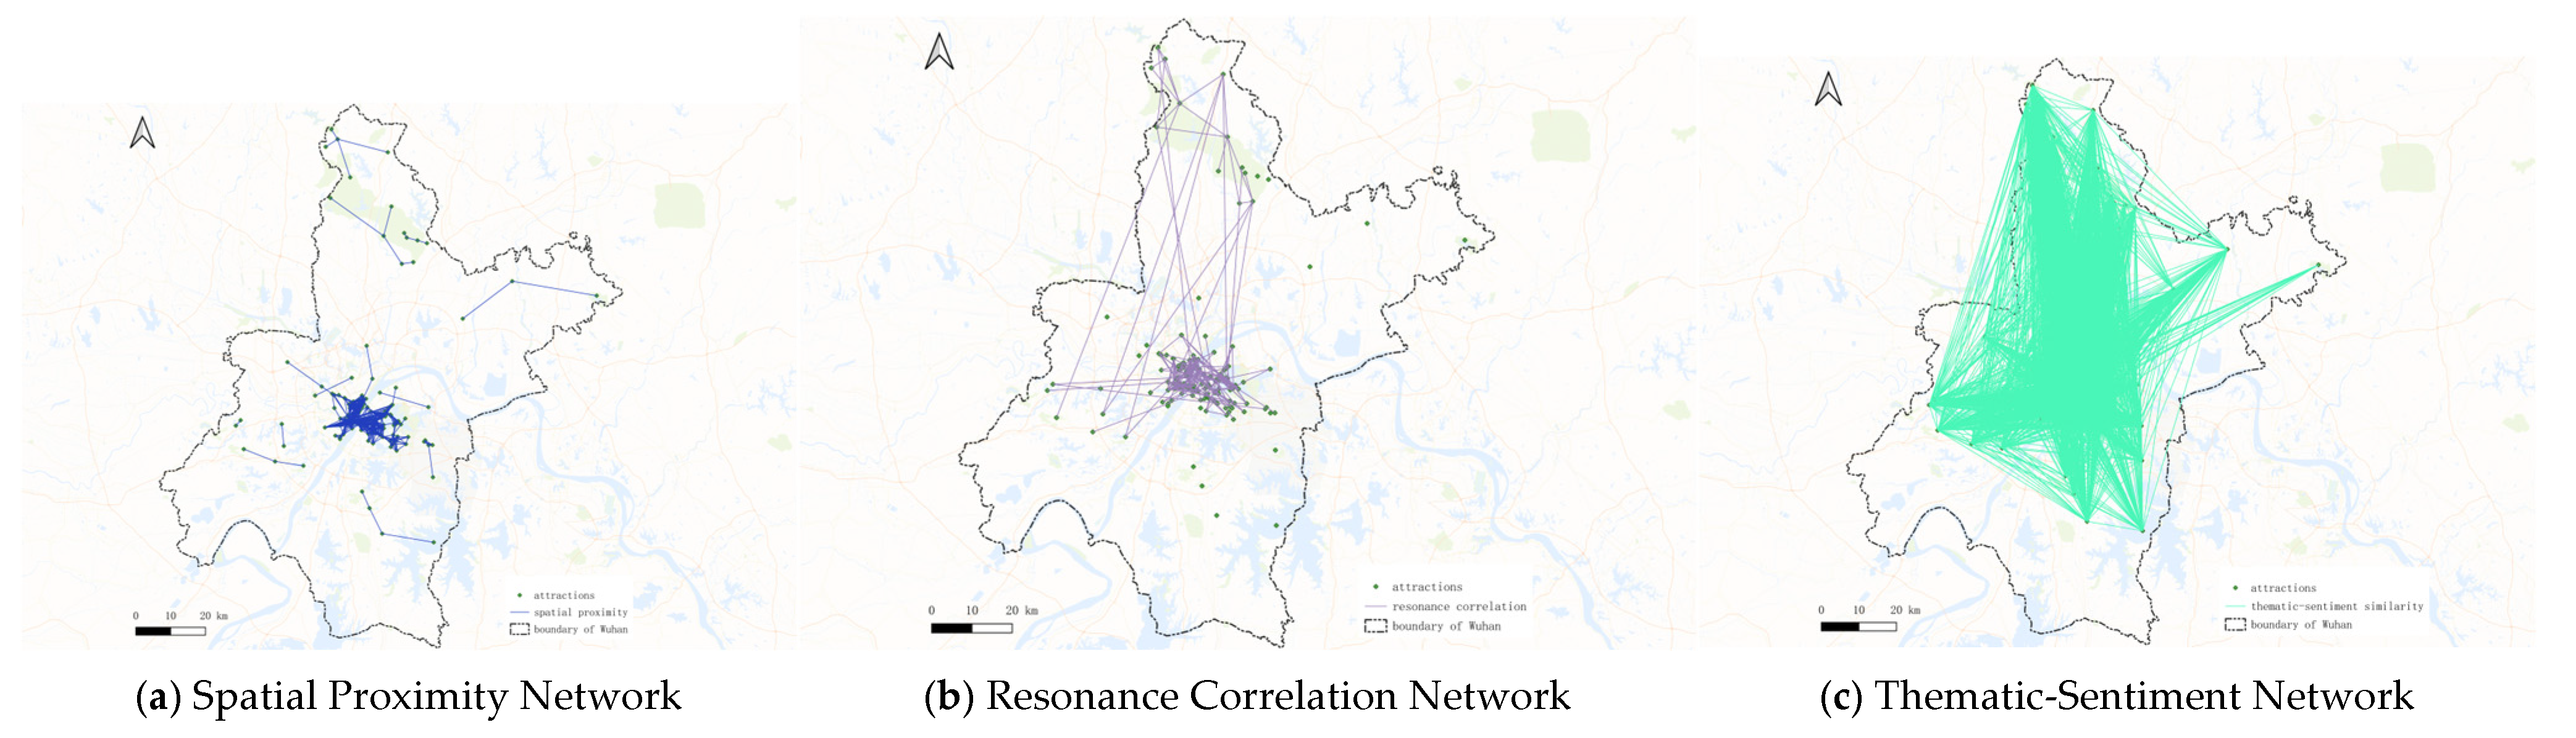
Within the Multidimensional Associative Network (MAN-SRT), the spatial proximity network, resonance correlation network, and Thematic Sentiment Network interlace via their unique structural features and functional properties, engendering a notable synergy.
Figure 10 delineates the network topology across these dimensions. The spatial proximity network, characterized by SP edge weights, encapsulates spatial clustering tendencies constrained by geographic distances. The resonance coherence network, defined by RC edge weights, reflects cross-regional semantic linkages derived from tourists’ cognitive associations. The thematic sentiment network, quantified through TS edge weights, elucidates thematic similarities driven by affective dynamics.
To demonstrate the morphological heterogeneity and functional complementarity of the multidimensional network, we performed a structural analysis on the three thematic layers of attraction associations (
Table 4). Fundamental metrics (such as edge density and average path length) quantify network connectivity efficiency, thereby indicating the level of regional tourism integration. Centrality indices identify key hubs and core attractions, while modularity scores assess the statistical significance of functional communities, uncovering emergent spatial or semantic groupings within the tourism network. For each dimensional layer, we derived a composite influence score for each attraction through a weighted aggregation of multiple centrality measures. Subsequent structural analysis was conducted to further interpret the topological characteristics and functional roles of each network dimension.
- (1)
Spatial Proximity Network
In
Figure 10a, the spatial proximity network primarily captures the geographical accessibility among attractions, reflecting tourists’ propensity to select travel routes based on transportation convenience and road distances.
Table 5 identifies the top 10 attractions based on composite influence scores within the spatial proximity network. Hongshan Square leads with a score of 0.7257, underscoring its role as a pivotal hub node. It also functions as an interchange station for Metro Lines 2 and 4, positioning it as a critical transportation nexus in urban infrastructure. The majority of these top 10 attractions are concentrated in the central urban district and distributed along the banks of the Yangtze River, corroborating the influence of the “confluence of two rivers” geographic configuration on the spatial organization of tourism activities [
48].
The spatial proximity network exhibits high modularity and global clustering coefficients, indicative of multiple distinct communities wherein attractions display robust internal connections, indicative of localized clustering phenomena. However, with a low average degree of centrality and a high network diameter, including 12 connected subgraphs, this network shows considerable dispersion, as most attractions are linked to only a few neighboring locations. The extensive geographical spread of Wuhan imposes constraints on the accuracy of tourism behavior modeling through route planning based on road network distances.
- (2)
Resonance Correlation Network
Figure 10b depicts the resonance correlation network, illustrating the semantic co-occurrence relations and tourists’ subjective cognitive associations among attractions, thereby revealing tourists’ mental perceptions of these sites.
Table 6 highlights the top 10 attractions by composite influence within this network. Hankou Riverside tops the list with a score of 0.6993, establishing itself as a pivotal node in the resonance correlation network. As a critical component of Wuhan’s riverside scenic belt, it serves both as a favored recreational area for residents and the primary choice for tourists seeking to experience the city’s urban charm. East Lake, scoring 0.5984, ranks second, renowned for its expansive lake and picturesque landscapes, while also being steeped in cultural heritage, including landmarks like the Qu Yuan Shrine and Chu Tian Terrace, underscoring its significance in tourist experiences. Jianghan Road Pedestrian Street, positioned third, emphasizes its role as the heart of Wuhan’s commercial center.
The resonance coherence network exhibits high modularity but low global clustering coefficients, suggesting pronounced community structures with weak internal connectivity and minimal inter-community links, manifesting a notable “semantic isolation”. This indicates that attractions with resonance and coherence connections form distinct semantic clusters. Extremely low average degree centrality and long average shortest path lengths signify a loosely connected network with inefficient information dissemination, severely limiting its utility for broad recommendation systems or path planning tasks.
- (3)
Thematic Sentiment Network
In
Figure 10c, the thematic sentiment network underscores thematic coherence and emotional resonance among attractions, emphasizing the continuity and coherence of tourists’ emotional experiences.
Table 7 identifies the top 10 attractions based on composite influence within this network. Wuhan Garden Expo Park, Hankou Riverside, and Zhongshan Park rank prominently due to their multidimensional thematic and emotional representations. High rankings of sites like Jiuzhen Mountain and Happy Jungle Cherry Blossom Theme Park indicate a prevalence of natural landscapes and leisure activities as dominant themes across Wuhan. Nevertheless, attractions such as Jiuzhen Mountain, Jinligou, and Yaojia Mountain, owing to their remote geographical locations, may not be ideal candidates for unconditional inclusion in tourism route recommendations. Thus, while thematic sentiment connections effectively capture experiential consistency among attractions, they should not serve as the sole criterion for tourism route planning.
High average degree centrality and global clustering coefficients, combined with exceptionally short average shortest path lengths, demonstrate a densely interconnected network structure. Low modularity and degree distribution power-law exponents indicate ambiguous community boundaries, characterized by substantial overlap and thematic–emotional similarities across attractions, with indistinct divisions between thematic categories.
A comparative structural analysis of the three networks reveals several key insights. The spatial proximity network demonstrates limited connectivity, constraining its applicability in modeling cross-regional tourist behavior. While the resonance correlation network captures subjective cognitive patterns among tourists, its sparse connectivity hampers performance in large-scale recommendation tasks. Conversely, the thematic sentiment network excels in generating immersive and emotionally coherent travel routes, offering distinct advantages in affective sequence modeling and personalized recommendation systems.
Notably, the geographic constraints embedded in the spatial proximity network provide a foundational framework for the resonance correlation network, ensuring that cognitive associations remain grounded in real-world transportation feasibility. Furthermore, the high connectivity of the thematic sentiment network effectively bridges the 12 disconnected subgraphs identified in the spatial proximity network through thematic–emotional similarity, thereby introducing affective drivers into cross-regional route formation. Crucially, the interplay between the resonance correlation network’s individual-level cognitive preferences and the thematic sentiment network’s population-level emotional consensus establishes a complementary micro–macro analytical framework. This dual-perspective integration facilitates group-aware path planning that harmonizes individual behavioral tendencies with collective experiential trends. Accordingly, the development of a multi-dimensionally driven tourism emotion system offers significant potential for enhancing tourist experiences while optimizing resource allocation across tourism destinations.


