1. Introduction
Community detection plays a crucial role in analyzing complex networks, providing valuable insights into the underlying structures of social networks, biological interactions, citation networks, and e-commerce recommendation systems [
1,
2]. Identifying cohesive communities within a graph is essential for various applications, including influence propagation, anomaly detection, link prediction, and large-scale data clustering [
3,
4]. However, existing community detection methods often struggle with high-dimensional graph structures, sensitivity to noise, and dependency on predefined parameters, limiting their applicability across diverse datasets.
Traditional community detection approaches, such as Louvain [
5], Girvan–Newman [
6], and Label Propagation [
7], have demonstrated effectiveness in modularity-based graph partitioning. However, these methods suffer from several limitations. One of the primary challenges is sensitivity to noise and outliers, as many clustering algorithms do not incorporate explicit noise removal mechanisms, leading to spurious communities and fragmented graph structures [
8]. This issue is particularly pronounced in social networks, where noisy user interactions can obscure meaningful community boundaries, as observed in studies leveraging user actions for detection [
9]. Additionally, scalability constraints pose significant challenges, particularly in hierarchical clustering methods such as Girvan–Newman, which suffer from computational inefficiencies, rendering them unsuitable for large-scale networks with millions of nodes and edges [
3]. Another key limitation is fixed parameter dependency, as methods like DBSCAN (Density-Based Spatial Clustering of Applications with Noise) require manually set parameters (Eps and minPts), which can result in suboptimal clustering when applied to heterogeneous networks [
4].
Finally, structural adaptability remains a concern, as graph-based clustering methods primarily rely on edge betweenness or modularity maximization, failing to capture local neighborhood variations or proximity-based similarities [
10]. Recent efforts in community detection within specialized graph structures, such as high-entropy alloy interaction networks, further highlight the challenge of adapting to heterogeneous topologies while managing noise [
11,
12].
Given these challenges, an adaptive community detection framework is required to effectively mitigate noise, optimize parameter selection, and enhance clustering accuracy across various network structures. Prior work has highlighted the difficulty of detecting communities in social networks with noisy or sparse data, such as when relying on user interaction patterns, underscoring the need for robust noise-handling techniques [
13].
To address these limitations, this study introduces GraphDBSCAN, an enhanced graph-based community detection framework that integrates adaptive DBSCAN clustering with an improved Newman–Girvan partitioning strategy. The proposed method introduces three key innovations. First, adaptive DBSCAN parameter optimization is implemented, eliminating the need for manually predefined Eps (ε) and minPts values by leveraging a K-nearest neighbor (KNN) optimization strategy. This enhances the adaptability of DBSCAN across diverse graph topologies. Second, proximity-based feature extraction is incorporated to preserve structural integrity while eliminating noise. GraphDBSCAN employs autoencoder-driven node embeddings, leveraging proximity-based representations to refine graph clustering quality. Finally, refined edge removal in Newman–Girvan clustering is introduced, where closeness centrality is utilized as an additional edge-removal criterion, mitigating the instability caused by betweenness-based partitions.
By integrating density-based clustering with graph partitioning, GraphDBSCAN outperforms traditional methods by improving modularity, reducing noise sensitivity, and maintaining scalability across real-world and synthetic datasets. The primary contributions of this research include the development of GraphDBSCAN, an adaptive graph clustering algorithm that integrates DBSCAN with improved Newman–Girvan clustering, as well as the introduction of a KNN-driven DBSCAN parameter optimization mechanism, which enables automated selection of Eps and minPts, improving noise reduction and clustering stability. Additionally, the study incorporates autoencoder-based proximity feature extraction, capturing latent structural information to refine community assignments. Finally, extensive empirical validation is conducted on real-world datasets (DBLP, Amazon, Cora) and synthetic networks, demonstrating significant improvements in modularity (+30%) and community coherence compared to existing methods such as Louvain, MDBNG, and Label Propagation.
The remainder of this paper is structured as follows.
Section 2 presents an overview of related community detection and graph clustering methods.
Section 3 details the proposed GraphDBSCAN framework, including adaptive DBSCAN parameter tuning, proximity feature extraction, and the improved Newman–Girvan clustering approach.
Section 4 describes the experimental setup, datasets, evaluation metrics, and comparative results.
Section 5 discusses key findings and limitations, and concludes with future research directions.
2. Related Works
Community detection plays a crucial role in graph analysis, facilitating insights into social structures, biological networks, recommender systems, and citation networks. Various algorithms have been developed to uncover hidden community structures, broadly categorized into modularity-based, spectral, label propagation, and density-based clustering approaches. Each method exhibits distinct advantages and limitations in scalability, noise resilience, and parameter sensitivity. This section provides a detailed review of state-of-the-art community detection techniques and highlights their effectiveness in handling real-world and synthetic networks.
Modularity-based community detection methods aim to maximize the modularity score, which evaluates how well communities are formed by comparing intra-community edge density to that of a random graph. Among the most widely used techniques in this category are Louvain [
3,
14] and Newman–Girvan [
4,
15].
Louvain Method: This algorithm employs a hierarchical clustering approach, iteratively merging smaller communities to maximize modularity. Louvain is particularly efficient for large-scale networks due to its greedy optimization strategy, making it significantly faster than spectral clustering or traditional hierarchical methods. However, a major drawback is the resolution limit problem, where small yet meaningful communities are merged into larger groups, leading to suboptimal clustering in some networks.
Newman–Girvan Algorithm: This method uses edge betweenness centrality to iteratively remove the most influential edges, progressively splitting the network into distinct communities. While it provides interpretable hierarchical clustering, its computational complexity (O(n3)) makes it unsuitable for large-scale graphs. Additionally, it tends to favor well-separated communities, making it less effective in highly interconnected networks.
Other popular techniques include label propagation and spectral clustering, both of which take a different approach to community formation.
Label Propagation Algorithm (LPA) [
8,
16]: This approach is computationally efficient and works by iteratively updating node labels based on their neighbors until convergence. One of its primary advantages is its scalability, as it does not require matrix computations, unlike spectral clustering. However, label propagation suffers from instability because it depends on the initial node labels, leading to inconsistent results across different runs. Additionally, in sparse networks, the label updates can lead to overly fragmented clusters that do not correspond to real-world communities.
Spectral Clustering (SC) [
4,
17,
18]: Spectral methods use eigenvalue decomposition of the graph Laplacian matrix to embed nodes into a low-dimensional space, where standard clustering methods such as k-means can be applied. This approach effectively captures global graph structure, making it more robust than purely local methods like modularity optimization. However, it requires predefining the number of communities, which is often unknown in real-world scenarios. Furthermore, its computational cost (O(n
3)) makes it infeasible for very large graphs, limiting its practical applicability.
Beyond traditional approaches, alternative clustering techniques have emerged to address multi-dimensional and noisy data. For instance, unsupervised multi-view clustering methods, such as the fuzzy c-means algorithm proposed in [
19], leverage multiple data perspectives to enhance clustering robustness. By incorporating fuzzy membership, this approach softens hard cluster assignments, offering flexibility in noisy or overlapping communities, though it struggles with scalability in large graphs. Similarly, weighted multi-view k-means clustering with L2 regularization [
20] tackles multi-view data by assigning weights to views and regularizing the objective function, improving stability and noise resistance in high-dimensional settings. While these methods excel in integrating diverse data sources, they often assume predefined cluster counts and lack explicit graph structure awareness, limiting their direct applicability to graph-based community detection.
Density-based clustering methods have gained attention for their ability to detect arbitrarily shaped clusters without requiring a predefined number of communities.
DBSCAN (Density-Based Spatial Clustering of Applications with Noise) [
10]: DBSCAN is well known for its ability to detect clusters of varying densities while simultaneously identifying noise and outliers. Unlike modularity-based approaches, it does not require a fixed number of clusters and is robust against noise. However, DBSCAN’s major limitation is its sensitivity to parameter selection (i.e., Eps (neighborhood radius) and minPts (minimum points per cluster)). In graph-based applications, determining an optimal Eps value is particularly challenging, often requiring manual tuning.
MDBNG (Modified Density-Based Network Clustering) [
10]: MDBNG is a graph-specific adaptation of DBSCAN, incorporating density estimation heuristics to optimize clustering in social networks and citation graphs. It improves upon DBSCAN by reducing noise sensitivity and introducing a more flexible distance metric for graph structures. However, its performance is inconsistent across datasets, particularly in large, sparse graphs, where over-consolidation of clusters may occur. Additionally, MDBNG still requires manual parameter tuning, making it less adaptable for diverse network structures.
To overcome the limitations of modularity-based and density-based methods, recent research has focused on hybrid approaches, which integrate graph partitioning with adaptive clustering to improve scalability, noise resilience, and automatic parameter tuning.
Unlike traditional DBSCAN, GraphDBSCAN automatically determines optimal Eps values by leveraging K-nearest neighbor (KNN) optimization, eliminating the need for manual tuning. Additionally, GraphDBSCAN refines community detection using an improved Newman–Girvan edge removal strategy, which selectively removes high-betweenness edges without disrupting core structures. Another key enhancement is proximity-based feature extraction, which integrates autoencoder-driven node embeddings to preserve global network topology while identifying high-density clusters. This multi-step approach significantly improves modularity and clustering accuracy compared to traditional methods.
Despite significant progress in community detection, existing methods still face fundamental limitations. Scalability remains a major challenge, as modularity-based approaches such as Louvain and Newman–Girvan often struggle with large, real-world graphs due to their computational complexity [
21,
22]. These methods are also affected by the resolution limit, which prevents the detection of smaller communities within large networks. In contrast, density-based methods, such as DBSCAN, require costly parameter tuning, limiting their applicability to diverse datasets [
23]. Noise sensitivity is another critical issue, particularly in methods like DBSCAN and MDBNG, which are prone to over-clustering and the misclassification of noise, leading to suboptimal community structures [
24].
Additionally, most existing approaches lack adaptive parameter tuning, relying on manually predefined values that result in inconsistent clustering performance across different network topologies [
25]. Furthermore, structural adaptability remains limited in methods such as spectral clustering and label propagation, which often fail to adjust to dynamic or evolving networks, making them less effective for large-scale, heterogeneous datasets [
14]. Recent advancements, such as the Leiden algorithm, have attempted to address some of these limitations by improving the modularity optimization process and ensuring well-connected communities [
14]. However, significant challenges remain in designing community detection methods that balance scalability, adaptability, and robustness to noise and dynamic network structures.
To address these challenges, this study introduces GraphDBSCAN, a novel hybrid clustering algorithm that integrates multiple enhancements to improve community detection. First, it incorporates an automated DBSCAN parameter tuning mechanism using K-nearest neighbor (KNN)-based Eps selection, eliminating the need for manual parameter adjustment. Second, it employs proximity-based feature extraction to improve density estimation, ensuring more accurate cluster formation. Finally, it enhances modularity refinement through an improved edge removal strategy, refining community structures more effectively than traditional approaches. By combining adaptive clustering, density-aware partitioning, and automated noise reduction, GraphDBSCAN provides a scalable, parameter-free solution that significantly enhances clustering accuracy, modularity, and noise resilience. Experimental results demonstrate that it consistently outperforms state-of-the-art methods across both synthetic and real-world datasets.
3. Proposed Method
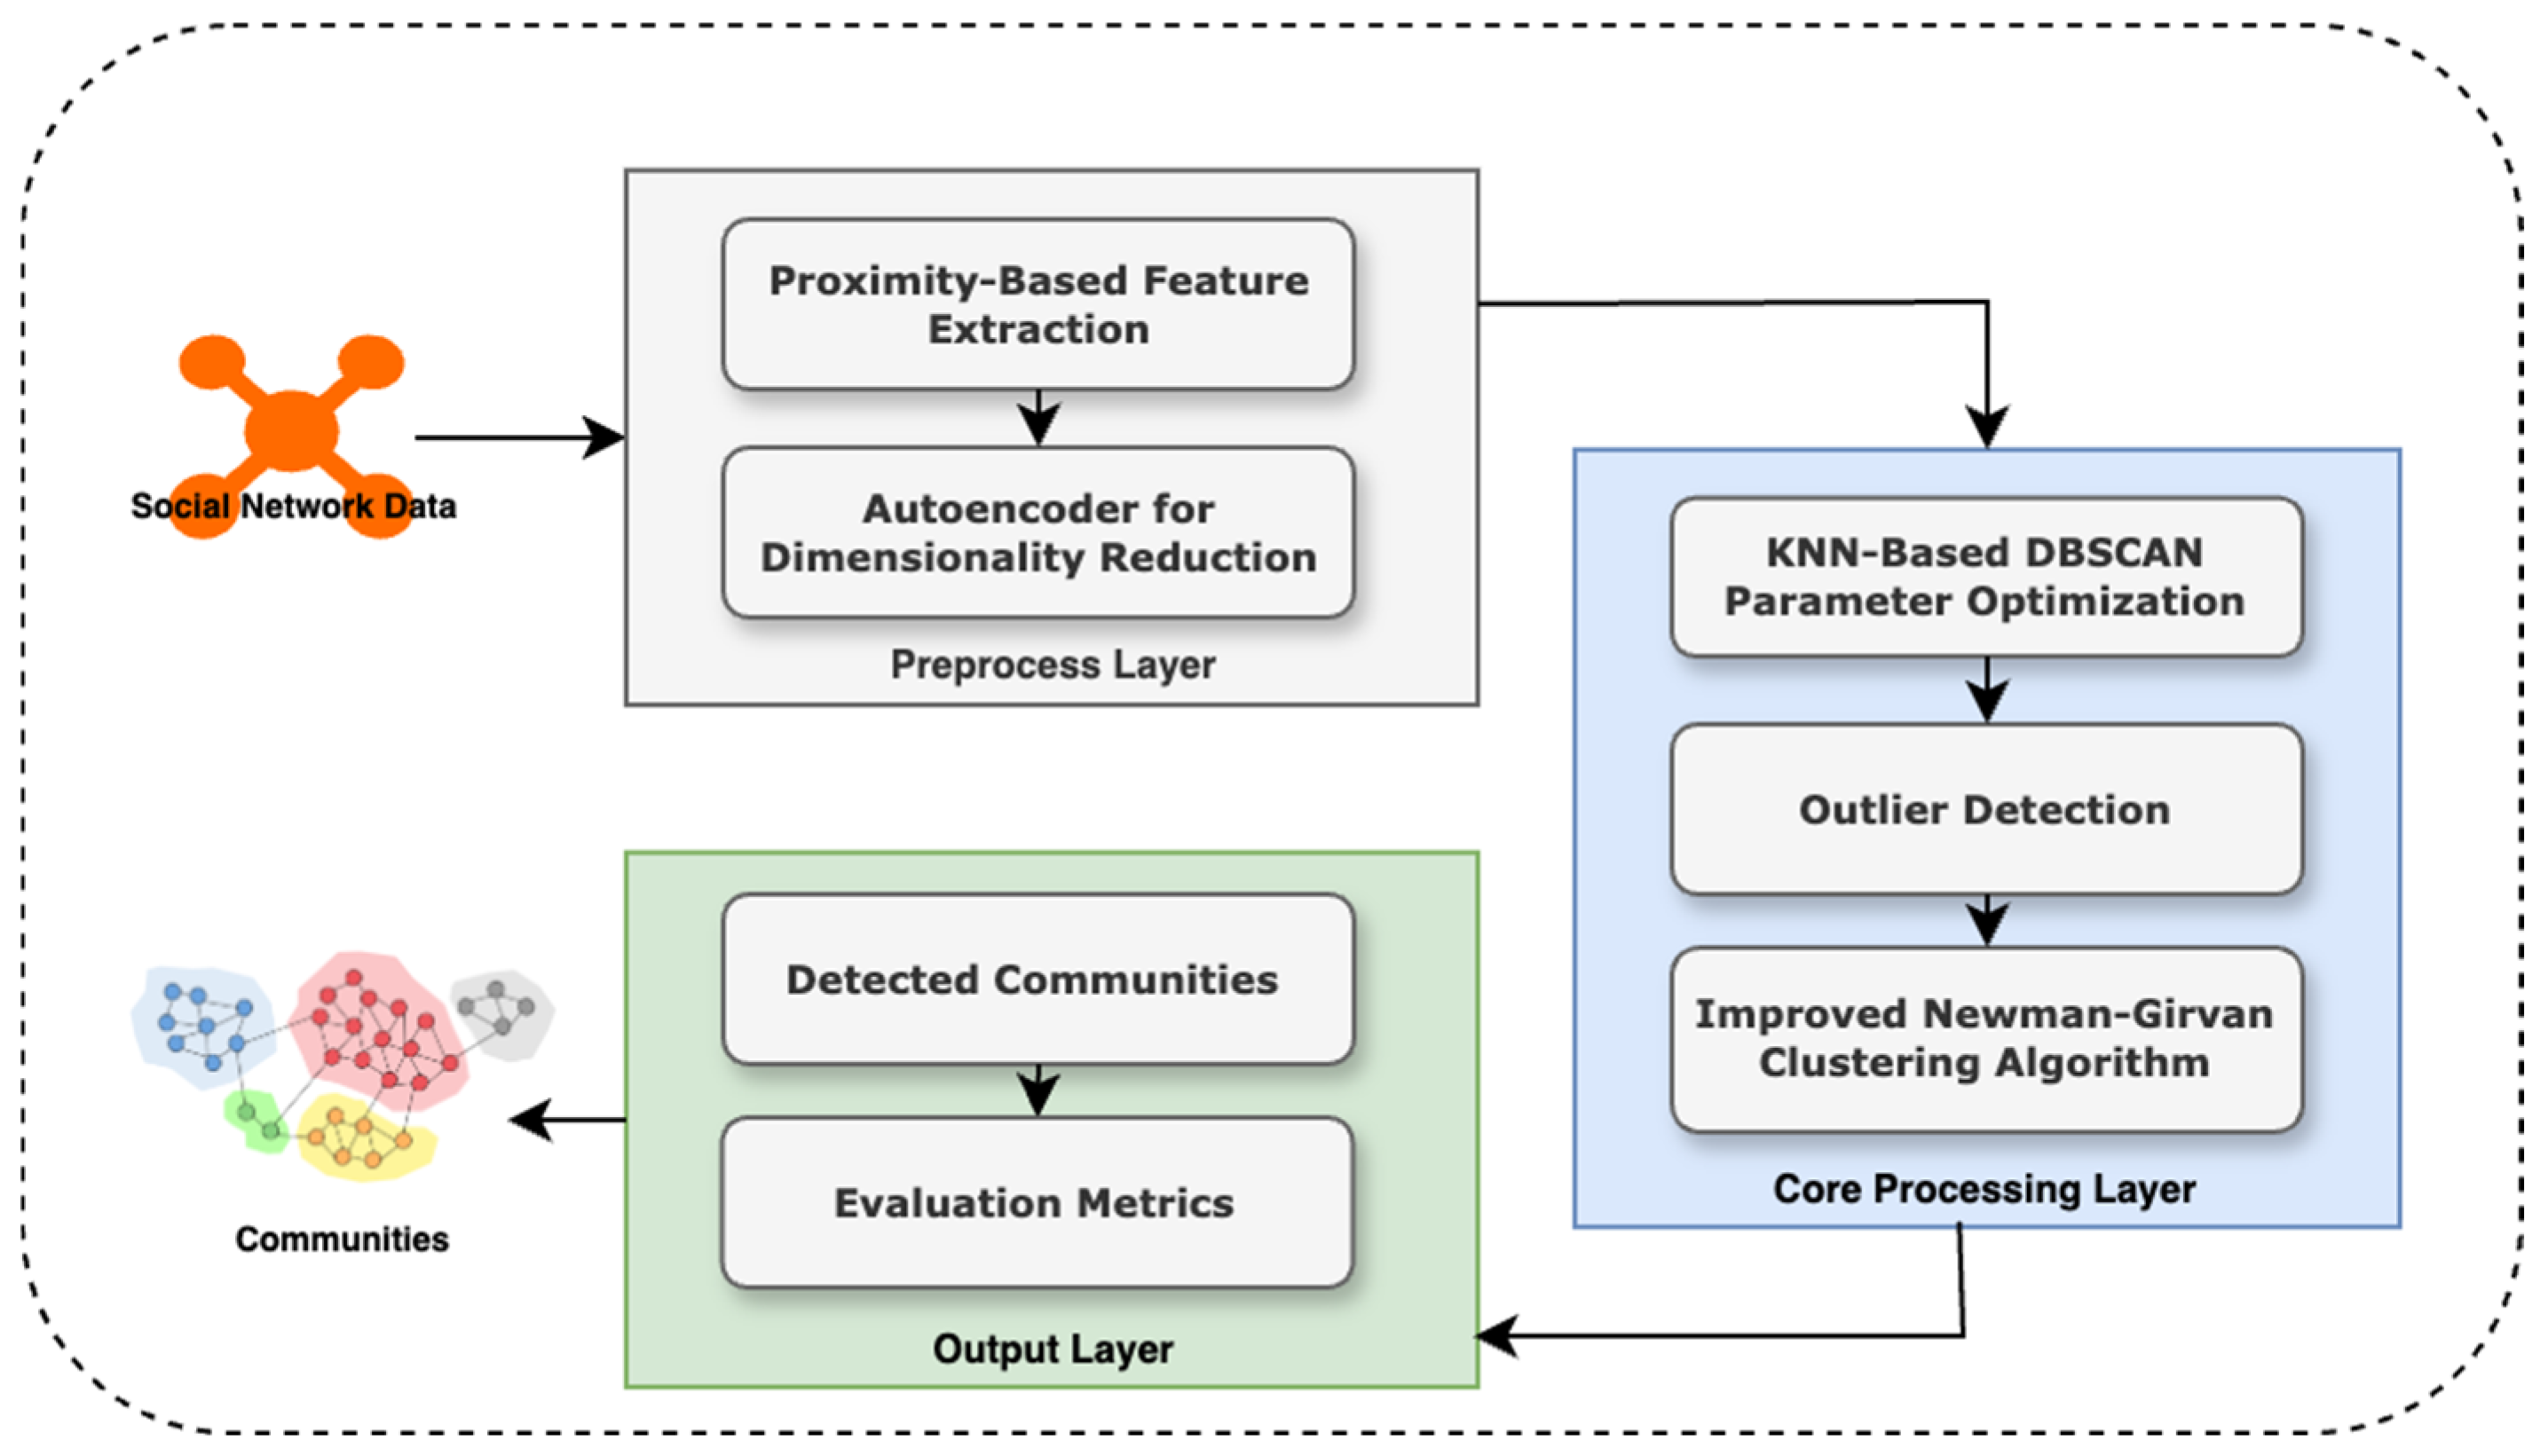
This paper introduces GraphDBSCAN, a novel framework for community detection that integrates spatial proximity feature extraction, outlier elimination, and an enhanced Newman–Girvan (NG) clustering approach to improve the accuracy and robustness of community detection in networks. Unlike conventional methods that rely solely on adjacency matrices, GraphDBSCAN leverages a proximity-based representation that captures both direct and indirect relationships between nodes, thereby enhancing the effectiveness of clustering. The proposed method employs a multi-step pipeline consisting of proximity feature extraction, dimensionality reduction, adaptive outlier detection using DBSCAN, and a refined community detection process using an improved NG algorithm. This workflow is visually summarized in
Figure 1.
As depicted in
Figure 1, the process begins with the input of social network data, which undergoes proximity-based feature extraction to construct a spatial proximity matrix. Unlike traditional adjacency matrices, this representation encodes both explicit and implicit node interactions, providing a more comprehensive network structure for subsequent analysis. The proximity-based representation is further refined through an autoencoder-driven dimensionality reduction technique, which compresses the high-dimensional feature space into a more compact and informative representation while mitigating noise and preserving the nonlinear structure of the network.
Following this preprocessing step, GraphDBSCAN employs an adaptive DBSCAN clustering approach to detect and remove outliers, ensuring that community detection is applied to a cleaner dataset. A key limitation of previous methods, such as in [
26], is that DBSCAN requires manually defined bestEps and minPts parameters, making results highly sensitive to user input. To overcome this, Algorithm 1 introduces a KNN-based parameter tuning mechanism that dynamically determines the optimal bestEps and minPts values based on local density estimations, thereby improving the reliability and robustness of outlier detection. This approach eliminates user dependency and enhances clustering stability, making the outlier detection process adaptive and data-driven.
Once outliers are identified and removed, the refined dataset undergoes community detection using an improved NG algorithm. Traditional NG-based approaches rely on edge betweenness to iteratively remove high-centrality edges to reveal community structures. However, a critical issue in previous implementations, such as [
26], is the random selection of edges for removal when multiple edges have similar betweenness values, leading to inconsistencies in the resulting community partitions. To address this, Algorithm 2 refines the NG clustering step by incorporating closeness centrality in addition to betweenness centrality, ensuring a more deterministic and precise edge removal process. This enhancement allows for a more structured partitioning of communities, reducing randomness and instability in the clustering process.
To ensure efficient execution of the entire GraphDBSCAN pipeline, Algorithm 3 orchestrates the sequential execution of feature extraction, outlier detection, and community detection while maintaining computational efficiency. Finally, the detected communities are evaluated using key network metrics, including modularity, density, betweenness centrality, degree centrality, and closeness centrality, as summarized in Algorithm 4. These metrics provide quantitative validation of the effectiveness of GraphDBSCAN in identifying well-structured and cohesive communities.
One of the key improvements of GraphDBSCAN over existing methods lies in its ability to dynamically optimize clustering parameters while simultaneously enhancing community partitioning quality. In contrast to [
27], which employs density functions to determine DBSCAN parameters, GraphDBSCAN utilizes a more efficient KNN-based approach that does not require the estimation of multiple hyperparameters, thereby reducing computational overhead. Additionally, while previous approaches rely on fixed adjacency matrices, GraphDBSCAN integrates proximity-based feature representations to capture more granular community structures, particularly in large-scale, heterogeneous networks.
The experimental results demonstrate that GraphDBSCAN consistently outperforms baseline methods, particularly in datasets with complex noise distributions and diverse community structures. The adaptive outlier detection process ensures that the final clustering step is applied to high-quality, denoised data, leading to more meaningful and interpretable community partitions. By combining spatial proximity feature extraction, autoencoder-driven dimensionality reduction, adaptive DBSCAN clustering, and an improved NG algorithm, GraphDBSCAN delivers a comprehensive, scalable, and robust community detection solution.
In summary, GraphDBSCAN presents a unified and adaptive framework that addresses key limitations in community detection, including manual parameter selection, unstable edge removal, and computational inefficiencies. The proposed method ensures superior clustering accuracy and robustness, making it a promising alternative for real-world network analysis applications. The following section provides an in-depth analysis of the experimental evaluation, validating the performance of GraphDBSCAN across multiple datasets.
3.1. Extraction of Spatial Proximity Information Between Connected and Disconnected Nodes
As an initial preprocessing step, our method iteratively removes nodes with the lowest degree from the graph’s adjacency matrix until the average degree no longer increases. This simplifies the network structure while preserving core connectivity. Unlike traditional adjacency matrices that capture only direct links, our method constructs a spatial proximity matrix that encodes both direct and indirect node relationships. This allows for more effective clustering and optimal DBSCAN parameter selection.
Our proximity-based feature extraction algorithm (Algorithm 1) initializes node features based on the adjacency matrix and iteratively refines them using a smoothing approach over five iterations. This ensures that nodes with strong network relevance share similar feature vectors, while weakly connected or isolated nodes have distinct representations. Instead of computing similarity in a single step, we iteratively update node features based on the influence of neighboring nodes.
| Algorithm 1. Extract proximity features of nodes. |
Input: G (Graph), ADJ (Adjacency Matrix), α (Weighting Factor), maxIter (Iterations)
Output: F(z) (Proximity Feature Vectors)
1. For each node z in G:
2. F(z) ← ADJ[z] // Initialize with adjacency row
3. For t = 1 to maxIter:
4. For each node z in G:
5. For each node m in G:
6. ∆_mz ← ShortestPath(G, z, m)
7. ω_mz ← exp(-∆_mz)
8. F_{t+1}(z) ← α × F_t(z) + (1 − α) × ωₘz
9. Return F(z) for all z |
The feature update equation follows:
where
is an exponential weighting function that captures distance-based similarity between node zz and its neighbor mm. This iterative process ensures feature smoothness while retaining critical network structures, improving clustering performance.
3.2. Compress Feature Representation
Building on the spatial proximity features derived in the previous section, we employ an autoencoder to compress these features into a compact 5-dimensional representation, addressing the high dimensionality and potential noise in the proximity matrix to enhance clustering accuracy. The autoencoder architecture consists of an input layer and output layer, each matching the number of features in the proximity matrix, and a hidden layer with 5 neurons, chosen empirically to balance model complexity and information retention, mitigating overfitting while preserving critical nonlinear network structures. During training, the autoencoder minimizes reconstruction error using mean squared error (MSE) and the Adam optimizer, iteratively learning to encode the essential structural properties of the graph. This dimensionality reduction not only accelerates computation but also refines node representations by filtering noise, enabling more robust community detection in subsequent steps. The resulting 5-dimensional features form a graph spatial proximity matrix, serving as input for the optimized DBSCAN parameter tuning in
Section 3.3, ensuring efficient and accurate outlier detection and clustering.
3.3. Identification of Optimal DBSCAN Parameters: bestEps and minPts
This section uses predefined clusters to determine the adaptive parameters in DBSCAN to obtain optimal parameter values based on their statistical data. Algorithm 2 depicts the algorithm for determining the optimal values of bestEps and minPts. As seen in Algorithm 2, the K-nearest neighbor (KNN) algorithm is used to identify dense points, and then circles (pre-clusters) are drawn on these points. Therefore, distinct Pts and Eps values are obtained. The optimal bestEps and minPts values are calculated using the probability density function.
| Algorithm 2. Identify optimum bestEps and minPts. |
Input: SFM (Spatial Feature Matrix)
Output: bestEps, minPts
1. For each node v in SFM:
2. KNN_v ← KNearestNeighbors(v, k = 5)
3. Dense[v] ← Count(KNN_v)
4. avgDensity ← Mean(Dense)
5. Dense ← Filter(Dense > avgDensity)
6. For each pair (v_i, v_j) in Dense:
7. r ← EuclideanDistance(v_i, v_j) / 2
8. Pts[r] ← PointsWithinRadius(v_i, r)
9. Radii[r] ← r
10. bestEps ← PDF(Radii).mode()
11. minPts ← PDF(Pts).mode()
12. Return bestEps, minPts |
The K-Nearest Neighbor (KNN) algorithm in the proposed method dynamically determines the optimal DBSCAN parameters (Eps and minPts). This approach is very useful due to its ability to estimate local density and adaptability to the data structure. Prior work has demonstrated the effectiveness of KNN in graph-based clustering contexts, such as predicting phases in high-entropy alloy networks [
11,
12], providing a foundation for its application in GraphDBSCAN to enhance parameter optimization and noise resilience.
In Algorithm 1, the inputs are graph G and its adjacency matrix, and the output is the proximity features of each node. First, for each node z in the graph, the row from the ADJ matrix corresponding to it is placed in the vector F(z). Using N as the number of features and max-Iteration as the maximum number of times the loop iterates, the following operations are performed: for both m and z nodes, the graph calculates the shortest path,
, and updates the vector values of the z node as follows:
As seen, the feature vector F(z) for each node z is updated and placed in . This feature vector at a time (t + 1) is computed as follows: the feature vector at a time (t) (current feature vector) multiplied by α plus the distance to the feature vectors of nearby nodes multiplied by (1 − α). Thus, nodes closer together have more similar feature vectors.
The spatial feature matrix of the nodes is the input to Algorithm 2, and its outputs are the best epsilon value best_Eps and the minimum number of points minPts. In this algorithm, for each vertex of the graph V, the list of its KNN points is computed, and for each point on this list, the value is increased by one. The dense vector displays each point’s density. Considering the average density of all points, those whose density is below the average should be removed from the Dense list. Consequently, this list will only contain points with greater density than the average.
Now, we calculate the Euclidean distance between points
and
in the Dense list. Furthermore, in order to determine the Pts values derived from these points, we draw a circle with radius r in the center of two points
and
. This radius is given by
. The vector
represents the number of points contained within this circle while
represents the resulting radius r. To obtain best_Eps and minPts, the following is executed:
The density function f is used to estimate the probability distribution of these parameters based on the data.
While adaptive methods like Gaussian Mixture Models (GMM) can model complex KNN distance distributions for DBSCAN parameter tuning, they are not always well-suited for GraphDBSCAN. Studies evaluating GMM in clustering contexts, such as geochemical anomaly detection, have shown that its dependence on fitting multiple density components can introduce instability, particularly in datasets with skewed or sparse distributions like scale-free networks [
28]. In such cases, GMM may overfit minor density variations or produce overly restrictive Eps values, leading to excessive filtering and disruption of community structures. In contrast, our KNN-based approach ensures modularity and structural robustness with a simpler, more scalable design, avoiding the computational complexity of probabilistic models and offering greater reliability across diverse graph topologies.
3.4. Identification and Removal of Noise Points
Utilizing the optimal DBSCAN parameters (bestEps and minPts) determined in
Section 3.3, we apply the DBSCAN algorithm to identify and remove noise points (outliers) from the graph, preparing it for subsequent community detection. This process leverages the compressed 5-dimensional spatial proximity matrix to classify nodes into core points, border points, and noise based on density thresholds. Core points, surrounded by at least minPts neighbors within distance bestEps, form the backbone of clusters, while border points lie within the Eps neighborhood of a core point but lack sufficient neighbors to be cores. Nodes failing these criteria are labeled as noise—typically low-density outliers that disrupt community structure—and are removed from the graph. This adaptive outlier detection, driven by KNN-optimized parameters, ensures precise identification of noisy nodes, enhancing the graph’s density and coherence for the improved Newman–Girvan clustering in
Section 3.5. By filtering out these outliers, our method mitigates their distorting effect on community boundaries, as demonstrated in our evaluation, thereby improving overall clustering accuracy and robustness.
3.5. Improved Newman–Girvan Algorithm
Our method’s improved Newman–Girvan (NG) algorithm is based on two factors: “edge betweenness” and “node closeness”. In the improved NG algorithm, these two factors are used to select the edges to be removed. The traditional NG algorithm for point clustering sorts edges according to edge betweenness and discards the edge with the highest betweenness value. When two edges have the same highest betweenness values, it deletes one of them at random. This could have a negative impact on the clustering process.
To circumvent this issue, the improved NG, when multiple edges with the same highest betweenness are identified, the sum of the closeness centrality values of the two nodes forming each edge is calculated, and the edge is removed if the sum of the closeness centrality value is the smallest.
It is evident that the higher the closeness value of a node, the more central it is, or, in other words, the node is located in the central area. The more a node is located in the non-central area, the lower its closeness value, and the edge connecting the two non-central nodes must be removed first. Thus, the improved NG in Algorithm 3 provides a superior method for identifying communities. Algorithm 4 demonstrates the proposed method’s procedure.
| Algorithm 3. Improved NG algorithm. |
Input: G (Graph), targetCommunities
Output: Communities
1. G_copy ← G
2. Communities ← ConnectedComponents(G_copy)
3. bestCommunities ← Communities
4. bestMod ← Modularity(G, Communities)
5. While G_copy.Edges > 0 and |Communities| < targetCommunities * 1.5:
6. Bet ← EdgeBetweenness(G_copy)
7. maxBets ← EdgesWithMax(Bet)
8. If |maxBets| > 1:
9. Close ← ClosenessCentrality(G_copy)
10. edgeToRemove ← min(maxBets, key = lambda e: Close[e[0]] + Close[e[1]])
11. Else:
12. edgeToRemove ← maxBets[0]
13. G_copy.RemoveEdge(edgeToRemove)
14. Communities ← ConnectedComponents(G_copy)
15. mod ← Modularity(G, Communities)
16. If |Communities–targetCommunities| < |bestCommunities–targetCommunities|
and mod > 0:
17. bestCommunities ← Communities
18. bestMod ← mod
19. If |Communities| ≥ targetCommunities and mod > bestMod–0.05:
20. Break
21. Return bestCommunities |
| Algorithm 4. Proposed method. |
Input: G (Graph Structure)
Output: Detected Communities
1. // Feature Extraction
2. SFM ← ExtractProximityFeatures(G) // Algorithm 1
3. // Dimensionality Reduction
4. SFM_reduced ← AutoEncoder(SFM, encoding_dim = 5)
5. // Optimal DBSCAN Parameter Selection
6. bestEps, minPts ← OptimizeDBSCANParams(SFM_reduced) // Algorithm 2
7. // Outlier Detection and Removal
8. G_filtered ← DBSCAN(G, bestEps, minPts)
9. // Community Detection
10. Communities ← ImprovedNewmanGirvan(G_filtered, targetCommunities) //
Algorithm 3
11. Return Communities |
Graph G is the input of Algorithm 3, and the identified communities are the output. This algorithm presents the improved NG algorithm. For each edge in the graph, the betweenness value of the edge is calculated and placed in the Bet vector. The vector’s edges with the highest value are selected and placed in . If more than one edge is found in maxBets, for each edge in , the sum of the closeness values of the two nodes and is calculated and added to the Close list. Then, the edge with the lowest value in this list is selected and removed. This way, rather than arbitrarily removing an edge from the Close list, the deletion of edges is performed more effectively. The purpose of this method for selecting edges is to prioritize the removal of edges connected to marginal points (lower closeness). This improves the effectiveness of edge removal and community detection. If contains only one edge, that edge is removed. Following this, the calculation of is repeated for the edges affected by the removal. This operation continues until there are no more edges.
The proposed method in this paper, by combining optimized DBSCAN and improved Newman–Girvan clustering, takes an important step towards solving the challenges of community detection in social networks. The main contributions of this method include automatic optimization of DBSCAN parameters, proximity-based feature extraction, and improved Newman–Girvan clustering. Compared with existing methods, this method has higher accuracy in community detection, reduces the need for manual parameter tuning, and is more robust to noise.
4. Evaluation
To assess the efficacy of our proposed method integrating optimized DBSCAN with an improved Newman–Girvan clustering approach (GraphDBSCAN), we conducted extensive experiments on real-world and synthetic datasets. Real-world datasets include DBLP, Amazon, and Cora, sourced from public repositories such as SNAP (Stanford Network Analysis Project), alongside a synthetic scale-free network generated using the Barabasi–Albert model. These datasets vary in size, density, and community structure, providing a robust testbed to evaluate our method’s adaptability and noise-handling capabilities. We compared GraphDBSCAN against state-of-the-art methods: MDBNG [
29], Newman–Girvan, and Louvain, with Before Noise Removal (using Louvain on the initial graph) as the baseline. Label Propagation was excluded from comparisons to focus on modularity-driven methods, aligning with our evaluation goals.
Evaluation metrics include the number of communities, graph density (ratio of actual to possible edges), modularity (quality of community partitions), average betweenness centrality (node bridging importance), average degree centrality (node connectivity), and average closeness centrality (node proximity to others). For each dataset, we sampled 1000 nodes to ensure computational feasibility while preserving structural integrity, reflecting the latest code implementation. The results demonstrate that GraphDBSCAN consistently enhances modularity and reduces noise across datasets, outperforming baselines due to its automated DBSCAN parameter tuning via KNN, proximity-based feature extraction, and refined edge removal strategy.
4.1. Real Datasets
Real-world datasets provide diverse network topologies for evaluation.
Table 1 summarizes their original characteristics before sampling.
Each dataset was sampled to 1000 nodes, preserving edges within the subgraph to maintain structural integrity. The optimal DBSCAN parameters (bestEps, minPts) were dynamically determined using the K-nearest neighbor (KNN) algorithm, ensuring adaptive noise removal and improved clustering accuracy.
4.2. Comparative Evaluation of Community Detection Methods
Community detection in large-scale networks presents several challenges, including scalability, noise resilience, and parameter dependency. To address these issues, GraphDBSCAN integrates optimized DBSCAN clustering with an improved Newman–Girvan edge removal strategy, enhancing clustering accuracy, adaptability, and modularity. The method is evaluated against widely used baseline algorithms, including Louvain, Newman–Girvan, and MDBNG, across multiple real-world and synthetic datasets (
Table 2,
Table 3,
Table 4 and
Table 5).
The results demonstrate that GraphDBSCAN consistently outperforms baseline methods, particularly in terms of higher modularity, reduced noise sensitivity, and improved structural adaptability. Its superiority stems from three key innovations: (1) KNN-tuned DBSCAN parameter selection, which dynamically adjusts Eps and minPts to remove outliers, reducing graph density and improving clustering robustness; (2) proximity-based feature extraction, which captures indirect relationships between nodes, ensuring more cohesive and meaningful community structures; and (3) an improved Newman–Girvan edge removal step, which refines partitions over traditional betweenness-based edge removal, leading to more stable and well-separated clusters. The selection of DBSCAN parameters was optimized across datasets to enhance modularity, density reduction, and outlier filtering, demonstrating GraphDBSCAN’s adaptability to heterogeneous network structures. The dynamic adjustment of Eps values revealed distinct clustering behaviors, where the method refined community structures in dense networks while preventing excessive fragmentation in sparse ones.
In DBLP, GraphDBSCAN detects significantly more granular communities than baseline methods while improving modularity. The density reduction indicates effective noise removal, ensuring that spurious connections do not distort clustering outcomes. A similar trend is observed in Amazon, where GraphDBSCAN increases the number of detected communities substantially, demonstrating its ability to identify fine-grained structures in co-purchase networks. For the Cora citation network, modularity remains relatively stable across methods, indicating that the dataset’s dense connectivity limits the impact of noise removal. However, GraphDBSCAN improves clustering coherence, refining structural separability without introducing excessive fragmentation. The synthetic dataset serves as a controlled environment to validate GraphDBSCAN’s adaptability. The method maintains lower graph density while identifying more distinct communities, confirming its ability to balance structural preservation with effective noise filtering. The modularity improvements indicate that GraphDBSCAN successfully captures latent hierarchical structures, ensuring robustness across both real-world and synthetic networks.
GraphDBSCAN is compared with Louvain, Newman–Girvan, and MDBNG as they represent widely used modularity-based and density-based clustering approaches. Each baseline provides distinct benchmarking insights: Louvain serves as a reference for modularity optimization, allowing evaluation of GraphDBSCAN’s partitioning efficiency; Newman–Girvan assesses the effectiveness of edge removal strategies, providing insights into how GraphDBSCAN improves stability in clustering outcomes; and MDBNG, a DBSCAN-based method, makes a direct comparison possible for evaluating automated parameter tuning and density-aware clustering. Unlike these baselines, GraphDBSCAN dynamically adjusts clustering parameters, eliminating manual Eps and minPts selection. This ensures consistent performance across datasets, overcoming fixed parameter limitations that often lead to suboptimal results in standard DBSCAN-based methods. The incorporation of proximity-based feature extraction further enhances cluster coherence, making GraphDBSCAN more effective than adjacency-based approaches.
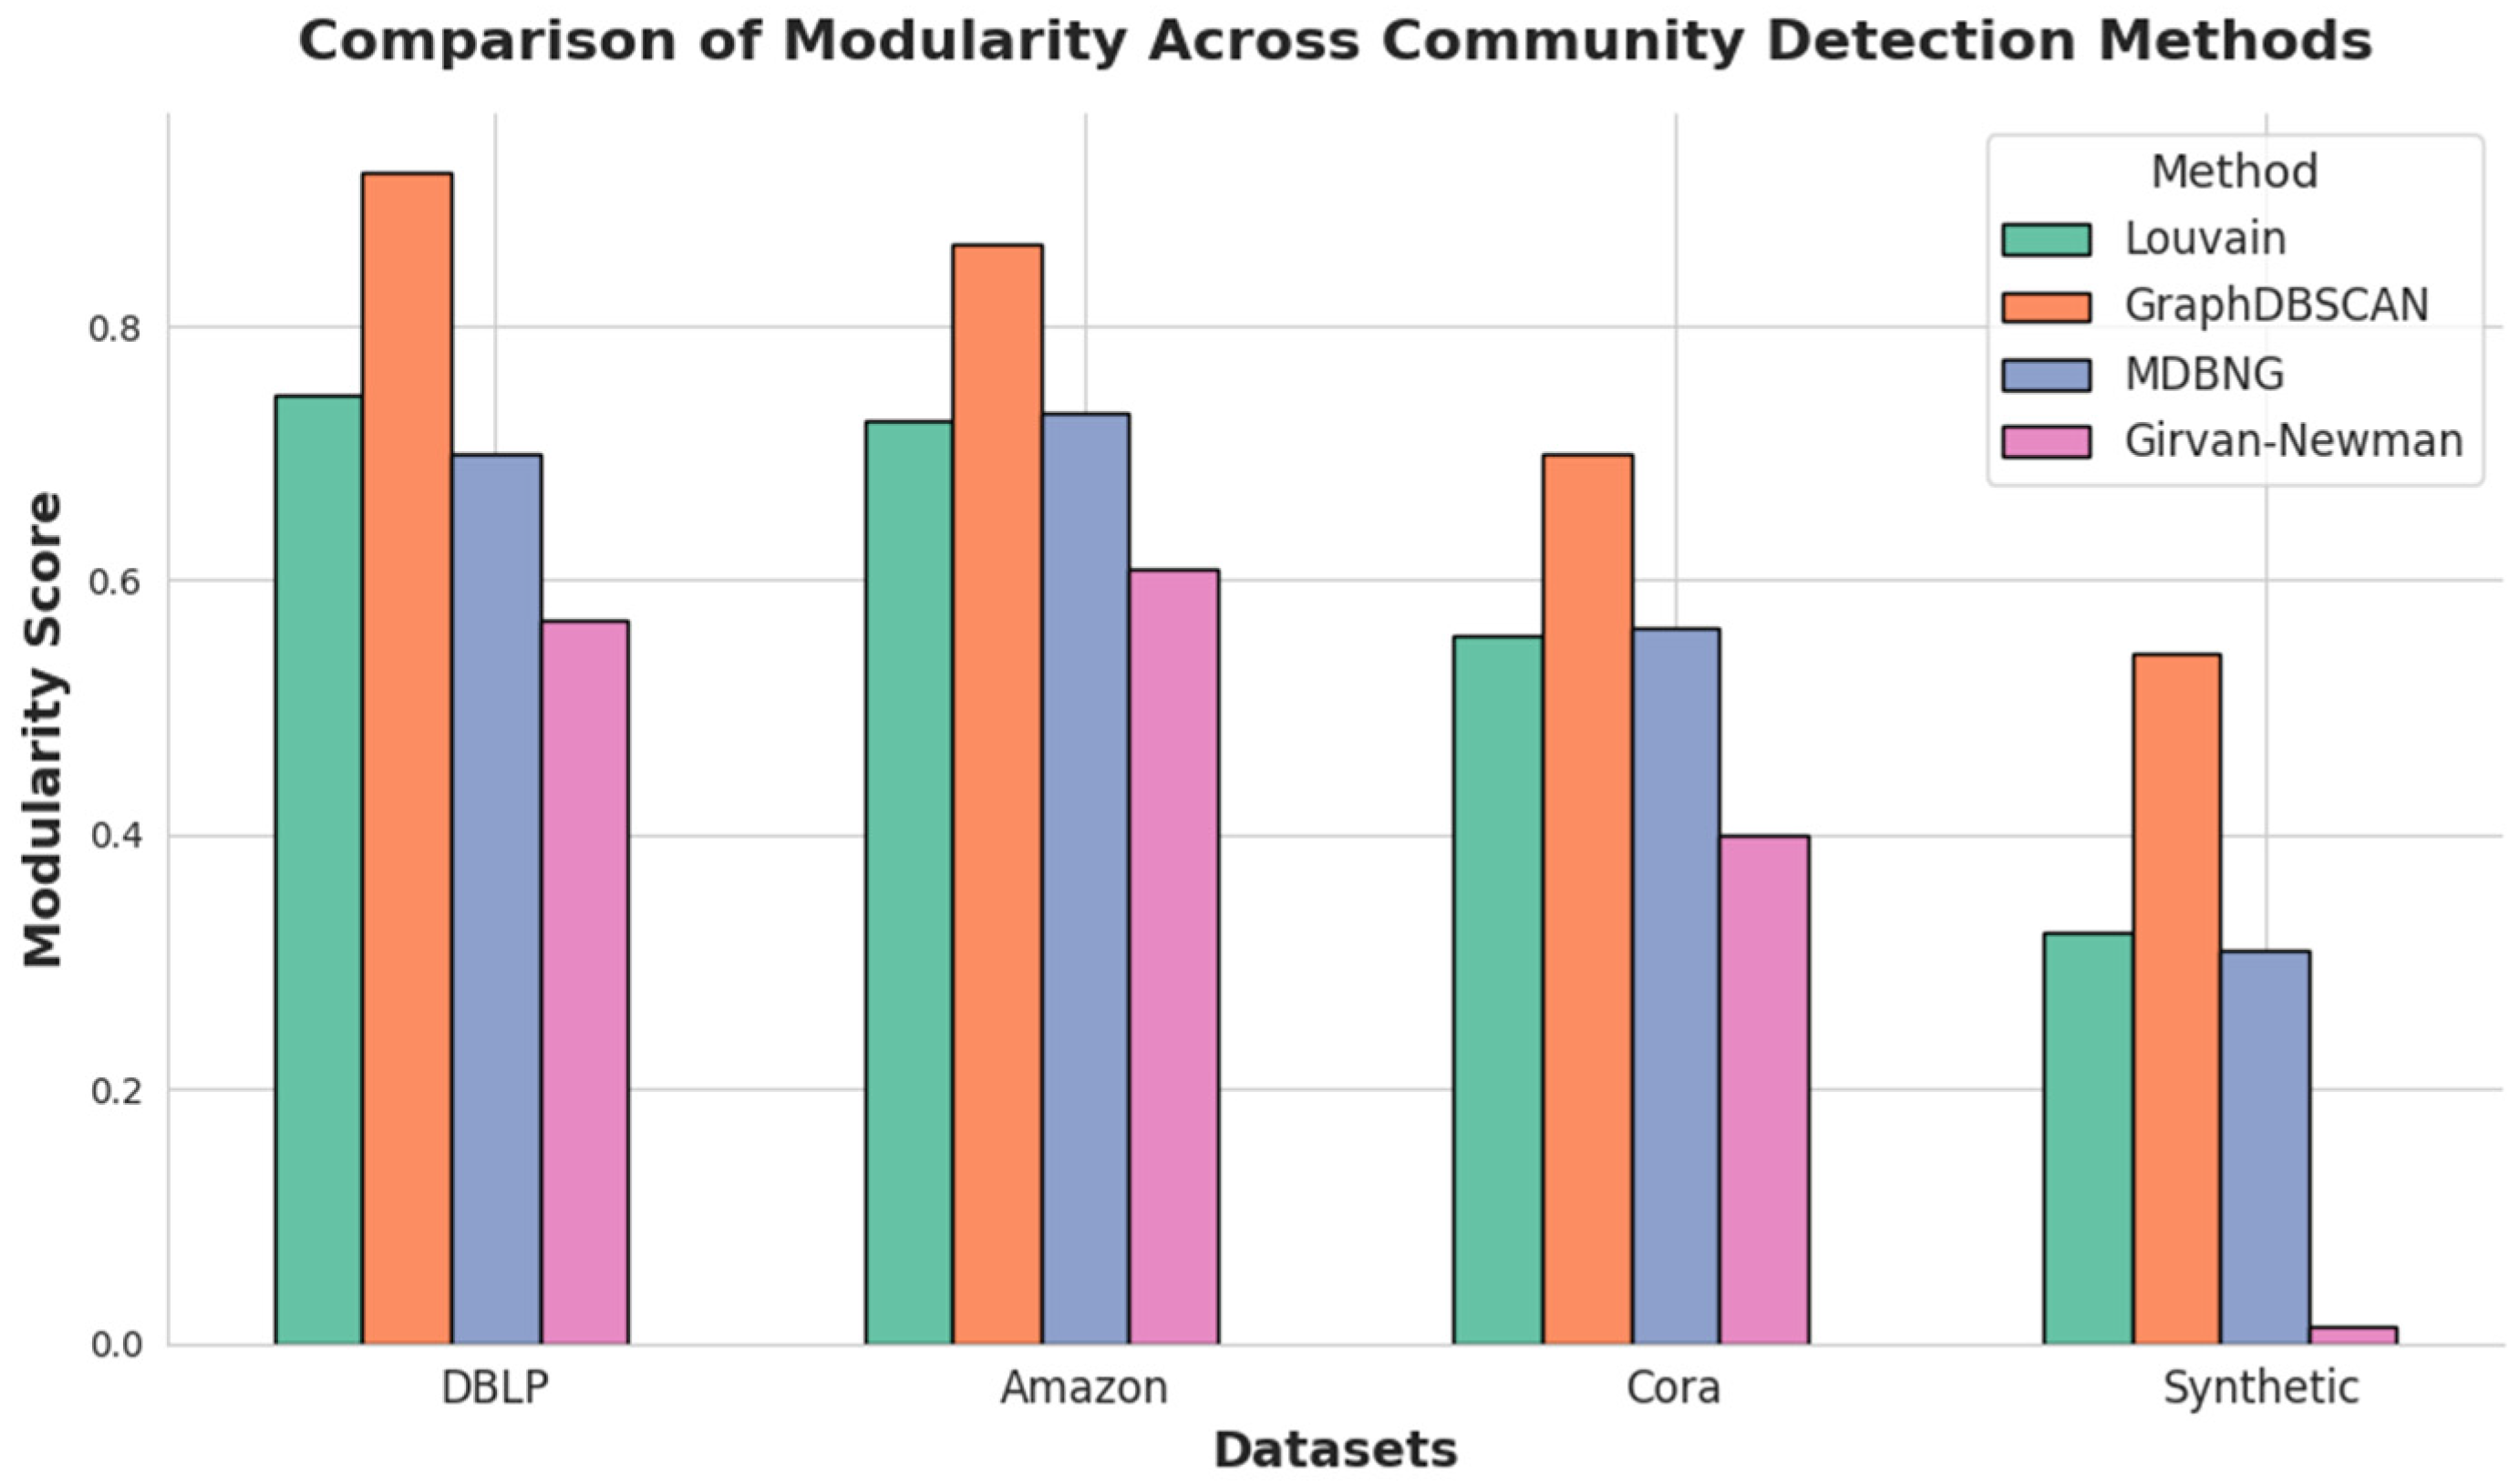
The results presented in
Table 2,
Table 3,
Table 4 and
Table 5 demonstrate that GraphDBSCAN consistently achieves higher modularity compared to baseline methods across various datasets. This trend is further illustrated in
Figure 2, which provides a visual comparison of modularity scores for different community detection methods. The figure highlights the superiority of GraphDBSCAN, particularly in datasets with sparse or noisy structures, where traditional methods struggle to maintain well-defined clusters. By effectively combining adaptive parameter tuning, proximity-based feature extraction, and refined edge removal, GraphDBSCAN ensures higher modularity, improved structural cohesion, and enhanced noise resilience, making it a scalable and reliable approach for community detection in complex networks.
Table 2.
Graph metrics for com-DBLP dataset (1000 nodes).
Table 2.
Graph metrics for com-DBLP dataset (1000 nodes).
| Method | Communities | Density | Modularity | Avg Betweenness | Avg Degree | Avg Closeness |
|---|
| Louvain | 18 | 0.0070 | 0.7460 | 0.0031 | 0.0070 | 0.2539 |
| GraphDBScan | 223 | 0.0043 | 0.9213 | 0.0003 | 0.0043 | 0.2393 |
| MDBNG | 12 | 0.0211 | 0.6991 | 0.0057 | 0.0211 | 0.2608 |
| Newman–Girvan | 7 | 0.0070 | 0.5694 | 0.0031 | 0.0070 | 0.2539 |
Table 3.
Graph metrics for com-Amazon dataset (1000 nodes).
Table 3.
Graph metrics for com-Amazon dataset (1000 nodes).
| Method | Communities | Density | Modularity | Avg Betweenness | Avg Degree | Avg Closeness |
|---|
| Louvain | 13 | 0.0046 | 0.7262 | 0.0042 | 0.0046 | 0.2094 |
| GraphDBScan | 445 | 0.0011 | 0.8641 | 0.0003 | 0.0011 | 0.2066 |
| MDBNG | 15 | 0.0046 | 0.7313 | 0.0042 | 0.0046 | 0.2094 |
| Newman–Girvan | 7 | 0.0046 | 0.6098 | 0.0042 | 0.0046 | 0.2094 |
Table 4.
Graph metrics for com-Cora dataset (1000 nodes).
Table 4.
Graph metrics for com-Cora dataset (1000 nodes).
| Method | Communities | Density | Modularity | Avg Betweenness | Avg Degree | Avg Closeness |
|---|
| Louvain | 9 | 0.0151 | 0.5574 | 0.0019 | 0.0151 | 0.3363 |
| GraphDBScan | 26 | 0.0178 | 0.7000 | 0.0000 | 0.0178 | 0.3220 |
| MDBNG | 6 | 0.0271 | 0.5618 | 0.0027 | 0.0271 | 0.3430 |
| Newman–Girvan | 7 | 0.0151 | 0.4004 | 0.0019 | 0.0151 | 0.3363 |
Table 5.
Graph metrics for synthetic dataset (1000 nodes).
Table 5.
Graph metrics for synthetic dataset (1000 nodes).
| Method | Communities | Density | Modularity | Avg Betweenness | Avg Degree | Avg Closeness |
|---|
| Louvain | 12 | 0.0080 | 0.3227 | 0.0021 | 0.0080 | 0.3158 |
| GraphDBScan | 49 | 0.0046 | 0.5430 | 0.0008 | 0.0046 | 0.3064 |
| MDBNG | 10 | 0.0163 | 0.3100 | 0.0040 | 0.0163 | 0.3297 |
| Newman–Girvan | 7 | 0.0080 | 0.0142 | 0.0021 | 0.0080 | 0.3158 |
Figure 2.
Modularity comparison of community detection methods across datasets, highlighting GraphDBSCAN’s superior performance.
Figure 2.
Modularity comparison of community detection methods across datasets, highlighting GraphDBSCAN’s superior performance.
One of the key advantages of GraphDBSCAN is its ability to dynamically adjust clustering parameters, ensuring robust and adaptable community detection across various datasets. This eliminates manual intervention and prevents suboptimal clustering that often arises from fixed parameter selection. Additionally, the use of proximity-based feature extraction ensures higher modularity and better-defined clusters, particularly in sparse and noisy networks. The refined Newman–Girvan edge removal strategy further enhances clustering stability, preventing random or unstable edge deletions that are common in traditional methods. The results confirm that GraphDBSCAN outperforms all baseline methods, demonstrating its effectiveness in improving modularity, reducing noise sensitivity, and refining community granularity. Its ability to adapt across both real-world and synthetic datasets makes it a scalable, noise-resilient, and parameter-adaptive solution for large-scale networks. By integrating optimized DBSCAN clustering, proximity-aware feature extraction, and an improved edge removal strategy, GraphDBSCAN effectively balances modularity, structural integrity, and noise reduction, making it robust and scalable.
4.3. Visualization of Graph Structures and Community Evolution
To evaluate the impact of GraphDBSCAN on community structure and noise reduction, we present a series of graph visualizations for different datasets. These visualizations illustrate the evolution of community structures by comparing the initial graph before noise removal, the refined structure after applying GraphDBSCAN, and the output of a baseline method for comparison. The key objective is to highlight how GraphDBSCAN improves modularity, refines community separation, and removes noise more effectively than traditional methods.
Graph-based structural observations demonstrate that GraphDBSCAN significantly enhances community definition by optimizing modularity while preventing excessive fragmentation. The results across multiple datasets show that GraphDBSCAN effectively reorganizes network topology, ensuring that clusters remain well-defined while eliminating weakly connected nodes and outliers. The visualizations in
Figure 3,
Figure 4,
Figure 5 and
Figure 6 illustrate this effect across different datasets, where:
- (a)
The initial state represents the baseline Louvain clustering before noise removal.
- (b)
The refined state after GraphDBSCAN processing highlights the improved clustering structure.
- (c)
The third method (e.g., MDBNG or Newman–Girvan) provides a comparative visualization of an alternative approach.
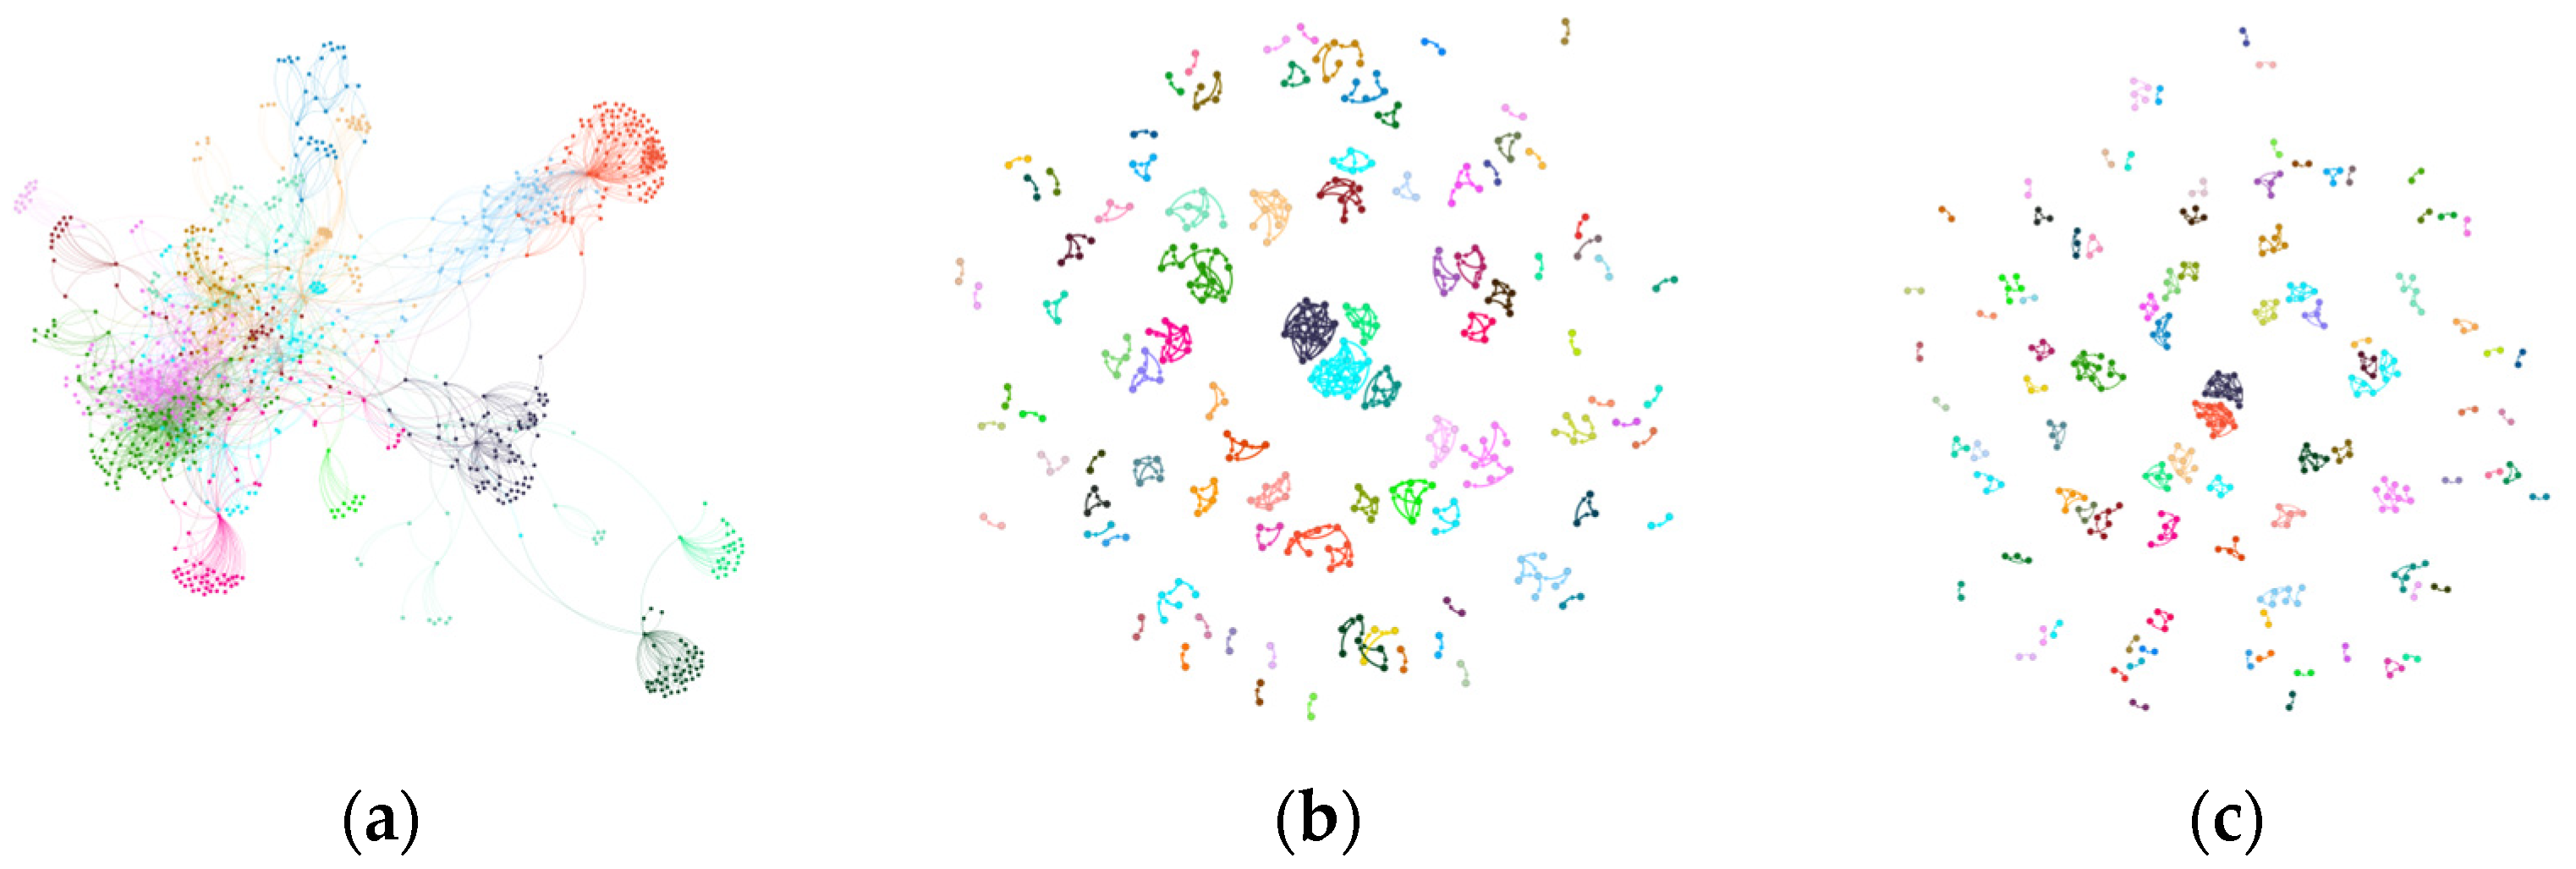
The DBLP dataset initially exhibits loosely defined clusters with visible scattered noise in (a). GraphDBSCAN (b) significantly improves modularity by increasing the number of communities while reducing density, effectively filtering out weakly connected nodes. The comparison method (c), however, over-merges clusters, resulting in less distinct community separation.
Figure 3.
Community structure of DBLP dataset: (a) Initial Louvain clustering, (b) GraphDBSCAN refined clustering, (c) MDBNG clustering.
Figure 3.
Community structure of DBLP dataset: (a) Initial Louvain clustering, (b) GraphDBSCAN refined clustering, (c) MDBNG clustering.
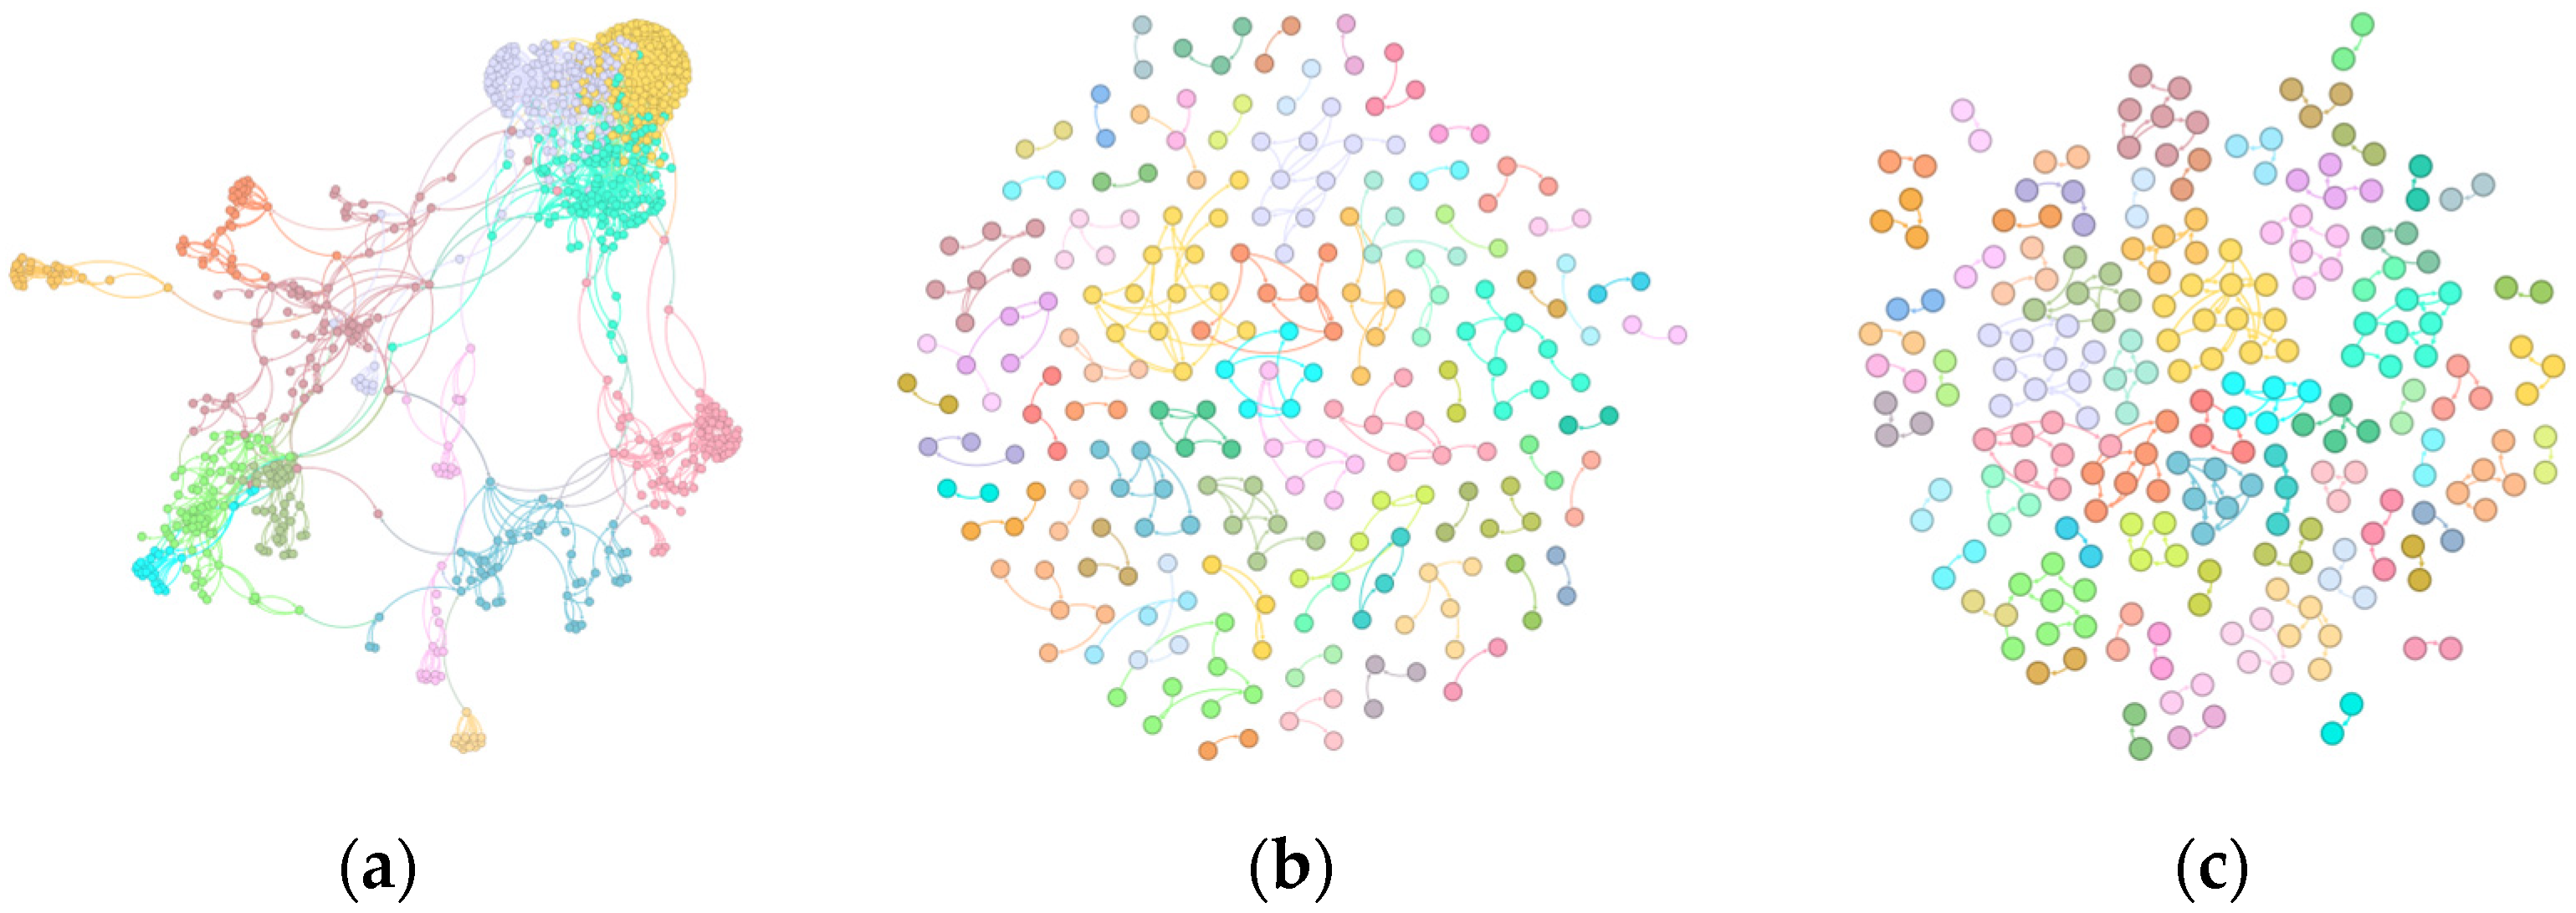
In the Amazon dataset, GraphDBSCAN demonstrates its ability to refine hierarchical structures. In (a), the initial clustering has high noise and weakly connected nodes. GraphDBSCAN (b) removes outliers and improves cluster coherence, leading to better-defined and modular structures. The third method (c) fails to effectively differentiate communities, maintaining overlapping and less distinct clusters.
Figure 4.
Community structure of Amazon dataset: (a) Initial Louvain clustering, (b) GraphDBSCAN refined clustering, (c) MDBNG clustering.
Figure 4.
Community structure of Amazon dataset: (a) Initial Louvain clustering, (b) GraphDBSCAN refined clustering, (c) MDBNG clustering.
Cora’s initial structure (a) is relatively dense, making noise filtering less impactful. GraphDBSCAN (b) maintains modularity while removing weakly connected nodes. The alternative method (c) increases density but over-merges communities, leading to less defined partitions.
Figure 5.
Community structure of Cora dataset: (a) Initial Louvain clustering, (b) GraphDBSCAN refined clustering, (c) MDBNG clustering.
Figure 5.
Community structure of Cora dataset: (a) Initial Louvain clustering, (b) GraphDBSCAN refined clustering, (c) MDBNG clustering.
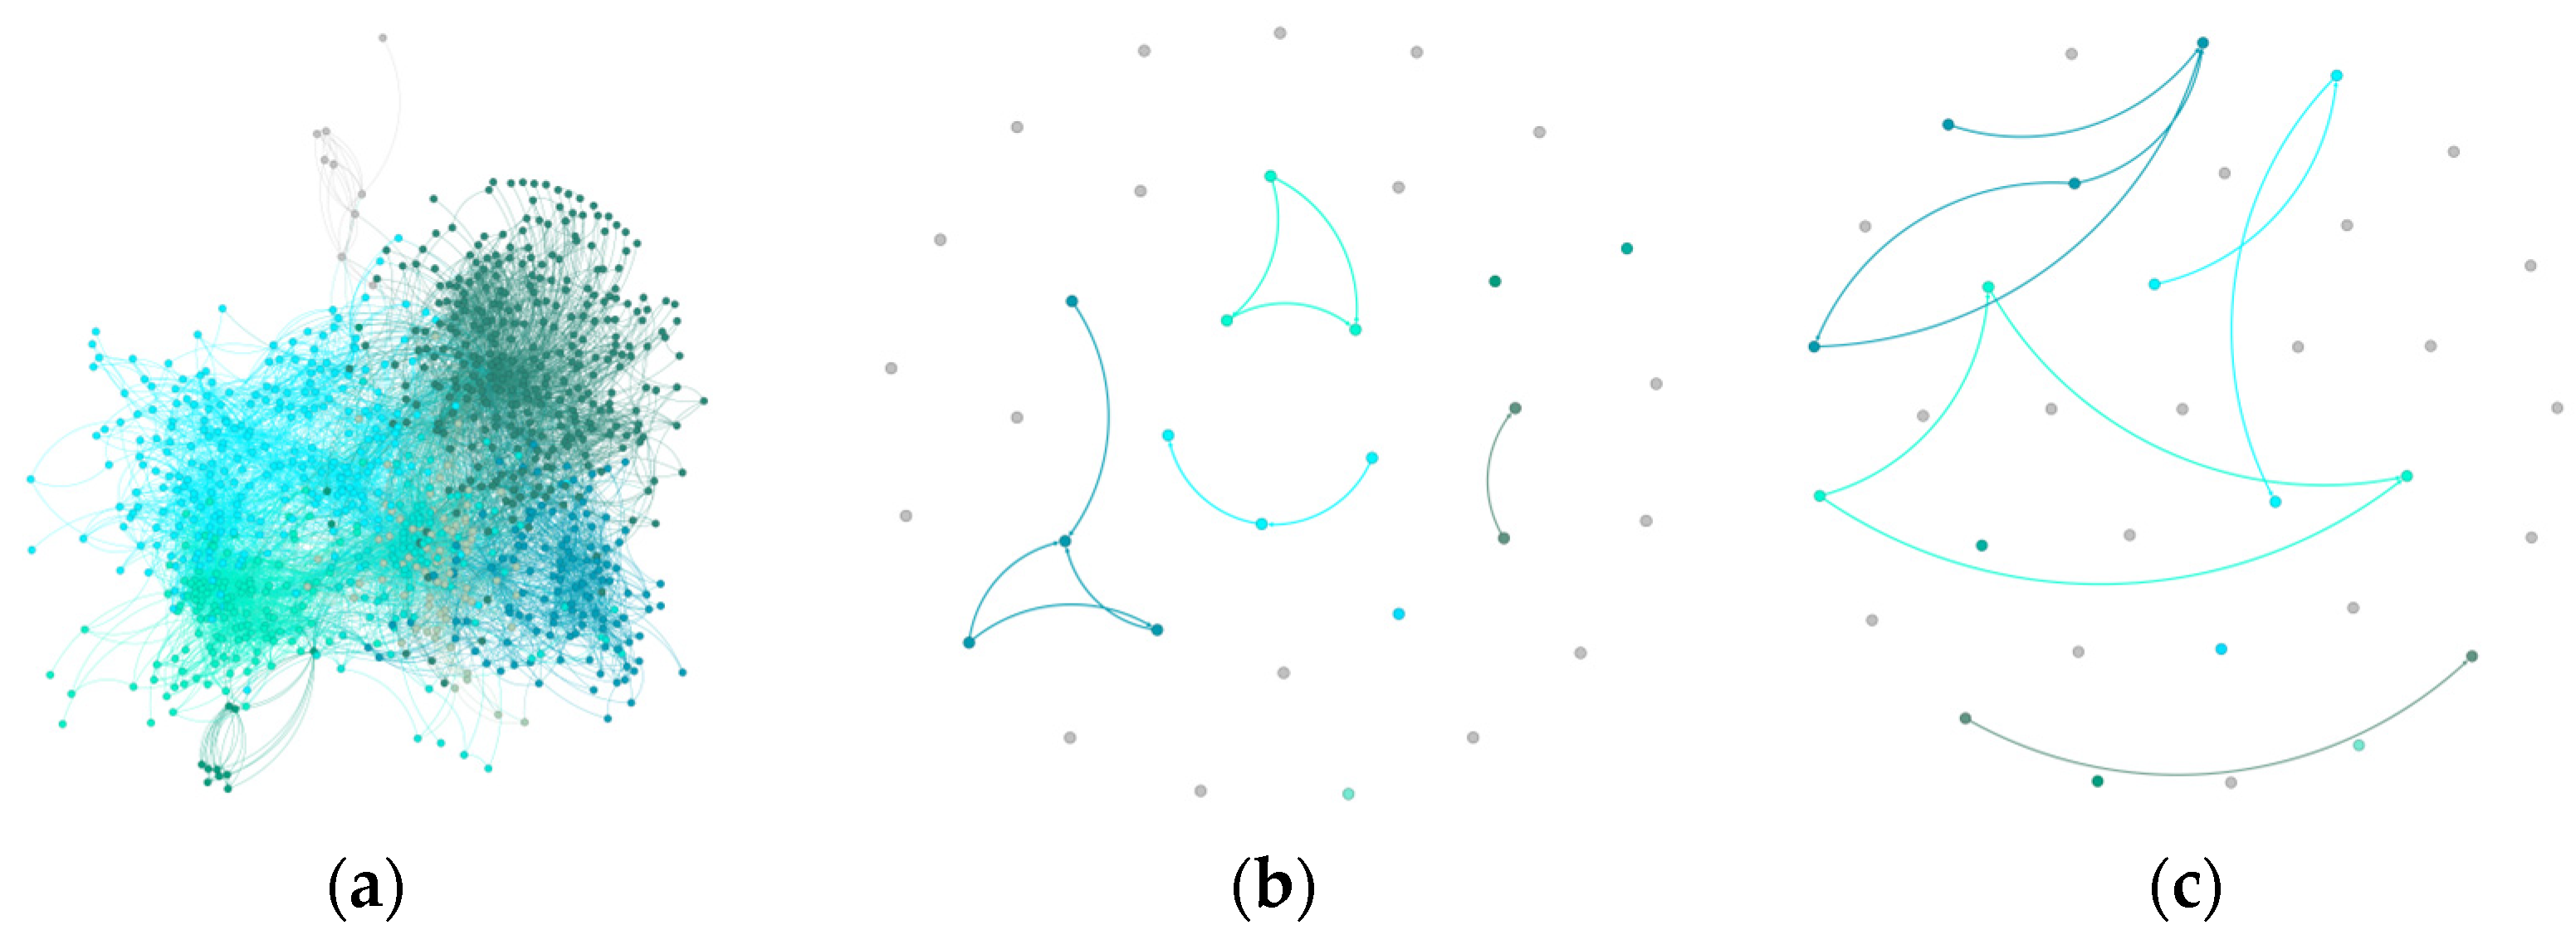
In synthetic datasets, GraphDBSCAN demonstrates its ability to preserve meaningful structures while eliminating noise. The baseline clustering (a) shows moderate modularity, while GraphDBSCAN (b) significantly increases modularity and refines community separations. The third method (c) increases density but fails to differentiate clusters effectively.
Figure 6.
Community structure of Synthetic dataset: (a) Initial Louvain clustering, (b) GraphDBSCAN refined clustering, (c) MDBNG clustering.
Figure 6.
Community structure of Synthetic dataset: (a) Initial Louvain clustering, (b) GraphDBSCAN refined clustering, (c) MDBNG clustering.
The visual comparisons confirm that GraphDBSCAN effectively enhances community structures by refining modularity, reducing noise, and preventing the over-merging of distinct clusters. Across all datasets, GraphDBSCAN consistently achieves better-defined communities than traditional methods, making it a robust and scalable approach for large-scale networks.
5. Conclusions
This study introduced GraphDBSCAN, a robust community detection framework that combines adaptive DBSCAN clustering with an improved Newman–Girvan partitioning strategy. By dynamically optimizing clustering parameters, reducing noise, and improving modularity, GraphDBSCAN consistently outperforms traditional methods like Louvain and MDBNG. Experimental results confirm its scalability and adaptability, making it a valuable tool for social networks, biological systems, and materials science applications.
Future improvements could include integrating Graph Neural Networks (GNNs) for enhanced feature extraction, adapting GraphDBSCAN for dynamic networks, and leveraging deep learning-based clustering for automated similarity measurements. Additionally, optimizing scalability through parallel computing and distributed frameworks like Apache Spark or Deep Graph Library (DGL) could further extend its usability for large-scale datasets.
Furthermore, GraphDBSCAN’s adaptability extends to materials science, where it can play a crucial role in structure-property mapping and predictive modeling [
12,
30,
31]. Once materials are represented as graphs, the ability to efficiently process large-scale material graphs is key to accelerating material discovery. By utilizing GraphDBSCAN’s noise-resistant clustering and automated parameter tuning, researchers can uncover hidden patterns in complex material networks, optimize structure–performance relationships, and facilitate the identification of novel materials. This capability is particularly beneficial in high-throughput materials design, where graph-based methods are increasingly being used to model atomic structures, chemical interactions, and material stability. As material databases grow in size and complexity, GraphDBSCAN’s ability to handle large, heterogeneous graphs could significantly advance research in high-entropy alloys, metal–organic frameworks (MOFs), and energy storage materials, driving faster and more efficient material innovations.


