Article

A Novel TLS-Based Fingerprinting Approach That Combines Feature Expansion and Similarity Mapping

by
Amanda Thomson
1,
Leandros Maglaras
2,3,* and
Naghmeh Moradpoor
1
1
School of Computing, Engineering and Built Environment (SCEBE), Edinburgh Napier University, 10 Colinton Road, Edinburgh EH10 5DT, UK
2
School of Computer Science and Informatics, De Montfort University, The Gateway, Leicester LE1 9BH, UK
3
Department of Digital Media and Communication, Ionian University, 28100 Kefalonia, Greece
*
Author to whom correspondence should be addressed.
Future Internet 2025, 17(3), 120; https://doi.org/10.3390/fi17030120
Submission received: 3 February 2025 / Revised: 25 February 2025 / Accepted: 3 March 2025 / Published: 7 March 2025

Abstract

:
Malicious domains are part of the landscape of the internet but are becoming more prevalent and more dangerous both to companies and to individuals. They can be hosted on various technologies and serve an array of content, including malware, command and control and complex phishing sites that are designed to deceive and expose. Tracking, blocking and detecting such domains is complex, and very often it involves complex allowlist or denylist management or SIEM integration with open-source TLS fingerprinting techniques. Many fingerprinting techniques, such as JARM and JA3, are used by threat hunters to determine domain classification, but with the increase in TLS similarity, particularly in CDNs, they are becoming less useful. The aim of this paper was to adapt and evolve open-source TLS fingerprinting techniques with increased features to enhance granularity and to produce a similarity-mapping system that would enable the tracking and detection of previously unknown malicious domains. This was achieved by enriching TLS fingerprints with HTTP header data and producing a fine-grain similarity visualisation that represented high-dimensional data using MinHash and Locality-Sensitive Hashing. Influence was taken from the chemistry domain, where the problem of high-dimensional similarity in chemical fingerprints is often encountered. An enriched fingerprint was produced, which was then visualised across three separate datasets. The results were analysed and evaluated, with 67 previously unknown malicious domains being detected based on their similarity to known malicious domains and nothing else. The similarity-mapping technique produced demonstrates definite promise in the arena of early detection of malware and phishing domains.

1. Introduction

There is an increasing threat from malicious domains to users and networks, whether that is from phishing domains that are designed to harvest user information and credentials or malicious domains that host command and control servers. There are several open-source techniques and tools designed to assist with the classification of domains, but many of them are reactionary and rely on reports from third parties, tools, or systems. However, a key arsenal in the weapon of classification is active TLS fingerprinting. This approach uses scanning to conduct exhaustive probes on domains and amalgamates the data returned from ClientHellos, to determine the configuration of the server from those features.
These TLS features, whilst appearing benign, can help form a picture of underlying technologies and libraries, such as the version of OpenSSL. Given the fingerprint of a malicious domain, it is possible to pivot to other domains with the same fingerprint and identify malware with the same technology and configurations. Given the rising level of automation in common malware, ransomware and phishing tools, it is reasonable to assume that numerous malicious domains will share similar configurations and deployments in the future [1,2].
Fingerprinting in this manner is widely used in tooling such as Shodan and Censys, and whilst useful for threat hunting and pivoting, it is not fool proof. If the TLS features included in the fingerprint are too wide, then cardinality will be too high, resulting in high levels of benign domains sharing fingerprints with malicious domains. Many of the methods currently in use also rely on hash-based approaches, meaning it is difficult to understand how similar domains are, as small differences in configurations produce radically different hashes.
This paper aimed to determine if the hypothesis that malicious domains can be classified more easily based upon their similarity to other domains is correct, rather than exclusively relying on hash-based approaches. It also aimed to examine the current state of the art for active scanning-based fingerprinting and to determine if the increased granularity of server features can aid in the detection of malicious domains even when they are hosted on CDNs—which greatly narrows the range of TLS features.
The main contributions of the current article are as follows:
  • We conducted a critical literature review, evaluating active scanning techniques that can be used to generate server fingerprints.
  • We applied the information gathered in the literature review to the design and development of an active scanning fingerprint that increases the granularity of current techniques, improving the ability to detect malicious domains hosted on CDNs where feature similarity is high.
  • We enhanced the applicability and security of fingerprinting by introducing a suitable similarity-mapping approach, making it difficult to subvert hash-based fingerprints with minuscule adjustments or manipulations.
  • We critically evaluated the results and findings from the practical experiments.
The paper is structured as follows: Section 2 presents an in-depth literature review to determine the current state of the research and what gaps can be identified. Section 3 presents the methodology for the practical experiments and examines any decisions made. Section 4 presents the results of the practical in-depth and extensive evaluations, including a comparison to others’ research. Finally, Section 5 summarises our work and Section 6 suggests future research and avenues for improvement.

2. Related Work

The first version of the TLS protocol was published in 1999 by the Internet Engineering Task Force (IETF) and has been under constant review and development since, with the latest version, TLS 1.3 [3], being released in 2018. Despite such a lengthy period of adoption, it remains in the Open Web Application Security Projects (OWASP) top ten, and as recently as 2021 cryptographic failures were promoted to the number two slot [4]. According to the OSWAP report, underlying issues can range from a simple lack of understanding of the TLS mechanisms resulting in weak cipher suite choices to invalid certificate chains and depreciated TLS versions.
TLS 1.3 is increasingly being adopted for its enhanced security and privacy features, with 63% of the global top 1 million web sites now supporting it [4]. Despite the modernity of the version, however, there remained gaps in the privacy aspect of the protocol, and in 2022 the TLS working group released a further amendment to the protocol [3], to introduce the Encrypted ClientHello (ECH). The introduction of ECH has far-reaching implications for TLS fingerprinting methods that have traditionally relied on metadata contained within the unencrypted ClientHello.
As this paper focused on future ability to detect and fingerprint malware and C2 domains under TLS, the background and exposition work focused on the latest released version, 1.3, including ECH [3], with previous versions only referenced for historical clarity.

2.1. Active Fingerprinting

Although the goal of TLS is to improve security and privacy, a side-effect is that it hampers the ability to differentiate malicious traffic from normal traffic. As the volume of companies utilising Security Operations Centres (SOCs) increases, the ability to classify traffic correctly is a valuable tool. Oh et al. [5] raised the issue that Network Traffic Analysis (NTA) is becoming increasingly difficult, due to 80% of internet traffic now being under the HTTPS protocol. They highlight one of the motivating factors in this growth as being the ease of access to certificate providers, specifically Let’s Encrypt, but also the drive by large web browser technologies, such as Mozilla, and by CDN providers like Cloudflare. Shamsimukhametov et al. [6] raised similar concerns regarding the uptake in malware utilising TLS, but they focused on the requirement for privacy on the internet.
Active fingerprinting is the technique of actively identifying malicious domains or web servers, and it can be useful in various scenarios, including threat hunting, infrastructure hunting and for detecting the use of CDNs [7]. These methods involve making active but benign connections to a domain, in order to gather enough information to make an accurate classification as to the intent of the server. The most common technique currently in use is known as JARM [8], which is a fuzzy SHA256 hash of the resultant selected set of metadata extracted from ten TLS connections. Each of the ten connections uses a different ClientHello, forcing the server to respond with a range of results that enables profiling of the server. The server behaviours [7] are considered the totality of the server’s capabilities, made up from the configuration of the TLS that can influence the handshake procedure. This indicates that servers with identical JARMs will have very similar software configurations.
In contrast to JARM, which creates a fingerprint based on unencrypted TLS metadata, Sosnowski et al. [7] created Active TLS Stack Fingerprinting. Unlike the JARM methodology, the tooling enables users to configure not only the number of ClientHellos sent but also the configuration of the ClientHellos themselves. Another key difference is the full completion of the TLS connection during the active scan, enabling the tooling to collect metadata that would otherwise be encrypted in the new ECH. The feature selection used to build the fingerprint consists of the TLS version, cipher suites, any received alerts and extensions data. A comparison of the TLS feature used by the JARM scanning tool and those used by ActiveTLS can be seen in Table 1.
Although Sosnowski et al. [7] concluded that their tooling can differentiate 55% more server behaviours than the JARM approach, the authors still had to incorporate additional metadata in the form of HTTP headers captured during the scan, to further improve the ability to detect command and control (C2) servers. Papadogiannaki and Ioannidis [9] also highlighted some weaknesses with the JARM technique, similar to the issues raised by [10]. They stated that the volume of collisions with benign domains can mean diminishing returns if the database is not kept up to date. This was reflected in their results, with the overlap of malicious fingerprints with benign being only 135 in 2021 versus 40% in 2022.

2.2. TLS Fingerprinting and the CDN Problem

Content delivery networks are geographically distributed nodes designed to improve the speed and availability of content by moving it closer to the end user. They are increasingly being adopted to help with Distributed Denial Of Service (DDOS) attacks, and some CDN vendors have been instrumental in pioneering the early adoptions of technologies like ECH, with Cloudflare enabling the technology as recently as 2023 [11].
The increasing adoption of CDNs has naturally had an impact on the statistics of TLS usage. According to the HTTP archive Web Almanac, 87% of sites using TLS now use the latest version compared to only 42% of non-CDN-origin sites [12]. This has been driven by the fact that the CDN handles the TLS termination at the edge and creates a second connection back to the origin. The fact that the CDN handles the termination means that TLS configurations are often no longer done by the origin server and, as the CDN can be configured to handle updates and configuration changes, more uniformity across TLS profiles is seen. Siby et al. [13] discussed some of the issues faced when fingerprinting websites host behind CDNs. They highlighted the increased usage of CDNs, with 44% of the top 1 million sites now utilising them, and how the co-hosting of multiple domains behind a singular IP with the same TLS configuration creates a natural anonymity for the origin server. Sosnowski et al. [7] helped confirm the principal difficulties behind CDN identification focusing only on TLS metadata during their development of the Active TLS Stack fingerprinting tool. Their attempt to identify CDN deployments outside of a CDN’s AS clearly highlighted the similarity between TLS fingerprints, with their research allocating specific fingerprints to several large CDN providers. Although the ranges of fingerprints were small in some cases, such as Alibaba being assigned only 1 fingerprint, Cloudflare was allocated 801 fingerprints, more than would be expected for a provider deploying TLS-enabled servers at scale.

2.3. TLS Fingerprint Enrichment

A large volume of the research into TLS fingerprinting suggests that it is a viable tool for clustering nodes with similar configurations, but that it is not granular enough on its own to enable true classification. As the roll-out of TLS 1.3 and ECH progresses, along with the upswing in the use of CDNs, the variation seen across the TLS stack is decreasing, making TLS fingerprinting less viable as a fine-grained method for malicious domain and infrastructure hunting.
Sosnowski et al. [7] included the HTTP ’Server’ key in their initial scans, to help detect CDN server deployments outside of a CDN’s designated AS. The additional HTTP metadata, when combined with TLS, achieved a maximum precision of 97%, but the authors were clear that HTTP header analysis alone was not ideal as a classifier. In contrast to this, Tang et al. [14] developed HSLF, a Locality-Sensitive Hashing algorithm that sequenced all header fields and measured similarities between HTTP sessions. The authors chose to weight specific headers that reflected application-specific details before applying a random forest machine learning algorithm that resulted in an accuracy rating of 0.96 when classifying application-specific traffic.
HTTP headers have also been used to track and pivot between malicious domains, McGahagan et al. [15] analysed numerous headers from benign and malicious web-servers and used eight machine learning models to demonstrate the feasibility and effectiveness of only using headers in isolation. The authors chose to invest heavily in data cleaning and the validation process, ensuring that custom headers and mis-spellings were not considered. This approach was in direct conflict to the one taken by Al-Hakimi and Bax [16], who used headers for hunting malicious infrastructure. Their research considered mis-spellings and unusual sequencing to be valuable anomalies that could aid in the identification of unique command and control servers. The importance of header sequences was echoed by Bortolameotti et al. [17], who produced HeadPrint to identify malicious communications in passive traffic. Their fingerprint technique relied on two orthogonal header characteristics that enabled applications to be distinguished by their order and their associated values. A range of machine learning models were evaluated using the fingerprinting technique, and the accuracy ranged from 90.74% to 95.44%.
Although research into the domain of active HTTP header fingerprinting is limited, the current research does indicate that, at least on an application level, HTTP headers can be effective in fingerprinting [14,16,17] and useful for enrichment of TLS fingerprints.

3. Methodology

It is clear from the current research that, as technology progresses, TLS fingerprints are becoming less granular, which naturally limits their effectiveness. This presents a significant challenge in malicious domain detection, as actors frequently make minor modifications to their server configurations to evade detection [9,10]. These small changes—such as adjusting a single cipher suite or TLS extension—can produce entirely different hash-based fingerprints, despite the underlying infrastructure remaining largely unchanged [7]. This fingerprint-evasion technique is particularly effective against traditional hash-based approaches like JARM, where even minimal alterations generate completely different signatures, making it difficult to track malicious infrastructure over time, as operators make small defensive changes.
This paper proposes a methodology to produce an enhanced fingerprint that combines TLS features with HTTP header data, complemented by a similarity-mapping technique that mitigates the subversion of current hash-based approaches. The methodology is presented in three main sections. Firstly, we detail the selection and breakdown of the datasets used. Secondly, we detail the tooling used throughout the process. Finally, we provide an end-to-end process flow followed by a detailed explanation of how fingerprints are obtained and transformed into fine-grained similarity relationships.

3.1. Data Acquisition

For known good domains, the Tranco list [18] was selected, as it offers several advantages over alternatives such as the historical Alexa or Umbrella rankings: it employs vote-counting rank aggregation across multiple source lists, it implements specific manipulation-resistance measures, and it provides reproducible daily snapshots with verifiable generation processes [18].
Known active malicious and unknown domains were more difficult to source in bulk, due to their transient nature. A range of publicly accessible sources were used, as shown in Table 2, covering various threat intelligence platforms and attack vectors. To ensure data quality and representativeness, several controls were implemented. Domains were deduplicated and cross-validated across multiple threat intelligence platforms, with any inactive domains removed from the dataset, given that prior studies indicated that approximately 75% of malicious domain activity occurs within the first 30 days after registration [19], and that industry findings from Akamai also demonstrated that newly registered domains exhibit the highest rates of malicious activity within their first month [20]. A 30-day sliding window was used for data collection, to balance currency with sufficient volume for meaningful analysis.

3.2. Tooling

The initial phase required domain name resolution to IP addresses across large datasets. MassDNS [26] was selected for its effectiveness in large-scale scanning scenarios. As a stub resolver, MassDNS enables parallel processing of thousands of queries per second while maintaining accuracy. Despite this accuracy, the relationship between domains and IP addresses is not static or permanent. Domain name resolution, via the Domain Name System (DNS), only provides a mapping at a specific time, and subsequent scans may resolve to different IP addresses. This limitation can introduce a degree of variability to the fingerprinting process, as subsequent scans can return different TLS or HTTP header patterns. To address this, our methodology focused on snapshots at a specific time within the 30-day sliding window, setting a temporal boundary on scans. This approach provided a valid representation of the domains’ configuration at any given moment, which was sufficient for detecting patterns in malicious infrastructure.
For TLS fingerprint generation, the ActiveTLS stack fingerprinting tool [7] was chosen over the more widely recognised JARM process. This was based on two requirements: (1) a transparent output format that would enable further analysis and modification, (2) support for Encrypted ClientHello (ECH) and an increased TLS feature set, as seen in Table 1. While JARM is widely adopted for TLS fingerprinting, its hash-based output format limits feature-level analysis without direct code modification. In contrast, ActiveTLS provides detailed metadata for each TLS feature, enabling the subsequent fine-grained similarity mapping required for the presented methodology. The tool’s built-in ten ClientHellos were used, to enable direct comparison to previous research and datasets’ outputs. To load balance, domain scanning was randomized across the ten connections. TLS extended output was also enabled, to capture the complete feature set.
ActiveTLS stack provides HTTP header capture functionality by using the existing TLS connection. However, its implementation presents two limitations: header ordering and correlation challenges when mapping the resultant header data to domains. Given that header sequence is a key element of fingerprinting techniques [16,17], the built-in HTTP mechanism was deemed unsuitable. To address these limitations, our methodology implemented a separate post-processing phase that established a dedicated TLS connection for each domain that executed a HEAD request, ensuring deterministic header collection.

3.3. Process Flow

The entire end-to-end fingerprinting process can be seen in Figure 1. Starting with the initial datasets and progressing through the MassDNS and ActiveTLS tooling, the raw enriched fingerprints were processed into unique feature sets. These sets were converted into binary vectors, which were then used to create a MinHash signature matrix. Finally, the LSH forest was generated from this matrix, enabling the visualisation of similarity comparisons.

3.4. Active Scanning

The initial steps involved resolving the domains to their respective IP address. The domain resolution to IP was performed using MassDNS [26]. The output from the MassDNS scan of the domain:ip format was then appended with the ten curated ClientHellos used by the ActiveTLS tool, to ensure parity of results across the datasets.

3.5. Fingerprint Post-Processing

The ActiveTLS-generated fingerprints (example shown in Figure 2) underwent initial post-processing, to decompose them into their core elements: TLS version, cipher suites, extensions (including decoded Application-Layer Protocol Negotiation), encrypted extensions and certificate extension parameters. These TLS features were reduplicated across all ten ClientHello scans and categorized by feature type, to create a complete profile of the TLS. While the original fingerprint was preserved, a SHA256-encoded version was also maintained, to enhance readability. The data were enriched by domain source information, classification labels (good, bad, or unknown) and Autonomous System (AS) numbers, with AS resolution performed using the pyasn.dat file from the original ActiveTLS dataset [27].

3.6. HTTP Header Enrichment

The HTTP header collection occurred as an optional post-processing step, executed through a HEAD request following TLS connection establishment. Unlike Sosnowski et al. [27], who captured only the Server header—commonly overwritten in CDNs—our methodology preserved all header keys in their original sequence, while discarding values except where explicitly specified. In the base implementation, only the Server value was retained. Header ordering was maintained as a critical metric for application similarity mapping. The collected headers were then hashed, using MurmurHash3. The Python aiohttp module was used during the implementation of the enrichment process, to asynchronously make each HEAD request. During the header collection, the session keys were written to key.log file, to enable future decryption of the session if required. An example of a full HEAD request taking place within Wireshark can be seen in Figure 3, with the corresponding HTTP header response being seen in Figure 4.
Table 3 demonstrates the correlation between HTTP header fingerprints and their corresponding TLS fingerprints:

3.7. Feature Vector Generation

To enable the similarity computation, the enriched fingerprints were also transformed into binary feature vectors in a post-processing step. For each fingerprint, we constructed a binary vector, x { 0 , 1 } | F | , where
x [ i ] = 1 if feature i is present in the fingerprint 0 otherwise
The feature set F was constructed dynamically after each active scan by iterating through all the fingerprints in the dataset and maintaining a set of unique TLS features and HTTP headers. This captured the complete feature space and ensured that fixed-size vectors were produced. The resulting binary feature vectors had dimensions ranging from 80 to 3000 features, depending on the inclusion of HTTP header data and, importantly, the size of the scan. The larger the selection of domains scanned, the larger the feature vectors.

3.8. Similarity Mapping

Similarity mapping is a core element of the presented approach, and it enabled us to map the high-dimensional feature spaces of TLS and HTTP fingerprints on to a lower-dimensional structure whilst preserving the local similarity structure. The main challenge in this mapping lies in being able to efficiently calculate similarities without losing any of the fine-grain details. This is more critical for TLS features where the quantity of the exposed data is limited to that which is exposed during the handshake.
In our approach, we used the Jaccard similarity coefficient to compare two fingerprints represented as binary feature vectors, A and B. This method is defined as J ( A , B ) = | A B | | A B | , and it provided a reliable measure of their similarity. However, directly computing Jaccard similarities has O ( n 2 ) complexity for n fingerprints, making it computationally expensive, especially for the large datasets used in active scanning. To address the challenge of scalability, we used a two-phase similarity approach involving MinHash signatures and Locality-Sensitive Hashing (LSH). Using MinHash specifically exploits the relationship between Jaccard similarity and the probability of hash collisions, enabling the compression of binary feature vectors into fixed-size signatures that preserve the expected Jaccard similarities.
For a fingerprint’s binary feature vector, x 0 , 1 | F | , the MinHash signature M ( x ) was generated, using k independent hash functions, h 1 , , h k , as
M ( x ) = [ min ( h 1 ( i ) : x [ i ] = 1 ) , , min ( h k ( i ) : x [ i ] = 1 ) ] .
This reduced the dimensionality from | F | to k, while still preserving the expected similarities between fingerprints [28,29]. The probability of a match between MinHash signatures was related to the Jaccard similarity:
P ( min ( h ( A ) ) = min ( h ( B ) ) ) = J ( A , B ) .
The most appropriate values for k and l were established through iterative testing. Once the LSH Forest was produced, it could be queried via linear scan and LSH traversal. This enabled the nearest neighbours for any given node to be determined. As established in Section 3.5, the original fingerprints were retained alongside their binary representations, enabling confirmation that domains with the same fingerprint or those with small vector differences were located on branches or in clusters. Through this iterative process, we were able to determine that k = 1024 hash functions struck an optimal balance between computational efficiency and similarity preservation, with a theoretical error bound of O 1 k .
The LSH forest data structure facilitated fast, approximate nearest-neighbour searches with O ( log n ) complexity. For each fingerprint, x, its MinHash signature was split M ( x ) into l bands (signature partitions) of r values, where l × r = k . Two fingerprints were considered candidate pairs if they matched in at least one band, with the collision probability given by
P ( candidates ) = 1 ( 1 J ( A , B ) r ) l .
The LSH forest was initialised with 1024 hash functions (matching the MinHash encoding) and l = 128 prefix trees. Increasing these values improved accuracy [30] but also increased memory usage. Using l = 128 prefix trees and r = 8 values per band, we achieved a high probability of detecting fingerprint pairs with J ( A , B ) > 0.7 , while keeping the false positive rate under 0.1%.
We then constructed the final c-k-NNG graph G = ( V , E ) in stages: 1. We computed the MinHash signatures for all fingerprints; 2. We built the LSH forest index, using l prefix trees; 3. We found k = 100 approximate nearest neighbours for each vertex; 4. We added edges weighted by estimated Jaccard similarity.
This reduced the complexity from O ( n 2 ) to O ( n log n ) , while still maintaining the local similarity relationships necessary for granular TLS comparison.

3.9. Similarity Visualisation with Tree MAP

To better understand the similarity relationships between fingerprints, we used Tree MAP (TMAP), a method developed by Probst and Reymond [30] for mapping chemical fingerprints. TMAP is a Python library supported upto Python 3.9 designed for handling high-dimensional datasets, and it has been used extensively in the chemical sciences, such as with the ChEMBL database, which contains millions of nodes. The core feature of TMAP is its focus on preserving nearest-neighbour relationships, making it an ideal choice when avoiding dimensionality-reduction techniques like Principle Component Analysis (PCA).
For our use case, TMAP allowed us to project the high-dimensional similarity space onto a 2D plane while preserving local structures. The resulting visualisations placed domains with similar TLS configurations closer together, while still capturing global relationships. This method is more resilient to minor configuration changes—domains with slightly different TLS settings will still remain close to each other in the visualisation. It also enables visual grouping of related infrastructure, making it easier to spot similarities across malicious domains quickly. The effectiveness of this approach is demonstrated in Section 4, where we show how visually distinct groups correspond to related malicious infrastructure, enabling the detection of previously unknown malicious domains through similarity relationships. Figure 5 shows a plot of binary feature vectors. For this visualisation, we used the Python library Fearun, which supports interactive graphs of millions of data points through web-based interfaces.

Similarity Resilience

Unlike static hash-based fingerprinting approaches, similarity mapping introduces a natural resilience to fingerprint subversion, particularly in relation to TLS features. An adversarial action to flip a single TLS extension would generate a completely different JARM or hash signature, but with a Minhash and LSH approach similarity relationships remain proportional to the Jaccard similarity of the underlying feature set.
For a feature vector with dimensionality d and k hash functions in the MinHash signature, the expected difference in similarity scores follows the statistical properties of MinHash sampling. The probability that two sets with Jaccard similarity J ( A , B ) will have the same MinHash value for a random hash function is exactly J ( A , B ) . This means that small changes to the feature vector result in proportionally small changes to the similarity score. From a practical perspective, the proportional response to changes imposes a degree of natural resilience to subversion. Adjusting some of the core TLS parameters (cipher suites, ALPN, extensions) beyond minor alterations can also lead to compatibility issues, impact handshake stability and security and, importantly, restrict supportable clients for malicious actors.
Additionally, when a node has a Jaccard similarity of 1 compared to other points in the dataset, it indicates there is zero similarity between other fingerprints. These isolated nodes, or clusters of isolation, could indicate novel infrastructure, either from new, unique TLS configurations or deliberate evasion techniques such as TLS randomization or customized TLS stacks.
While this research focused on the foundations for using the MinHash and LSH techniques for fingerprinting and similarity mapping, practical evaluation of the techniques’ performance against targeted adversarial subversion was not undertaken. The section on future work suggests some approaches for how this could be evaluated, along with some further avenues of research.

4. Evaluation

Dataset A (Mixed Host) contained 17,711 domains across multiple autonomous systems, ensuring broad applicability across diverse hosting environments. Dataset B (Cloudflare CDN) consisted of 5368 domains exclusively from Cloudflare AS 13335, evaluating the technique’s effectiveness in CDN environments, where traditional TLS fingerprinting is less granular. Cloudflare was specifically chosen, due to its roll-out of Encrypted Client Hello (ECH) in August 2024 [31], which presented challenges to the widely adopted JARM fingerprinting approach. Dataset C (Malicious) included 4475 known malicious domains from verified sources, assessing the abilities of the approaches to identify similarities within known malicious infrastructure.
Although only three datasets were used, they were constructed by aggregating data from multiple sources (Table 2), to provide a representative evaluation across distinct technical fingerprinting challenges. These included variations in hosting environments, the impact of privacy-enhancing measures in CDN deployments and the classification of known malicious infrastructure. The datasets were, however, temporal, as many malicious domains are. They represented a snapshot of domain behaviour at a given point in time, and they focused on specific deployment scenarios rather than long-term trends.

4.1. Granularity Comparisons

Granularity improvement was evaluated using a methodology similar to that of Sosnowski et al. [7], based on comparative analysis of fingerprint cardinality and feature dimensionality. The baseline ActiveTLS fingerprints were compared to the new enriched TLS-HTTP fingerprints, to quantify improvements across granularity and classification ability. The three datasets used in the active scan were comprised of the domains selected from those in Table 2. The percentage increases of distinct fingerprints across the datasets can be seen in Table 4, and they were calculated by (ActiveTLS fingerprint—enriched fingerprint/ActiveTLS fingerprint) × 100. The calculation provided a measure of how much additional differentiation the HTTP header enrichment added to the ActiveTLS fingerprint. By comparing the baseline and enriched fingerprints, we could assess how much more uniquely each domain was represented, particularly in environments with TLS feature similarity, such as CDNs. The percentage range increase represented the data subsets within each of the three scans. For example, in the mixed host dataset, domains from the Tranco list saw the largest increase in distinct domains, increasing from 2638 TLS fingerprints to 7910 TLS-HTTP fingerprints.
The largest increase in granularity was observed in the Cloudflare CDN dataset, where the improvements ranged from 66.7% to 4523.7%. This increase is noteworthy, given the similarity of TLS features in CDN environments. The results indicate that HTTP header enrichment is an effective addition that improves the ability to differentiate between domains with similar TLS configurations.
The Mixed Host dataset showed improvements ranging from 4% to 199%, while maintaining the highest set of features at 2124. This broader range indicates that domains hosted outside CDN environments tend to exhibit greater TLS feature diversity, resulting in more varied impact from HTTP header enrichment.
Finally, the Malicious dataset showed improvements ranging from 4% to 118%, with a feature dimensionality of 306. This aligned with the tendency of malicious applications to share similar deployment patterns and configurations, limiting the effect of enrichment.

4.2. Evaluation of Similarity

The LSH forest can be queried using a linear scan by domain approach, which retrieves the k-nearest neighbours to a given domain through a combination of LSH forest traversal and linear scanning. This method provided an effective means by which to visualise and assess the success and stability of the similarity calculations. For TMAP functionality, the distance to the given domain was inversely related to its proximity, i.e., the closer the domain, the lower the distance value, with an exact match represented as 0.0. To evaluate the results, 20 random domains from each dataset were queried for their nearest ten neighbours, and the distance from the origin (0.0) was plotted against the k-nearest neighbours. Figure 6 displays the results for Dataset A (Mixed Host), in comparison to Dataset B (Cloudflare CDN), as shown in Figure 7:

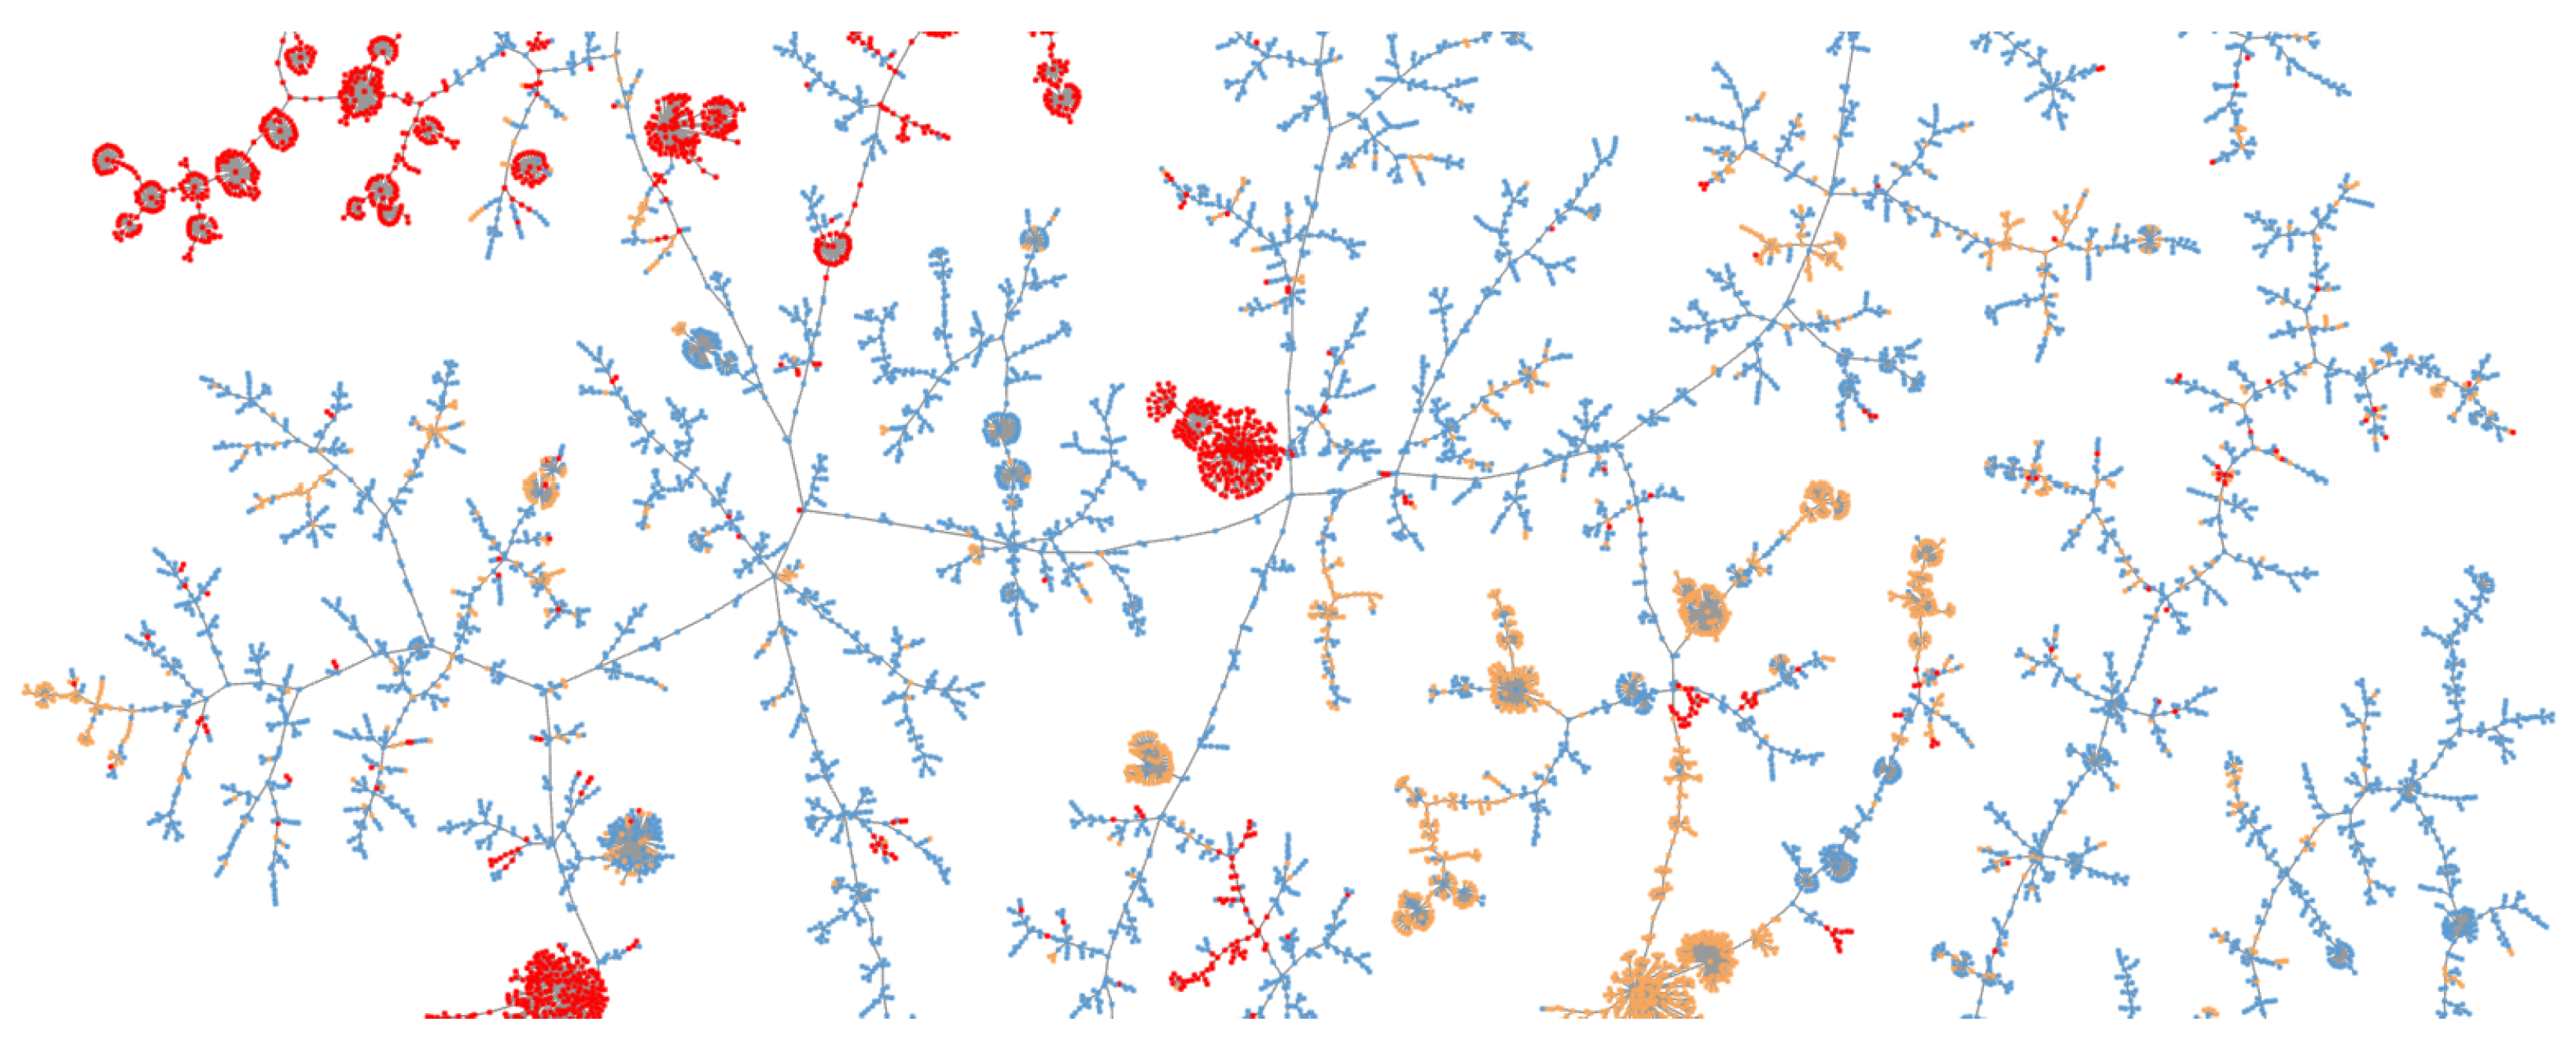
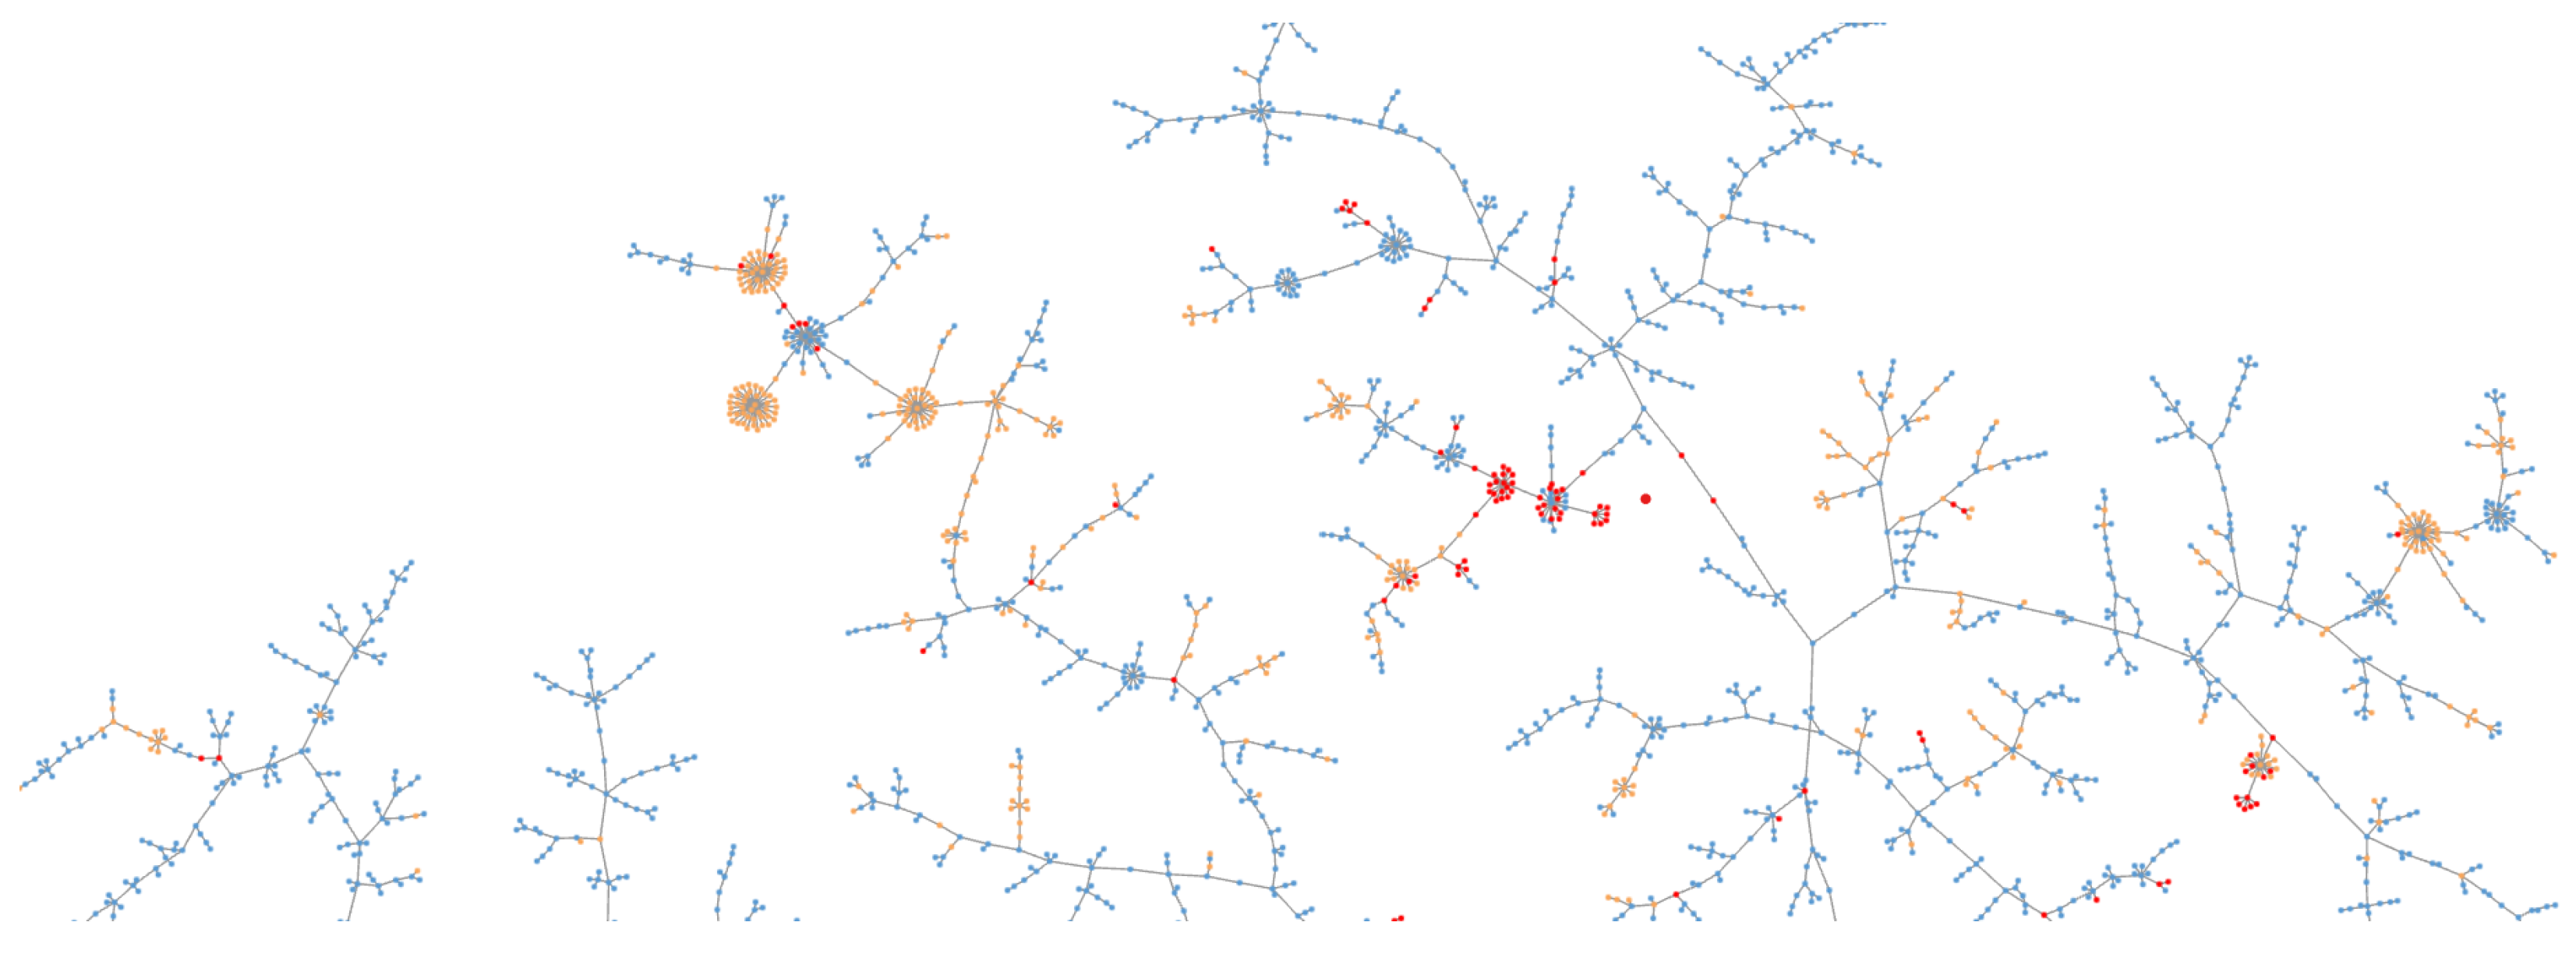
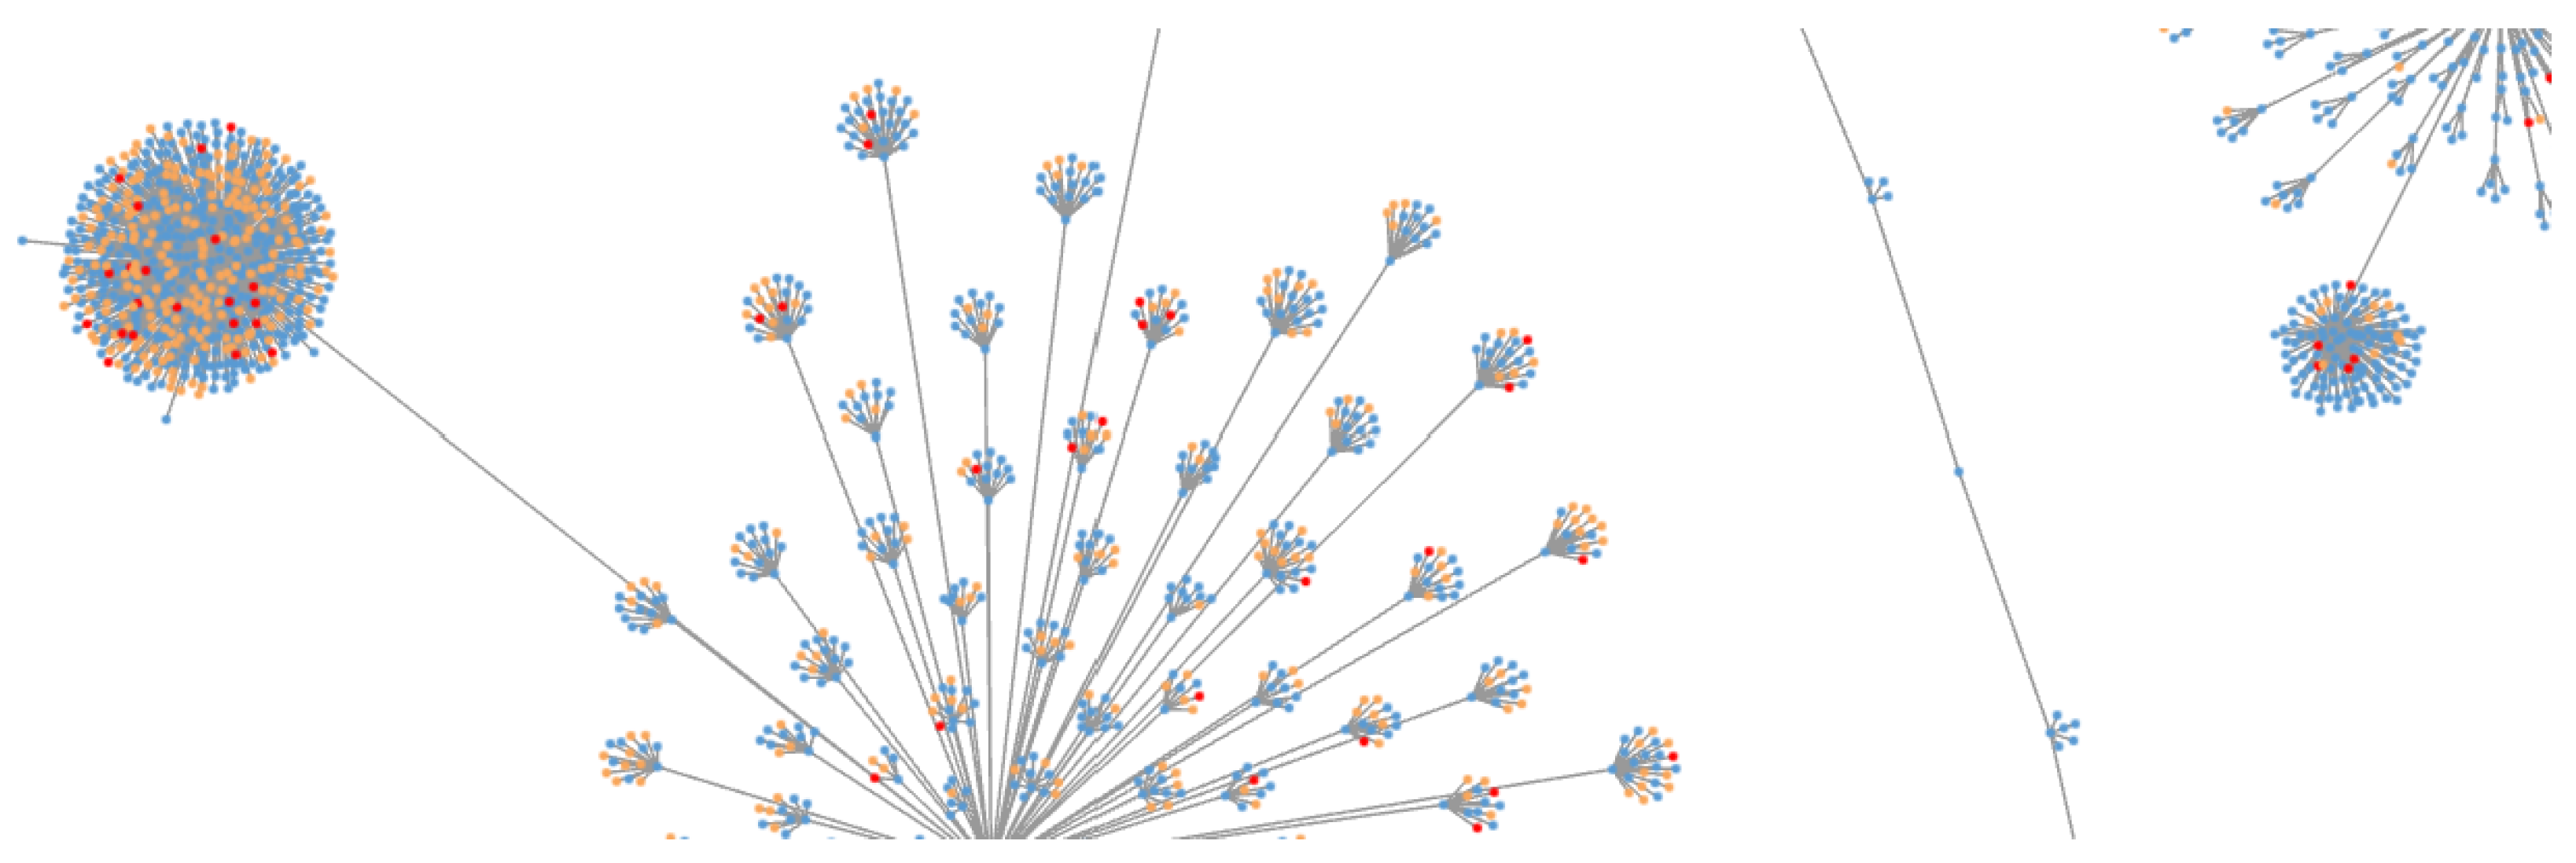
4.3. Visualisation of the Datasets

The graphs produced are visual representations of the c-k-NNG construction. It is important to highlight that this method is not a clustering method and cannot be evaluated as such. The visualisations represent continuous similarity relationships and, subsequently, domains that shared a high similarity are displayed closely, forming natural groups with branching. Due to the non-traditional approach to clustering, it was difficult to quantify the success or failure of the similarity mapping by using techniques such as silhouette scores. Consequently, the visualisation was evaluated by examining distinct areas of the graph, to determine if the plots were accurate, consistent and, importantly, new malicious domains that could be located based solely on their similarity to known bad domains. The approach involved highlighting good domains that were grouped closely within areas of bad domains, or good domains that appeared on distinct branches of bad domains, and evaluating them to determine their true classification.

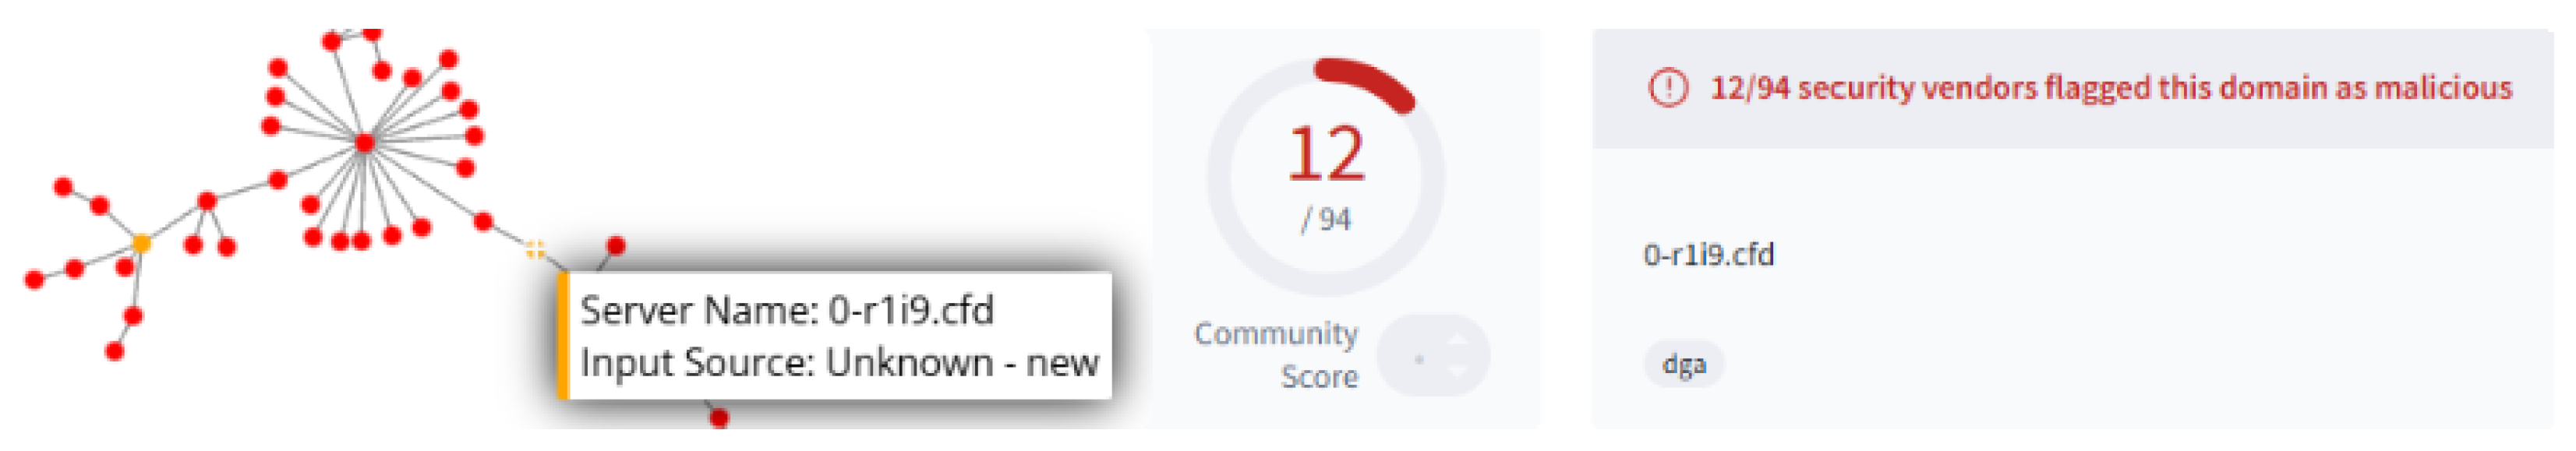
4.3.1. Initial Verification Through Security Platforms

Domains appearing in suspicious clusters were first evaluated through Virus Total, which aggregates detection results across security vendors. Following a similar methodology to that established by Anderson et al. [32], a domain was only reclassified as malicious when a minimum of four independent vendors flagged it as suspicious or explicitly malicious. An example of this can been seen in Figure 8:

4.3.2. Further Indication Analysis

For cases where primary verification yielded inconclusive results or was close to the threshold, but where similarity mapping strongly suggested malicious intent, secondary verification was conducted. The domain was explored within Virus Total, to determine any shared hosting infrastructure (IP addresses, name-servers) with confirmed malicious domains before further analysis with URLQuery.net’s [33] sand-boxed browser environment, and an example of this can be seen in Figure 9:
For the the purpose of these experiments, the verification process was conducted manually, to establish confidence in the results. The Python library used—Fearun—can, however, be run as a web server, enabling exploration to be performed interactively and third party verification to be automated.

4.3.3. Dataset A—Mixed Host

For the Mixed Host dataset, malicious nodes formed natural groups—indicating that there is a high similarity between malware domains across TLS and HTTP features. Figure 10 shows a proportion of the final graph, where the diversity between known good domains is evident by the high level of branching. This dataset had dimensions n = 17,711 (fingerprints) and d = 2133. The statistical analysis of the domain evaluations can be found in Table 5.

4.3.4. Dataset B—Cloudflare CDN

Dataset B focused on domains from the Cloudflare AS 13335, and it was a blend of known good, known bad and unknown domains. Two graphs were generated, one that plotted the domains solely based on their TLS features, and one based on the full enriched TLS with HTTP features. It had been previously established that the diversity of the TLS features across the CDN was poor, with only 59 fingerprints covering the full spectrum of known good domains. This is well represented in the visualisations show in Figure 11, with HTTP headers, compared to Figure 12, which is TLS only. The dimensionality of the pure TLS is n = 5368 (fingerprints) and d = 50 (features). In contrast, the dimensionality of the graph when enriched with HTTP headers is n = 5368 and d = 847. The statistical analysis of the domains can be seen in Table 6.

4.4. Data Set C—Malicious

Dataset C represented domains from five known malicious applications. This dataset enabled us to examine the similarity-mapping approach across an already identified malicious infrastructure. Figure 13 displays the final plot based on the TLS-HTTP fingerprint. It has a dimensionality of n = 4475 (fingerprints) and d = 306 (features). Clear areas of similarity can be seen across the applications. Overlap on branches is primarily seen between the Go Phish domains and the miscellaneous bad domains provide by Cert.Pl. It is clear from the plots that despite a range of fingerprints being seen across each of the applications, they were close enough in similarity that the applications themselves were close in the Jaccard space.

5. Discussion

The results indicate that a combination of the two-fold approach of increased fingerprint granularity through feature expansion with similarity mapping can indeed improve malicious domain detection. Fingerprint granularity was improved in all the sample datasets resulting in improved similarity mapping in each dataset, with Dataset B, specifically relating to CDNs, being the most improved. As stated in the results section, Chapter 4, the aim of the approach was not to create clusters based on features but to calculate and visualise the similarities between application configurations. The fact that many applications formed natural clusters was an artefact of the process. This confirms that with many types of malware applications, there are limited variations in the way they are deployed.
One of the major benefits of the approach is its ability to identify evolving threats and hidden malicious domains. The technique of TLS fingerprinting has been used successfully in cyber security for many years now, but the technique is not infallible, and small changes to configurations produce very different fingerprints. This leads to a new cycle of detection, where new malicious fingerprints must be identified and lists of known malicious fingerprints must be updated. In this situation, it is difficult to understand changes to malicious applications, because the fingerprints themselves are either overly verbose and require analysis to understand the changes or they are hashed and subsequently cannot be reversed. Although the technique presented here produces a ‘hashed’, enriched fingerprint, the similarity-mapping process ensures that small changes are maintained and represented visually. The benefit of this is that new fingerprints that appear close to known branches and clusters of bad domains can be instantly highlighted and flagged for further investigation.
This approach has demonstrated a clear ability to discover new fingerprints and domains that are otherwise unidentified or have been classified as good. Across Datasets A and B, in just the five areas of mixed good, bad and unknown that were evaluated in the results, 67 new malicious domains were discovered, based on their similarity to known malicious domains alone. Of those, 37 were known good domains taken from the Tranco top 1 million [18], indicating that even maintaining and evaluating known goods against the most reputable list is not enough on its own to defend against phishing and malicious domains.

6. Conclusions

In this article, we conducted a critical literature review evaluating active scanning techniques that can be used to generate server fingerprints. Following the review, and having identified the pros and cons of the existing methods, we presented the design and development of an active scanning fingerprint. The proposed method increases the granularity of current techniques, improving the ability to detect malicious domains hosted on CDNs where feature similarity is high. Moreover, we enhanced the applicability and security of fingerprinting by introducing a suitable similarity-mapping approach. Finally, we critically evaluated the results and findings from practical experiments. Its ability to reclassify known good domains from high-reputation allowlists, even when examining only small subsections of the c-k-NNG graph, demonstrates that there is future potential in this technique.

Future Work

The section Similarity Resilience introduced the concept of resilience testing for the similarity technique. A valid avenue for future work would be a systematic evaluation of the technique against deliberate fingerprint-subversion techniques. Future experiments should explore to what degree modification across the feature space alters the location of malicious nodes when TLS and HTTP headers are changed significantly, slightly and when they are completely randomised.
Additionally, a promising extension to the research would be to apply the similarity-mapping approach solely to domain classification by malware domain or campaign. Figure 13 demonstrated a natural clustering, but further analysis and extensive scanning of known malware families could help determine the feasibility of the approach, to distinguish between applications.
Finally, further research should focus on feature vector expansion. The similarity technique relies on flexible and dynamically built vectors. This research focused on TLS and HTTP headers, but this could easily be expanded to include certificate details or even content analysis.

Author Contributions

Conceptualization, A.T., L.M. and N.M.; methodology, A.T., L.M. and N.M.; software, A.T.; validation, A.T., L.M. and N.M.; formal analysis, A.T., L.M. and N.M.; investigation, A.T., L.M. and N.M.; resources, A.T.; data curation, A.T.; writing—original draft preparation, A.T., L.M. and N.M.; writing—review and editing, A.T., L.M. and N.M. All authors have read and agreed to the published version of the manuscript.

Funding

This research received no external funding.

Data Availability Statement

Datasets are available on request from the authors.

Conflicts of Interest

The authors declare no conflicts of interest.

References

  1. Internet Organised Crime Threat Assessment (IOCTA) 2024. 2024. Available online: https://www.europol.europa.eu/publication-events/main-reports/internet-organised-crime-threat-assessment-iocta-2024 (accessed on 2 February 2025).
  2. Begou, N.; Vinoy, J.; Duda, A.; Korczyński, M. Exploring the Dark Side of AI: Advanced Phishing Attack Design and Deployment Using ChatGPT. In Proceedings of the 2023 IEEE Conference on Communications and Network Security (CNS), Orlando, FL, USA, 2–5 October 2023; pp. 1–6. [Google Scholar] [CrossRef]
  3. Rescorla, E. The Transport Layer Security (TLS) Protocol Version 1.3; Request for Comments; Internet Engineering Task Force: Bangkok, Thailand, 2018; p. 160. [Google Scholar] [CrossRef]
  4. Warburton, D. The 2021 TLS Telemetry Report. Available online: https://www.f5.com/labs/articles/threat-intelligence/the-2021-tls-telemetry-report (accessed on 1 August 2024).
  5. Oh, C.; Ha, J.; Roh, H. A Survey on TLS-Encrypted Malware Network Traffic Analysis Applicable to Security Operations Centers. Appl. Sci. 2022, 12, 155. [Google Scholar] [CrossRef]
  6. Shamsimukhametov, D.; Kurapov, A.; Liubogoshchev, M.; Khorov, E. Is Encrypted ClientHello a Challenge for Traffic Classification? IEEE Access 2022, 10, 77883–77897. [Google Scholar] [CrossRef]
  7. Sosnowski, M.; Zirngibl, J.; Sattler, P.; Carle, G.; Grohnfeldt, C.; Russo, M.; Sgandurra, D. Active TLS Stack Fingerprinting: Characterizing TLS Server Deployments at Scale. In Proceedings of the Network Traffic Measurement and Analysis Conference (TMA), Enschede, The Netherlands, 27–30 June 2022. [Google Scholar]
  8. Althouse, J.; Smart, A.; Nunnally, R.; Brady, M. Easily Identify Malicious Servers on the Internet with JARM. 2020. Available online: https://engineering.salesforce.com/easily-identify-malicious-servers-on-the-internet-with-jarm-e095edac525a/ (accessed on 8 July 2024).
  9. Papadogiannaki, E.; Ioannidis, S. Pump up the JARM: Studying the Evolution of Botnets Using Active TLS Fingerprinting. In Proceedings of the 2023 IEEE Symposium on Computers and Communications (ISCC), Tunis, Tunisia, 9–12 July 2023; pp. 764–770, ISSN 2642-7389. [Google Scholar] [CrossRef]
  10. Matoušek, P.; Burgetová, I.; Ryšavý, O.; Victor, M. On Reliability of JA3 Hashes for Fingerprinting Mobile Applications. In Proceedings of the Digital Forensics and Cyber Crime: 11th EAI International Conference, ICDF2C 2020, Boston, MA, USA, 15–16 October 2020; Lecture Notes of the Institute for Computer Sciences, Social Informatics and Telecommunications Engineering. Goel, S., Gladyshev, P., Johnson, D., Pourzandi, M., Majumdar, S., Eds.; Springer International Publishing: Cham, Switzerland, 2021; pp. 1–22. [Google Scholar]
  11. Van Der Mandele, A.; Ghendini, A.; Wood, C.; Mehra, R. Encrypted Client Hello—The Last Puzzle Piece to Privacy. 2023. Available online: https://blog.cloudflare.com/announcing-encrypted-client-hello/ (accessed on 8 July 2024).
  12. Bhandari, H.; Viggiano, J. The 2022 Web Almanac: CDN; Technical Report, HTTP Archive; 2022; Volume 4, Available online: https://almanac.httparchive.org/en/2022/cdn (accessed on 8 July 2024).
  13. Siby, S.; Barman, L.; Wood, C.; Fayed, M.; Sullivan, N.; Troncoso, C. Evaluating practical QUIC website fingerprinting defenses for the masses. Proc. Priv. Enhancing Technol. 2023, 4, 79–95. [Google Scholar] [CrossRef]
  14. Tang, Z.; Wang, Q.; Li, W.; Bao, H.; Liu, F.; Wang, W. HSLF: HTTP Header Sequence Based LSH Fingerprints for Application Traffic Classification. In Proceedings of the Computational Science—ICCS 2021, Kraków, Poland, 16–18 June 2021; Paszynski, M., Kranzlmüller, D., Krzhizhanovskaya, V.V., Dongarra, J.J., Sloot, P.M.A., Eds.; Springer International Publishing: Cham, Switzerland, 2021; pp. 41–54. [Google Scholar]
  15. McGahagan, J.; Bhansali, D.; Gratian, M.; Cukier, M. A Comprehensive Evaluation of HTTP Header Features for Detecting Malicious Websites. In Proceedings of the 2019 15th European Dependable Computing Conference (EDCC), Naples, Italy, 17–20 September 2019; pp. 75–82. [Google Scholar] [CrossRef]
  16. Al-Hakimi, S.; Bax, F. Hunting for Malicious Infrastructure Using Big Data. SNE Master Research Projects 2020–2021, University of Amsterdam. Available online: https://rp.os3.nl/2020-2021/p54/report.pdf (accessed on 12 August 2024).
  17. Bortolameotti, R.; van Ede, T.; Continella, A.; Hupperich, T.; Everts, M.H.; Rafati, R.; Jonker, W.; Hartel, P.; Peter, A. HeadPrint: Detecting anomalous communications through header-based application fingerprinting. In Proceedings of the 35th Annual ACM Symposium on Applied Computing, New York, NY, USA, 30 March–3 April 2020; SAC ’20. pp. 1696–1705. [Google Scholar] [CrossRef]
  18. Pochat, V.L.; Van Goethem, T.; Tajalizadehkhoob, S.; Korczyński, M.; Joosen, W. Tranco: A Research-Oriented Top Sites Ranking Hardened Against Manipulation. In Proceedings of the 2019 Network and Distributed System Security Symposium, San Diego, CA, USA, 24–27 February 2019. [Google Scholar]
  19. Deniz, F.; Nabeel, M.; Yu, T.; Khalil, I.M. MANTIS: Detection of Zero-Day Malicious Domains Leveraging Low Reputed Hosting Infrastructure. arXiv 2025, arXiv:2502.09788. [Google Scholar]
  20. Tilborghs, S. Flagging 13 Million Malicious Domains in 1 Month with Newly Observed Domains. Akamai Secur. Res. 2022, 28. [Google Scholar]
  21. URLhaus. Malware URL Exchange. Available online: https://urlhaus.abuse.ch/ (accessed on 1 August 2024).
  22. Hunt.io. Proactive Infrastructure Hunting. Available online: https://hunt.io/ (accessed on 1 August 2024).
  23. Cert.pl. Research and Academic Computer Network. Available online: https://hole.cert.pl/domains (accessed on 1 August 2024).
  24. OpenPhish.io. Actionable Intelligence Data on Active Phishing Threats. Available online: https://www.openphish.com/ (accessed on 1 August 2024).
  25. Shreshtait. Stop Internet Threats such as Phishing, Ransomware, DGA, Botnets Real-Time. Available online: https://shreshtait.com/blog/2024/02/recently-registered-domains-download/ (accessed on 1 August 2024).
  26. Blechschmidt. A High-Performance DNS Stub Resolver for Bulk Lookups and Reconnaissance. Available online: https://github.com/blechschmidt/massdns (accessed on 1 August 2024).
  27. Sosnowski, M.; Zirngibl, J.; Sattler, P.; Carle, G.; Grohnfeldt, C.; Russo, M.; Sgandurra, D. EFACTLS: Effective Active TLS Fingerprinting for Large-scale Server Deployment Characterization. IEEE Trans. Netw. Serv. Manag. 2024, 21, 2582–2595. [Google Scholar] [CrossRef]
  28. Broder, A. On the resemblance and containment of documents. In Proceedings of the Compression and Complexity of SEQUENCES 1997 (Cat. No.97TB100171), Salerno, Italy, 13 June 1997; IEEE: New York, NY, USA, 1997; pp. 21–29. [Google Scholar] [CrossRef]
  29. Broder, A.Z.; Charikar, M.; Frieze, A.M.; Mitzenmacher, M. Min-Wise Independent Permutations. J. Comput. Syst. Sci. 2000, 60, 630–659. [Google Scholar] [CrossRef]
  30. Probst, D.; Reymond, J.L. Visualization of very large high-dimensional datasets as minimum spanning trees. J. Cheminformat. 2020, 12, 12. [Google Scholar] [CrossRef] [PubMed]
  31. Bullock, M.; Lechowski, M.; Mehra, R. New Standards for a Faster and More Private Internet. 2024. Available online: https://blog.cloudflare.com/new-standards/#encrypted-client-hello-ech (accessed on 3 February 2025).
  32. Anderson, B.; Paul, S.; McGrew, D.A. Deciphering Malware’s use of TLS (without Decryption). arXiv 2016, arXiv:1607.01639. [Google Scholar] [CrossRef]
  33. URLQuery. Website Malware Analysis and Malicious Content Detection. Available online: https://urlquery.net (accessed on 28 July 2024).
Figure 1. A flow diagram of the end-to-end fingerprint processing pipeline.
Futureinternet 17 00120 g001
Figure 2. The raw fingerprint produced from the active scan.
Futureinternet 17 00120 g002
Figure 3. A screenshot of the HEAD request being made, as seen within Wireshark. The HTTP Protocol is highlighted in green.
Futureinternet 17 00120 g003
Figure 4. A screenshot of a typical set of HTTP headers received in response to a HEAD request during the header enrichment process. The HEAD request is seen in red, the HTTP response is blue.
Futureinternet 17 00120 g004
Figure 5. Graph displaying TLS features enriched with HTTP header data. The resulting feature matrix M { 0 , 1 } n × d has dimensions n = 16,254 (fingerprints) and d = 2124 (features), representing the complete binary feature space of the TLS and HTTP characteristics. Known good domains are coloured green, known bad domains, red and unknown domains, orange.
Futureinternet 17 00120 g005
Figure 6. The Mixed Host dataset displays a diverse number of distance metrics and a broader distribution of similarity scores across the sample space. Each line represents a different domain, with a range of colors to aid in differentiation.
Futureinternet 17 00120 g006
Figure 7. The Cloudflare CDN dataset displays less diversity in similarity. All k-nearest neighbours maintain distances below 0.30. This shows closer similarity between domains. Each line represents a different domain, with a range of colors to aid in differentiation.
Futureinternet 17 00120 g007
Figure 8. A typical domain with strong indicators of malicious intent. The domain was sourced from the unknown category and registered within 30 days of the scan taking place. At the time of evaluation, 12 security vendors had flagged the domain as malicious, including Sophos, Fortinet, ESET and Bitdefender.
Futureinternet 17 00120 g008
Figure 9. An example of a domain on the threshold for further investigation. The domain has three vendors confirmed as malicious—BitDefender, CRDF and G-Data—but a further suspicious flag from vendor Trustwave. The left-hand shows the heuristic scan performed by URLQuery, indicating that ClearFake malicious JavaScript library was detected.
Futureinternet 17 00120 g009
Figure 10. The LSH forest of dataset A visualised using Fearun. Known bad domains are colored red, known good are colored blue and unknown domains are colored orange.
Futureinternet 17 00120 g010
Figure 11. The LSH forest of dataset B (Cloudflare CDN domains) visualised using Fearun. The TLS fingerprints have been enriched with HTTP header data. Known bad domains are colored red, known good are colored blue and unknown domains are colored orange.
Futureinternet 17 00120 g011
Figure 12. The LSH forest of dataset B (Cloudflare CDN domains) visualised using Fearun. The TLS fingerpritns are not enriched and contain only TLS features. Known bad domains are colored red, known good are colored blue and unknown domains are colored orange.
Futureinternet 17 00120 g012
Figure 13. The LSH visualisation of dataset C, known malicious domains. Clear similarity patterns can be seen forming by capability. Go Phish domains are seen in yellow, Cert Pl orange, Metasploit pink, Tactical RRM purple and Burp Collaborator Blue.
Futureinternet 17 00120 g013
Table 1. The full TLS features used in both the JARM and ActiveTLS scan tools. The features used by each tool are highlighted in green; those not used are highlighted in grey.
IDExtensionJARMActive TLS
1max_fragment_length
7client_authentication
8server_authentication
9cert_type
10supported_groups
11ec_point_formats
13signature_algorithms
15heartbeat
16application_layer_protocol_negotiation
19client_certificate_type
20server_certificate_type
23extended_master_secret
24token_binding
27compress_certificate
28record_size_limit
35session_ticket
43supported_versions
45psk_key_exchange_modes
47certificate_authorities
50signature_algorithms_cert
51key_share (only selected group)
65281renegotiation_info
Table 2. Table of all datasets used for active scanning.
DatasetLocationCategory
Tranco LJNY4 [18]https://tranco-list.eu access on 2 March 2025Good
UrlHaus [21]https://urlhaus.abuse.ch access on 2 March 2025Bad
Hunt.io [22]https://hunt.io access on 2 March 2025Bad
Cert.pl [23]https://hole.cert.pl access on 2 March 2025Bad
OpenPhish [24]https://openphish.com access on 2 March 2025Bad
Shreshtait [25]https://shreshtait.com access on 2 March 2025Unknown
Table 3. TLS fingerprint and HTTP header hash correlation for CDN-hosted domains, demonstrating how incorporating HTTP headers increases fingerprint granularity. While there are only two unique TLS fingerprints shown, there are three unique HTTP header hashes, suggesting better server differentiation capability.
TLS Fingerprint (SHA256)HTTP Headers (MMH3)
71a72d0a2d5478cafb7fc513fe120129a4db5f5dd21671ded5314034b0b721243898065973
ab545fcff96261433c531d79bd9035d8db4a13b7faef85f5e4283d66ad5ed49d3898065973
71a72d0a2d5478cafb7fc513fe120129a4db5f5dd21671ded5314034b0b721242350846486
ab545fcff96261433c531d79bd9035d8db4a13b7faef85f5e4283d66ad5ed49d1200561793
Table 4. Fingerprint granularity improvement across datasets.
DatasetSample Size (n)Dimensionality (d)Improvement
Mixed Host17,7112124 features4–199%
Cloudflare CDN5368847 features66.7–4523.7%
Malicious4475306 features4–118%
Table 5. Breakdown of the statistics across three blended areas of the similarity mapping for dataset A.
Total Nodes:211
Known Good:32
Known Bad:166
Unknown:13
Newly identified malicious domains:27
Area with 91.47% confirmed malicious nodes and 12 distinct fingerprints.
Of the total good or unknown domains, 60% were reclassified to bad.
Table 6. Breakdown of the statistics across three blended areas of the similarity mapping for dataset B.
Total Nodes:85
Known Good:25
Known Bad:30
Unknown:30
Newly identified malicious domains:40
Area with 82.35% confirmed malicious nodes and nine distinct fingerprints.
Of the total good or unknown domains, 72.72% were reclassified to bad.
Disclaimer/Publisher’s Note: The statements, opinions and data contained in all publications are solely those of the individual author(s) and contributor(s) and not of MDPI and/or the editor(s). MDPI and/or the editor(s) disclaim responsibility for any injury to people or property resulting from any ideas, methods, instructions or products referred to in the content.

