1. Introduction
A Bluetooth Low Energy (BLE) beacon is a small device designed to broadcast Bluetooth packets of information without requiring an active connection with a receiver [
1]. The Received Signal Strength Indicator (RSSI) is a metric used to quantify the power level of a received signal. It is essential for evaluating the signal strength between the BLE and a receiver, also gateway receivers, which act as the intermediate receiver for data transmission between BLE devices and a broader network [
2]. As the distance between a BLE beacon and the receiving device increases, the RSSI value decreases. Conversely, as the devices move closer, the RSSI value increases.
This principle underpins the development of signal fingerprint indoor localization methods [
3,
4,
5]. The mapping approach constructs an RSSI map through pre-measured data from multiple reference nodes at known locations [
6]. During the offline phase, RSSI measurements are collected at various reference points, creating a unique map for each location. In the online phase, real-time RSSI data from an unknown target is compared to the radio map [
7]. Sykes and Mustafa proposed an asset localization method that integrates RSSI data with a Kalman filter and machine learning techniques [
8].
In another study [
9], the focus was on developing an indoor navigation system that utilizes low-cost BLE beacons to deliver accurate location predictions while users are in motion. The study conducted experiments in a large academic building with 35 beacons placed approximately 3 m apart [
9]. The study utilized RSSI values, proximity data, and multiple smoothing algorithms (Kalman filter, Savitzky–Golay filter, feedback filter, moving average filter, and proximity filter) to enhance accuracy. A dynamic micro-location algorithm was implemented within a native iOS application. Testing results revealed that the Feedback filter, Moving average filter, and Proximity filter provided the most accurate outcomes, with an average accuracy of 2.23 m during user movement.
Ai et al. examined the impact of signal string measurement window size on the accuracy of BLE fingerprint-based positioning [
10]. They proposed an enhanced Cramer–Rao Lower Bound (CRLB) model that incorporates window size as a parameter. To mitigate the effects of reduced window size and RSSI fluctuations, they introduced a Weighted Fingerprint Construction (WFC) method. Experimental results demonstrated that the WFC-KNN algorithm outperformed the Mean-KNN algorithm, particularly with smaller window sizes, in terms of accuracy.
Aranda et al. conducted a performance comparison of BLE databases, evaluating training time, parameter optimization, computational time, and positioning accuracy [
11]. The results indicated that weighted k-nearest neighbors algorithm-based methods outperform others in large-scale deployments, as they require no prior training and minimize optimization time. In contrast, Support Vector Machines provide higher accuracy with reduced computational and training time in smaller environments. This study addresses the limitations of Wi-Fi fingerprinting and highlights BLE as a promising alternative for indoor positioning applications. Garg and Gupta reviewed various indoor localization techniques [
12], including ranging methods such as Angle of Arrival, Time of Arrival, Time Difference of Arrival, and RSSI, as well as range-combining methods like Triangulation, Trilateration, Proximity, and Fingerprinting.
To address the issue of erroneous proximity reference points (RP) and extended data collection times, Dinh et al. [
6] proposed a strategic selection of reference points, focusing on high-traffic areas, uniform distribution, and less complex indoor architectures. Rather than storing multiple data samples, their method saves only the average value for each RP, effectively correcting errors in Pedestrian Dead Reckoning (PDR). The matching algorithm is distance-based, where the position class returned corresponds to the RP with the shortest distance to the new data point. The authors assessed system performance through real-world experiments, comparing their approach to traditional fingerprinting methods and PDR alone. The results showed that the proposed system, using a minimal number of RPs, significantly enhanced localization accuracy compared to other methods.
Benaissa et al. [
13] proposed a real-time indoor localization system utilizing Bluetooth Low Energy transmitters and smartphones as receivers. The method employs Radial Basis Functions (RBF) for accurate indoor positioning. Implemented within an Android application, the system supports offline data collection. The indoor area model is constructed directly on the smartphone, enabling real-time position estimation during the online phase. This approach allows for continuous model updates, incorporating new signal and position data. The adaptability of RBF interpolation permits the system to accommodate changes in the indoor environment, such as new furniture, without the need for complete retraining [
14]. Additionally, As et al. explored the reduction in calibration efforts in indoor localization by using BLE beacons [
15].
Safwat et al. [
16] developed a system to construct a Bluetooth Low Energy fingerprint during an offline phase. Nabati and Ghorashi [
17] suggested a deep neural network to analyze the distribution of RSSI samples during the offline phase. In the online phase, the user’s position is estimated by comparing real-time Received Signal Strength Indicator values with the stored fingerprint using K-nearest neighbors and Weighted K-nearest neighbors algorithms. Kawecki et al. [
18] developed an indoor localization approach using Android mobile devices. Experiments conducted in various indoor environments, including a corridor and a sports hall, demonstrated the system’s ability to accurately determine the user’s position. The study focused on evaluating the precision of fingerprint-based positioning, utilizing RSSI reference maps generated from measurement data.
It is established that the human body interacts with BLE signals [
19]. The conductive properties of the human body cause it to scatter longer radio signal wavelengths and reflect or attenuate shorter wavelengths, thereby affecting radio signal propagation between a transmitter and receiver [
20]. This can lead to inaccurate RSSI measurements, resulting in erroneous position estimates in RSSI fingerprinting-based localization [
21]. Naghdi et al. [
22] employed the fluctuations caused by human body shadowing from three different BLE sources to detect human bodies. Mamun et al. [
23] tackled the challenge of body shadowing in indoor localization using RSSI-based fingerprinting. A solution is proposed that includes angle estimation through landmarks, a decision tree classifier for motion mode detection, and an RSSI compensation model to correct body-induced signal distortions. Junoh et al. suggested a data-augmentation method to improve indoor location estimation using radiofrequency fingerprinting [
24]. The approach employs a Conditional Generative Adversarial Network with Long Short-Term Memory to generate synthetic fingerprint data that enhances sparse training datasets. The experimental results demonstrate an improvement in localization accuracy compared to non-augmented fingerprinting data.
Wattananavin et al. [
25] investigated the impact of human presence and movement on the accuracy of RSSI-based localization techniques, which are susceptible to significant errors due to signal strength variations caused by human interference. A comparative experimental analysis was conducted on different localization methods under conditions with and without human movement. These findings highlight the necessity for further refinement of these methods to mitigate the effects of human-induced RSSI fluctuations in practical localization applications. Morgan provided a comprehensive survey of BLE-based localization systems, focusing on accuracy metrics and categorizing techniques based on their performance [
26]. The authors analyze various localization approaches, identifying those capable of achieving sub-meter accuracy and highlighting areas that require further research, particularly in sub-decimeter localization and security metrics.
Gorilami et al. collected a dataset across four distinct indoor scenarios designed to represent various real-world conditions for localization [
27]. The first scenario, referred to as Calibration, involves data collection from a Bluetooth tag mounted on a tripod and placed in 119 different locations, facilitating the study of Angle of Arrival variation in a controlled environment with minimal human interference. The second scenario, Static, involves a person holding the Bluetooth tag around the neck in 36 different positions, with orientations varied across four directions, to assess the impact of the human body on AoA measurements. The third scenario, Mobility, simulates a person moving naturally while carrying the Bluetooth tag, enabling the evaluation of AoA and Received Signal Strength Indicator under dynamic conditions. The final scenario, Proximity, examines interactions between individuals and reference points, analyzing the proximity of a person to five POIs, a group of four people, a trio, and two couples.
In another study, Mavilia et al. collected another dataset with particular emphasis on the effect of user orientation on localization accuracy. The study used a single anchor node and a Bluetooth tag to measure the Angle of Arrival across 28 locations in an indoor environment. The findings demonstrated that the user’s orientation significantly influenced the AoA estimation. Localization errors ranged from 1.89 m to 2.17 m, with error magnitude increasing as the distance from the anchor node grew. These results underscore the importance of accounting for user orientation in the design and implementation of Bluetooth-based indoor localization systems. The Bluetooth tag in this study is worn somewhere around the chest on a lanyard.
The dataset presented by McConville et al. [
28] utilized a wearable device positioned on the participant’s wrist. The wearable incorporates a tri-axial accelerometer that records movement data and transmits it via Bluetooth Low Energy (BLE) to gateways located in various rooms of a residential house. These data, along with the Received Signal Strength Indicator (RSSI) values, is employed for the evaluation and enhancement of indoor localization methods. Other datasets are collected from a handheld smartphone [
29,
30].
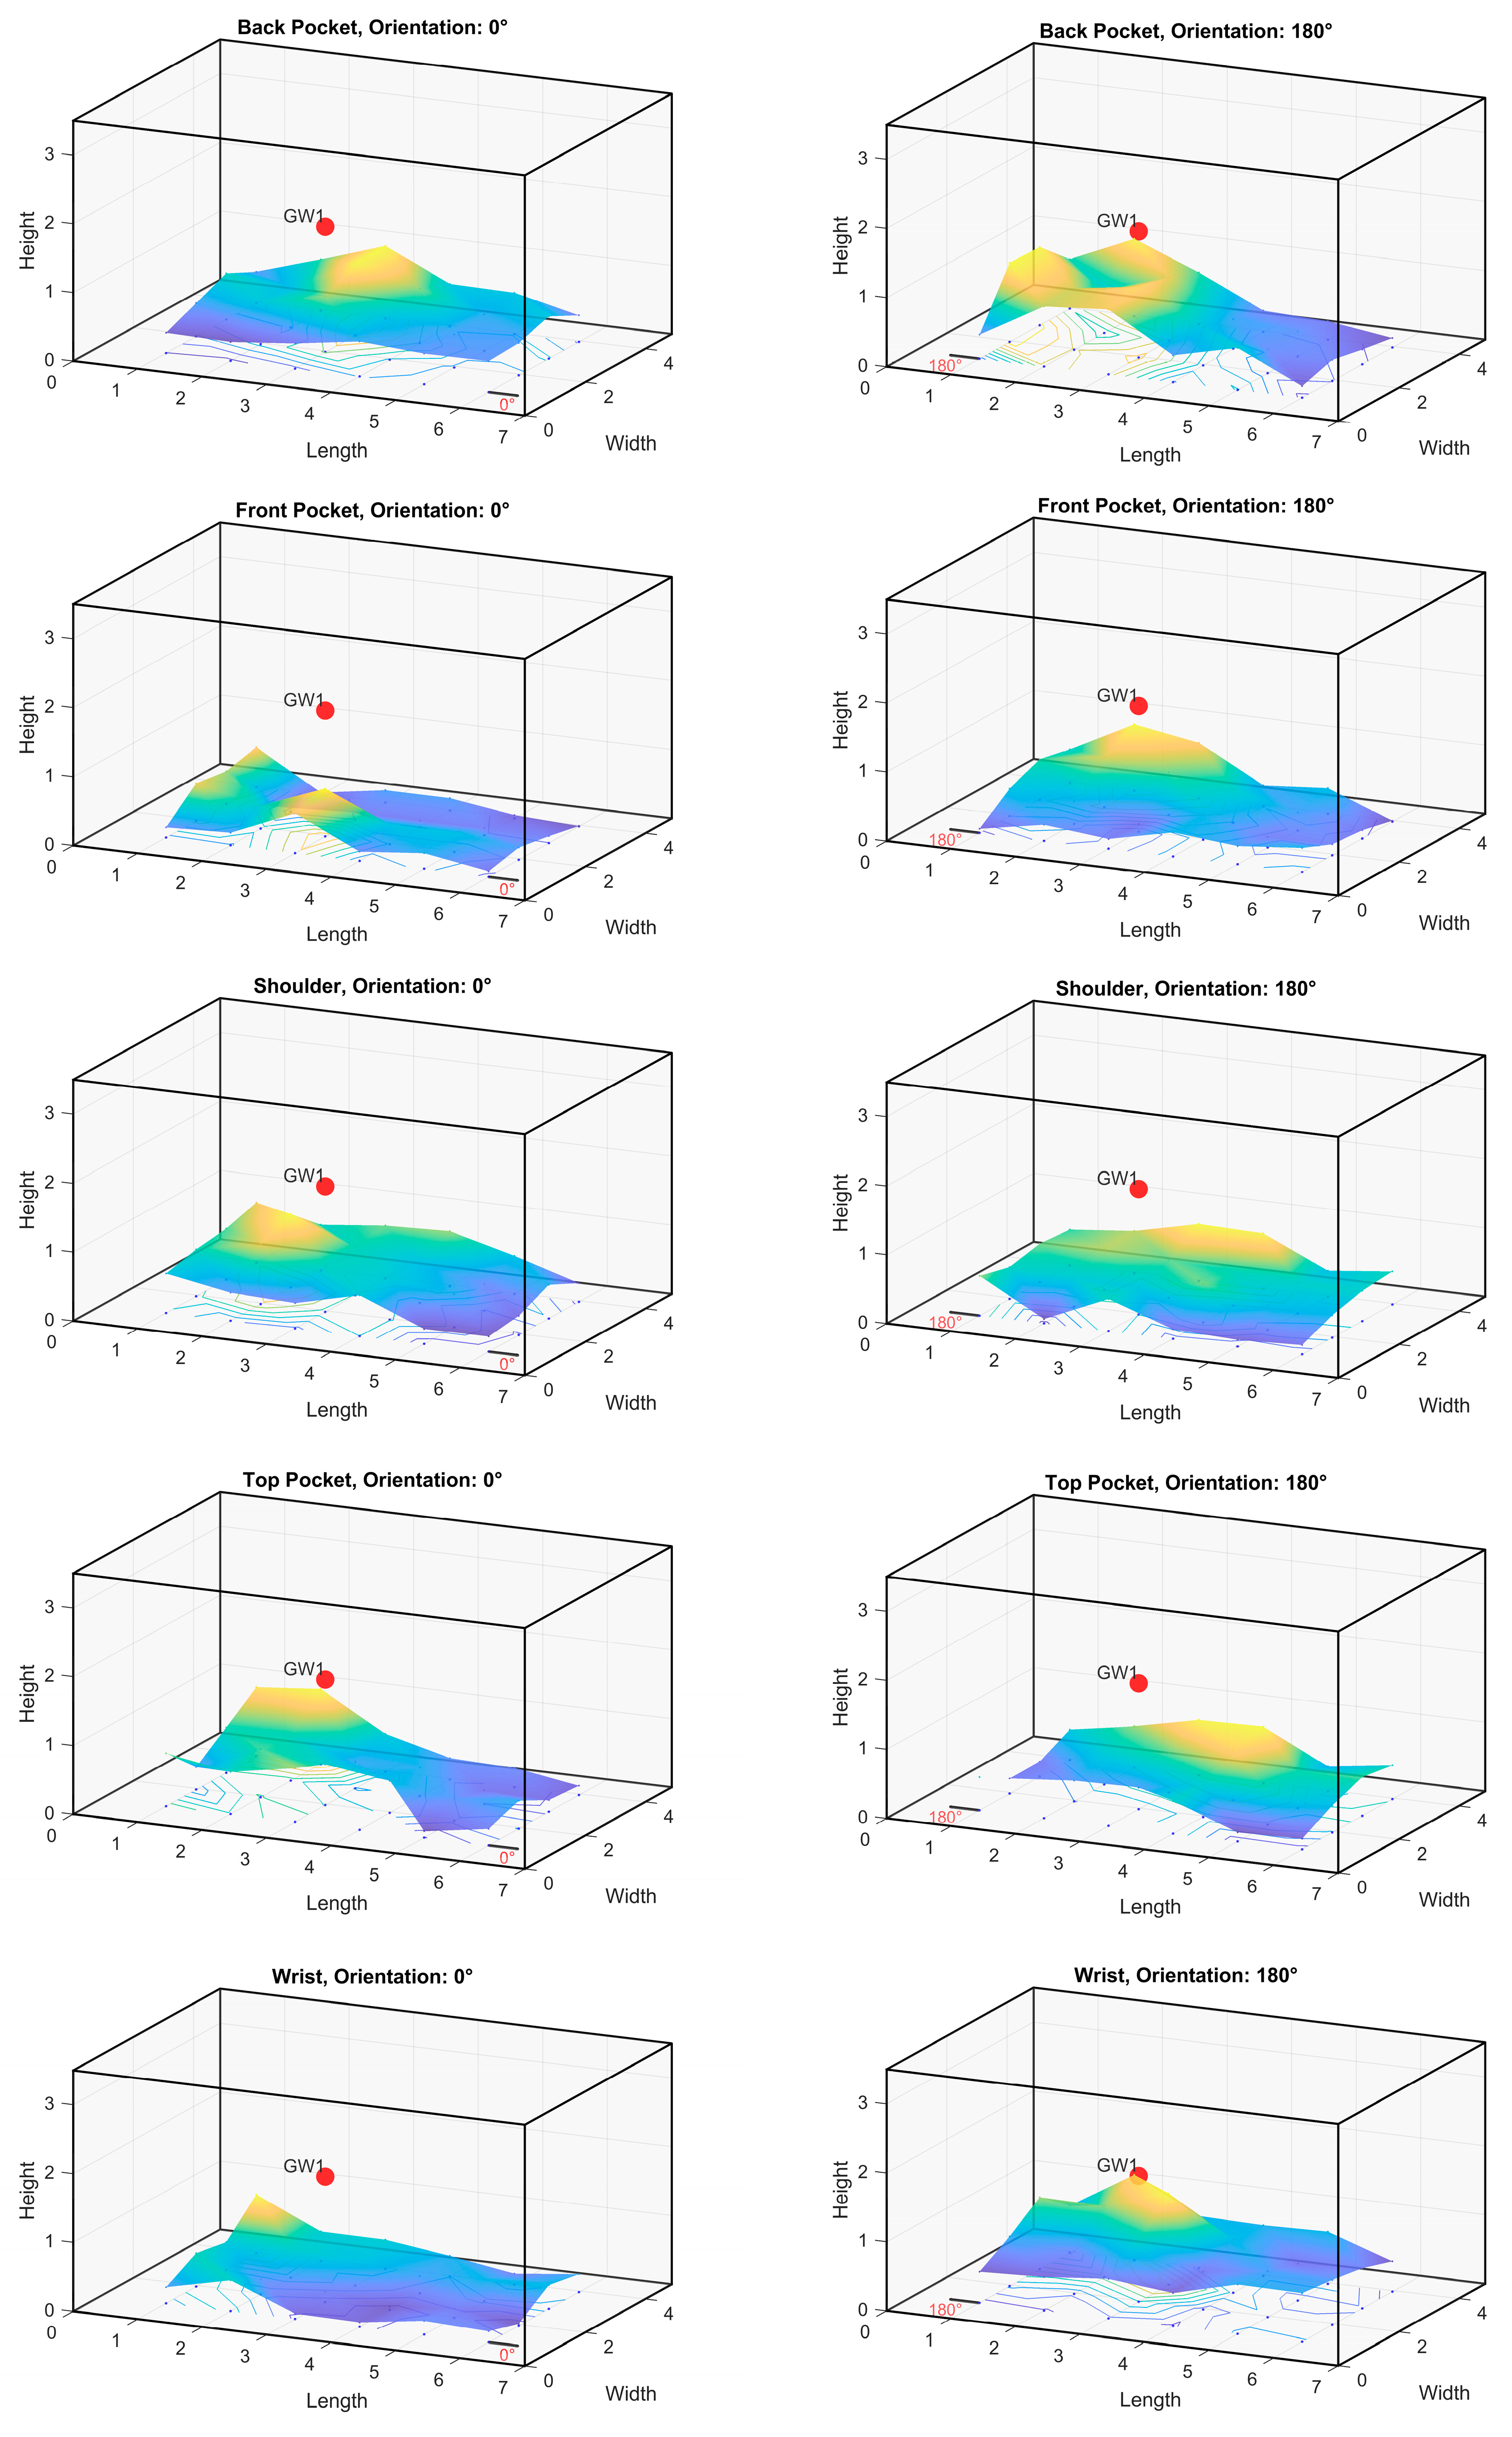
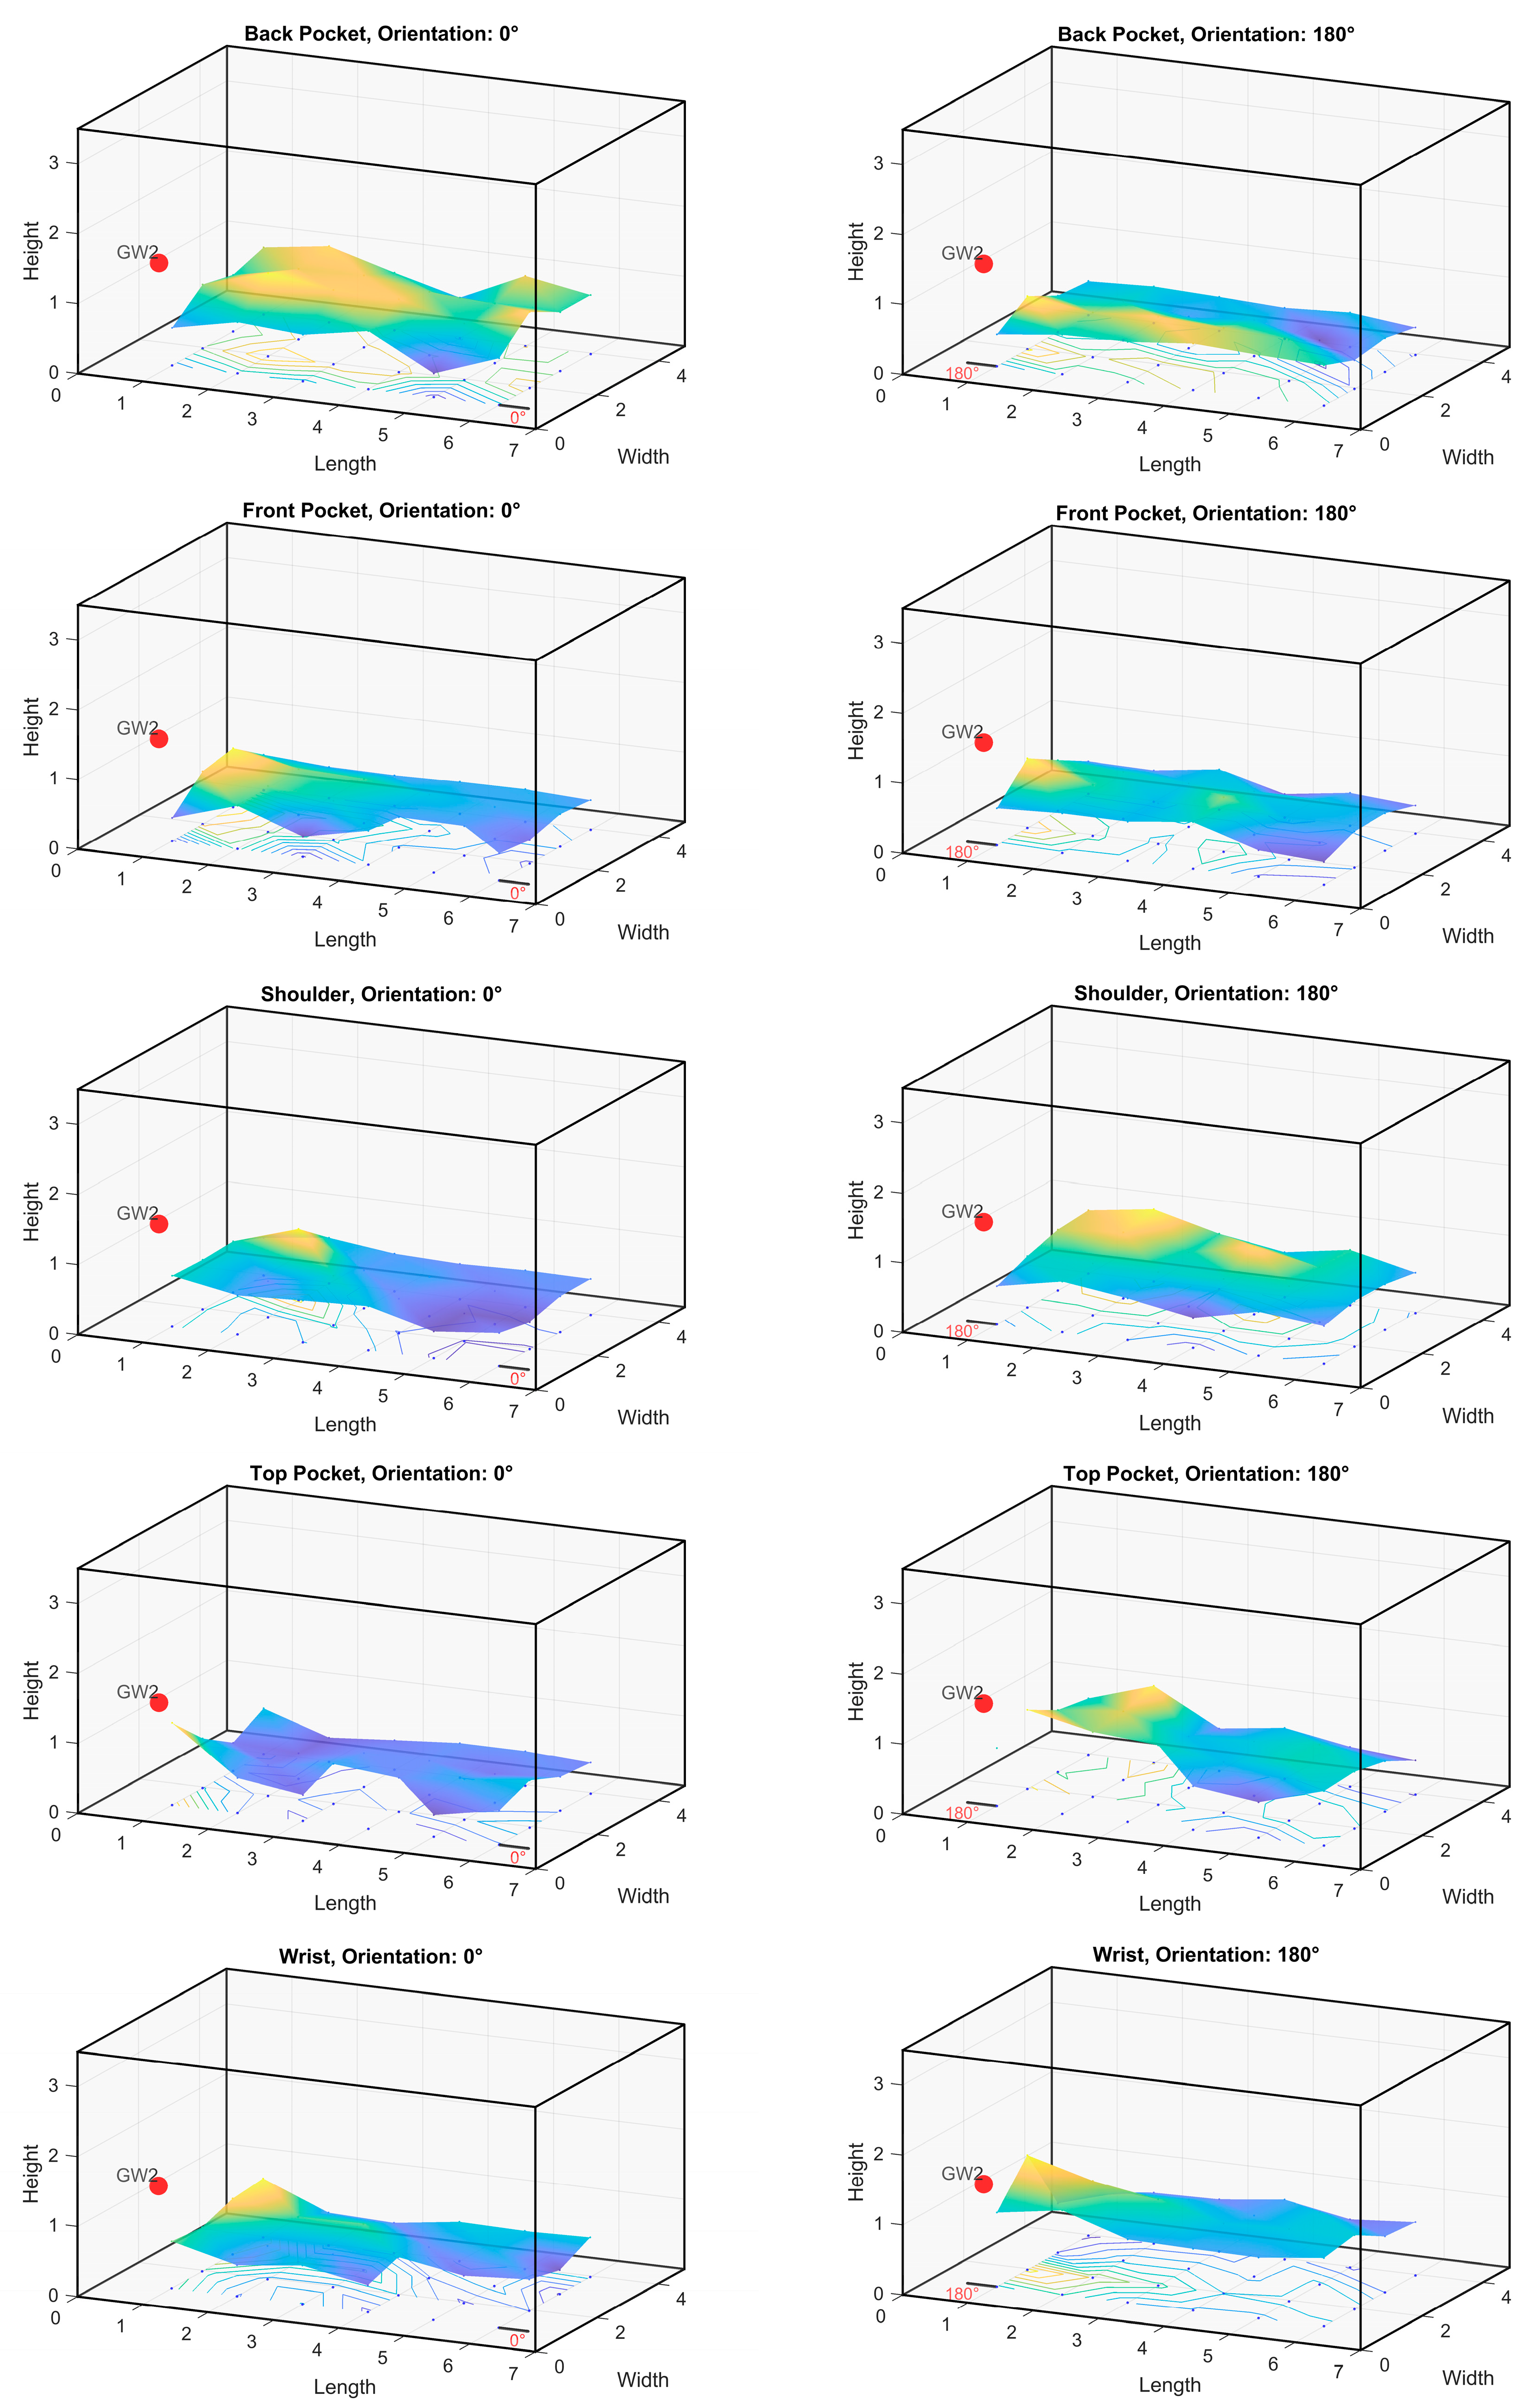
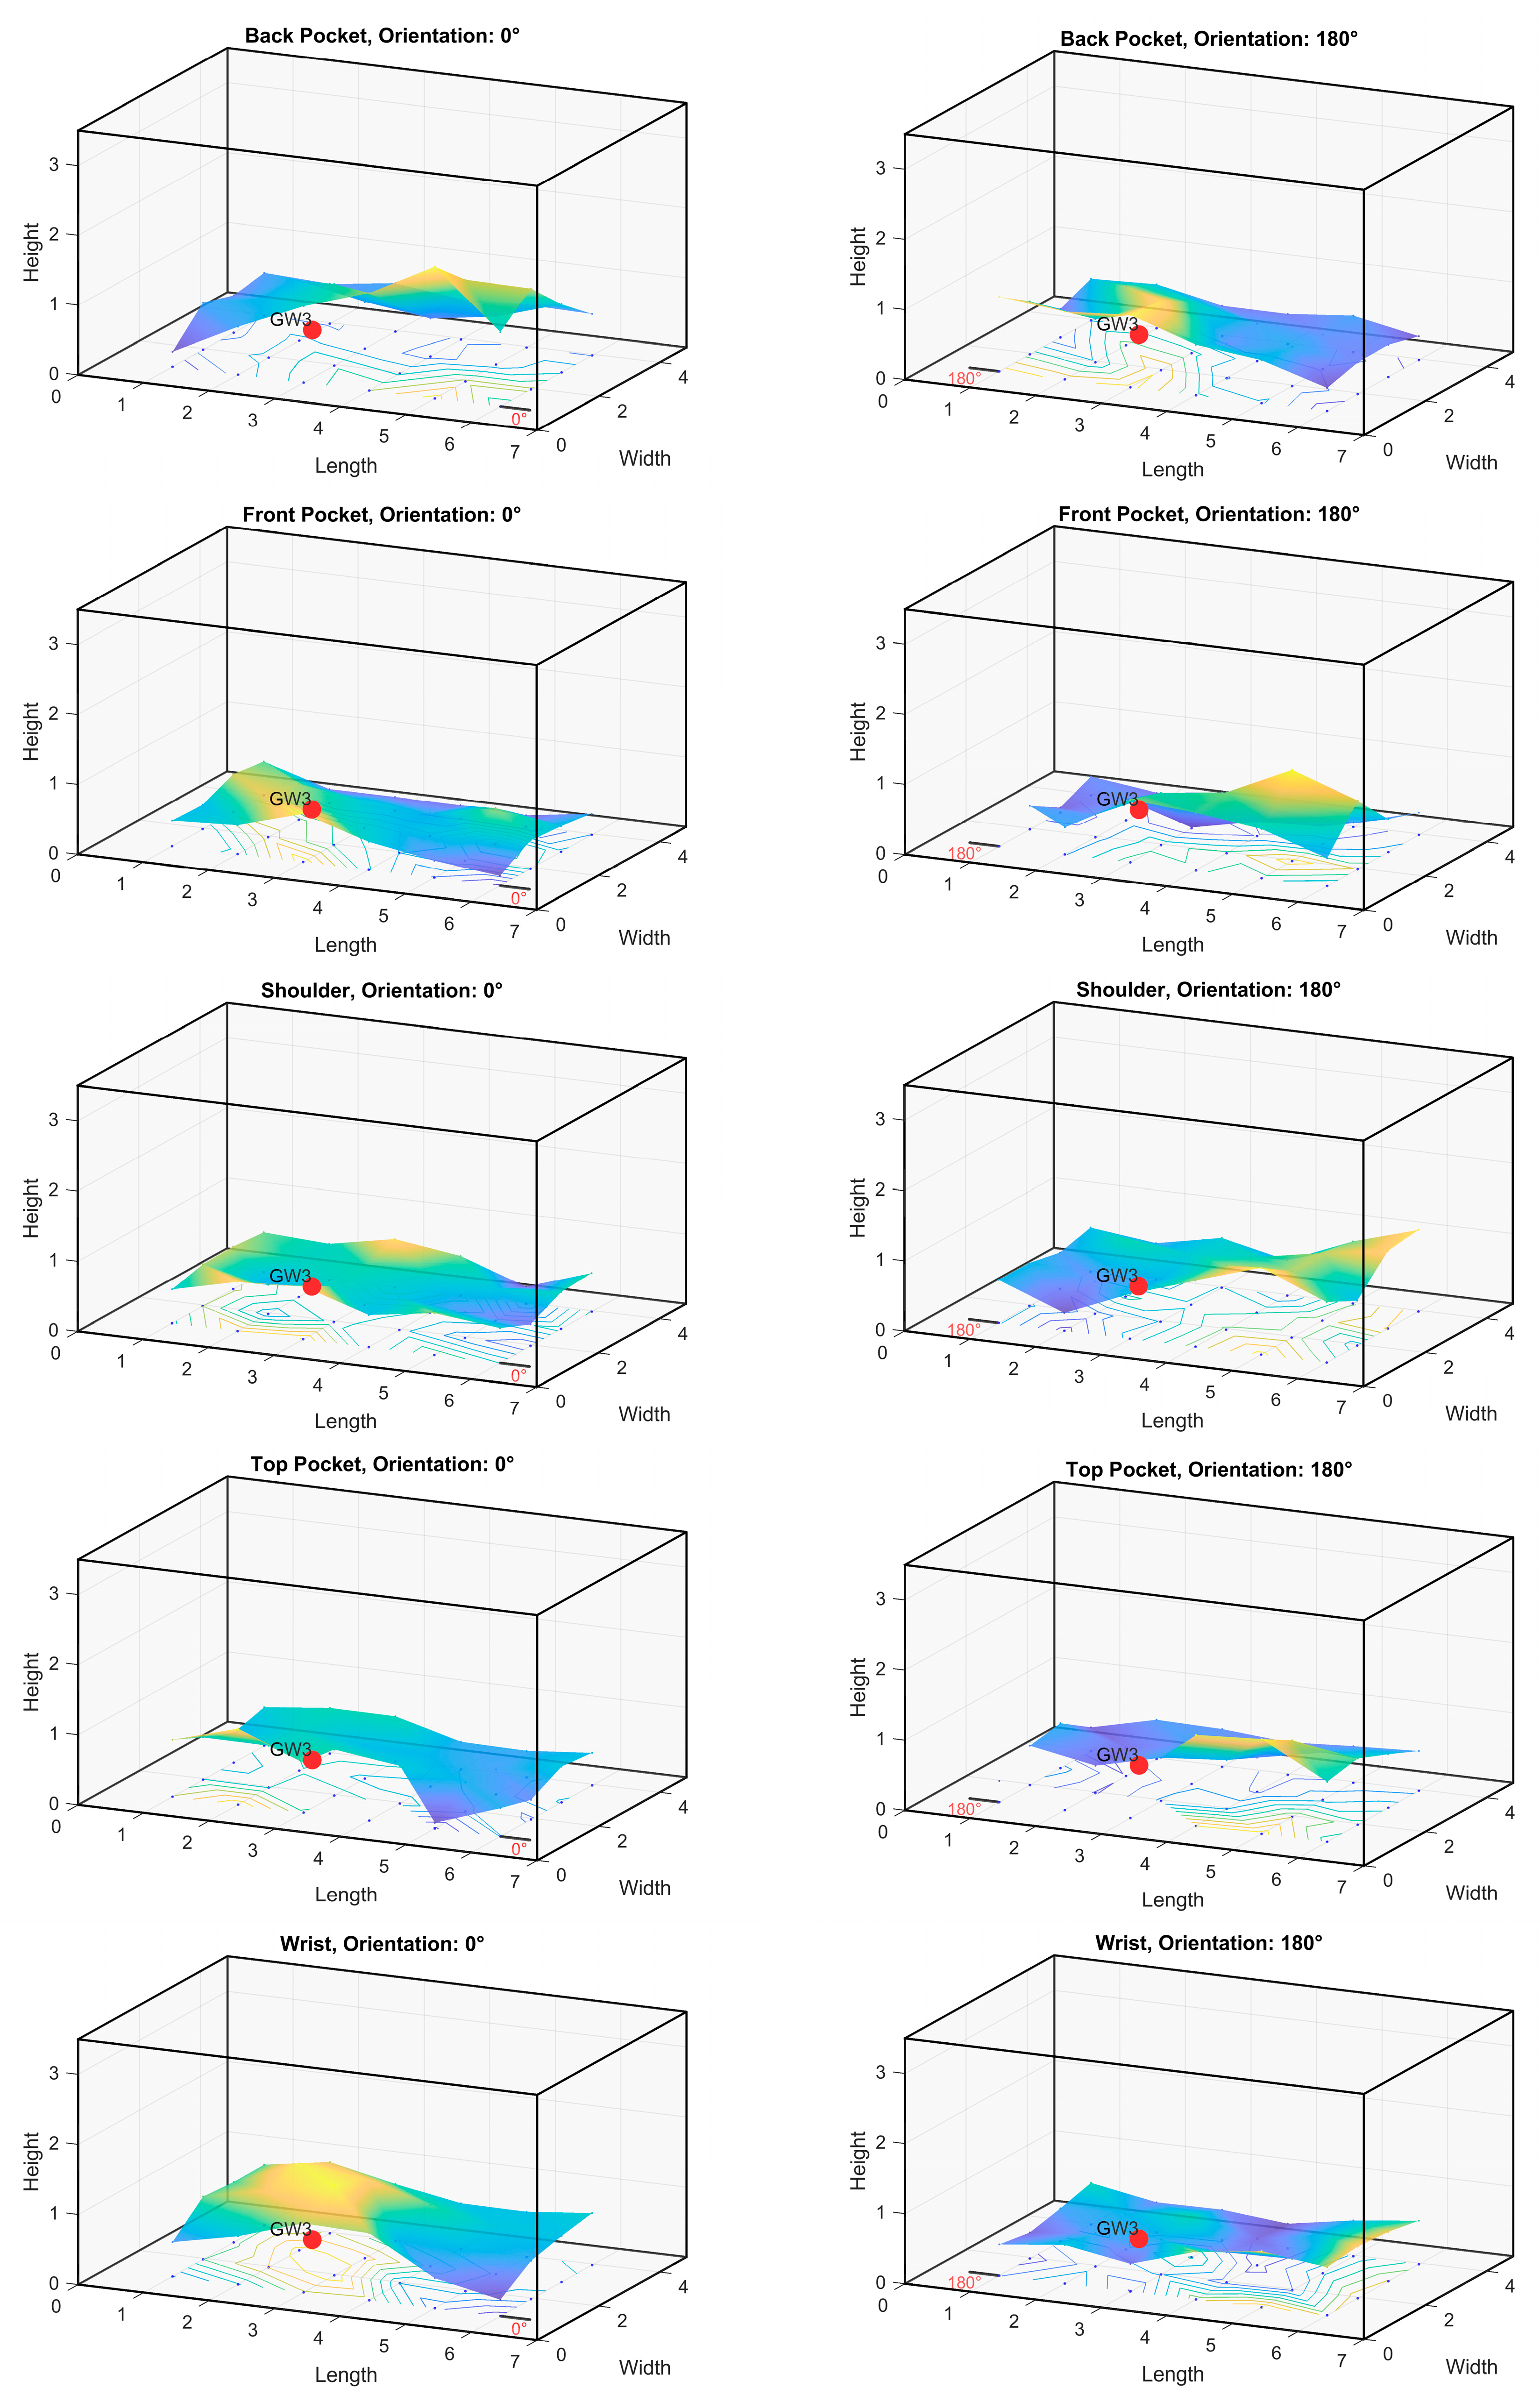
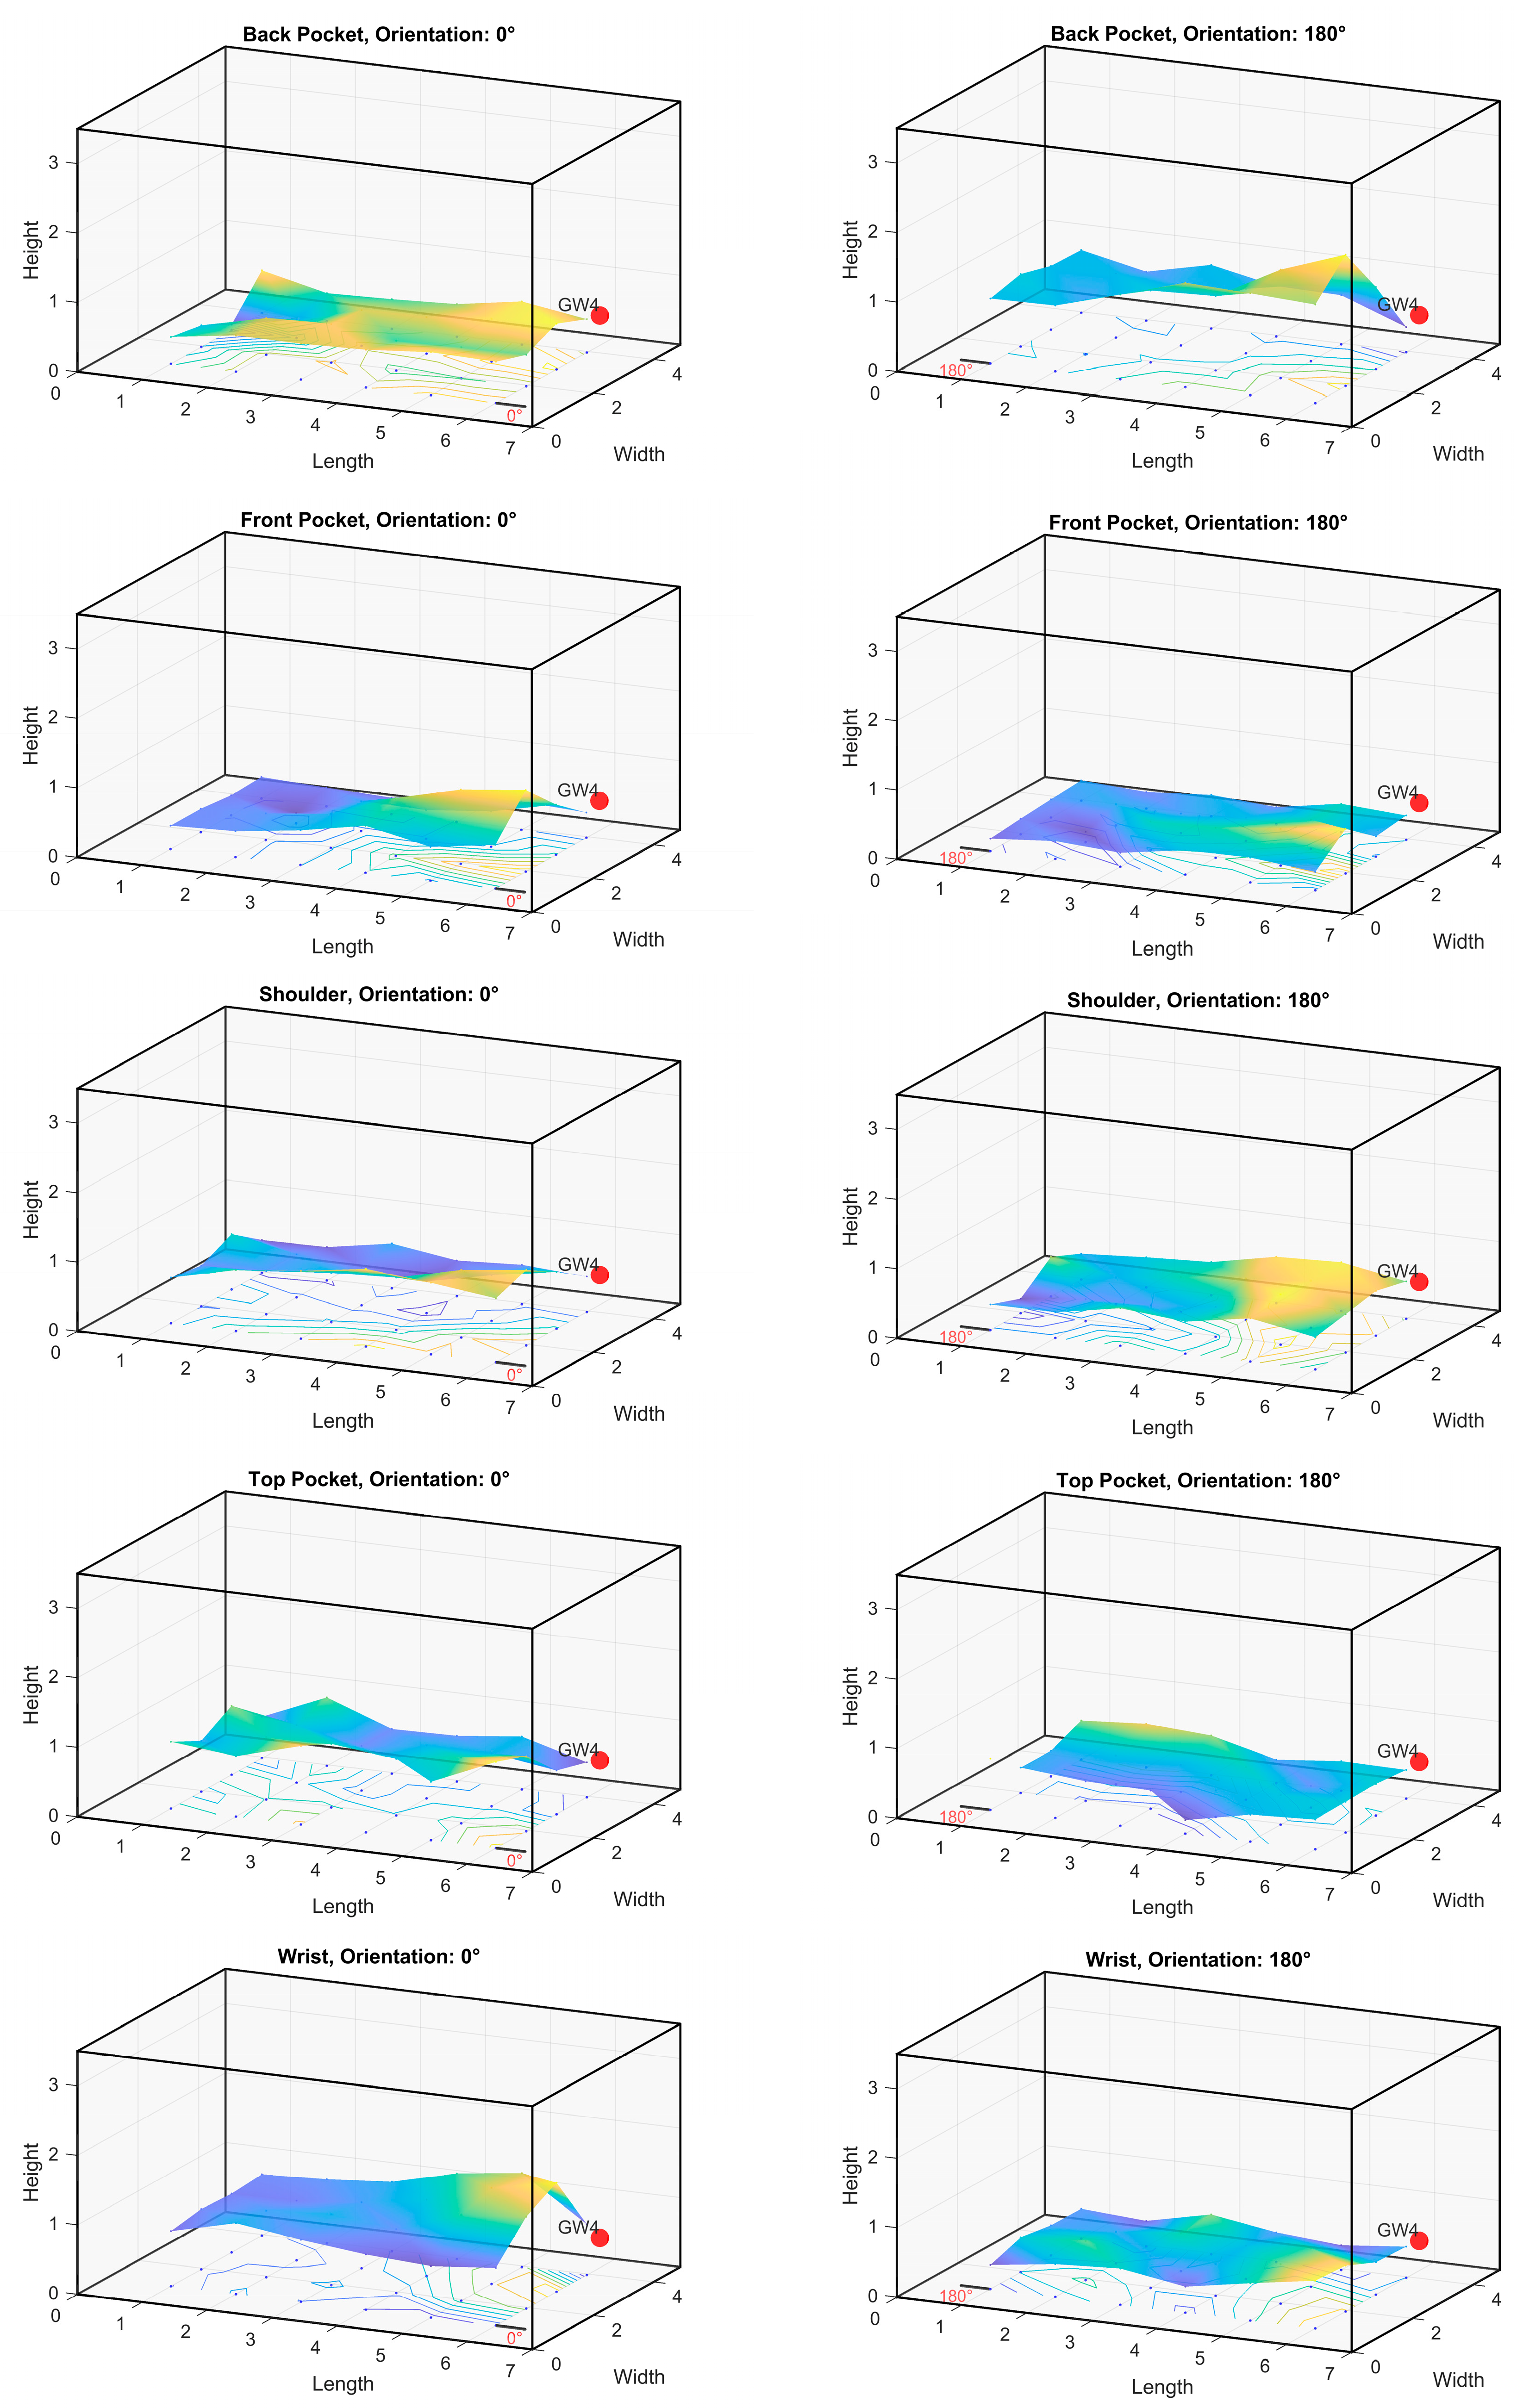
This paper evaluates Bluetooth Low Energy (BLE) signal reception in indoor environments, with a focus on the impact of various factors such as gateway placement, beacon positioning relative to the body, and the number of gateways on BLE signal strength and indoor localization accuracy. The primary contribution of this study lies in the dataset presented, which examines the influence of body position and gateway configuration on BLE signal reception. This dataset includes measurements of signal strength from multiple BLE beacons positioned at five distinct body locations: shoulder, chest pocket, wrist, and two pockets. These signals were received by 10 different gateways strategically placed throughout an indoor environment.
Section 2 describes the BLE signal collection setup, detailing the equipment used, preliminary investigations on gateway performance, and the impact of body positioning on signal strength.
Section 3 analyzes the characteristics of BLE signal segments, examining signal variability and stability at various body locations and comparing wall-mounted and ceiling-mounted gateway configurations.
Section 4 focuses on indoor localization accuracy using a Radial Basis Function approach, evaluating localization errors across different gateway setups and body positions.
2. BLE Signal Collection Setup
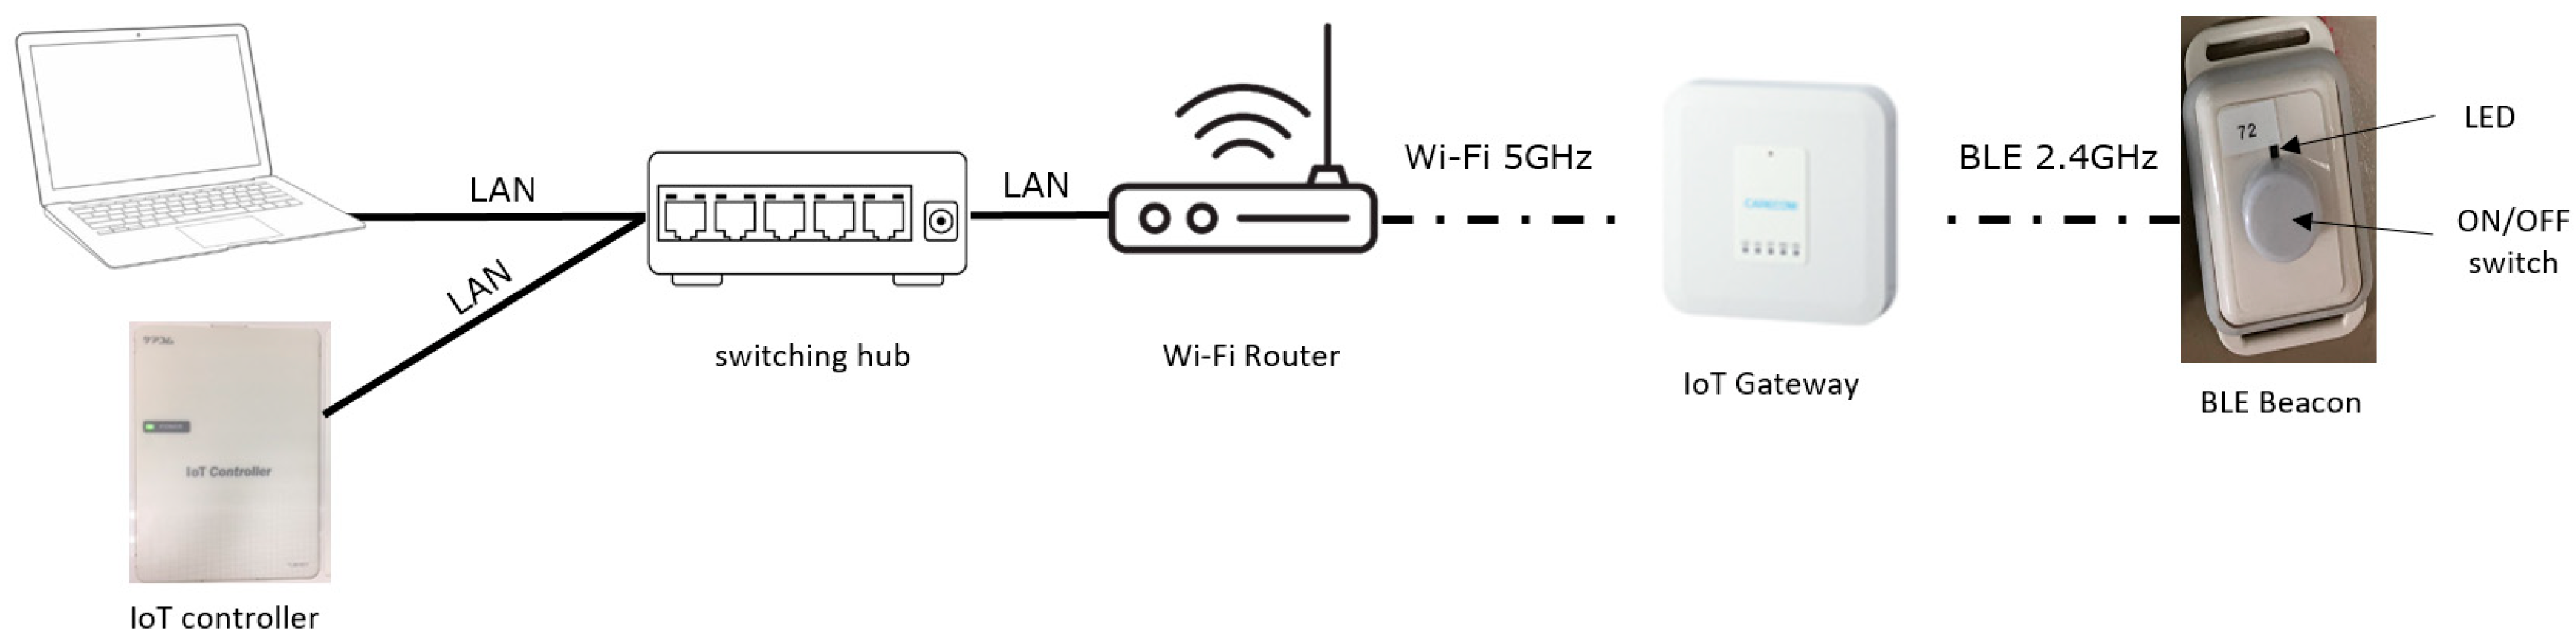
This study is conducted using Carecome equipment [
31], IoT Controller “TLM-001”, accessible through a web browser using a specific IP address and port, IoT Gateway “TRX-302-GW”, BLE tag “TTX-301-LG”, WiFi router, Switching Hub, and PC for WEB Console.
Figure 1 illustrates the setup of BLE signal mapping equipment and network architecture employed in the process.
2.1. Preliminary Investigations
The setup described in the next subsections is informed by preliminary investigations aimed at assessing the operational efficacy of the gateway (GW) and beacon components. In the preliminary test, the gateway was positioned at ground level, while the beacon was manually held at a distance from the tester, who moved through the room with strategically placed beacons. The results indicated that the GW effectively detected signals at short distances but struggled to distinguish signals at medium and long ranges. Notably, the number of signal measurements was higher when the beacon was in close proximity, suggesting that antenna positioning influenced signal characteristics. Suboptimal alignment, due to the gateway being placed on the floor and oriented towards the ceiling, caused signal degradation and loss as the tester moved further away.
In another test on the effect of distance on signal strength, two GWs were positioned at a height of 1 m on opposite walls, 7 m apart. The received RSSI was measured at various points between the GWs. The results showed a significant decline in signal strength as the distance increased, demonstrating the impact of distance on signal attenuation. Further analysis of RSSI stability and the body effect was conducted with GWs positioned on the ceiling. Four GWs were symmetrically arranged, and RSSI values were measured at various points, accounting for the body effect. The results showed stable and frequent signals, with variations in signal strength depending on the tester’s orientation. The body effect was observed as a reduction in signal strength, particularly when the tester’s body was positioned between the GW and the beacon.
In the final test investigating the impact of body effects on signal data, involving GWs and beacons, observations revealed variations in signal fields at different angles and distances, with notable anomalies at longer ranges. The body effect was particularly significant when GWs were positioned in front of and behind the tester. Asymmetry and signal irregularities were observed in scenarios involving multiple GWs.
2.2. BLE Beacon Position on the Body
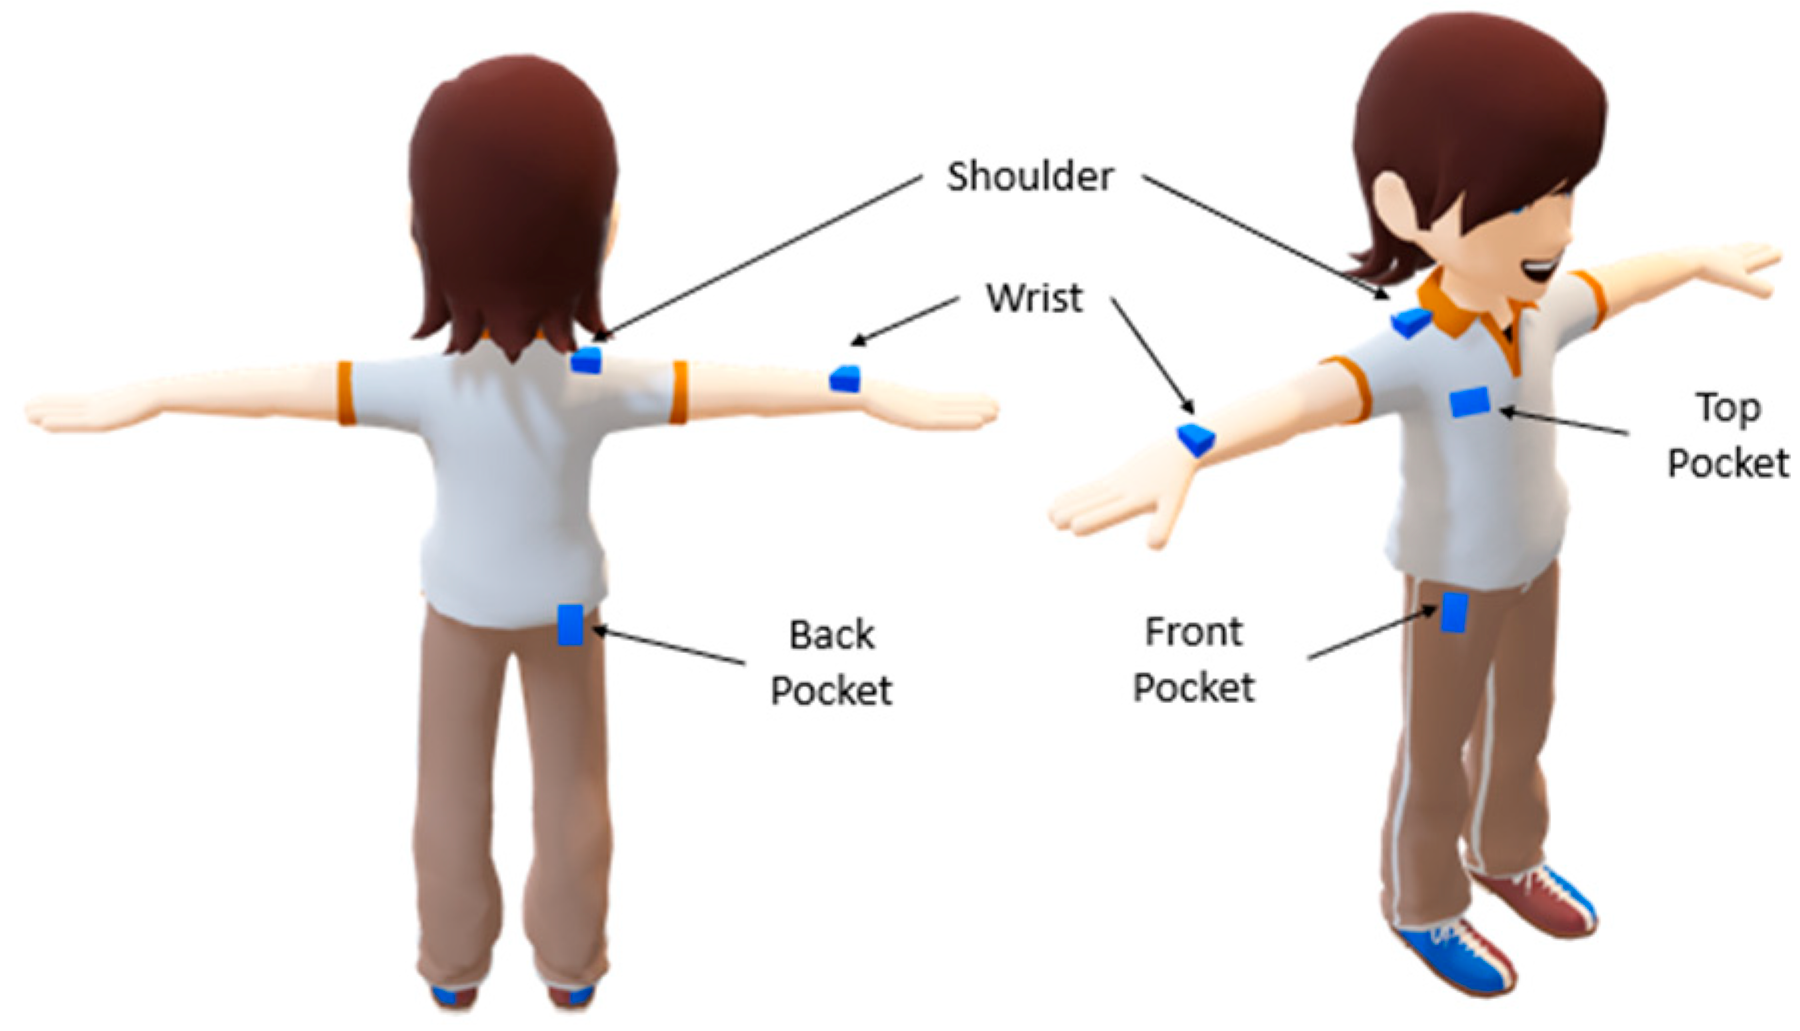
Five beacons were placed on a male subject, measuring 170 cm in height and weighing 71 kg. The beacons were positioned at the following locations: left shoulder, left chest pocket (top pocket), wrist, lower front pocket (front pocket), and lower back pocket (back pocket). These positions were chosen based on typical behavior, with three of the locations representing common pocket placements where individuals often store small items similar in size to the beacons.
The wrist beacon was worn on a watch strap. The beacons in the top, front, and back pocket positions were inserted inside the respective pockets. The shoulder beacon was affixed to the fabric of the shirt using adhesive. During the measurement process, only the subject was present in the indoor location, and no smartphones were permitted in the area.
The design aimed to minimize the invasiveness of the device positions. The wrist position was included due to its common use for wearing watches, making it both visible and natural. Although the shoulder position is less frequently utilized, its potential technical advantage lies in reduced signal interference with the human body, despite being more invasive compared to other locations.
Figure 2 illustrates the BLE device positions on the body.
2.3. Gateway Receiver Setup
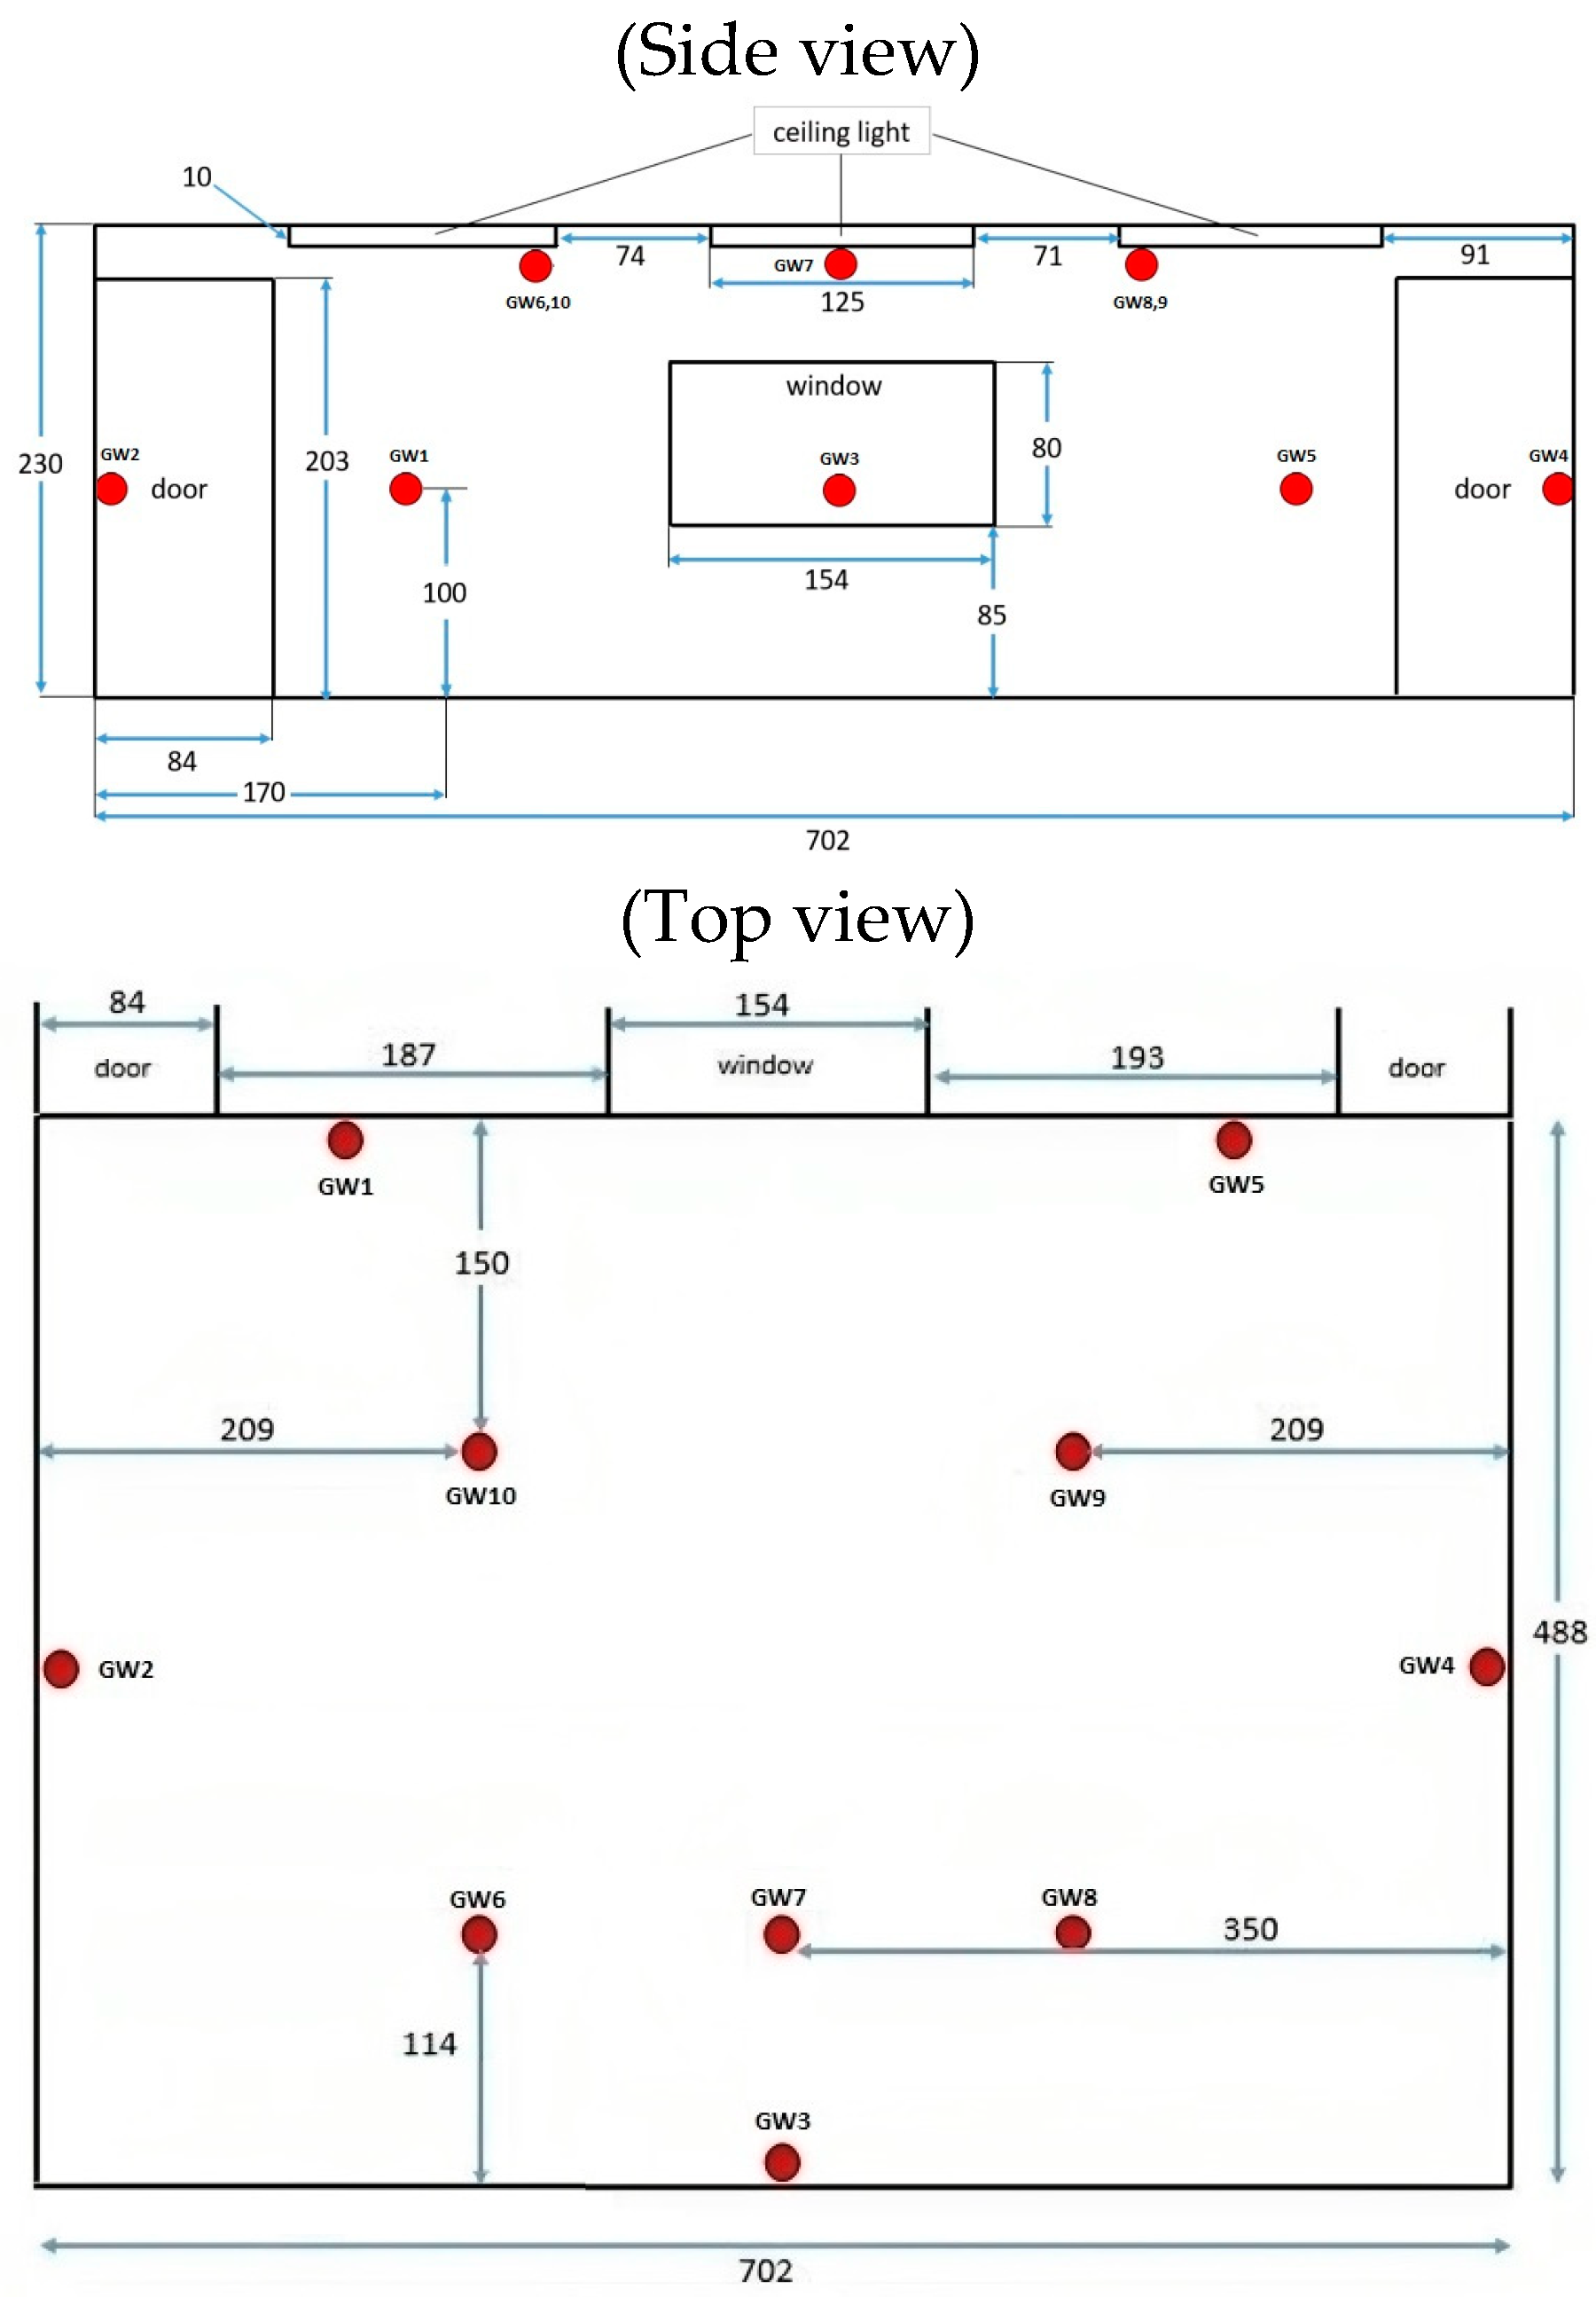
The study also investigated the configuration of gateways to assess their impact on BLE signal reception performance. Ten gateways were deployed across the area, with five placed on the walls and five on the ceiling. The ceiling-mounted gateways were attached to light frames and oriented toward the room’s center to minimize signal loss due to narrow angles. To evaluate the configuration, the diode feature of the new gateway generation was employed, with the blinker diode used to monitor signal receipt from all corners of the room for each gateway. The findings were further validated through data analysis. Wall-mounted gateways generally did not encounter issues.
Figure 3 provides a schematic representation of the deployment of gateway receivers within the indoor environment, illustrating their spatial arrangement and distribution.
2.4. Signal Map Setup
In this study, the indoor location is defined by the coordinates of positions in a two-dimensional space, relative to a coordinate reference point located at the bottom-left corner of the designed indoor space.
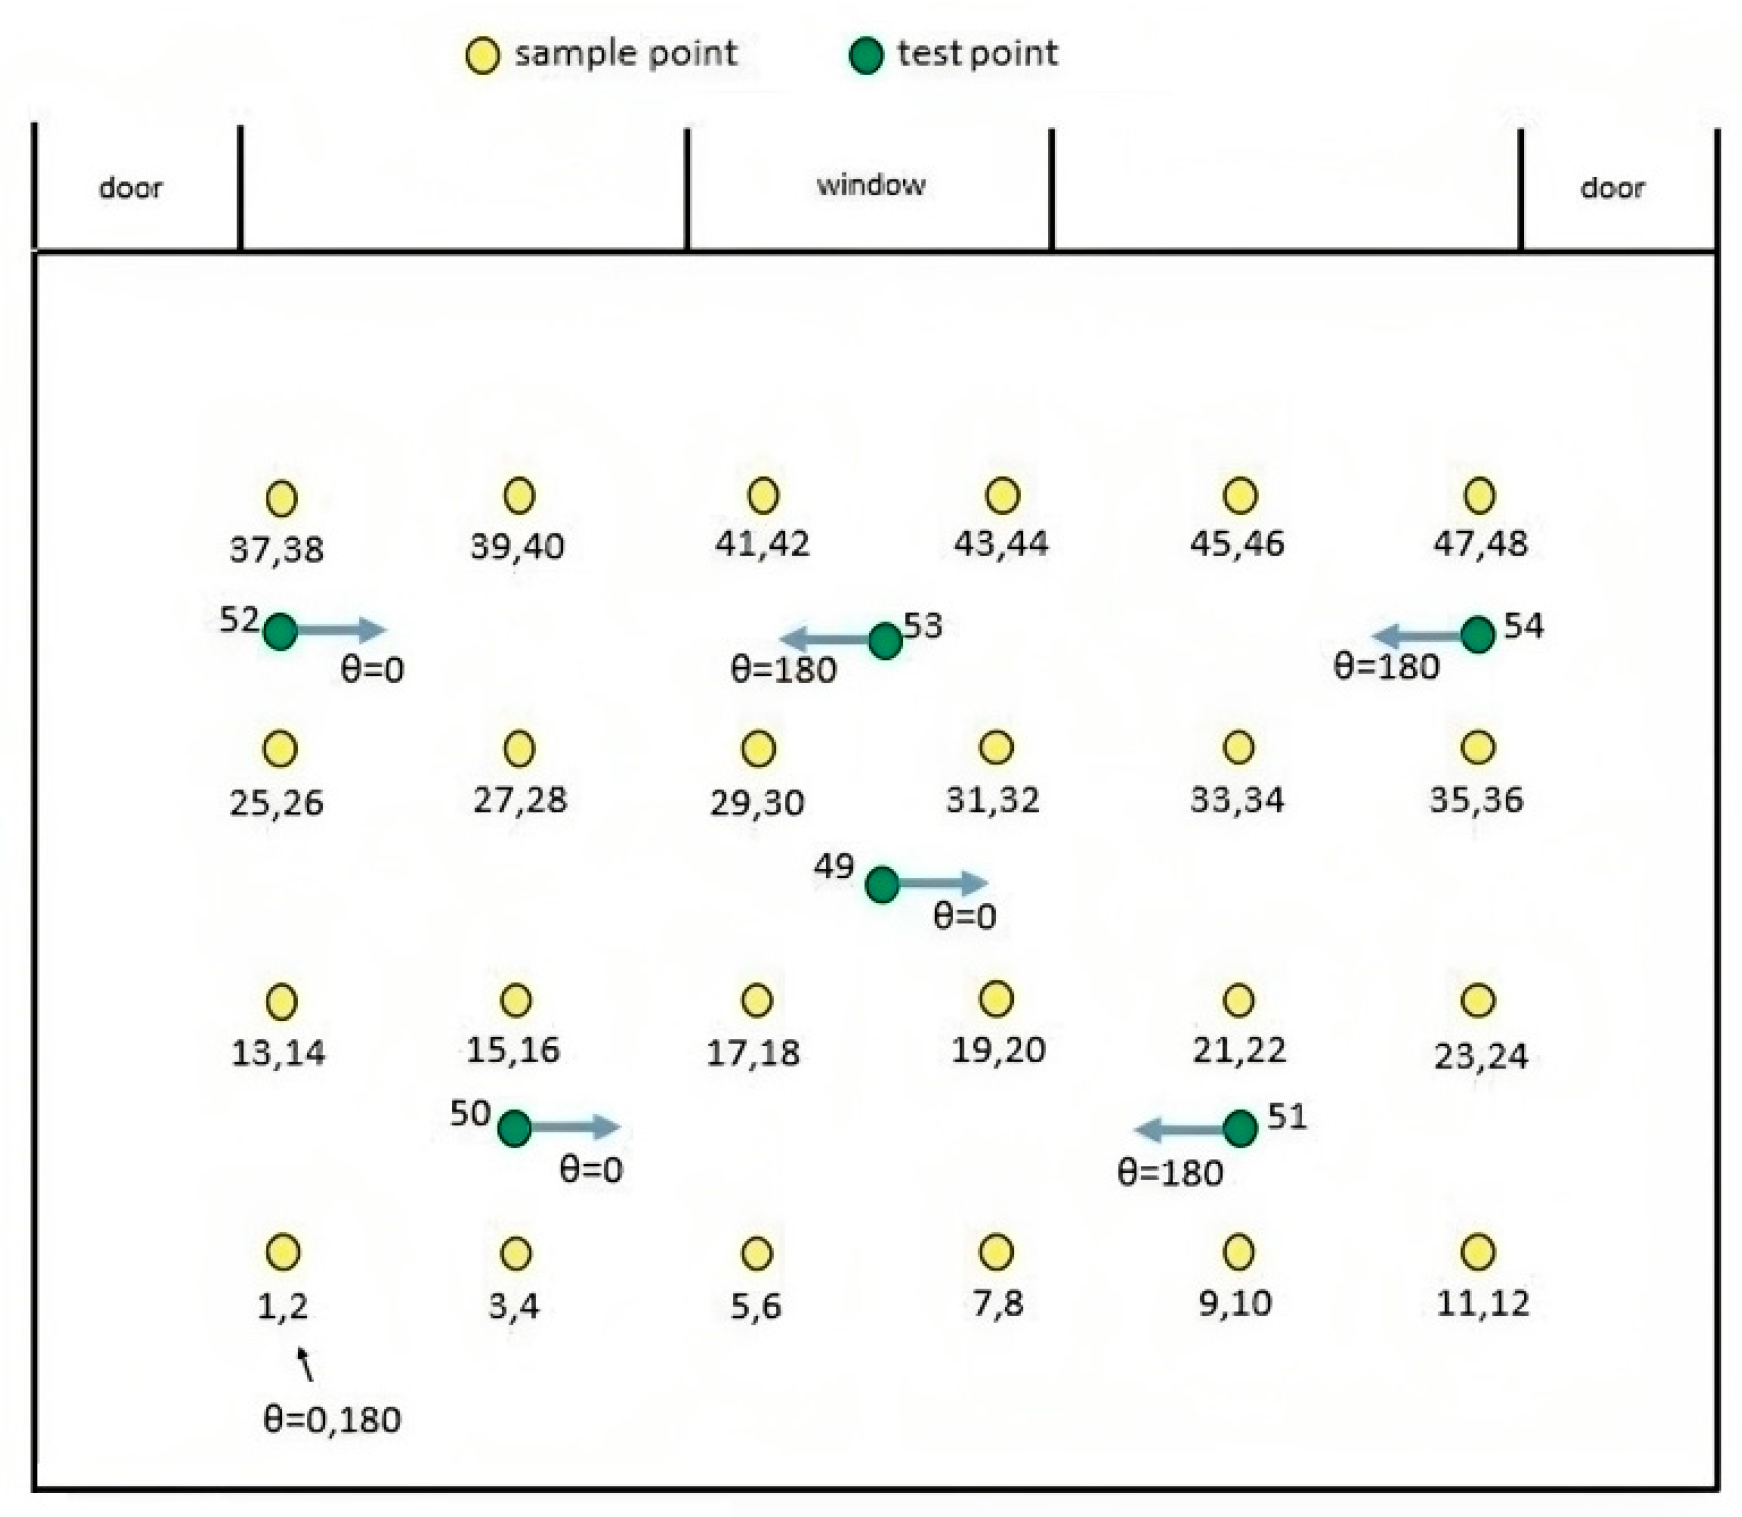
For the signal map used in the localization models, a grid was established with 1 m spacing between 24 neighboring positions. At each position, signal measurements were taken while standing, once facing the left (180°) direction and once facing the right (0°) direction, resulting in 48 sample positions.
The BLE signal broadcasts at a frequency of 1 Hz, with signal measurements taken at each point for a duration of 3 min. All 10 gateways were used to capture signals from the 5 BLE beacons. Six test points, shown in green, were selected to measure the signal for 3 min, chosen to represent varying levels of signal reception difficulty. In total, 2700 signal data points were collected for the experimental models. This database has been shared with BLE signal researchers for further studies.
Figure 4 illustrates the arrangement of signal measurement positions within the indoor space.
3. BLE Signal Analysis
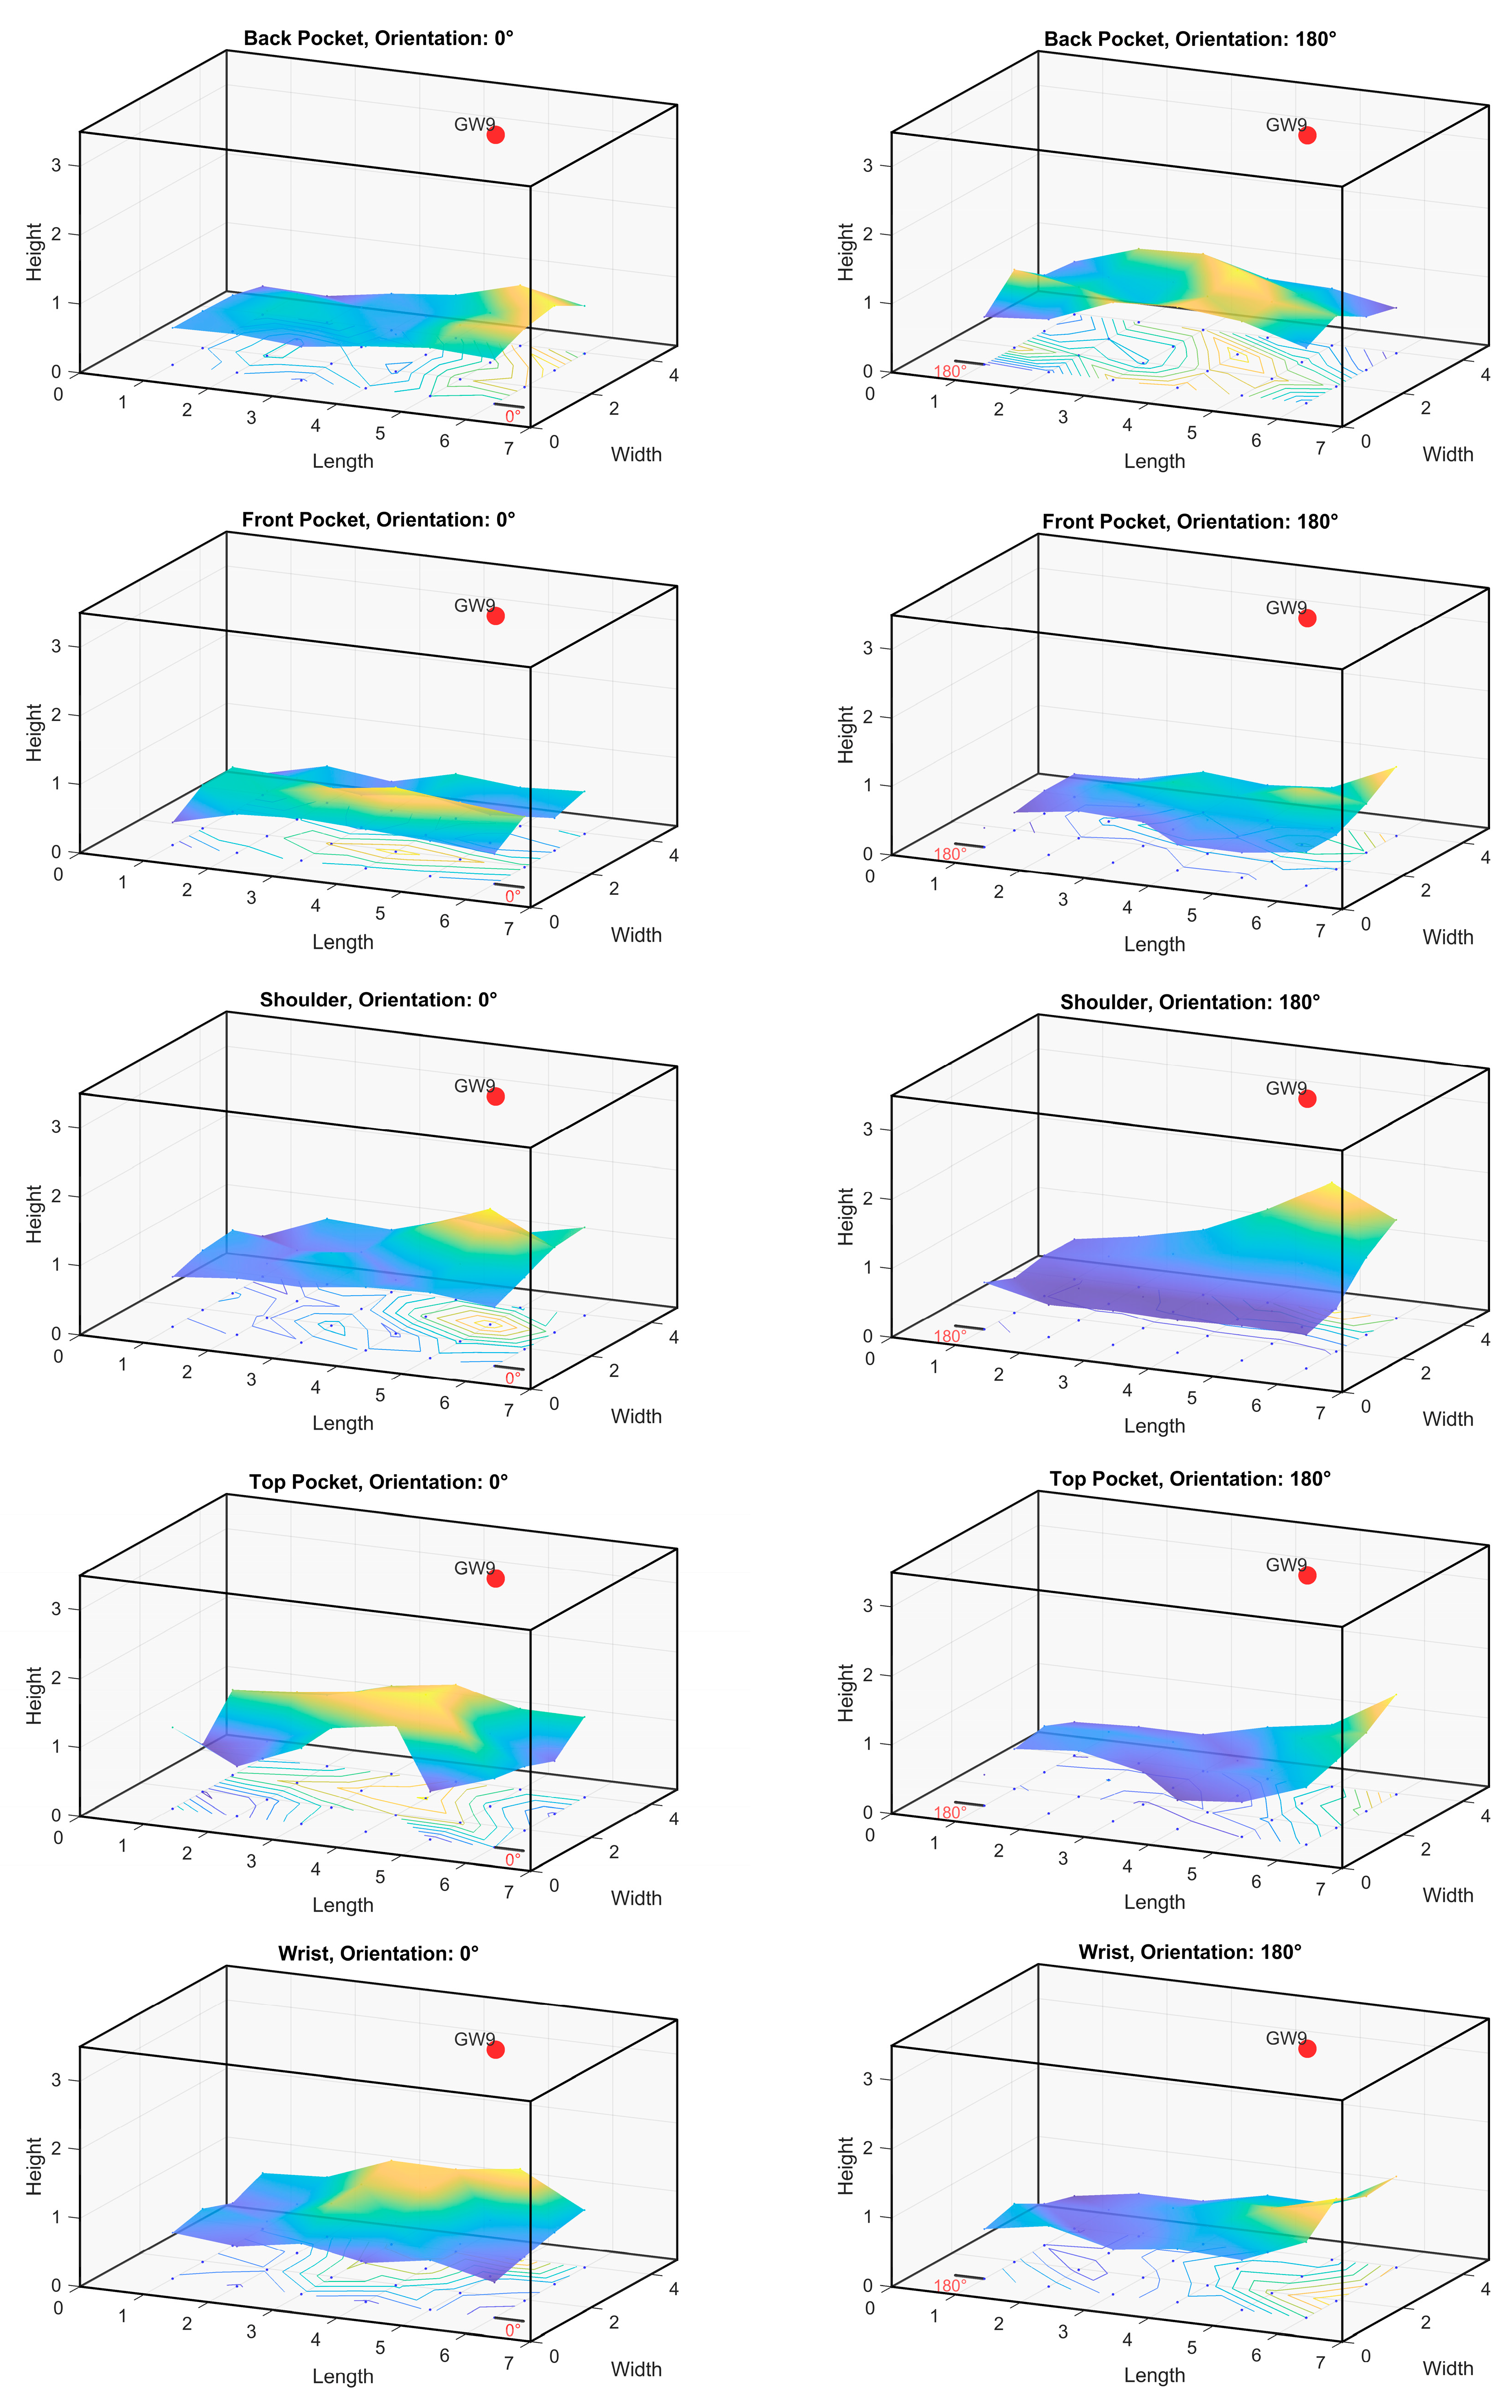
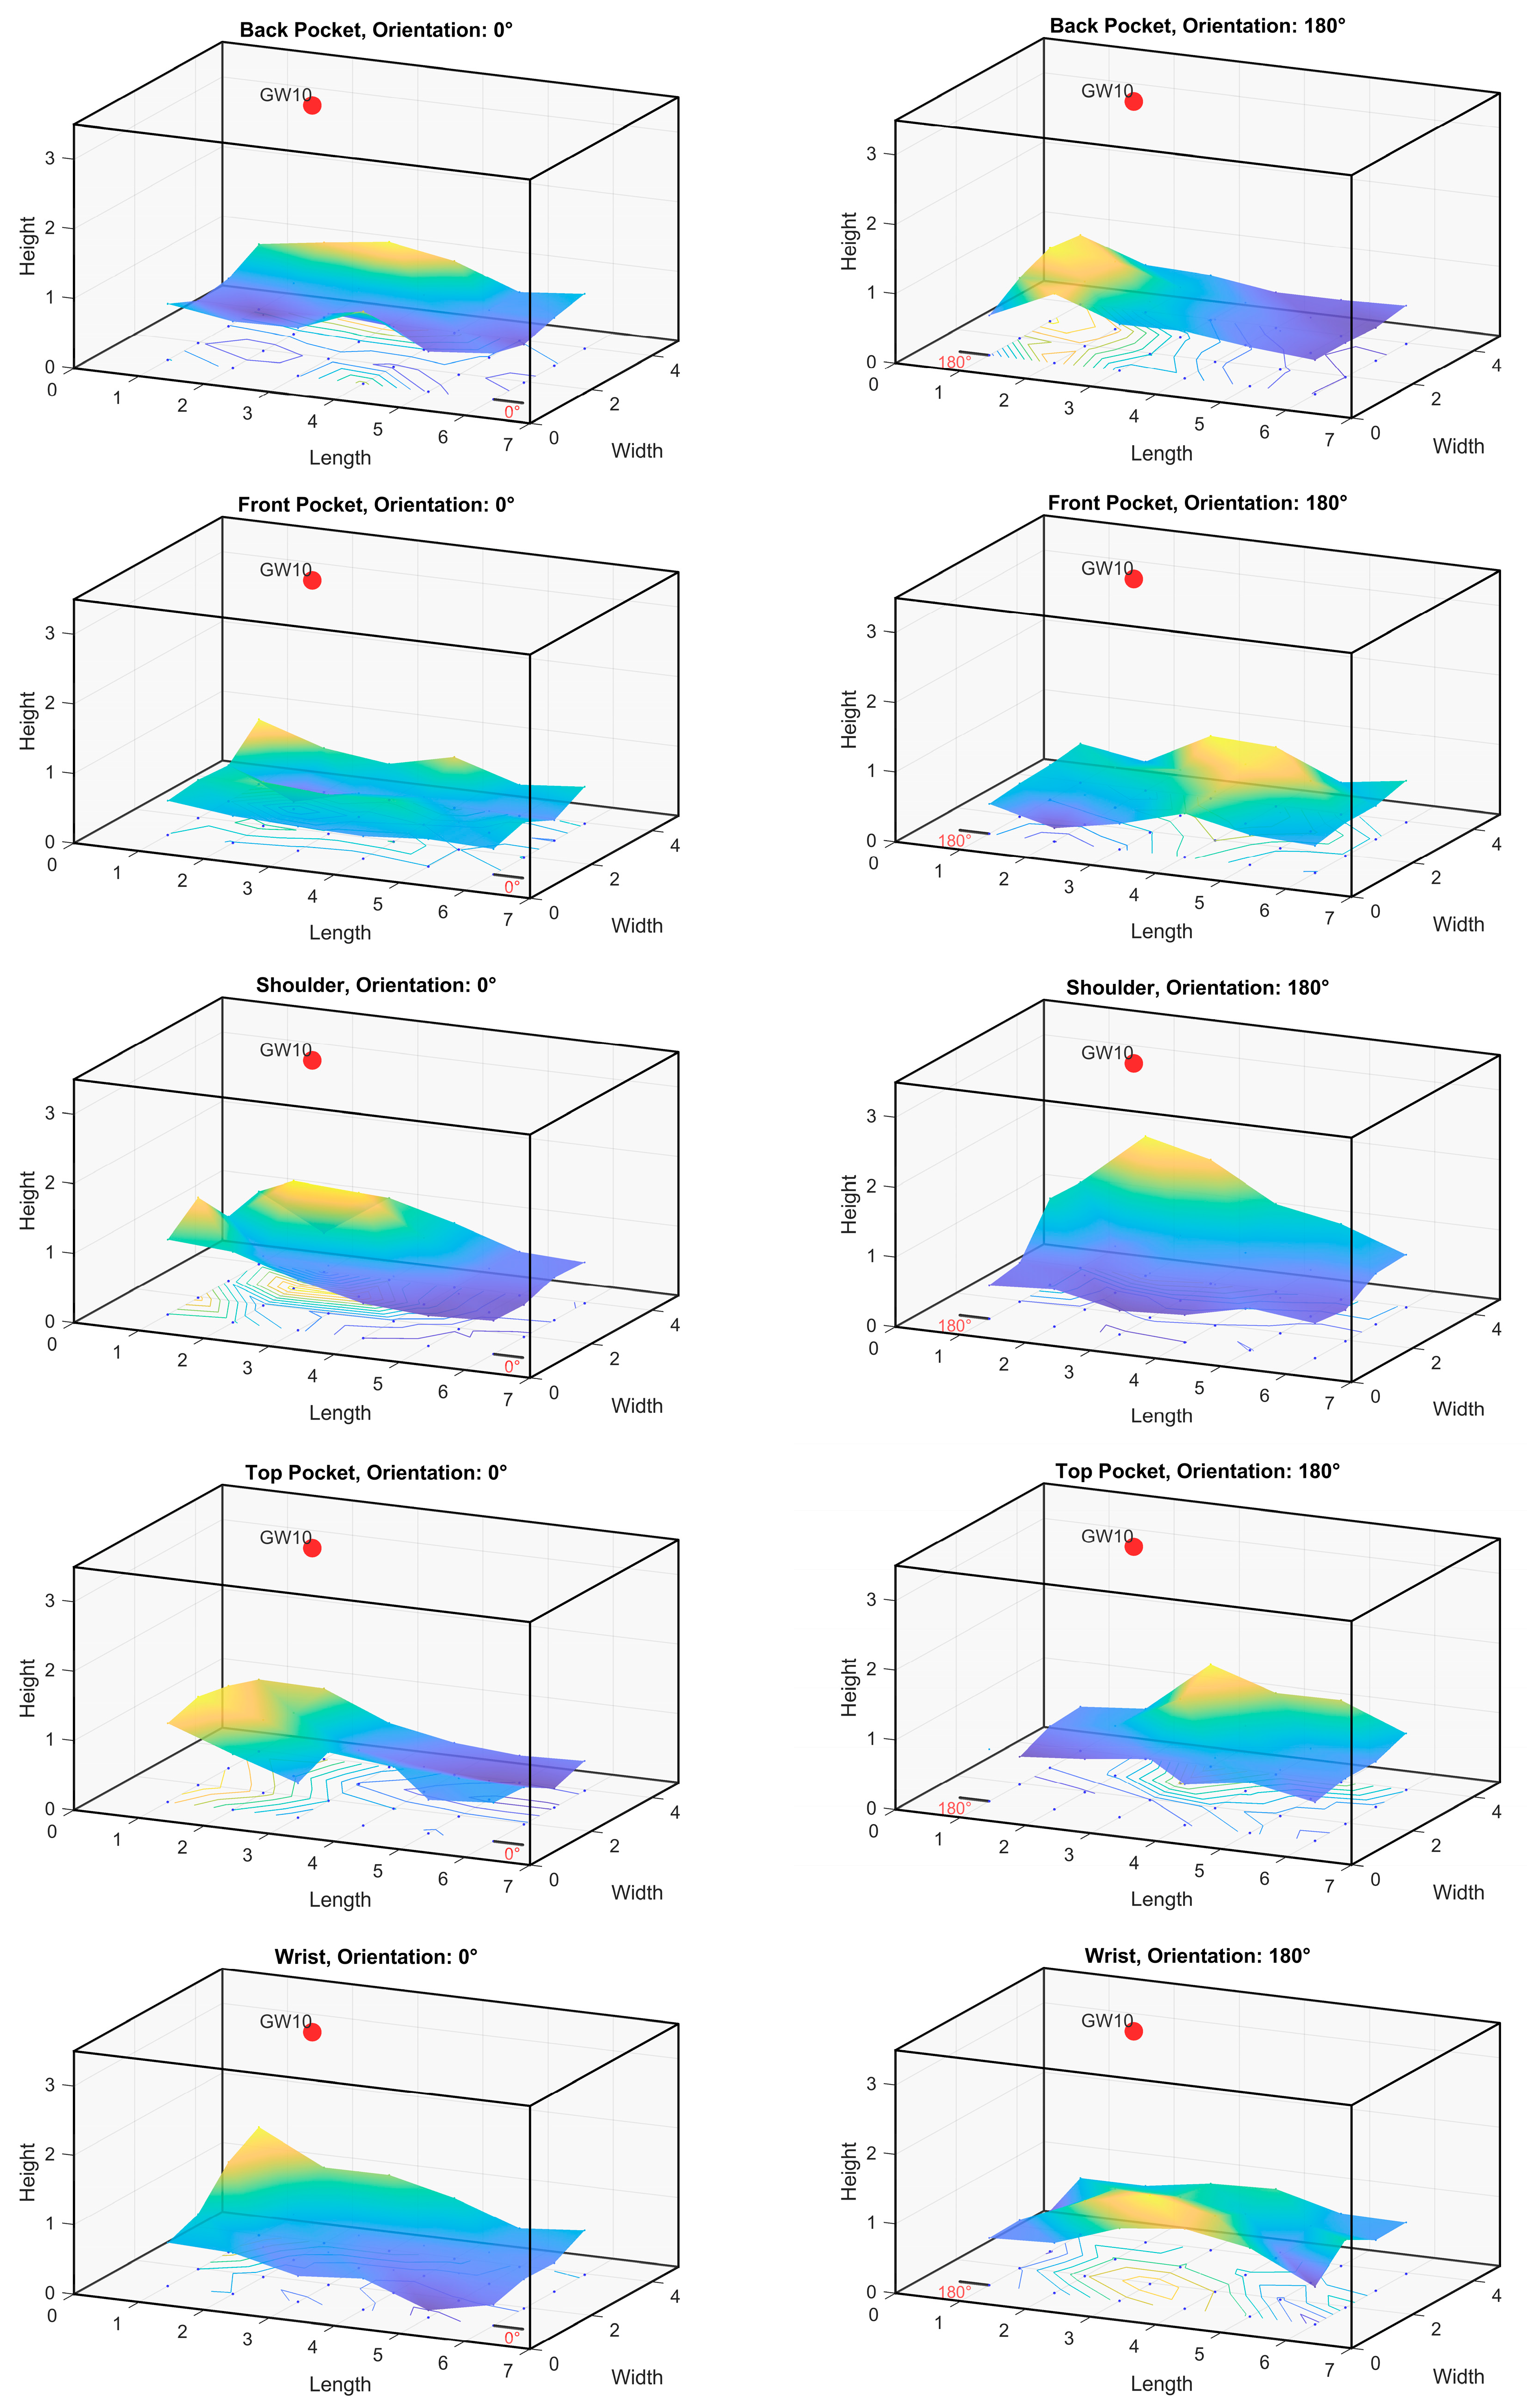
During signal measurement, signals emitted by the BLE devices (positioned in the front pocket, back pocket, top pocket, shoulder, and wrist) were recorded in distinct time segments. Each segment corresponds to the signal emitted over a 180 s period, with the signal transmitted once per second (1 Hz). The length of these segments was determined by the number of signal measurements recorded during this 180 s interval.
To categorize the segments as either short or long, threshold values were applied, ranging from 10% (equivalent to 18 measurements) to 100% (equivalent to 180 measurements). The goal of this analysis was to examine the variability and stability of signal values across different body positions.
3.1. Wall Gateways BLE Signal Segments
For the wall gateways, variations in signal segment lengths were observed regardless of the BLE device position. Analysis of the signal characteristics over 3 min revealed distinct patterns. The average signal values consistently decreased across all BLE positions. Specifically, the front pocket, back pocket, and top pocket positions exhibited a consistent decrease in mean values, indicating that shorter signal segments were generally associated with lower signal strength. Additionally, the standard deviation increased with shorter segments, indicating greater variability in signal strength.
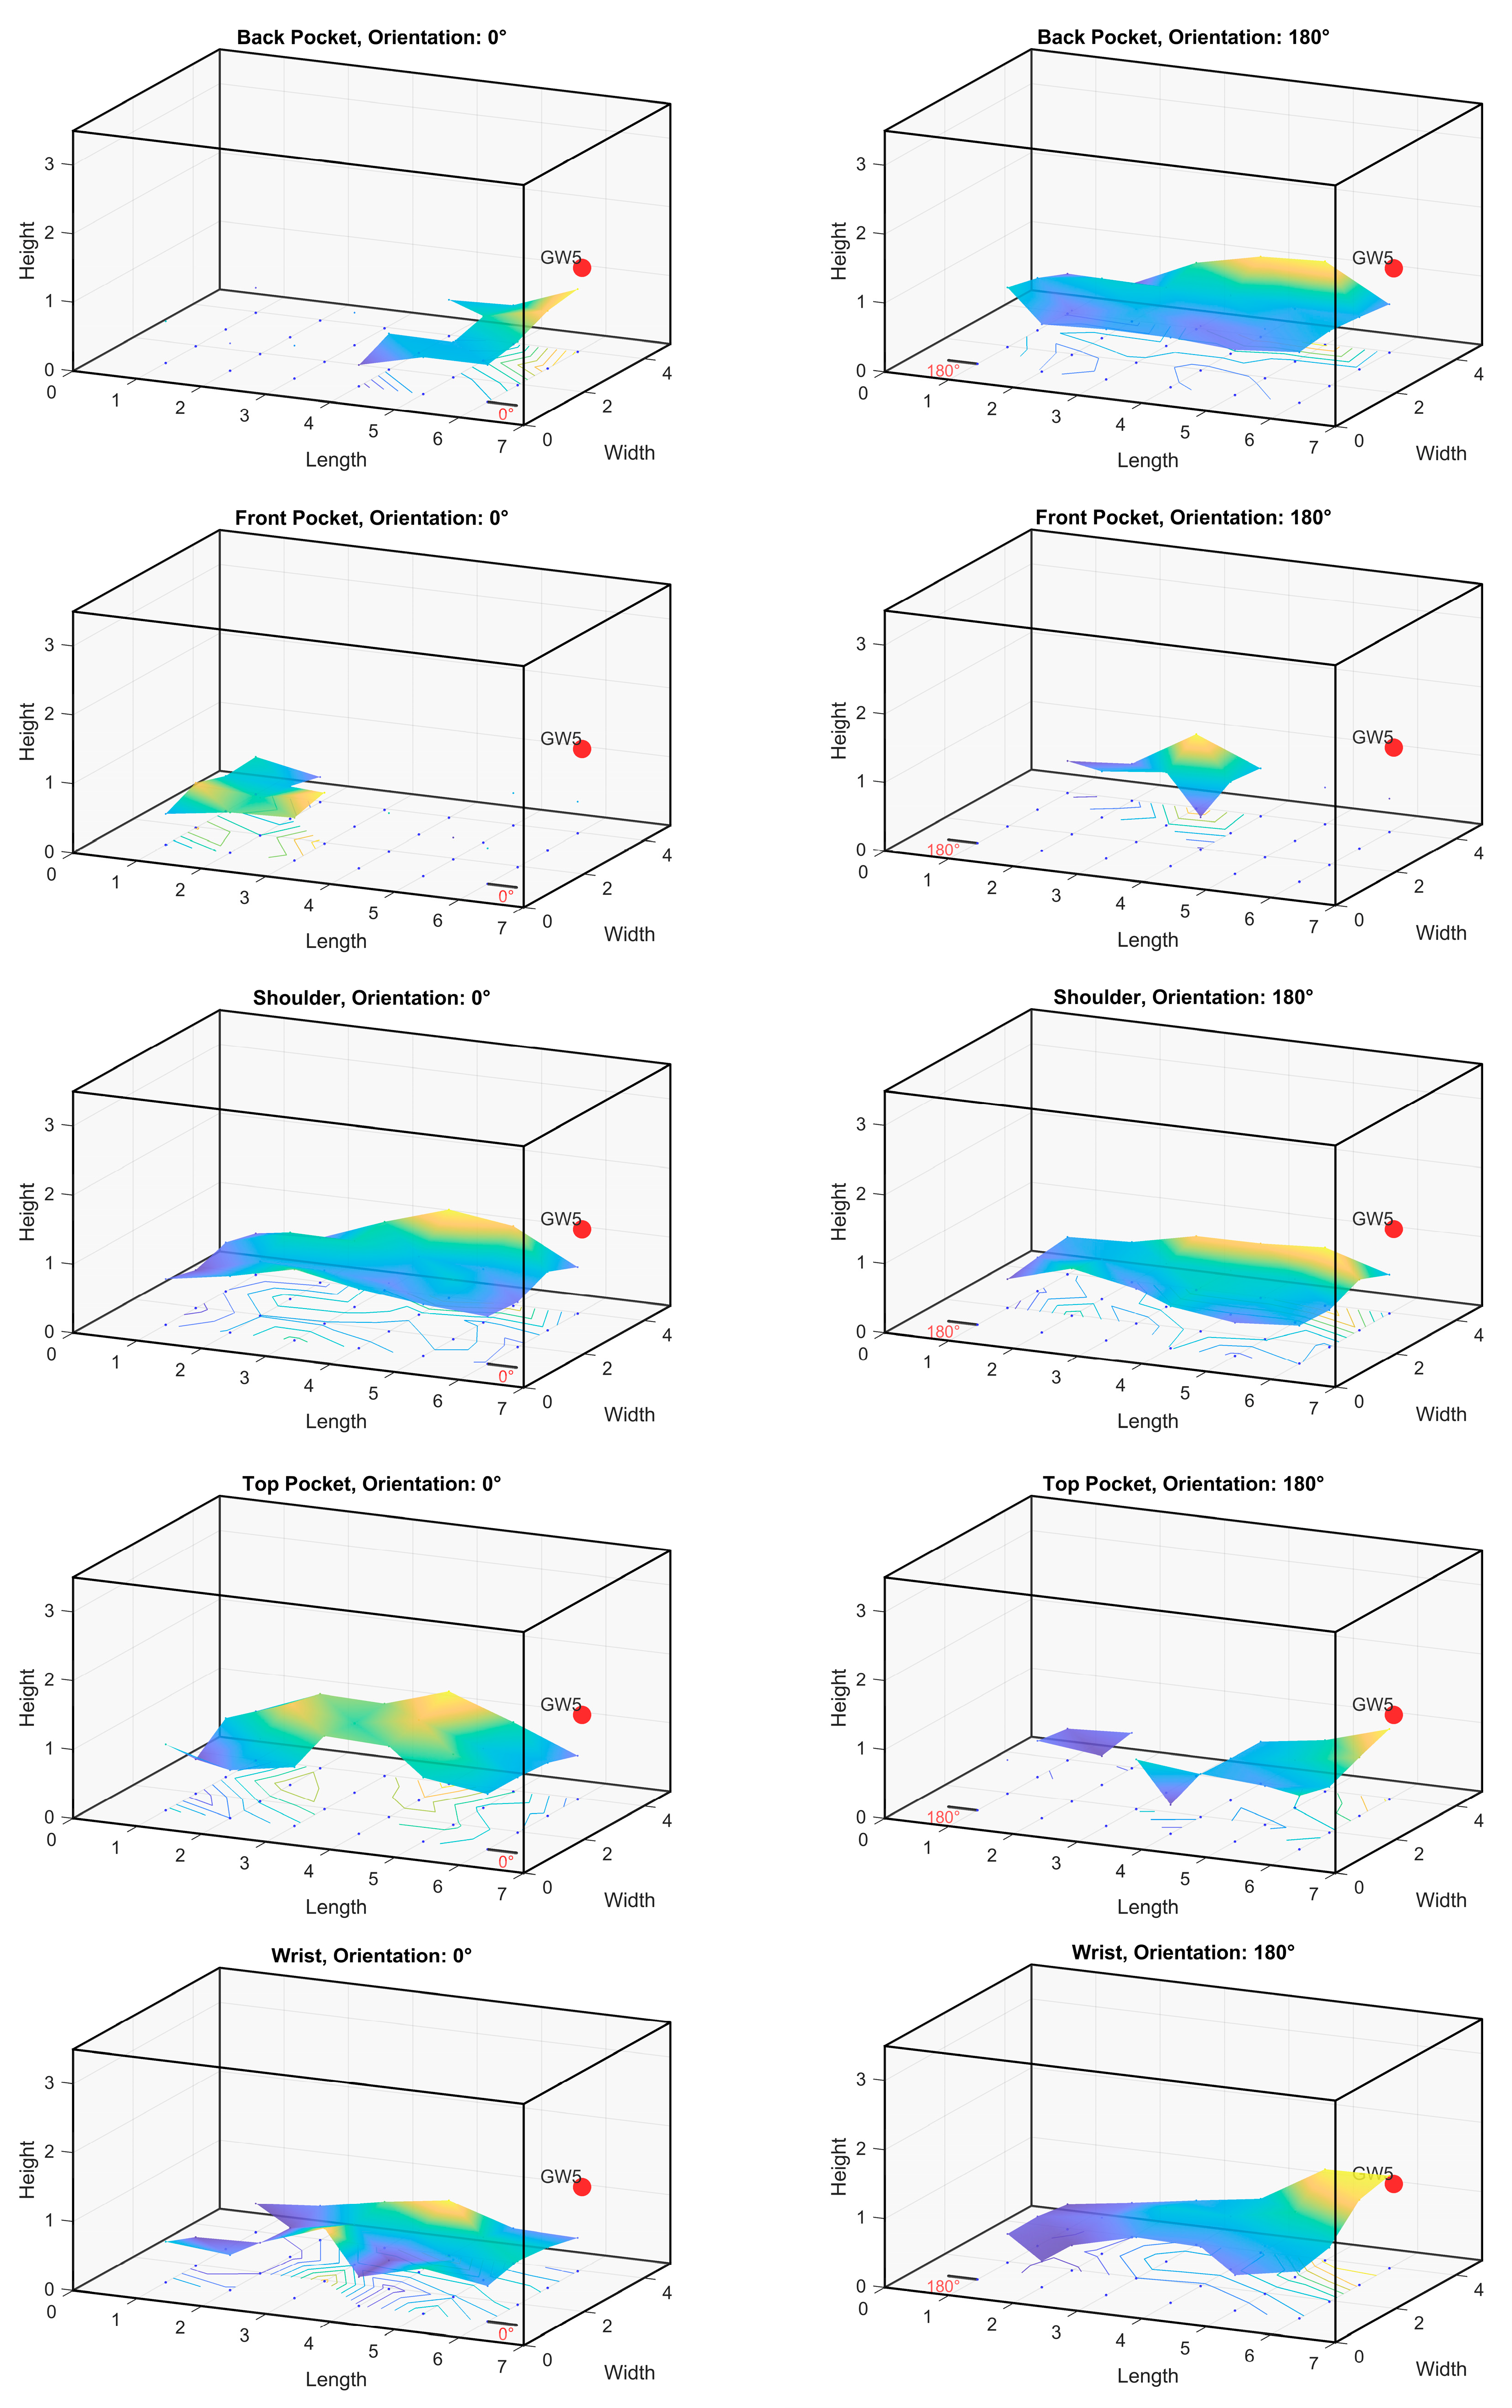
Conversely, as the threshold for longer signal segments increased, the mean signal values gradually rose. This trend was consistent across all BLE positions, indicating that longer signal segments generally corresponded to higher signal strength. The standard deviation decreased with longer segments, suggesting greater stability in signal strength. Certain positions failed to register measurements from specific receivers, particularly from GW 5, as shown in the
Appendix A. In these cases, missing signal values were replaced with a standardized value of −90.
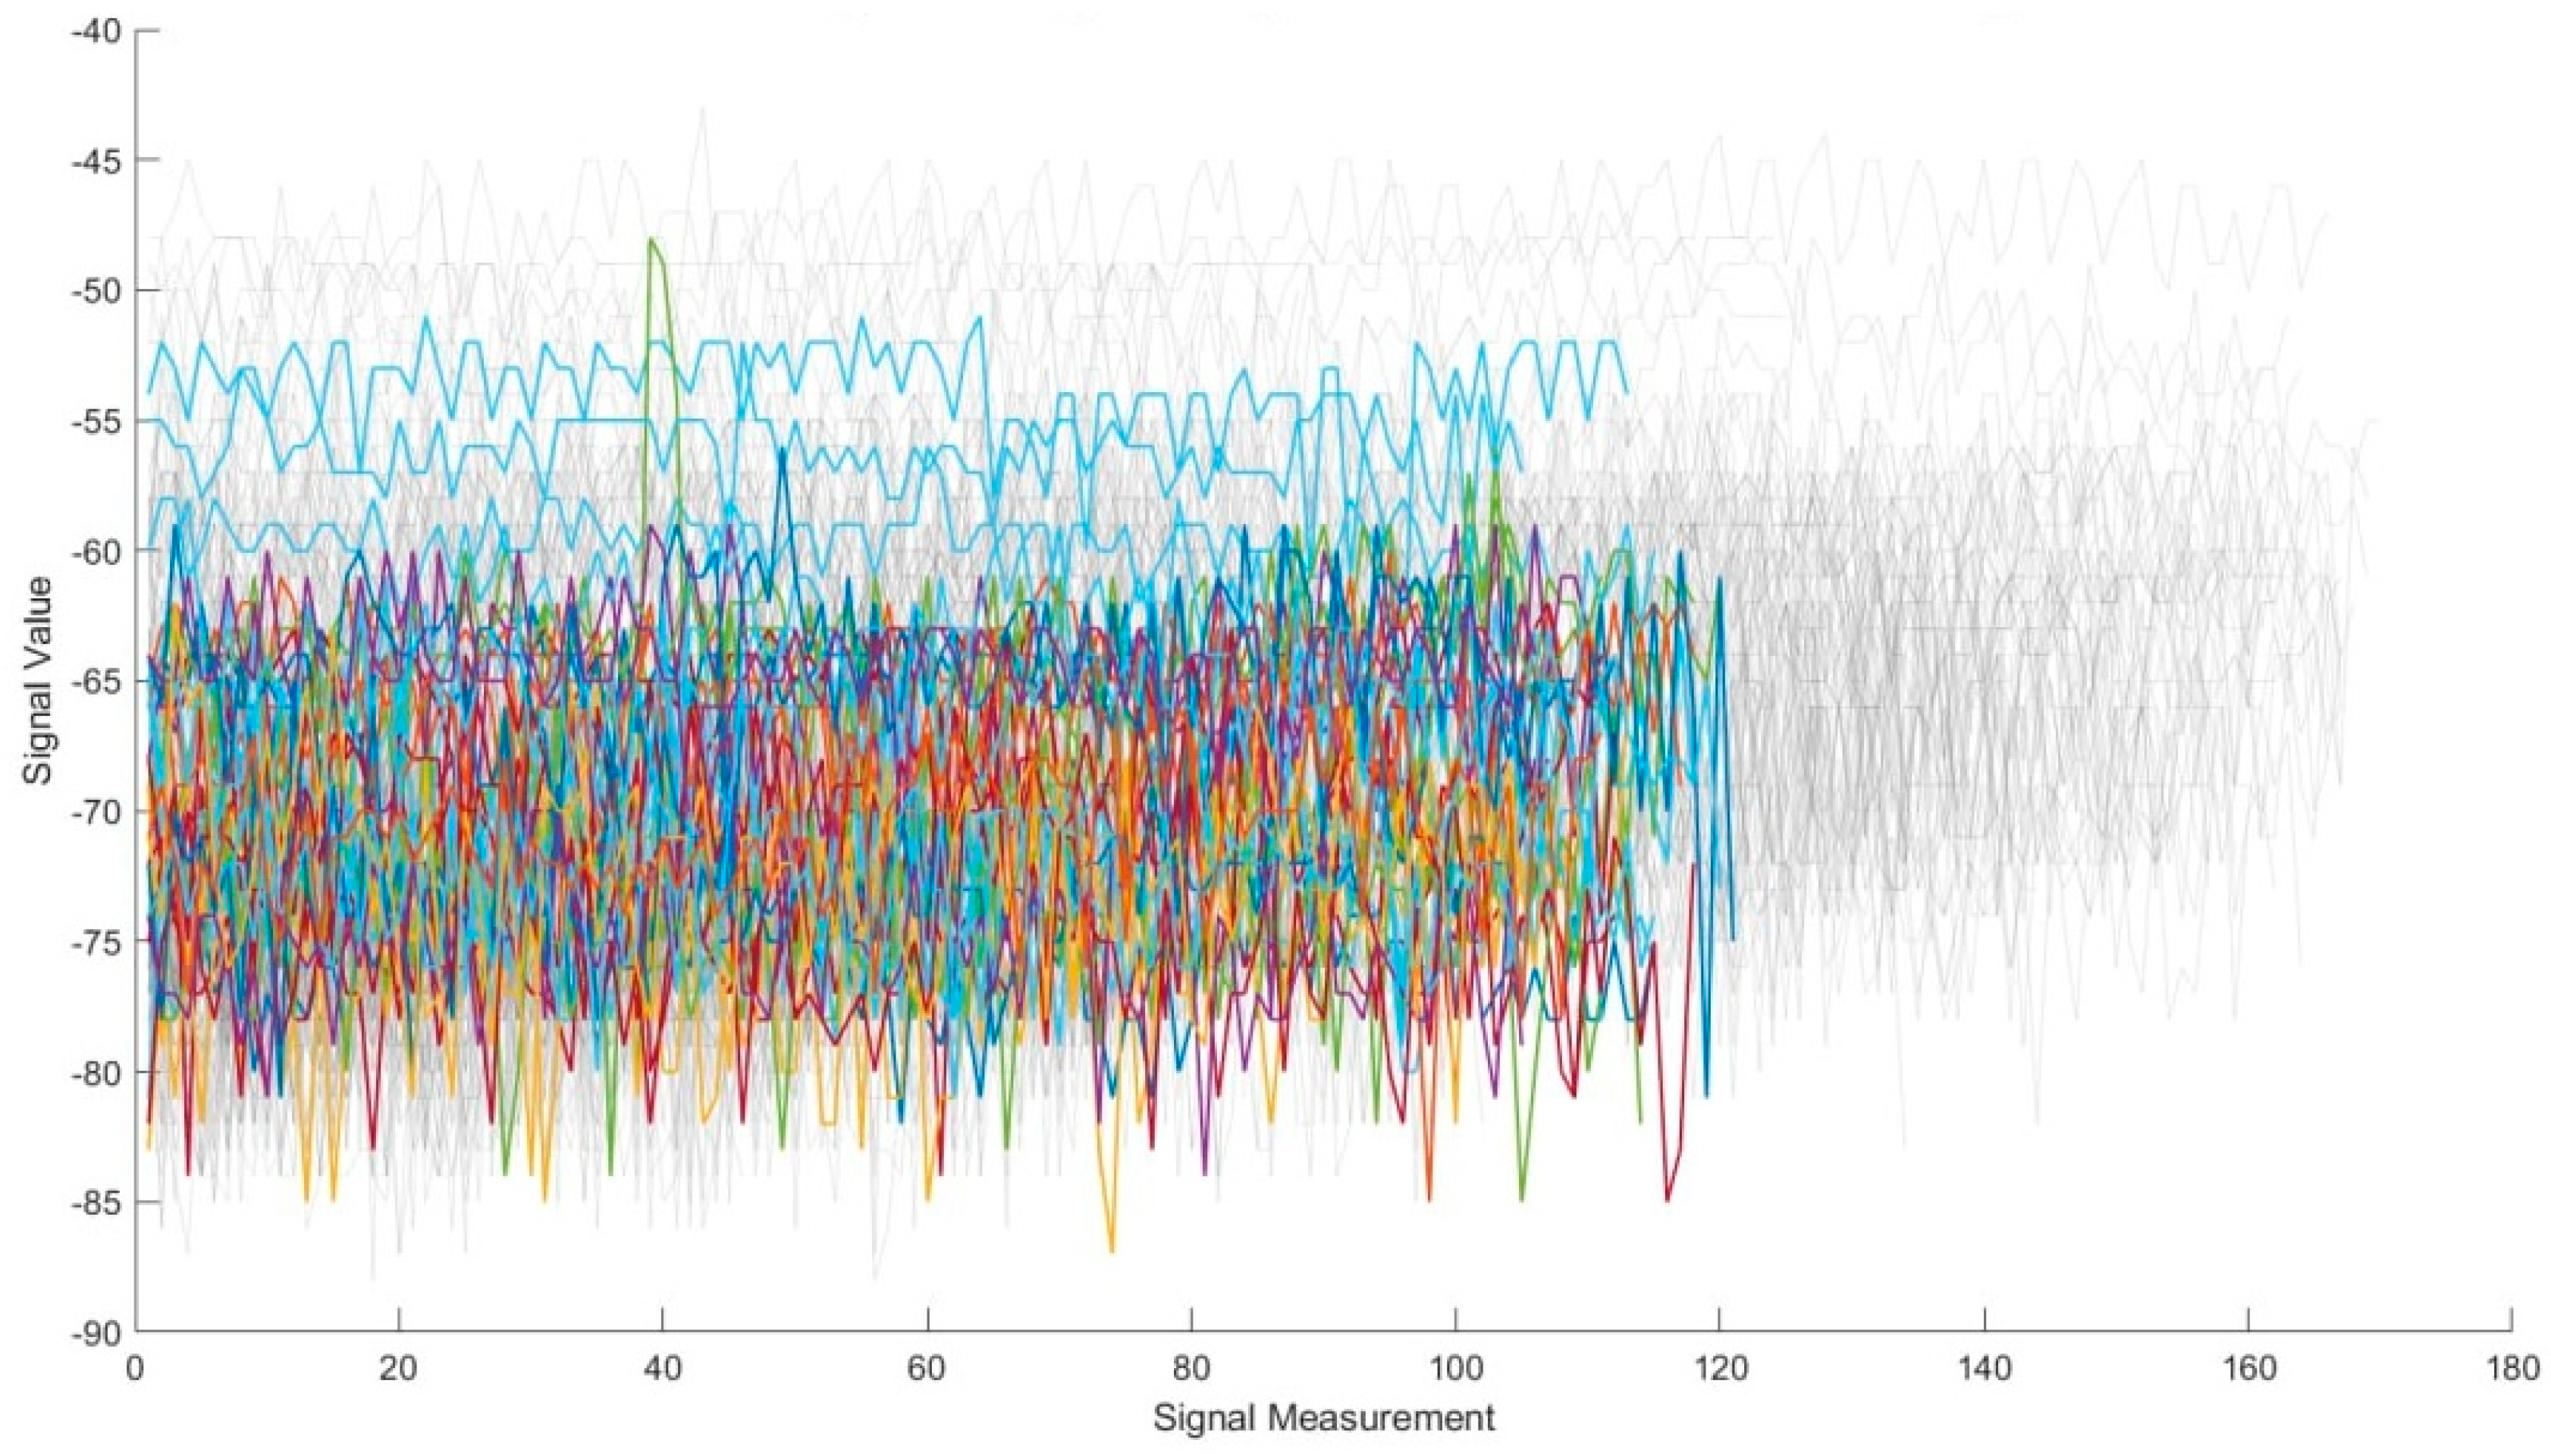
Figure 5 illustrates an example of segments between the 60% and 70% thresholds emitted by the shoulder beacon received from the wall gateways. The different colors represent the various positions where the RSSI is measured. And gray colors represent signal segments of lengths belonging to other length ranges.
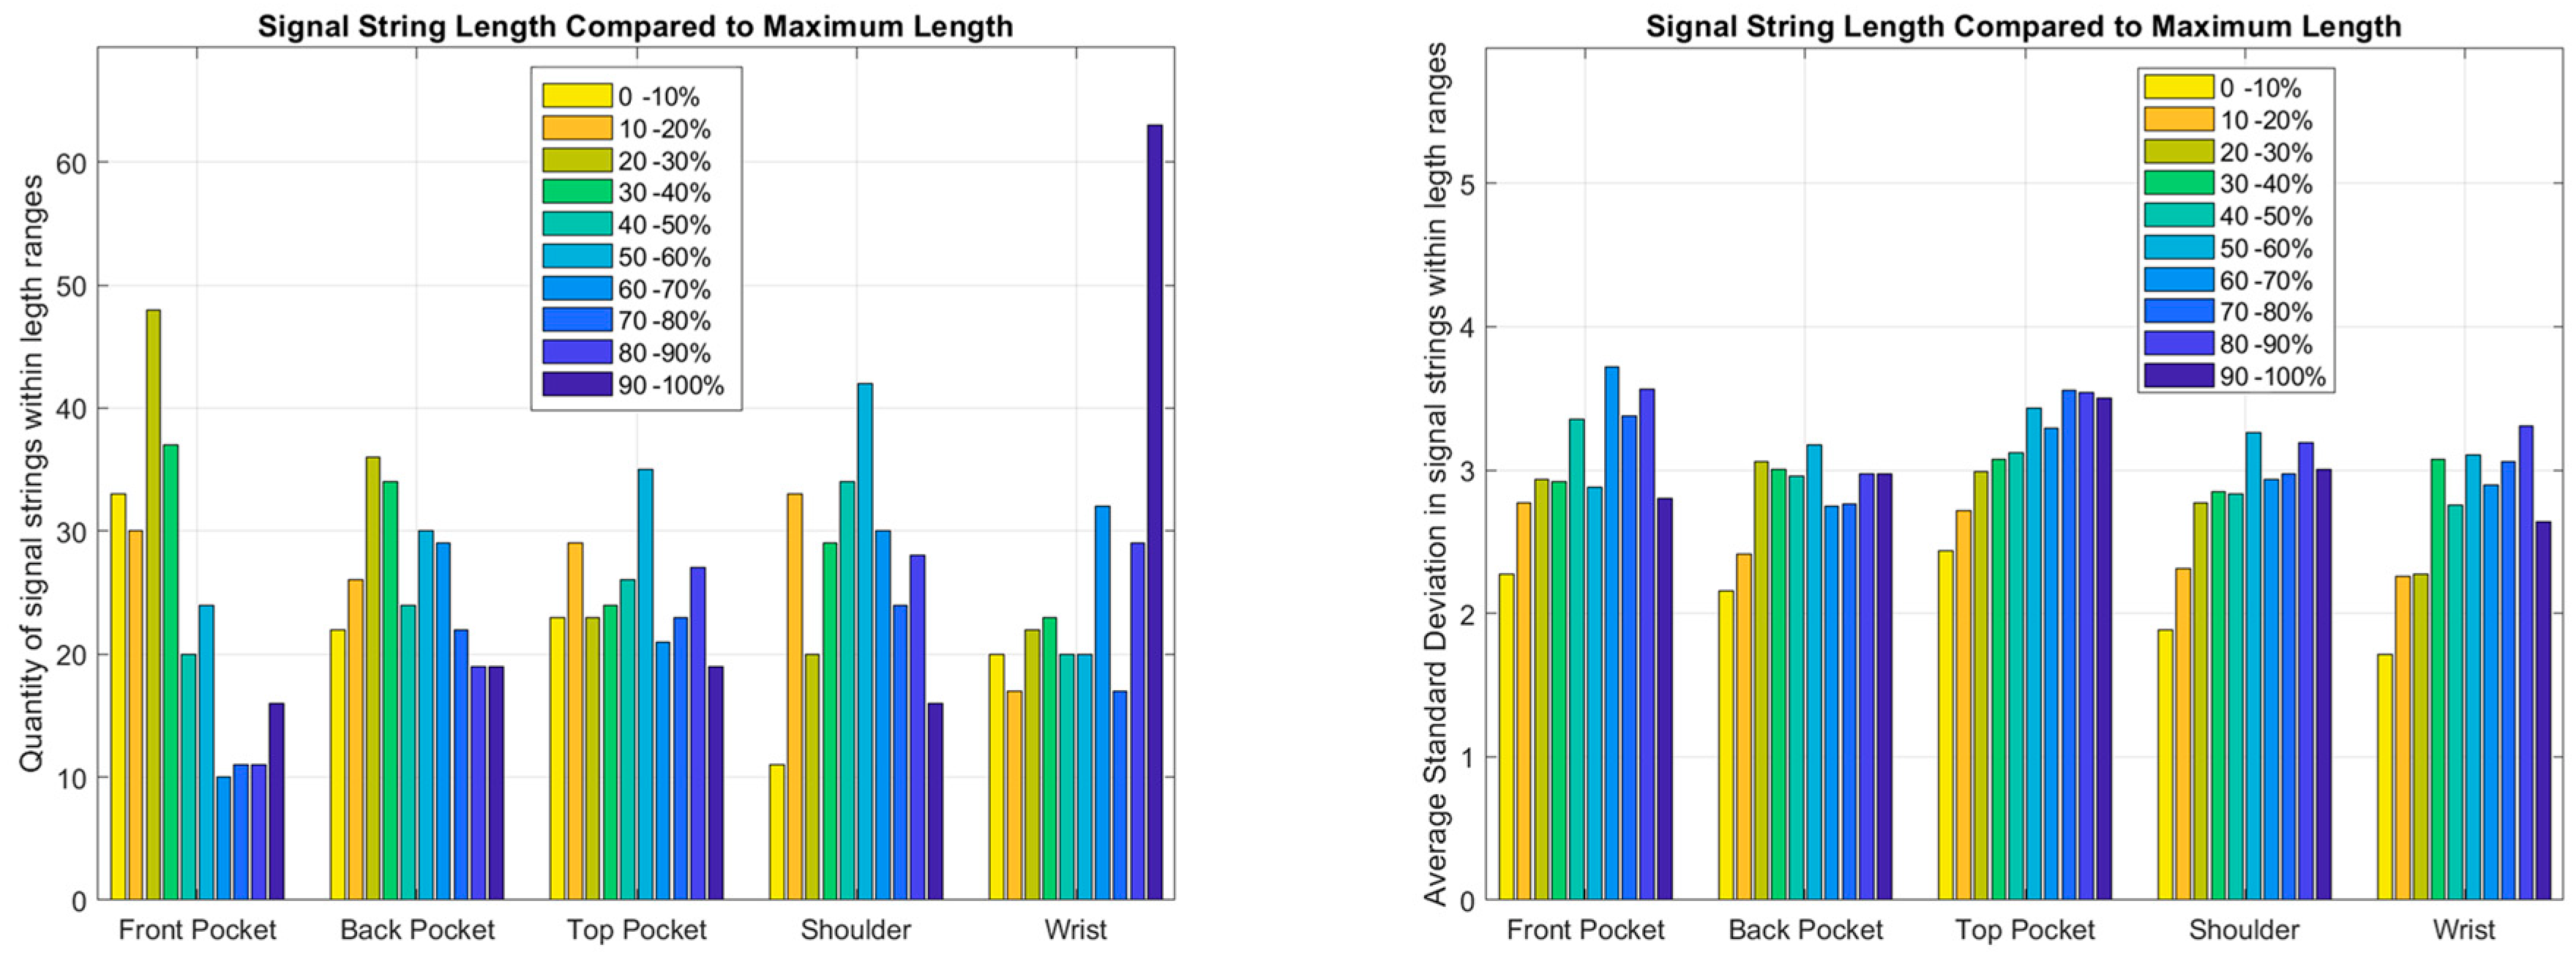
Table 1 presents data on the quantity of BLE signal segments and their standard deviation across different length ranges for shoulder positions. Analysis of BLE signal segments received by wall-mounted gateways reveals variations in the quantity of short and long segments across different body positions. The front pocket, back pocket, and top pocket positions show a higher signal number of short segments, indicating potential challenges in signal stability. In contrast, fewer long segments are observed in these positions. The wrist position exhibits the highest number of long signal segments. The shoulder position consistently shows a lower number of short signal segments, suggesting a higher signal reception effectiveness. The standard deviation of signal values across all segment lengths and BLE positions remains relatively consistent.
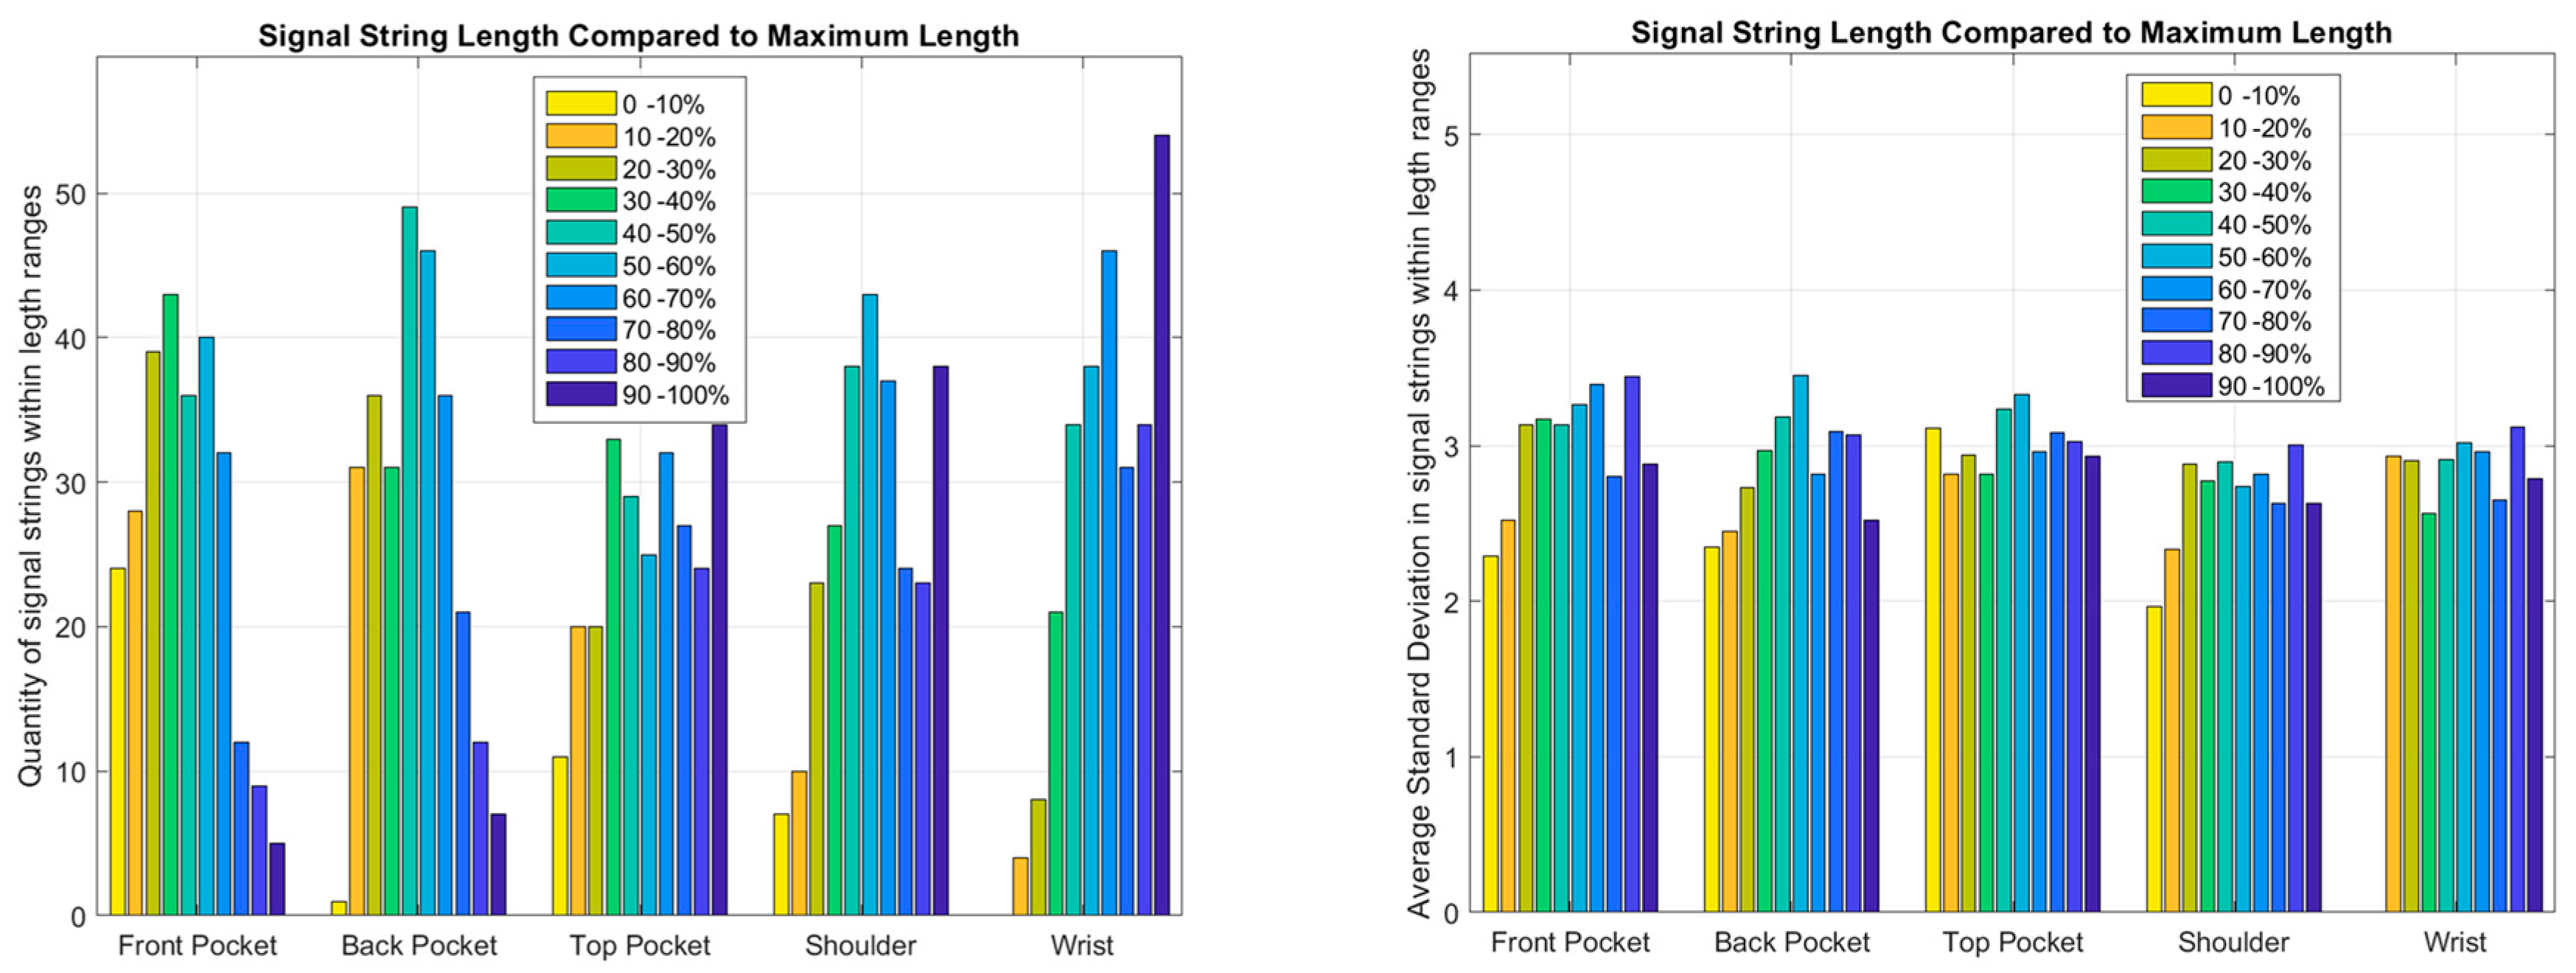
Figure 6 shows the distribution of BLE signal segments received from the wall-mounted GW, and their quality across different body positions. The left subfigure depicts the quantity of signal segments within different length ranges (e.g., 0–10%, 10–20%, etc.) for each body position, including the front pocket, back pocket, top pocket, shoulder, and wrist. The right subfigure shows the standard deviation of signal quality (representing variability) within each segment length range for the same body positions. These visualizations highlight variations in signal across different body locations.
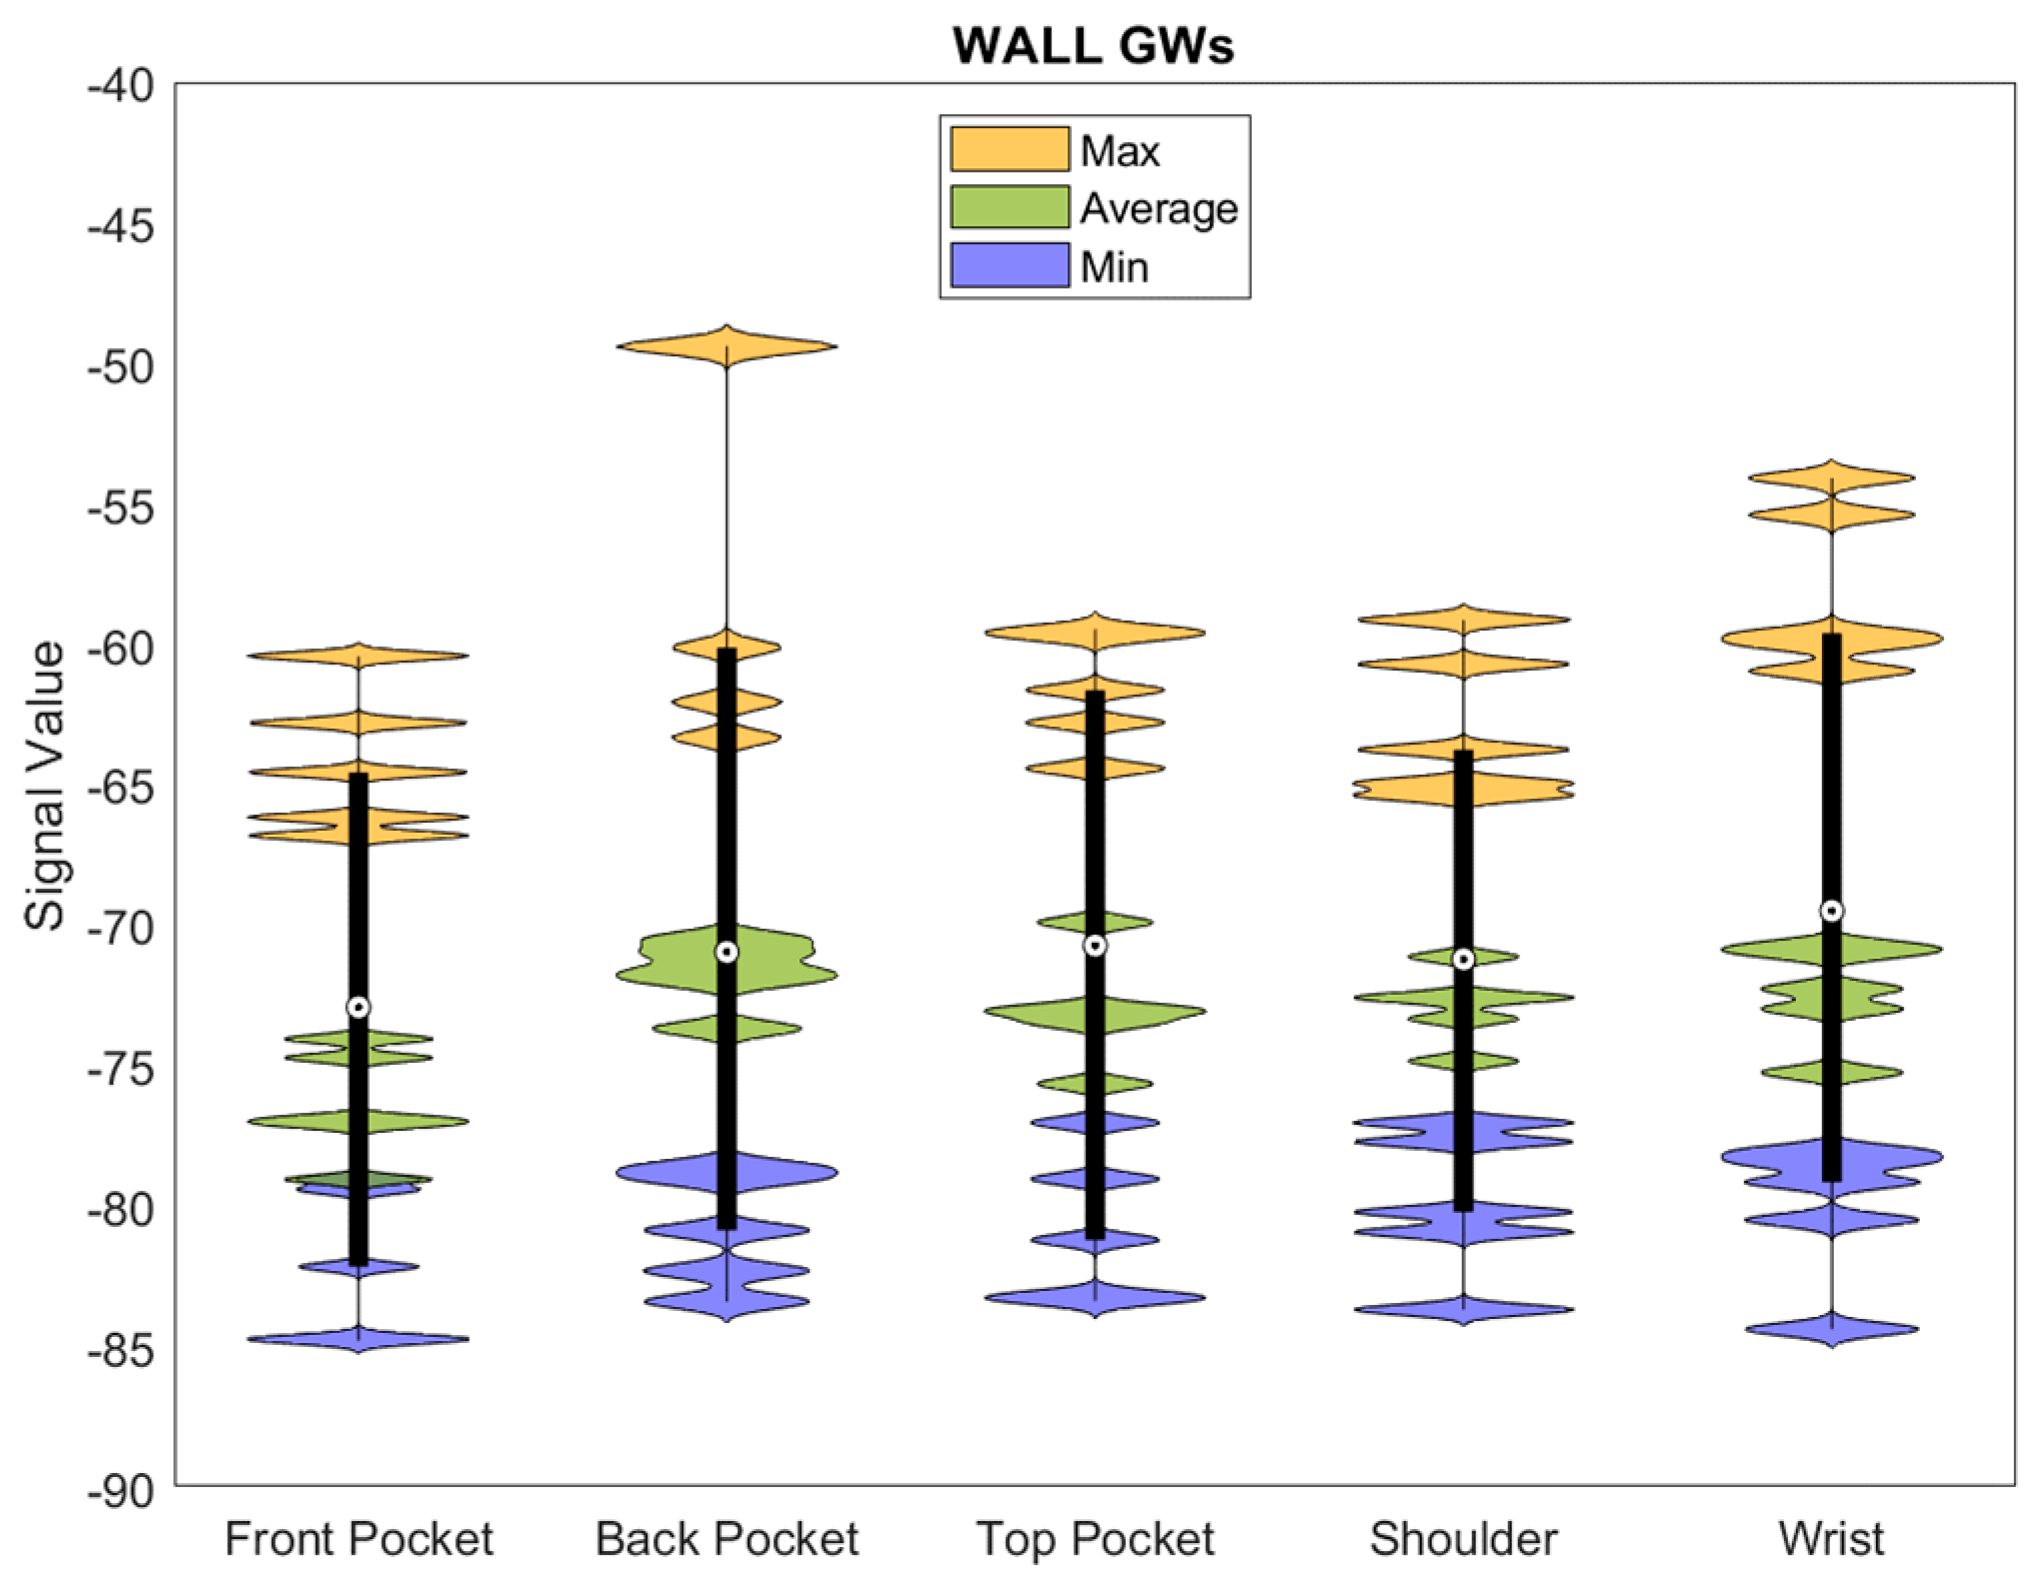
The analysis of signals from wall-mounted gateways at various BLE positions reveals consistent signal strength patterns. Evaluation of minimum, maximum, and average signal values provides insights into BLE signal performance at different body positions. The wrist and back pocket positions show the highest maximum and average signal strengths in the indoor environment, suggesting that the proximity of the BLE device to the wall-mounted gateways affects signal strength.
The characteristics of BLE signal performance are further illustrated in the violin plot shown in
Figure 7. The plot displays the distribution of signal strengths (minimum, maximum, and average values) for each body position. The width of each “violin” represents the density of data points across different signal values, with wider sections indicating higher concentrations of signal strengths at specific values. The central line within each violin denotes the median signal strength, while the range of signal values is shown from the minimum to maximum. This visualization allows for easy comparison of signal distribution and variability across different body positions, highlighting differences in signal strength performance at each location relative to the wall-mounted gateways.
3.2. Ceiling Gateways BLE Signal Segments
A similar trend is observed for the ceiling GW. Longer received signal segments correspond to higher mean signal values across all BLE positions. This is accompanied by a reduction in standard deviation, indicating increased signal stability. Specific patterns are also noted across body positions, with the shoulder and front pocket positions consistently showing higher mean signal values, particularly in longer signal segments.
Figure 8 illustrates the RSSI segments, of range 60% to 70% threshold, emitted by the shoulder beacon and received from the ceiling gateways.
Table 2 presents data on the quantity of BLE signal segments and their standard deviation across different length ranges for shoulder positions.
Figure 9 shows the distribution of BLE signal segments received from the wall-mounted GW, and their quality across different body positions. The analysis of BLE signal segments received at ceiling-mounted gateways reveals variations in the distribution of short and long segments across different body positions. In the front pocket and back pocket positions, the short segment length range is characterized by a higher number of shorter segments, which may indicate challenges in immediate signal stability. In contrast, the long segment length range exhibits fewer occurrences, suggesting more stable and prolonged connections.
The top pocket position shows a balanced distribution of short and long segments, reflecting a combination of immediate and sustained signal stability. The shoulder position, in turn, demonstrates fewer short segments, indicating a relatively higher signal reception effectiveness. The wrist position, with no short segments observed, exhibits a significant proportion of long segments, implying a preference for more sustained, robust connections. The standard deviation of signal values across all segment lengths and BLE positions remains relatively consistent.
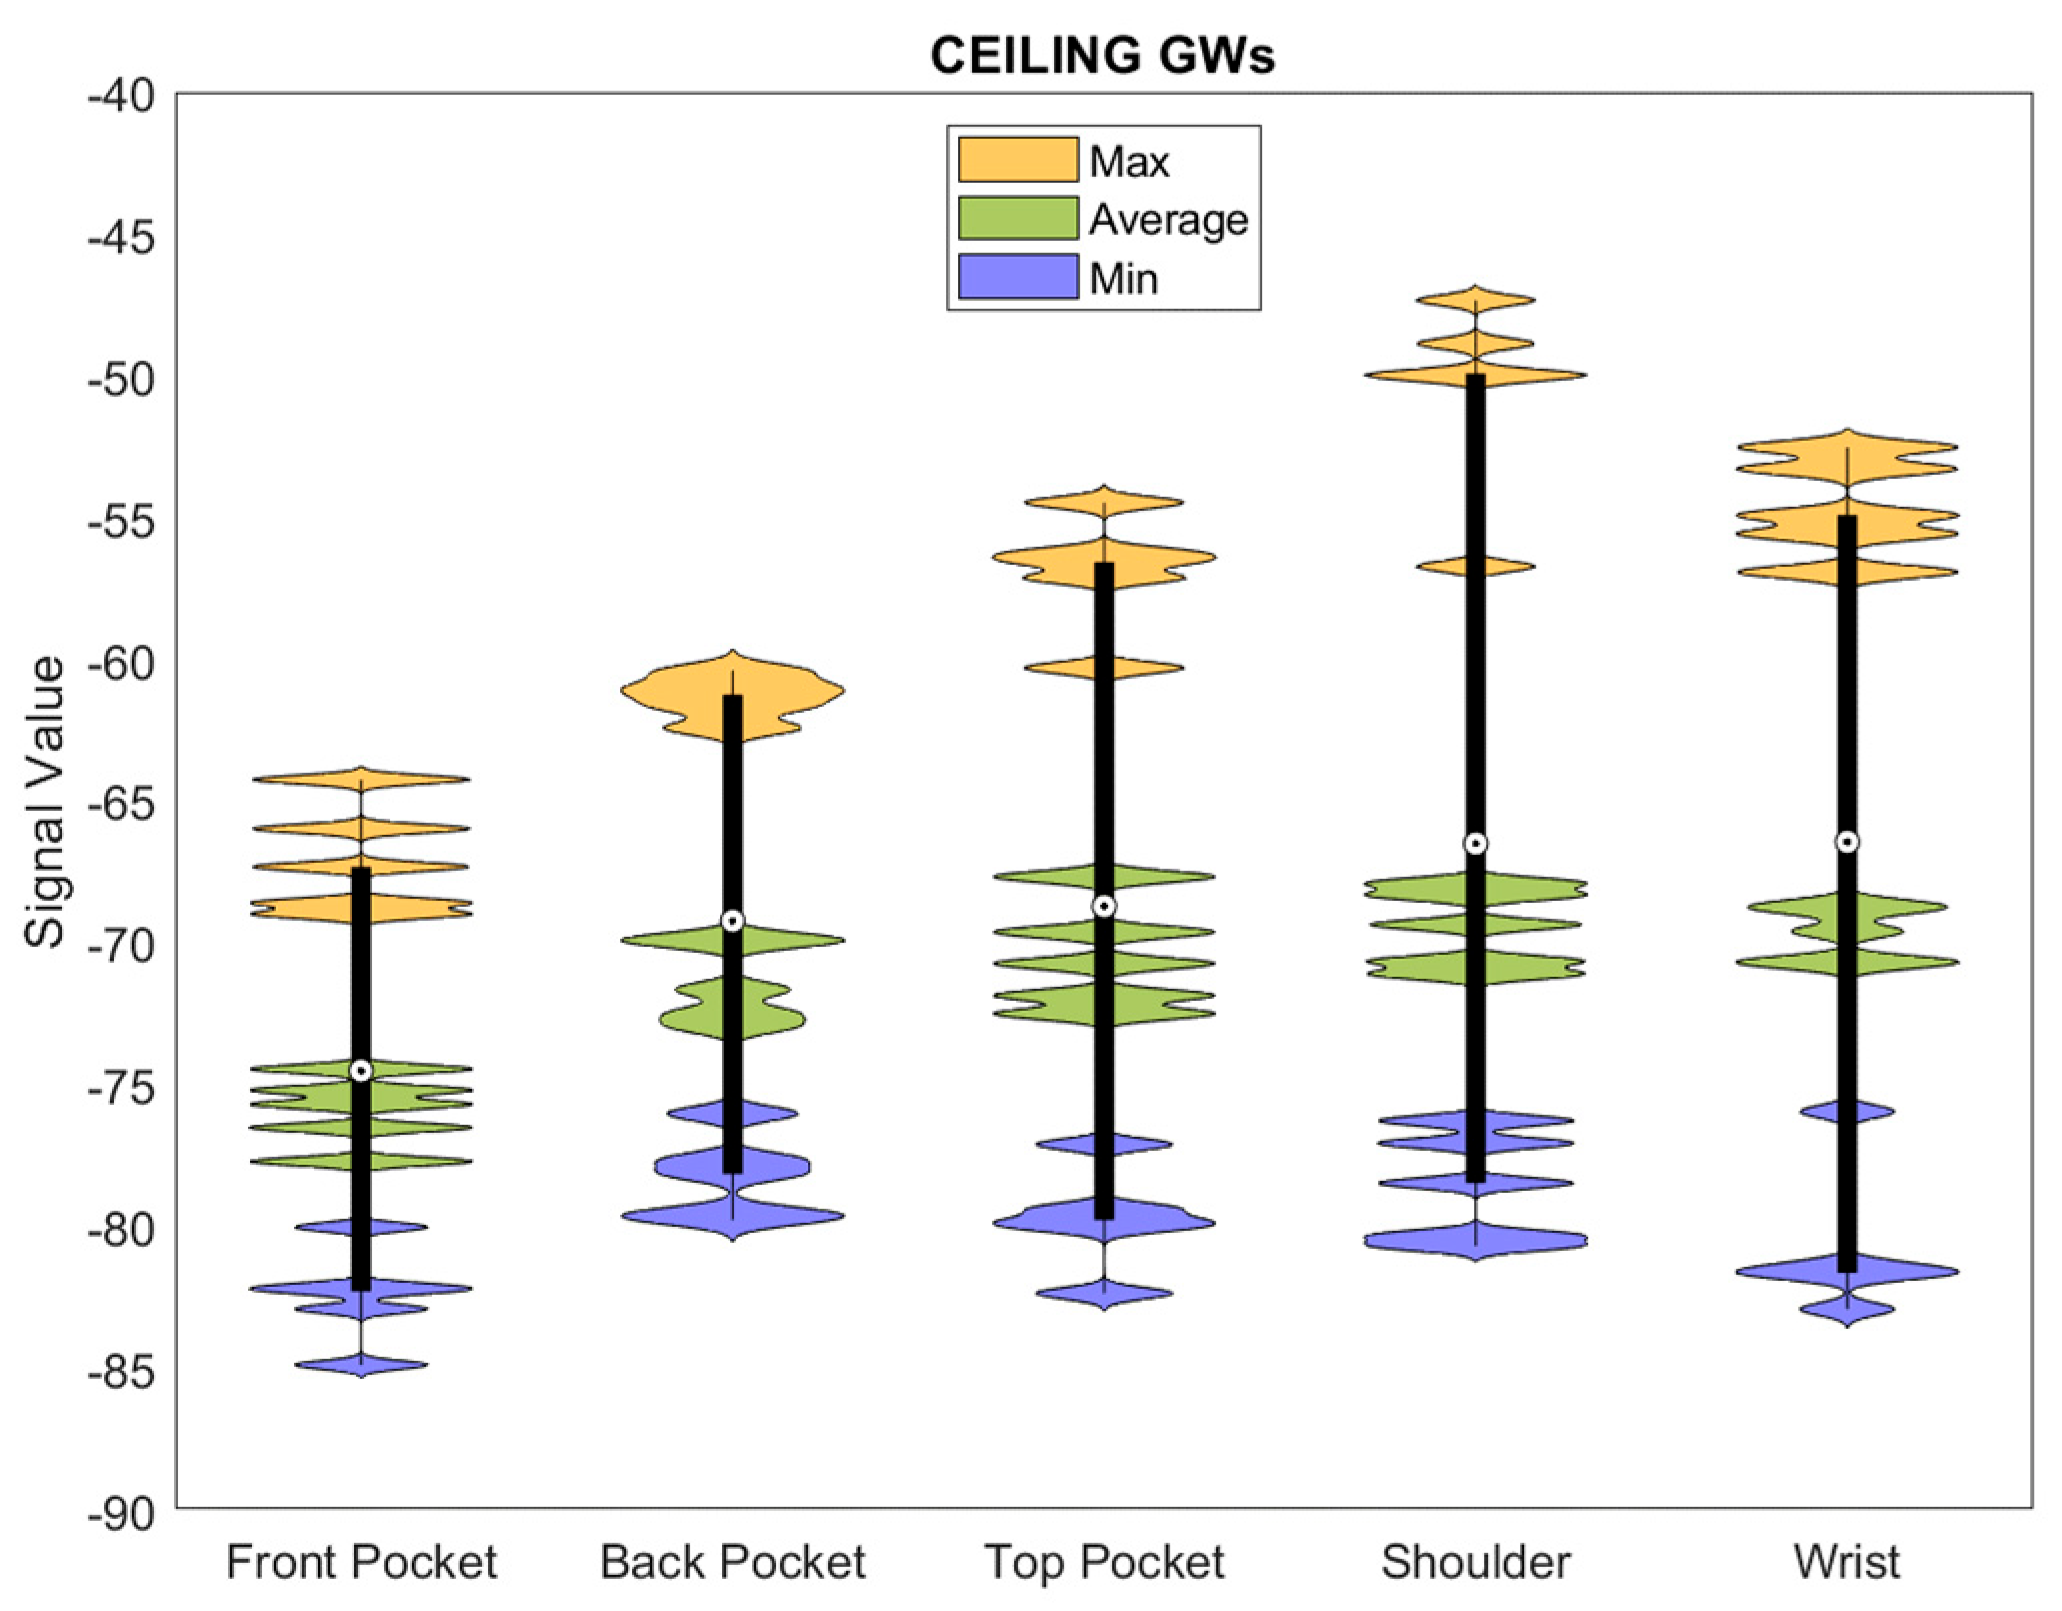
The characteristics of ceiling BLE signal performance are further illustrated in the violin plot shown in
Figure 10. The analysis of signals from ceiling-mounted GWs across various BLE positions reveals distinct patterns in signal strength. The minimum signal values show that the shoulder position exhibits the highest at −80.28 dBm, indicating relatively stronger signals compared to other body positions, while the back pocket has the lowest minimum signal strength at −79.47 dBm.
For maximum signal values, the back pocket records the lowest at −60.38 dBm, while the shoulder position has the highest at −48.86 dBm. In terms of average signal strength, the shoulder position maintains the highest value at −70.62 dBm, whereas the top pocket has the lowest at −71.83 dBm. These findings highlight notable variations in signal strength across body positions when using ceiling-mounted GWs. The shoulder position consistently shows stronger signals, suggesting potential advantages for signal reception at this body location. These results emphasize the importance of considering body positioning in BLE device deployment near ceiling-mounted GWs for optimal signal performance.
Analysis of signals from wall-mounted and ceiling-mounted GWs at various BLE positions reveals distinct patterns. Ceiling-mounted GWs consistently provide stronger signal reception at the shoulder position, indicating better signal strength in this area. In contrast, wall-mounted GWs exhibit greater signal variability across different body positions, with positions like the front pocket consistently showing weaker signals. Ceiling-mounted GWs, however, demonstrate more stable signal strength, particularly at the shoulder position. These findings emphasize the need to consider both gateway placement and body position when optimizing BLE signal reception in indoor environments. The choice between wall and ceiling GWs can impact signal performance, influencing the reliability of BLE-based applications.
4. Overview of Indoor Localization Accuracy Based on the RBF Method
This section focuses on indoor localization accuracy based on collected data. The Radial Basis Function (RBF)-based methodology used for location estimation relies on signal strength measurements [
13]. This approach employs a matrix framework, where a signal matrix (S) represents the data, a two-dimensional spatial matrix (P) corresponds to the physical layout, and a coefficient matrix captures the positional relationships with the signals. The RBF is utilized as a distance-dependent function, enabling interpolation between known signal points for the localization of new signal measurements.
The overall process is structured into two distinct phases: modeling and prediction. In the modeling phase, data acquisition is initiated through the collection of RSSI measurements from the sample points within the indoor environment. Subsequently, the obtained data are utilized to compute matrices (G), portraying the RBF effect of each sample point on all others. The modeling phase is finished with the computation of the coefficient matrix (C), which enables the position estimation in the prediction phase.
where
, in this study, considers the normalized signal values and represents the Euclidian distances of each sample point from all the other points.
is the number of sample points. measured
is the signal strength measurement at a particular point.
The position prediction
involves the acquisition of RSSI measurements at the test points and the subsequent calculation of a vector
representing the RBF distances of the measured signal relative to all signals in the database. The actual position estimation is then executed by multiplying this vector with the coefficient matrix (
).
The evaluation of indoor localization errors in this study focuses on three configurations: wall-mounted gateways, ceiling-mounted gateways, and a combined wall and ceiling gateway setup. The performance is systematically examined across five body positions: front pocket, back pocket, top pocket, shoulder, and wrist.
In the first two configurations, multiple models were constructed using all possible combinations of wall and ceiling gateway data, varying the number of GWs from 2 to 5 in each configuration. In the third configuration, models were built using data from all GWs, considering all possible combinations of wall and ceiling GWs, with the number of GWs varying from 2 to 10.
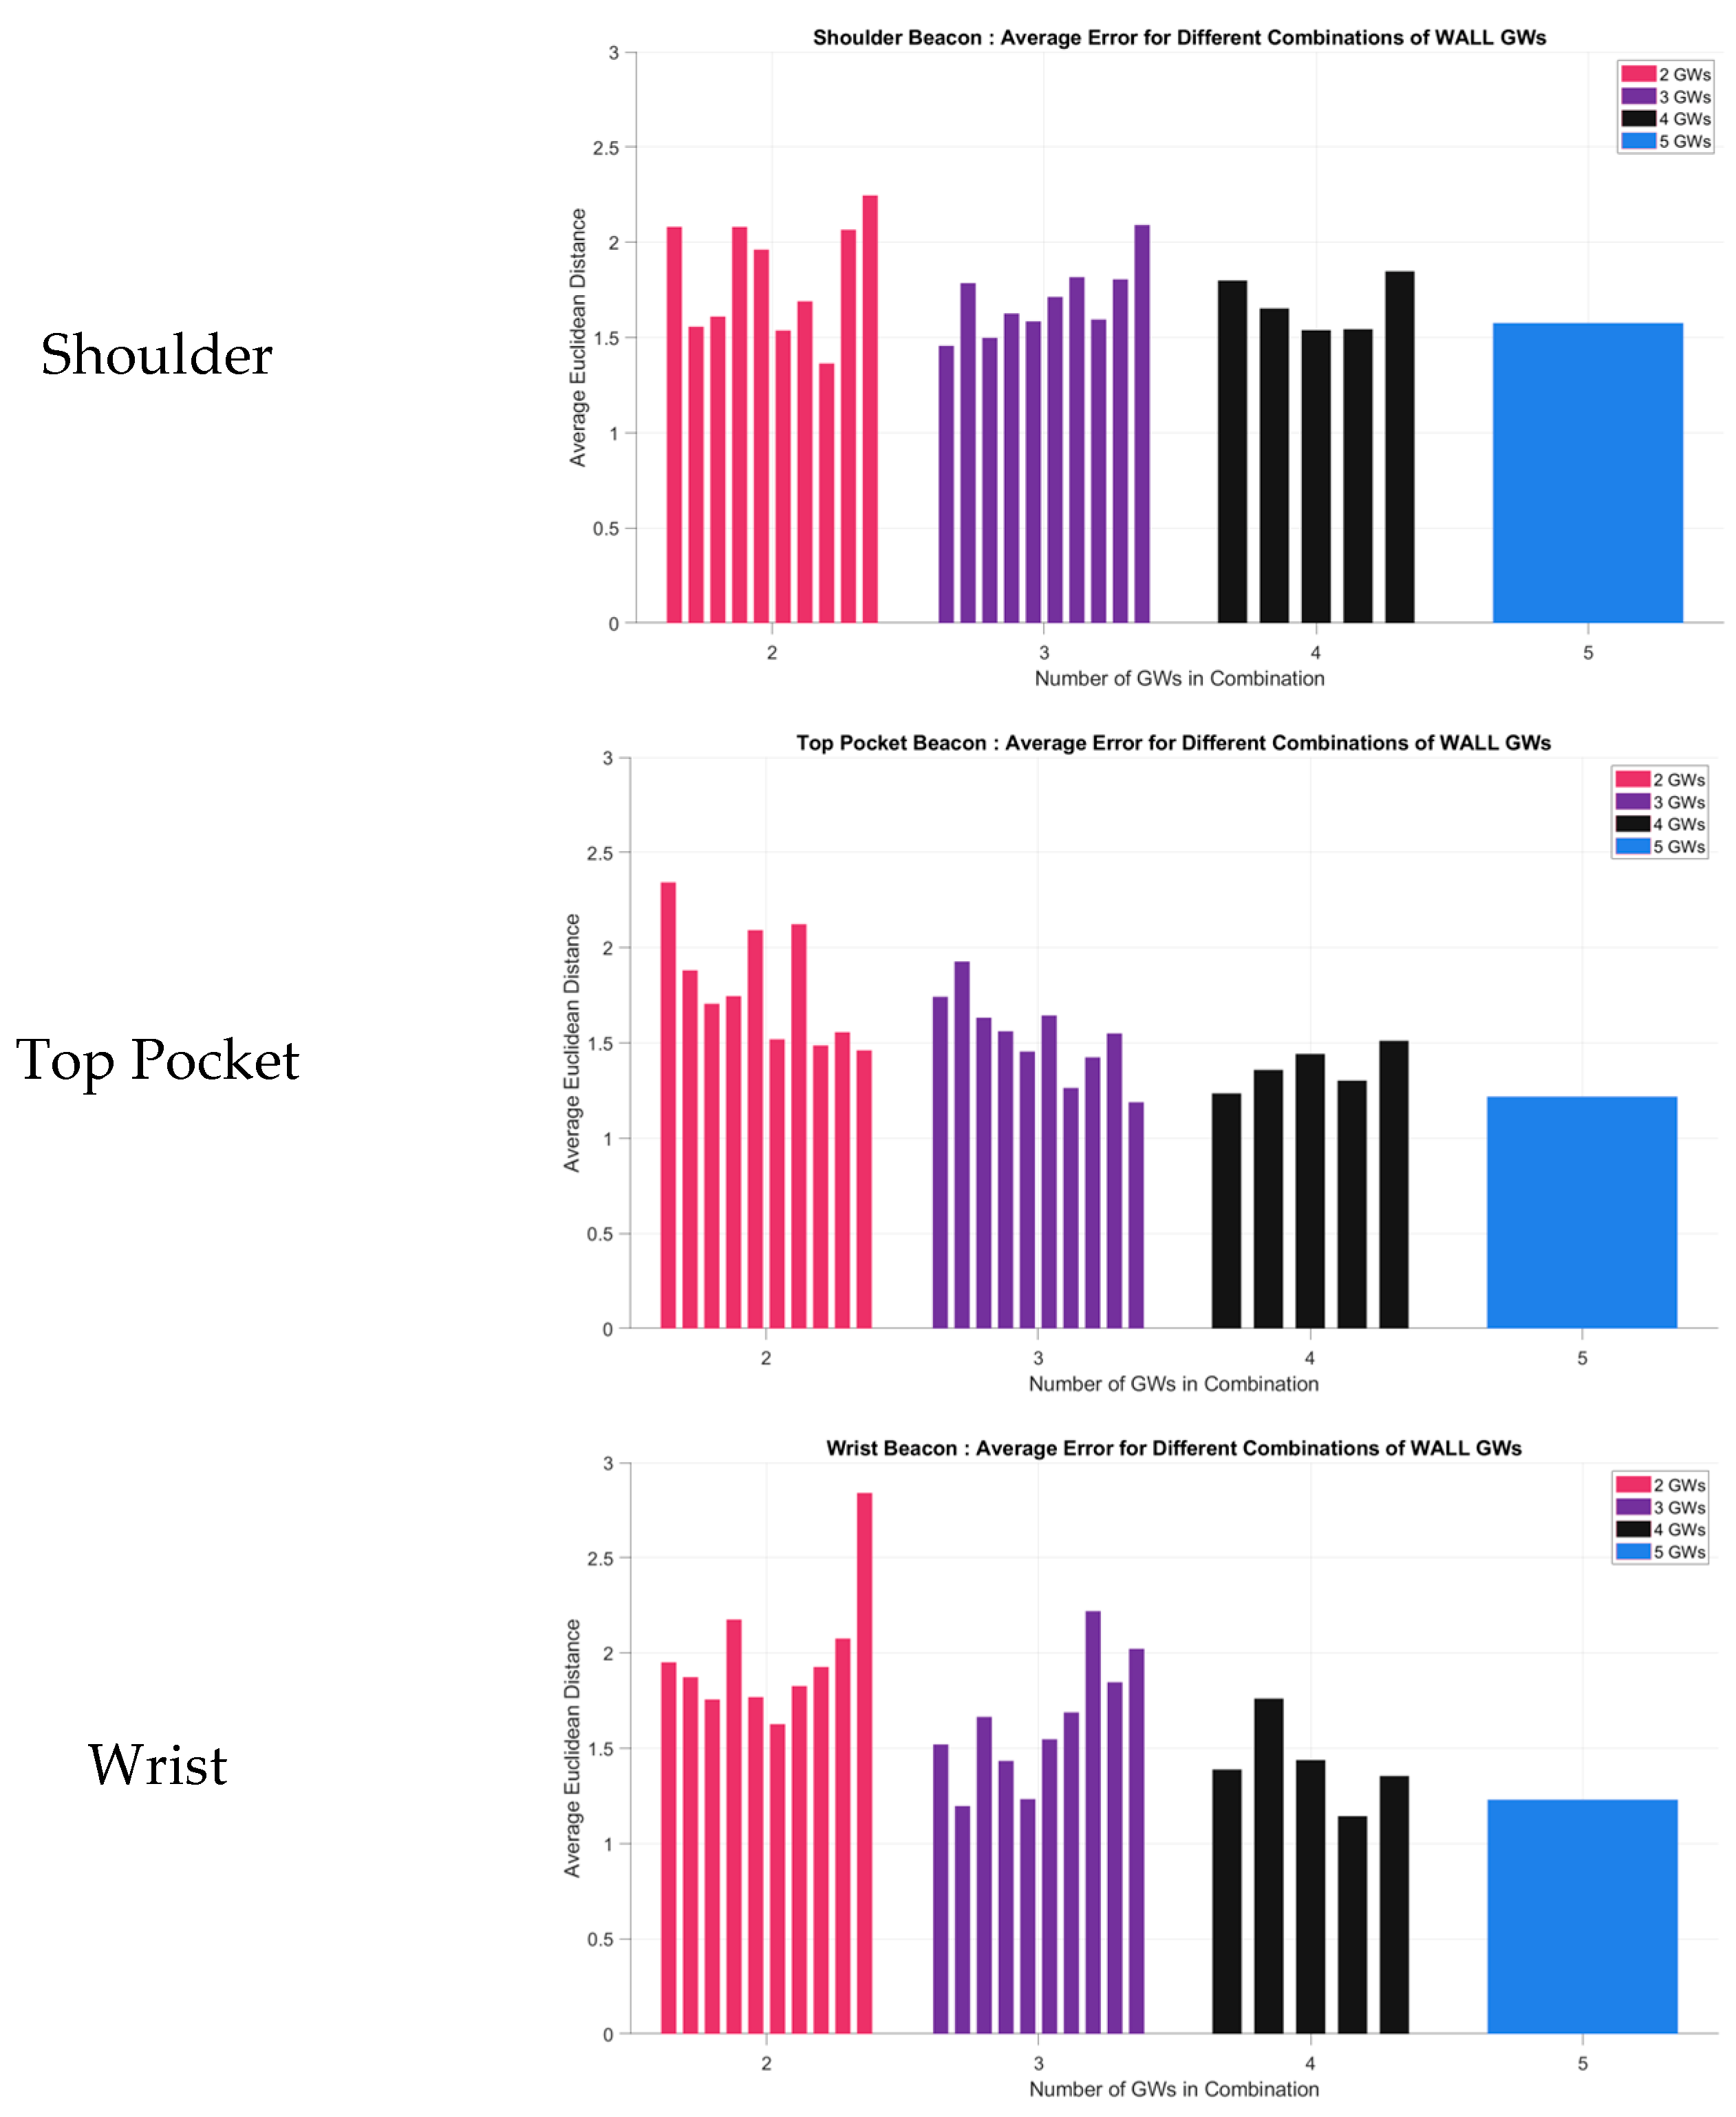
4.1. Localization Errors from the Wall GW Combinations
The results indicate a clear impact of the number of gateways on the localization error. As the number of gateways increased, a reduction in localization error was observed across all body positions. Specifically, with two gateways, the error ranged from 1.36 m to 1.62 m, while with five gateways, the error ranged from 1.21 m to 1.72 m. This suggests that a higher number of gateways improves indoor localization accuracy. However, the effect of gateway count on error varies by body position.
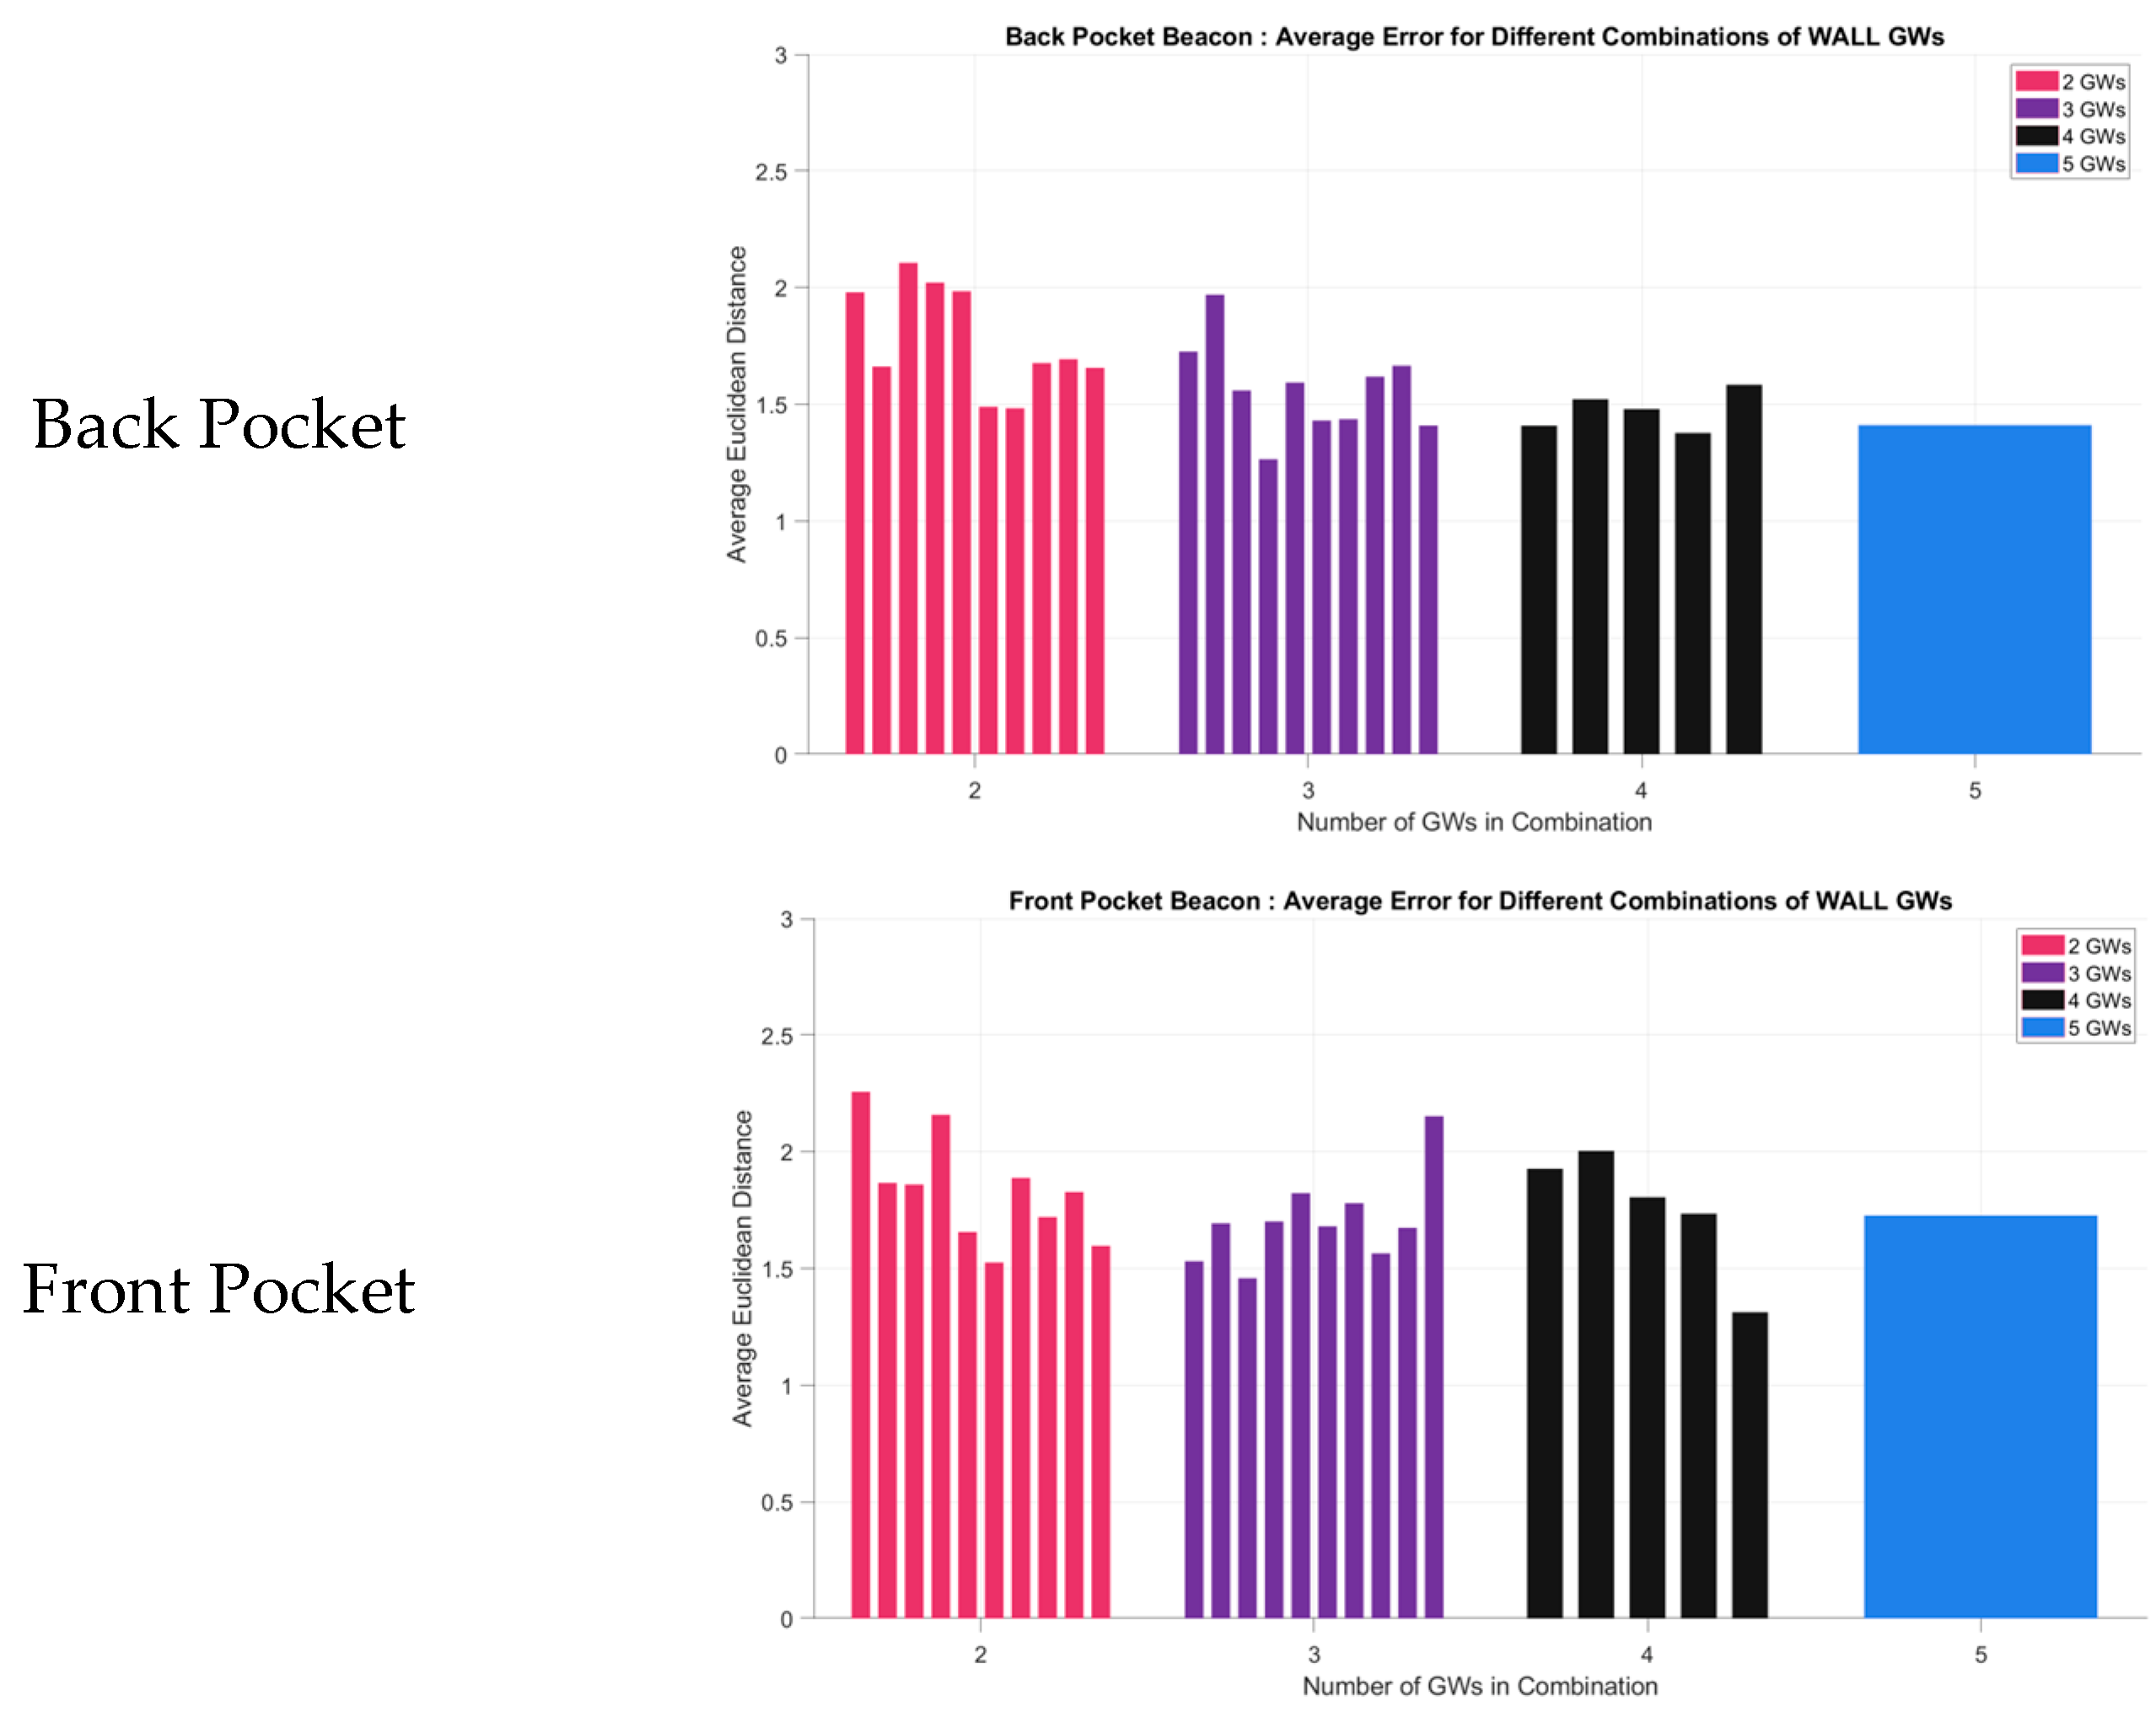
Figure 11 illustrates the average localization errors associated with different combinations of wall-mounted gateways.
The results indicate that positioning significantly affects localization accuracy. The front pocket consistently shows higher errors compared to other positions, particularly with five gateways, likely due to increased signal blockage or attenuation, which impacts the performance of the BLE beacon system.
When analyzing consistency across gateway combinations, certain positions, such as the wrist and top pocket, exhibit consistently low errors across all wall-mounted gateway configurations, indicating these positions are generally more favorable. The shoulder position also displays relatively consistent error rates across different gateway configurations, suggesting it may be less sensitive to variations in the number and position of receivers.
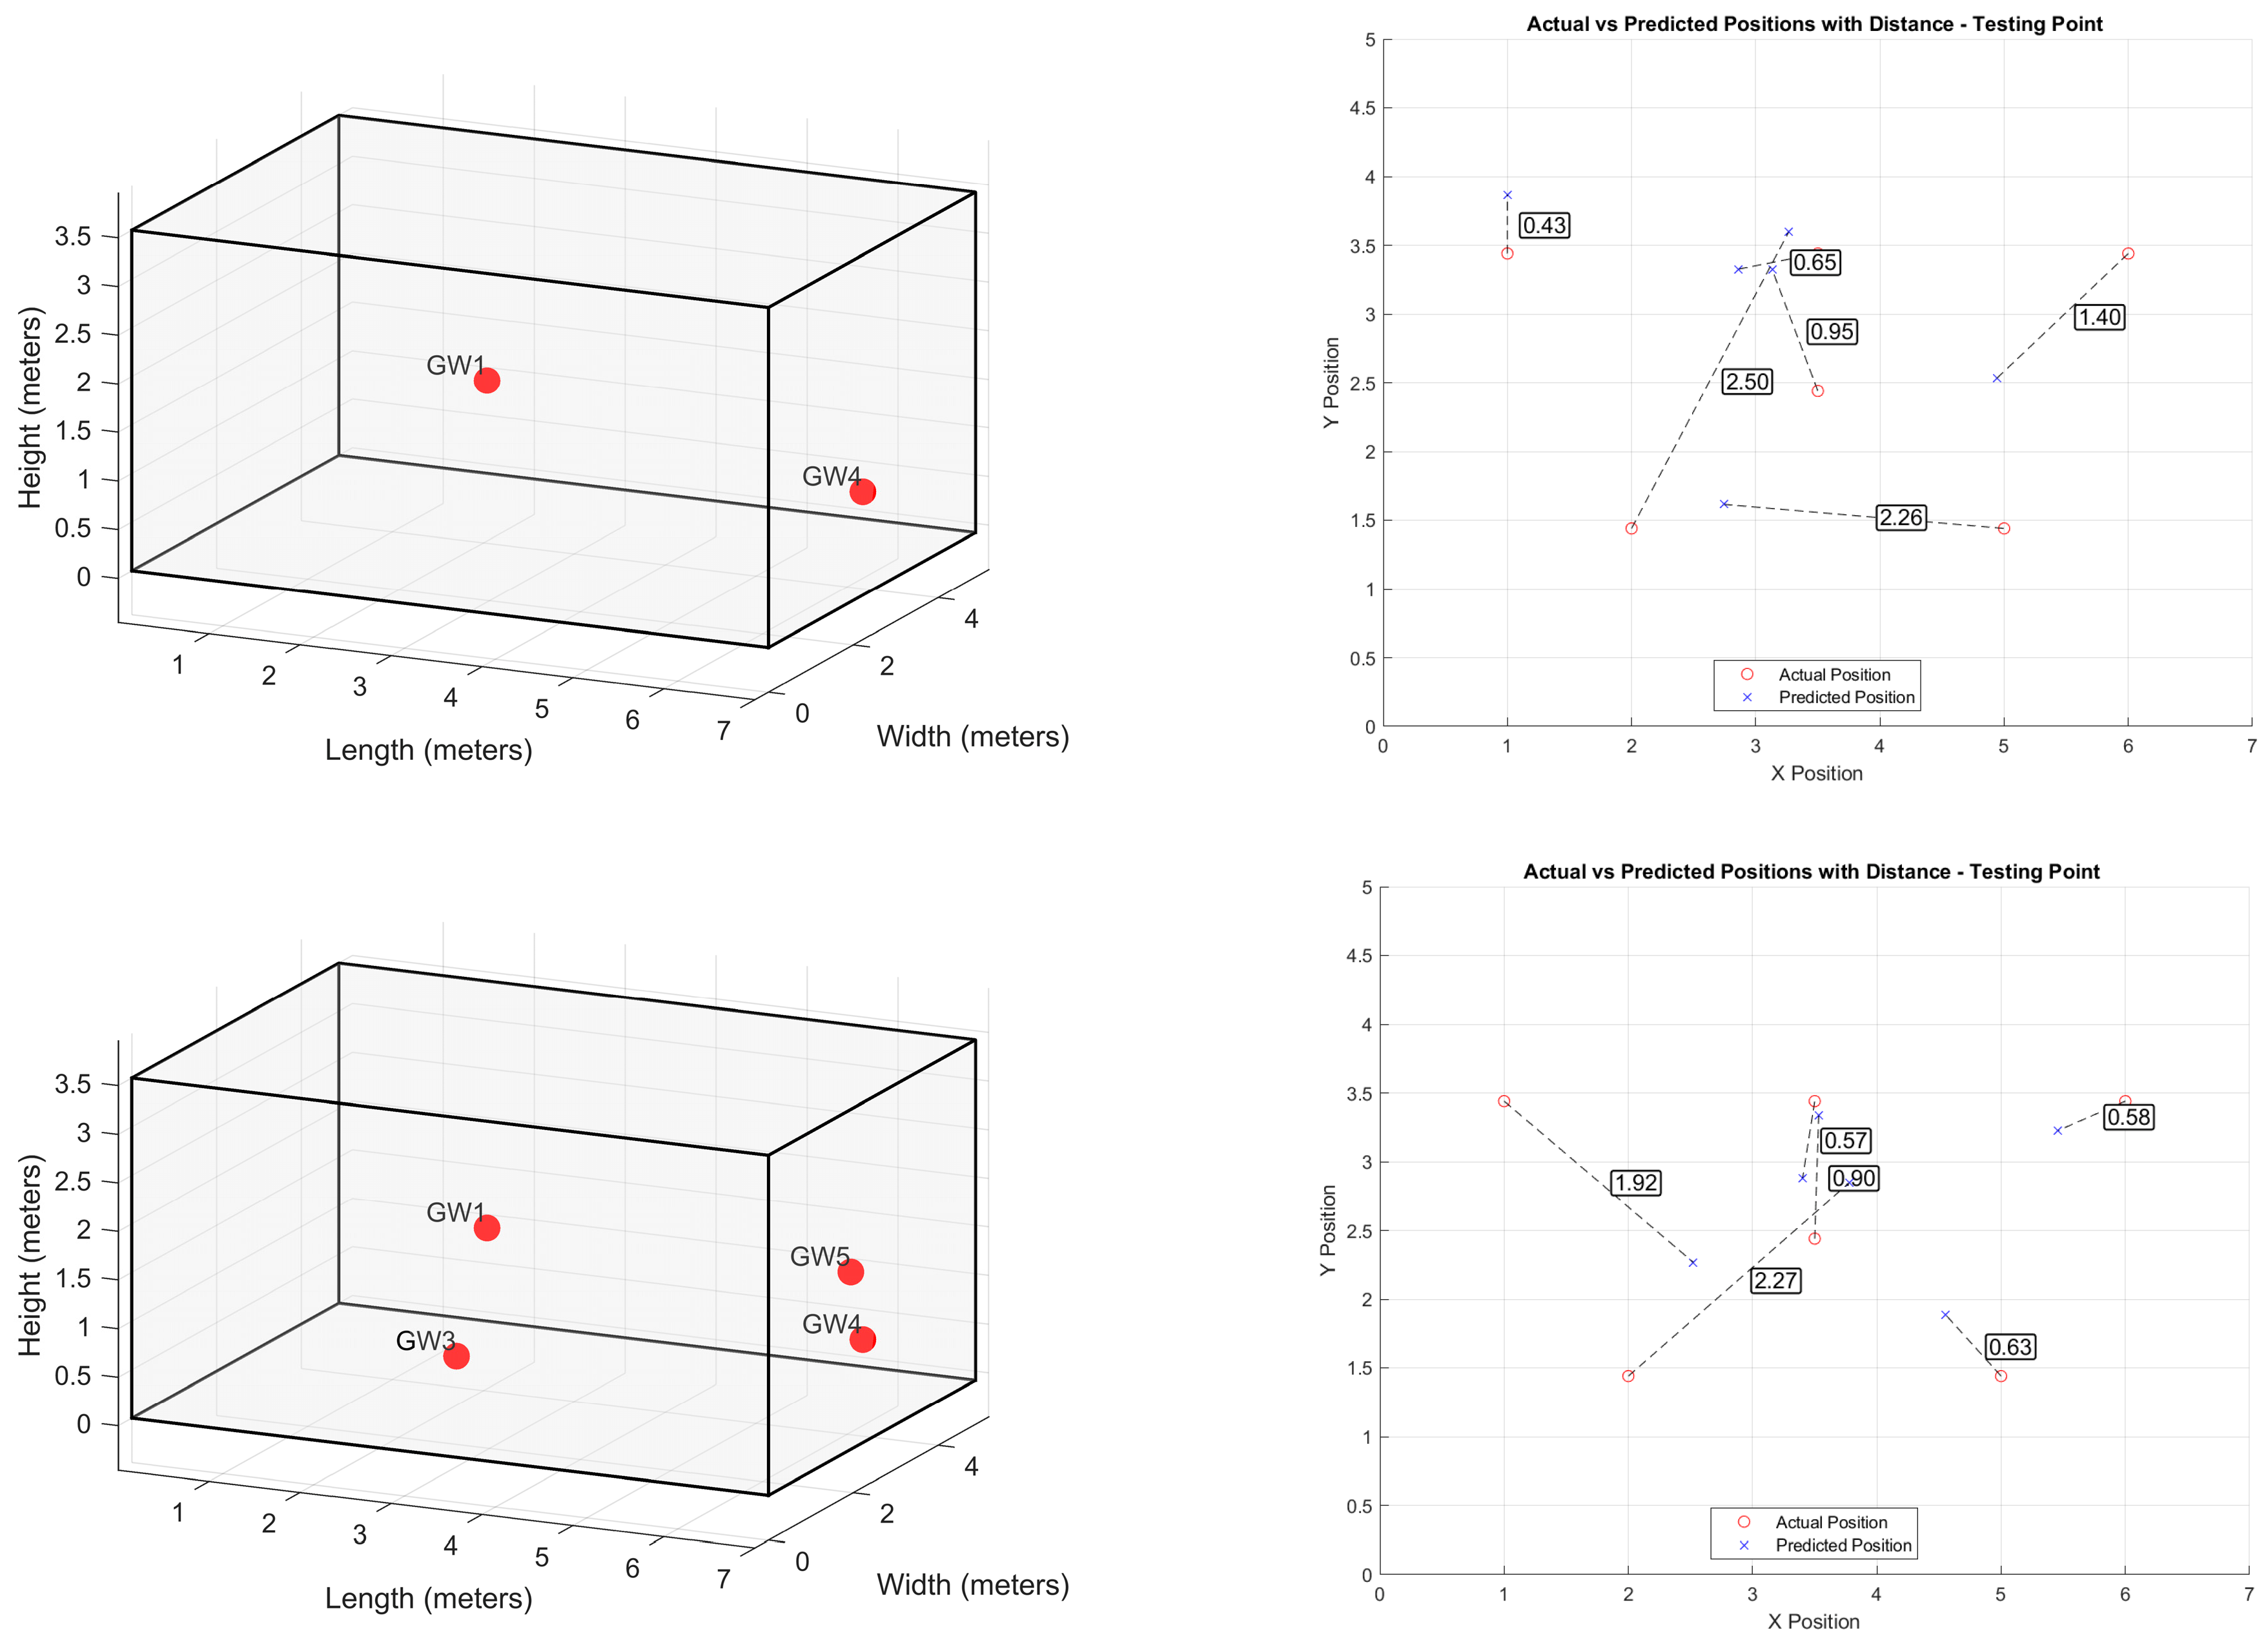
Table 3 illustrates the best indoor localization errors at the five body positions, considering different combinations of wall-mounted receivers. The errors are reported for combinations of two, three, four, and five gateways.
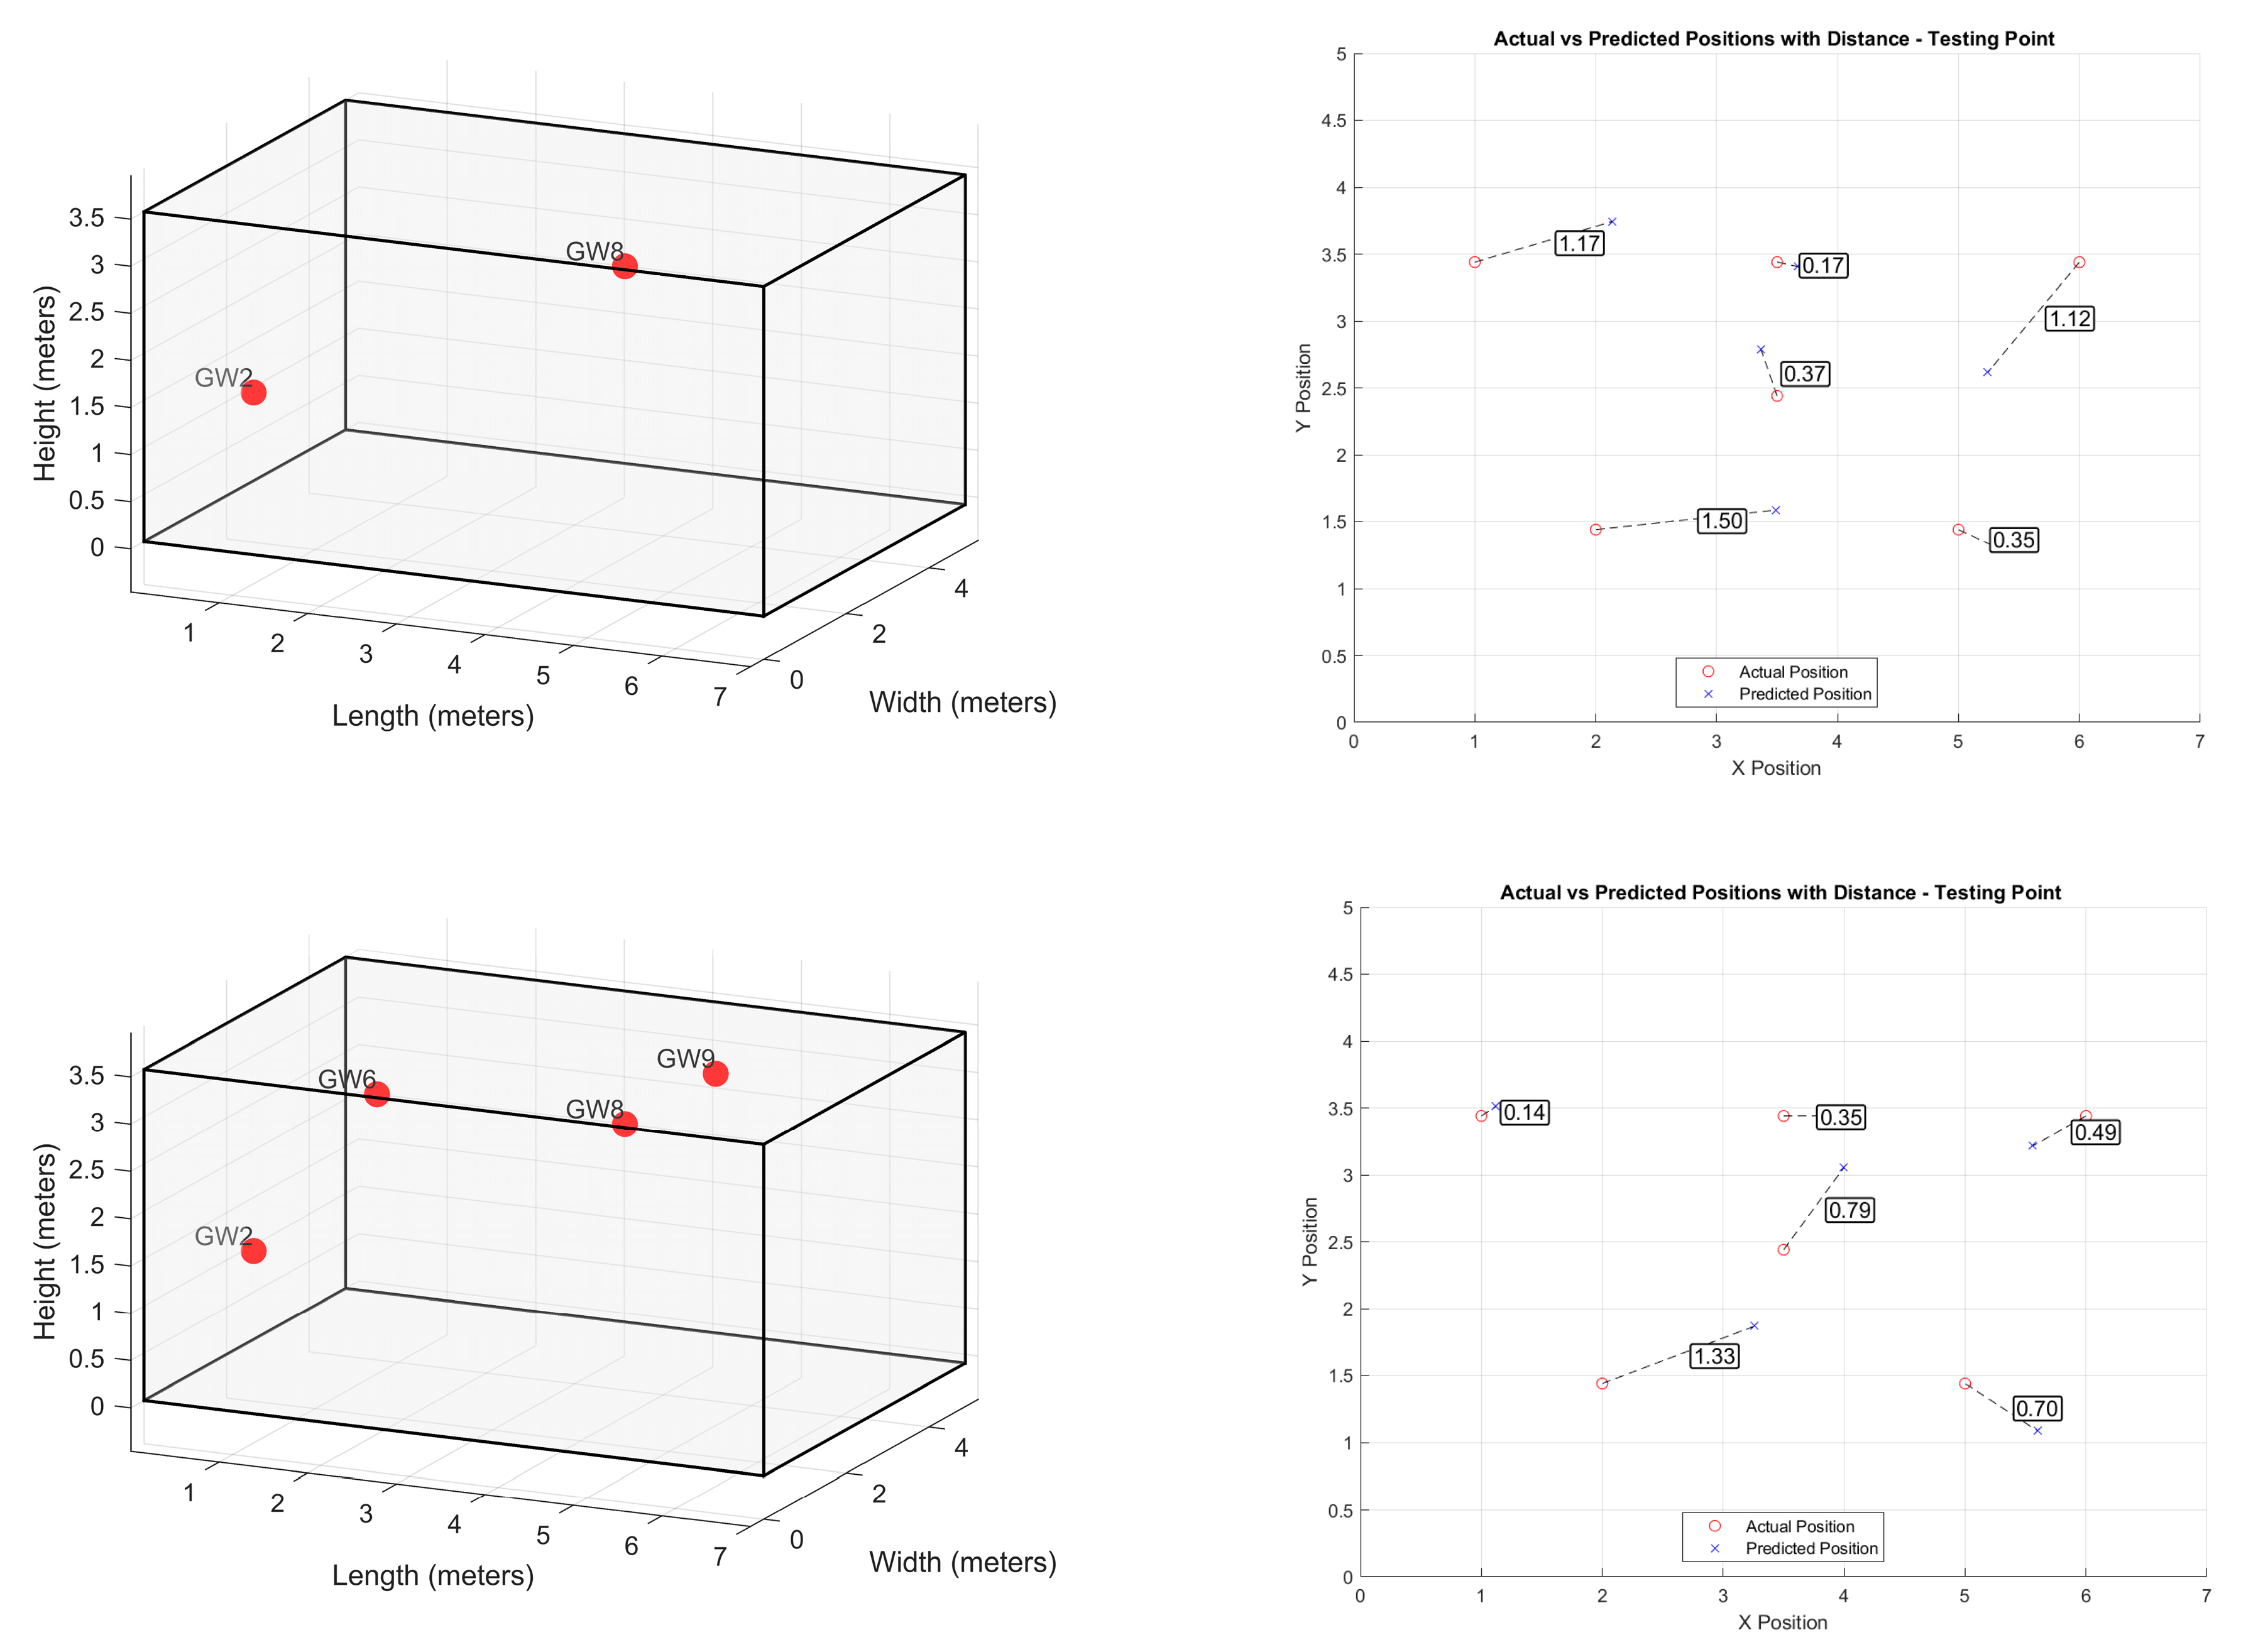
Figure 12 shows the best localization errors along with their respective wall gateway combinations, with the top figures corresponding to the shoulder position and the bottom figure corresponding to the wrist position.
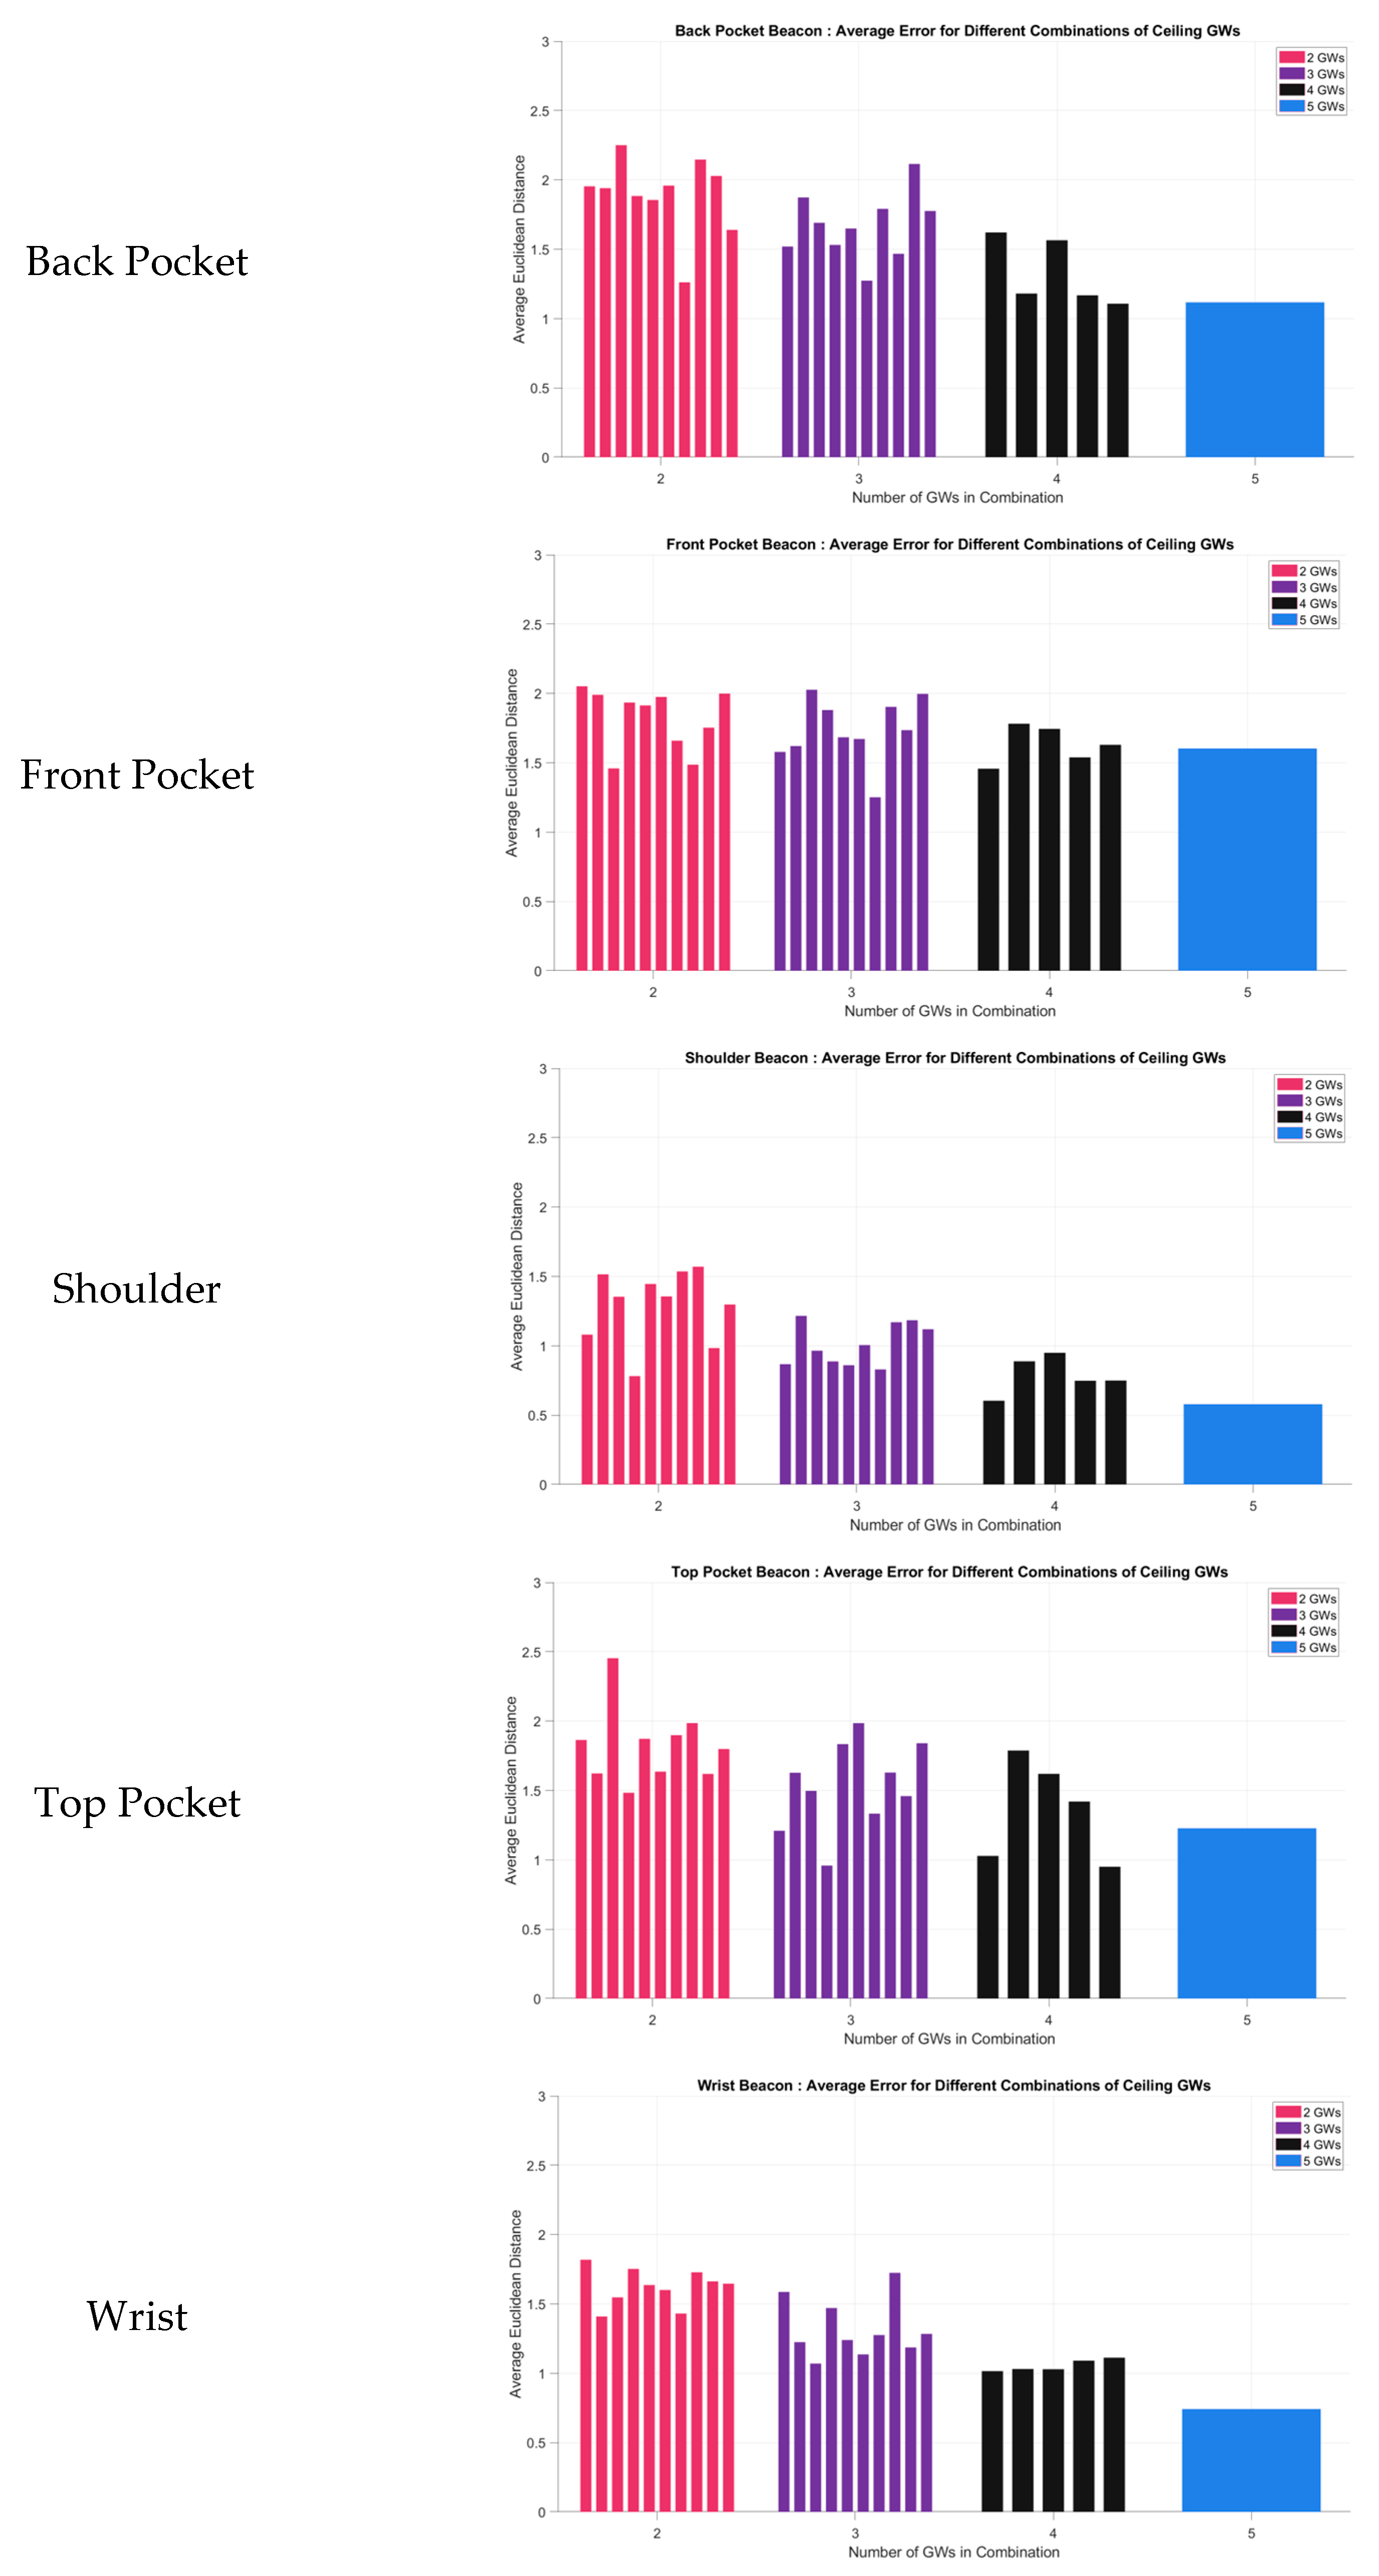
4.2. Localization Errors from the Ceiling GW Combinations
The results exhibit variability across different body positions and the number of gateways. Generally, as the number of gateways increases from 2 to 5, positioning errors tend to decrease, with the most significant reductions observed at positions such as the top pocket, shoulder, and wrist. For example, at the shoulder position, the error decreases from 0.78 m with 2 gateways to 0.57 m with 5 gateways, indicating that a higher number of gateways enhances accuracy in indoor localization. However, the influence of gateway count on positioning errors is body position-dependent. Notably, errors at the top pocket position display inconsistent patterns across various gateway configurations.
Figure 13 illustrates the indoor localization errors resulting from the utilization of various combinations of ceiling gateways. And
Table 4. illustrates the best indoor localization errors at the five BLE positions on the body and considers different combinations of ceiling-mounted receivers.
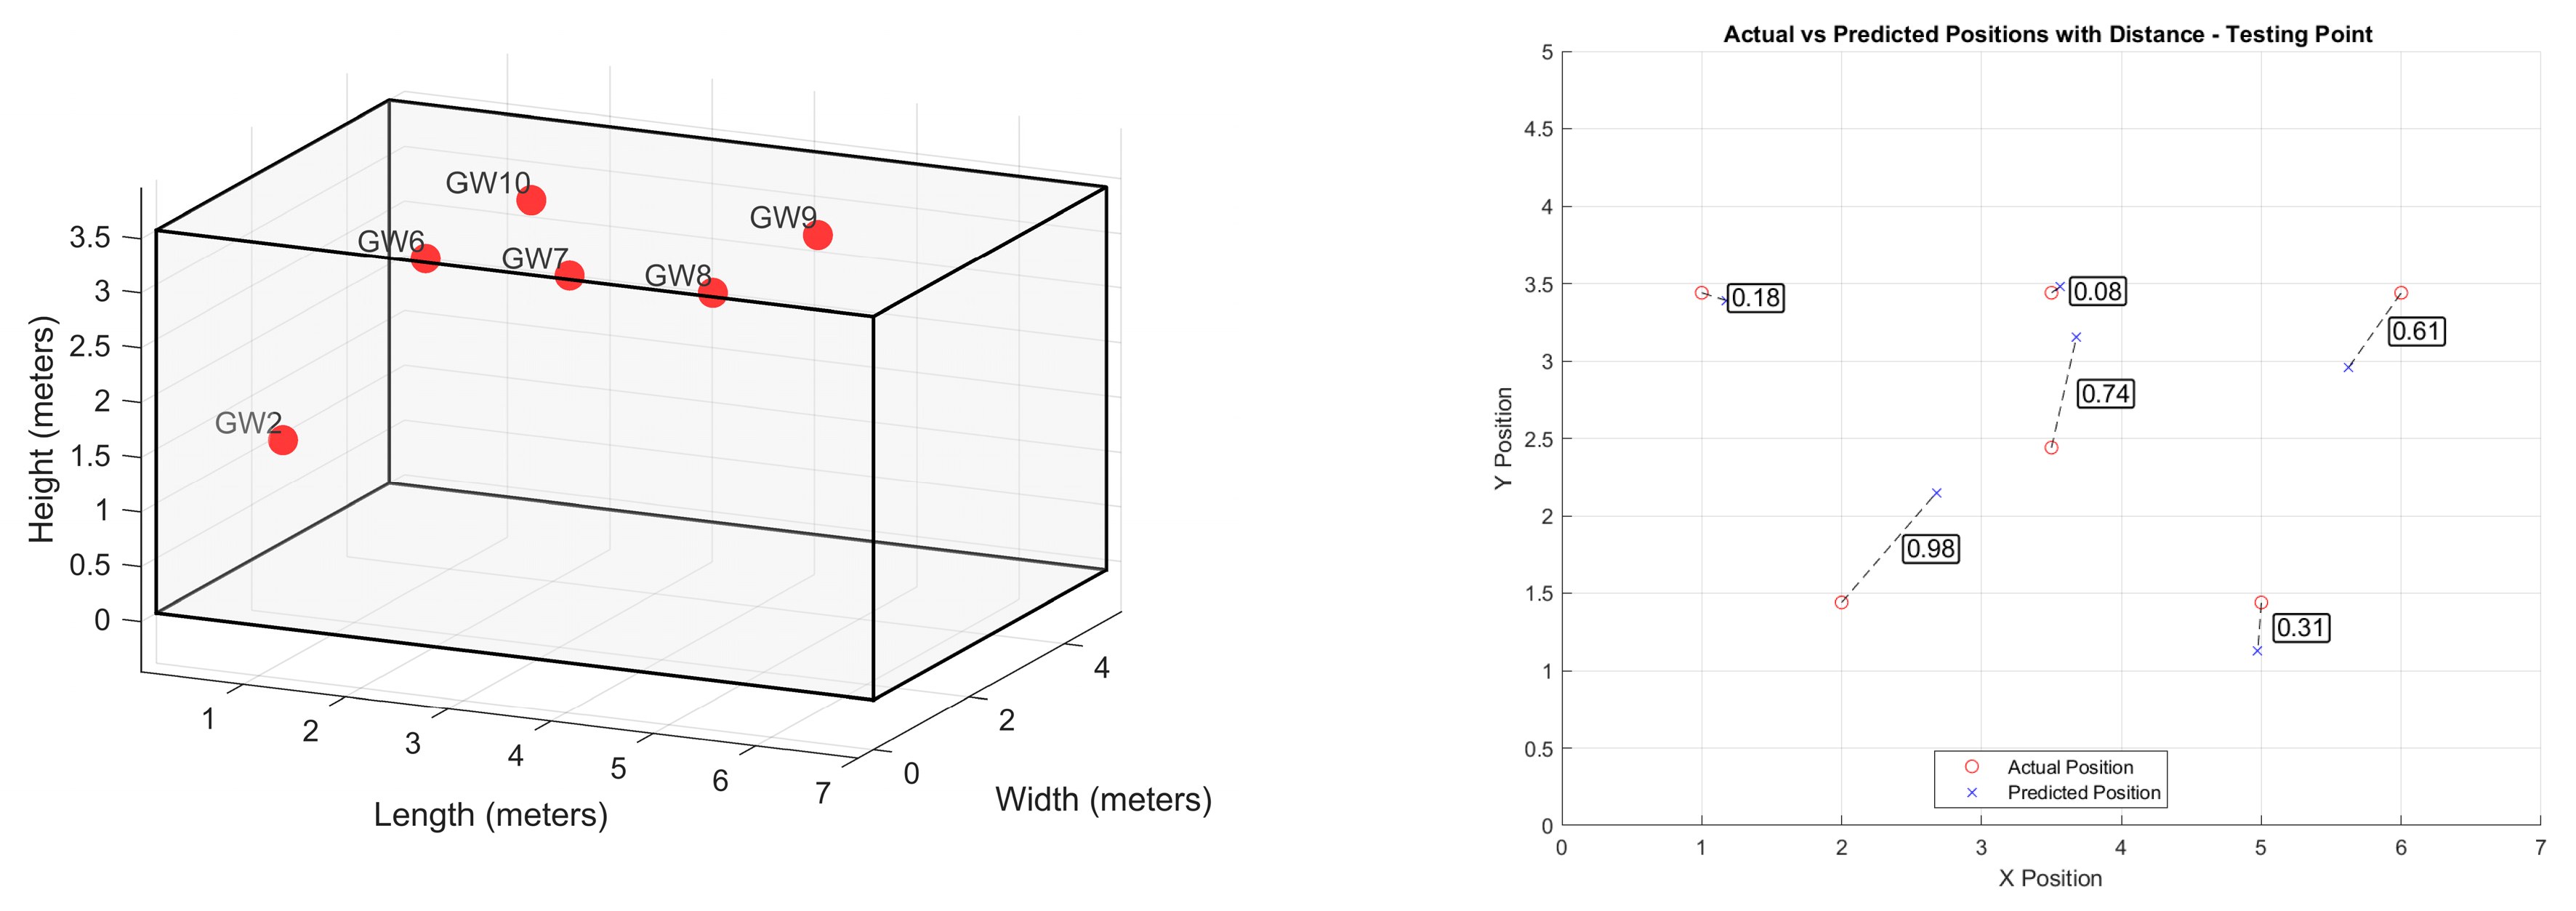
Figure 14 illustrates the best localization errors found along with their respective ceiling GW combinations. It is evident that the choice of body position has a discernible impact on localization accuracy. The results indicate that the shoulder position consistently yields the lowest errors across all combinations of GWs. This suggests that the shoulder position is particularly advantageous for achieving precise indoor localization when utilizing BLE beacons. On the other hand, the front pocket and back pocket positions exhibit higher errors, indicating a comparatively less reliable localization performance in these locations. The top pocket and wrist positions fall in between, demonstrating varying degrees of accuracy.
The analysis of localization data from ceiling-mounted and wall-mounted receivers indicated that ceiling-mounted gateways generally offer higher localization accuracy, particularly at the shoulder position across various configurations. Both configurations demonstrated varying error rates with an increasing number of gateways; however, ceiling-mounted configurations consistently showed greater improvements in accuracy as the number of gateways increased. Examination of error patterns across different body positions suggested that the choice between wall-mounted and ceiling-mounted configurations should be influenced by the specific use case and the predominant body positions involved. The highest localization accuracy was consistently observed at the shoulder position across configurations.
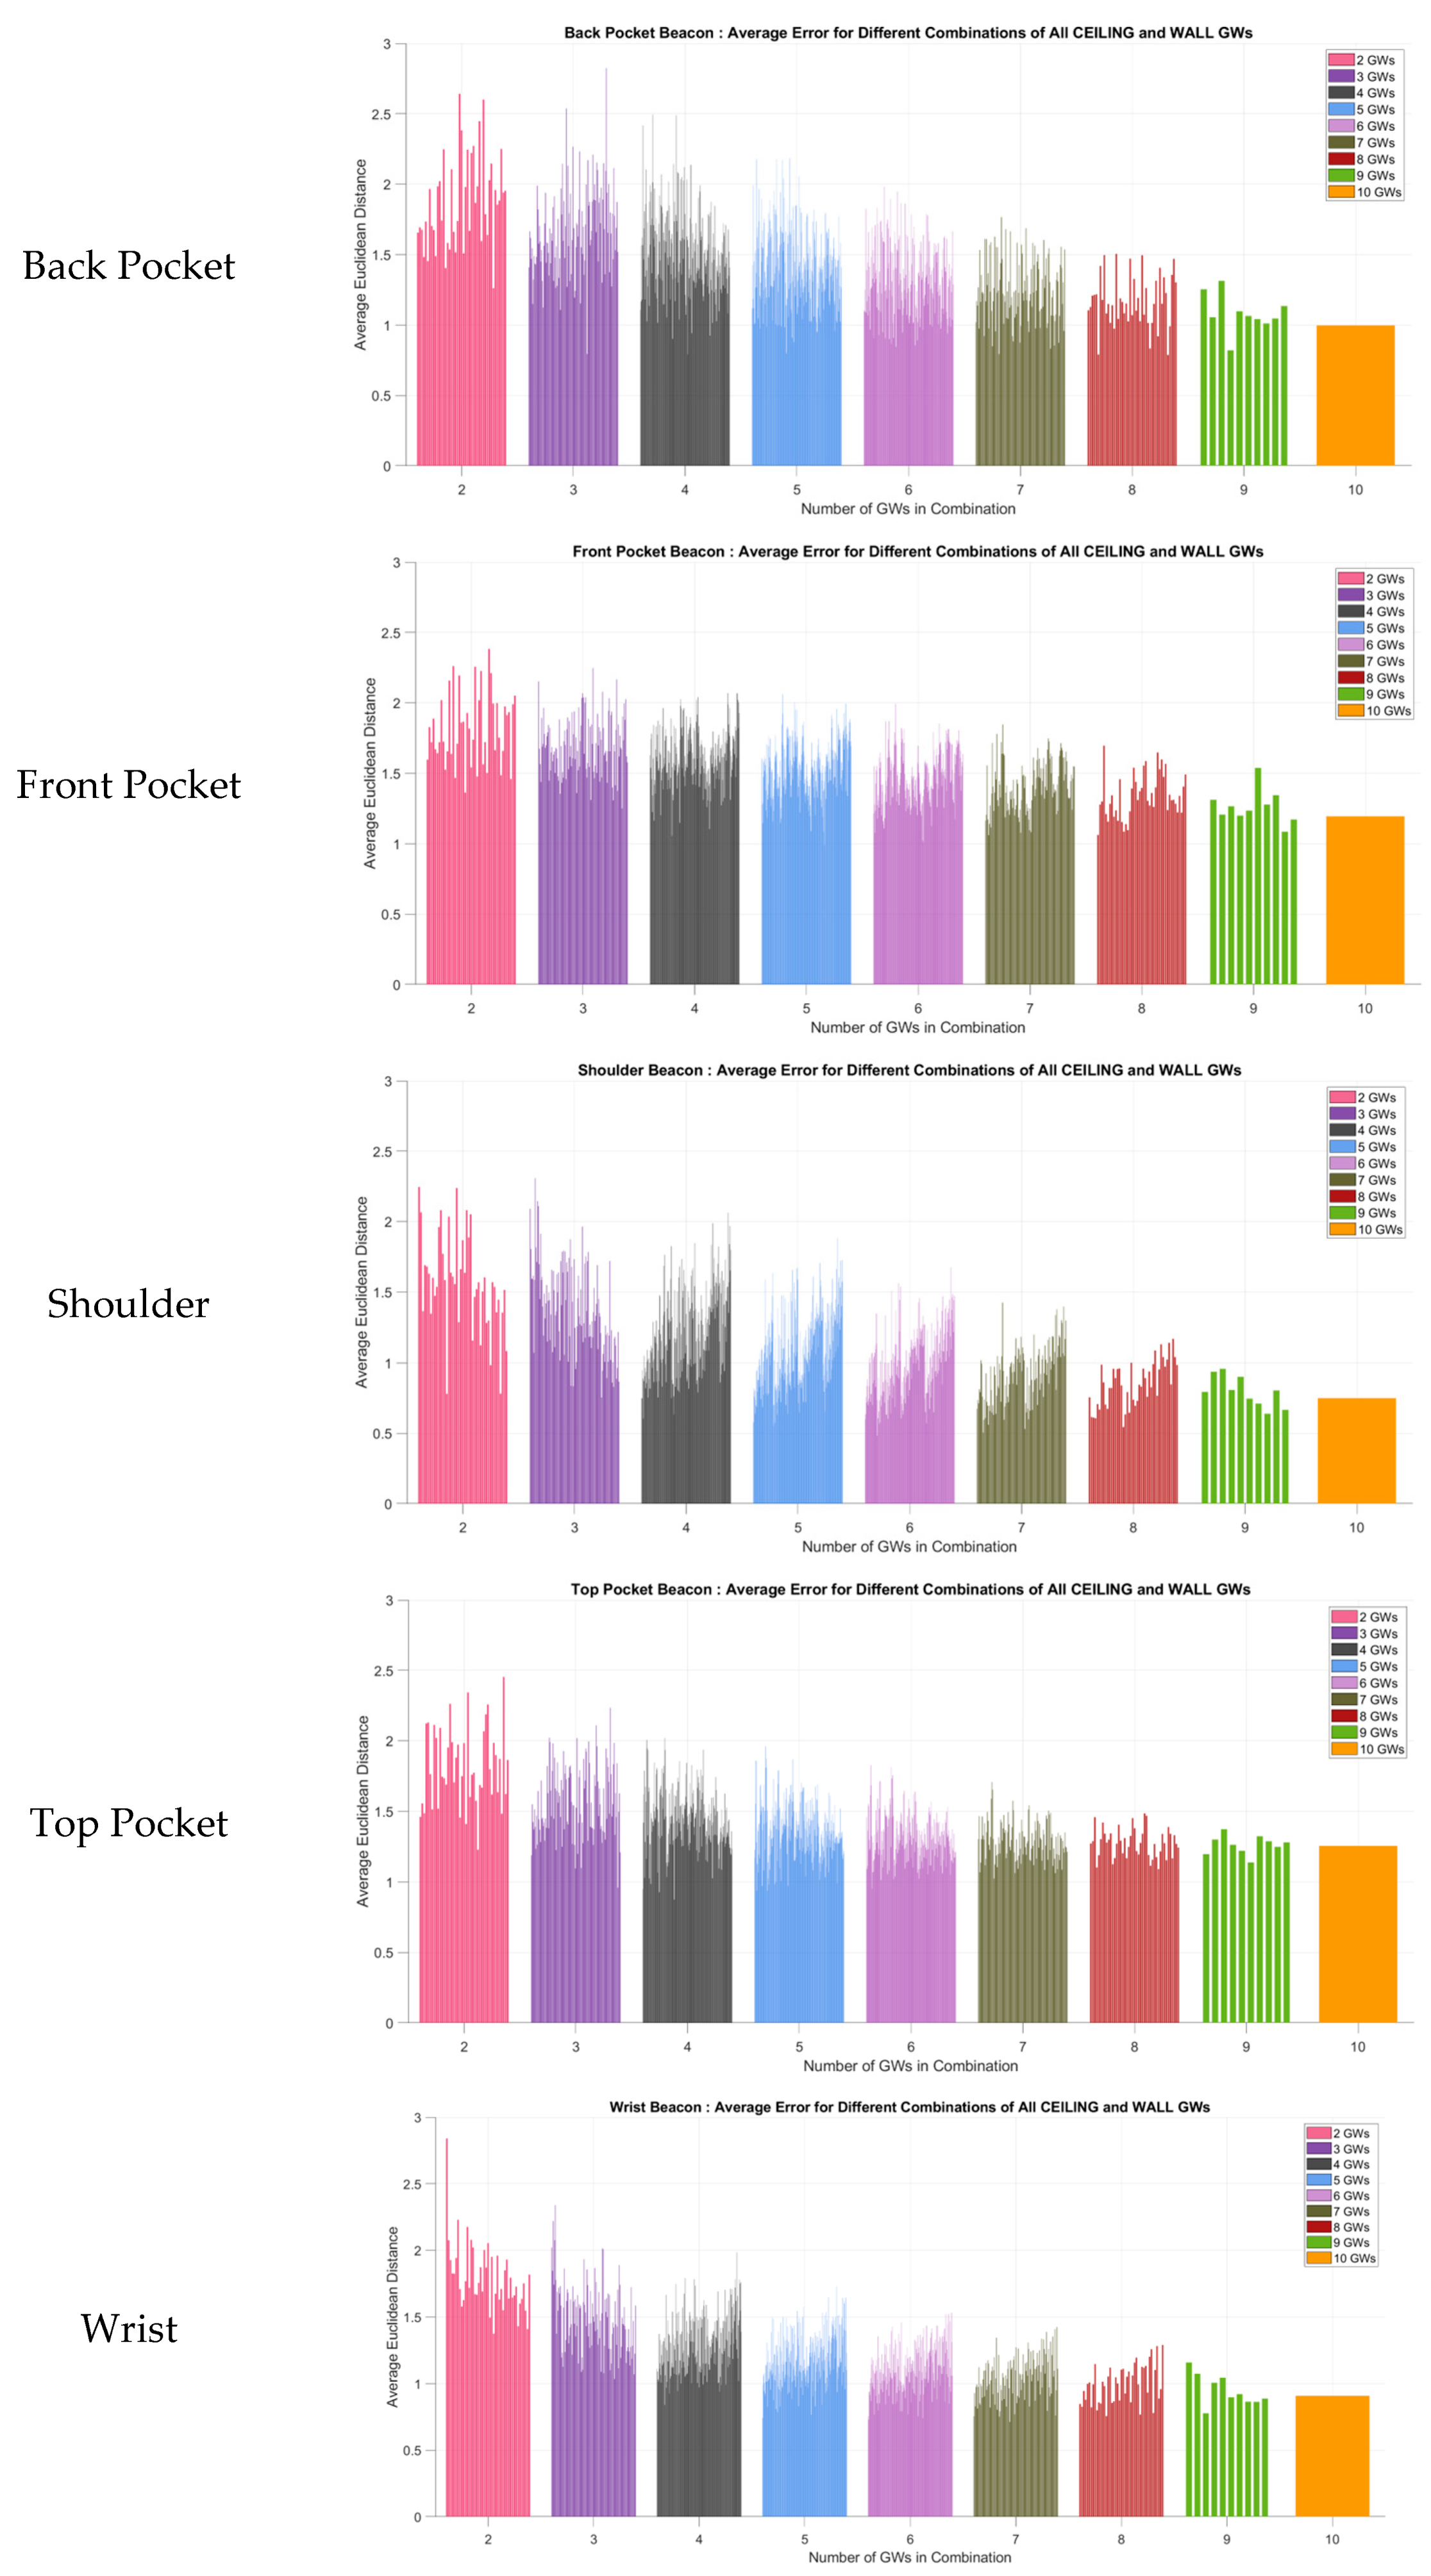
4.3. Localization Errors from the All (Ceiling and Wall) GW Combinations
The combined configurations, employing both ceiling-mounted and wall-mounted receivers, demonstrate improved localization accuracy compared to the separate wall and ceiling configurations previously discussed. The enhancements are especially significant in the front pocket, back pocket, top pocket, and wrist positions across varying numbers of gateways. This combination offers more comprehensive and robust coverage, leading to improved accuracy in indoor localization.
Figure 15 illustrates the localization errors for all possible combinations of wall and ceiling gateways.
Table 5 presents the best localization accuracies achieved using both ceiling-mounted and wall-mounted gateways in configurations ranging from 2 to 10 gateways.
The shoulder position retains its low error rates in the combined configurations, with improvements becoming more pronounced as the number of gateways increases. The combined setup enhances the reliability of the shoulder position for precise indoor localization. These results indicate that integrating both ceiling and wall-mounted gateways yields a more robust and accurate indoor localization system across various body positions.
Figure 16 illustrates the best localization errors for the respective ceiling and wall combinations.


