1. Introduction
The integration of solar energy systems has emerged as a critical strategy in the global transition toward sustainable, low-carbon infrastructures [
1]. Central to this shift are photovoltaic (PV) panels, whose efficiency can be significantly reduced from their design levels by environmental and physical factors.
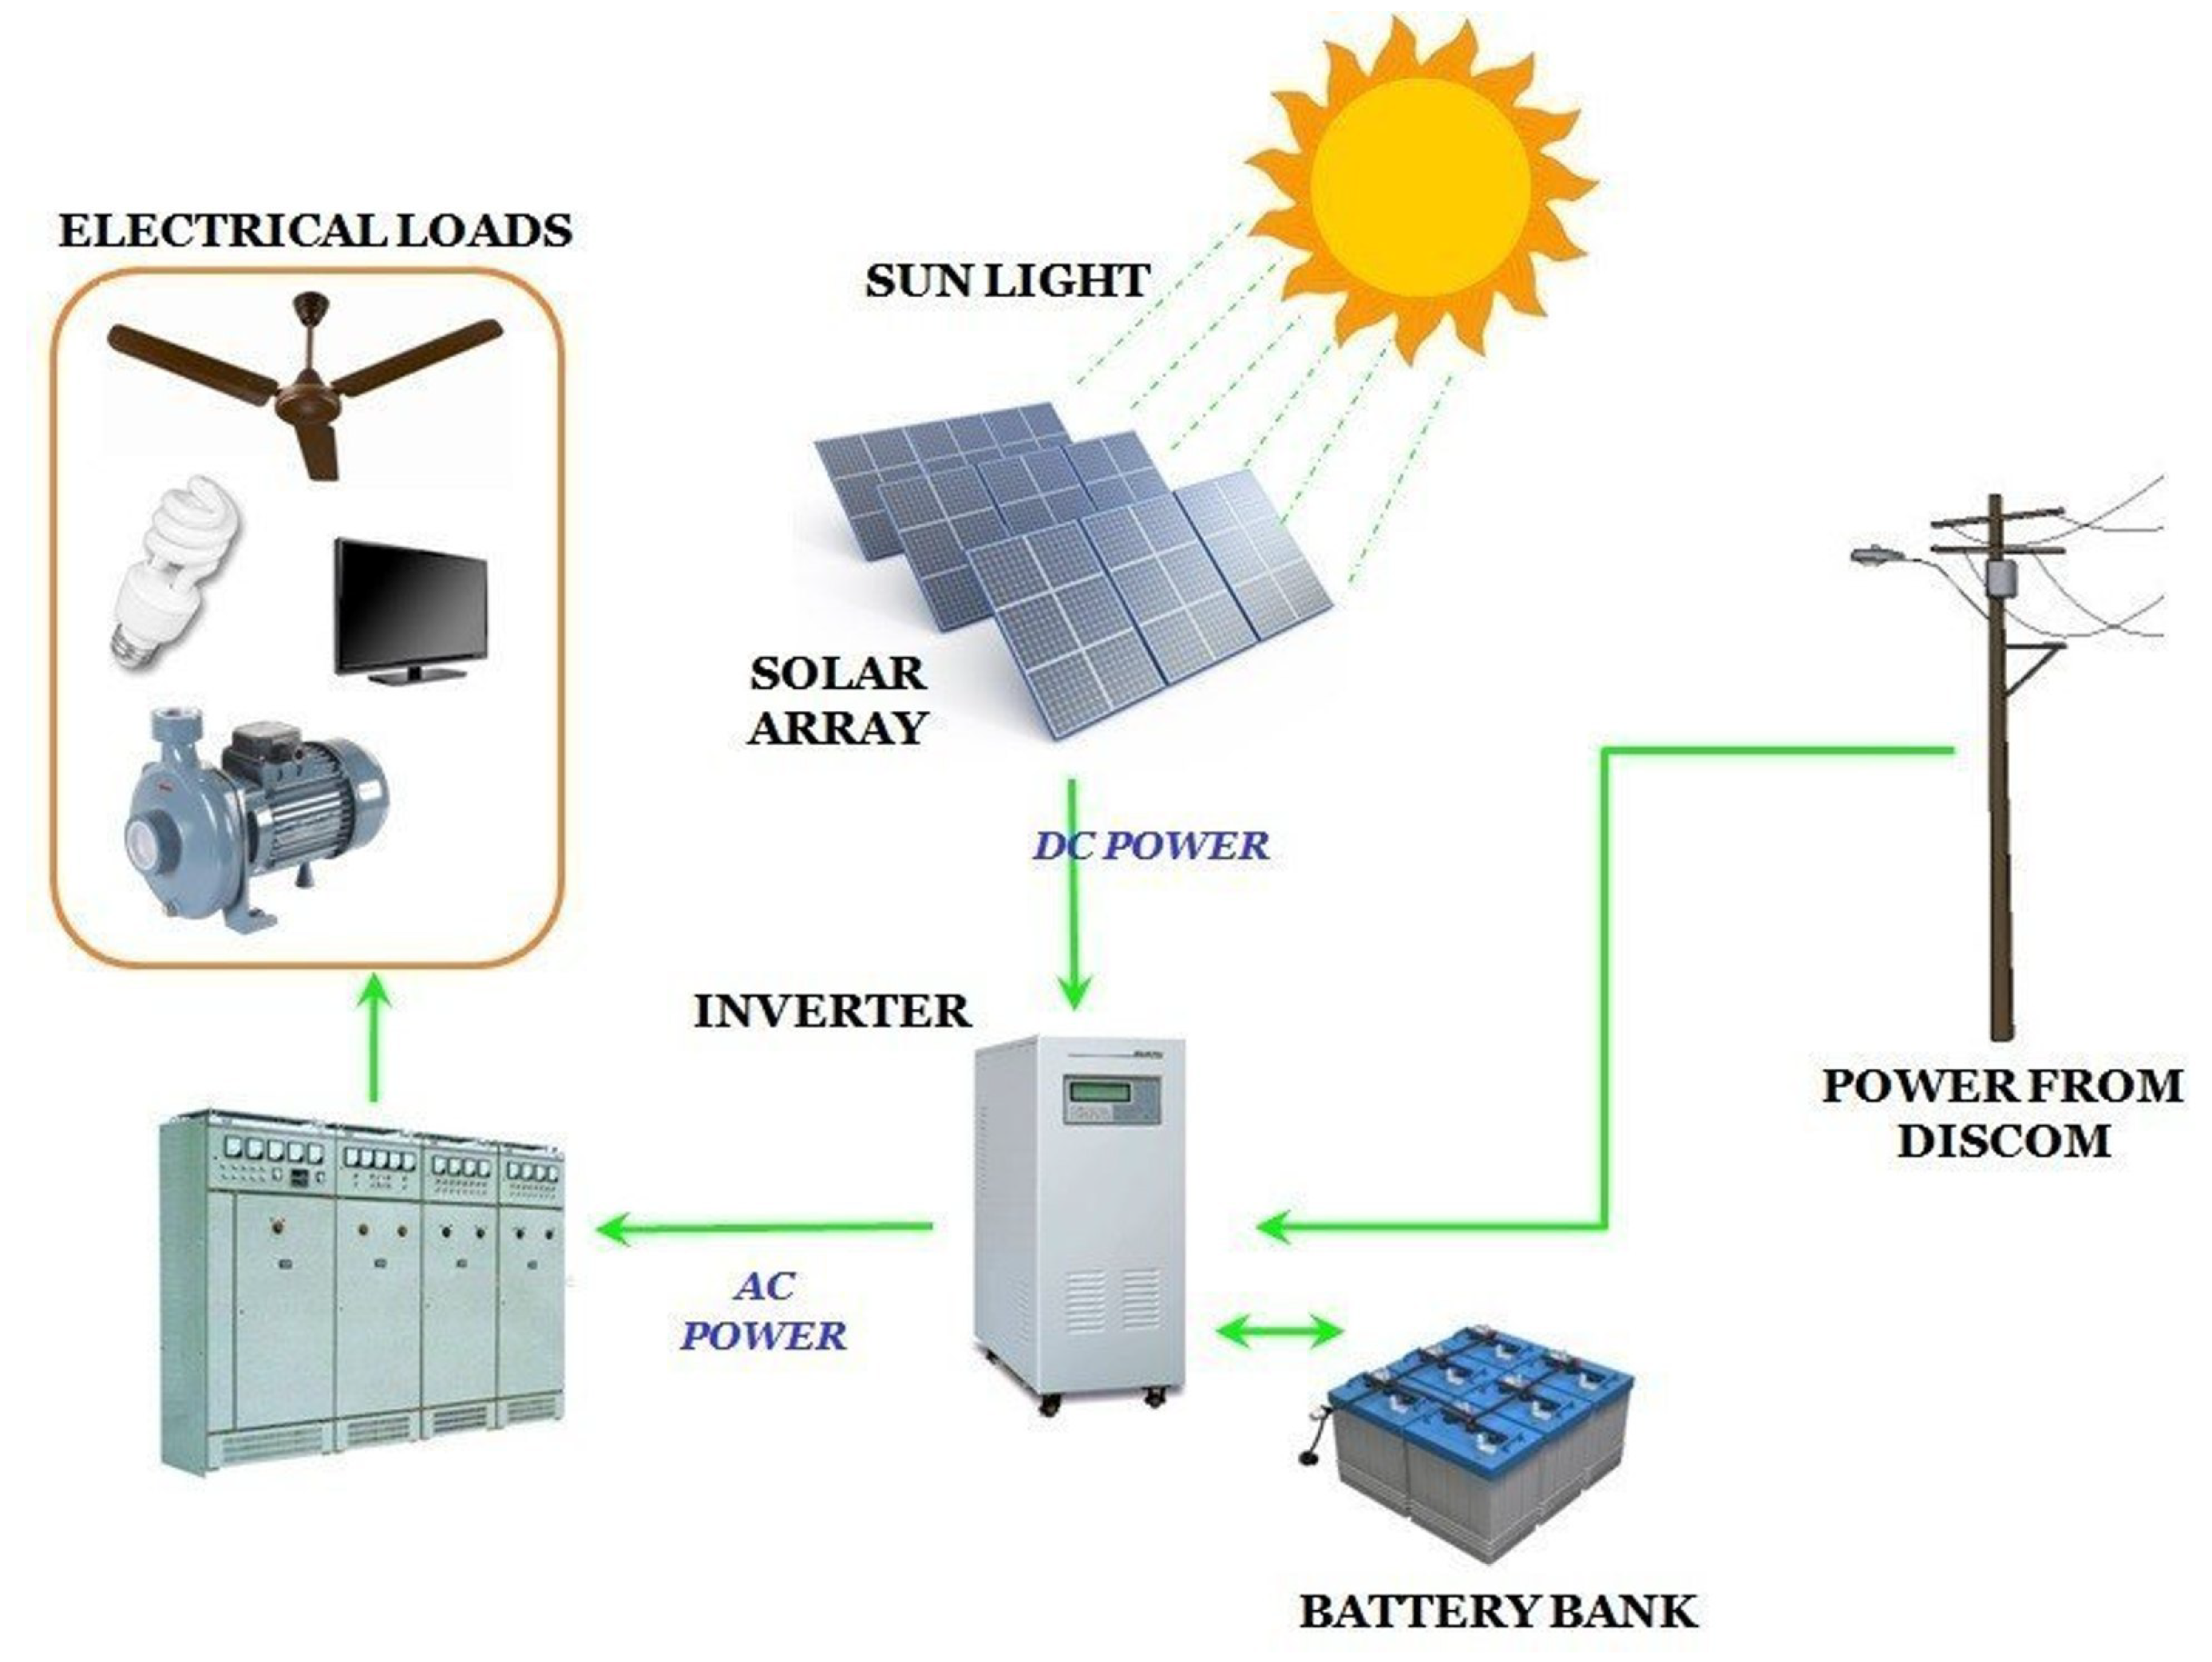
To illustrate the operational context of this work,
Figure 1 presents the main components and power flow of a typical on-grid solar PV system. Sunlight is captured by the solar array and converted into DC power. This energy is routed through the inverter, which supplies AC power to household and industrial loads. Surplus energy is stored in the battery bank for later use, while additional electricity can be drawn from the distribution grid (DISCOM) when solar generation is insufficient. Conversely, when local production exceeds demand, excess power can be exported to the grid. The inverter plays a central role in coordinating energy flows among the solar array, the battery bank, the grid (as both backup source and output destination), and the electrical loads, ensuring reliable and continuous power availability.
While PV systems offer a renewable alternative to fossil fuels, their efficiency can be significantly reduced by soiling [
2]. Dust [
3], snow [
4], and bird droppings [
5] are frequent contaminants that block sunlight and reduce energy conversion, sometimes causing losses ranging from 5% to more than 60%, depending on severity and local conditions [
6]. In addition, physical [
7] and electrical [
8] damage, such as cracks, delamination, hot spots, or diode breakdown, can drastically reduce panel output.
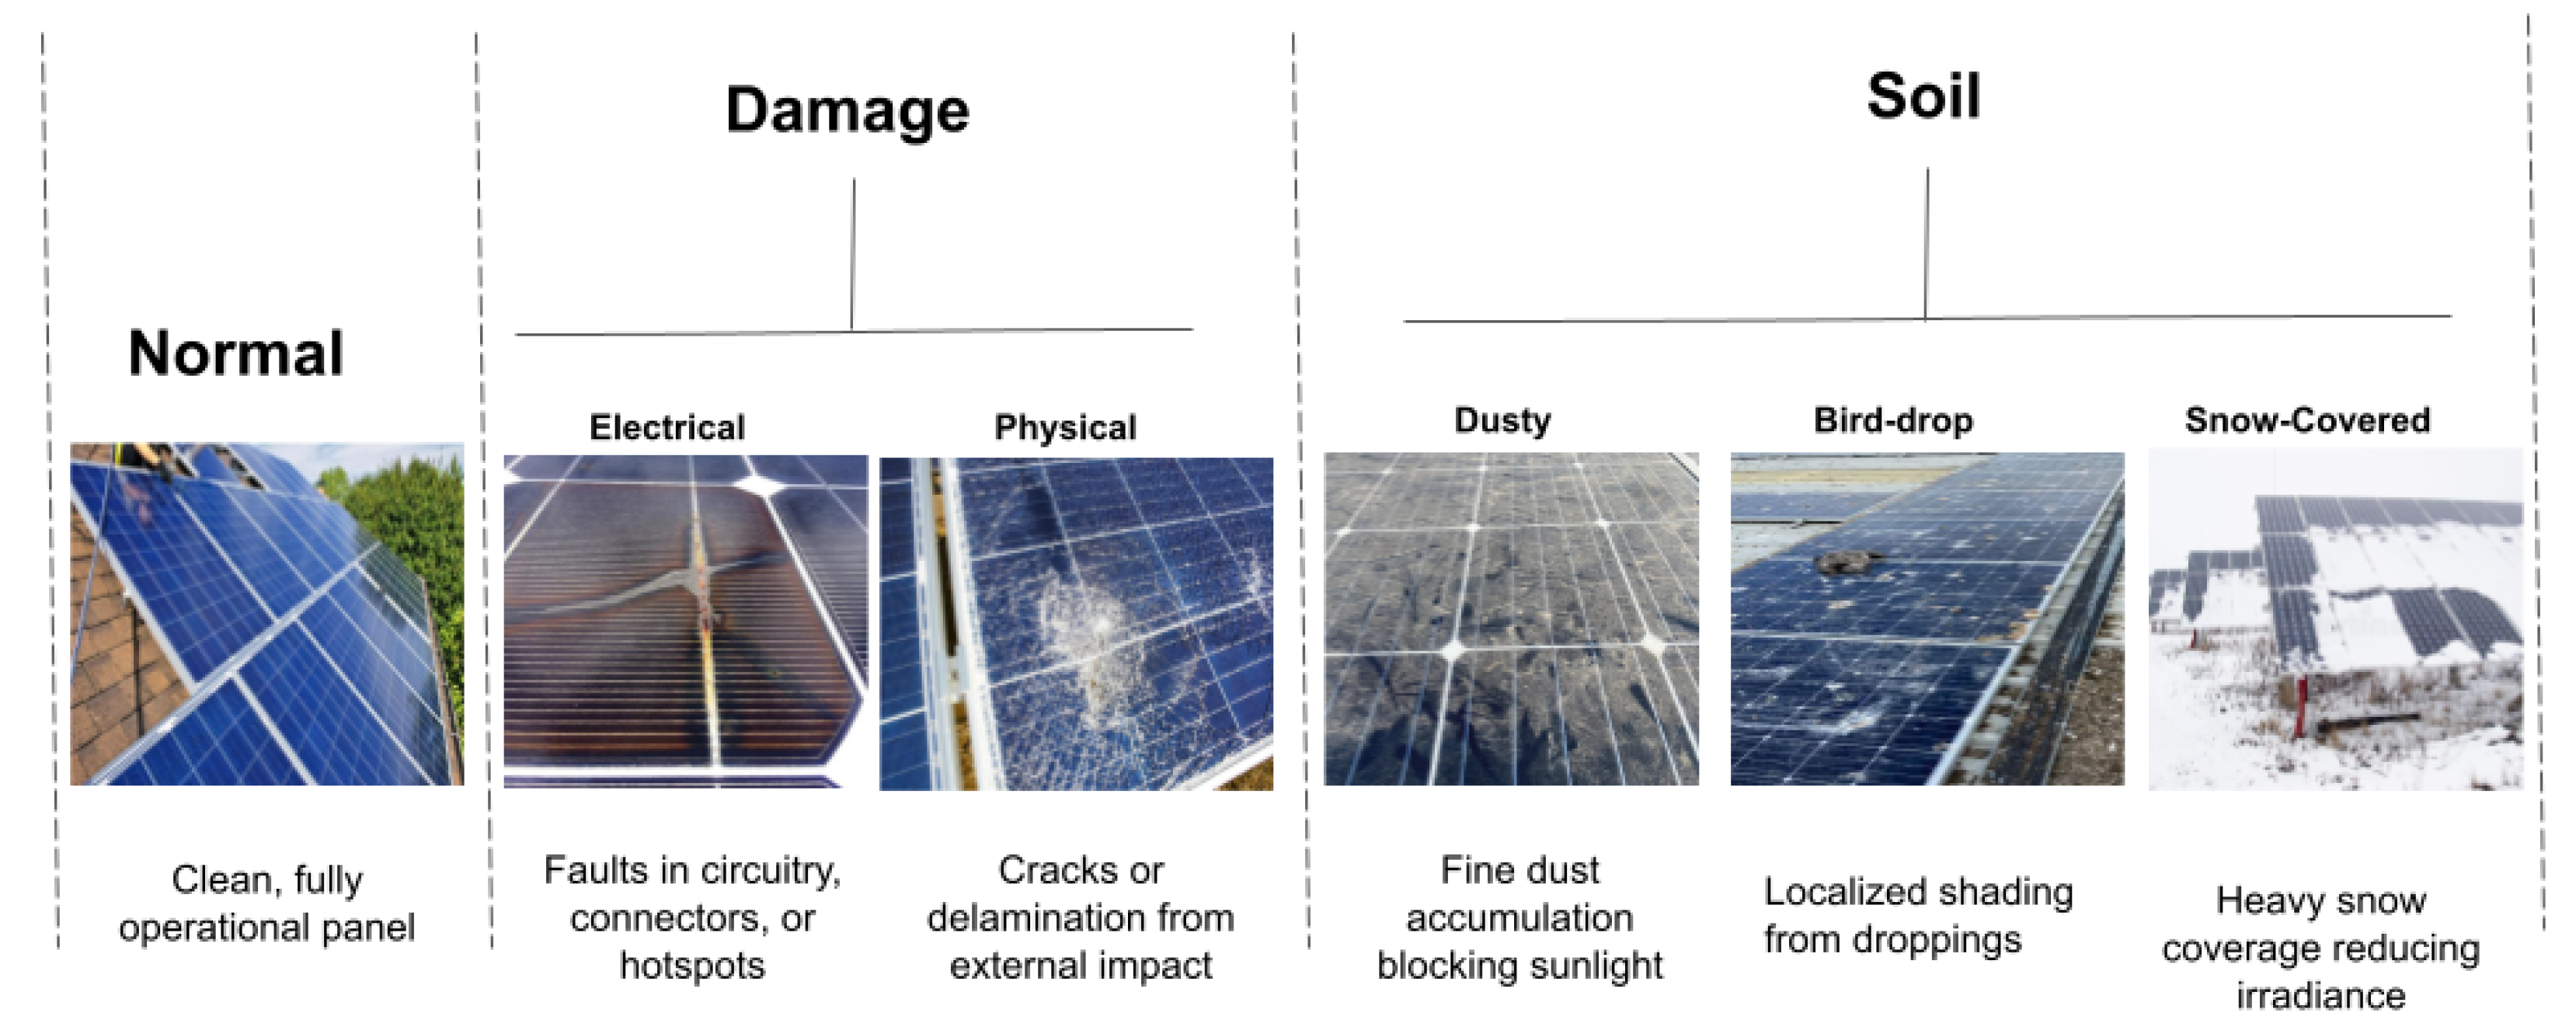
Figure 2 shows representative examples of clean panels, soiling types, and damage modalities.
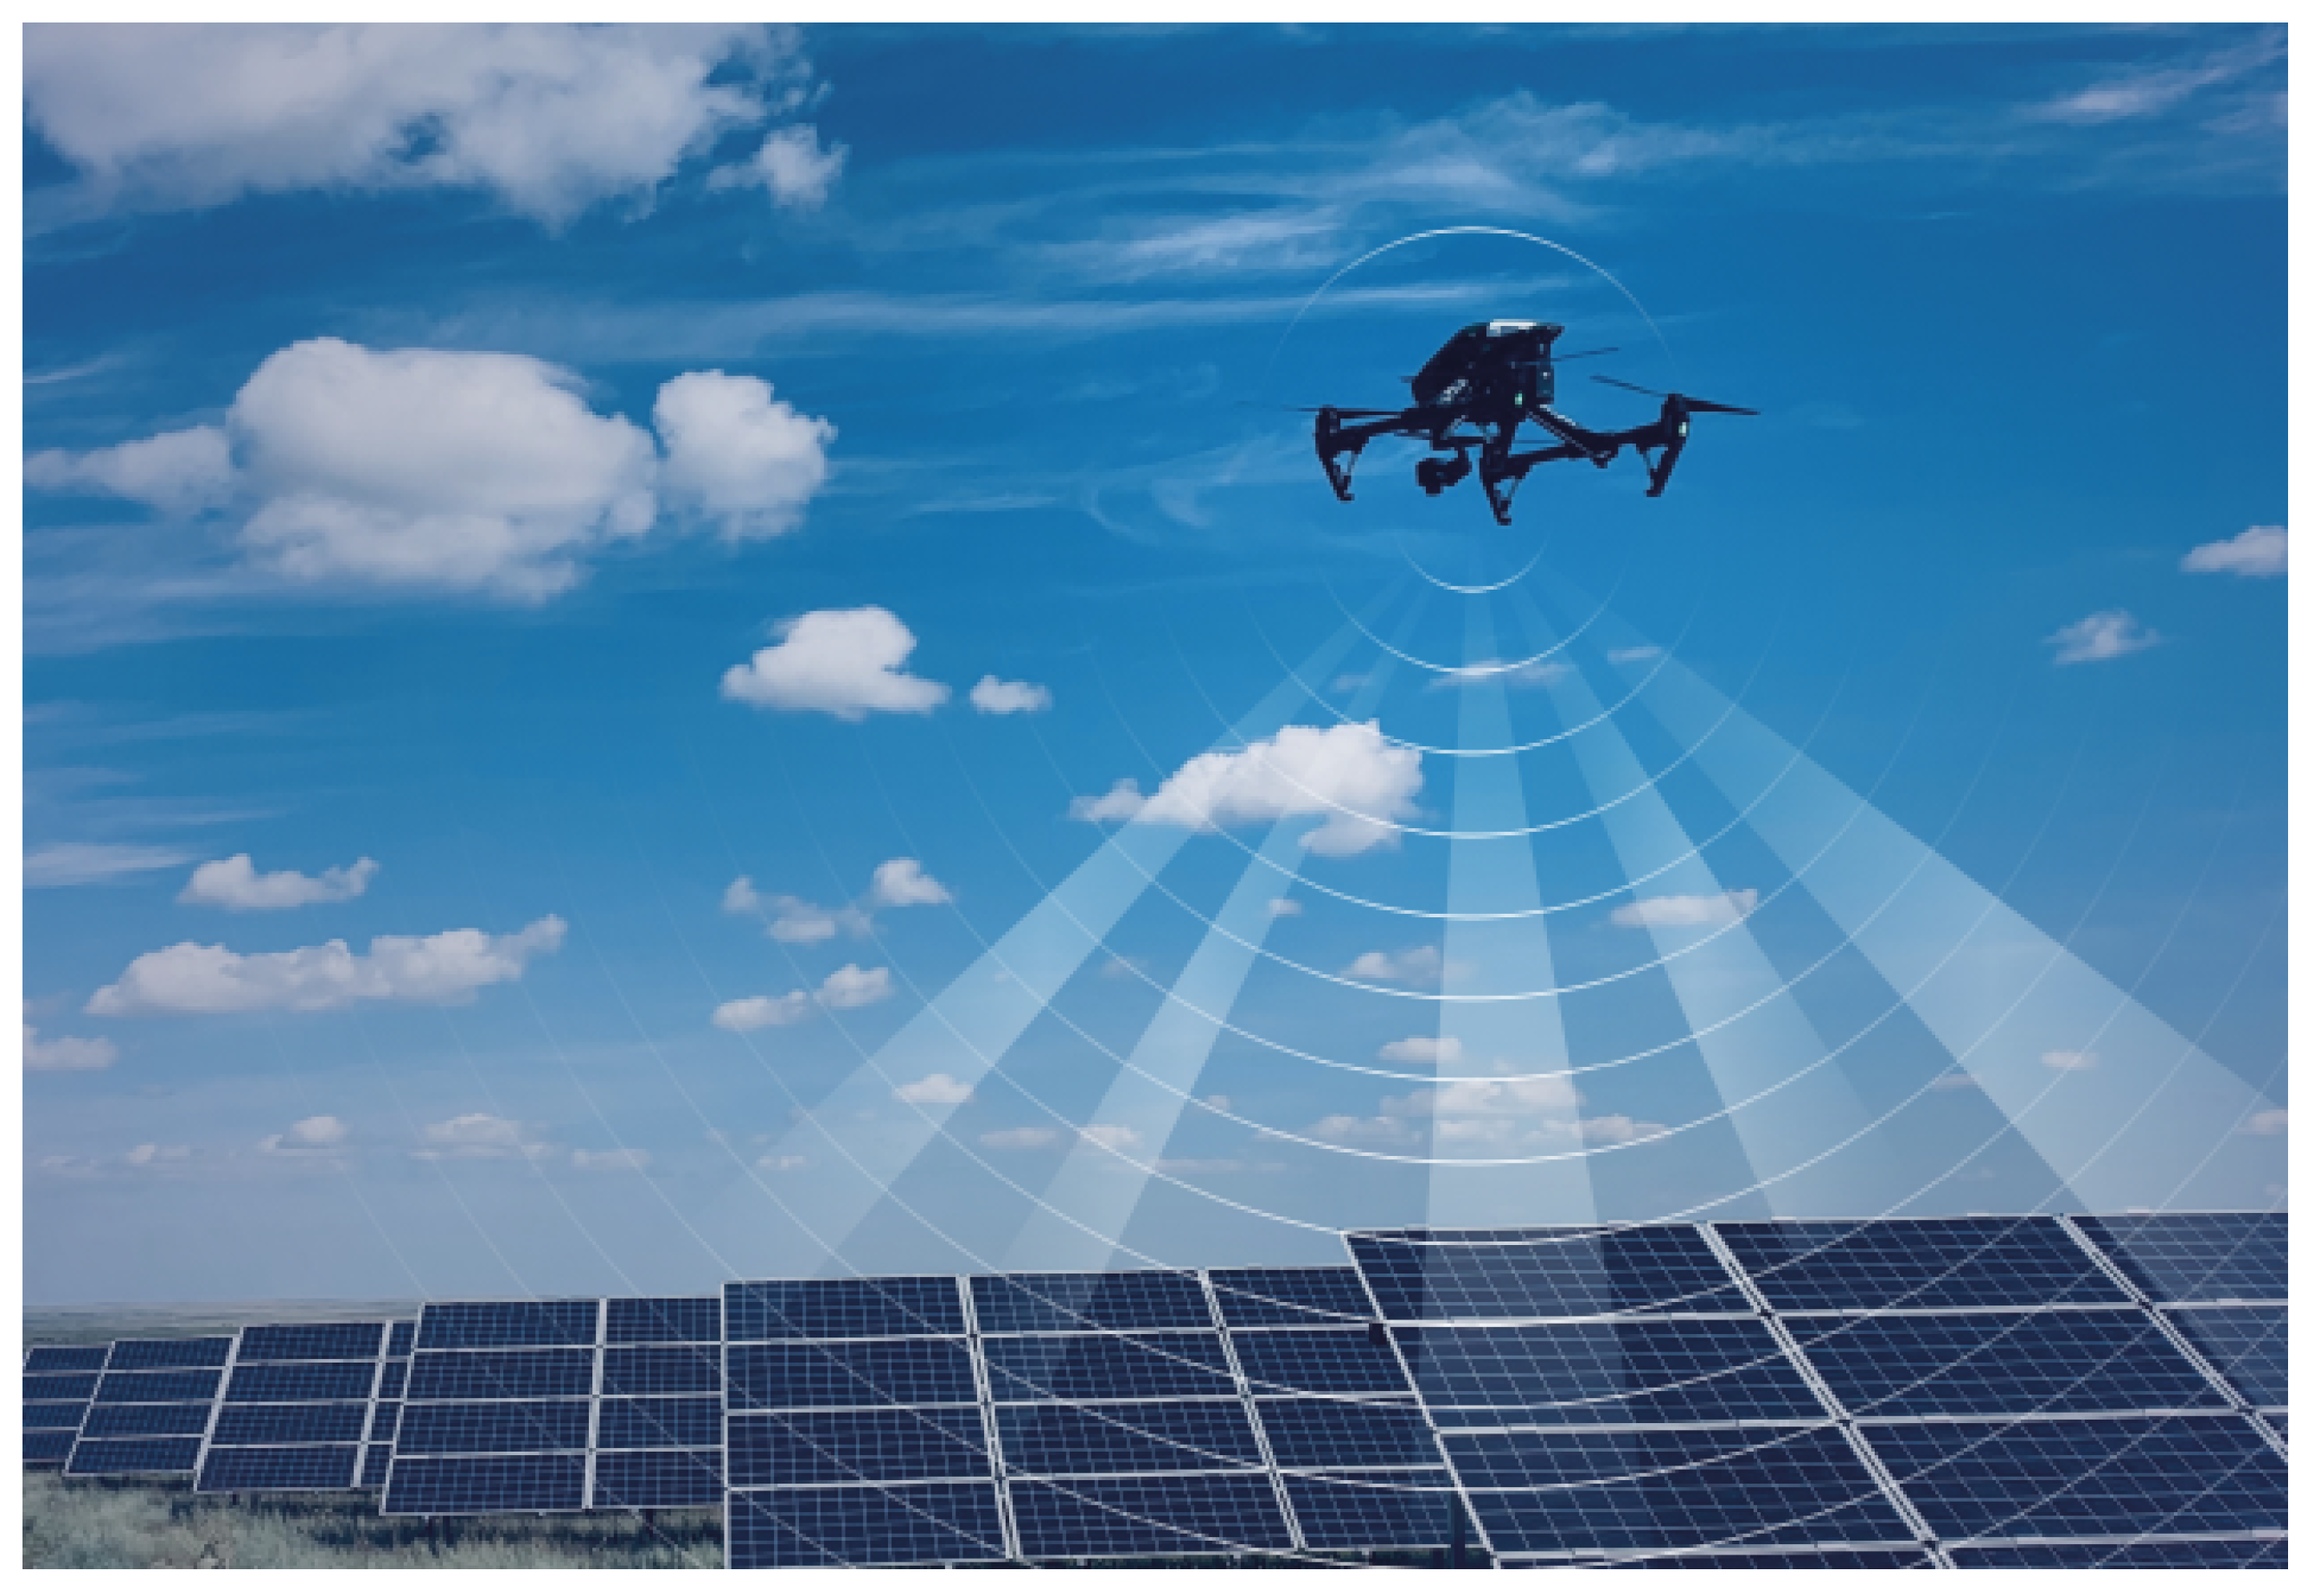
Manual inspection of PV systems across large farms is labor-intensive and inefficient. Drone-based inspection systems have therefore gained popularity, as they can cover vast areas quickly while capturing high-resolution imagery.
Figure 3 illustrates a drone operating over a solar array with AI-assisted anomaly detection.
The integration of artificial intelligence (AI) into drone-based inspection workflows improves automation and accuracy. Deep learning models can recognize complex soiling patterns and defect types directly from images, enabling consistent large-scale monitoring. A major challenge entails balancing accuracy with constraints on model size and inference speed: transformer-based models such as Vision Transformers (ViTs) [
10] achieve strong performance but are computationally heavy, while lightweight CNNs [
11] such as EfficientNet are faster but may miss subtle signs of defects.
Problem Statement and Motivation.
Despite significant progress has been made in automated inspection, but existing methods still face important limitations. Many approaches are either computationally heavy transformer-based models that are not well-suited to real-time deployment on drones or lightweight CNNs that fail to capture subtle soiling and signs of damage. Moreover, a unified framework that effectively balances accuracy, efficiency, and scalability for large-scale solar panel inspection is still lacking. These challenges indicate the need for an approach that is both accurate and lightweight, making it suitable for real-world monitoring on solar farms.
Aim of the Paper. This paper aims to design and evaluate a two-tiered classification framework that combines the strengths of DINOv2-based vision transformers and lightweight EfficientNet extensions to achieve both high accuracy and real-time suitability for the detection of defects and soiling on solar panels.
Contributions. The main contributions of this work are summarized as follows:
- -
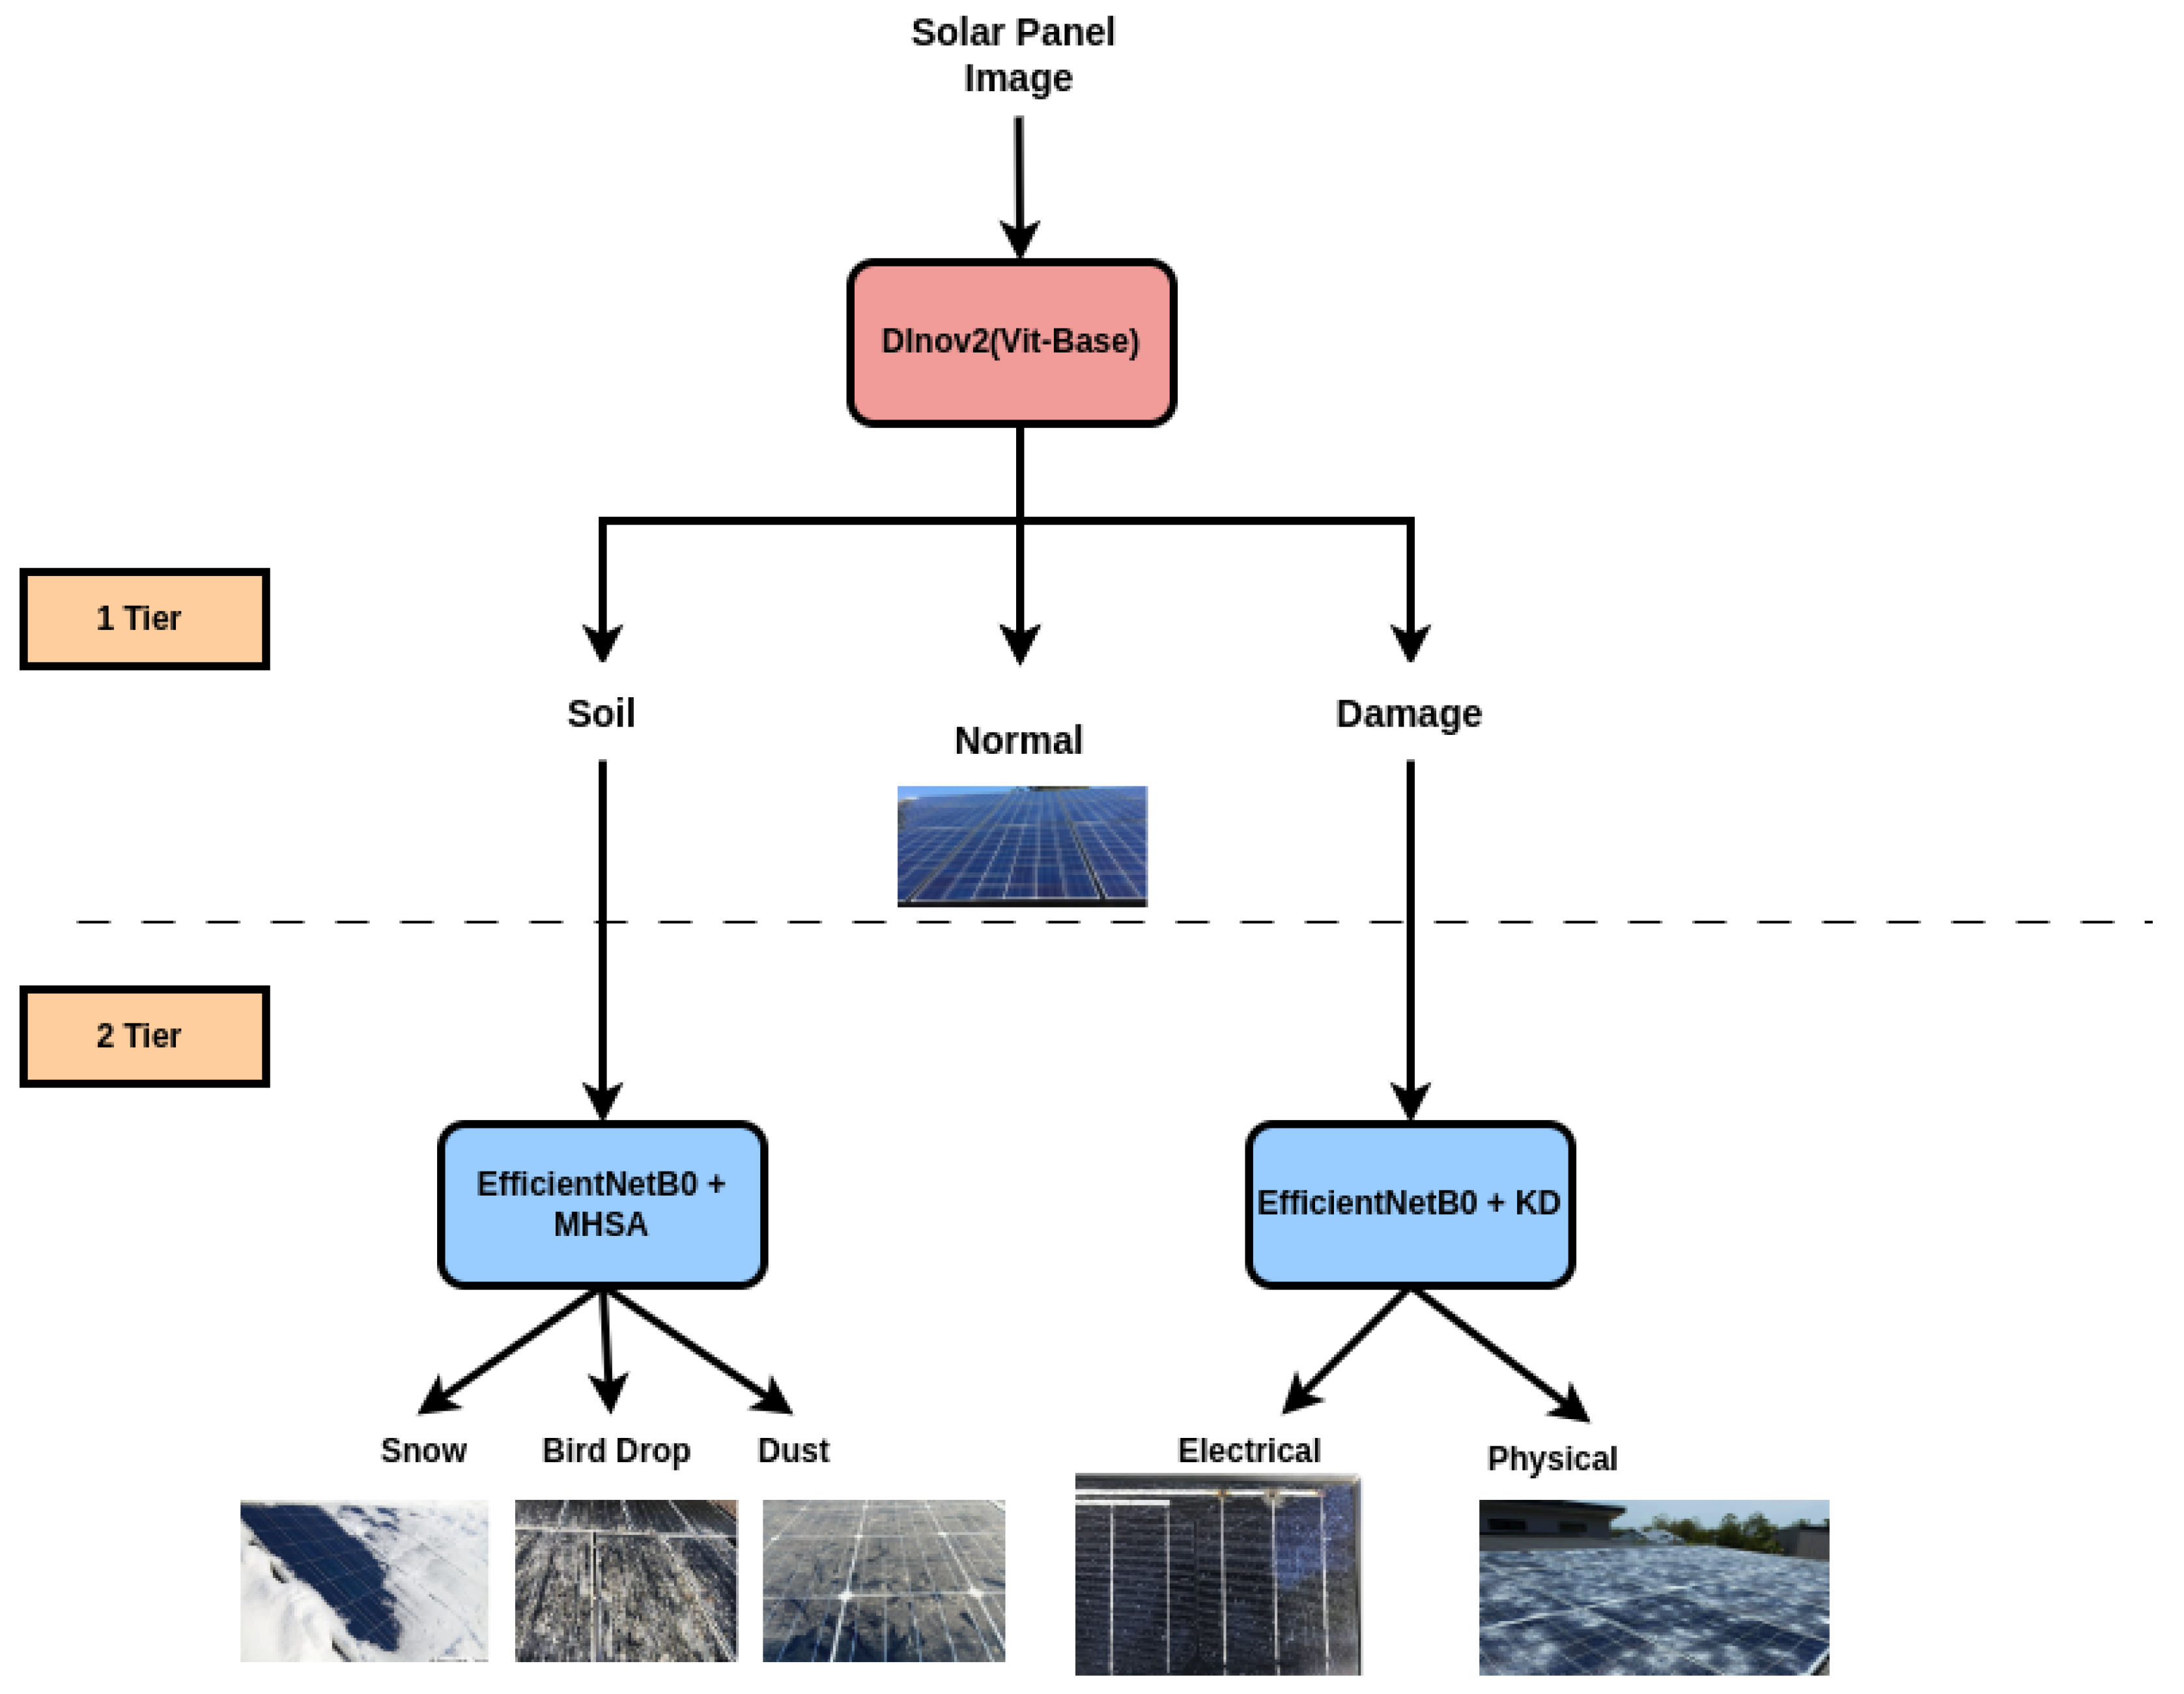
We introduce a novel two-tiered classification framework for monitoring the condition of solar panels, where Tier 1 provides high-level categorization (Normal, Soiled Damaged) using DINOv2 ViT-Base, and Tier 2 performs fine-grained classification with lightweight EfficientNet-based models.
- -
We enhance EfficientNetB0 with two complementary strategies: (i) Multi-Head Self-Attention (MHSA) for capturing global contextual information and (ii) Knowledge Distillation (KD) from a strong DINOv2 ViT-S teacher to improve feature learning in compact models.
- -
We conduct extensive experiments on solar panel datasets under diverse conditions, demonstrating that the proposed models outperform state-of-the-art baselines in terms of accuracy, inference time, and parameter efficiency.
Organization
The remainder of this paper is structured as follows.
Section 2 reviews recent developments in monitoring the condition of solar panels using deep learning, focusing on CNN-based methods, Vision Transformers, and hybrid techniques such as MHSA.
Section 3 presents the background knowledge essential for understanding our approach, including common solar panel defects, drone-based inspection systems, CNN fundamentals, EfficientNet architecture, the DINOv2 model, and knowledge distillation.
Section 4 describes the proposed two-tiered classification framework in detail, outlining the dataset, architectural design, and enhancement strategies that use KD and MHSA.
Section 5 provides comprehensive experimental results that were used to evaluate classification performance, confusion matrices, and inference efficiency across various model configurations.
Section 6 offers a discussion of key findings, error patterns, and the trade-offs between accuracy and model complexity. Finally,
Section 7 concludes the paper and outlines potential future directions, such as integrating object detection, self-supervised learning, and hardware-aware model optimization. The abbreviations used in this paper are summarized in
Table 1.
2. Related Work
This section reviews prior research on solar panel monitoring. It begins with the general problem (
Section 2.1), then follows with a discussion of CNN-based methods (
Section 2.2), Transformer-based approaches (
Section 2.3), and recent work combining MHSA with lightweight CNNs (
Section 2.4). Finally, it summarizes comparative studies and identifies remaining gaps (
Section 2.5).
2.1. Introduction to the General Problem
Solar PV systems are central to sustainable energy infrastructure, making reliable monitoring essential [
12,
13]. Traditional inspection approaches [
14,
15], which primarily rely on manual assessments, face major scalability and efficiency challenges on large-scale solar farms. These methods are often labor-intensive, time-consuming, prone to subjective inconsistencies, and logistically difficult in hazardous or hard-to-reach areas. The inherent limitations of manual inspection create a bottleneck, delaying the identification and rectification of performance-degrading issues.
As a result, AI-based methods have been proposed to automate monitoring. Still, environmental variability (illumination, weather, thin soiling layers, microcracks) makes robust generalization difficult [
16]. The demand for real-time analysis for proactive maintenance [
17] further imposes strict efficiency constraints, especially on edge devices [
18]. These challenges motivate the development of advanced deep learning architectures combined with optimization techniques.
2.2. CNN-Based Methods
CNNs [
19] learn spatial feature hierarchies directly from pixels, which has made them widely used in solar panel monitoring. Architectures such as AlexNet [
20], VGG [
21], ResNet [
22], and EfficientNet [
23] have been applied to classify panels as normal, soiled, or damaged [
24,
25]. CNNs are also used for defect detection with EL imagery [
26] and object-detection tasks with YOLO.
Their main limitation is their reliance on local receptive fields, which restricts modeling of long-range dependencies. Even with deeper networks or larger kernels, global context remains difficult to capture. For analysis of solar panels, this can be problematic when large-scale or distributed anomalies must be recognized.
2.3. Transformer-Based Models
Vision Transformers (ViTs) [
27], inspired by NLP [
28], divide images into patches and use self-attention to capture relationships among all patches. This gives them an inherent global receptive field, often leading to better performance than that obtained with CNNs for tasks requiring a holistic understanding of images.
Self-supervised learning frameworks such as DINO [
29] and DINOv2 [
30] further strengthen ViTs, producing general-purpose features transferable to many tasks. However, their quadratic complexity in relation to patch number leads to high computational and memory costs, limiting deployment on resource-constrained edge devices used for inspection of solar panels. This motivates research into hybrid and optimized models.
2.4. MHSA in Lightweight CNNs
MHSA [
31], originally from Transformers, has been integrated into CNNs [
32] to combine local efficiency with global context modeling. When paired with knowledge distillation (KD), MHSA-augmented CNNs are better able to absorb globally-aware knowledge from ViT teachers. These hybrid CNNs achieve a balance between accuracy and efficiency, making them promising for real-time solar inspection on edge devices.
2.5. Comparative Works
Several works have applied deep learning for solar panel monitoring. CNN-based methods detect defects using IR imagery [
33], classify soiling from optical images [
34], and identify cracks or cell failures [
35,
36]. Object-detection models like YOLO have also been adapted [
37].
However, most approaches focus narrowly on specific defect types or single imaging modalities, limiting generalizability. Few propose integrated frameworks for both broad condition categorization and fine-grained classification. In addition, deployment challenges remain, as lightweight CNNs sacrifice accuracy, while ViTs are too computationally heavy for use on edge devices.
Our work addresses these gaps by proposing a two-tiered classification framework: Tier 1 uses a pre-trained Vision Transformer (DINOv2 ViT-Base) for coarse categorization, and Tier 2 employs an EfficientNetB0 student enhanced with KD and MHSA for fine-grained classification. This design combines strong representation learning with computational efficiency, targeting real-world edge deployment.
3. Background and Preliminaries
This section first identifies common issues like soiling and damage (
Section 3.1) that hinder solar panel performance. It then introduces drone-based inspection and the crucial role of AI (
Section 3.2) for efficient analysis. The section explains the fundamentals of CNNs for visual tasks (
Section 3.3) and presents the efficient EfficientNet architecture (
Section 3.4). Furthermore, it explores DINOv2 for robust self-supervised learning (
Section 3.5) and knowledge distillation for model enhancement (
Section 3.6), laying the groundwork for the proposed methodology for solar panel inspection.
3.1. Common Issues in Solar Panel Performance: Soiling and Damage
While solar PV systems provide a clean and sustainable source of energy, their efficiency can be reduced by two major factors: surface soiling and physical/electrical damage.
Soiling refers to the accumulation of foreign material on PV panels and is a substantial cause of reduced energy yield. A wide array of contaminants, including dust, bird droppings, snow, and industrial pollutants, can deposit on the panel surface and obstruct incident sunlight. The extent of energy loss varies by contaminant type, accumulation duration, and local conditions, ranging from a few percentage points in clean environments to more than 30–50% in polluted or arid regions [
6]. Different contaminants have distinct impacts: dust forms light-scattering layers; bird droppings cause localized hotspots; and snow can completely block sunlight, requiring removal strategies.
In addition to soiling, physical and electrical damage pose serious threats to panel integrity and safety. Physical damage includes micro-cracks, delamination, corrosion, or glass breakage from hail, debris, or thermal stress. Such defects reduce energy generation and may expose internal components to moisture, accelerating degradation and creating safety risks.
Electrical damage, though less visible, is equally critical. It includes hotspots, bypass diode failures, interconnect corrosion, and faulty wiring, which can reduce output and even pose fire hazards.
Figure 2 illustrates examples of the types of soiling and damage that commonly affect solar panels. Addressing these issues through regular inspection and maintenance is crucial to ensure long-term reliability and safety.
3.2. Drone-Based Inspection and the Role of AI
Traditional inspection of large-scale solar PV installations is labor-intensive, slow, and sometimes hazardous, requiring technicians to walk across arrays. Unmanned aerial vehicles (drones) now provide a faster, safer, and more cost-effective alternative. Equipped with RGB and thermal cameras, they can efficiently survey large solar farms. RGB imagery reveals visible surface defects such as cracks, delamination, and soiling, while thermal imaging highlights hotspots from faulty cells, shading, or electrical issues.
While drones streamline data collection, the large volume of imagery requires automated analysis. AI, particularly computer vision, enables automatic detection and classification of soiling and damage, reducing inspection time and enabling proactive maintenance. The integration of drones with AI-powered image analysis thus provides a powerful solution for scalable, efficient solar panel monitoring.
3.3. CNNs in Visual Inspection
CNNs are a cornerstone of modern computer vision that are widely used for classification, detection, and segmentation tasks. Their ability to automatically learn hierarchical spatial features from raw pixel data makes them well-suited for use in visual inspection, including for anomaly and defect detection.
A typical CNN includes convolutional, pooling, and fully connected layers. Convolutional layers learn local features such as edges and textures; pooling layers reduce spatial dimensions and add translational invariance; fully connected layers combine learned features for classification.
CNNs have been successfully applied to diverse domains such as detection of manufacturing defects, medical imaging, and infrastructure monitoring. Their ability to learn discriminative features directly from data removes the need for manual feature engineering. This makes them effective for capturing subtle anomalies that traditional handcrafted methods often miss.
Building on this foundation, CNNs have been widely adopted for inspection of solar PV installations, where they provide the basis for efficient automated monitoring. In this work, we focus on the EfficientNetB0 architecture, which balances accuracy and efficiency for large-scale deployment.
3.4. EfficientNet: Compound Scaling for Efficient and Accurate CNNs
The EfficientNet family, introduced by Tan and Le [
38], is designed to achieve a balance between accuracy and efficiency in vision models. Its key innovation is the compound scaling method, which jointly scales depth, width, and resolution in a balanced way.
The base architecture, EfficientNet-B0, was obtained through neural architecture search with an emphasis on accuracy–efficiency trade-offs. It relies on three main building blocks:
Mobile Inverted Bottleneck Convolutions (MBConv): inverted residuals and linear bottlenecks enable efficient feature extraction [
39].
Depthwise Separable Convolutions: reduce parameters and FLOPs by factorizing convolution into depthwise and pointwise operations.
Squeeze-and-Excitation (SE) units: adaptively re-weight feature channels to emphasize informative ones with minimal extra cost.
Larger EfficientNet variants (B1–B7) are derived from B0 via compound scaling, offering different balances of accuracy and efficiency.
For solar panel inspection, EfficientNet provides flexible options depending on deployment. Smaller models (e.g., B0, B1) are suited for resource-constrained drones or edge devices, while larger ones (e.g., B4–B7) can be used in server settings where accuracy is prioritized. The architectural design of MBConv and SE units supports robust feature learning, making EfficientNet well-suited to capturing subtle soiling patterns and signs of damage while remaining computationally efficient.
3.5. DINOv2: Self-Supervised Learning for Robust Visual Features
DINOv2 [
30] is a state-of-the-art self-supervised framework that learns general-purpose visual features from massive unlabeled image datasets, making them transferable across diverse domains.
The method follows a student–teacher paradigm wherein two identical Vision Transformers process different augmented views of the same image. Unlike in traditional supervised distillation, no human labels are used; instead, the student is trained to match the teacher’s predictions.
Trained on large-scale data with carefully designed strategies, DINOv2 produces semantically rich and robust features that transfer effectively to tasks such as classification, detection, and segmentation.
In the context of solar panel monitoring, DINOv2 provides features that capture both structural patterns and subtle variations linked to soiling or damage, even under changing viewpoints and illumination. This makes it well-suited to serving as the backbone for our Tier-1 classifier. By fine-tuning on a smaller labeled solar dataset, we adapt DINOv2’s generic features to the domain, enabling accurate and efficient analysis.
3.6. Knowledge Distillation for Model Enhancement
Knowledge Distillation (KD) [
40,
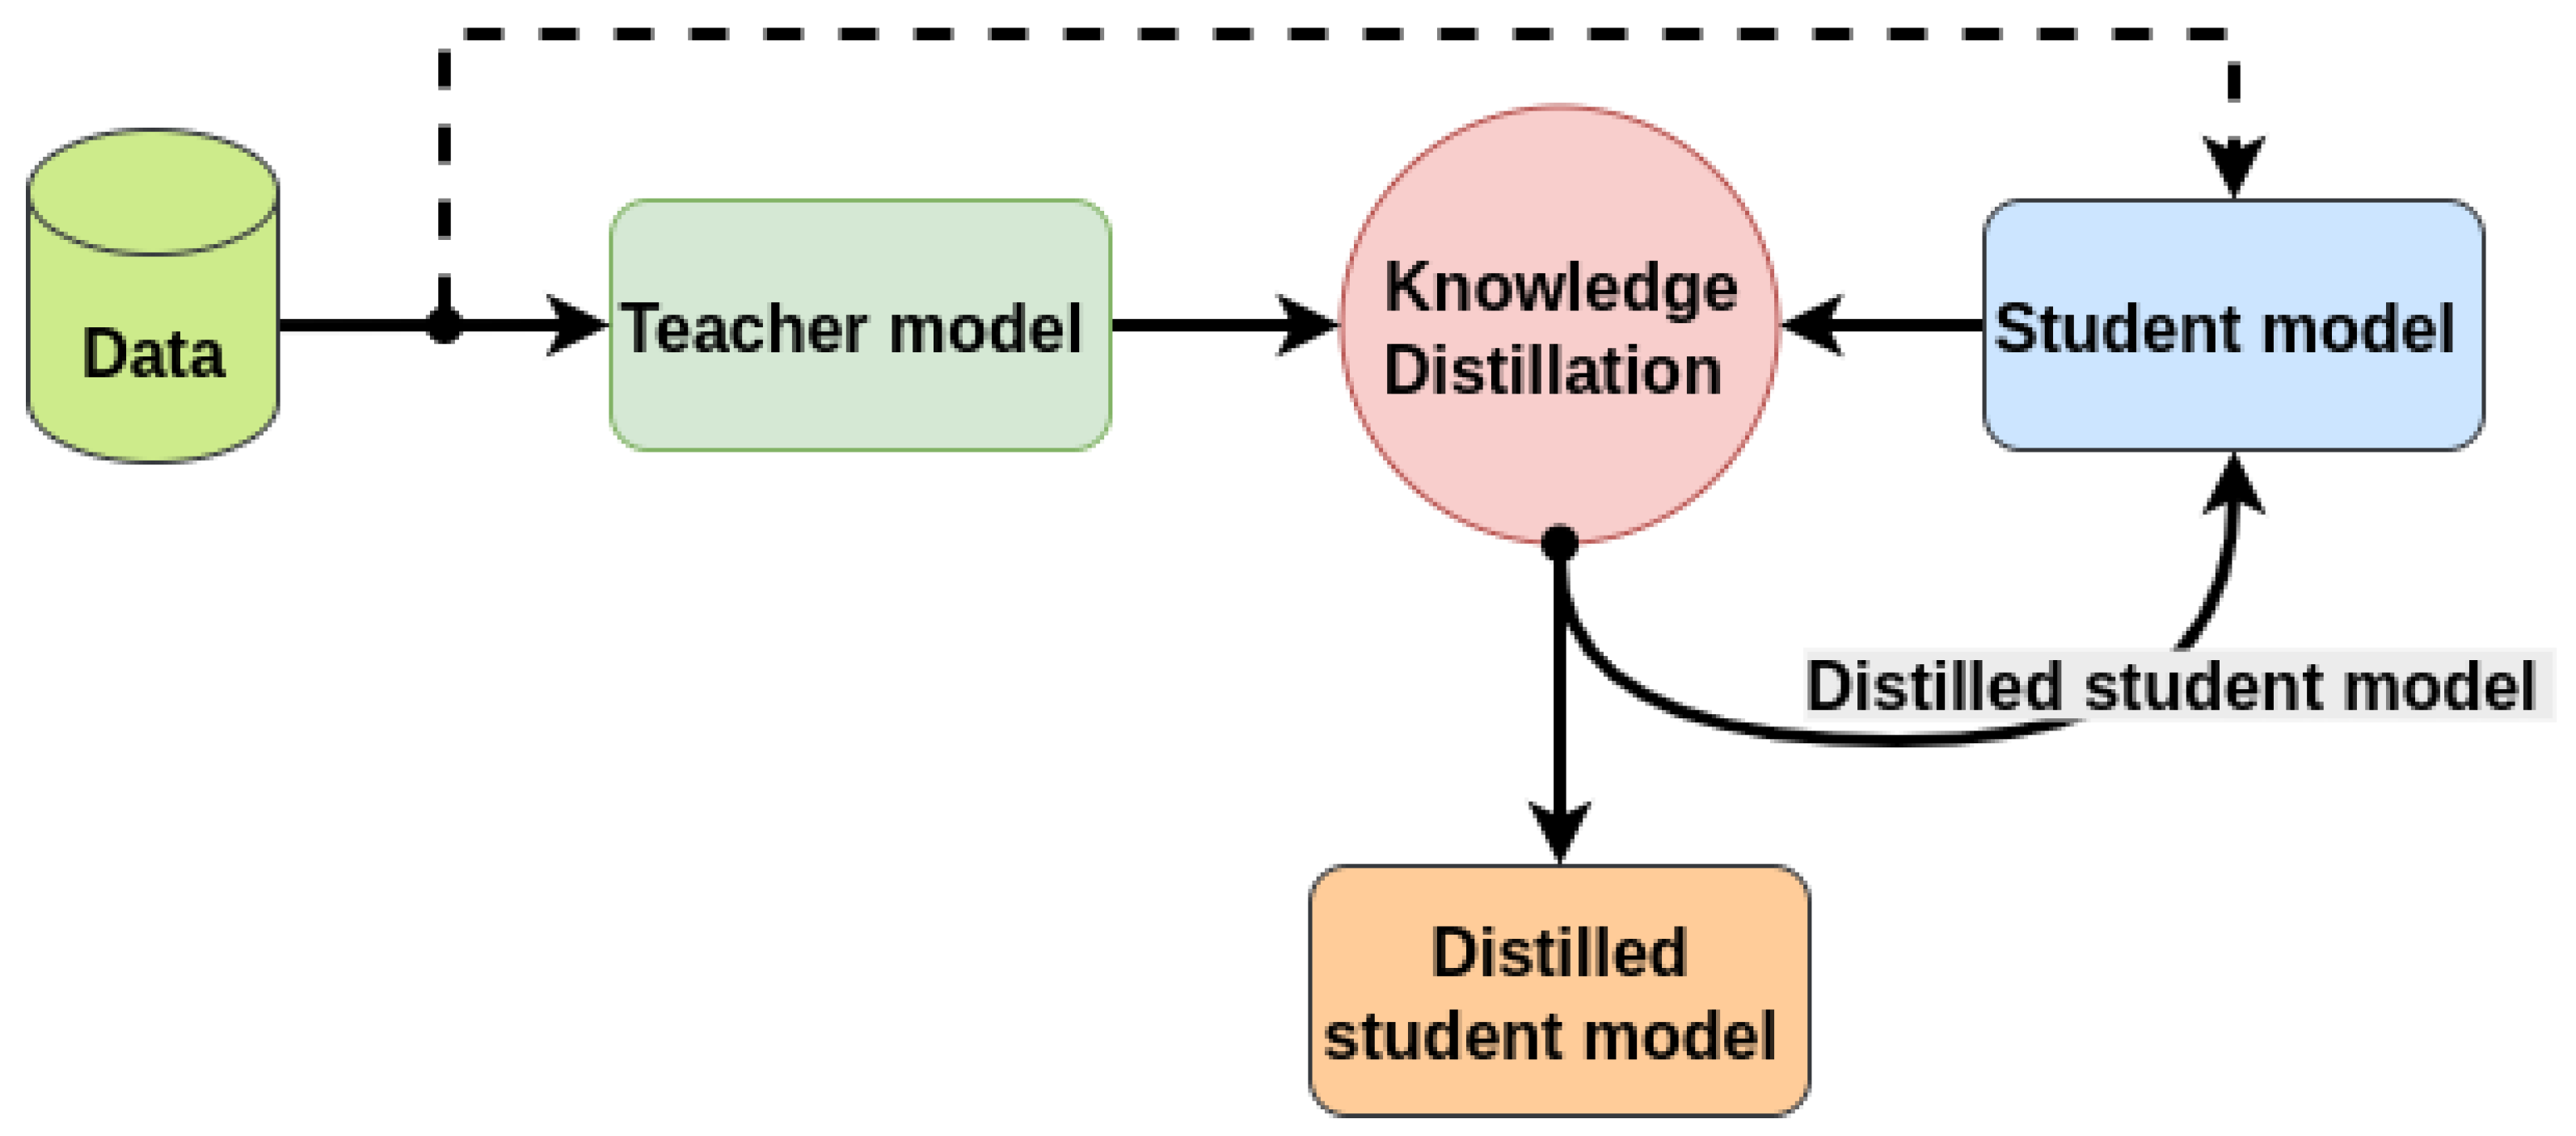
41] transfers the knowledge of a larger teacher model to a smaller student, enabling the latter to achieve competitive accuracy with lower complexity. The student is trained using a weighted combination of the task loss and a distillation loss that aligns its predictions with the teacher’s. Soft probability distributions from the teacher, obtained via temperature-scaled softmax, provide richer information than hard labels would and guide the student toward smoother and more generalizable decision boundaries. This process is illustrated in
Figure 4.
The total loss is calculated as follows:
with
as cross-entropy,
the KL divergence, and
the temperature-scaled softmax.
KD is especially beneficial when the teacher (e.g., DINOv2 ViT) encodes rich, generalizable features that a compact student (e.g., EfficientNetB0) can inherit. This boosts the accuracy of lightweight models while retaining efficiency, making them suitable for edge deployment.
In our framework, Tier-2 employs KD to enhance EfficientNetB0 by transferring knowledge from the DINOv2 teacher, which has been fine-tuned on Tier-1 outputs. This enables the student to perform fine-grained classification of soiling and damage with higher accuracy while remaining computationally efficient.
3.7. Performance Metrics Employed
To comprehensively evaluate the classification performance of the proposed models across both tiers, we employ a set of standard and widely accepted performance metrics. These metrics enable both global and class-wise analysis of the models’ predictive capabilities, as described in
Table 2.
These metrics jointly provide a holistic view of model performance, supporting fair comparisons across models with varying complexity and application constraints.
5. Experimental Results
This section presents a comprehensive evaluation of our two-tiered classification framework designed for solar panel monitoring. The evaluation focuses on the effectiveness of the DINOv2 ViT-Base model in Tier-1 classification and the performance of two enhancement strategies applied to EfficientNetB0 in Tier 2: Knowledge Distillation and MHSA.
5.1. Tier-1 Classification
In the first stage of the proposed framework, the DINOv2 ViT-Base/14 model was fine-tuned to classify solar panel images into three high-level categories: Normal, Damaged, and Soiled. This model, selected for its balance between performance and computational efficiency, outperformed larger transformer variants explored in prior studies. By freezing the backbone and fine-tuning only the classification head, we leveraged robust, self-supervised features while minimizing computational overhead.
A quantitative comparison with six state-of-the-art models is presented in
Table 4 and employs four standard metrics: Accuracy, Precision, Recall, and F1-Score. The DINOv2 ViT-Base achieved an F1-Score of 95.2% and an accuracy of 95.5%, outperforming all other contenders, including ViT-Large and EfficientNetB4.
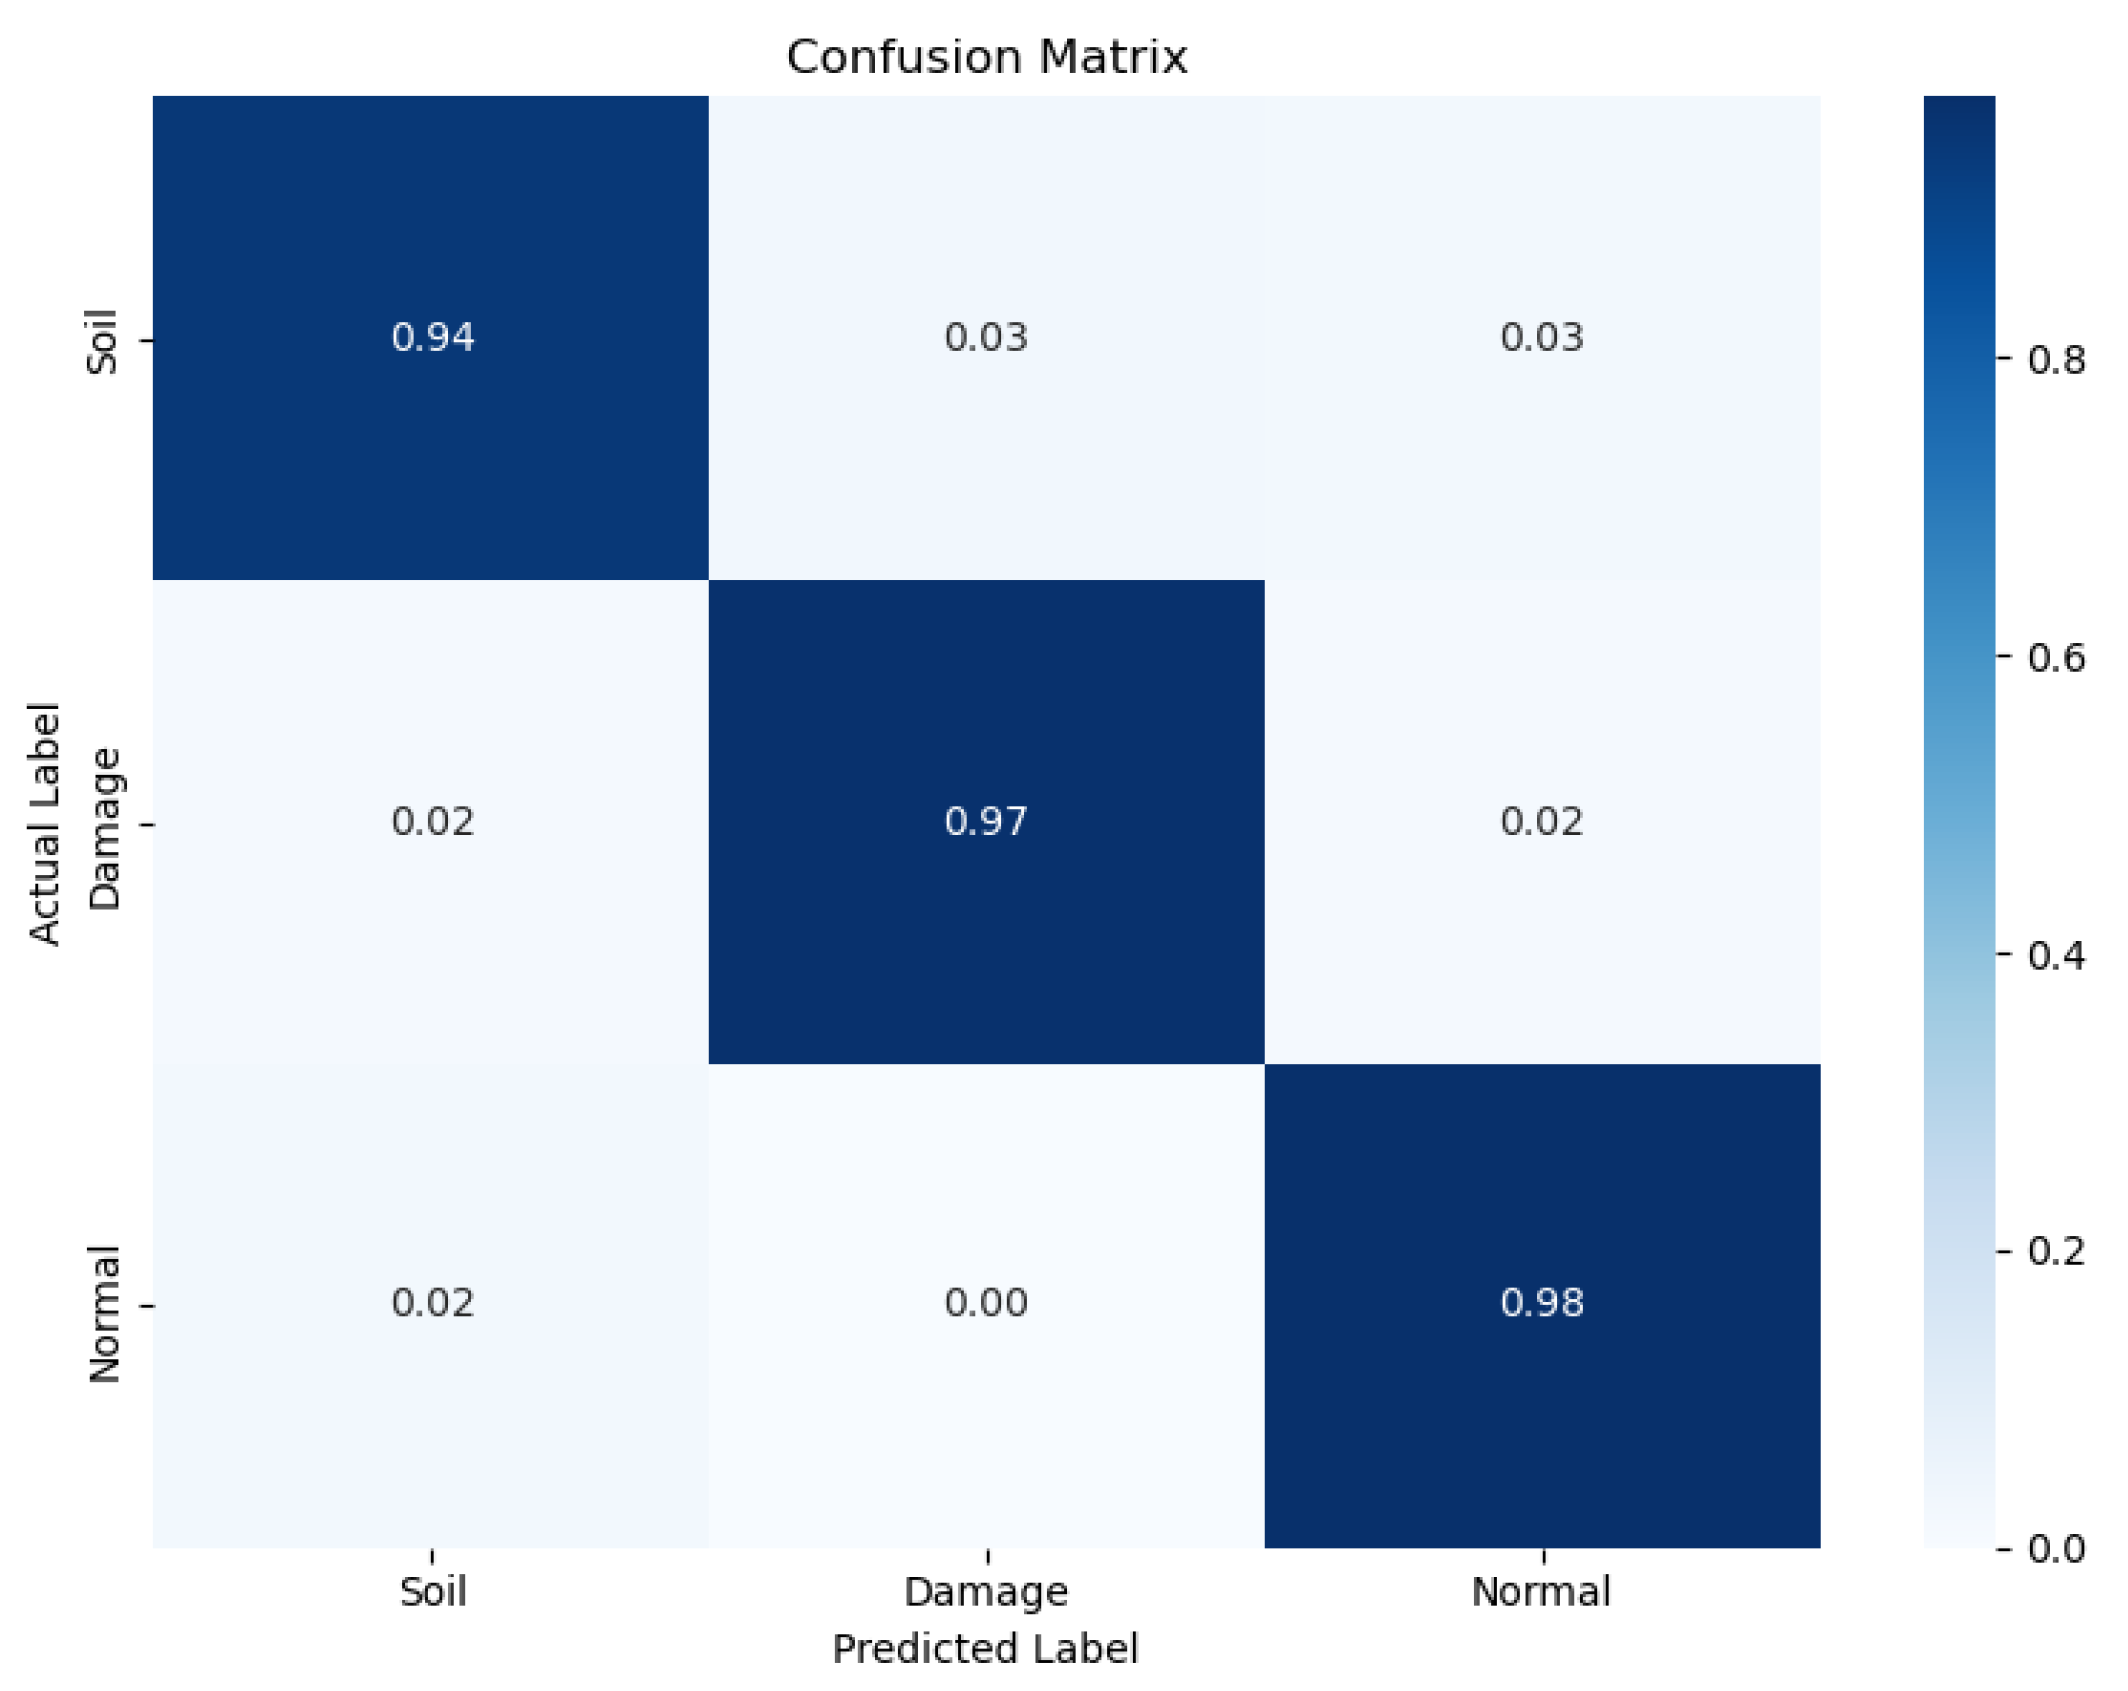
The confusion matrix in
Figure 7 offers further insight into the model’s per-class prediction performance. The model demonstrates a high true-positive rate across all three classes, with minimal misclassification. In particular, the high recall (96.2%) reflects the model’s effectiveness in correctly identifying defective and soiled panels, a critical requirement for minimizing false negatives in maintenance systems for solar panels.
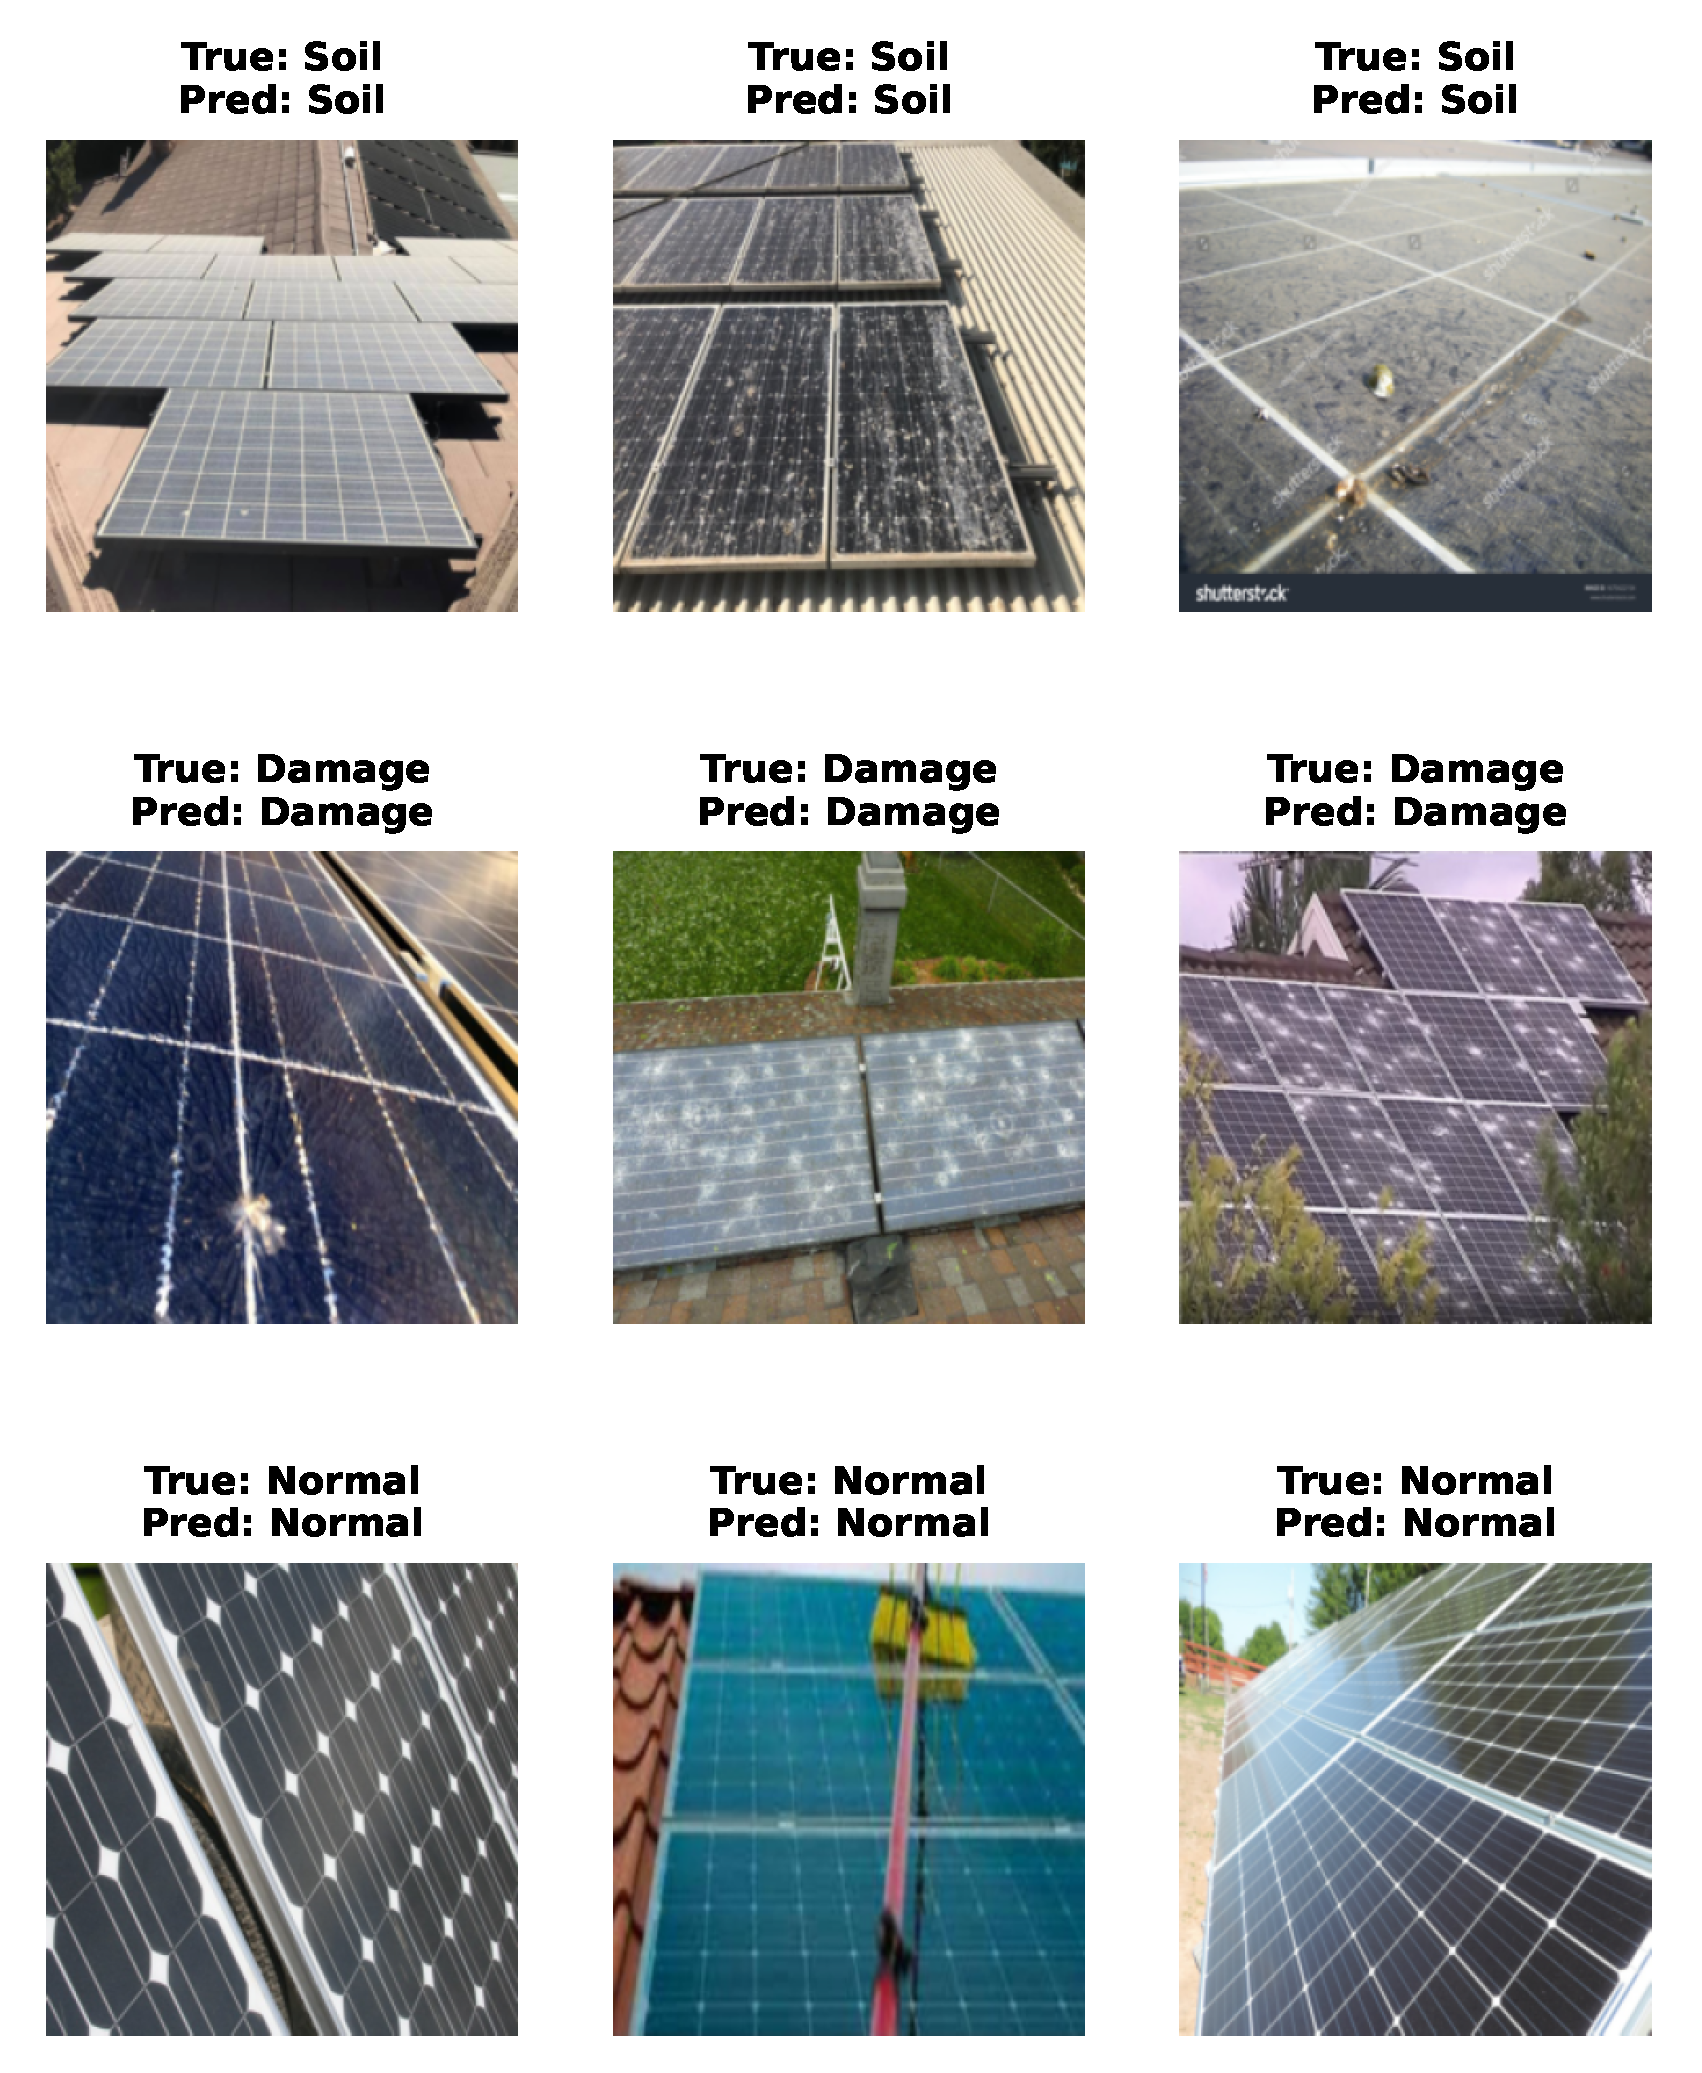
Qualitative results are presented in
Figure 8, showcasing example predictions across diverse panel conditions. These examples highlight the model’s robustness under varied lighting, soiling patterns, and damage manifestations.
Overall, the DINOv2 ViT-Base demonstrates excellent generalization and reliability, establishing a strong foundation for fine-grained classification in Tier 2. Its performance justifies its use over larger models and aligns with the goal of maintaining computational efficiency without compromising accuracy.
5.2. Tier-2 Classification
In this section, we present a fine-grained analysis of classification of solar panel images, focusing on soiling and damage types. Two enhancement strategies, KD and MHSA, are explored in conjunction with lightweight CNN architectures to improve performance while maintaining efficiency.
5.2.1. Performance in Soiling Classification
To assess the effectiveness of our fine-grained soiling-classification module, we evaluated the impact of two enhancement strategies applied to the EfficientNetB0 architecture: KD and MHSA. The goal was to improve recognition of three common soiling types on PV panels: Dust, Bird Droppings, and Snow.
In the KD setup, a DINOv2 ViT-S/14 model served as the teacher, transferring its rich feature representations to the student EfficientNet-based models. In parallel, the MHSA mechanism was introduced to capture global spatial dependencies. The standalone performance of the DINOv2 ViT-S/14 teacher on this task is reported in
Table 5, while
Table 6 presents the comparative evaluation of the enhanced models against several lightweight baselines.
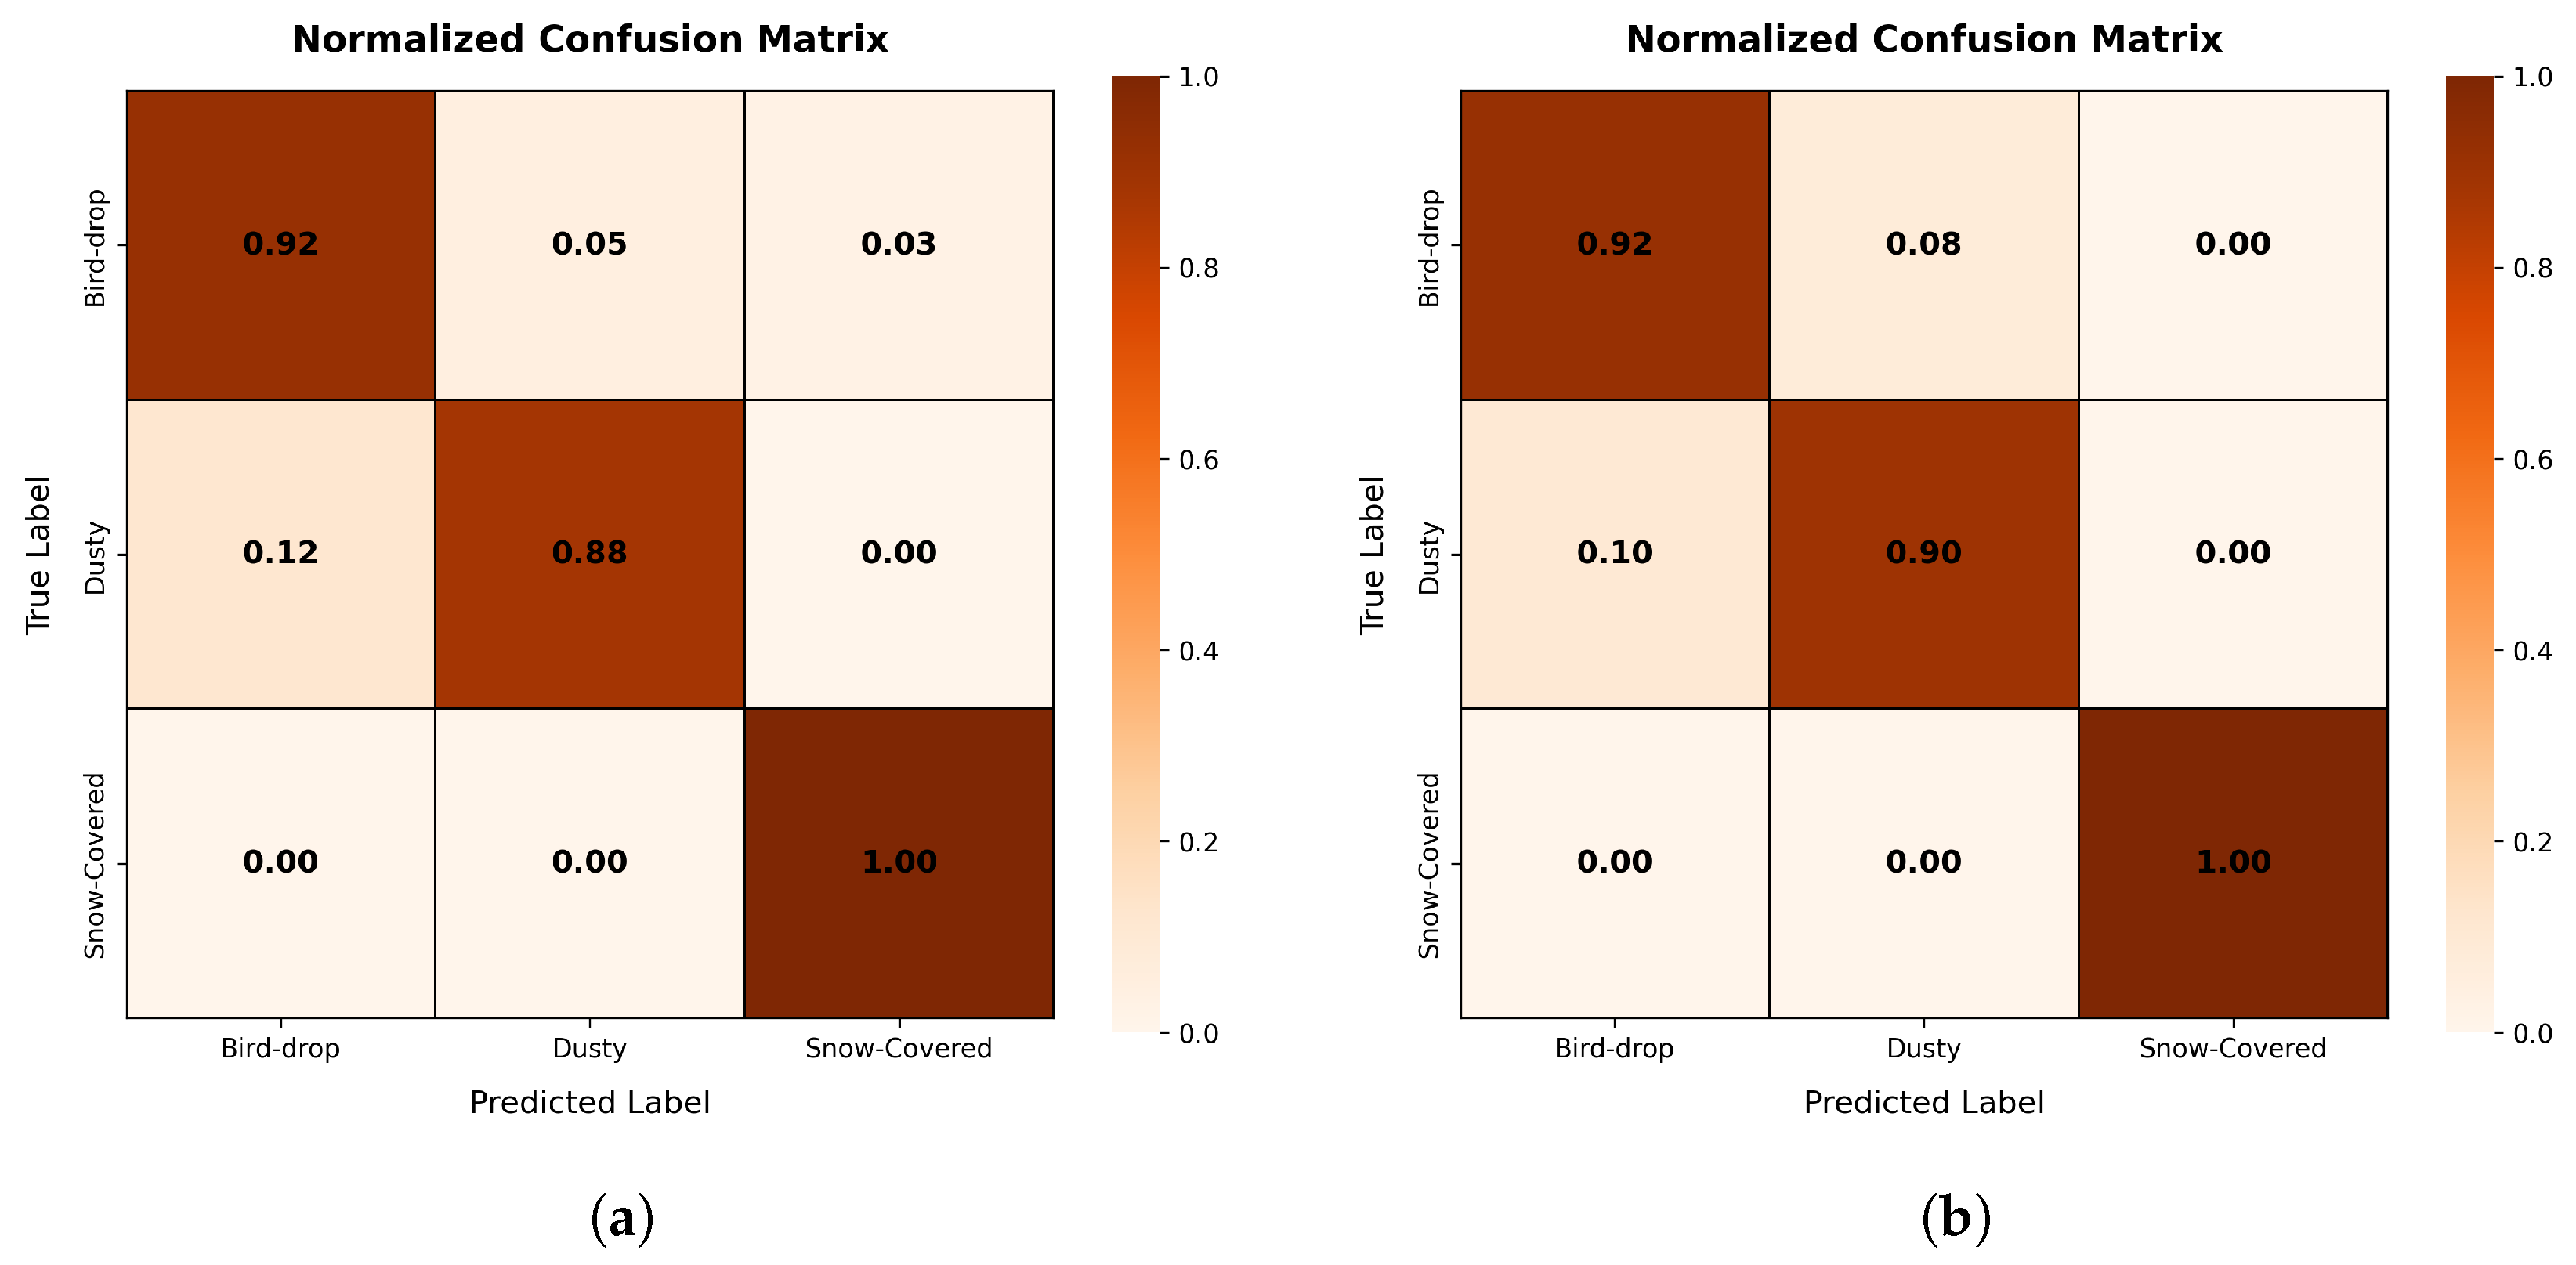
The confusion matrices in
Figure 9 provide a class-wise analysis of the best-performing KD and MHSA models based on EfficientNetB0. Notable findings include:
The KD model shows strong performance for the Bird Droppings class, with a 95.2% true-positive rate and low false-positive rate (4.2%).
The most common error for the KD model involves confusion between Snow and Dust (8.4%).
The MHSA-enhanced model significantly improves Snow detection (TPR: 94.7%) and reduces confusion between Dusty and Snow to 5.1%.
Overall, the MHSA model achieves consistently high true-positive rates across all classes, indicating balanced and robust classification.
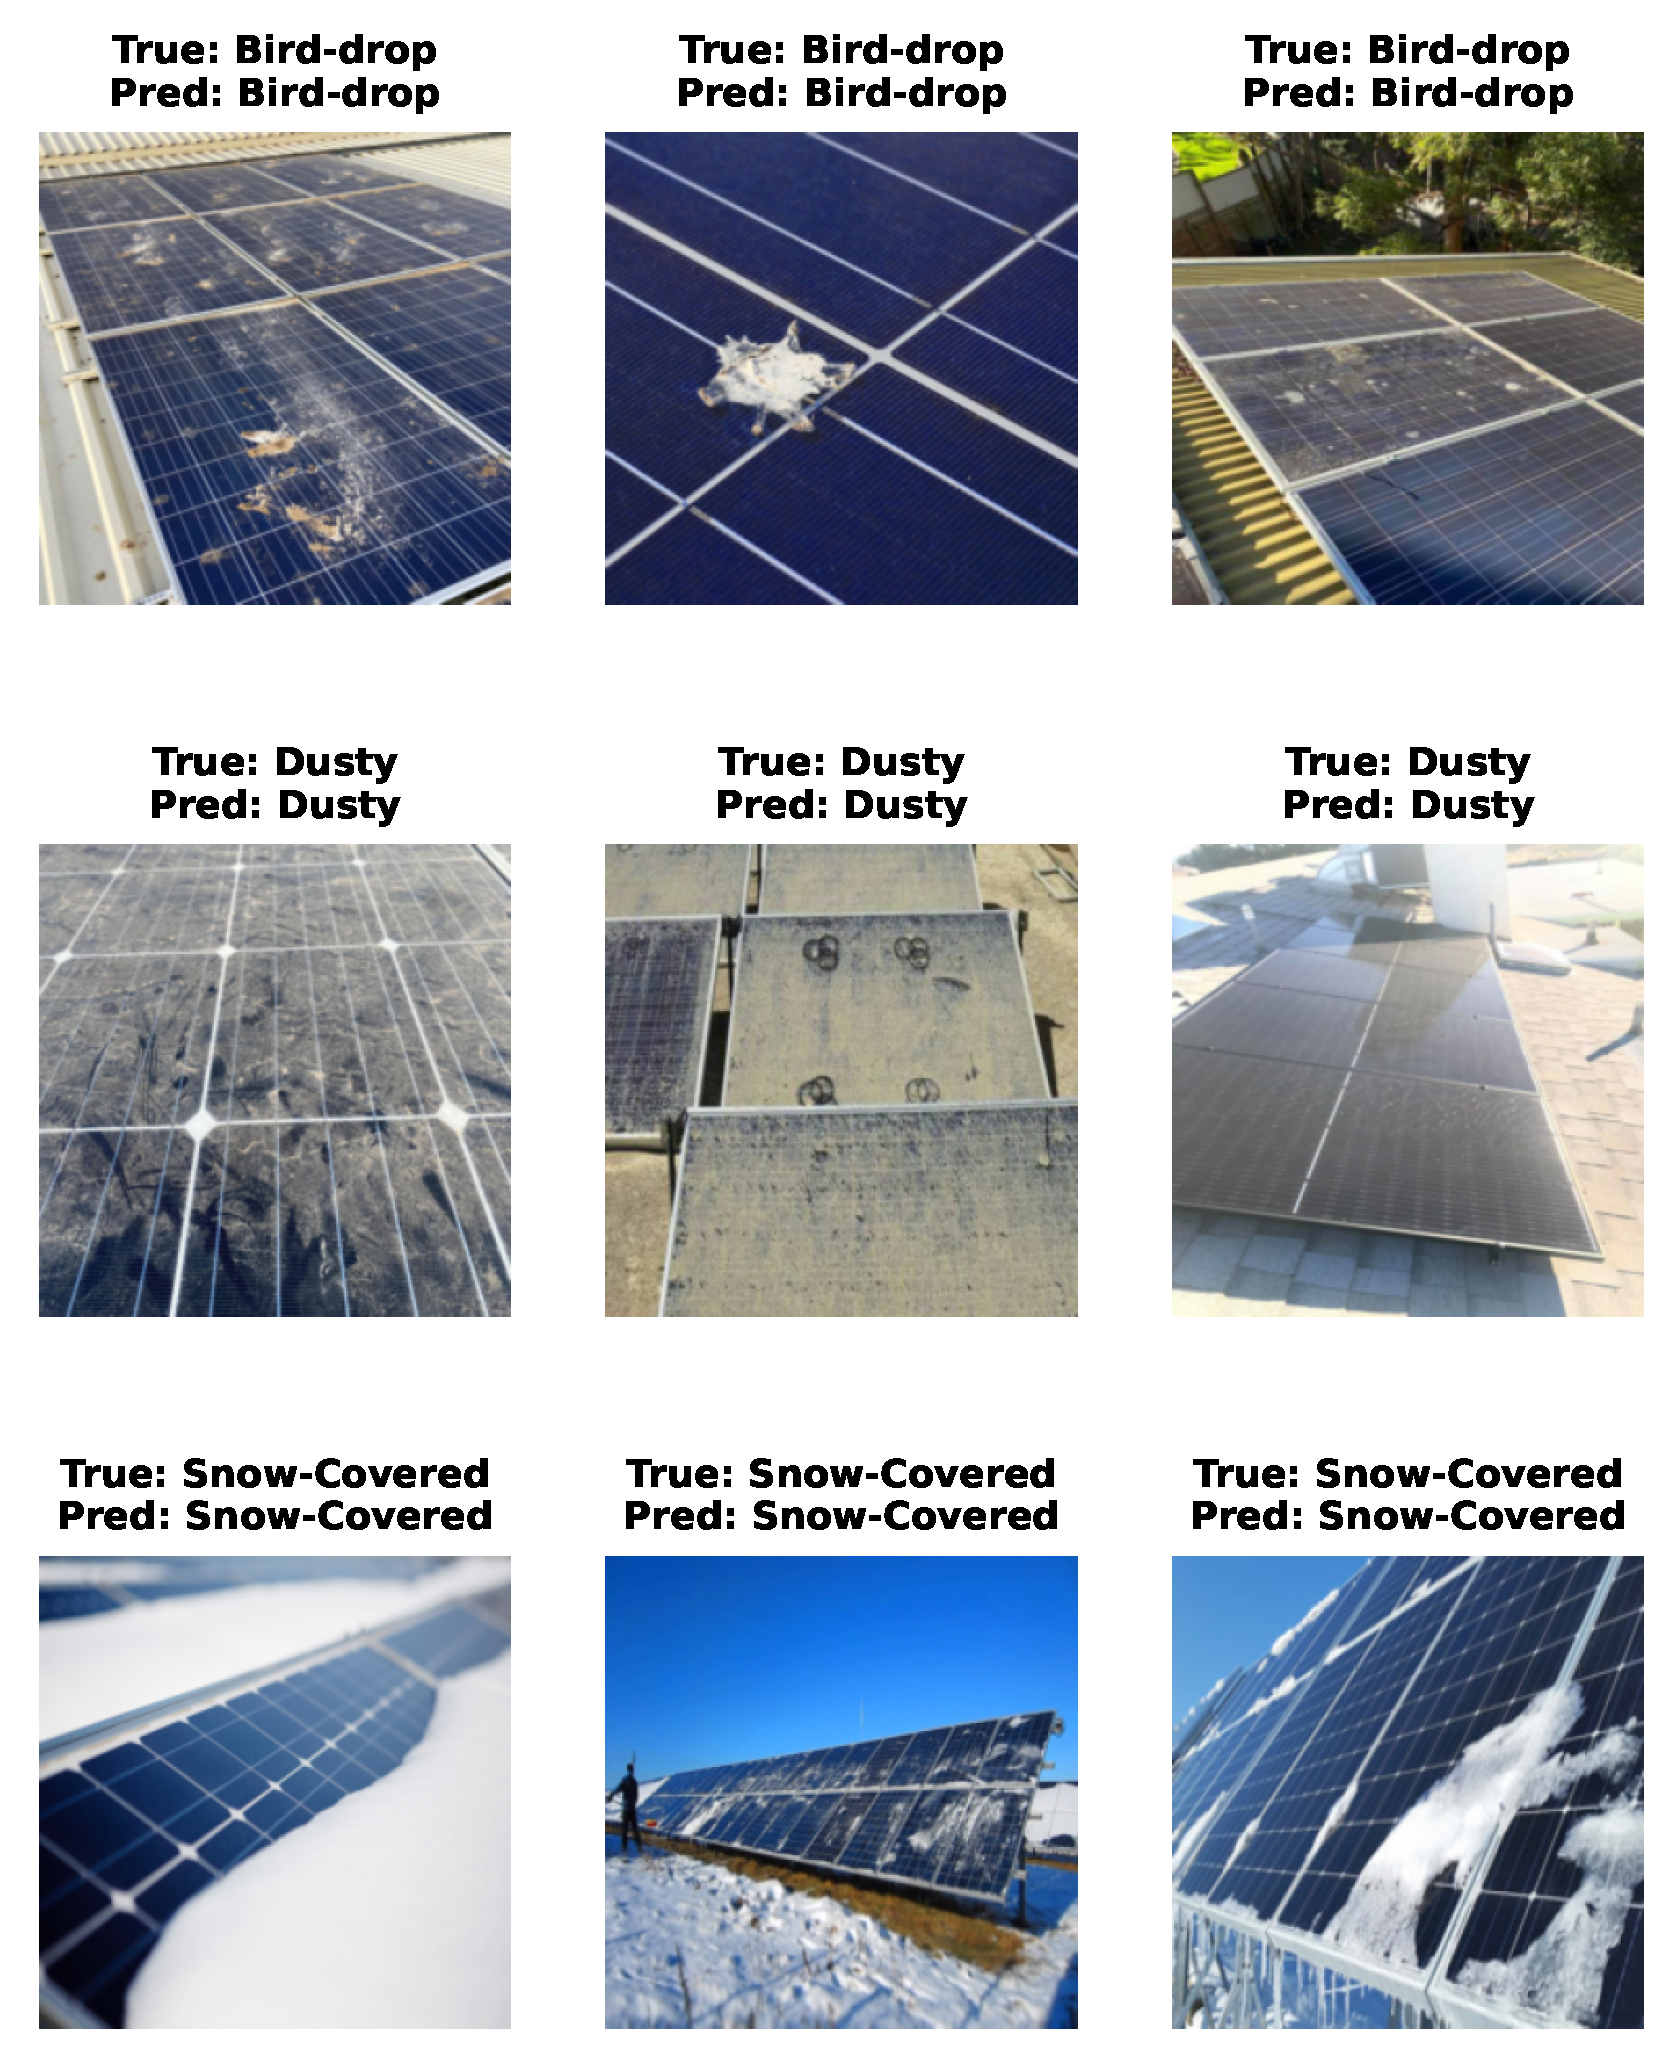
Qualitative examples of soiling predictions are provided in
Figure 10, further illustrating the model’s effectiveness in distinguishing visually similar soiling conditions under varying lighting and occlusion patterns.
5.2.2. Performance in Damage Classification
To evaluate the robustness and generalization of the proposed models on the binary classification task of identifying Electrical versus Physical defects in solar panels, we applied both KD and MHSA techniques. The KD framework leveraged a DINOv2 ViT-S/14 teacher model with 16-head Multi-Head Attention, transferring its strong representational capacity to lightweight student architectures such as EfficientNetB0, B4, and B7. In parallel, we evaluated the performance gains achieved by incorporating MHSA alone into these student models.
The standalone performance of the teacher model is summarized in
Table 7, which shows perfect classification metrics across all evaluated indicators.
The results comparing KD-enhanced and MHSA-based models against baseline architectures are presented in
Table 8, highlighting improvements in both accuracy and inference efficiency.
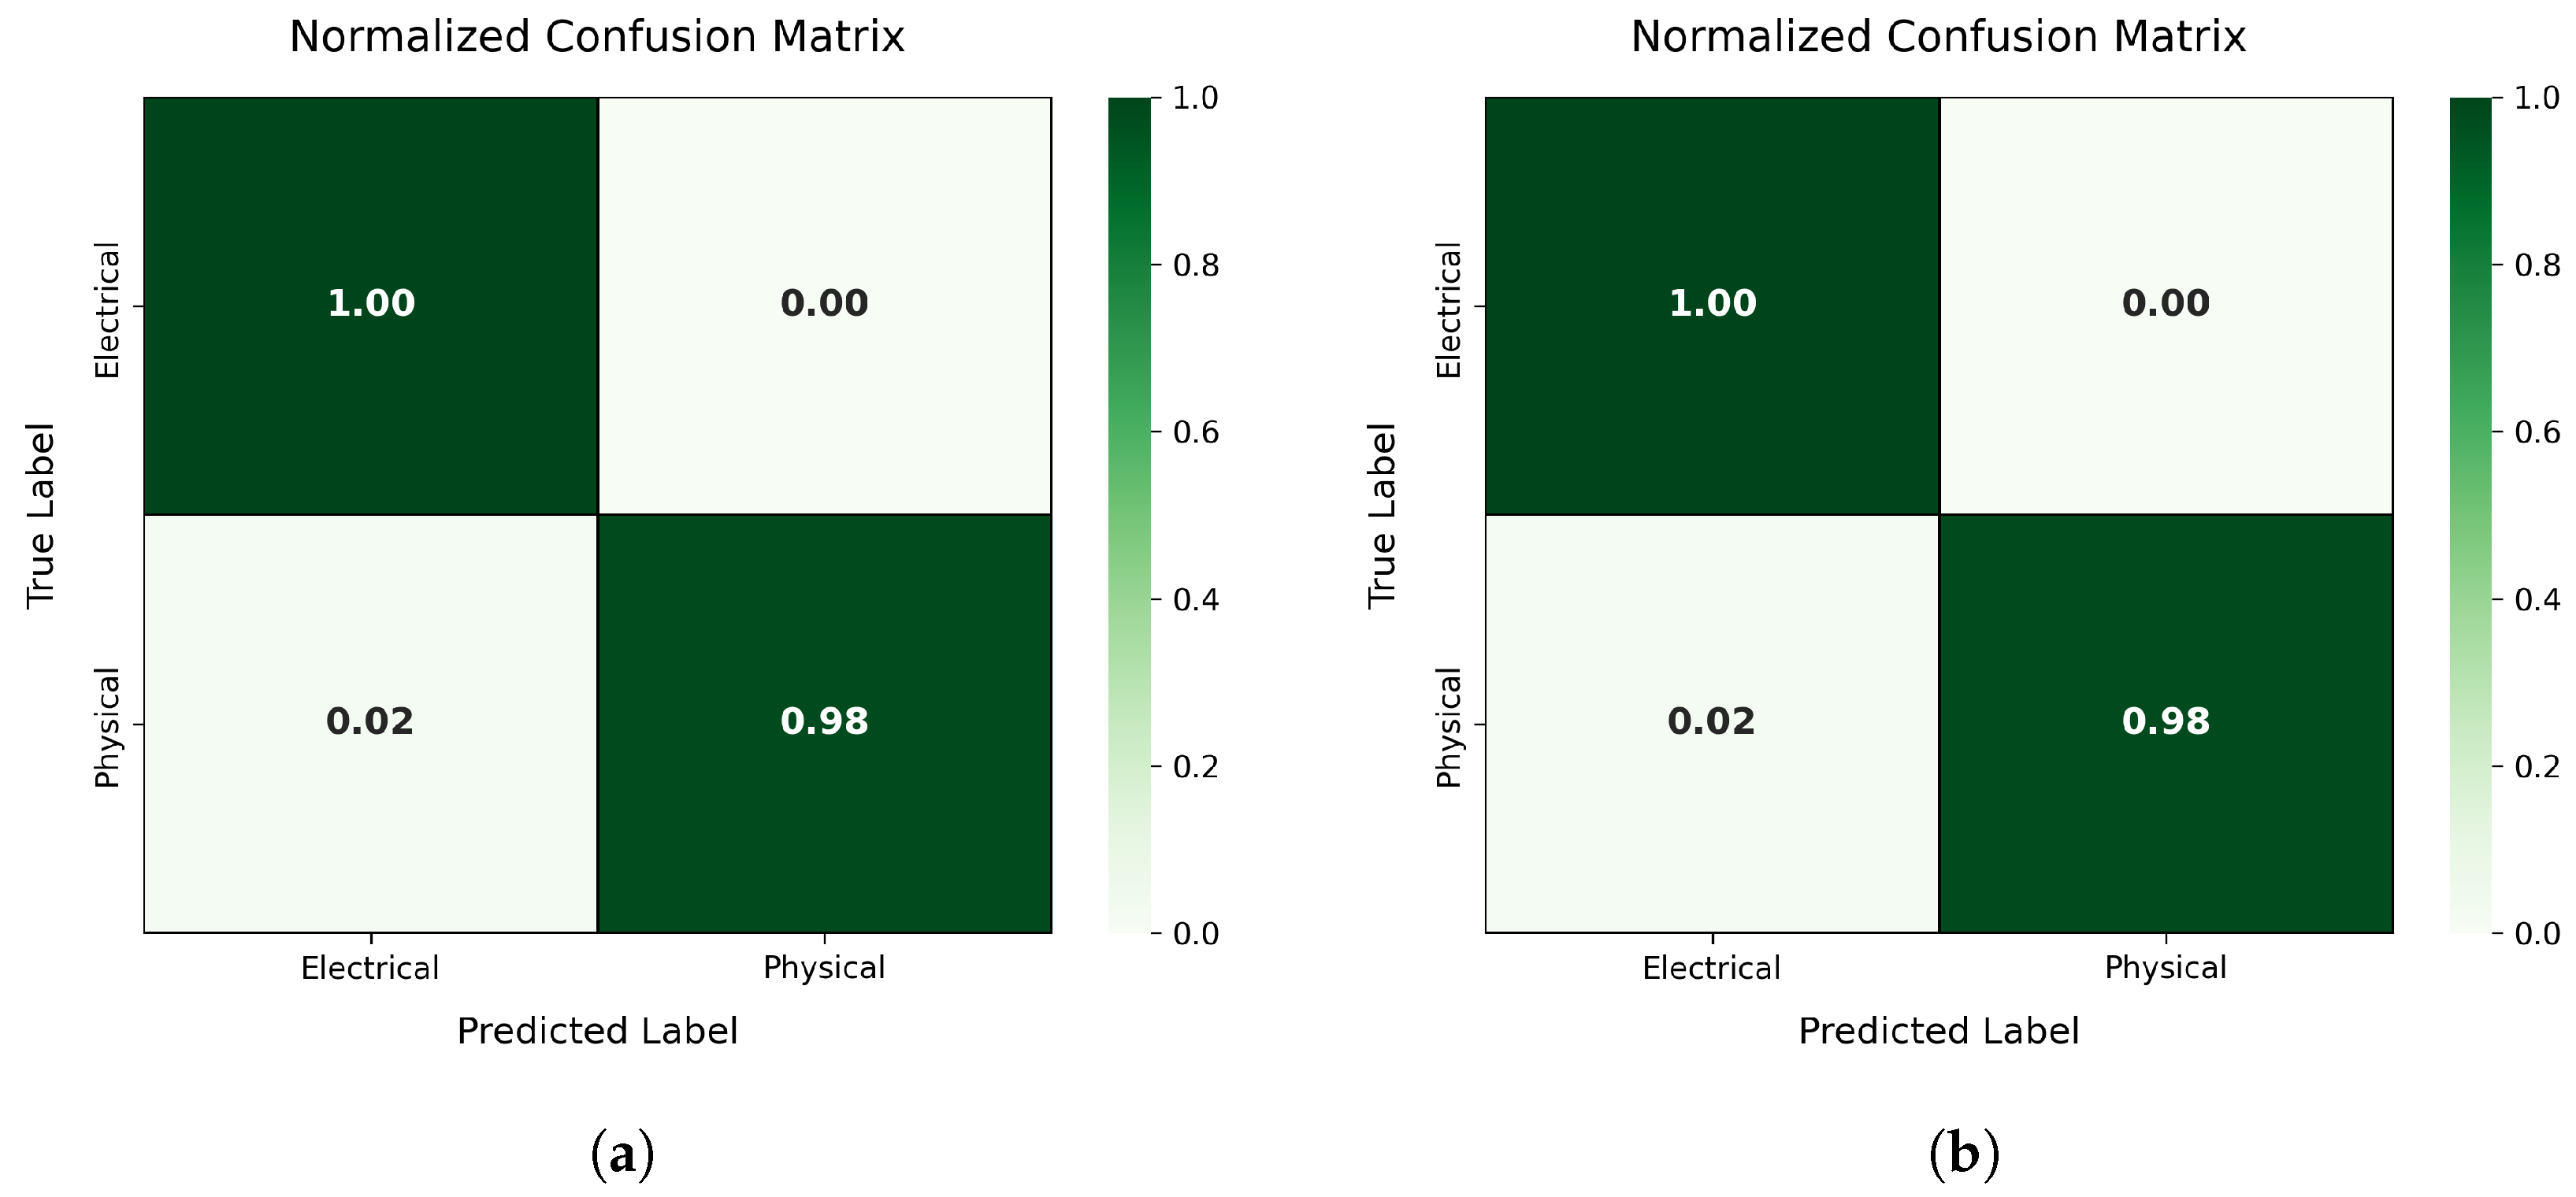
To support a better understanding of class-wise performance, normalized confusion matrices for the top KD and MHSA models are presented in
Figure 11. These visualizations highlight key improvements in both recall and precision for the Electrical and Physical damage classes.
Key observations include the following:
The KD model based on EfficientNetB7 achieves a recall of 99.0% for Electrical damage and a low false-positive rate (1.8%) for Physical damage, improving over the EfficientNetB0 baseline.
The MHSA model based on EfficientNetB4 achieves a near-perfect recall of 99.1% for both classes and reduces the confusion between classes to below 1%.
Both models significantly outperform the baseline EfficientNetB0 in terms of both precision and recall while maintaining efficient inference times.
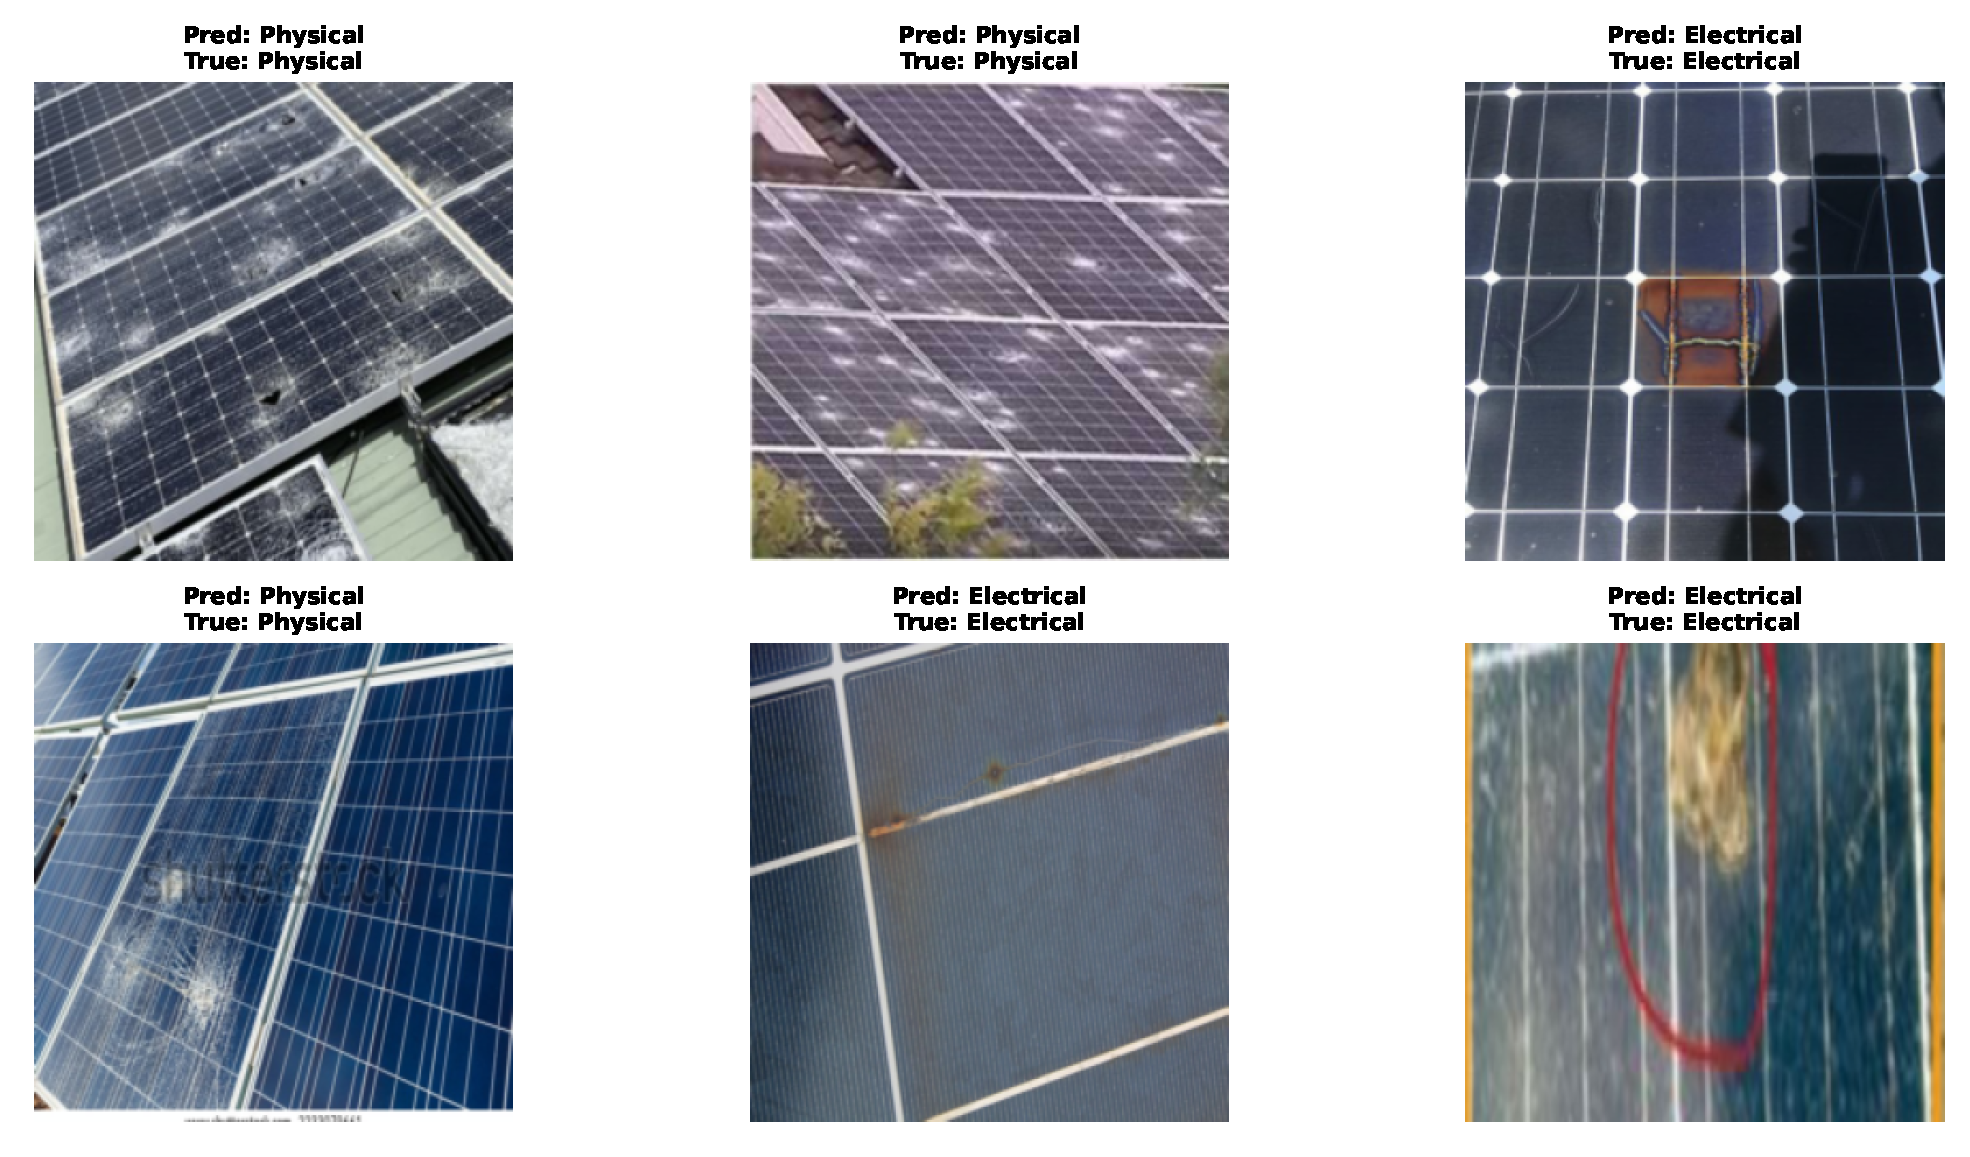
Qualitative examples of predictions across both damage categories are shown in
Figure 12, illustrating the models’ ability to generalize to unseen samples.
5.3. Model Efficiency Analysis
In this section, we analyze the efficiency of the proposed KD and MHSA models in terms of parameter count, classification error patterns, and performance improvements. These results are compared with the EfficientNetB0 baseline to examine differences in model complexity and predictive accuracy.
Parameter Efficiency:
- -
The KD model exhibits a streamlined architecture with 4.66 million parameters, which is notably close to the EfficientNetB0 baseline (5.3M,
Table 6).
- -
MHSA-enhanced models introduce a moderate increase in model complexity, ranging from 6.01M to 7.26M parameters. This increase is justified by consistent performance gains (as evidenced in
Table 6 and
Table 8).
- -
Specifically for soiling classification, the KD model achieves superior accuracy and a higher F1-Score with parameter counts comparable to the baseline, highlighting efficient representational learning. MHSA models, though slightly larger, deliver further accuracy improvements at modest computational cost.
Error Patterns:
- -
For soiling classification, both the KD and MHSA models exhibit residual confusion between the Snow and Dust categories, which appears to be a persistent challenge due to their visual similarity. While baseline errors are not visualized, the KD and MHSA models substantially mitigate misclassification rates.
- -
In damage classification, the confusion matrices in
Figure 11 demonstrate low false-positive and false-negative rates, where panel (a) corresponds to KD and panel (b) to MHSA. This represents a notable improvement over the baseline model, whose error rates are reported in
Table 8.
Performance Gains:
- -
As detailed in
Table 6, the KD model yields an accuracy gain of +1.68% and an F1-score improvement of +1.75% for soiling classification relative to the EfficientNetB0 baseline. MHSA integration further increases accuracy by +2.63% and the F1-score by +2.87%.
- -
In damage classification (
Table 8), the KD model outperforms the baseline by +1.97% in accuracy and +1.76% in F1-score. Similarly, the MHSA-enhanced variant shows an accuracy gain of +2.03% and an F1-score improvement of +2.21%.
6. Discussion
The experimental results across both classification tiers demonstrate the effectiveness of combining advanced transformer architectures with model efficiency techniques for the detection of solar panel defects. In Tier 1, the fine-tuned DINOv2 ViT-Base model substantially outperformed conventional architectures, achieving an F1-score of 95.2% with only 86M parameters; this result highlights its suitability for general triage tasks in field deployments. The confusion matrix revealed high sensitivity across all three classes (Normal, Damaged, and Soiled), supporting its robustness in real-world scenarios.
In Tier 2, the application of KD and MHSA demonstrated tangible benefits across both soiling and damage classification subtasks. The KD-based EfficientNetB0 model achieved a notable accuracy improvement of +1.68% and F1-score gain of +1.75% for soiling classification, despite maintaining a parameter count similar to the baseline. The MHSA-enhanced variant further improved performance with marginal increases in complexity.
For damage classification, MHSA yielded the highest accuracy (99.2%) and F1-score (99.0%) among all Tier 2 models, highlighting its strength in capturing complex inter-class relationships. Confusion matrix analysis confirmed reduced misclassification rates for both Electrical and Physical defect classes, indicating improved class separability.
Efficiency analysis revealed that performance gains were achieved without incurring excessive computational costs. All enhanced models remained within a practical range of parameter counts and inference latency, making them viable for deployment on edge devices in inspection systems for photovoltaic installations.
Overall, the results validate the proposed two-tiered framework as a balanced solution for accurate and efficient defect detection. While DINOv2 serves as a strong base classifier, its distilled knowledge and attention mechanisms can be effectively transferred to lightweight student models, enabling real-time, high-accuracy predictions in constrained environments.
7. Conclusions
This paper presented a two-tiered deep learning framework for efficient and accurate classification of solar panel defects, leveraging a combination of Vision Transformers, Knowledge Distillation, and Multi-Head Self-Attention. In the first tier, a fine-tuned DINOv2 ViT-Base model provided high-performance triage of solar panel images into general categories (Normal, Damaged, and Soiled). The second tier incorporated KD and MHSA techniques to refine classification across six specialized defect classes, achieving state-of-the-art performance while preserving computational efficiency.
Experimental evaluations across multiple CNN and transformer-based baselines demonstrated that the proposed models outperform existing architectures in terms of accuracy, precision, recall, and F1-score. Notably, KD-based EfficientNetB0 and MHSA-enhanced variants consistently surpassed the performance of their non-enhanced counterparts, validating the effectiveness of knowledge transfer and attention mechanisms in improving class discrimination.
Furthermore, the proposed models maintain low parameter counts and fast inference times, making them well-suited for deployment in edge-based photovoltaic monitoring systems. The confusion matrix analysis confirmed the models’ ability to generalize well across visually similar defect types; they show a reduced tendency towards the common misclassification trends observed in baseline models.
In future work, this two-tiered framework can be extended with real-time object detection for localized defect identification and adapted to other renewable infrastructure domains such as wind turbines. Additionally, integrating self-supervised learning and hardware-aware optimization (e.g., quantization, pruning) will further enhance its deployment readiness for resource-constrained environments.
