Article

Active Queue Management in L4S with Asynchronous Advantage Actor-Critic: A FreeBSD Networking Stack Perspective

IoT & Software Engineering Research Lab, School of Information Technology, Deakin University, Geelong, VIC 3220, Australia
*
Author to whom correspondence should be addressed.
Future Internet 2024, 16(8), 265; https://doi.org/10.3390/fi16080265
Submission received: 12 June 2024 / Revised: 18 July 2024 / Accepted: 23 July 2024 / Published: 25 July 2024

Abstract

:
Bufferbloat is one of the leading causes of high data transmission latency and jitter on the Internet, which severely impacts the performance of low-latency interactive applications such as online streaming, cloud-based gaming/applications, Internet of Things (IoT) applications, voice over IP (VoIP), real-time video conferencing, and so forth. There is currently a pressing need for developing Transmission Control Protocol (TCP) congestion control algorithms and bottleneck queue management schemes that can collaboratively control/reduce end-to-end latency, thus ensuring optimal quality of service (QoS) and quality of experience (QoE) for users. This paper introduces a novel solution by experimentally integrate the low latency, low loss, and scalable throughput (L4S) architecture (specified by the IETF in RFC 9330) in FreeBSD framework with the asynchronous advantage actor-critic (A3C) reinforcement learning algorithm. The first phase involves incorporating a modified dual-queue coupled active queue management (AQM) system for L4S into the FreeBSD networking stack, enhancing queue management and mitigating latency and packet loss. The second phase employs A3C to adjust and fine-tune the system performance dynamically. Finally, we evaluate the proposed solution’s effectiveness through comprehensive experiments, comparing it with traditional AQM-based systems. This paper contributes to the advancement of machine learning (ML) for transport protocol research in the field. The experimental implementation and results presented in this paper are made available through our GitHub repositories.

1. Introduction

Network routers use buffers to improve routing performance and overall throughput by absorbing sudden bursts of packets and minimizing packet loss, ultimately boosting network efficiency. However, the trend of using large buffers due to more affordable memory has led to “bufferbloat”, particularly when dealing with congestion [1].
In response, researchers have turned to active queue management (AQM) techniques to manage buffers in routers. These AQM algorithms control queue length by selectively dropping or marking packets when the buffer becomes full or the queue delay exceeds a certain threshold. An early implementation of this was the random early detection (RED) algorithm [2], which utilized queue length to predict congestion. However, configuring these types of AQMs can be challenging, and they may not perform well in certain scenarios.
Modern AQMs like controlled delay (CoDel) and proportional integral controller enhanced (PIE) have been developed to address these challenges. These algorithms utilize queue delay rather than queue length to detect congestion. These AQMs aim to maintain low latency even under a high network load by focusing on delay.
The next advancement in AQMs involved developing hybrid schemes such as flow queue CoDel (FQ-CoDel) and flow queue proportional integral controller enhanced (FQ-PIE), which combined the merits of CoDel and PIE with a modified deficit round robin (DDR) scheduler.
In FQ-CoDel, flows are assigned to a pool of internal queues, each managed independently by an instance of CoDel for buffer management. The DDR scheduler shares the outbound link capacity among the active queues, ensuring a fair allocation of resources. Likewise, the hybrid strategy “FQ-PIE” amalgamates the FlowQueuing aspect of FQ-CoDel with the PIE queue management. Both algorithms have shown exemplary capacity sharing between competing flows while achieving high throughput and low queuing delay.
Despite their efficacy in throughput and queuing delay reduction, these delay-based algorithms are insufficient for the growing demand for low-latency and low-loss data transmission required for applications such as online gaming, high bitrate streaming, video conferencing, virtual reality, and cloud-based processing for real-time IoT applications [3,4]. Presently, employing classic congestion control alongside cutting-edge active queue management (AQM) strategies such as FQ-CoDel [5], PIE [6], or DOCSIS PIE [7] yields an average latency ranging from 5 to 20 ms. Nevertheless, even with these advancements, latency at the 99th percentile hovers around 20 to 30 ms, falling short of the stringent latency requirements of contemporary applications. This research explores avenues for enhancing latency performance in data transmission systems, catering to the evolving needs of modern digital environments.
Low latency, low loss, and scalable throughput (L4S) represent a novel architecture paradigm based on the insight that the root cause of queuing delay lies in the capacity-seeking congestion mechanisms of senders rather than inherent issues within the queuing system itself. This architectural innovation is primarily facilitated towards incremental deployment, ensuring compatibility with the existing network infrastructures. Central to its design is introducing a mechanism enabling the integration of a new class of congestion controls and queue management within the L4S framework. This mechanism employs a modified explicit congestion notification (ECN) variant, facilitating their coexistence alongside ’Classic’ congestion controls within shared network environments. The overarching objective of L4S is to achieve superior latency and throughput while maintaining a low loss rate compared to the traditional network infrastructure.
CoDel, PIE, FQ-CoDel, and FQ-PIE are effective in reducing “bufferbloat” and managing congestion in general scenarios. However, L4S goes a step further by explicitly prioritizing latency-sensitive traffic, catering particularly well to applications that demand immediate responsiveness, such as online gaming, video conferencing, and interactive multimedia streaming. By implementing L4S in FreeBSD, the project aims to optimize the network stack for delay-sensitive applications, providing a smoother and more reliable user experience.
In this paper, we pioneer a new hybrid framework that can combine asynchronous gradient descent optimization for deep neural network controllers (e.g., A3C) with the L4S architecture to optimize buffer management for latency-sensitive real-time applications. It employs neural networks to learn and optimize system policies based on the environment’s feedback, allowing it to recognize network congestion preemptively and prepare responses appropriately depending on the severity of congestion. Traditional algorithms have significant delays in responding to network congestion due to their simplistic nature in responding to sudden bursts of packets in the network. Integrating L4S into FreeBSD’s network stack, combined with the A3C machine learning algorithm, enhances network performance, responsiveness, and adaptability, making it a compelling choice for modern network environments.
The aim of this paper, as for other researchers in this field, is to find ways to contribute to advancing network protocols and machine learning techniques within the context of networking. Our main focus is developing a preliminary implementation of A3C-L4S to enhance L4S’s responsiveness to congestion by exploring and exploiting past experiences. This will ultimately lead to improved network responsiveness, reduced latency, and enhanced efficiency in FreeBSD-based systems. Our experimental implementation and results presented in this paper are made available through our GitHub repositories (Experimental L4S implementation in FreeBSD 13.1: https://github.com/MPTCP-FreeBSD/FB13.1-AQM-L4S-SRC.git accessed on 18 July 2024, A3C implementation and analysis: https://github.com/MPTCP-FreeBSD/FreeBSD-DRL-L4S.git accessed on 18 July 2024).
We formulate the following research questions in our paper:
  • How can the FreeBSD networking stack be modified to support L4S and integrate explicit congestion notification (ECN)?
  • What performance improvements can be observed in terms of latency, loss, and throughput by implementing L4S in FreeBSD?
  • How can the A3C algorithm be applied to dynamically adjust the base drop probability of L4S in response to varying network conditions?
  • What is the impact of using A3C to optimize the base drop probability of L4S on the performance of real-time applications?
This paper is organized as follows. Section 2 presents the background and related work in state-of-the-art AQM algorithms and their ML-based approaches, Section 3 and Section 4 present our system design and implementation of L4S in FreeBSD. Section 5 presents our experimental evaluation, and Section 6 analyzes the results and discuss key findings. Section 7 concludes the paper and outlines future work.

2. Background and Related Work

In this section, we present the background information on active queue management (AQM) and related works in machine learning (ML)-based approaches.

2.1. Active Queue Management

In the last decade, we have seen a staggering increase in the number of devices connected to the internet, leading to a surge in network traffic. Consequently, this has resulted in frequent congestion in networks characterized by high loss and high end-to-end latency. This has increased the demand for scalable solutions that offer low latency, low loss, and high throughput data transmissions.
As noted in [8], bufferbloat occurs primarily due to excessively large buffering capacity at network devices, particularly routers. Packets queue within these buffers, allowing the network devices to absorb the erratic packet bursts and inadvertently reducing packet loss but also resulting in high end-to-end delays. The large buffer size introduces a significant delay that persists over time, thereby degrading network performance.
Active queue management (AQM) is an algorithm run on routers/switches that detects incipient network congestion by monitoring the instantaneous or average queue size [9]. Network congestion occurs during high network traffic when it exceeds the network’s capacity to handle it.
To avoid network congestion, AQM algorithms are designed to monitor the queue’s state or length to make accurate decisions about packet handling (such as dropping or marking packets) based on the observed queue conditions to free up buffer space. In some AQM algorithms, a router sets a congestion notification bit in a packet to inform clients to reroute packets through a different path to avoid congestion in the router [10,11].
Kathleen et al. [1] highlights that present-day networking suffers from unwarranted latency and sub-optimal performance induced by bursts of packets and large buffers. Another point that is evident from [1] not mentioned in [8] is inefficient congestion control schemes. Though large buffers are essential to adequately functioning packet networks, overly large and unmanaged buffers create excessive delays, which frustrate many end-users. To mitigate these problems, the work presented in [1] hints at an effective AQM that can prevent the queues at the bottleneck from growing excessively by monitoring packet queue size and informing the sender’s TCP to drop packets promptly. The article also mentions that packet loss is not a concern but is necessary to function properly in the face of congestion. However, in L4S, we also require it to possess low loss.
In addition to the above, Prasade et al. [12] state that classic TCP control congestion algorithms are window-based, meaning that in the initial stages of congestion, the congestion control algorithm preemptively increases the transmission rate as a preventive measure for packet loss, but this exacerbates congestion issues. To mitigate this problem, AQM algorithms, relative to the queue size, start dropping packets or marking them, signaling the impending congestion to the endpoints, prompting them to reduce their congestion window before packet loss occurs to prevent overflow. The AQM uses the explicit congestion notification (ECN) flag present in packet headers to mark the packets and inform endpoints of congestion.
AQM schemes are pivotal in managing network congestion. These schemes include controlled delay (CoDel), proportional integral controller enhanced (PIE) and flow-queue-controlled delay (FQ-CoDel). Here, we briefly present the operations of these schemes.

2.1.1. Controlled Delay (CoDel)

CoDel is an active queue management (AQM) algorithm first proposed by Van Jacobson in 2012 [13] as an advancement over the traditional drop-tail algorithm and is a variant of the RED algorithm. CoDel primarily utilizes packet-sojourn time (or queue delay in simpler terms) as the primary congestion indicator. Once the queuing delay has exceeded a certain target for at least a certain interval, a packet is discarded, and the subsequent drop time is determined by a control law proportional to the square root of the number of drops since entering the dropping state. Conversely, the queue ceases discarding packets if the delay falls short of the target.
Several variants of CoDel have been proposed, including FQ-CoDel, which uses fair queuing to improve flow-level fairness, and PIE-CoDel, which incorporates the PIE algorithm to improve queue management.

2.1.2. Proportional Integral Controller Enhanced (PIE)

PIE [6] is another well-known AQM similar to RED. During congestion, incoming packets are dropped randomly according to a drop probability before being placed into the buffer. PIE determines congestion and drop probability by using the derivative (rate of change) of queuing latency. To ensure that PIE is “work conversing”, the random drop is bypassed if the latency samples are less than half the target latency value. After congestion ends, PIE exponentially decays “drop probability” to prevent the router from dropping too many packets. PIE also supports explicit congestion notification (ECN) but is optional.

2.1.3. Flow Queue-Controlled Delay (FQ-CoDel)

FQ-CoDel [5] is an active queue management (AQM) algorithm that combines fair queuing and the CoDel algorithm to mitigate bufferbloat in computer networks. Karlstad University first proposed it in September 2014 [14].
FQ-CoDel is a hybrid AQM scheme that utilizes multiple queues, each governed by its instance of CoDel for buffer management. As in a typical CoDel instance for a single queue, it drops packets when the packet-sojourn time exceeds a specific interval. To ensure a fair bandwidth among the queues, we employ a flow-queuing algorithm known as deficit found robin (DDR) with an efficiency of O(1) time complexity. This combination of fair queuing and CoDel helps to achieve flow-level fairness and reduce bufferbloat, packet loss, and latency. Another feature of FQ-CoDel is its implementation of two sets of old and new queues. This provides brief periods of priority to lightweight or short burst flows, helping deliver low latency.

2.1.4. Flow Queue-Proportional Integral Controller Enhanced (FQ-PIE)

Similar to FQ-CoDel, FQ-PIE [15] combines fair queuing (FQ) and the proportional-integral (PI) controller, an advanced control theory technique widely used in process control systems, as explained above. In our experiments, we use FQ-PIE deployed in FreeBSD, as mentioned in this paper [16]. The goals are similar to FQ-CoDel, where we use a DDR scheduler to evenly share bandwidth capacity among competing queues, except each queue is managed by an instance of PIE, which utilizes a derivative of the queuing delay to determine congestion and the responses to mitigate it.
FQ-PIE has been observed to outperform other AQM algorithms, including FQ-CoDel, regarding delay performance and fairness, as shown in this paper [17]. FQ-PIE has also been shown to be effective in wireless networks, where packet loss and delay are significant problems.

2.1.5. Low Latency, Low Loss, and Scalable Throughput (L4S)

The dual-queue coupled AQM [18,19] is a novel AQM scheme that utilizes two virtual queues, L4S and Classic, to control network traffic and utilizes the PIE controller as its base [20]. The objective of this AQM is to achieve low latency, low loss, and scalable throughput (L4S) under a wide range of dynamic network conditions. The congestion control becomes the primary mechanism that keeps utilization high but low delay in an L4S service, but it also requires shallow unsmoothed explicit congestion notification (ECN) [17]. ECN [17] is a signal or, to be precise, an ECN field in the IP header with two bits to provide a congestion indication for any incoming congestion. ECN does not require any smoothing delay, as additional delay is required to ensure round trip time data on each flow.

2.2. Machine Learning-Based AQM Schemes

In recent years, researchers have proposed several machine learning-based schemes in active queue management (AQM). Jakub et al. [21] proposed a unique approach using supervised convolutional neural networks to replicate the behavior of the AQM PI mechanism. However, it is constrained by its dependence on previous training data, limiting its efficiency in handling unique scenarios.
Researchers started using deep reinforcement learning (RL) to overcome these limitations. RL algorithms can learn through exploration, meaning they do not solely rely on historical data but actively interact with the environment to discover the optimal action. This exploratory nature of RL allows it to push the network towards better performance by continuously analyzing and learning from the outcomes of its actions.
Both papers, Refs. [22,23], propose a DRL-based AQM implementation that optimizes the maximum dropping probability ( m a x p ) of the RED AQM scheme using a Q-learning algorithm. Liu et al. [23] especially use a traffic predictor with Q-learning to optimize their drop probability. Though the way they optimize their models and gather data is quite different, both show promising results, especially in scenarios where the network behaves erratically.
The paper [24] proposes an AQM algorithm that uses explicit congestion notification (ECN) to regulate network congestion. They build a congestion predictor using an LSTM-based ML model and Q-learning to find optimal drop probability.
Similarly, other studies [25,26,27] all utilize a DRL approach to learn the optimal packet drop probability based on the observed network state and to regulate the queue length and congestion level.
We can see the constant rate of improvement and development of technology, especially with the advent of machine learning, and the performance of AQM can be increased significantly. The above literature summarizes the latest developments in AQM using machine learning. We have found out that all these papers primarily implement them in Linux-based operating systems, and all these papers are based on single queue-based AQMs, which are not suitable for L4S architecture, whereas our solution entails that we develop A3C-L4S for the FreeBSD OS. FreeBSD is an essential operating system for several reasons, including its high reliability, stability, security, and customizability. However, the main reason is that it is widely utilized in servers and networking devices where stability is critical. Many major IT-service-providing companies like Apple, Microsoft, and Netflix use FreeBSD in their production services. These are the few we mentioned among the many others, as we utilize these services heavily, making it easier to understand their significance.

3. Research Design and Methodology

We present the research design for our A3C-L4S. We first discuss L4S and then A3C.

3.1. Using DualPi2 as an AQM in FreeBSD-L4S

The coupled dual-queue AQM (or DualPi2) [18,19] operates like a semi-permeable membrane, effectively maintaining the sub-millisecond average queuing delay characteristics of L4S while isolating it from classic traffic latency by maintaining separate queues for each type. This configuration ensures that capacity-seeking algorithms achieve approximately equivalent throughput per flow, regardless of the queue they utilize.
However, unlike single-queue frameworks, DualQ does not require examination of the transport-layer flow iD nor compromise classic traffic performance, and it requires no new configuration for public internet deployment [18,19].
Latency is not L4S’s sole focus. The “Low Loss and Scalable” aspect of its name indicates its other functions. Traditional scalable congestion control algorithms like DCTCP and Prague encounter compatibility issues with classic congestion controls. Even if they are sharing an ECN-capable queue, the classic algorithms limit their capacity due to the aggressive nature of scalable congestion controls. Unlike Diffserv EF, which limits high-priority traffic to a small percentage of bandwidth capacity to maintain low delay, L4S leverages ECN and DualQ’s isolating and coupling effect to achieve very low latency while also achieving zero % loss and retain its ability to scale rapidly without majorly affecting its throughput.
Rigorous testing has been conducted in residential network setups, varying the base RTT up to 100 ms and link rates up to 200 Mb/s between the data center and home network to evaluate the effectiveness of L4S AQMs. The experiments discovered that L4S AQMs maintained an average queuing delay below 1 ms for each of their packets, with the 99th percentile delay not exceeding 2 ms. The L4S AQM introduced no packet loss to the network. The extensive tests are detailed in [18,28].
The comprehensive L4S framework [29] offers more insights on advanced deployment features like ensuring backward compatibility with scalable congestion controls in network bottlenecks lacking DualQ coupled AQM implementation. Additional publications [18,28,30,31] provide more detailed justification through discourse and precise mathematical formulas, accompanied by empirical performance evaluations.
Modified DualQ Coupled L4S AQM: The coupled AQM mechanism ensures harmonious coexistence by setting the classic drop probability p c proportional to the square of the coupled L4S probability p c l . Here, p c l influences the immediate L4S drop probability p l , changing at a similar pace to p c . The square of p c l offsets the square root of p c in the TCP formula used by classic Reno congestion management. As a consequence of this, the flow rate of Reno now approximates that of DCTCP. The correlation between the L4S probability, p _ c l , and the classic drop probability, p c , needs to be expressed as the following formula:
p c = ( p c l / k ) 2
where k is referred to as the proportionality constant, known as the ‘coupling factor’.
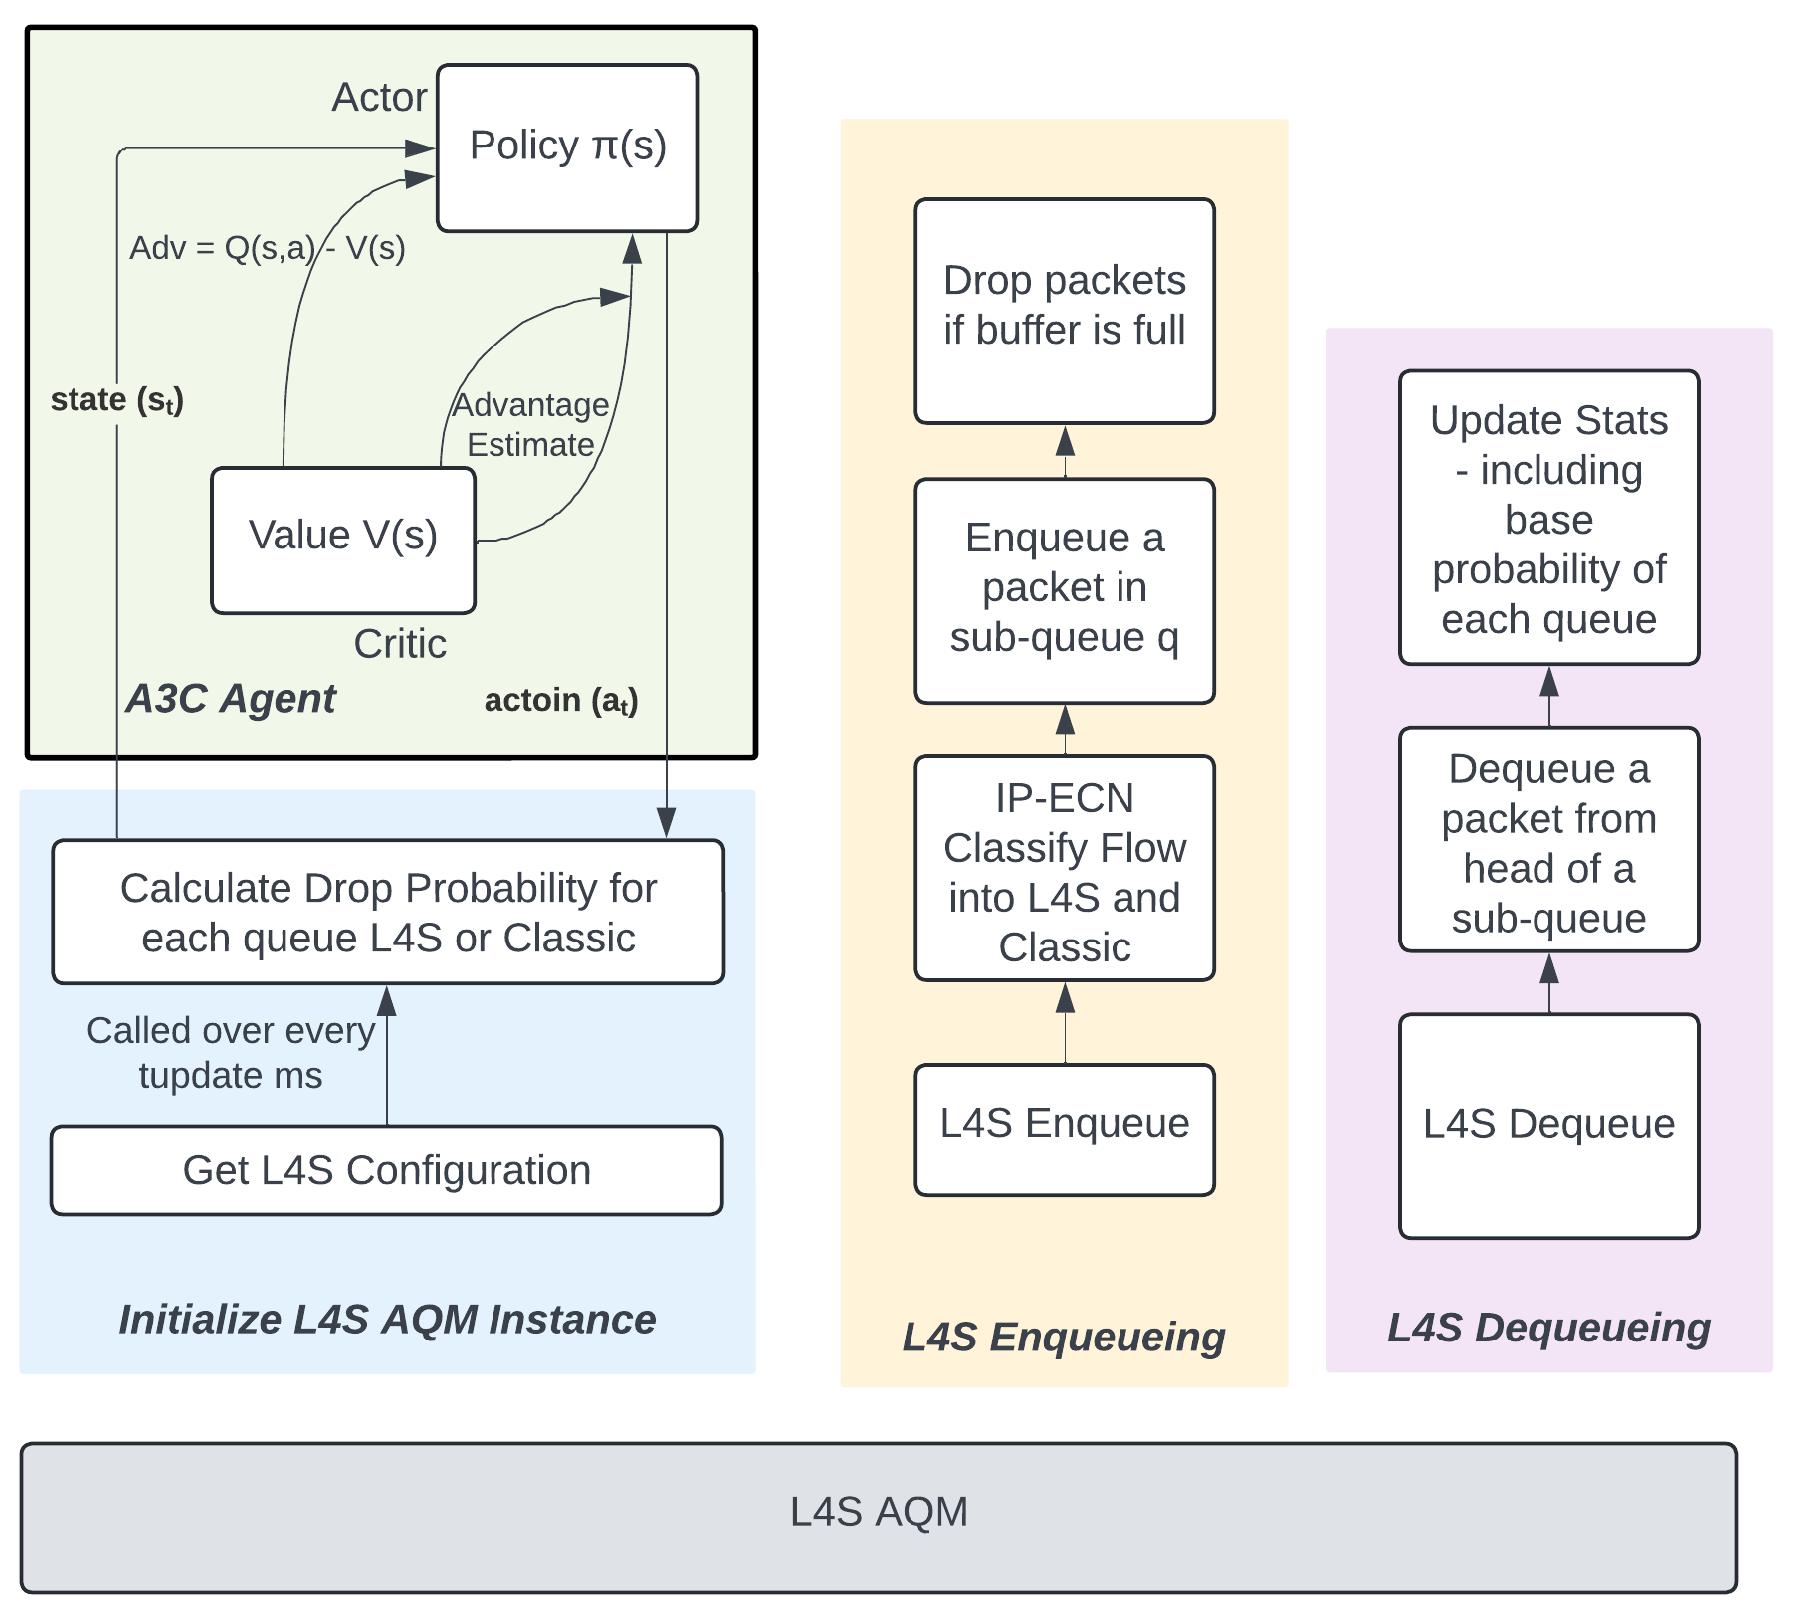
Any DualQ Coupled AQM likely has a general structure similar to Figure 1. The classifier at the ingress segregates the incoming traffic into two distinct queues: the L4S and classic queues. Each queue is governed by the probability of marking (or dropping) packets denoted by p l and p c l , respectively.
In managing Reno traffic, which varies the traffic load relative to the square root of observed drops, research such as [PI2] [30] has shown that employing a linear controller to regulate load, squaring the resultant output, and using it as the classic drop probability in traffic compatible with Reno yields favorable results.
For the actual implementation of DualQ L4S, we need to understand the underlying mathematical formulations for each pair of L4S and classic queues, as shown in Figure 1. The implementation requires two phases: (i) phase one produces an internal base probability p , and (ii) in phase 2, we generate p c using Equation (2), where
p c = ( p ) 2 .
Substituting the value of p c in the equation provided in Equation (1) to Equation (2) gives
p = p c l / k .
Now, we can express the Coupled L4S ECN-marking probability as
p c l = k × p .
Recognizing that the L queue has its own ECN-dropping probability due to its “Native AQM”, we denote it as p l , calculated based on the current L4S queuing delay. Given that p l is the ECN-dropping probability applied to the L4S queue, and p c l is the probability under coupled congestion conditions, the L4S queue should apply p l whenever the L4S queue grows due to its conditional precedence over the classic queue. However, it should not drop below p c l . We can define this relation as follows:
p l = m a x ( p l , p c l ) ,
This has been proven to function really well in actual network traffic.
The transformations applied to p in Equations (2) and (3) serve to apply the correlation described in Equation (1), previously introduced.
The coupling factor, denoted as ‘k’ in Equation (1), intricately determines the relationship between congestion probabilities for low latency, low loss, and scalable throughput (L4S) and classic traffic within network environments. Through its modulation of drop probabilities, k indirectly influences the adjustments in transmission rates made by the AQM in response to congestion. Consequently, variations in k directly impact the equilibrium ratio between L4S and classic flow rates: higher values of k promote more pronounced marking of L4S traffic, potentially leading to substantial rate adjustments compared to classic traffic, while lower values indicate a lesser degree of coupling and closer resemblance in marking probabilities between L4S and classic traffic. This parameter offers network administrators and policymakers a critical tool for fine-tuning traffic proportions, optimizing network performance, and enhancing overall efficiency by accommodating the diverse requirements of different traffic types.
In queue prioritization, although the scheduler gives higher precedence to the L queue, the classic queue still exerts a significant influence. This phenomenon arises because the ’Base AQM’ aggressively applies congestion signals to L traffic as the C queue expands. Consequently, as L4S flows adjust their rates in response, they underutilize the allocated L4S scheduling resources. This behavior creates opportunities for C traffic to be scheduled within the gaps.
While prioritizing the L queue results in a low queuing delay for L traffic, courtesy of the coupling mechanism controlling L traffic, it necessitates conditional prioritization to prevent the C queue from being starved in the short term, giving the means for the C traffic to assert itself. The introduction of a conditional priority mechanism allows for a balanced approach, granting small weight or limited waiting time for C traffic, thereby improving response times for short classic messages like DNS requests and enhancing the startup performance of classic flows by providing immediate capacity when needed.
We employ the ’flow queueing scheduler’ from FQ-CoDel and FQ-PIE to segregate network traffic evenly across our three DualPi2 L4S AQMs by utilizing hash functions computed based on certain network parameters, such as port numbers and the source and destination IP addresses. This allows us to isolate low-traffic and high-traffic connections. In upcoming versions, we hope to add the option to change the number of flows or queues dynamically. Flow-queuing significantly impacts performance, especially when scaling our network traffic.

3.2. Asynchronous Advantage Actor-Critic (A3C) Model

Asynchronous advantage actor-critic (A3C) is a deep reinforcement learning algorithm introduced by Mnih et al. [32] in 2016. It combines actor-critic and asynchronous methods, making it highly scalable and efficient in solving large and complex problems.
The A3C algorithm uses multiple parallel agents that interact with the environment independently and asynchronously. Each agent is a copy of the same neural network but with different random initial weights. These agents operate in parallel and collect experiences by interacting with the environment. The experiences are then used to update the parameters of the global neural network.
The advantage of using A3C in this context lies in its scalability and efficiency. Each agent operates independently and updates its own copy of the neural network asynchronously without waiting for other agents. This asynchronous update mechanism enables efficient parallelization, allowing multiple agents to work in parallel and optimize their AQMs without interfering with each other.
For our research purposes, we hope to employ multi-agents to optimize multiple routers in our network. A3C allows a central global network to control our routers, ensuring that our model learning encompasses the whole network and is training only our central DRL model, thus requiring less computation and resources. The model parameters and weights in the agents are updated from the global network after a certain time period asynchronously.

3.2.1. Markov Decision Process

The Markov decision process (MDP) formalizes the learning process of the proposed A3C-L4S. In this framework, the learning process begins with observing the current environment state st. An action ( a ) is then chosen according to the policy π ( a s ) . The ECN-marking probability of queue is what our A3C model contributes to our AQM algorithms. Therefore, we utilize a continuous action space to represent this, as the action varies in a certain range from 0 to L4S_MAX_PROB. Executing this action transitions the environment to a new state st+1, and the model receives a reward R; where R = RTT. For further research, we should define a utility function that does not solely prioritize the queuing delay and focuses on its collective performance, which includes other metrics like throughput and loss. Depending on the environment and the usage scenario, we will give higher weightage to certain metrics.
The environment state is characterized by various metrics, all defined in the Table 1. Some crucial metrics include drop_probability pt, queuing delay qdt, packet drop count pdropt, length of the queue in bytes lenbt, and total transmitted data in bytes totbt of each sub-flow. Each sub-flow’s dropping or marking probability sri represents the actions.
The intelligent agent has three main components:
S t a t e : s t = p t , q d t , p d r o p t , l e n b t , t o t b t i
A c t i o n : a t = p t
R e w a r d : R t = q d e l a y t

3.2.2. Actor-Critic Model

The A3C algorithm uses multiple workers or agents to update a shared model asynchronously. In the following Figure 2, we can discern the placement of our A3C agent in conjunction with our modified L4S algorithm. As observed, we construct an actor and critic model by representing policy function and Q-network.
Advantage Function: The advantage function A ( s , a ) quantifies the relative benefit of choosing action ‘a’ in state ‘s’ compared to the average action in that state. This metric allows us to evaluate the effectiveness of specific actions within their respective states by assessing their performance relative to the norm for that context. It is a key component in enhancing the decision-making capabilities of actor-critic agents in complex and dynamic environments.
A ( s , a ) = Q ( s , a ) V ( s )
Advantage Function with Returns: Since Q values are unavailable, we estimate the advantage function by computing the discounted rollout returns. This allows us to infer the potential value of different actions in various states during training.
A ( s , a ) = R V ( s )
Returns: The return R is the cumulative discounted reward with γ exponentially decreasing the future rewards’ weight and n denoting the number of steps or actions taken:
R = r n + γ r n 1 + γ 2 r n 2 +
Advantage Estimate: Each worker in the algorithm maintains estimates of the policy π ( a t | s t ; θ ) and value function V ( s t ; θ v ) , utilized in computing the following advantage estimate:
A ( s t , a t ) = i = 0 n 1 γ i r t + i + γ n V ( s t + n ; θ v ) V ( s t ; θ v )
In this equation,
-
θ represents the parameters of the policy network, which outputs the policy π ( a | s ; θ ) .
-
θ v represents the parameters of the value network, which outputs the value function V ( s ; θ v )
-
The state s t represents the environment at step t. It contains all the necessary information for the agent to decide that step.
H ( π ) = a π ( a | s ) log ( π ( a | s ) )
Actor Network: The actor network is responsible for choosing actions ‘a’ based on the current environmental state. It receives in the state ‘s’ as input and outputs a probability distribution of the feasible actions available in that state. The primary goal of the actor is to maximize the expected returns, which are represented by the policy loss functions:
L actor = log π ( a | s ; θ ) · A ( s , a ) + β H ( π )
In this equation:
  • log π ( a | s ; θ ) represents the probability of choosing action a given state s, as determined by the actor network with parameters θ .
  • ( A ( s , a ) ) denotes the advantage function
  • ( H ( π ) ) is an entropy term that encourages exploration by ensuring the policy does not become overly deterministic, with ( β ) being a hyperparameter that influences the agent into prioritizing learning policies that consistently favor a specific action over another with greater probability.
Critic Network: The critic network evaluates the value of the current state, providing a baseline to assist the actor in determining the quality of actions. It takes the state (s) as input and outputs a scalar value V(s;w), where (w) represents the critic network’s parameters. The critic’s objective is to minimize the mean squared error between the estimated value function (V(s;w)) and the actual discounted return ’R’ observed during training.
The formula for the critic loss function L_critic is:
L critic = ( R V ( s ; w ) ) 2
where R is the cumulative discounted return, and V(s;w) is the estimated value function for state (s) with parameters (w).
Neural Layer Structure of Actor and Critic Model This section presents the neural network architectures for the actor and critic models utilized by our A3C model. Each neural network is implemented using an input layer, multiple hidden layers, and output layers.
In this section, we define the action network (actor) and the critic network as neural networks (NNs), integral components of our reinforcement learning model. Each network is designed with specific layers and sizes tailored to their respective roles within the model.
Actor Network: The neural network layer structure of the Action Network model:
The actor network’s architecture, as shown in Algorithm 1, consists of one input, two hidden, and two output layers. The input layer has twelve neurons and accepts the state representation of the environment. The hidden layers consist of two dense layers, each with 32 neurons and ReLU activation functions. This layer is responsible for the model’s ability to learn the input state’s complexities. The two output layers then compute two outputs—mean output (mu) and standard deviation (std), respectively.
Algorithm 1: Actor Neural Network Architecture
state_input = Input((self.state_dim,))
dense_1 = Dense(32, activation=’relu’)(state_input)
dense_2 = Dense(32, activation=’relu’)(dense_1)
out_mu = Dense(self.action_dim, activation=’tanh’)(dense_2)
mu_output = Lambda(lambda x: x * self.action_bound)(out_mu)
std_output = Dense(self.action_dim, activation=’softplus’)(dense_2)
return tf.keras.models.Model(state_input, [mu_output, std_output])
Critic Network:
The neural network layer structure of the critic model is as follows:
The critic network’s architecture, as shown in Algorithm 2, consists of one input layer, two hidden layers, and one output layer. Like the actor network, the input layer has 12 neurons that accept the state representation. The next three layers are the hidden layers. The first two are dense layers, each consisting of 32 neurons and a Relu activation function, followed by a third layer with 16 neurons and a Relu activation function. The final output layer is a dense layer with a single neuron and a linear activation function, which outputs the given state’s estimated value, which is crucial in calculating the advantage estimates to train our actor network.
Algorithm 2: Critic Neural Network Architecture
Input((self.state_dim,)),
Dense(32, activation=’relu’),
Dense(16, activation=’relu’),
Dense(1, activation=’linear’)
Simultaneous Update and Asynchronous Training: During training, the actor and critic networks are updated simultaneously using the gradients of their respective loss functions with respect to their parameters θ and θ v .
The updates are performed asynchronously across multiple agents, independently interacting with the environment and collecting experiences. This asynchronous training mechanism significantly enhances sample efficiency and reduces the variance of the gradients, leading to more stable and efficient learning. The formulas are adapted from a Stanford University paper [33].

3.2.3. Training the Asynchronous Advantage Actor-Critic (A3C) model

In this section, we provide a concise overview of the training procedure for A3C-L4S.
Algorithm 3 outlines the pseudo-code of the A3C model training process in a continuous action observation space. The model goes through a total of 100 episodes during the entire training phase. Every episode commences by resetting the environment and the training session with a fresh random data point. Every episode teaches the model to learn the relationship between action, states and reward. Every episode executes 100 actions to enhance the overall episode reward or to minimize the queuing delay throughout the entire episode. Our model is trained using network environment data collected over long testing periods in our existing artifact. During deployment, the local model or agent that governs each AQM instance asynchronously updates its parameters using the model weights provided by the global network after a certain time interval. Due to exchanging information from kernel space to user space, the delay is introduced, which is typically under one millisecond but may vary depending on system configuration and workload.
Algorithm 3: A3C Pseudocode
1:
Set discount factor gamma γ = 0.99 .
2:
Set the global update interval t args _ update _ interval = 5 .
3:
Set the actor learning rate α actor = 0.0005 .
4:
Set the critic learning rate α critic = 0.001 .
5:
Set the entropy regularization term β = 0.01 .
6:
Initialize global shared parameter vectors θ and θ v , and a global shared counter T = 0 .
7:
Initialize thread-specific parameter vectors θ and θ v .
8:
Initialize the thread step counter t 1 .
9:
repeat
10:
    Reset gradients: d θ and d θ v to zero.
11:
    Synchronize thread-specific parameters: θ θ and θ v θ v .
12:
    Set t start = t .
13:
    Retrieve current state s t .
14:
    repeat
15:
        Select action a t based on policy π ( a t | s t ; θ ) .
16:
        Retrieve reward r t and observe new state s t + 1 .
17:
        Increment counters: t t + 1 and T T + 1 .
18:
    until terminal state s t or t t start = t args _ update _ interval
19:
    for i from t 1 down to t start  do
20:
        Update accumulated reward R recursively: R r i + γ R .
21:
        Accumulate gradients w.r.t. θ : d θ d θ + θ log π ( a i | s i ; θ ) ( R V ( s i ; θ v ) ) .
22:
        Accumulate gradients w.r.t. θ v : d θ v d θ v + ( R V ( s i ; θ v ) ) 2 θ v .
23:
    end for
24:
    Update weights of policy and value function asynchronously: θ θ + d θ and θ v θ v + d θ v .
25:
until  T > T max

3.2.4. Data Preparation

Table 1 displays all the metric data obtained from the kernel along with their description. Custom logging functions were used within the kernel to accurately capture data for analysis, offline data cleaning, and preparation for A3C’s environment. The collected data were then normalized to values between 0 and 1 to make training easier, with minimum and maximum values set accordingly. The data we collect from the kernel has no boundaries and may have drastic variations. Therefore, implementing normalization enables us to reduce substantial errors and fluctuations. This allows for the model to achieve better stability.

4. Implementation and Benchmarking of L4S in FreeBSD

In this section, we explain how we incorporated the low latency, low loss, and scalable throughput (L4S) algorithm into the FreeBSD operating system.
In this paper [16], the authors have implemented CoDel, FQ-CoDel, PIE and FQ-PIE in FreeBSD successfully. FQ-PIE combines both flow-queuing (FQ) and proportional-integral controller enhanced (PIE). We use the already existing FQ-PIE algorithm as the base for our L4S AQM scheme. L4S works by filtering ECN and non-ECN into separate queues and couples their drop probabilities to ensure L4S packets are given the right proportion of priority when sending packets while not ignoring classic packets.
There are four steps to the process:
  • Limiting the number of flows or queues to the required amount
  • Enqueuing and filtering packets based on their ECN flag
  • Coupling the probabilities of the L4S and classic queues

4.1. Step 1: Limiting the Number of Flows or Queues to the Required Amount

For an L4S algorithm, one needs a minimum of two queues: one L4S and the other a classic queue, which, in our case, is a classic PIE queue. Our proposed solution is designed with flexibility in mind. We utilize a total of six queues, three of which are L4S queues, and the other three are classic queues. This number can always be increased, but for our testing purposes, we believe that testing our modified algorithm with three pairs of L4S and classic queues is the ideal starting point. This setup should be easily scalable when testing it in a larger environment, giving us the freedom to adapt as needed.
The function named l4s_config in Algorithm 4 receives L4S parameters from the user or terminal and assigns them to the corresponding local variables. However, we specifically assert it to use our default flow size parameter. This means that we do not need to specifically add another argument when we change the AQM algorithm in FreeBSD, and it will automatically create six queues.
Algorithm 4: Assert code to use default queue size
static int
l4s_config(struct dn_schk *_schk)
{...
    struct dn_sch_l4s_parms *fqp_cfg;
......
    /* L4S configurations */
.....
if (1)
fqp_cfg->flows_cnt = l4s_sysctl.flows_cnt;
            ......
   .....
}

4.2. Step 2: Enqueuing and Filtering Packets Based on Their ECN Flag

In this step, we must filter the packets into ECN-capable transport and non-ECN marked packets; these are codepoints of the ECN field. ECT-capable packets are given higher priority when enqueuing, meaning when there is congestion, L4S packets are given more priority, and the classic packets are dropped more relative to L4S packets, decreasing the latency for L4S packets. This is why we need to be able to differentiate the packets, as they might have different purposes. Packets related to a certain service, like live streaming and video calls, are latency-sensitive and thus would be marked with the (ip->ip_tos & IPTOS_ECN_MASK) ! = 0, meaning it would be 01, 10 or 11 bits.
Algorithm 5 demonstrates the high-level details of implementing packet enqueuing into the queues. The algorithm is designed for packet filtering and enqueuing, which involves classifying packets and then enqueuing them into the appropriate queue based on certain criteria.
Algorithm 5: Packet Enqueuing in Queues
/*
 * Enqueue a packet into either L4S or Classic queues according to its ECN flag
 */
static int
l4s_enqueue(struct dn_sch_inst *_si, struct dn_queue *_q,
struct mbuf *m)
{
................
 
 /* classify a packet to queue number, which is half of the total queue size*/
idx = l4s_classify_flow(m, param->flows_cnt/2, si);
 
        struct ip *ip;
ip = (struct ip *)mtodo(m, dn_tag_get(m)->iphdr_off);
/* If the queue number is 0-2 given by Jenkin Hash and if ECN is enabled,
        * we will put the packet in the later half of the queue buffer meant for
        * L4S */
if (ip->ip_tos & IPTOS_ECN_MASK) != 0)
idx=idx+(int)(param->flows_cnt / 2);
        drop = pie_enqueue(&flows[idx], m, si);
 
.......................
}
Classify a Packet to Queue Number:
idx = l4s_classify_flow(m, param->flows_cnt / 2, si);
  • l4s_classify_flow(m, param->flows_cnt / 2, si) is a function that classifies the packet m into a queue number using The Jenkins hash algorithm.
  • param->flows_cnt / 2 is used as an argument to split the classification into L4S and native PIE queues.
  • si is an additional parameter passed to the classification function.
Extract IP Header
struct ip *ip;
ip = (struct ip *)mtodo(m, dn_tag_get(m)->iphdr_off);
  • struct ip *ip; declares a pointer to an IP header structure.
  • ip = (struct ip *)mtodo(m, dn_tag_get(m)->iphdr_off); extracts the IP header from the packet m using the offset provided by dn_tag_get(m)->iphdr_off.
Check ECN Field in IP Header
if ((ip->ip_tos & IPTOS_ECN_MASK) == IPTOS_ECN_ECT1)
    idx = idx + (int)(param->flows_cnt / 2);
  • if ((ip->ip_tos & IPTOS_ECN_MASK) == IPTOS_ECN_ECT1) checks the explicit congestion notification (ECN) field in the IP header’s type of service (ToS) field.
  • IPTOS_ECN_MASK is a mask to isolate the ECN bits.
  • If the ECN field is not zero, the queue index idx is adjusted by adding half of the total flow count (param->flows_cnt / 2). This effectively classifies the packet into L4S queues based on its ECN status.
Enqueue the Packet
drop = pie_enqueue(&flows[idx], m, si);
  • drop = pie_enqueue(&flows[idx], m, si); enqueues the packet m into the queue indexed by idx in the flows array using the pie_enqueue function.
  • &flows[idx] is a pointer to the specific queue.
  • si is likely additional context or parameters needed for the enqueue operation.
  • The result of the enqueue operation (whether the packet was dropped or successfully enqueued) is stored in the variable drop.
The l 4 s _ c l a s s i f y _ f l o w method uses a Jenkins hash function and uses the network configuration settings like the source and destination IP address and ports as parameters. The Jenkins hash algorithm utilizes a combination of bitwise operations and multiplication with prime numbers to generate the hash value. It is commonly used in software applications for tasks such as hash table lookups, checksum generation, and data indexing.

4.3. Step 3: Coupling the Probabilities of the L4S and Classic Queues

In this section, we describe the process of coupling the drop probabilities for the low latency, low loss, and scalable throughput (L4S) and classic queues. The following code snippet initializes variables to store the base drop probabilities of each flow:
Algorithm  6 initialized the variables to store the drop probabilities—( P ) and ( P l ) represent the base drop probabilities from the individual queues. These variables are used to calculate the coupled drop probabilities, as shown in the following algorithm.
Algorithm 6: Initializing variables for drop probabilities
uint32_t drop_prob_Pdash_flow_0;
uint32_t drop_prob_Pdash_flow_1;
uint32_t drop_prob_Pdash_flow_2;
uint32_t drop_prob_Pl_flow_3;
uint32_t drop_prob_Pl_flow_4;
uint32_t drop_prob_Pl_flow_5;
 
uint32_t P_Cmax;
At the start of the code implementation in Algorithm 7, we compute P C by utilizing Formula (2):
P C = ( P ) 2
Afterwards, we determine P C L utilizing previously defined Formula (3):
P C L = k · P
We then apply the max function on P C L and P L to compute P L as defined before in Equation (5):
P L = max ( P L , P C L )
We have a fixed ‘coupling factor’ that is pre-established. To determine a better ‘k’, it is better to understand the scenario where the algorithms are being used and either use a gradient optimization or manually test it with varying values of the ‘coupling factor’. However, it is best to determine dynamically.
Algorithm 7: Calculate the drop probabilities based on their queue type
1 /*
2 * Enqueue a packet in queue q, subject to space and L4S queue management policy
3 * We will calculate its drop probability depending on its queue or flow index
4 * Update stats for the queue and the scheduler.
5 * Return 0 on success, 1 on drop.
6 */
7 static int
8 pie_enqueue(struct l4s_flow *q, struct mbuf* m, struct l4s_si *si)
9 {
10        ....
11  int coupling_factor=2;
12        ....
13  int64_t prob;
14  uint32_t drop_prob_PCl_flow_3;
15  uint32_t drop_prob_PCl_flow_4;
16  uint32_t drop_prob_PCl_flow_5;
17 
18  if(q->flow_index==0 || q->flow_index==1 || q->flow_index==2 )
19   prob=(pst->drop_prob*pst->drop_prob)/PIE_MAX_PROB;
20 
21  if(q->flow_index==3)
22  {
23   drop_prob_PCl_flow_3=drop_prob_Pdash_flow_0*coupling_factor;
24   if(drop_prob_Pl_flow_3<drop_prob_PCl_flow_3)
25    prob=drop_prob_PCl_flow_3;
26   else
27    prob=drop_prob_Pl_flow_3;
28  }
29 
30 
31 
32  if(q->flow_index==4)
33  {
34   drop_prob_PCl_flow_4=drop_prob_Pdash_flow_1*coupling_factor;
35   if(drop_prob_Pl_flow_4<drop_prob_PCl_flow_4)
36    prob=drop_prob_PCl_flow_4;
37   else
38    prob=drop_prob_Pl_flow_4;
39  }
40  if(q->flow_index==5)
41  {
42   drop_prob_PCl_flow_5=drop_prob_Pdash_flow_2*coupling_factor;
43   if(drop_prob_Pl_flow_5<drop_prob_PCl_flow_5)
44    prob=drop_prob_PCl_flow_5;
45   else
46    prob=drop_prob_Pl_flow_5;
47  }
48 
49  if(prob < 0)
50   prob = 0;
51  else if(prob > PIE_MAX_PROB)
52   prob = PIE_MAX_PROB;
53 
54  .......
55  }

4.4. Step 4: Kernel Integration of L4S-Based AQM

To integrate our L4S AQM as a separate AQM scheduler within the ipfw module, we needed to propagate the changes throughout the FreeBSD system. This involved modifying the administrative utilities of the kernel to accommodate the new L4S algorithm and its distinct parameters. The process required a complete rebuild of the system using buildworld. Here is a succinct description of the steps we have undertaken:
Modification of theipfwModule
  • Implemented the L4S AQM scheduler within the ipfw module source code.
  • Ensured that all necessary parameters and functionalities specific to the L4S algorithm were defined.
Propagation of Changes
  • Updated the relevant system files to reflect the addition of the new AQM scheduler.
  • Made necessary adjustments to ensure compatibility and proper integration within the FreeBSD kernel.
Rebuilding the System
  • Executed the buildworld process to rebuild the FreeBSD world, incorporating the new AQM scheduler.
  • This step recompiled all userland programs and utilities, ensuring they recognized and could utilize the new AQM parameters.
  • Followed the buildkernel process to compile the updated kernel with the newly integrated L4S AQM.
  • Installed the rebuilt kernel and rebooted the system to apply the changes.
With these steps, we successfully integrated our L4S-based AQM into the FreeBSD kernel, ensuring that all administrative utilities were updated to accept and manage the new algorithm parameters.

5. Experimental Evaluation

In this section, we conduct a comprehensive evaluation of our L4S mechanism against various other competing AQM solutions. Furthermore, we analyze A3C-L4S, discussing its promise as a significant avenue for future research endeavors.

5.1. Evaluation and Benchmarking of AQM Algorithms

In our evaluations, we compare our L4S algorithm with other AQM congestion control algorithms implemented in the FreeBSD kernel, specifically CoDel, PIE, FQ-CoDel, FQ-PIE, and L4S.
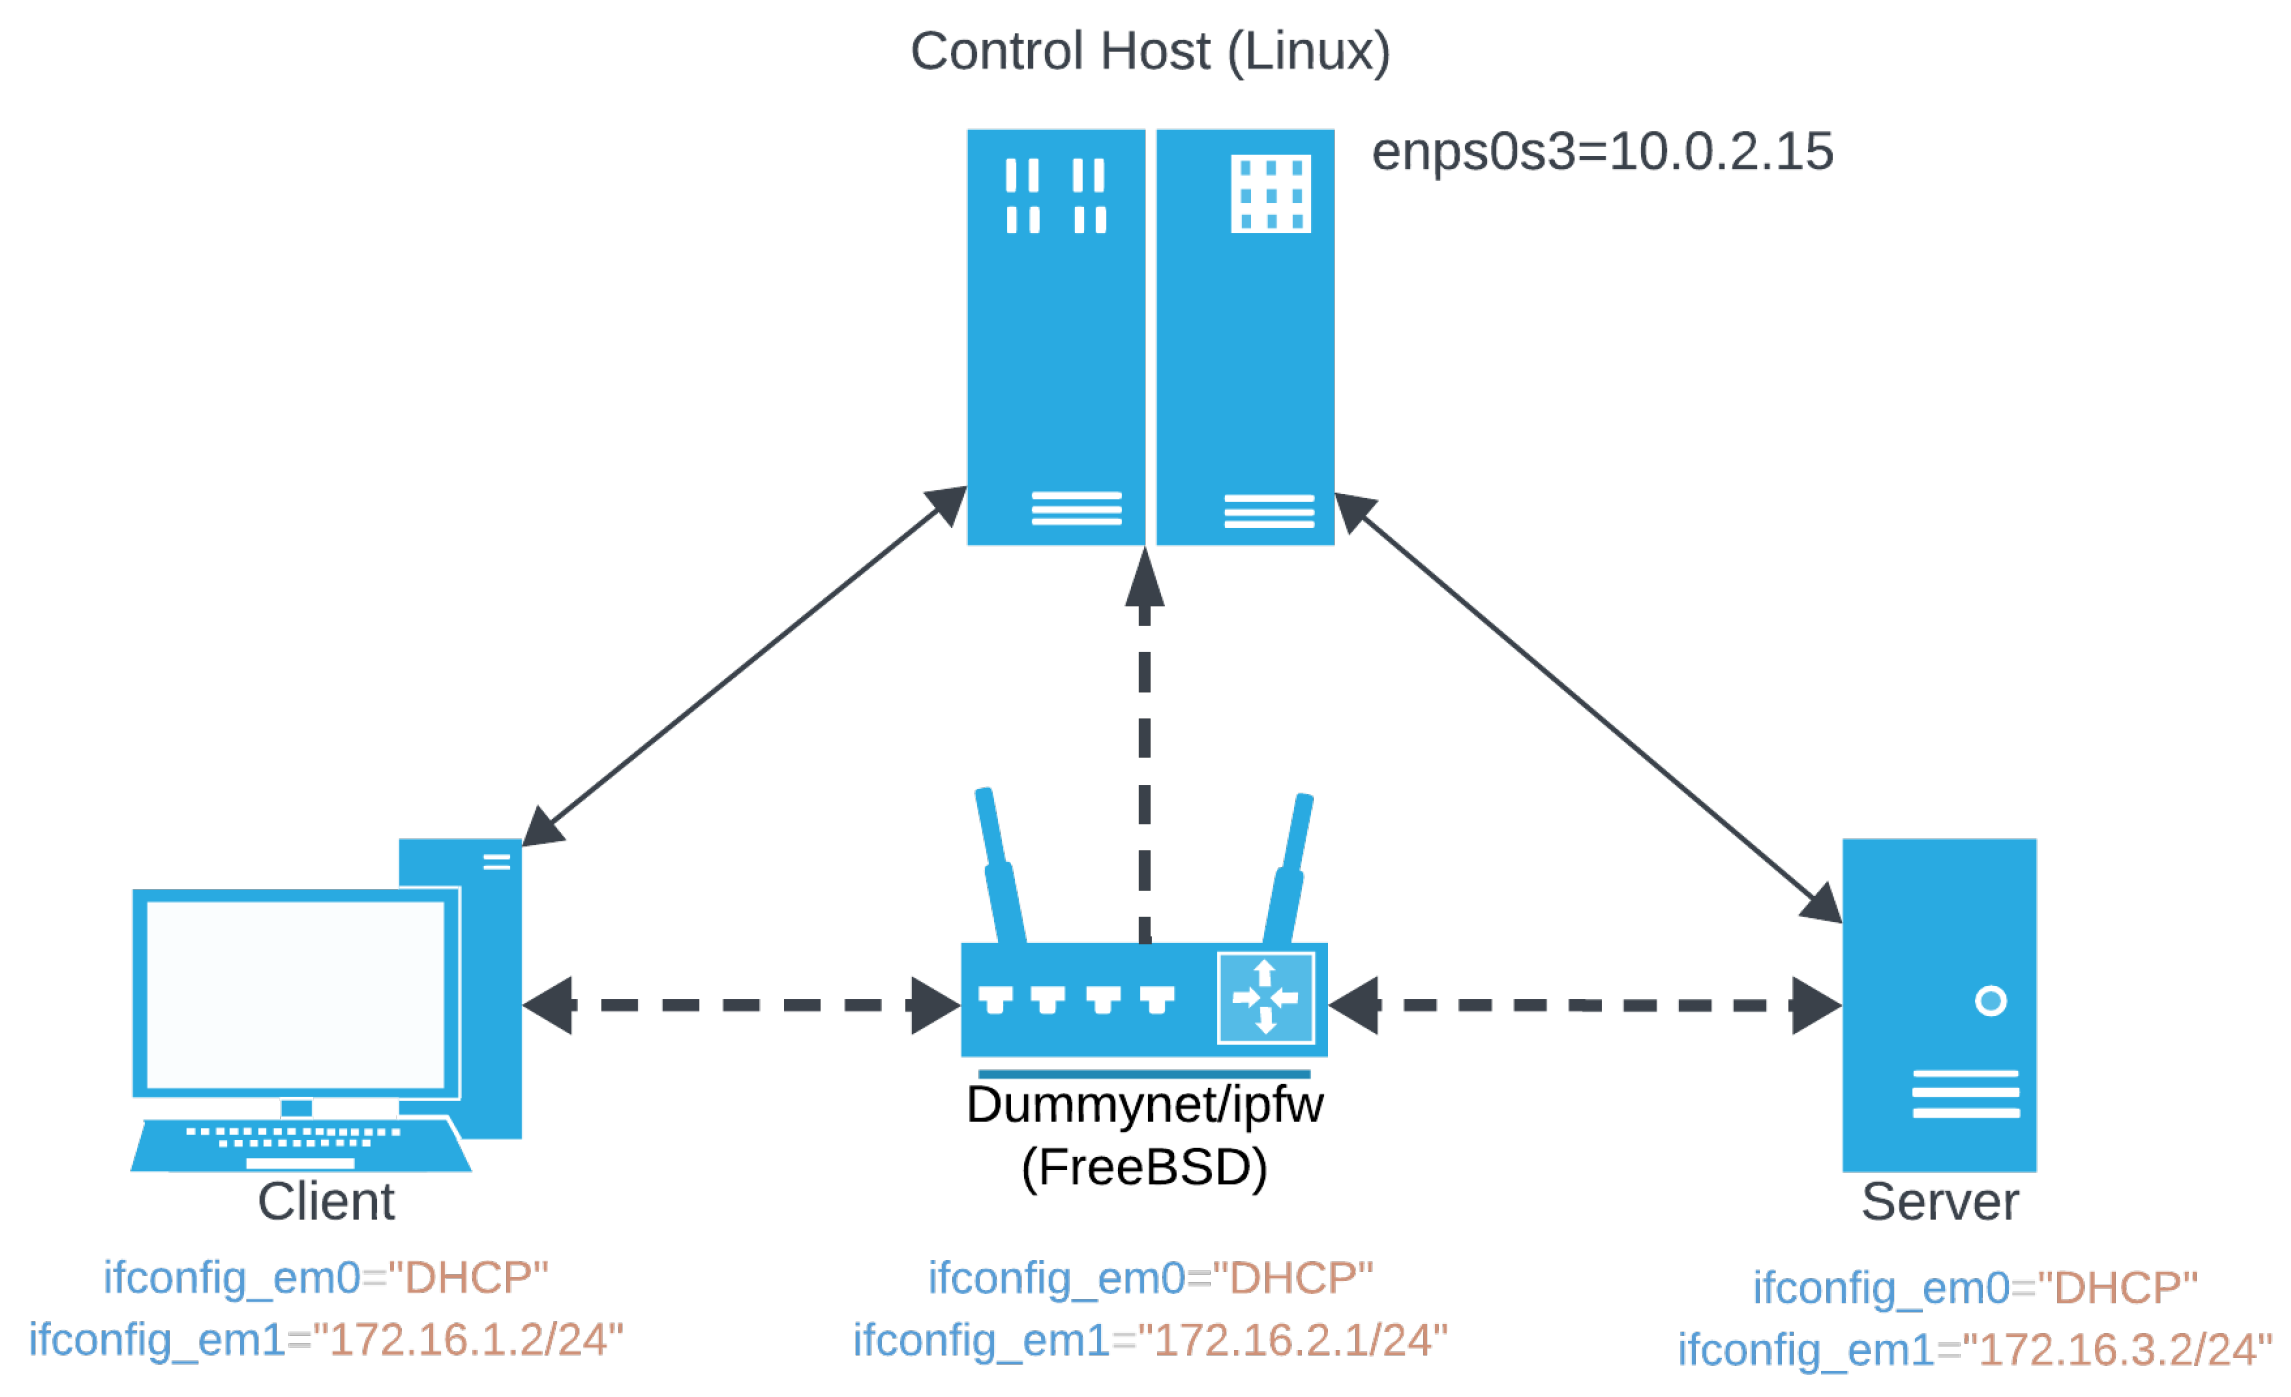
Our experimental testbed is based on virtual machines operating within VirtualBox. The testbed features a client and a server connected via a single router, thus simulating a single-path network, as depicted in Figure 3. Multiple TCP streams were deployed at the router to simulate real-world network congestion.
To evaluate the algorithms’ performance across different network conditions, we conducted tests in both high-bandwidth and low-bandwidth environments, specifically at 10 Mbps and 1 Mbps. This comprehensive approach ensures that our L4S algorithm is robust and effective across various operational scenarios.
Congestion window size and smoothed RTT data were recorded using the ‘Statistical Information For TCP Research (SIFTR)’ [34] kernel module. The ‘siftr’ (https://man.freebsd.org/cgi/man.cgi?query=siftr&apropos=0&sektion=4&manpath=FreeBSD+13.1-RELEASE+and+Ports&arch=default&format=html accessed on 18 July 2024) tool rests between the IPv4 and TCP/IP layers and intercepts the TCP packets as they traverse the network stack within the kernel. On interception, it generates a log file containing highly granular measurements of each packet in the TCP session. The filename for the logfile can be configured using the ‘net.inet.siftr.logfile’ variable through the ‘sysctl’ interface. Additionally, the recording session can be initiated or terminated by setting the net.inet.siftr.enabled’ variable to 0 or 1.
The log file records the congestion window size in bytes, and the smoothed RTT in units of TCP_RTT_SCALE * HZ, where TCP_RTT_SCALE is defined in tcp_var.h and HZ is the kernel’s tick timer. To acquire the smoothed RTT in seconds, dividing the recorded value by (TCP_RTT_SCALE * HZ ) is necessary.
To expedite the ’throughput’ measuring process, we employ the ‘tcpdump’ [35] utility to capture packet data and save it as a ‘.pcap’ file. This file is then analyzed using the ‘dpkt’ python library [36] to filter for TCP packets heading to a specific port connected to its respective TCP stream. The results are then immediately visualized using the ’matplotib’ library. Readers familiar with ’Wireshark’ [37] can replicate these throughput graphs by selecting throughput in the TCP stream graphs section under the statistics tab, using the pcap files in the referenced repository.
NewReno TCP congestion control: Our experiments utilize NewReno as the primary TCP congestion control mechanism. NewReno, implemented in FreeBSD, commences with the slow-start phase, starting with a conservative congestion window (cwnd) size of several segments, exponentially scaling until it detects potential congestion, after which it transitions into the congestion avoidance phase, where it increases the cwnd linearly. Suppose the congestion control mechanism detects any packet loss, in that case, it enters into fast recovery mode, where it decreases its cwnd size by half and prioritizes retransmitting lost packets till it receives an acknowledgment for retransmitted packets. Subsequently, it transitions back into the congestion avoidance phase and repeats the process when it encounters packet loss or after an idle timeout; it enters the slow-start phase again to probe the optimal cwnd size.
In the following Figure 2, we observe the total data transferred for each case in our experiment. Our results show that the total data transferred throughout the experiment are slightly higher when ECN is enabled, except for FQ-CoDel. This is because ECN notification helps NewReno detect congestion earlier, and it decreases the cwnd threshold to the cwnd value when it detects early congestion, ensuring an optimal threshold. First, we must recognize that these are the total data transferred, including retransmissions, and when we encounter higher retransmission, we observe higher RTT.

5.1.1. CoDel

In experiments (4)–(7), multiple instances of iperf3 were deployed under FreeBSD to generate four TCP NewReno streams with staggered start and end times (starting at t = 0, 10, 20, 30 s, and each flow lasting for 60 s). The bandwidth was set to 10 Mbps or 1 Mbps, and the delay was set to 20 ms. The internal parameters of CoDel were configured with a target of 5 ms and an interval of 100 ms, tested both with ECN enabled and disabled.
Scenario 1 (Bandwidth = 10 Mbps, Delay = 20 ms): We evaluated the performance of CoDel in two cases: (i) Case 1 is with enabled ECN; the results are shown in Figure 4, and (ii) Case 2: ECN is disabled, and the results are in Figure 5.
When ECN is disabled, an evident spike in RTT occurs at the initiation of each TCP stream, indicating the slow-start phase of NewReno, as depicted in Figure 4c and Figure 5c. The CoDel always uses ECN-marking when ECN is enabled and never drops packets in case of extreme delays, unlike in the PIE algorithm, which drops packets if marking packets does not decrease RTT. During congestion, the NewReno algorithm reduces its cwnd more conservatively under ECN-enabled conditions, resulting in a higher maximum cwnd size and more stability, albeit with sub-optimal cwnd sizes. CoDel sets the ECN flag in the packet header to CE to indicate congestion and does not drop packets, unlike PIE-based AQMs. Furthermore, in the absence of ECN, cwnd undergoes rapid adjustments, as depicted in Figure 4b and Figure 5b. This conservative approach also results in higher RTT but lower total throughput when ECN is enabled compared to its absence, as depicted in Figure 4 and in Table 2.
Scenario 2 (Bandwidth = 1 Mbps, Delay = 20 ms): We evaluated the performance of CoDel in two cases: (i) Case 1 is with enabled ECN; the results are shown in Figure 6, and (ii) Case 2: ECN is disabled, and the results are in Figure 7. The conservative approach of CoDel in adjusting cwnd sizes when ECN is enabled results in more stable, low but unfair cwnd sizes when compared across multiple TCP connections, as depicted in Figure 6b and Figure 7b. This conservative approach appears to have influenced RTT noticeably. Specifically, RTT shows fewer variations but is consistently higher than when ECN is disabled. Similarly, cwnd has influenced throughput to have a higher maximum throughput but unfair bandwidth sharing across multiple TCP connections, as depicted in Figure 6a and  Figure 7a.

5.1.2. PIE

In experiments (8)–(11), the internal parameters of PIE were configured with target = 15 ms, tupdate = 15 ms, alpha = 0.125, beta = 1.25, max-burst = 150 ms, and max-ecnth = 0.1.
Scenario 1 (Bandwidth = 10 Mbps, Delay = 20 ms): We evaluated the performance of PIE in two cases: (i) Case 1 is with enabled ECN; the results are shown in Figure 8, and (ii) Case 2: ECN is disabled, and the results are in Figure 9.
The PIE algorithm drops packets instead of merely marking them when the drop-probability exceeds the configurable parameter ’max_ecnth’. This behavior ensures that the congestion control optimally sets cwnd sizes leveraging its high variability characteristics in both cases whether ECN is enabled or disabled, as illustrated in Figure 8b and Figure 9b.
This behavior ensures consistent throughput and RTT values across multiple TCP connections, regardless of enabling ECN or not. It results in low RTTs and stable bandwidth sharing, as depicted in Figure 8c, Figure 9c and Figure 8a, Figure 9a, respectively.
Scenario 2 (Bandwidth = 1 Mbps, Delay = 20 ms): We evaluated the performance of PIE in two cases: (i) Case 1 is with enabled ECN; the results are shown in Figure 10, and (ii) Case 2: ECN is disabled, and the results are in Figure 11. The PIE algorithm exhibits consistent behavior in low-bandwidth environments, in high-bandwidth environments characterized by low RTTs, high variations in cwnd in its search for optimal cwnd values, and optimal throughput, albeit only when ECN is disabled. Notably, with ECN enabled, significant unfairness across TCP connections is observed across all metrics, alongside high RTTs.

5.1.3. FQ-CoDel

For our experiments (12)–(15), the internal parameters of FQ-CoDel were configured with target = 5 ms, interval = 100 ms, quantum = 1514 bytes, limit = 10,240 packets, and flows = 1024 queues, tested with both ECN enabled and disabled.
Scenario 1 (Bandwidth = 10 Mbps, Delay = 20 ms) : We evaluated the performance of FQ-CoDel in two cases: Case 1 with enabled ECN and Case 2 with disabled ECN for comparison. Figure 12 and Figure 13 present the results for the two cases, respectively.
FQ-CoDel shows significant fairness in throughput across connections regardless of ECN, as shown in the throughput Figure 12a where ECN is enabled and Figure 13a where ECN is disabled. FQ-CoDel shows higher maximum cwnd values and high unfairness, prioritizing more recent TCP connections when ECN is enabled, illustrated in Figure 12b. Unlike when ECN is disabled, Figure 13b displays a sawtooth pattern indicating the transition from congestion avoidance to fast-retransmit during packet loss and return to the congestion avoidance phase.
When ECN is enabled, FQ-CoDel shows very high RTT due to higher retransmissions, as it does not drop packets and only uses ECN notification to indicate congestion, unlike PIE, FQ-PIE, and L4S, as illustrated in Figure 12c. This results in high data transfer, as shown in Table 2, as retransmission is counted as part of the data transfer metric. In contrast, FQ-CoDel shows admirably low RTT when ECN is disabled, indicating that dropping packets is advisable during high congestion, similar to PIE-based algorithms. In future evaluations, it is better advised to transfer video files and other types of data transmission and analyze packet loss and retransmissions.
Scenario 2 (Bandwidth = 1 Mbps, Delay = 20 ms): We evaluated the performance of FQ-CoDel in two cases, Case 1 with ECN enabled and Case 2 with ECN disabled, for comparison. Figure 14 and Figure 15 present the results for the two cases, respectively. FQ-CoDel shows similar fairness in throughput regardless of ECN, even though it shows high variation in throughput in Figure 14a when ECN is enabled. FQ-CoDel shows similar cwnd values to Scenario 1, except it shows higher variations in cwnd when ECN is disabled, as depicted in Figure 15b, indicating high packet loss. When ECN is disabled, FQ-CoDel drops packets during congestion, thus ensuring RTT is low for all successfully transferred packets, as illustrated in Figure 15c.

5.1.4. FQ-PIE

In experiments (16)–(19), The internal parameters of FQ-PIE were configured with target = 15 ms, tupdate = 15 ms, alpha = 0.125, beta = 1.25, max-burst = 150 ms, max-ecnth = 0.1, quantum = 1514 bytes, limit = 10,240 packets, and flows = 6 queues.
Scenario 1 (Bandwidth = 10 Mbps, Delay = 20 ms): We evaluated the performance of FQ-PIE in two cases: (i) Case 1 is with enabled ECN; the results are shown in Figure 16, and (ii) Case 2: ECN is disabled, and the results are in Figure 17.
Similarly to PIE, The FQ-PIE algorithm drops packets instead of merely marking them when the drop probability exceeds the configurable parameter ’max_ecnth’. This behavior ensures that the congestion control optimally sets cwnd sizes, leveraging its high variability characteristics whether ECN is enabled or disabled, as illustrated in Figure 16b and Figure 17b.
This conservative behavior results in near consistent throughput and RTT values across multiple TCP connections, regardless of enabling ECN, though only after it starts dropping packets in the case of ECN, causing a slight delay in its reduction of cwnd to optimal levels. It results in low RTTs and stable bandwidth sharing, as depicted in Figure 8c, Figure 9c and Figure 8a, Figure 9a, respectively. Upon closer examination, Figure 16c shows higher RTT when ECN is enabled, as illustrated. Subsequently, Figure 16a illustrates a higher throughput and more unfairness when compared to its counterpart in Figure 17a. This outcome stems from NewReno’s conservative approach in reducing its cwnd size when ECN is enabled. In contrast, NewReno instantly halves its cwnd upon detecting packet loss and then enters fast-recovery mode.
In Figure 16c, we see a bit more instability than in Figure 17c.
Scenario 2 (Bandwidth = 1 Mbps, Delay = 20 ms): We evaluated the performance of FQ-PIE in two cases, Case 1 with ECN enabled and Case 2 with ECN disabled, for comparison. Figure 18 and Figure 19 present the results for the two cases.
The FQ-PIE algorithm exhibits consistent behavior in low-bandwidth environments as in high-bandwidth environments, characterized by slight unfairness and slightly elevated RTTs, especially when ECN is enabled.
Compared to the high-bandwidth environment in scenario 1, scenario 2 demonstrates notably more exaggerated RTT, particularly in TCP connection 2. This increase in RTT directly results from lower available bandwidth and increased waiting time due to congestion and packet loss. The resulting diminished performance of throughput and cwnd due to lower bandwidth is as expected in such scenarios.

5.1.5. L4S

In experiments (20)–(23), the internal parameters of L4S were configured with target = 15 ms, tupdate = 15 ms, alpha = 0.125, beta = 1.25, max-burst = 150 ms, max-ecnth = 0.1, quantum = 1514 bytes, limit = 10,240 packets, and flows = 6 queues.
Scenario 1 (Bandwidth = 10 Mbps, Delay = 20 ms): We employed two cases: (i) Case 1 is with enabled ECN; the results are shown in Figure 20, and (ii) Case 2: ECN is disabled, and the results are in Figure 21.
L4S is based on FQ-PIE, so it behaves quite similarly, dropping packets instead of marking them when they exceed the ECN threshold. Upon receiving duplicate ACKS, the NewReno algorithm transitions from the slow-start phase to the congestion avoidance phase. Upon discovering retransmission timeout due to packet loss or high packet delay, it sets cwnd to the maximum segment size of a TCP(MSS), and the ’ssh_thrsh’is halved and then enters the congestion avoidance phase. In the case of ECN, it sets the cwnd threshold to the current cwnd and enters the congestion avoidance phase. We can see this process in Figure 20b, and in Figure 21b, we can observe L4S going into fast-recovery and then into congestion avoidance immediately.
L4S segregates incoming packets into separate L4S and classic queues, prioritizing L4S packets, so we observe a noticeably reduced overall RTT when ECN is enabled, as depicted in Figure 20c, compared to in Figure 21c where ECN is disabled. If ECN is enabled, all data-carrying packets in a TCP transmission are marked with ECN capability. Still, other packets, like acknowledgment (ACK) packets sent by the server, do not have ECN enabled in their packet header and are thus segregated into separate classic queues. Its prioritization scheme allows for more buffer capacity and prioritization for L4S packets.
Scenario 2 (Bandwidth = 1 Mbps, Delay = 20 ms): We evaluated the performance of L4S in two cases: Case 1 with enabled ECN and Case 2 with disabled ECN for comparison. Figure 22 and Figure 23 present the results for the two cases.
Similarly to FQ-PIE, L4S exhibits consistent behavior in both low- and high-bandwidth environments. In a low-bandwidth environment, reduced bandwidth capacity induces greater cwnd fluctuation due to higher packet loss, as illustrated in Figure 22b and Figure 23b. This higher cwnd variation adversely affects throughput and RTT, inducing elevated levels of unfairness when bandwidth is low compared to when bandwidth is high, as depicted in Figure 22c and Figure 23c.
L4S in low-bandwidth environment demonstrates notably more exaggerated RTT when ECN is disabled. This increase in RTT is a direct consequence of lower available bandwidth, resulting in diminished throughput and performance of cwnd due to higher packet loss and congestion.

5.2. A3C-L4S Evaluation

We have established an additional test environment using virtual machines specifically for evaluating A3C-L4S. Figure 24 shows this setup, which now includes two routers instead of one. This network configuration involves a source host, destination host, and two intermediary routers.
To gather more data, we have two iperf3 experiments going on simultaneously in each path in different directions. We now have four different data streams from which we collect data to feed our A3C model.
We utilize the normalized L4S data from the kernel logs generated from experimentation and testing to pass into the DDPG agent’s observation space for training. Our A3C model runs the training session for a certain number of steps. Each episode resets and starts from a new data point. We trained our A3C model for 100 episodes. We plot the average reward in each episode against the episode index to observe how the rate and utility improve over each training session as the A3C learns more.

5.2.1. Convergence of A3C Model

We can see in Figure 25 the convergence of the A3C model. The figure plots the average epoch or episode reward against the epoch index. The average reward gradually increases, quietly approaching the limit, demonstrating A3C’s ability to minimize queue delay for each agent. We can improve A3C with more training time and with more data. Especially in online learning, the A3C model can extract higher performance out of the environment. The A3C model is computationally more expensive and time-consuming than other models. We might want to train our data on a much bigger dataset and for longer.
PIE-based AQM algorithms like our modified L4S AQM recalculate its ECN marking probability at regular time intervals (tupdate), which is set to 15 ms by default unless explicitly configured differently. Likewise, periodically, after a certain number of actions or steps (controlled by args_update_interval), each worker thread transmits its gradients to the global network, thereby determining the frequency of global network parameter updates. This dual strategy allows for adaptive control over the stability and convergence of the A3C algorithm, balancing computational efficiency with performance optimization. In highly dynamic and unstable network environments, increasing the update frequency for both A3C and L4S proves beneficial in improving the stability and learning efficacy of the A3C algorithm. Future refinements based on comprehensive testing across diverse scenarios, including mobile networks and IoT environments, may involve optimizing these intervals to update global network parameters more frequently and recalculate ECN-marking probabilities.
We can also see the reward data for each worker agent and the global network. Each agent’s reward increases steadily and shows no adverse performance issues. It also does not seem to have hit a constant reward yet, so we might need to run the model for longer. This graph tells us our A3C model is feasible, and we can start with it and fine-tune it with more training.

5.2.2. Comparing Predicted QDelay vs. Actual QDelay

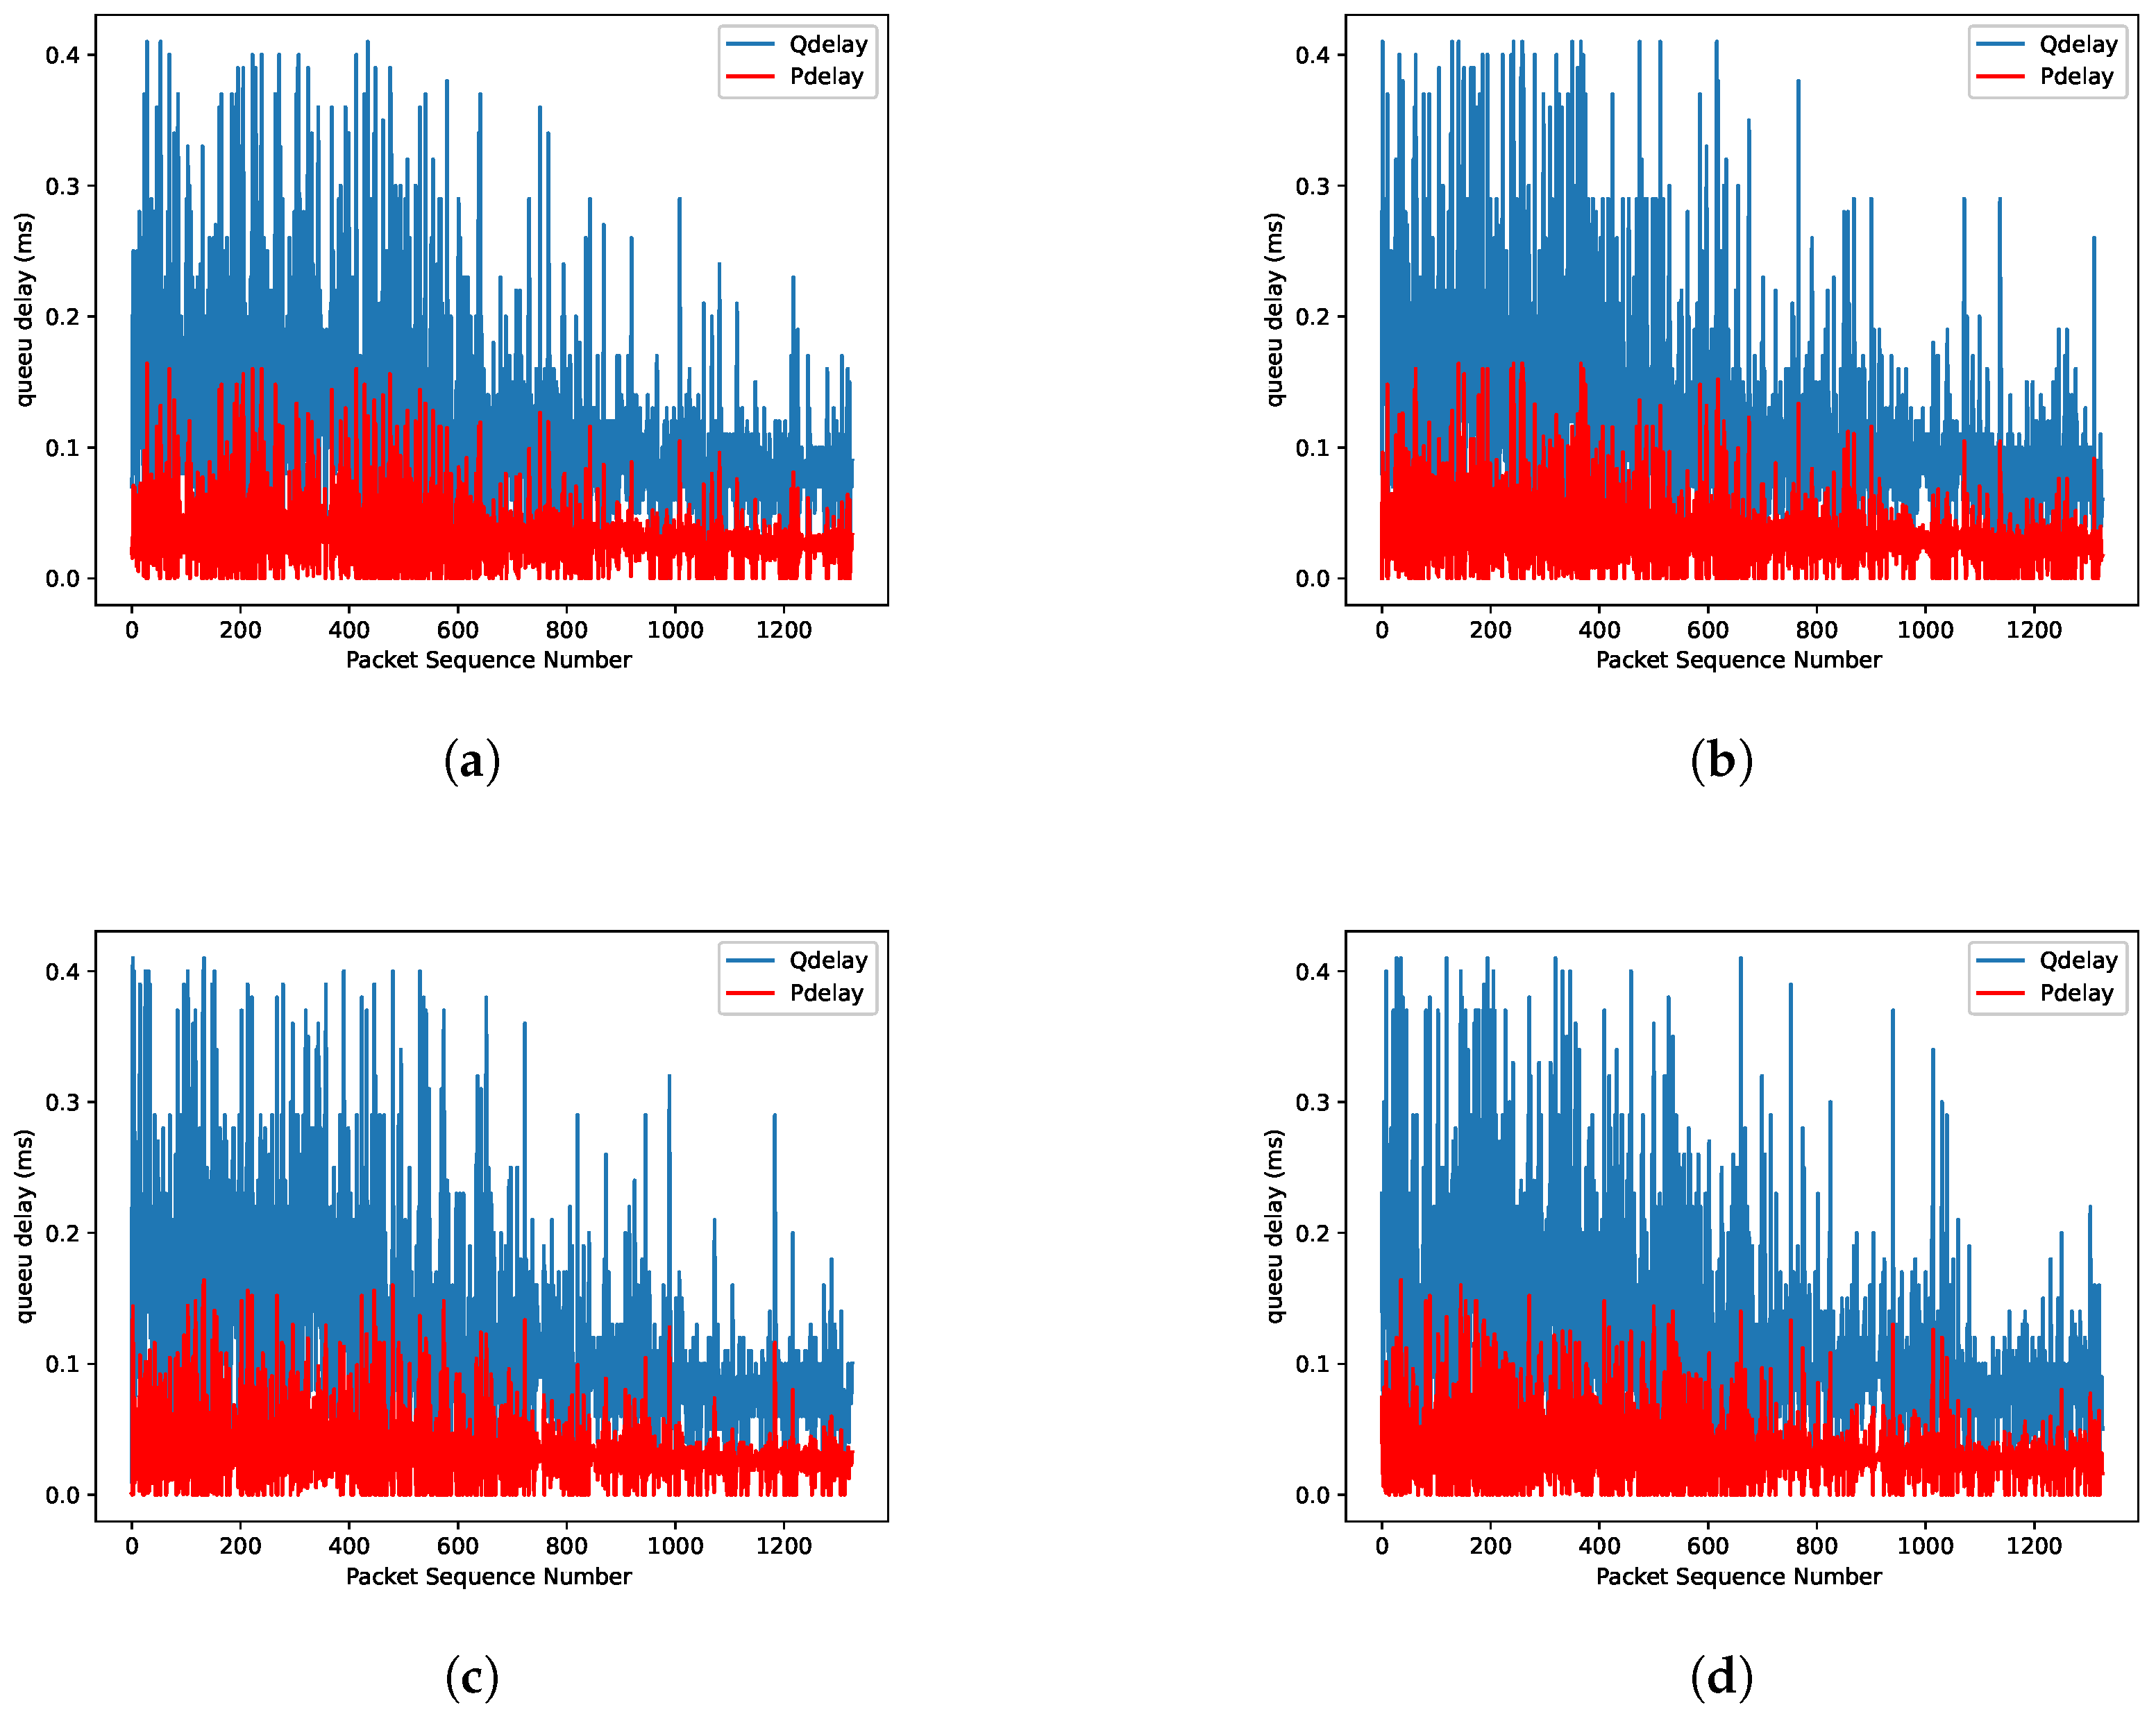
We can see how A3C affects the network’s performance, mainly focusing on queue delay in the following Figure 26 graphs. The predicted queue delay is already very low after training and keeps decreasing until it hits a specific limit, beyond which it cannot improve its performance without more data. All the agents perform similarly because we work in a virtual environment with no other traffic in addition to our experiments. We have also set the same bandwidth, delay, loss, and different configurations on both routers. We might also want to introduce irregular traffic differences between the end hosts in each path.

5.2.3. Comparing Predicted QDelay vs. Actual QDelay with Varying Reward Scaling Factor

The following Figure 27 illustrates the predicted queue delay (QDelay) in a three-dimensional graph. We also vary the ‘alpha’ reward scaling factor variable from 10 to 100. We can see how the Qdelay decreases with more training.

6. Results Analysis and Discussion

In the first part of our research, we compared multiple AQM algorithms with L4S and tested them in two different scenarios: Scenario A—10 Mbps and Scenario B—1 Mbps.
We deployed multiple instances of iperf3 under FreeBSD to generate four TCP NewReno flows with staggered start and end times (starting at t = 0, 10, 20, and 30 s and each flow lasting 60 s).
Each instance of FQ-CoDel was configured for target 5 ms, interval 100 ms, quantum 1514 bytes and with 10,240 packets of bottleneck buffering shared by 1024 FQ-CoDel sub-queues.
Each instance of FQ-PIE was configured for target 15 ms, tupdate 15 ms, max_burst 100 ms, quantum 1514 bytes, and with 10,240 packets of bottleneck buffering shared by six FQ-PIE sub-queues. We have data for both cases when ECN was enabled and disabled. We use six sub-queues because our L4S also uses six sub-queues, which helps us compare both algorithms under similar conditions.
Each instance of L4S was configured for target 15 ms, tupdate 15 ms, max_burst 100 ms, quantum 1514 bytes, and with 10,240 packets of bottleneck buffering shared by three pairs of L4S sub-queues.
We have data for both cases when ECN was enabled and disabled.
The main difference in scenarios is the bandwidth. Scenario A’s bandwidth is 10 Mbps; in Scenario B, the bandwidth is 1 Mbps.

6.1. Performance of Throughput across Varying AQM Algorithms

Scenario 1 (Bandwidth = 10 Mbps, Delay = 20 ms):
We evaluated the throughput performance of FQ-CoDel, FQ-PIE, and L4S across two scenarios: Case 1 with ECN enabled and Case 2 with ECN disabled. Figure 28 and Figure 29 illustrates the results for both cases.
Our findings show that FQ-CoDel achieves fairness across all TCP connections, whereas FQ-PIE and L4S exhibit significant unfairness. Subsequently, FQ-PIE and L4S exhibit elevated unfairness when ECN is enabled rather than disabled. Enabling ECN leads NewReno to detect congestion sooner, causing an earlier reduction in its cwnd threshold and quicker entry into congestion avoidance mode. This behavior sustains higher cwnd levels, resulting in more data transferred, as indicated in Table 2 when ECN is enabled, especially L4S. L4S exhibits higher throughput than FQ-PIE when ECN is enabled, showing superior performance. We can also observe that the maximum throughput attained when ECN notification is enabled is higher compared to when ECN is disabled.
Scenario 2 (Bandwidth = 1 Mbps, Delay = 20 ms): We evaluated the performance of FQ-CoDel, FQ-PIE, and L4S in two cases: Case 1 with ECN enabled and Case 2 with ECN disabled for comparison. Figure 30 and Figure 31 showcase these two cases’ results. Similarly to Scenario 1, FQ-PIE and L4S exhibit higher unfairness in throughput when ECN is enabled due to NewReno’s early congestion detection, which sends New Reno directly into the congestion avoidance phase. This leads to higher sustained cwnd values and higher total data transferred, at least in the case of FQ-PIE. L4S shows higher data transfer when ECN is disabled; refer to Table 2. L4S has the same buffer size, but its lower bandwidth causes excessive delays. We can also attribute it to the uneven distribution of packets into their respective classic and L4S queues. The low-bandwidth environment has resulted in FQ-CoDel showing high variations in throughput, though it seems to have maintained fairness across its multiple TCP connections.

6.2. Performance of RTT across Varying AQM Algorithms

Scenario 1 (Bandwidth = 10 Mbps, Delay = 20 ms): We evaluated the performance of FQ-CoDel, FQ-PIE, and L4S in two cases: Case 1 with enabled ECN and Case 2 with ECN disabled for comparison. Figure 32 and Figure 33 present the results for the two cases.
In Figure 32a, where ECN is disabled, FQ-CoDel exhibits high RTT but demonstrates higher data transfer due to higher retransmissions, as shown in Table 2. This is mainly because FQ-CoDel does not drop packets from its buffer when congestion is too high, unlike FQ-PIE and L4S. Upon disabling ECN, FQ-CoDel has a very similar RTT to CoDel, with the lowest consistent RTT among its competitors, as depicted in Figure 33a.
L4S demonstrates a distinct reduction in RTT when ECN is enabled, highlighting the efficacy of its prioritization strategies. This contrasts with FQ-PIE, which exhibits higher RTT and occasional fairness concerns, particularly around the 60-second mark when ECN is enabled. When ECN is disabled, both L4S and FQ-PIE display comparable RTT characterized by slightly higher RTT. Figure 33b,c depict their RTT behavior without ECN, whereas Figure 32b and Figure 34c illustrate the impact of ECN on their performance metrics.
Scenario 2 (Bandwidth = 1 Mbps, Delay = 20 ms):
We evaluated the performance of FQ-CoDel, FQ-PIE, and L4S in two cases: Case 1 with ECN enabled and Case 2 with ECN disabled for comparison. Figure 34 and Figure 35 present the results for these two cases.
In both low and high-bandwidth environments, FQ-CoDel, FQ-PIE, and L4S demonstrate similar RTT behaviors. FQ-CoDel exhibits significantly high RTT when ECN is enabled (Figure 34a), contrasting sharply with its low RTT when ECN is disabled (Figure 35a), similar to scenario 1. Subsequently, FQ-PIE shows high RTT and unfairness among connections irrespective of ECN status, as depicted in Figure 34b and Figure 35b. Notable, L4S shows significantly reduced RTT and enhanced fairness with ECN enabled due to its prioritization mechanisms. Conversely, with ECN disabled, L4S shows elevated RTT, except for TCP stream two.
FQ-CoDel, FQ-PIE, and L4S experience initial RTT spikes during connection initiation, typical of NewReno’s slow-start phase with exponential cwnd growth. It then transitions into congestion avoidance upon receiving multiple acknowledgments or enters fast recovery upon detecting packet loss due to retransmission timeout (RTO), finally entering congestion avoidance. FQ-CoDel avoids dropping packets when ECN is enabled, unlike FQ-PIE and L4S, which drop packets exceeding the ECN threshold. L4S additionally segregates packets into L4S and classic queues, prioritizing L4S traffic for significantly reduced RTT under ECN, as depicted in Figure 32c and Figure 34c, compared to Figure 33c and Figure 35c where ECN is disabled. When ECN is enabled, all data-carrying packets in TCP transmissions are marked with ECN capability. However, acknowledgment (ACK) packets from the server lack ECN in their headers and are segregated into classic queues. This prioritization scheme ensures more buffer capacity and prioritizes L4S packets, as seen in our experiments. The marginal improvements in RTT facilitated by L4S represent critical advancements for latency-sensitive applications, significantly enhancing user experience, particularly during scaling. Not to forget, L4S shows higher throughput.

6.3. Performance of Congestion Window across Varying AQM Algorithms

Scenario 1 (Bandwidth = 10 Mbps, Delay = 20 ms): We evaluated the performance of FQ-CoDel, FQ-PIE and L4S in two cases: Case 1 with enabled ECN and Case 2 with ECN disabled, for comparison. Figure 36 and Figure 37 present the results for the two cases.
In the FQ-CoDel algorithm with ECN enabled (Figure 36a), the cwnd for some TCP connections steadily increases over time. There seems to be extreme unfairness in its cwnd sizes across connections in the bottleneck, predominately showing a preference for TCP connections that started later. When ECN is disabled (Figure 37a), the cwnd exhibits periodic oscillation due to frequent RTO and NewReno’s response to congestion, and the cwnd has a lower maximum cwnd size than other algorithms. This directly influences the total data transferred throughout the process across all connections, as seen in Table 2, significantly lower than its L4S and FQ-PIE competitors when ECN is disabled.
In the FQ-PIE and L4S algorithms, regardless of ECN, as illustrated in (Figure 36b,c when ECN is enabled, and Figure 37b,c when ECN is disabled), the cwnd displays a sawtooth pattern characterized by sharp increases in cwnd followed by rapid decreases upon detecting packet loss. This reflects NewReno’s adaptive behavior to maximize throughput while avoiding congestion.
Scenario 2 (Bandwidth = 1 Mbps, Delay = 20 ms):
Evaluation is conducted in two cases: Case 1 with ECN enabled and Case 2 with ECN disabled for comparison. Figure 38 and Figure 39 present the results for these two cases.
Similar to Scenario 1, FQ-CoDel’s cwnd with ECN enabled (Figure 38a steadily increases. Its cwnd values are significantly higher during upwards trends of the staircase pattern, though its frequency of rapid change is lower compared to FQ-PIE and L4S. This behavior is brought about by FQ-CoDel’s behavior of only using ECN notification instead of dropping packets in extreme congestion conditions. When ECN is disabled in Figure 39a, FQ-CoDel shows a sawtooth pattern in its cwnd with a higher frequency of dips and rises compared to FQ-PIE and L4S, regardless of ECN with a lower maximum cwnd size. Like Scenario 1, it directly influences the total data transferred throughout the multiple connections, as seen in Table 2, which is lower than its L4S and FQ-PIE competitors when ECN is disabled but not as exaggerated as in Scenario 1 because of its low bandwidth.
Similar to Scenario 1, In the FQ-PIE and L4S algorithm, regardless of ECN (Figure 38b,c and Figure 39b,c), the cwnd displays a sawtooth pattern demonstrating NewReno’s aggressive behavior in adapting optimal cwnd values.

7. Conclusions and Future Work

In this paper, we conducted a comprehensive analysis of various AQM algorithms, including our implementation of a preliminary architecture of L4S in the FreeBSD network stack. We conducted extensive research. For this purpose, we created two network scenarios, one with high bandwidth and the other with low bandwidth. We assessed their performance in a scenario where multiple TCP connections compete in the same bottleneck. Our findings revealed that L4S exhibits very low RTT in low-bandwidth conditions, nearly a second faster than its competitors while maintaining a high level of throughput.
Furthermore, we have developed an innovative hybrid A3C-L4S approach to enhance network performance, specifically for latency-sensitive applications. This approach leverages the multi-agent and asynchronous nature of A3C to enhance exploration and adaptability while minimizing resource consumption on the routers. It is a novel addition to network management, offering a unique solution to enhancing network performance. The A3C model can converge properly, learning the intricate relationship between the drop probability and the queuing delay, further enhancing the adaptability of our approach.
The potential of leveraging the L4S architecture in FreeBSD with a deep-reinforcement learning model like A3C to optimize the gaps in our network infrastructure is immense. This combination can make our network more suitable for a specific type of latency-sensitive data. However, there is a need to optimize both the TCP and AQM sides of L4S to respond faster to real-time network traffic, in which A3C plays a significant role. We are also exploring the energy efficiency of the final system and how we can adjust the model parameters to consume fewer resources while maintaining an enhanced performance.
In our future work, we aim to dedicate more time to fine-tuning the A3C model by training it on larger datasets. Additionally, we intend to deploy the model directly into the kernel and utilize an online learning approach for training. This would enable the model to continuously learn and adapt in real time. The communication between kernel space and user space would also introduce some delay, which would be negligible under typical conditions, but we have to explore the other scenarios, especially under high load. The perfect solution would be directly coding the machine learning algorithm in the kernel, which has difficulties. Moreover, we intend to explore using the UDP protocol in our research. UDP is well-suited for applications where low latency and high throughput are prioritized, and reliability is not critical. By leveraging UDP, we can cater to latency-sensitive applications that require efficient data transmission.
Building on the prior research in [38], which focused on implementing an ML-based multi-path TCP, we see potential in collaborating with source control protocols like TCP and UDP, along with network devices such as routers and switches [38]. Exploring the interactions and optimizations between these components could lead to significant network performance and efficiency advancements. By combining the strengths of machine learning, protocols like TCP and UDP, and network devices, we can enhance the overall performance, reliability, and adaptability of future network systems.

Author Contributions

Conceptualization, J.K. and S.R.P.; Methodology, J.K. and S.R.P.; Software, J.K.; Validation, D.S.; Formal analysis, D.S.; Investigation, D.S. and S.R.P.; Data curation, D.S.; Writing—original draft, D.S.; Writing—review & editing, J.K. and S.R.P.; Visualization, D.S.; Supervision, J.K. and S.R.P.; Project administration, S.R.P.; Funding acquisition, J.K. and S.R.P. All authors have read and agreed to the published version of the manuscript.

Funding

This research is funded by the 2023 Information Society Innovation Fund (ISIF Asia) through the APNIC Foundation.

Data Availability Statement

Experimental implementation and results presented in this paper are made available through the following GitHub repositories. Experimental L4S implementation in FreeBSD 13.1: https://github.com/MPTCP-FreeBSD/FB13.1-AQM-L4S-SRC.git; A3C implementation and analysis: https://github.com/MPTCP-FreeBSD/FreeBSD-DRL-L4S.git (accessed on 18 July 2024).

Conflicts of Interest

The authors declare no conflicts of interest.

References

  1. Gettys, J.; Nichols, K. Bufferbloat: Dark Buffers in the Internet: Networks without effective AQM may again be vulnerable to congestion collapse. Queue 2011, 9, 40–54. [Google Scholar] [CrossRef]
  2. Floyd, S.; Jacobson, V. Random early detection gateways for congestion avoidance. IEEE/ACM Trans. Netw. 1993, 1, 397–413. [Google Scholar] [CrossRef]
  3. Kua, J.; Armitage, G.; Branch, P. A survey of rate adaptation techniques for dynamic adaptive streaming over HTTP. IEEE Commun. Surv. Tutorials 2017, 19, 1842–1866. [Google Scholar] [CrossRef]
  4. Kua, J.; Armitage, G.; Branch, P.; But, J. Adaptive Chunklets and AQM for higher-performance content streaming. Acm Trans. Multimed. Comput. Commun. Appl. (TOMM) 2019, 15, 1–24. [Google Scholar] [CrossRef]
  5. Hoeiland-Joergensen, T.; McKenney, P.; Taht, D.; Gettys, J.; Dumazet, E. The Flow Queue Codel Packet Scheduler and Active Queue Management Algorithm. Technical Report. 2018. Available online: https://www.rfc-editor.org/rfc/rfc8290.html (accessed on 18 July 2024).
  6. Pan, R.; Natarajan, P.; Baker, F.; White, G. Proportional Integral Controller Enhanced (PIE): A Lightweight Control Scheme to Address the Bufferbloat Problem. RFC 8033. 2017. Available online: https://www.rfc-editor.org/info/rfc8033 (accessed on 18 July 2024).
  7. White, G.; Pan, R. Active Queue Management (AQM) Based on Proportional Integral Controller Enhanced (PIE) for Data-Over-Cable Service Interface Specifications (DOCSIS) Cable Modems. RFC 8034. 2017. Available online: https://www.rfc-editor.org/info/rfc8034 (accessed on 18 July 2024).
  8. Cardozo, T.B.; da Silva, A.P.C.; Vieira, A.B.; Ziviani, A. Bufferbloat systematic analysis. In Proceedings of the 2014 International Telecommunications Symposium (ITS), Sao Paulo, Brazil, 17–20 August 2014; IEEE: Piscataway, NJ, USA, 2014; pp. 1–5. [Google Scholar]
  9. Ahammed, G.; Banu, R. Anakyzing the performance of active queue management algorithms. arXiv 2010, arXiv:1003.3909. [Google Scholar]
  10. Kua, J.; Nguyen, S.H.; Armitage, G.; Branch, P. Using active queue management to assist IoT application flows in home broadband networks. IEEE Internet Things J. 2017, 4, 1399–1407. [Google Scholar] [CrossRef]
  11. Kua, J.; Branch, P.; Armitage, G. Detecting bottleneck use of pie or fq-codel active queue management during dash-like content streaming. In Proceedings of the 2020 IEEE 45th Conference on Local Computer Networks (LCN), Sydney, Australia, 16–19 November 2020; IEEE: Piscataway, NJ, USA, 2020; pp. 445–448. [Google Scholar]
  12. Amol, D.; Rajesh, P. A review on active queue management techniques of congestion control. In Proceedings of the 2014 International Conference on Electronic Systems, Signal Processing and Computing Technologies; IEEE: Piscataway, NJ, USA, 2014; pp. 166–169. [Google Scholar]
  13. Nichols, K.; Jacobson, V. Controlling queue delay. Commun. ACM 2012, 55, 42–50. [Google Scholar] [CrossRef]
  14. Hoeiland-Joergensen, T.; McKenney, P.; Taht, D.; Ghettys, J.; Dumazet, E. Flowqueue-Codel: Draft-Hoeiland-Joergensen-Aqm-fq-Codel-00. 2014. Available online: https://datatracker.ietf.org/doc/draft-ietf-aqm-fq-codel/00/ (accessed on 18 July 2024).
  15. Ramakrishnan, G.; Bhasi, M.; Saicharan, V.; Monis, L.; Patil, S.D.; Tahiliani, M.P. FQ-PIE queue discipline in the Linux kernel: Design, implementation and challenges. In Proceedings of the 2019 IEEE 44th LCN Symposium on Emerging Topics in Networking (LCN Symposium), Osnabrück, Germany, 14–17 October 2019; IEEE: Piscataway, NJ, USA, 2019; pp. 117–124. [Google Scholar]
  16. Al-Saadi, R.; Armitage, G. Dummynet AQM v0. 2–CoDel, FQ-CoDel, PIE and FQ-PIE for FreeBSD’s ipfw/Dummynet Framework; Tech. Rep. A 160418; Centre for Advanced Internet Architectures, Swinburne University of Technology: Melbourne, Australia, 2016; p. 18. [Google Scholar]
  17. Ramakrishnan, K.; Floyd, S.; Black, D. The Addition of Explicit Congestion Notification (ECN) to IP. Technical Report. 2001. Available online: https://www.rfc-editor.org/rfc/rfc3168.html (accessed on 18 July 2024).
  18. De Schepper, K.; Albisser, O.; Tilmans, O.; Briscoe, B. Dual Queue Coupled AQM: Deployable Very Low Queuing Delay for All. arXiv 2022, arXiv:2209.01078. [Google Scholar]
  19. Schepper, K.D.; Briscoe, B.; White, G. Dual-Queue Coupled Active Queue Management (AQM) for Low Latency, Low Loss, and Scalable Throughput (L4S). RFC 9332. 2023. Available online: https://www.rfc-editor.org/info/rfc9332 (accessed on 18 July 2024).
  20. Hollot, C.V.; Misra, V.; Towsley, D.; Gong, W.B. On designing improved controllers for AQM routers supporting TCP flows. In Proceedings of the IEEE INFOCOM 2001 Conference on Computer Communications, Twentieth Annual Joint Conference of the IEEE 61 Computer and Communications Society (Cat. No.01CH37213), Anchorage, AK, USA, 22–26 April 2001; IEEE: Piscataway, NJ, USA, 2001; Volume 3, pp. 1726–1734. [Google Scholar] [CrossRef]
  21. Szyguła, J.; Domański, A.; Domańska, J.; Marek, D.; Filus, K.; Mendla, S. Supervised Learning of Neural Networks for Active Queue Management in the Internet. Sensors 2021, 21, 4979. [Google Scholar] [CrossRef] [PubMed]
  22. Su, Y.; Huang, L.; Feng, C. QRED: A Q-learning-based active queue management scheme. J. Internet Technol. 2018, 19, 1169–1178. [Google Scholar]
  23. Liu, J.; Wei, D. Active Queue Management Based on Q-Learning Traffic Predictor. In Proceedings of the 2022 International Conference on Cyber-Physical Social Intelligence (ICCSI), Nanjing, China, 18–21 November 2022; IEEE: Piscataway, NJ, USA, 2022; pp. 399–404. [Google Scholar]
  24. Gomez, C.A.; Wang, X.; Shami, A. Intelligent active queue management using explicit congestion notification. In Proceedings of the 2019 IEEE Global Communications Conference (GLOBECOM), Waikoloa, HI, USA, 9–13 December 2019; IEEE: Piscataway, NJ, USA, 2019; pp. 1–6. [Google Scholar]
  25. Ma, H.; Xu, D.; Dai, Y.; Dong, Q. An intelligent scheme for congestion control: When active queue management meets deep reinforcement learning. Comput. Netw. 2021, 200, 108515. [Google Scholar] [CrossRef]
  26. Kim, M.; Jaseemuddin, M.; Anpalagan, A. Deep reinforcement learning based active queue management for iot networks. J. Netw. Syst. Manag. 2021, 29, 34. [Google Scholar] [CrossRef]
  27. Fawaz, H.; Zeghlache, D.; Pham, Q.T.A.; Jérémie, L.; Medagliani, P. Deep Reinforcement Learning for Smart Queue Management. In Proceedings of the NETSYS 2021: Conference on Networked Systems 2021, Lübeck, Germany, 13–16 September 2021; pp. 1–14. Available online: https://hal.archives-ouvertes.fr/hal-03546621 (accessed on 18 July 2024).
  28. Albisser, O.; De Schepper, K.; Briscoe, B.; Tilmans, O.; Steen, H. DUALPI2—Low Latency, Low Loss and Scalable Throughput (L4S) AQM. In Proceedings of the Linux Netdev 0x13, Prague, Czech Republic, 20–22 March 2019; pp. 1–8. Available online: https://www.netdevconf.org/0x13/session.html?talk-DUALPI2-AQM (accessed on 18 July 2024).
  29. Briscoe, B.; Schepper, K.D.; Bagnulo, M.; White, G. Low Latency, Low Loss, and Scalable Throughput (L4S) Internet Service: Architecture. RFC 9330. 2023. Available online: https://www.rfc-editor.org/info/rfc9330 (accessed on 18 July 2024).
  30. De Schepper, K.; Bondarenko, O.; Tsang, I.J.; Briscoe, B. Pi2: A linearized aqm for both classic and scalable tcp. In Proceedings of the 12th International on Conference on emerging Networking EXperiments and Technologies, Irvine, CA, USA, 12–15 December 2016; pp. 105–119. [Google Scholar]
  31. Briscoe, B. PI2 Parameters. arXiv 2021, arXiv:2107.01003. [Google Scholar]
  32. Mnih, V.; Badia, A.P.; Mirza, M.; Graves, A.; Lillicrap, T.; Harley, T.; Silver, D.; Kavukcuoglu, K. Asynchronous methods for deep reinforcement learning. In Proceedings of the International Conference on Machine Learning. PMLR, New York, NY, USA, 19–24 June 2016; pp. 1928–1937. [Google Scholar]
  33. Palamuttam, R.; Chen, W. Vision Enhanced Asynchronous Advantage Actor-Critic on Racing Games. Methods 2017, 4, A3C. [Google Scholar]
  34. Stewart, L.; Healy, J. Characterising the Behaviour and Performance of SIFTR v1. 1.0. Technical Report, CAIA, Tech. Rep. 2007. Available online: http://caia.swinburne.edu.au/reports/070824A/CAIA-TR-070824A.pdf (accessed on 18 July 2024).
  35. The Tcpdump Group. Tcpdump. Available online: https://www.tcpdump.org/ (accessed on 12 July 2024).
  36. Dpkt Contributors. Dpkt. Available online: https://pypi.org/project/dpkt/ (accessed on 12 July 2024).
  37. Wireshark Foundation. Wireshark. Available online: https://www.wireshark.org/ (accessed on 12 July 2024).
  38. Pokhrel, S.R.; Kua, J.; Satish, D.; Ozer, S.; Howe, J.; Walid, A. DDPG-MPCC: An Experience Driven Multipath Performance Oriented Congestion Control. Future Internet 2024, 16, 37. [Google Scholar] [CrossRef]
Figure 1. L4S AQM Architecture.
Futureinternet 16 00265 g001
Figure 2. A3C coupled L4S Architecture.
Futureinternet 16 00265 g002
Figure 3. Network topology utilized for evaluating AQM algorithms.
Futureinternet 16 00265 g003
Figure 4. Case 1: CoDel (ECN enabled)—Scenario 1 with Bandwidth = 10 Mbps, Delay = 20 ms. (a) Throughput; (b) Congestion Window; (c) Smoothed TCP RTT.
Futureinternet 16 00265 g004
Figure 5. Case 2: CoDel (ECN disabled)—Scenario 1 with Bandwidth = 10 Mbps, Delay = 20 ms. (a) Throughput; (b) Congestion Window; (c) Smoothed TCP RTT.
Futureinternet 16 00265 g005
Figure 6. Case 1: CoDel (ECN enabled)—Scenario 2 with Bandwidth = 1 Mbps, Delay = 20 ms. (a) Throughput; (b) Congestion Window; (c) Smoothed TCP RTT.
Futureinternet 16 00265 g006
Figure 7. Case 2: CoDel (ECN disabled)—Scenario 2 with Bandwidth = 1 Mbps, Delay = 20 ms. (a) Throughput; (b) Congestion Window; (c) Smoothed TCP RTT.
Futureinternet 16 00265 g007
Figure 8. Case 1: PIE (ECN enabled)—Scenario 1 with Bandwidth = 10 Mbps, Delay = 20 ms. (a) Throughput; (b) Congestion Window; (c) Smoothed TCP RTT.
Futureinternet 16 00265 g008
Figure 9. Case 2: PIE (ECN disabled)—Scenario 1 with Bandwidth = 10 Mbps, Delay = 20 ms. (a) Throughput; (b) Congestion Window; (c) Smoothed TCP RTT.
Futureinternet 16 00265 g009
Figure 10. Case 1: PIE (ECN enabled)—Scenario 2 with Bandwidth = 1 Mbps, Delay = 20 ms. (a) Throughput; (b) Congestion Window; (c) Smoothed TCP RTT.
Futureinternet 16 00265 g010
Figure 11. Case 2: PIE (ECN disabled)—Scenario 2 with Bandwidth = 1 Mbps, Delay = 20 ms. (a) Throughput; (b) Congestion Window; (c) Smoothed TCP RTT.
Futureinternet 16 00265 g011
Figure 12. Case 1: FQ-CoDel (ECN enabled)—Scenario 1 with Bandwidth = 10 Mbps, Delay = 20 ms. (a) Throughput; (b) Congestion Window; (c) Smoothed TCP RTT.
Futureinternet 16 00265 g012
Figure 13. Case 2: FQ-CoDel (ECN disabled)—Scenario 1 with Bandwidth = 10 Mbps, Delay = 20 ms. (a) Throughput; (b) Congestion Window; (c) Smoothed TCP RTT.
Futureinternet 16 00265 g013
Figure 14. Case 1: FQ-CoDel (ECN enabled)—Scenario 2 with Bandwidth = 1 Mbps, Delay = 20 ms. (a) Throughput; (b) Congestion Window; (c) Smoothed TCP RTT.
Futureinternet 16 00265 g014
Figure 15. Case 2: FQ-CoDel (ECN disabled)—Scenario 2 with Bandwidth = 1 Mbps, Delay = 20 ms. (a) Throughput; (b) Congestion Window; (c) Smoothed TCP RTT.
Futureinternet 16 00265 g015
Figure 16. Case 1: FQ-PIE (ECN enabled)—Scenario 1 with Bandwidth = 10 Mbps, Delay = 20 ms. (a) Throughput; (b) Congestion Window; (c) Smoothed TCP RTT.
Futureinternet 16 00265 g016
Figure 17. Case 2: FQ-PIE (ECN disabled)—Scenario 1 with Bandwidth = 10 Mbps, Delay = 20 ms. (a) Throughput; (b) Congestion Window; (c) Smoothed TCP RTT.
Futureinternet 16 00265 g017
Figure 18. Case 1: FQ-PIE (ECN enabled)—Scenario 2 with Bandwidth = 1 Mbps, Delay = 20 ms. (a) Throughput; (b) Congestion Window; (c) Smoothed TCP RTT.
Futureinternet 16 00265 g018
Figure 19. Case 2: FQ-PIE (ECN disabled)—Scenario 2 with Bandwidth = 1 Mbps, Delay = 20 ms. (a) Throughput; (b) Congestion Window; (c) Smoothed TCP RTT.
Futureinternet 16 00265 g019
Figure 20. Case 1: L4S (ECN enabled)—Scenario 1 with Bandwidth = 10 Mbps, Delay = 20 ms. (a) Throughput; (b) Congestion Window; (c) Smoothed TCP RTT.
Futureinternet 16 00265 g020
Figure 21. Case 2: L4S (ECN disabled)—Scenario 1 with Bandwidth = 10 Mbps, Delay = 20 ms. (a) Throughput; (b) Congestion Window; (c) Smoothed TCP RTT.
Futureinternet 16 00265 g021
Figure 22. Case 1: L4S (ECN enabled)—Scenario 2 with Bandwidth = 1 Mbps, Delay = 20 ms. (a) Throughput; (b) Congestion Window; (c) Smoothed TCP RTT.
Futureinternet 16 00265 g022
Figure 23. Case 2: L4S (ECN disabled)—Scenario 2 with Bandwidth = 1 Mbps, Delay = 20 ms. (a) Throughput; (b) Congestion Window; (c) Smoothed TCP RTT.
Futureinternet 16 00265 g023
Figure 24. Network topology utilized for data collection for A3C-L4S model.
Futureinternet 16 00265 g024
Figure 25. Evolution of the average reward ( R t ) of the trained A3C model over the entire fifty epochs.
Futureinternet 16 00265 g025
Figure 26. Predicted queue delay vs. actual queue delay for all workers during packet transmission. (a) Predicted QDelay vs. Actual QDelay—Agent Worker 1; (b) Predicted QDelay vs. Actual QDelay—Agent Worker 2; (c) Predicted QDelay vs. Actual Qdelay—Agent Worker 3; (d) Predicted QDelay vs. Actual Qdelay—Agent Worker 4.
Futureinternet 16 00265 g026
Figure 27. Predicted queue delay vs. actual queue delay for all workers with varying reward scaling factor in units of 100 μs. (a) Predicted QDelay with varying reward scaling factor Agent Worker 1; (b) Predicted QDelay with varying reward scaling factor Agent Worker 2; (c) Predicted QDelay with varying reward scaling factor Agent Worker 3; (d) Predicted QDelay with varying reward scaling factor Agent Worker 4.
Futureinternet 16 00265 g027aFutureinternet 16 00265 g027b
Figure 28. Case 1: (ECN enabled) Throughput Scenario 1 with Bandwidth = 10 Mbps, Delay = 20 ms. (a) FQ-CoDel (Throughput); (b) FQ-PIE (Throughput); (c) L4S (Throughput).
Futureinternet 16 00265 g028
Figure 29. Case 2: (ECN disabled) Throughput Scenario 1 with Bandwidth = 10 Mbps, Delay = 20 ms. (a) FQ-CoDel (Throughput); (b) FQ-PIE (Throughput); (c) L4S (Throughput).
Futureinternet 16 00265 g029
Figure 30. Case 1: (ECN enabled) Throughput Scenario 2 with Bandwidth = 1 Mbps, Delay = 20 ms. (a FQ-CoDel (Throughput)); (b) FQ-PIE (Throughput); (c) L4S (Throughput).
Futureinternet 16 00265 g030
Figure 31. Case 2: (ECN disabled) Throughput Scenario 2 with Bandwidth = 1 Mbps, Delay = 20 ms. (a) FQ-CoDel (Throughput); (b) FQ-PIE (Throughput); (c) L4S (Throughput).
Futureinternet 16 00265 g031
Figure 32. Case 1: (ECN enabled) Smoothed TCP RTT measured in seconds for Scenario 1 with Bandwidth = 10 Mbps, Delay = 20 ms. (a) FQ-CoDel (Smoothed RTT); (b) FQ-PIE (Smoothed RTT); (c) L4S (Smoothed RTT).
Futureinternet 16 00265 g032
Figure 33. Case 2: (ECN disabled) Smoothed TCP RTT measured in seconds for Scenario 1 with Bandwidth = 10 Mbps, Delay = 20 ms. (a) FQ-CoDel (Smoothed RTT); (b) FQ-PIE (Smoothed RTT); (c) L4S (Smoothed RTT).
Futureinternet 16 00265 g033
Figure 34. Case 1: (ECN enabled) Smoothed TCP RTT measured in seconds for Scenario 2 with Bandwidth = 1 Mbps, Delay = 20 ms. (a) FQ-CoDel (Smoothed RTT); (b) FQ-PIE (Smoothed RTT); (c) L4S (Smoothed RTT).
Futureinternet 16 00265 g034
Figure 35. Case 2:(ECN disabled) Smoothed TCP RTT measured in seconds for Scenario 2 with Bandwidth = 1 Mbps, Delay = 20 ms. (a) FQ-CoDel (Smoothed RTT); (b) FQ-PIE (Smoothed RTT); (c) L4S (Smoothed RTT).
Futureinternet 16 00265 g035
Figure 36. Case 1: (ECN enabled) Congestion Window Scenario 1 with Bandwidth = 10 Mbps, Delay = 20 ms. (a) FQ-CoDel (cwnd); (b) FQ-PIE (cwnd); (c) L4S (cwnd).
Futureinternet 16 00265 g036
Figure 37. Case 2: (ECN disabled) Congestion Window Scenario 1 with Bandwidth = 10 Mbps, Delay = 20 ms. (a) FQ-CoDel (cwnd); (b) FQ-PIE (cwnd); (c) L4S (cwnd).
Futureinternet 16 00265 g037
Figure 38. Case 1: (ECN enabled) Congestion Window Scenario 2 with Bandwidth = 1 Mbps, Delay = 20 ms. (a) FQ-CoDel (cwnd); (b) FQ-PIE (cwnd); (c) L4S (cwnd).
Futureinternet 16 00265 g038
Figure 39. Case 2:(ECN disabled) Congestion Window Scenario 2 with Bandwidth = 1 Mbps, Delay = 20 ms. (a) FQ-CoDel (cwnd); (b) FQ-PIE (cwnd); (c) L4S (cwnd).
Futureinternet 16 00265 g039
Table 1. FreeBSD AQM L4S Terminology.
VariableDefinition
burst_allowanceMaximum allowed burst size of packets before congestion control measures are applied.
drop_probProbability of dropping a packet when the queue is congested.
current_qdelayCurrent queue delay, which is the time a packet spends in the queue before being transmitted.
qdelay_oldPrevious queue delay value used for comparison and calculation in the FQ-PIE algorithm.
accu_probAccumulated probability value used in FQ-PIE to determine the drop probability for incoming packets.
measurement_startStart time of the measurement interval for collecting statistics.
tot_pktsTotal number of packets observed during the measurement interval.
tot_bytesTotal number of bytes observed during the measurement interval.
lengthAverage length (in packets) of the queue during the measurement interval.
len_bytesAverage length (in bytes) of the queue during the measurement interval.
dropsNumber of packets dropped during the measurement interval.
ECNis a packet flag marked with explicit congestion notification (ECN) during the measurement interval.
actionAction taken by the A3C algorithm
rewardReward or penalty assigned to a specific action taken by the A3C algorithm.
Table 2. Total data transferred (including retransmissions) in the experiment.
AQM AlgorithmData Transferred (Mbytes)—NoECNData Transferred (Mbytes)—ECN
CoDel Scenario 10 Mbps46.57463841.101404
CoDel Scenario 1 Mbps4.9381264.523826
PIE Scenario 10 Mbps50.33971245.790667
PIE Scenario 1 Mbps4.9761136.371356
FQ-CoDel Scenario 10 Mbps38.92891353.030176
FQ-CoDel Scenario 1 Mbps5.2453585.571887
FQ-PIE Scenario 10 Mbps47.98454548.413749
FQ-PIE Scenario 1 Mbps5.3893625.438388
L4S Scenario 10 Mbps48.19689348.748529
L4S Scenario 1 Mbps5.6766795.159440
Disclaimer/Publisher’s Note: The statements, opinions and data contained in all publications are solely those of the individual author(s) and contributor(s) and not of MDPI and/or the editor(s). MDPI and/or the editor(s) disclaim responsibility for any injury to people or property resulting from any ideas, methods, instructions or products referred to in the content.