1. Introduction
With the rise of cloud-native development practices [
1,
2], it has been critical to bring agility to legacy apps through application modernization. The primary objective in any modernization roadmap revolves around application assessment through the discovery of application interactions, interdependencies as well as boundaries to help rationalize application portfolio and architecture and a wide range of other modernization activities. Companies, such as Amazon, IBM, Microsoft, and Deloitte, employ application discovery (AD) methodologies to enable enterprise customers to obtain visibility into the configuration, usage and behavior of workloads running on their infrastructure [
3]. Moreover, the discovery and understanding of applications is critical in terms of creating relevant inventories of technical assets, improving maintenance and operations as well as significantly reducing risk in response to ongoing business needs. Cloud vendors tend to enhance their data center management portfolios with application-aware management capabilities. This introduces flexibility for customers to leverage tools and identify workloads [
4] that necessarily make up an application and manage/troubleshoot their data centers with a solid understanding of inter-dependencies, communication patterns and potential problems related to those applications. As modern multi-cloud environments advance rapidly with ever-growing complexities, it becomes challenging to accurately define highly dynamic application boundaries. As of this, the application definition itself can reflect different interpretations across different products. Most services usually leverage a combination of workload naming conventions, workload tags, security tags and groups to establish application boundaries in their discovery engines. There are yet other approaches (e.g., AWS Application Discovery Service) that incorporate agent-based AD methodologies capturing system configuration, system performance, running processes and details of the network connections between systems [
5]. They necessarily gather and process information corresponding to server hostnames, IP addresses as well as resource allocation and utilization details related to virtual machine (VM) inventory, configuration and performance history such as CPU, memory and disk usage data [
6]. Microsoft [
7] and IBM [
8] solutions on AD verify logs against an existing catalog of applications. Although all these solutions in industry address a variety of significant use cases in application-aware management frontiers, the accuracy and performance of the underlying models heavily rely on rich and available metadata to be in place. Overall, AD remains an important and complicated administration task under the emerging multi-cloud management paradigm that some vendors drive their vision to.
Our proposal (ADLog) takes a novel approach to the AD problem from the log data of cloud sources and fully AI-driven perspectives. It is an attempt to employ unsupervised machine learning to modeling the log streams of cloud resources monitored by Aria Ops for Logs (former Realize Log Insight or vR LI) [
9]. Log data contain a contextually rich behavioral fingerprint of the underlying application. Therefore, we consider this as a more reliable and unbiased source for characterizing the nature of applications and discriminate those in terms of both their kinds and instances through the relevant workload patterns. Building on this intuition, our prototype solution verifies a hypothesis on whether event type (ET) meta-constructs by Log Insight [
9] and their distributions are indicative enough of fingerprint applications across their dynamism in time. ETs were previously utilized in intelligent log analytics in identifying anomalies, changes and sickness status of IT resources (e.g., [
10]), as well as for problem’s root cause analysis purposes, where explainable ML plays an important role in terms of the adoptability of generated recommendations [
11]. These are abstract groups of similar messages performing dimensionality reduction of the original log data. Users leverage ET representations in various tasks to interactively analyze log streams. An extra functionality (event trends) on top of ETs enables users to compare two time intervals in the log stream and identify increasing or decreasing types of messages and locate sub-streams of interest.
We share results from our initial experimental work on a set of applications available to us in corporate internal environments. ADLog demonstrates highly accurate grouping outcomes of application entities and their deployment instances, monitored and modeled with the above-mentioned ET distributions. We believe that based on this research, cloud management solutions can be furnished with a relevant log-driven discovery capability, which is sufficiently reliable to be delivered as a standalone feature/recommender system for users to infer their map of app components, as well as enhance the existing AD solutions from a new angle.
We review the related work in
Section 2 and our methodology in
Section 3 with experimental set-up details. Evaluation of obtained results is provided in
Section 4, while
Section 5 covers discussion points and concluding notes.
2. Related Work
VMware enables its customers with a variety of approaches to define applications within their products through cloud management and deployment tools (such as Configuration Management Databases, Aria for Automation [
12], Aria Operations (former vRealize Ops or vR Ops) [
13]), where customers can manually establish application definitions, specify application dependencies across different entities in datacenter and define application blueprints among the resources in use. Additionally, customers can incorporate properties on their deployed entities as well as tags and naming conventions to identify specific resources that belong to subjective applications. Whereas all these approaches might serve well in specific use cases, they all expose drawbacks in terms of consistency in deviations from true application topologies over time. Current AD offerings include the Service and Application Discovery by Aria Ops [
14] and the network Flow-Based Application Discovery (FBAD) [
4] within Aria Ops for Networks [
15]. The problem of AD can also be tackled from additional perspectives which utilize the configuration properties of IT objects and their naming conventions.
From application monitoring, integration and management perspectives, Aria Ops enables Service Discovery (SD) for services running in each VM to build relationships or dependency between those from different VMs. With this, SD leverages VMware tools to discover some known services, but it limits the scope, in which the applications are only discovered within specific contexts of those services connected to each other. On the other hand, FBAD leverages network traffic flows from either the vSphere Distributed Switch [
16] or NSX [
17] and applies ML techniques (such as disconnected component and outlier detection) to discover application boundaries automatically [
4]. Whereas the flow-based discovery approach groups application components based on their runtime behaviors, it is generally not capable of accurately capturing the components (e.g., VMs in “dev”, “production” or “staging” environments) of a true application that are yet to be isolated in the network. Unlike FBAD, object tags and property-based approaches drive the discovery and ML-based inference of potential applications solely based on the configuration properties of compute entities and tags as an additional source for entity labeling from automated datacenter naming systems (not always available).
Even though these methods can serve as several successful use cases in the AD frontier, they heavily rely on the availability and propriety of contextual representations of data to train accurate and robust ML models. Due to the difference in methodologies, in assumptions and use cases of those as well as in dissimilar specifics of environment conditions, the understanding of application topology across different end-use cases remains a state-of-the-art challenge for all these existing approaches. As a result, the AD itself exposes significant bias toward the source of information used in the discovery process.
Unfortunately, the above-mentioned ML-driven approaches to AD are described only in internal technical papers and are not disclosed academically for proper and accessible references. Moreover, there is a lack of a scientifically systematic treatment of the AD problem especially from the perspectives of unsupervised ways of learning the nature of cloud assets/objects. On the other hand, researchers are focused more on designing frameworks for the discovery of relevant cloud services for a given application rather than categorizing compute instances in a cloud environment subject to common behaviors of its components, as we observe in the review paper by Agbaegbu et al. [
18] on ontologies in cloud computing and the respective references [
19,
20,
21,
22,
23,
24] therein.
Apart from application reconciliation and curation roadmap, it has become critical to serve a variety of scenarios in different environments, by focusing on the co-existence of different sources of discovery independently. With this, there is no prior art looking into the AD problem from log data perspectives of services which contains contextually rich information about the underlying applications and infrastructures. This paper makes a preliminary validation of the viability of an approach which is based on log data characteristics, applies no expert knowledge and is completely unsupervised.
3. Materials and Methods
Log monitoring and analytics platforms (such as Aria Ops for Logs) collect logs through agent-based and agentless methods and API integrations. The logs can be in various formats such as Syslog, Windows event logs and custom application logs. The log management solutions normalize, parse and index these logs, making them searchable and analyzable for effective pattern detection and troubleshooting. In the context of our study, the analysis below based on particular cloud vendor concepts is exemplary, since the proposed methods rely on abstract constructs of the distributions of log messages, making them universally applicable in any other cloud eco-system where these distributions can be derived accordingly.
Based on the introductory discussion, our objective in this study was to investigate
whether log sources of IT resources within a common cloud management service can be reliably leveraged for identifying underlying applications in a context-independent manner;
what ML approaches could be adopted for automating such a task.
Our approach in identifying similar groups of entities relies on hierarchical clustering of relevant log sources based on their ET (probability) distributions sampled across a time axis with an aggregation interval. Then, to evaluate the quality of such an approach, we need to compare the obtained groups of sources with the true structure of apps under investigation.
The full solution under our vision contains a recommender system running on trained ML models and advising users on discovered app maps, as well as dynamic changes occurring in those. Additionally, we can automatically reconstruct/prescribe application kinds while enriching detected groups with indicative messages behind dominant ETs using NLP or word clouds for user validation and continuous operator-in-the-loop improvement of the ML method.
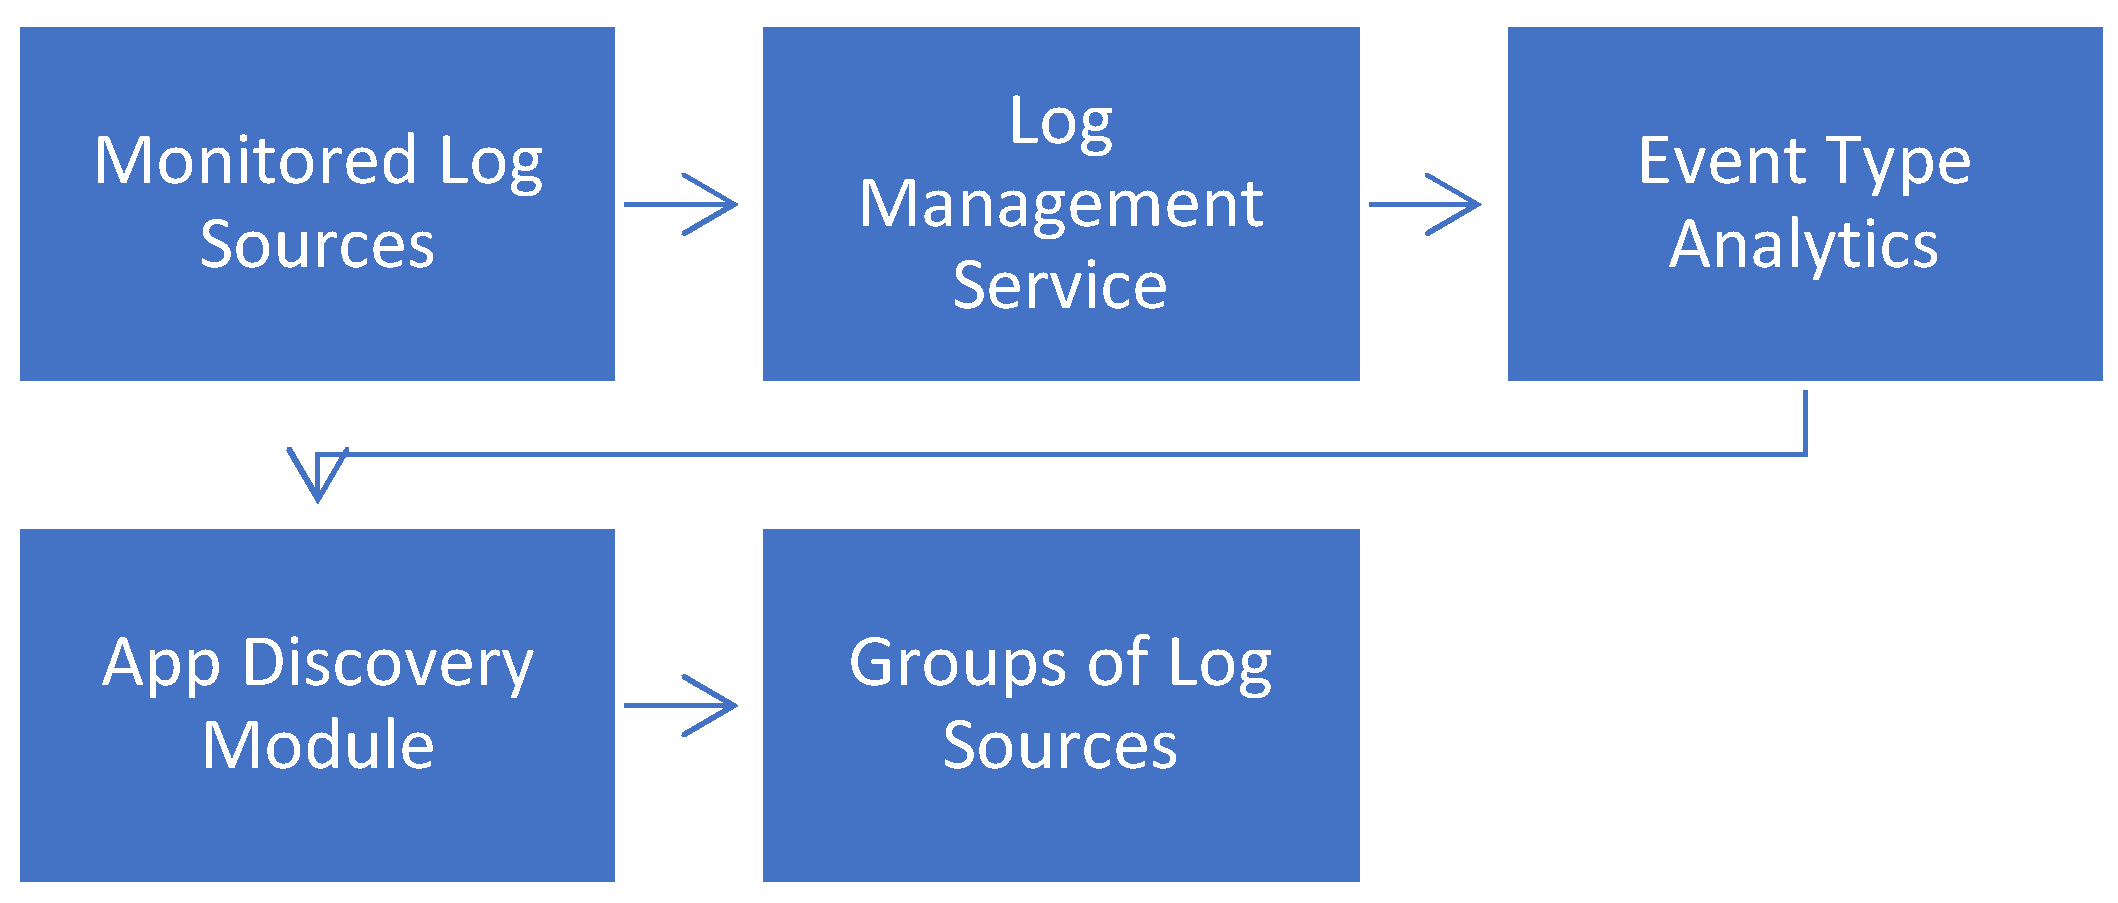
A high-level architectural representation of the proposed system (ADLog) is depicted in the diagram of
Figure 1. Monitored log messages of heterogeneous applications flowing into an intelligent log management service are analyzed for their ETs and related probability distributions, which are then fed into the AD engine. This module identifies similarity groups of those sources using ML approaches.
On top of such an architecture and analysis, the discovered groups of log sources can be used to fuel another recommender system. This system (out of scope of our study) can suggest potential components of an application (entity baskets) to cloud users. These groups can then be approved as valid applications and transferred into a specific management mode. Furthermore, these applications and components can be tagged, labeled and enriched with additional metadata. This enrichment process helps operators optimize and monitor the performance of their ecosystems in a more application-centric manner.
3.1. Experimental Set up for ADLog
To evaluate the ET-based grouping method, it is applied to a set of applications with ground truths coming from SD in Aria Ops (which is approved and labeled by developers) and from Engineering Services managing various internally deployed applications.
Monitored Applications
The ground truth applications monitored in Aria for Logs are listed in
Table 1. The kinds of applications and status (whether it is a standalone instance although of the same kind, like ESX16 in the table) of entities within those applications are also indicated. The list includes vR Ops and vR LI apps with relevant services discovered by SD. This adapter or management pack-based discovery mechanism executes commands in the guest operating system (OS) of the corresponding VMs and finds out which services are running and which ones communicate through ports. The discovered applications can be both predefined and custom. In particular, the vR Ops application instance (of
Table 1) consists of two VM nodes. There are multiple services in this app, for instance, “vROps Analytics” which performs data manipulation and learning tasks such as typical ranges of time series metrics for anomaly detection. Those services are hosted by different VMs; however, they are part of the same “vRealize Operations” application. Another application discovered by SD is “vRLI” (
Table 1). There are three nodes in the application and each of them are connected to the other node through services. Both applications definitely exist in the monitored environment. The rest of the applications in
Table 1 are confirmed by the engineering teams dealing with internally deployed apps under the monitoring of Aria Ops for Logs. For instance, F5 load balancer has two distinct instances. Analogously, the host esx16 is not a part of the same service application consisting of the rest of the nine hosts, but a different service running with an NSX.
An AD method has to learn and distinguish the applications in
Table 1, subject to their kind and deployment instances ideally. This list of applications of various natures serves as an exemplary set of log sources against which we demonstrate the viability of our methods in terms of their high-accuracy classification.
An examplary ET distribution charting over a time axis is depicted for the load balancer application F5 in
Figure 2. For each time interval, the relative presence of ETs can be converted to relevant probability distributions (as discribed in the prior art literature, as well as in the next subsection). Our ML analysis deals with those distributions in identifying the behavioral similarity of log sources to potentially make an application kind or its particular deployment in case of a hierarchical discrimination.
3.2. Feature Engineering
All log sources of apps in
Table 1 were monitored by an Aria Ops for Logs for a one-week period. With our prototype scripts, we extracted counts of distinct ETs observed in each 4-h interval for each of the sources under consideration, thus generating a data store of samples to be processed. Then, converting those values into relative frequencies or probabilities of ETs, we continued to work with the resultant distributions (this means probability elements are summed up to one for each time interval). It is important to note that, for the sake of an accurate ML treatment, this feature engineering technique builds the relevant probability vectors on the entire set of distinct ETs observed from all sources, thus introducing a sparsity into the data set subject to the hierarchical clustering below. Overall, 607 distributions (with dimensionality = 5605) feature vectors, representing behavioral samples from the six application kinds and their sources, were collected over the one-week monitoring window.
Here are some interesting patterns and insights from the descriptive analysis of the ET data.
Figure 3 demonstrates a structure in observed ET counts for the same sort of log sources. It seems that, even based on this total count, criterion app kinds can be differentiated/filtered out in a given time slot.
Figure 4 displays a discernable structure of probability feature vectors (with probabilities higher than 0.005) for two 4-h intervals of distinct instances of the same load balancer F5.
3.3. ADLog Using Hierarchical Clustering of Event Type Distributions
Features constructed based on ETs occurrence, described in
Section 3.2, are fed into the agglomerative clustering with Jaccard distance and average linkage. This distance is a measure of dissimilarity between two sets. In the context of clustering or similarity analysis, it quantifies how different two sets are based on their shared and unique elements, calculated as the ratio of the size of the intersection of the sets to the size of their union.
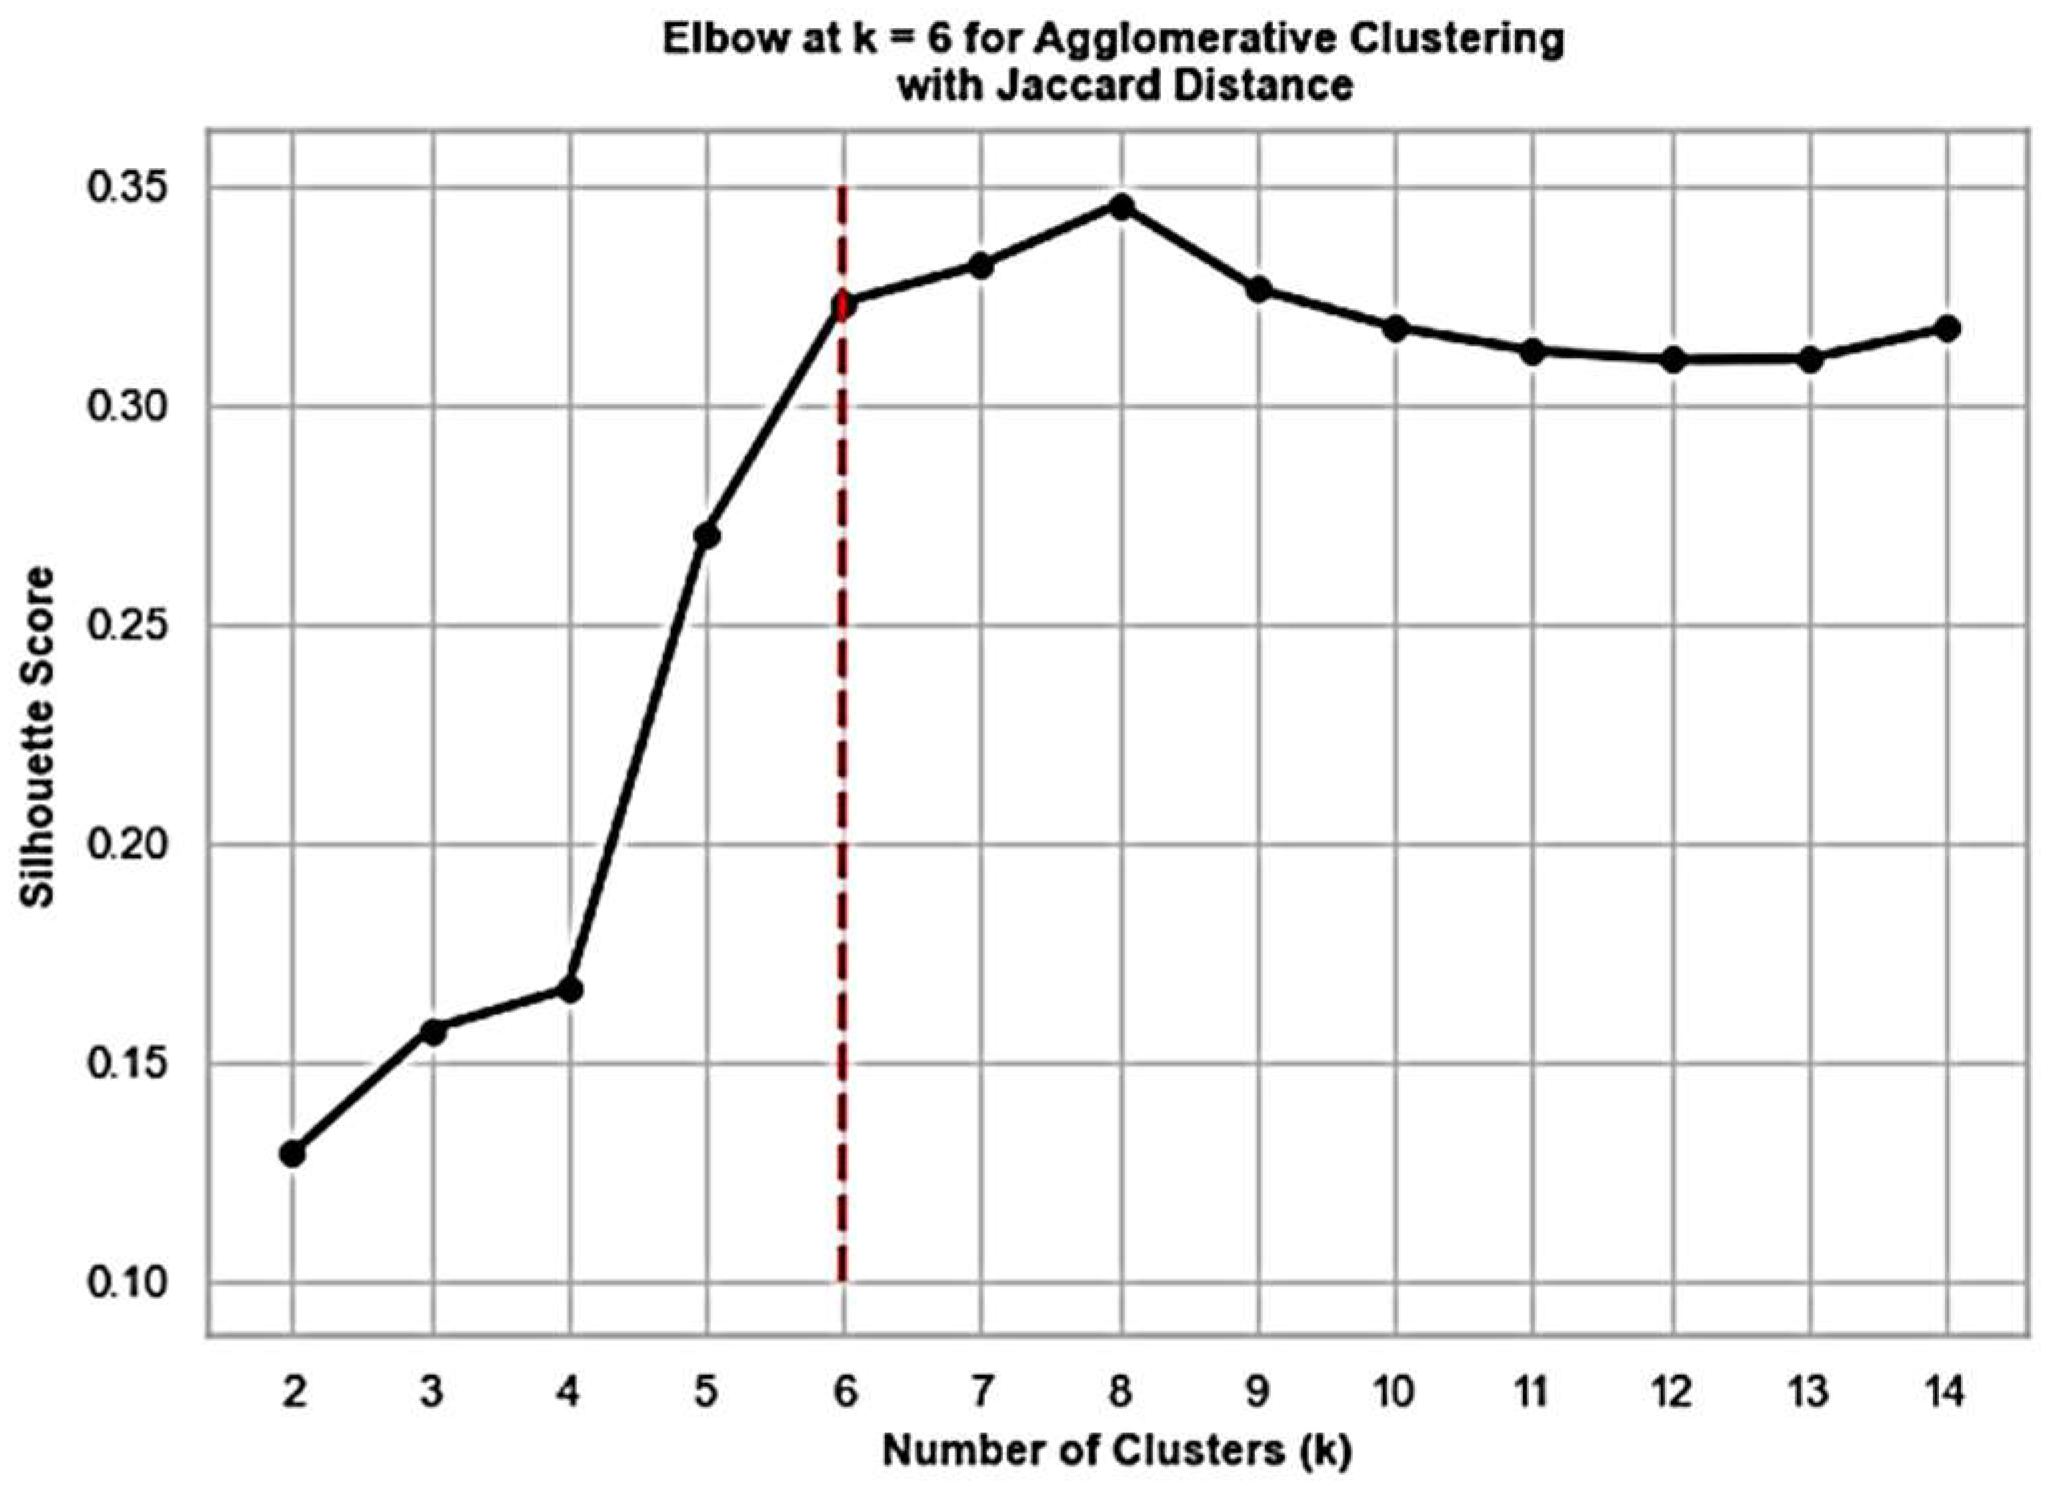
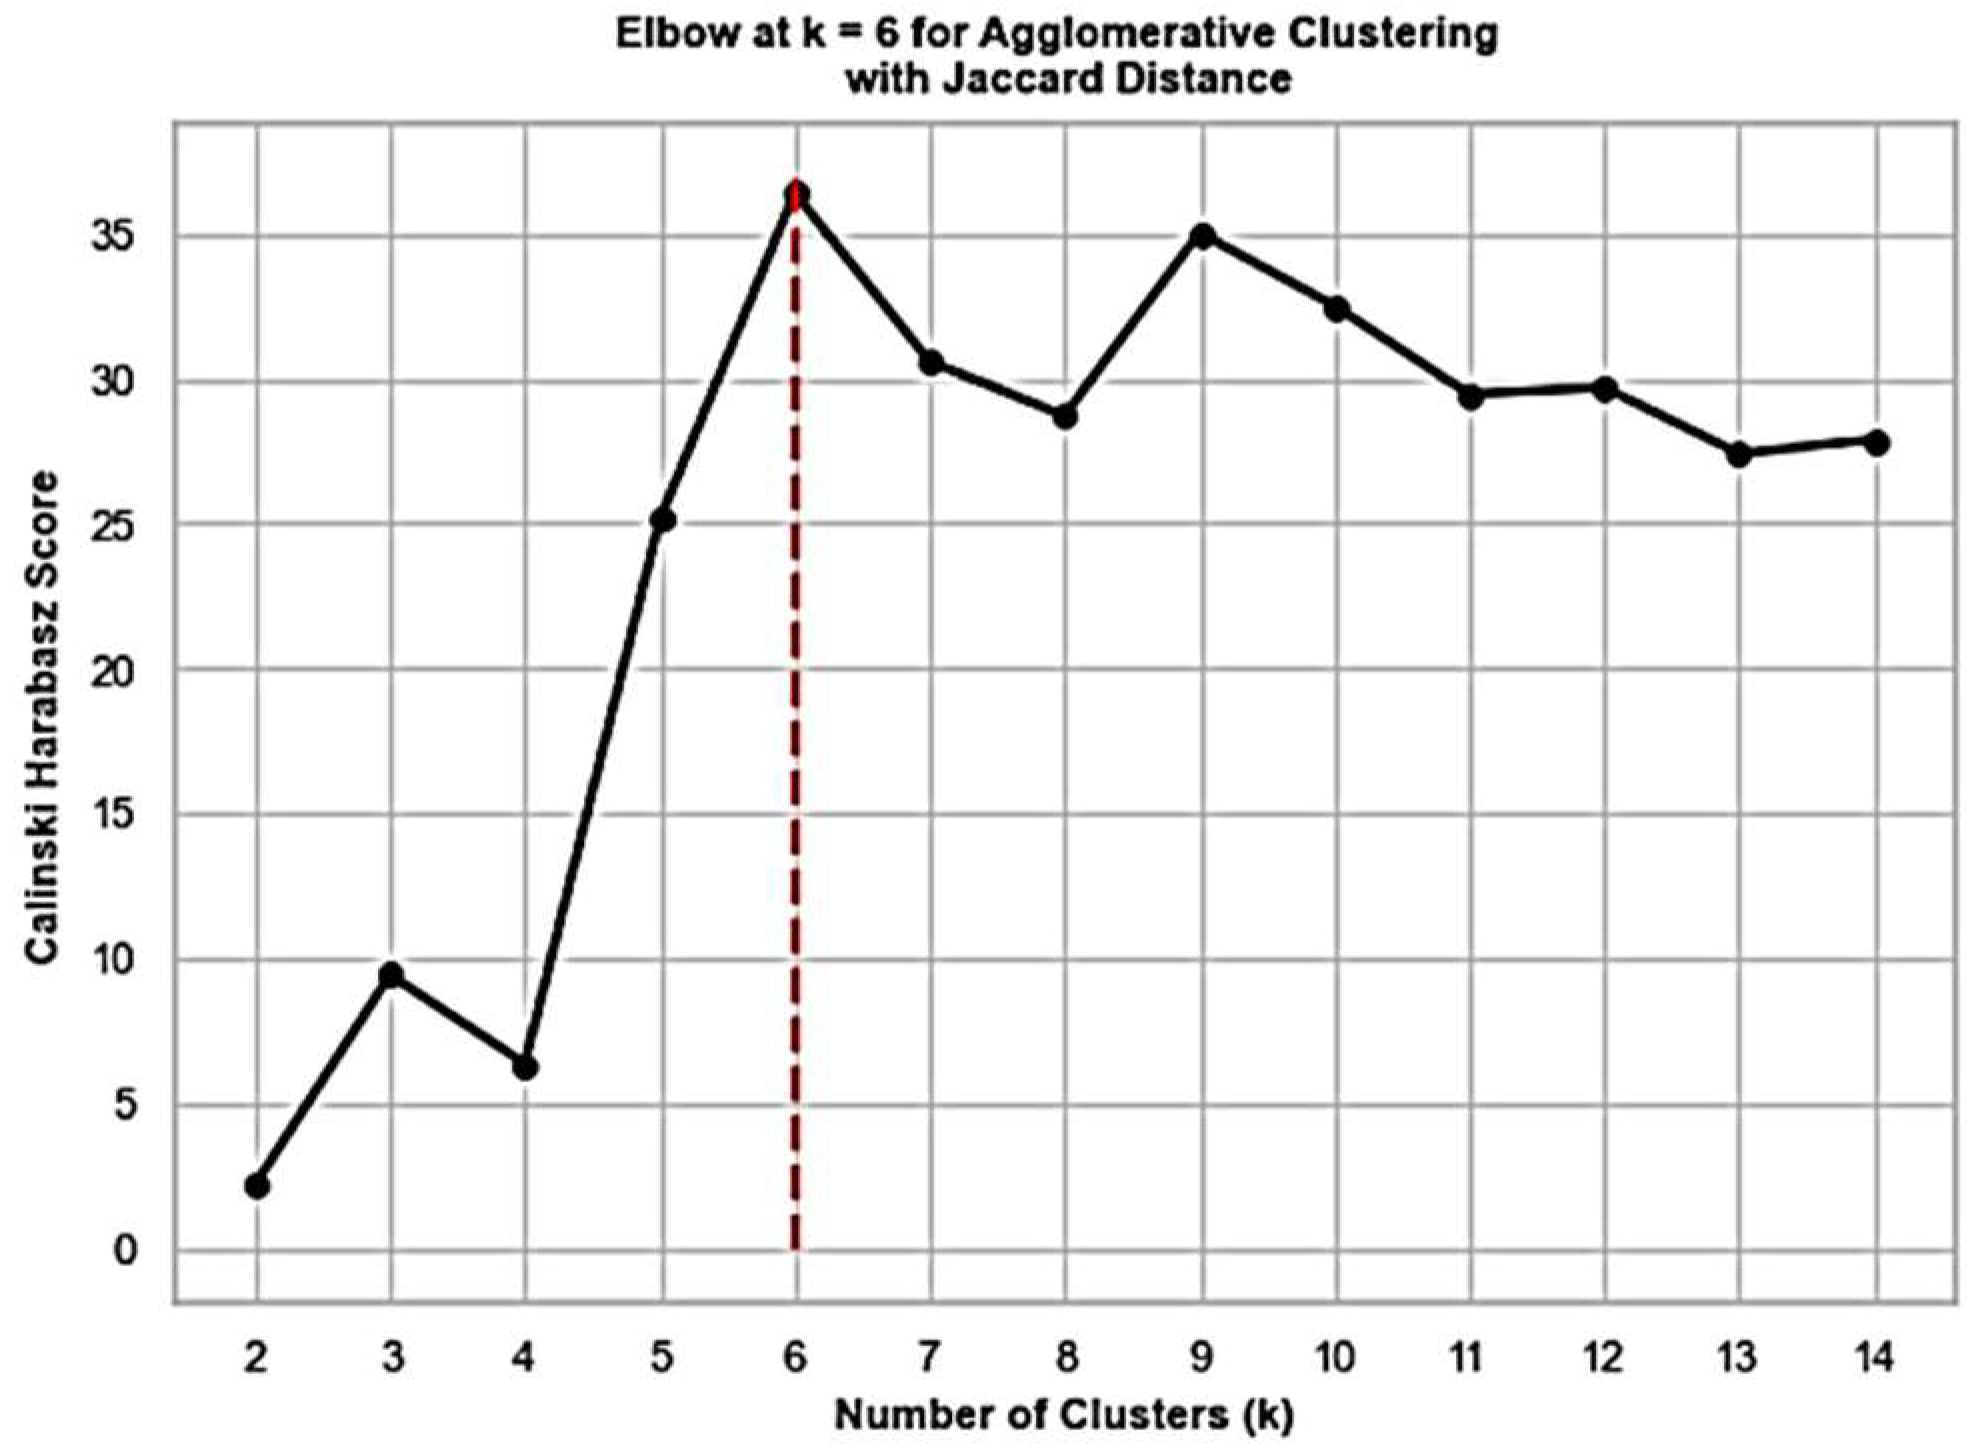
Since we do not know how many groups of entities to expect in the cloud environment, silhouette and Calinski–Harabasz scorings serve a guidance for inferring the best number of clusters. The silhouette score is a metric used to evaluate the quality of clusters formed by a clustering algorithm. It measures how similar an object is to its own cluster (cohesion) compared with other clusters (separation). A higher silhouette score indicates better-defined clusters, where data points are closer to members of their own cluster than to members of other clusters. The Calinski–Harabasz score is another metric for evaluating the quality of clusters produced by clustering algorithms. It is calculated by considering the ratio of between-cluster dispersion to within-cluster dispersion. A higher Calinski–Harabasz score indicates better-defined and more separated clusters.
Figure 5 and
Figure 6 display the corresponding results, respectively, detecting the number of app kinds in our experiment, where the elbow method is used. In general, we suggest experimenting with different clustering scores and making the final decision based on the summary of the results.
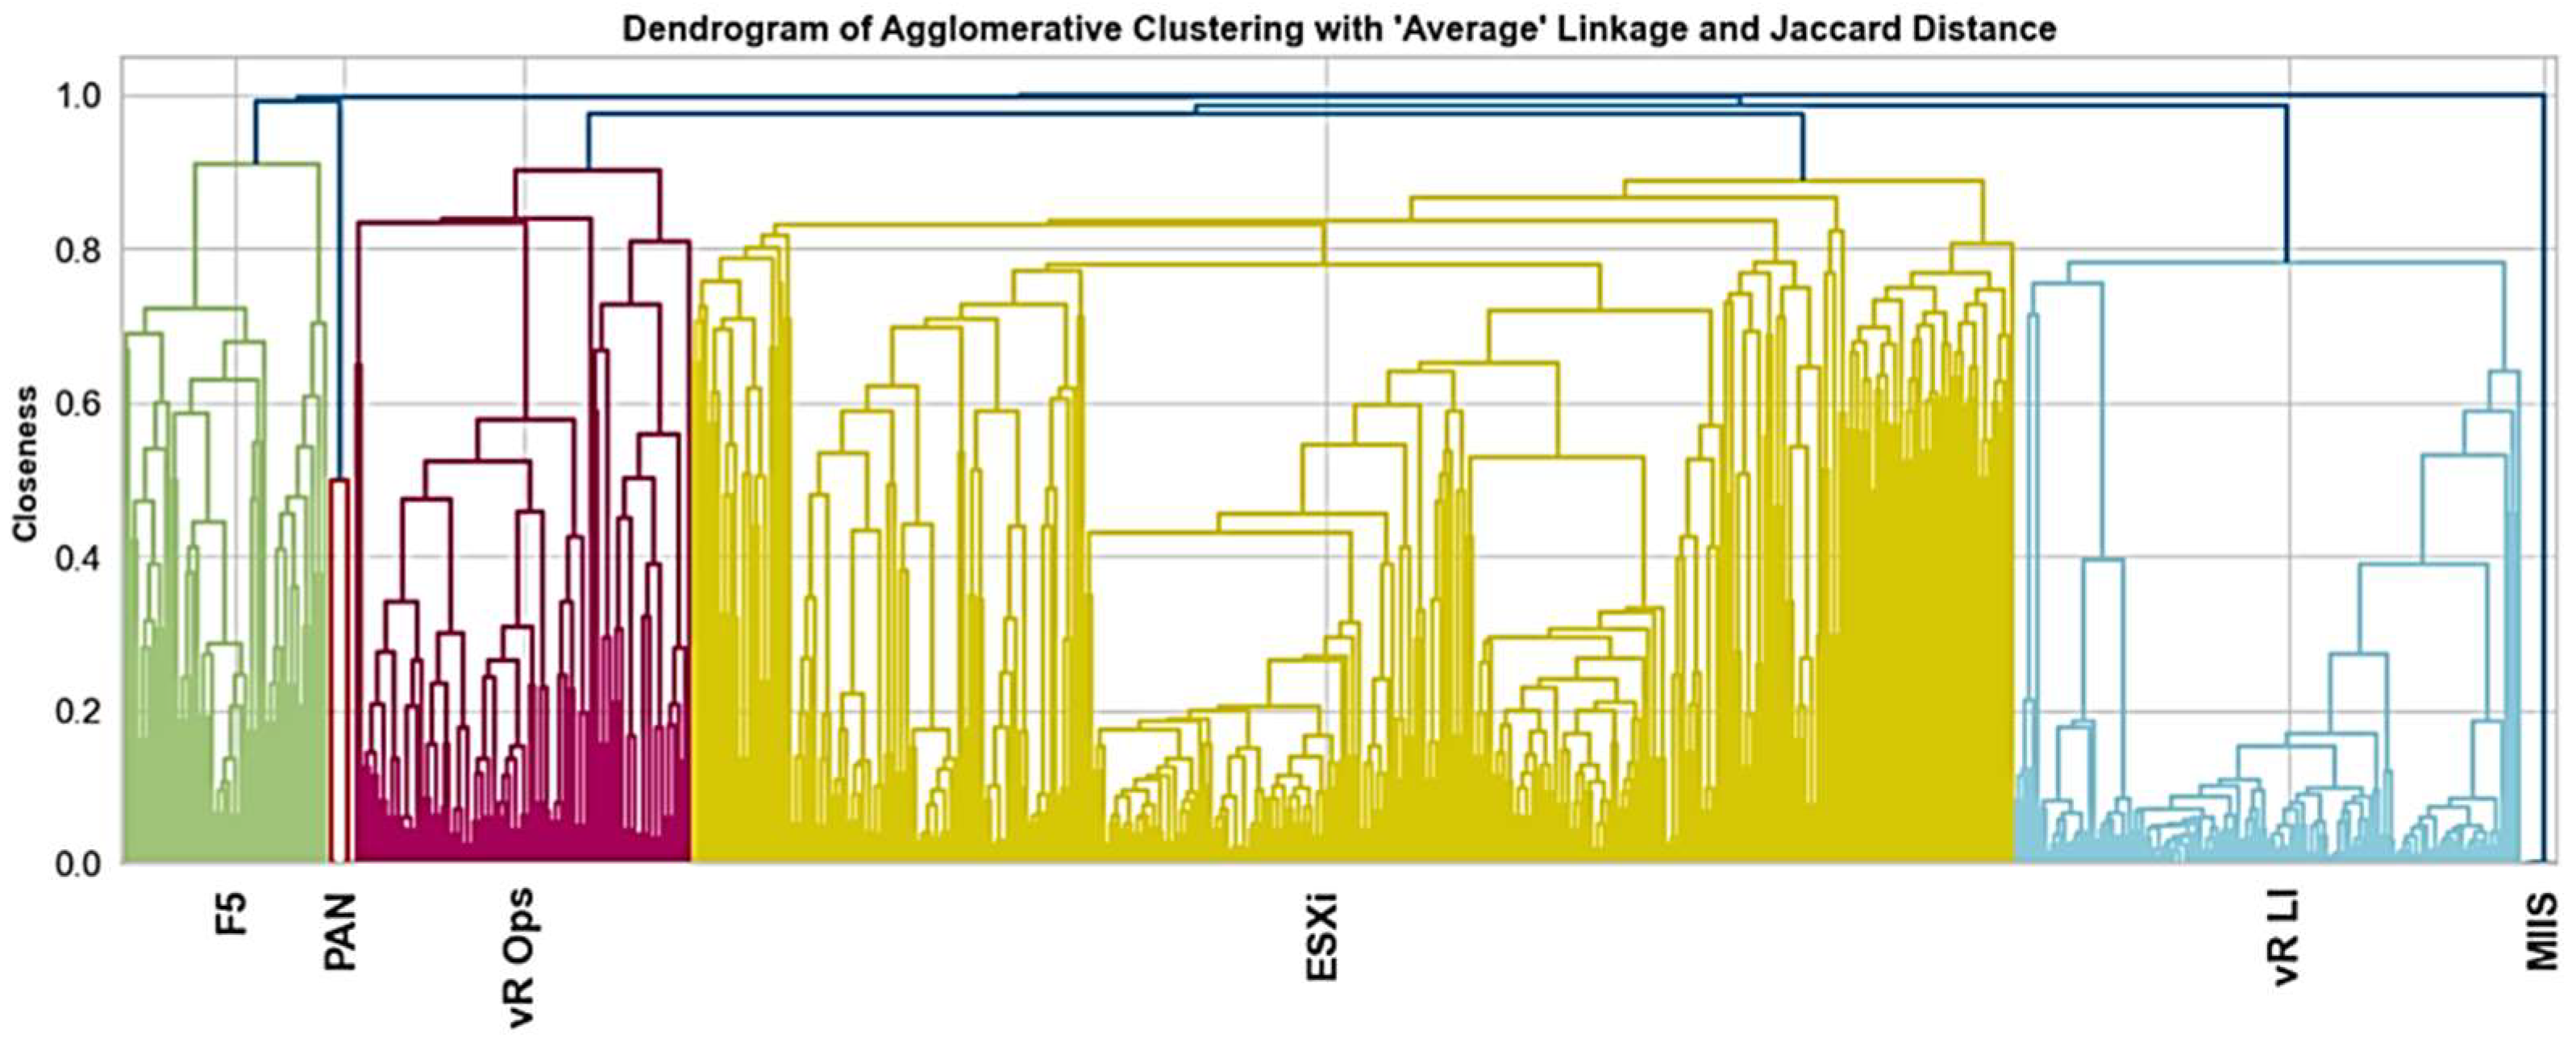
The dendrogram (a diagrammatic representation of the arrangement of clusters produced by hierarchical clustering algorithms) in
Figure 7 illustrates how the various sorts of apps (indicated in differently colored trees) in our analysis are discriminated based on the above-mentioned scoring results. These tree-like structures display how individual data points or clusters are combined at each stage of the clustering process. The most sizeable cluster (yellow) represents the ESXi-kind application with a comparably larger number of sampled ET distributions from related host entities.
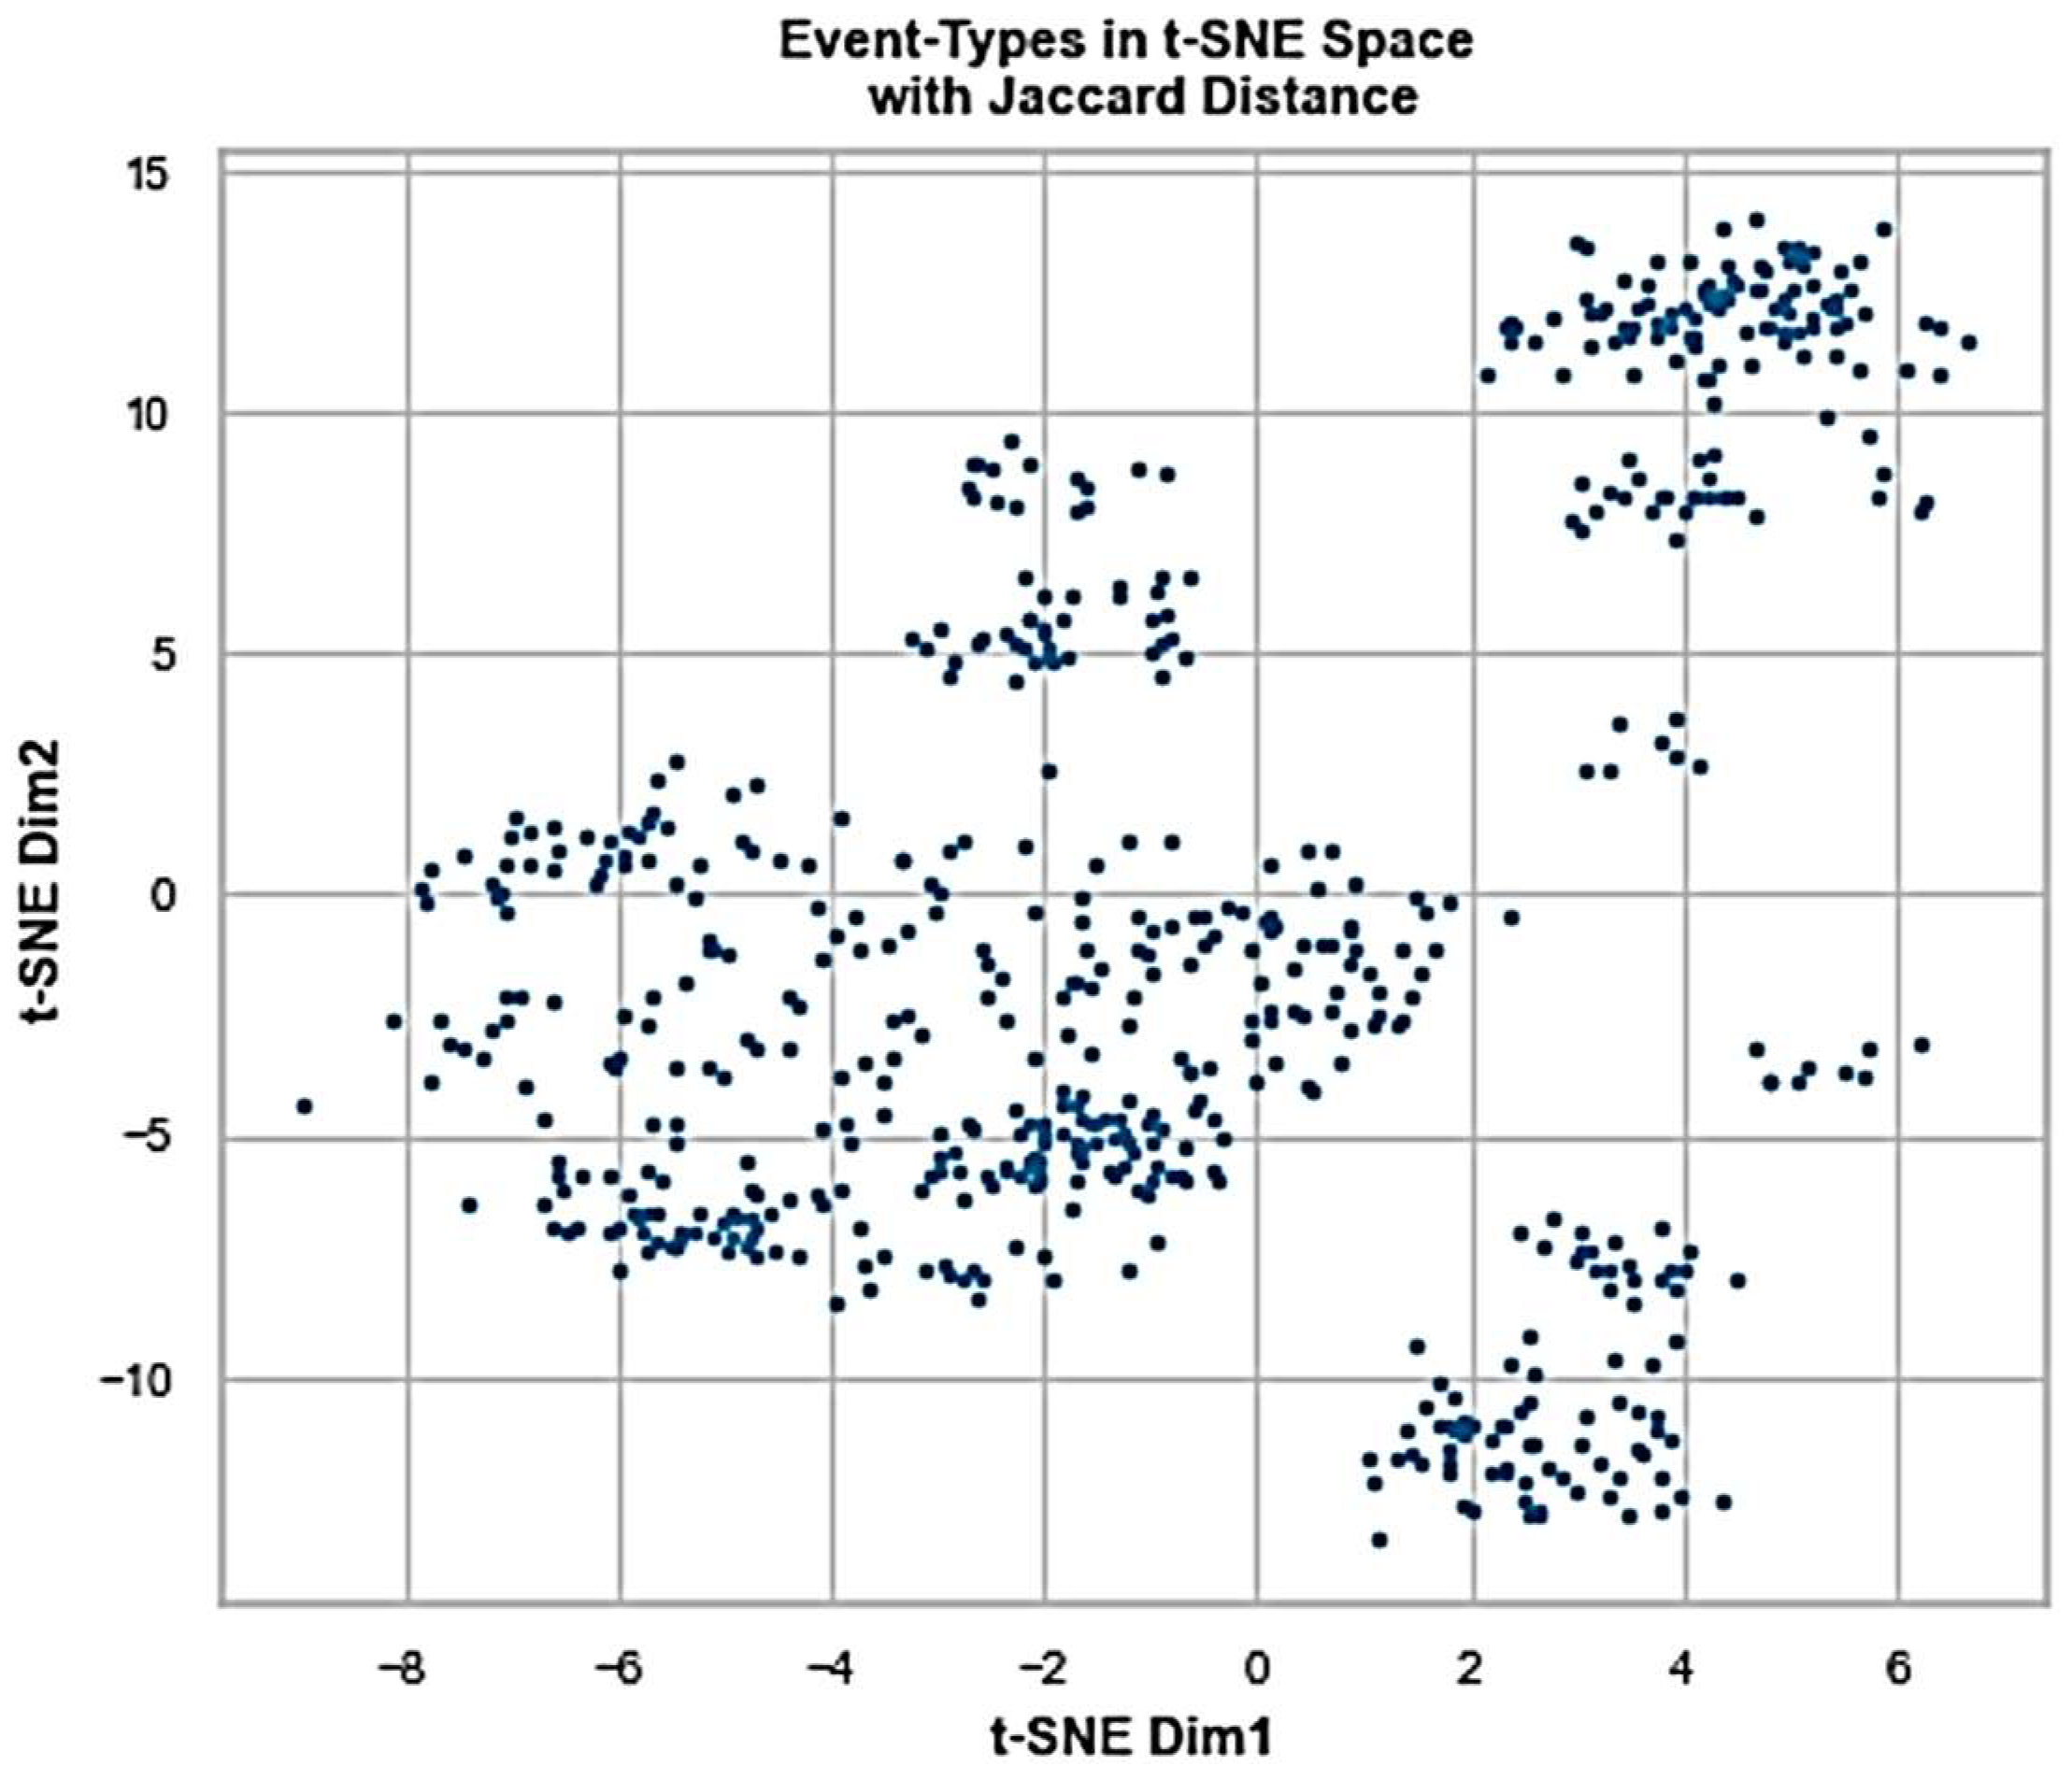
Since, within ADLog, the next objective is to be able to also distinguish app instances of the same kind of subject to their workload patterns (reflected in ET distributions), the solution performs further steps in interpreting the high-dimensional feature space we deal with into two-dimensional representation for more granular observability and an extra tooling in recommending the cloud application map. In that context,
Figure 8 reflects the original feature space through t-SNE (t-distributed stochastic neighbor embedding) methodology [
25]. This dimensionality reduction technique is commonly used for visualizing high-dimensional data in lower-dimensional space while preserving the local structure of the data. It constructs a probability distribution over pairs of high-dimensional data points, aiming to keep similar points close together and dissimilar points apart in the lower-dimensional space. For that, the method minimizes the Kullback–Leibler (KL) divergence or distance between the joint probability distribution of the high-dimensional data and the conditional probability distribution of the lower-dimensional embedding.
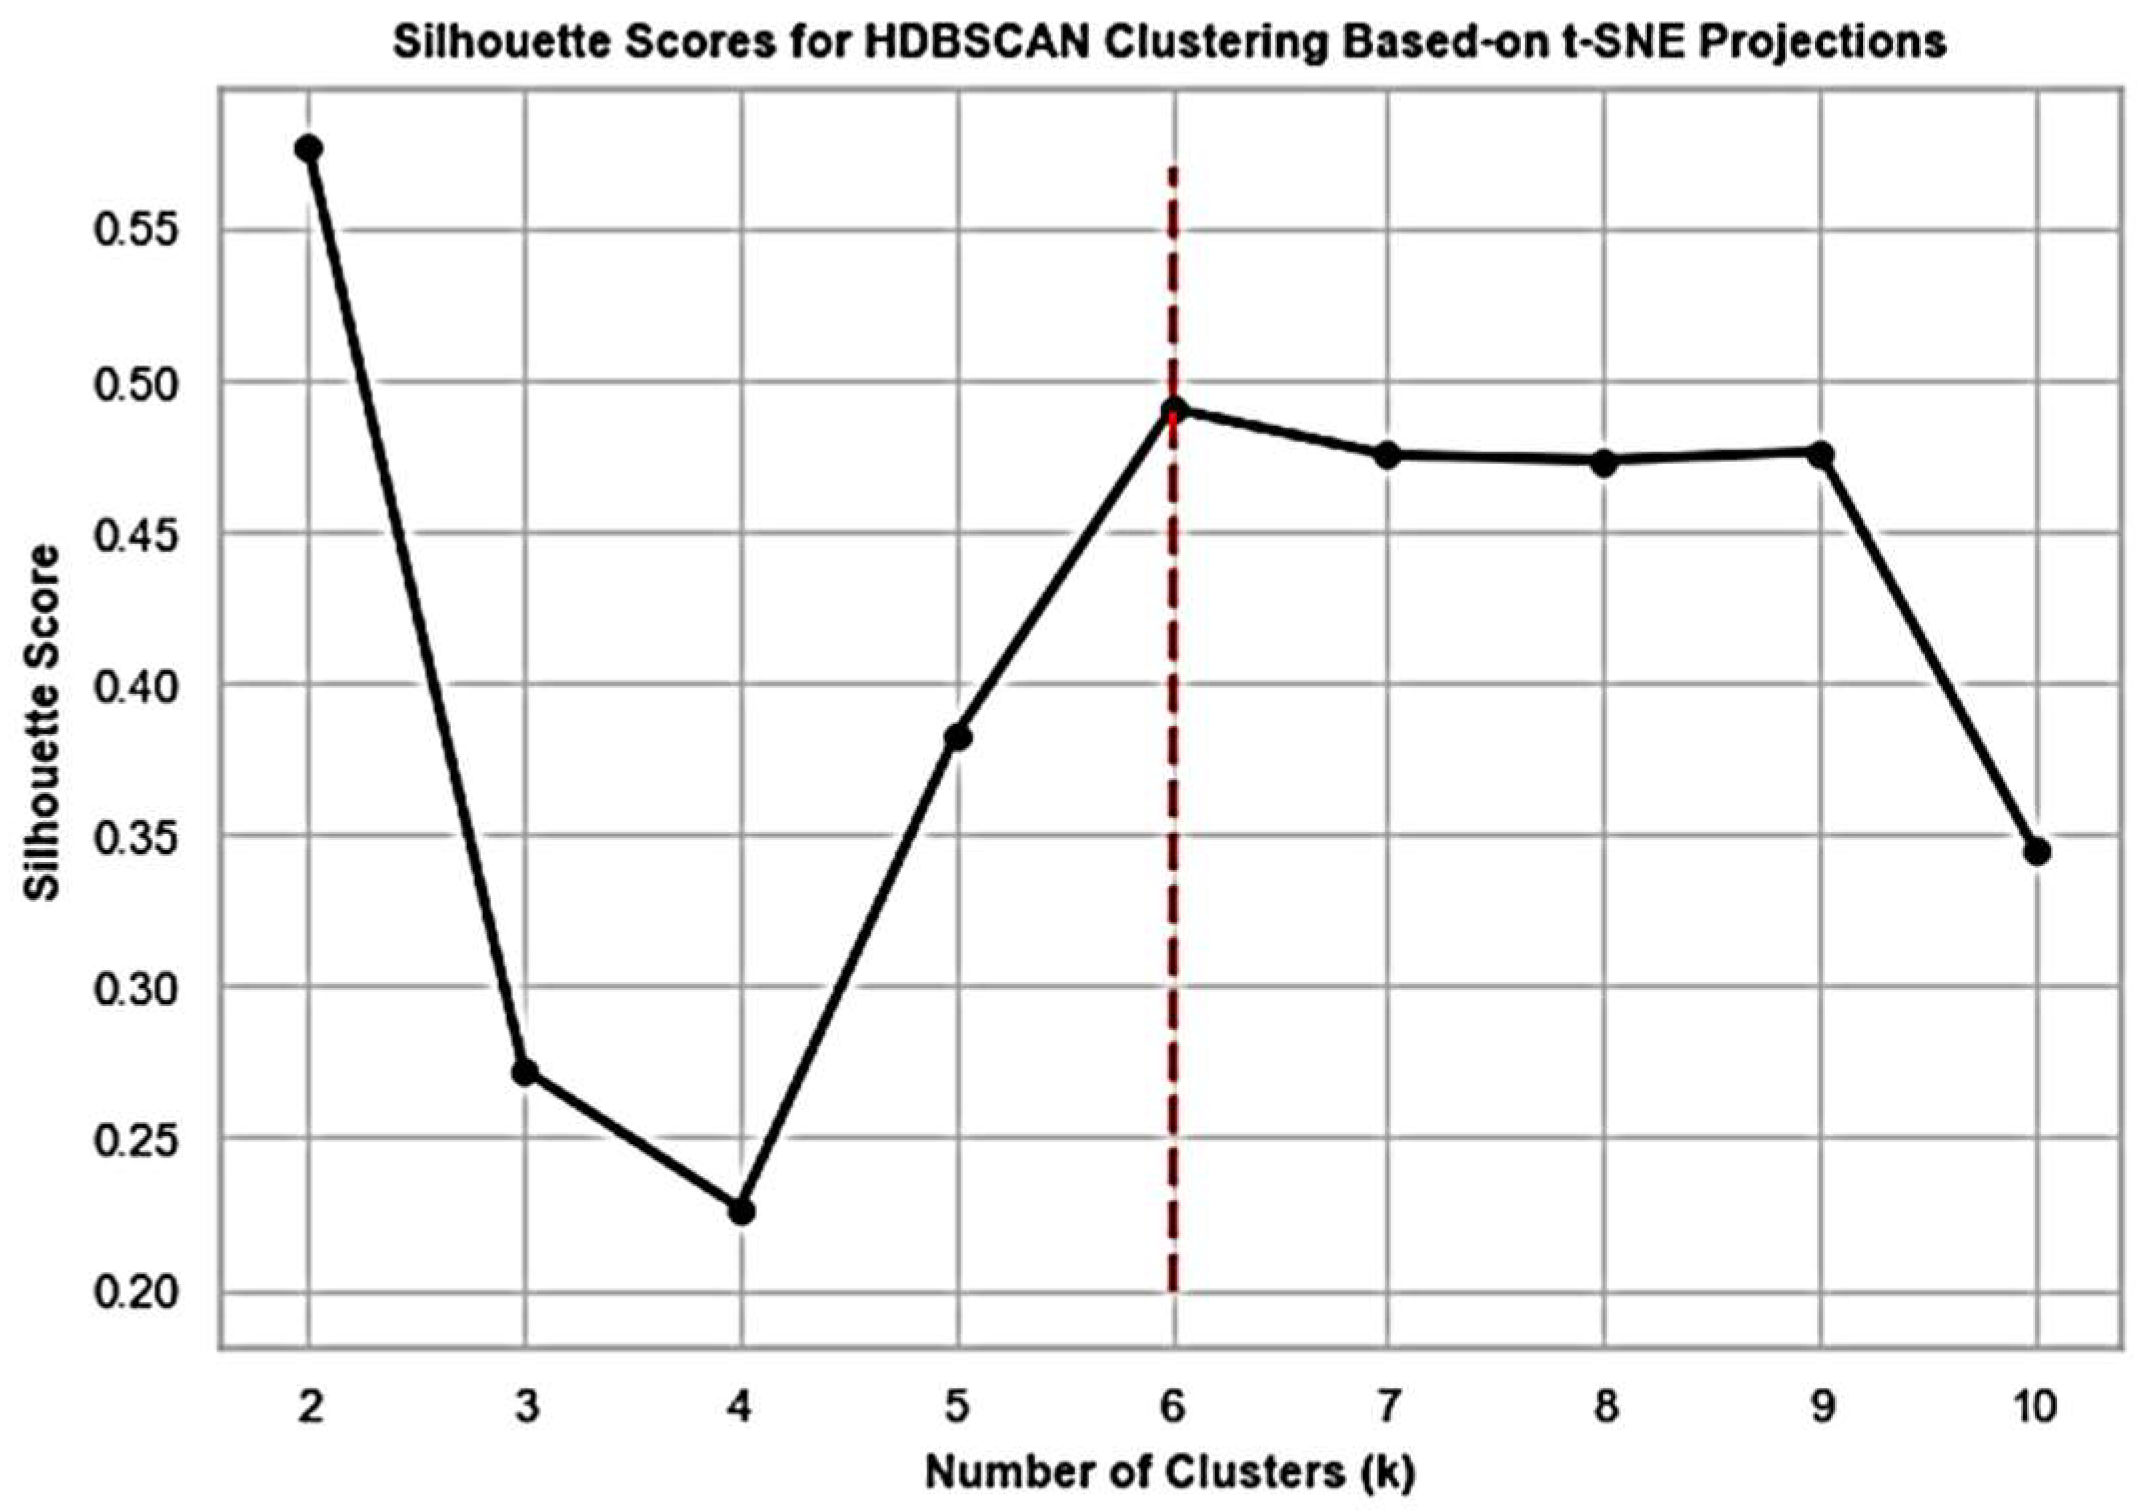
Interestingly, silhouette scoring (
Figure 9) for HDBSCAN (hierarchical density-based spatial clustering of applications with noise) [
26] clustering using t-SNE projections results in six groups again, where we chose the density-based way of grouping as more intuitive in view of the projections plot in
Figure 8. HDBSCAN is a density-based clustering algorithm that identifies clusters of varying shapes and sizes in a dataset. It extends the traditional DBSCAN algorithm by incorporating hierarchical clustering techniques. The choice of density-based clustering algorithms is more reasonable in our use case compared with centroid-based algorithms (like K-means), especially because of the non-Euclidean distance we deal with and the unknown number and data structure of expected applications.
We apply HDBSCAN clustering to the t-SNE feature space shown in
Figure 8, for different values of the number of clusters, and calculate the corresponding silhouette scores (see
Figure 9).
The graph of
Figure 9 suggests that the maximum value of silhouette score is attained at
. However, our choice stands on
, which corresponds to the next maximum value. The reason for this choice is the visual confirmation obtained from
Figure 7. Application of HDBSCAN with six clusters implies a labeled t-SNE representation of
Figure 10 with clearly separated constellations of observations sampled from the different kinds of app entities/sources.
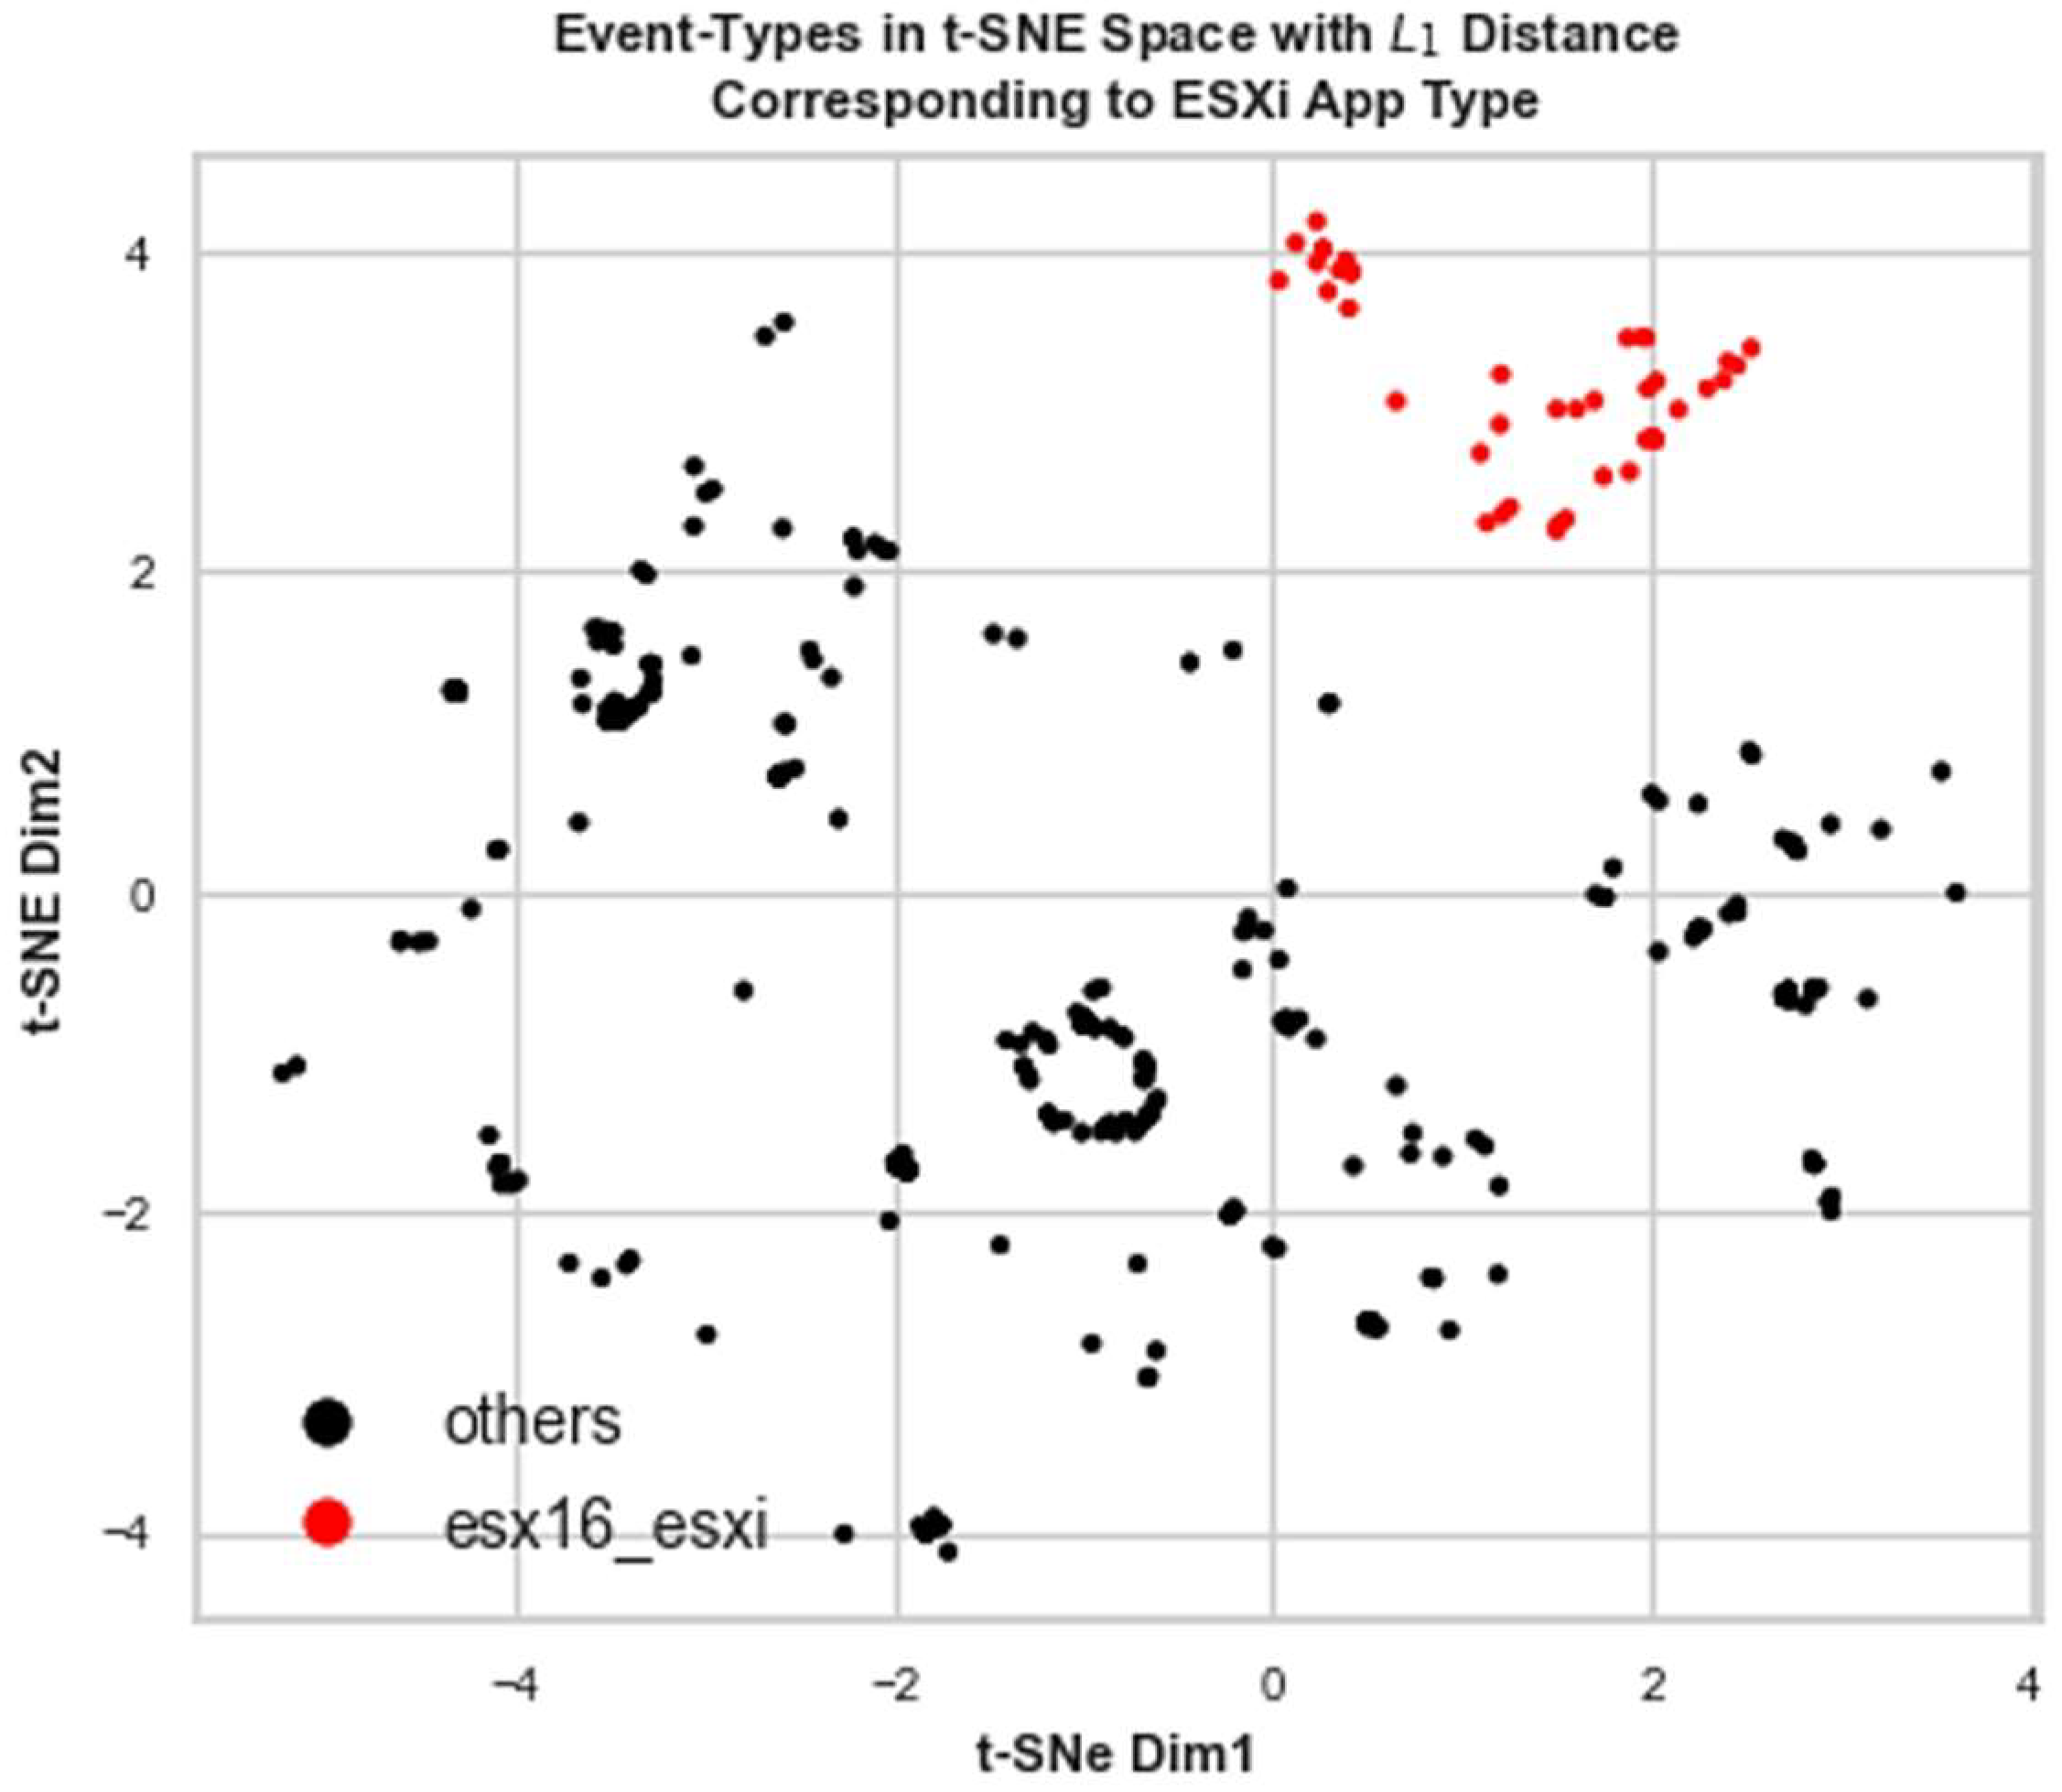
Zooming into the ESXi constellation and taking it as an input to the agglomerative clustering with the related t-SNE features, we infer that the second-stage grouping for this data set can be performed as the silhouette scoring in
Figure 11 indicates. We highlight this effect in
Figure 12, where the samples coming from source esx16 make a separable and tighter group in the t-SNE plot of features using preserved
-distance. Therefore, ADLog leads to a prediction about a distinct app instance which is compliant with the ground truth in
Table 1.
4. Evaluation of Results
The insights discussed in the previous subsection confirm the ability of ADLog to perform application categorization using ET distributions by Aria Ops for Logs. This prototype solution demonstrated a high discrimination power and accurately identified the app kinds in ground truth in
Table 1 with 100% accuracy.
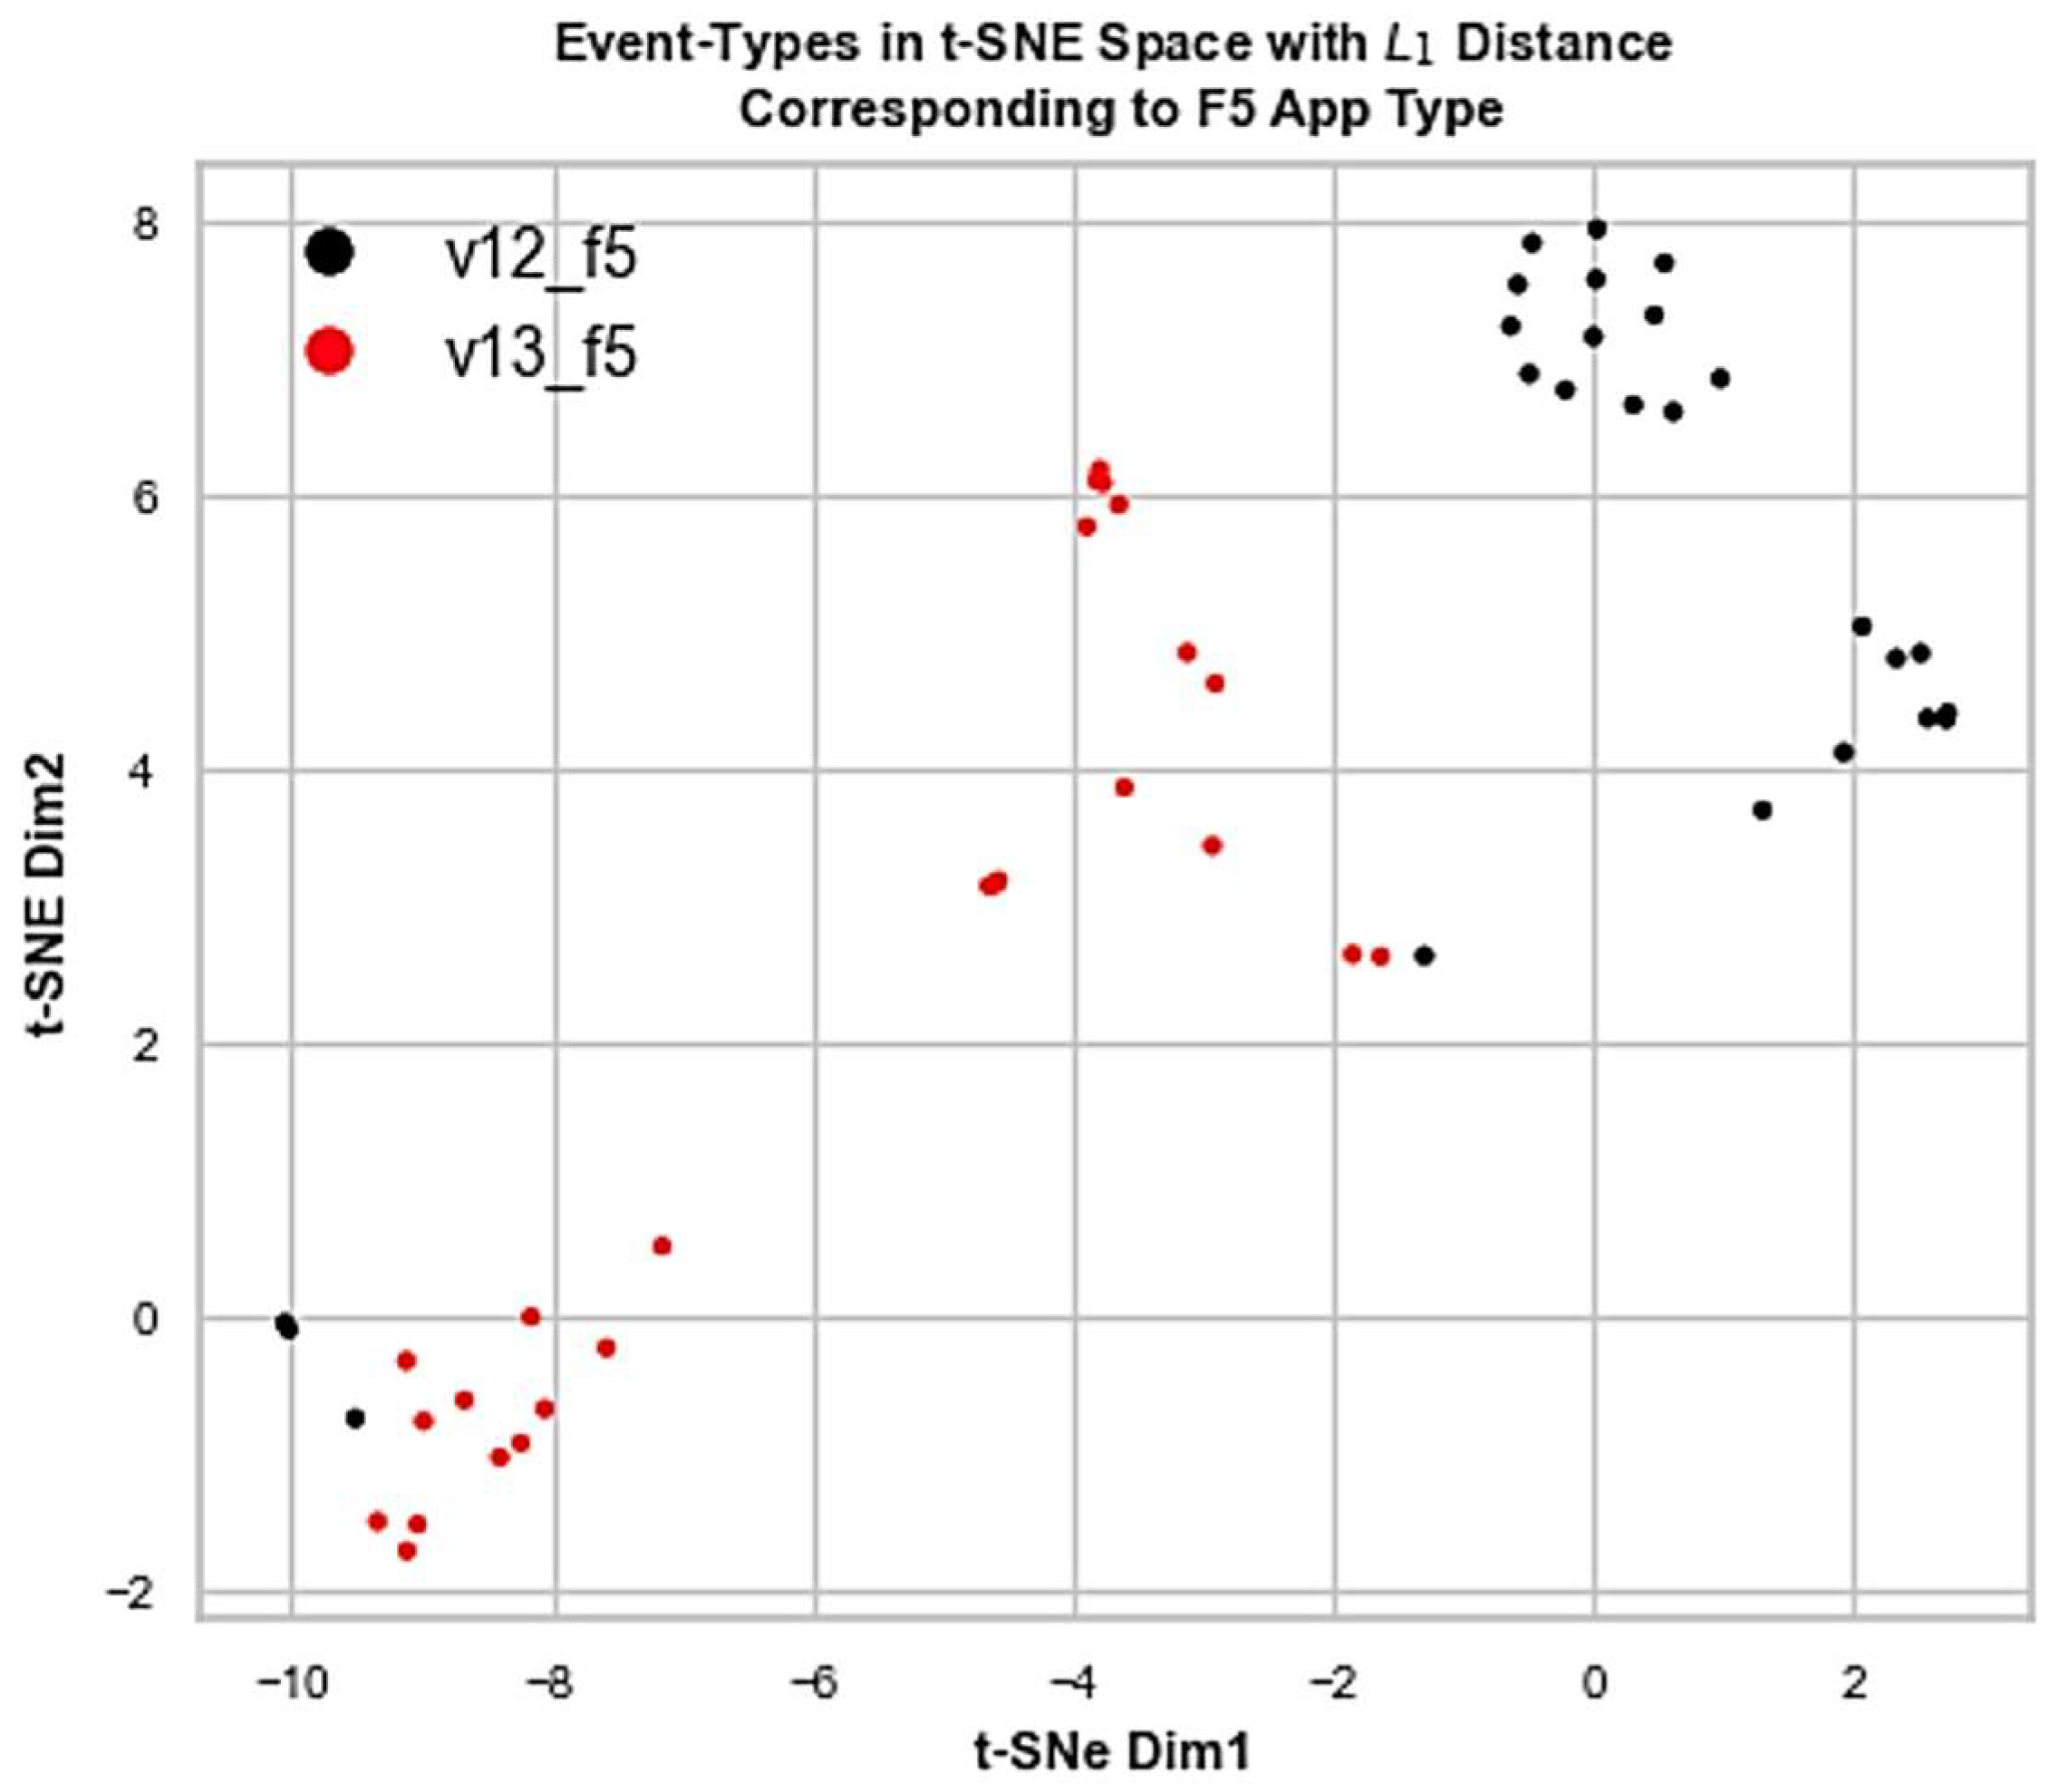
As to the identification of standalone instances of the same kind, only in the case of the F5 load balancer with two consecutive versions v12 and v13 was it not possible to effectively discriminate those (see
Figure 13). Hypothetically, ADLog misses this fragment because of the very nature of F5 and its behavioral footprint collected, needing more distributions to be sampled reflecting various levels of workload stress. In general, Jaccard distance is a suitable measure for identifying the app kinds, while more sensitive measures like
are better for the second-layer and more granular clustering of log sources.
Within a log analytics service, ET distributions can provide also an explanation for discovered applications as footprint structures. However, in general, they might represent rather big vectors of probabilities not suitable for a simple interpretability purpose. At the same time, they are baseline structures of applications which can be utilized not only for the discovery task but also for identifying atypical performance behaviors (abnormalities or anomalies) when diverging from dominant distributions (see [
10] for relevant concepts and methods). In this regard, for an anomaly detection task of an application within a supervised learning set up, where training data given by ET distributions and their labels are available, a rule induction and verification approach based on the Dempster–Shafer theory (DST) of evidence [
27] introduced in [
11] is of special value. It can validate simple rules defined on probability degrees of individual ETs and their combinations that lead to anomalous application states, thus reducing the complex interpretability in characterizing applications and their performance statuses.
5. Discussion and Conclusions
Our initial belief is that the AD from the logs approach remains a standalone way for the contextually relevant and accurate identification of cloud resources, while also guiding other techniques to improve their recommendations and function as an ensemble method. At the same time, it is important to note that, especially in the context of multi-cloud and native cloud management scenarios, ADLog might be a stronger choice for adoption with a higher degree of observability power. However, one of its potential drawbacks might be less discrimination power of the same-type applications operating independently in the environment.
To enhance this work, we plan to conduct extensive experimental validation and comparison with various techniques based on available log data sets which we did not possess while working on this idea. The explanation aspect in application discovery and performance analysis is another important direction of research to pursue in our future studies. An extended ADLog prototype will also include a fully developed recommender system for inferring relevant application kinds and indicative tags from messages behind ETs using NLP.
Although the proposed approach was demonstrated on log management paradigms of a specific cloud provider, the ADLog principles remain generic. Realizing ADLog into any cloud management eco-system might only need the integration of an ET learning mechanism. In the case of Aria Operations for Logs, those constructs are available, which were directly utilized in our analysis. In this regard, it is another research item to compare ADLog with AD services by various cloud providers. However, the available offerings seem to be mostly rule-driven solutions, not relying on machine intelligence, which would be important for a proper benchmarking.
6. Patents
The study is supported by a filed (on 18 October 2023) US patent no. 18/381,520.
Author Contributions
Conceptualization, A.H. (Ashot Harutyunyan) and A.P.; methodology, A.H. (Ashot Harutyunyan), A.P. and T.B.; software, A.H. (Andranik Haroyan), M.H. and L.H.; validation, A.H. (Andranik Haroyan) and M.H.; formal analysis, A.P. and T.B.; investigation, A.P., T.B. and L.H.; resources, M.H., L.H. and A.H. (Andranik Haroyan); data curation, A.H. (Andranik Haroyan), M.H. and L.H.; writing—original draft preparation, A.H. (Ashot Harutyunyan) and A.P.; writing—review and editing, T.B. and N.B.; visualization, A.P. and L.H.; supervision, A.H. (Ashot Harutyunyan); project administration, A.H. (Ashot Harutyunyan); funding acquisition, N.B. All authors have read and agreed to the published version of the manuscript.
Funding
The research was supported by ADVANCE Research Grants from the Foundation for Armenian Science and Technology.
Data Availability Statement
The data analyzed in this study are available on request from the corresponding author. The data are not publicly available due to their proprietary and business-sensitive nature.
Acknowledgments
Authors are thankful to the anonymous reviewers for their constructive feedback.
Conflicts of Interest
The authors declare no conflicts of interest. The funders had no role in the design of the study; in the collection, analyses or interpretation of data; in the writing of the manuscript; or in the decision to publish the results.
References
- What Is Application Modernization? Available online: www.vmware.com/topics/glossary/content/application-modernization.html (accessed on 4 April 2024).
- Microsoft Azure: What Is Application Modernization? Available online: www.azure.microsoft.com/en-us/solutions/application-modernization/ (accessed on 4 April 2024).
- Application Modernization: Application Discovery Services. Available online: www.deloitte.com/us/en/pages/technology/solutions/application-discovery-tool.html (accessed on 4 April 2024).
- Smit, M. Using Machine Learning to Discover Applications. Available online: www.blogs.vmware.com/management/2020/05/using-machine-learning-to-discover-applications.html (accessed on 4 April 2024).
- AWS Application Discovery Service. Available online: https://www.aws.amazon.com/application-discovery/faqs/ (accessed on 4 April 2024).
- Introduction to AWS AD Service and Its Use Cases. Available online: www.projectpro.io/recipes/introduction-aws-application-discovery-service-and-its-use-cases (accessed on 4 April 2024).
- Set up Cloud Discovery. Available online: https://learn.microsoft.com/en-us/defender-cloud-apps/set-up-cloud-discovery (accessed on 7 May 2024).
- Viewing the Application Discovery Data Collection Logs. Available online: https://www.ibm.com/docs/en/adi/5.0.4.2?topic=provider-viewing-application-discovery-data-collection-logs (accessed on 7 May 2024).
- VMware Aria Operations for Logs. Available online: www.vmware.com/products/vrealize-log-insight.html (accessed on 4 April 2024).
- Harutyunyan, A.; Poghosyan, A.; Grigoryan, N.; Kushmerick, N.; Beybutyan, H. Identifying changed or sick resources from logs. In Proceedings of the 2018 IEEE 3rd International Workshops on Foundations and Applications of Self* Systems (FAS*W), Trento, Italy, 3–7 September 2018; pp. 86–91. [Google Scholar] [CrossRef]
- Poghosyan, A.; Harutyunyan, A.; Davtyan, E.; Petrosyan, K.; Baloian, N. A Study on automated problem troubleshooting in cloud environments with rule induction and verification. Appl. Sci. 2024, 14, 1047. [Google Scholar] [CrossRef]
- Working with Blueprints/Cloud Templates. Available online: https://developer.vmware.com/docs/19299/GUID-976A01AB-CEEA-4A9A-B485-858012FA0DE1.html (accessed on 4 April 2024).
- Service and Application Discovery. Available online: https://www.blogs.vmware.com/management/2020/12/an-overview-of-application-monitoring-with-vrealize-operations.html (accessed on 4 April 2024).
- An Overview of Application Monitoring with vRealize Operations. Available online: www.blogs.vmware.com/management/2020/12/an-overview-of-application-monitoring-with-vrealize-operations.html (accessed on 4 April 2024).
- VMware Aira Operations for Networks. Available online: https://www.vmware.com/products/aria-operations-for-networks.html (accessed on 4 April 2024).
- vSphere Distributed Switch. Available online: https://www.vmware.com/products/vsphere/distributed-switch.html (accessed on 4 April 2024).
- VMware NSX. Available online: https://www.vmware.com/products/nsx.html (accessed on 4 April 2024).
- Agbaegbu, J.; Arogundade, O.T.; Misra, S.; Damaševičius, R. Ontologies in Cloud Computing—Review and Future Directions. Future Internet 2021, 13, 302. [Google Scholar] [CrossRef]
- Alfazi, A.; Sheng, Q.Z.; Qin, Y.; Noor, T.H. Ontology-Based Automatic Cloud Service Categorization for Enhancing Cloud Service Discovery. In Proceedings of the 2015 IEEE 19th International Enterprise Distributed Object Computing Conference, Adelaide, Australia, 21–25 September 2015. [Google Scholar]
- Gábor, A.; Kő, A.; Szabó, Z.; Fehér, P. Corporate Knowledge Discovery and Organizational Learning: The Role, Importance, and Application of Semantic Business Process Management—The ProKEX Case. In Knowledge Management and Organizational Learning; Springer: Cham, Switzerland, 2016; pp. 1–31. [Google Scholar]
- Parhi, M.; Pattanayak, B.K.; Patra, M.R. A Multi-Agent-Based Framework for Cloud Service Description and Discovery Using Ontology. Intell. Comput. Commun. Devices 2014, 308, 337–348. [Google Scholar]
- Parhi, M.; Pattanayak, B.K.; Patra, M.R. A multi-agent-based framework for cloud service discovery and selection using ontology. Serv. Oriented Comput. Appl. 2017, 12, 137–154. [Google Scholar] [CrossRef]
- Parhi, M.; Pattanayak, B.K.; Patra, M.R. An ontology-based cloud infrastructure service discovery and selection system. Int. J. Grid Util. Comput. 2018, 9, 108. [Google Scholar] [CrossRef]
- Ali, A.; Shamsuddin, S.M.; Eassa, F.E.; Mohammed, F. Cloud Service Discovery and Extraction: A Critical Review and Direction for Future Research. Available online: https://link.springer.com/chapter/10.1007/978-3-319-99007-1_28#citeas (accessed on 3 June 2024).
- van der Maaten, L.J.P.; Hinton, G.E. Visualizing data using t-SNE. J. Mach. Learn. Res. 2008, 9, 2579–2605. [Google Scholar]
- Campello, R.J.G.B.; Moulavi, D.; Sander, J. Density-based clustering based on hierarchical density estimates. In Lecture Notes in Computer Science; Springer: Berlin/Heidelberg, Germany, 2013; Volume 7819. [Google Scholar]
- Shafer, G. A Mathematical Theory of Evidence; Princeton University Press: Princeton, NJ, USA, 1976. [Google Scholar]
| Disclaimer/Publisher’s Note: The statements, opinions and data contained in all publications are solely those of the individual author(s) and contributor(s) and not of MDPI and/or the editor(s). MDPI and/or the editor(s) disclaim responsibility for any injury to people or property resulting from any ideas, methods, instructions or products referred to in the content. |
© 2024 by the authors. Licensee MDPI, Basel, Switzerland. This article is an open access article distributed under the terms and conditions of the Creative Commons Attribution (CC BY) license (https://creativecommons.org/licenses/by/4.0/).


 ,
, 


