
Investigating the Key Aspects of a Smart City through Topic Modeling and Thematic Analysis


Abstract
:
1. Introduction
Related Work
2. Materials and Methods
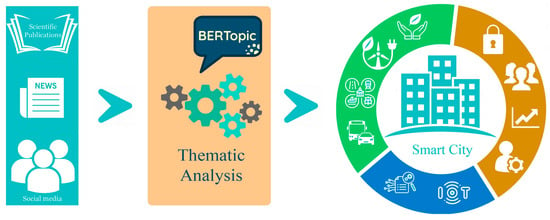
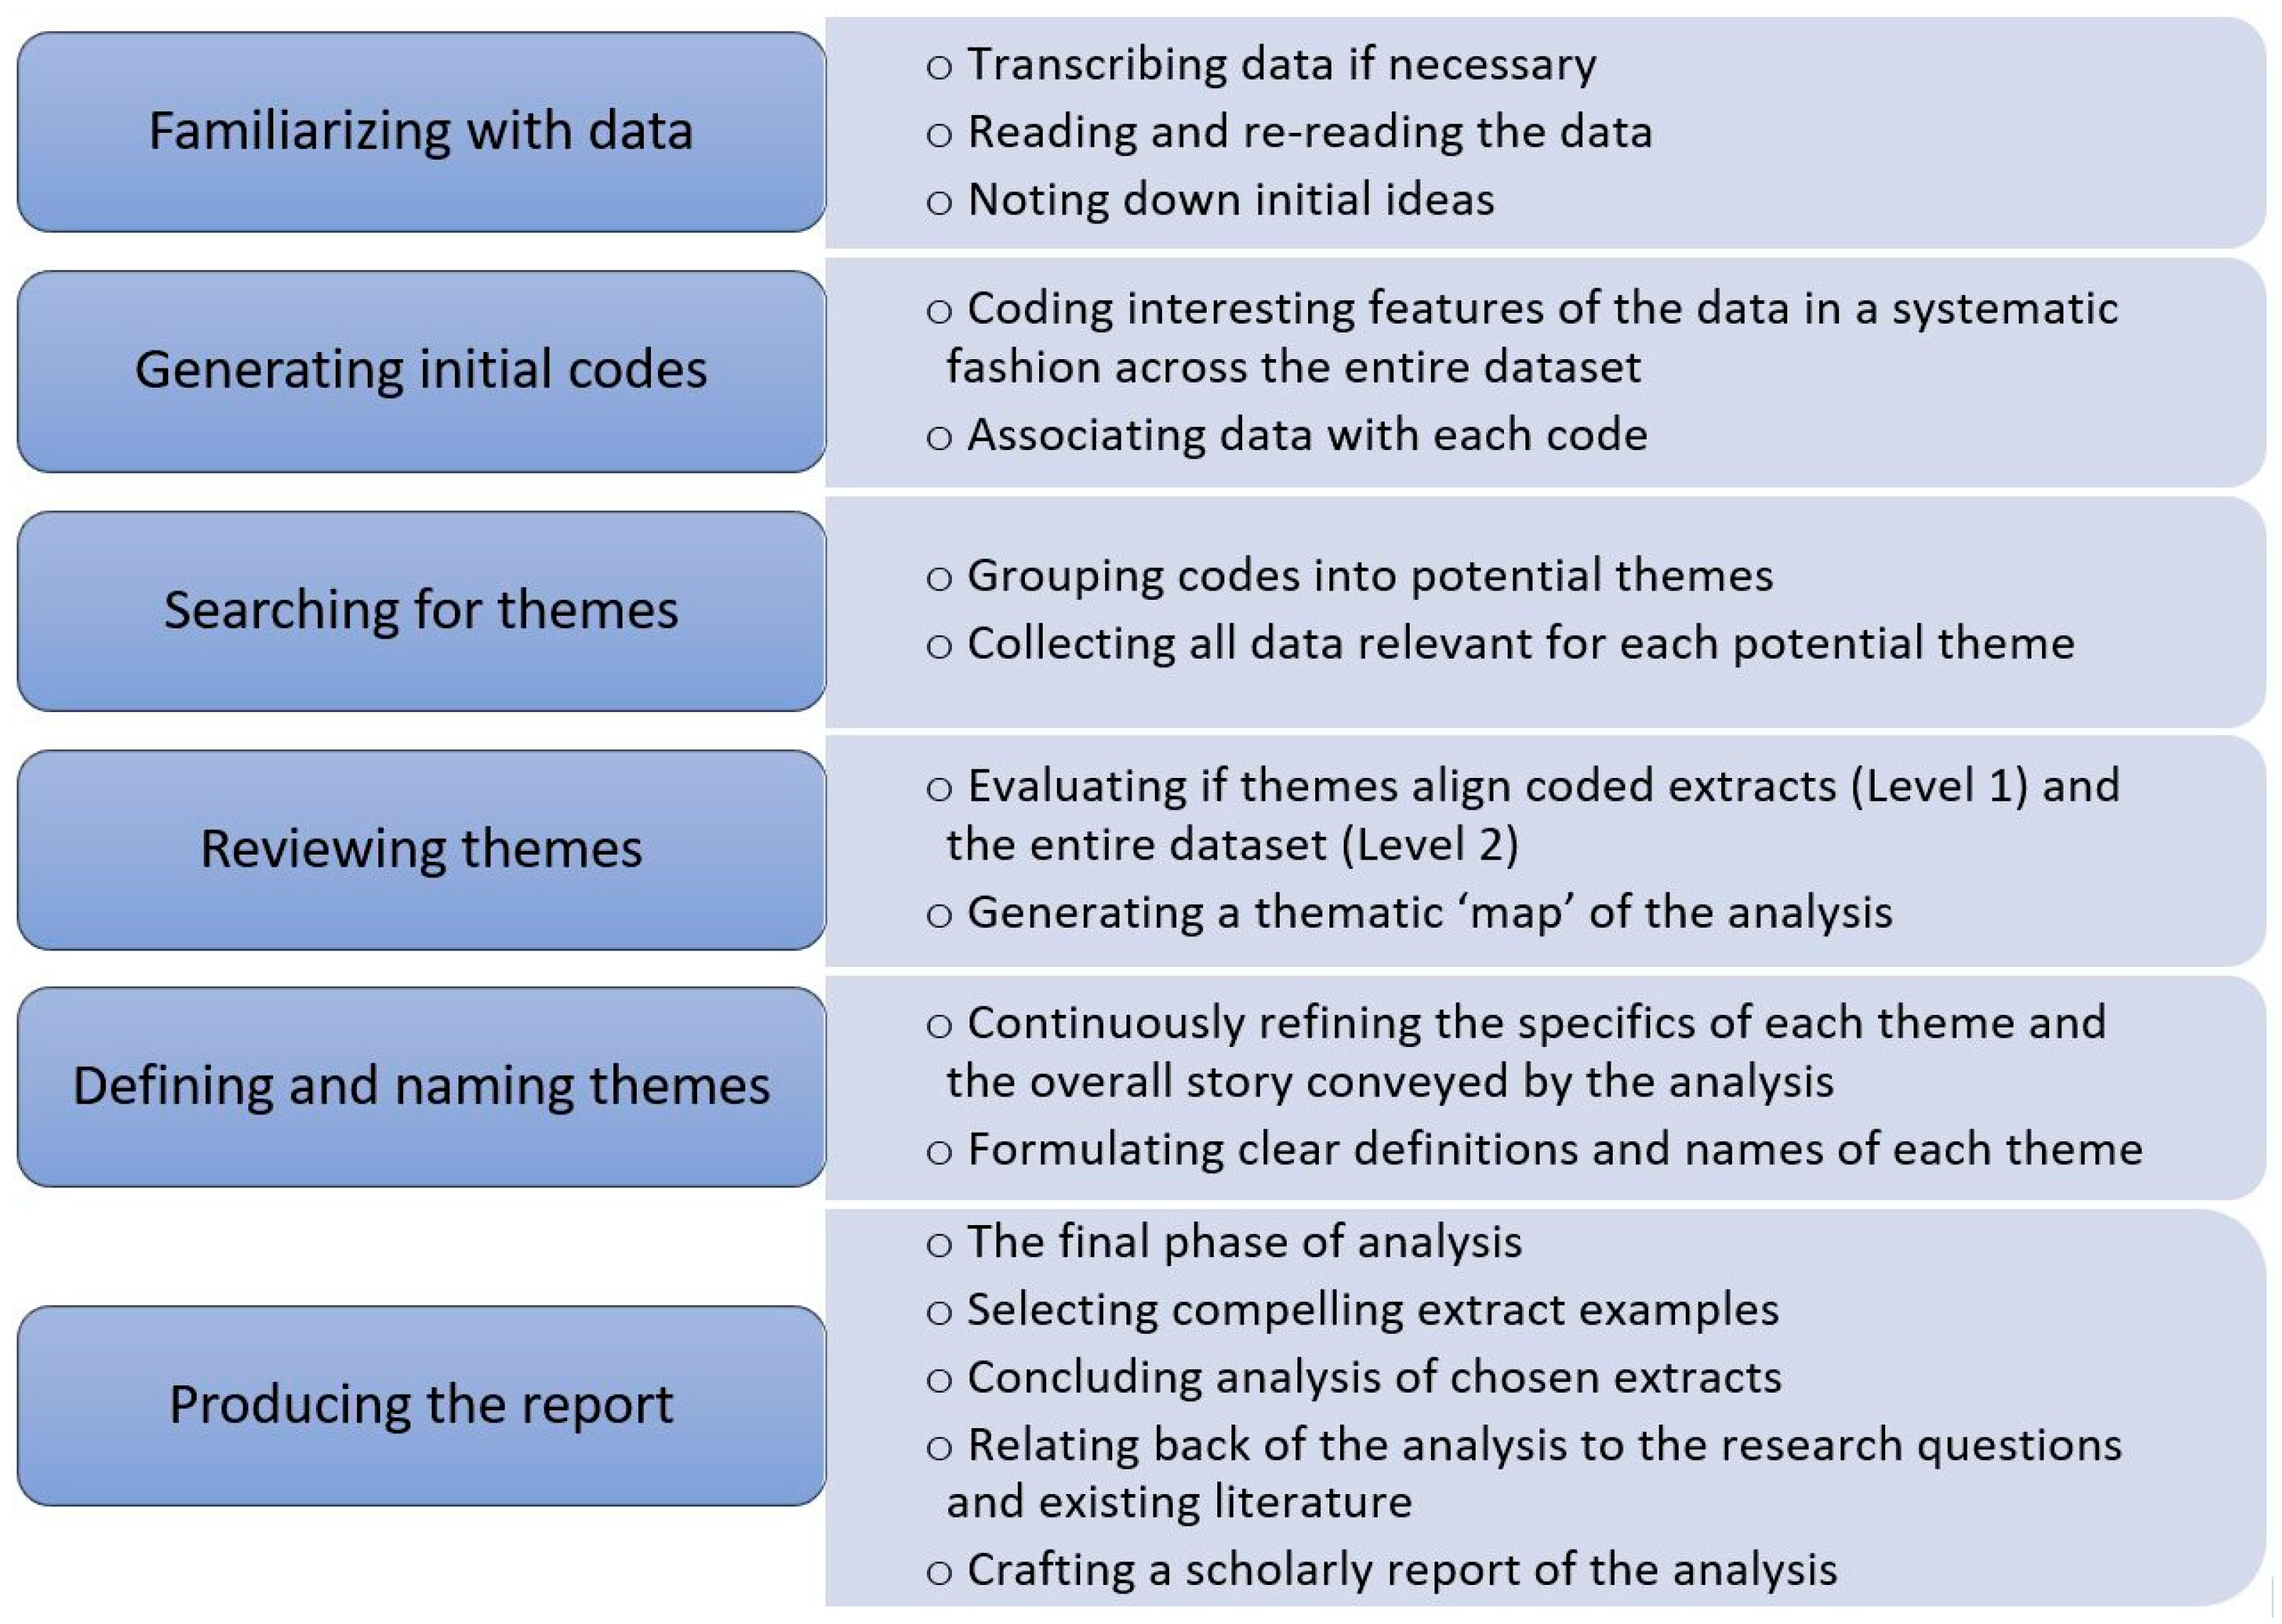
2.1. Research Design
2.2. Coding Language and Tools
2.3. Data Collection
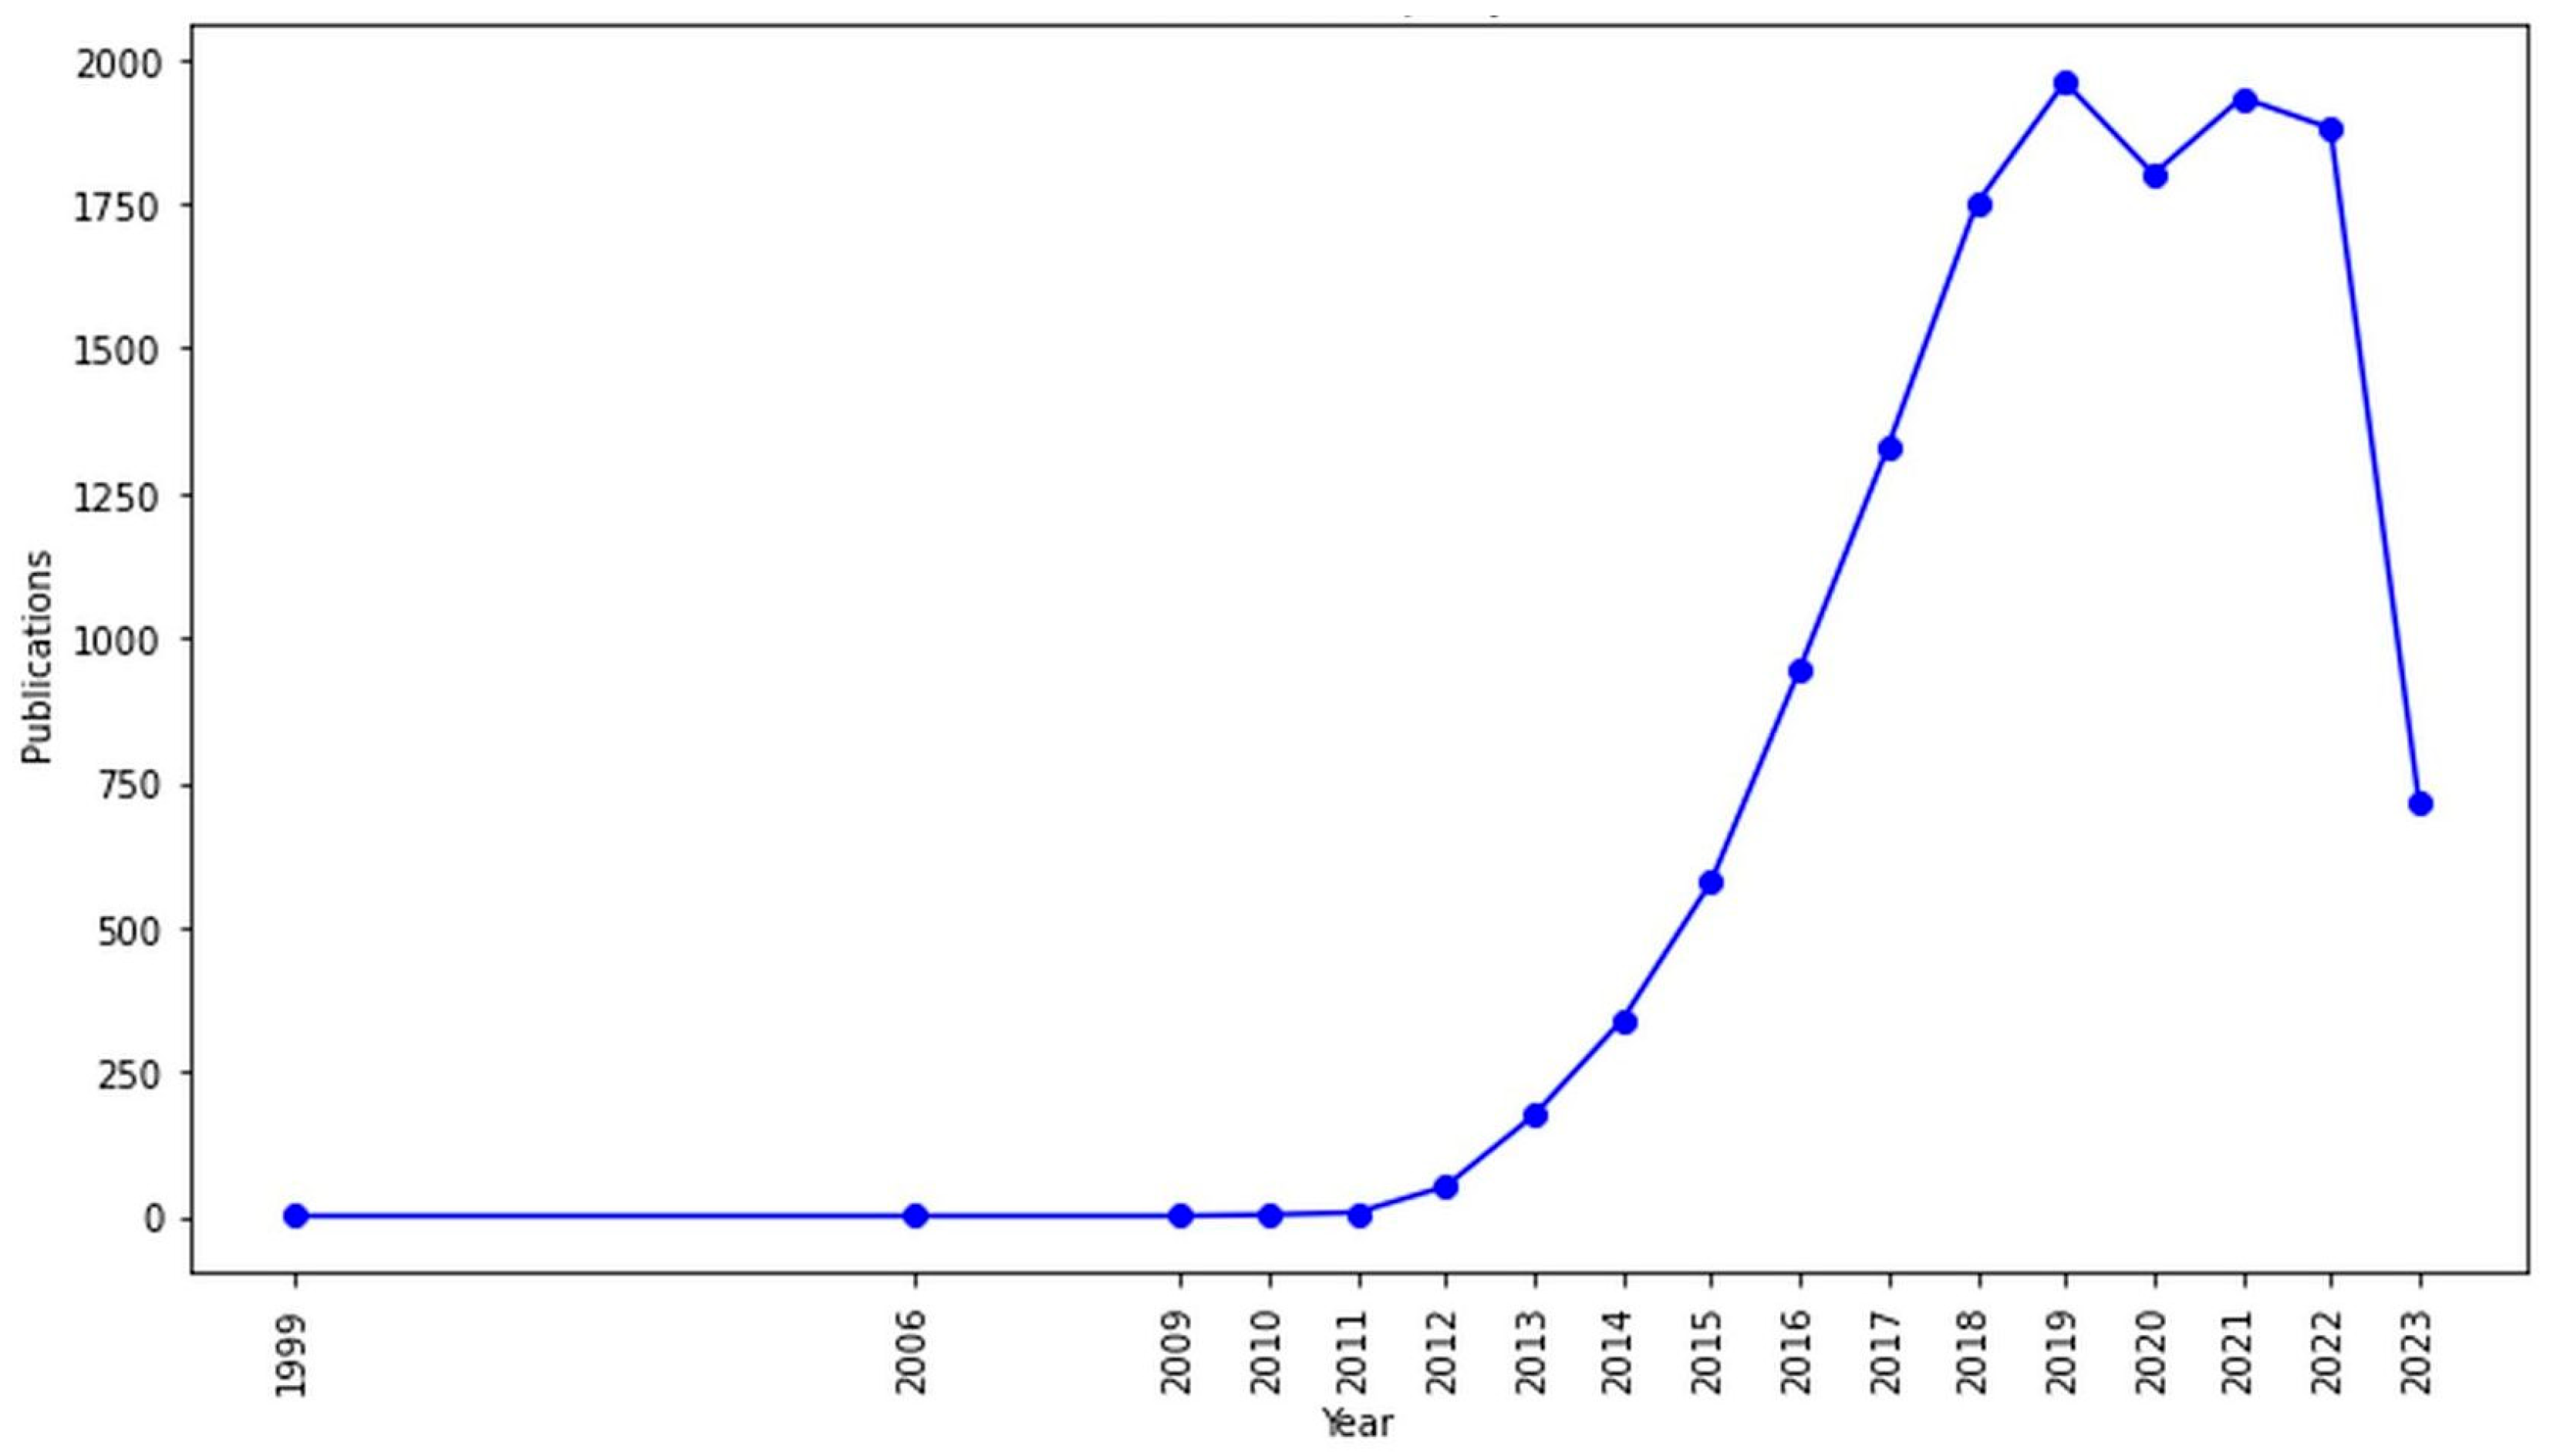
2.3.1. Scientific Papers
2.3.2. News Articles
2.3.3. Social Media
2.4. Text Data Preprocessing
2.5. Topic Modeling
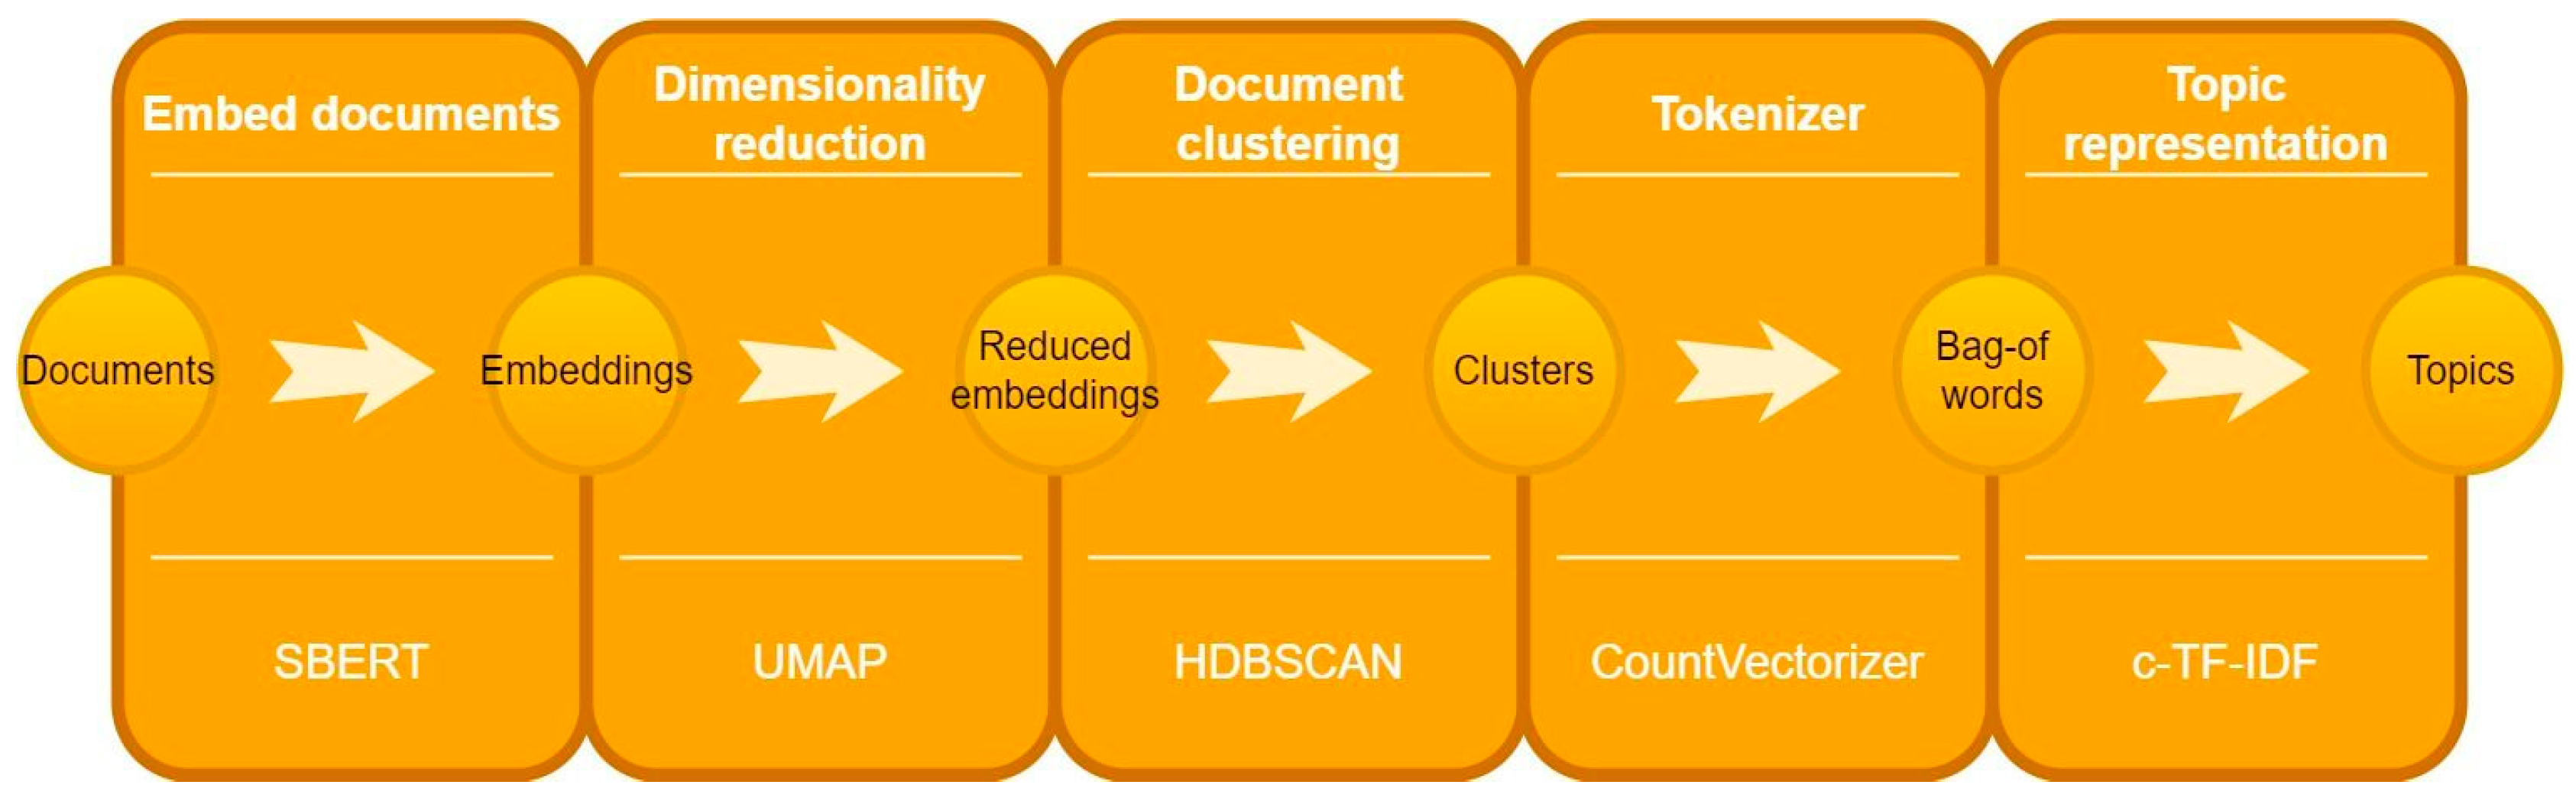
BERTopic
2.6. Evaluation, Visualization, Interpretation, and Optimization
2.6.1. Evaluation
2.6.2. Visualization
2.6.3. Interpretation
2.6.4. Optimization
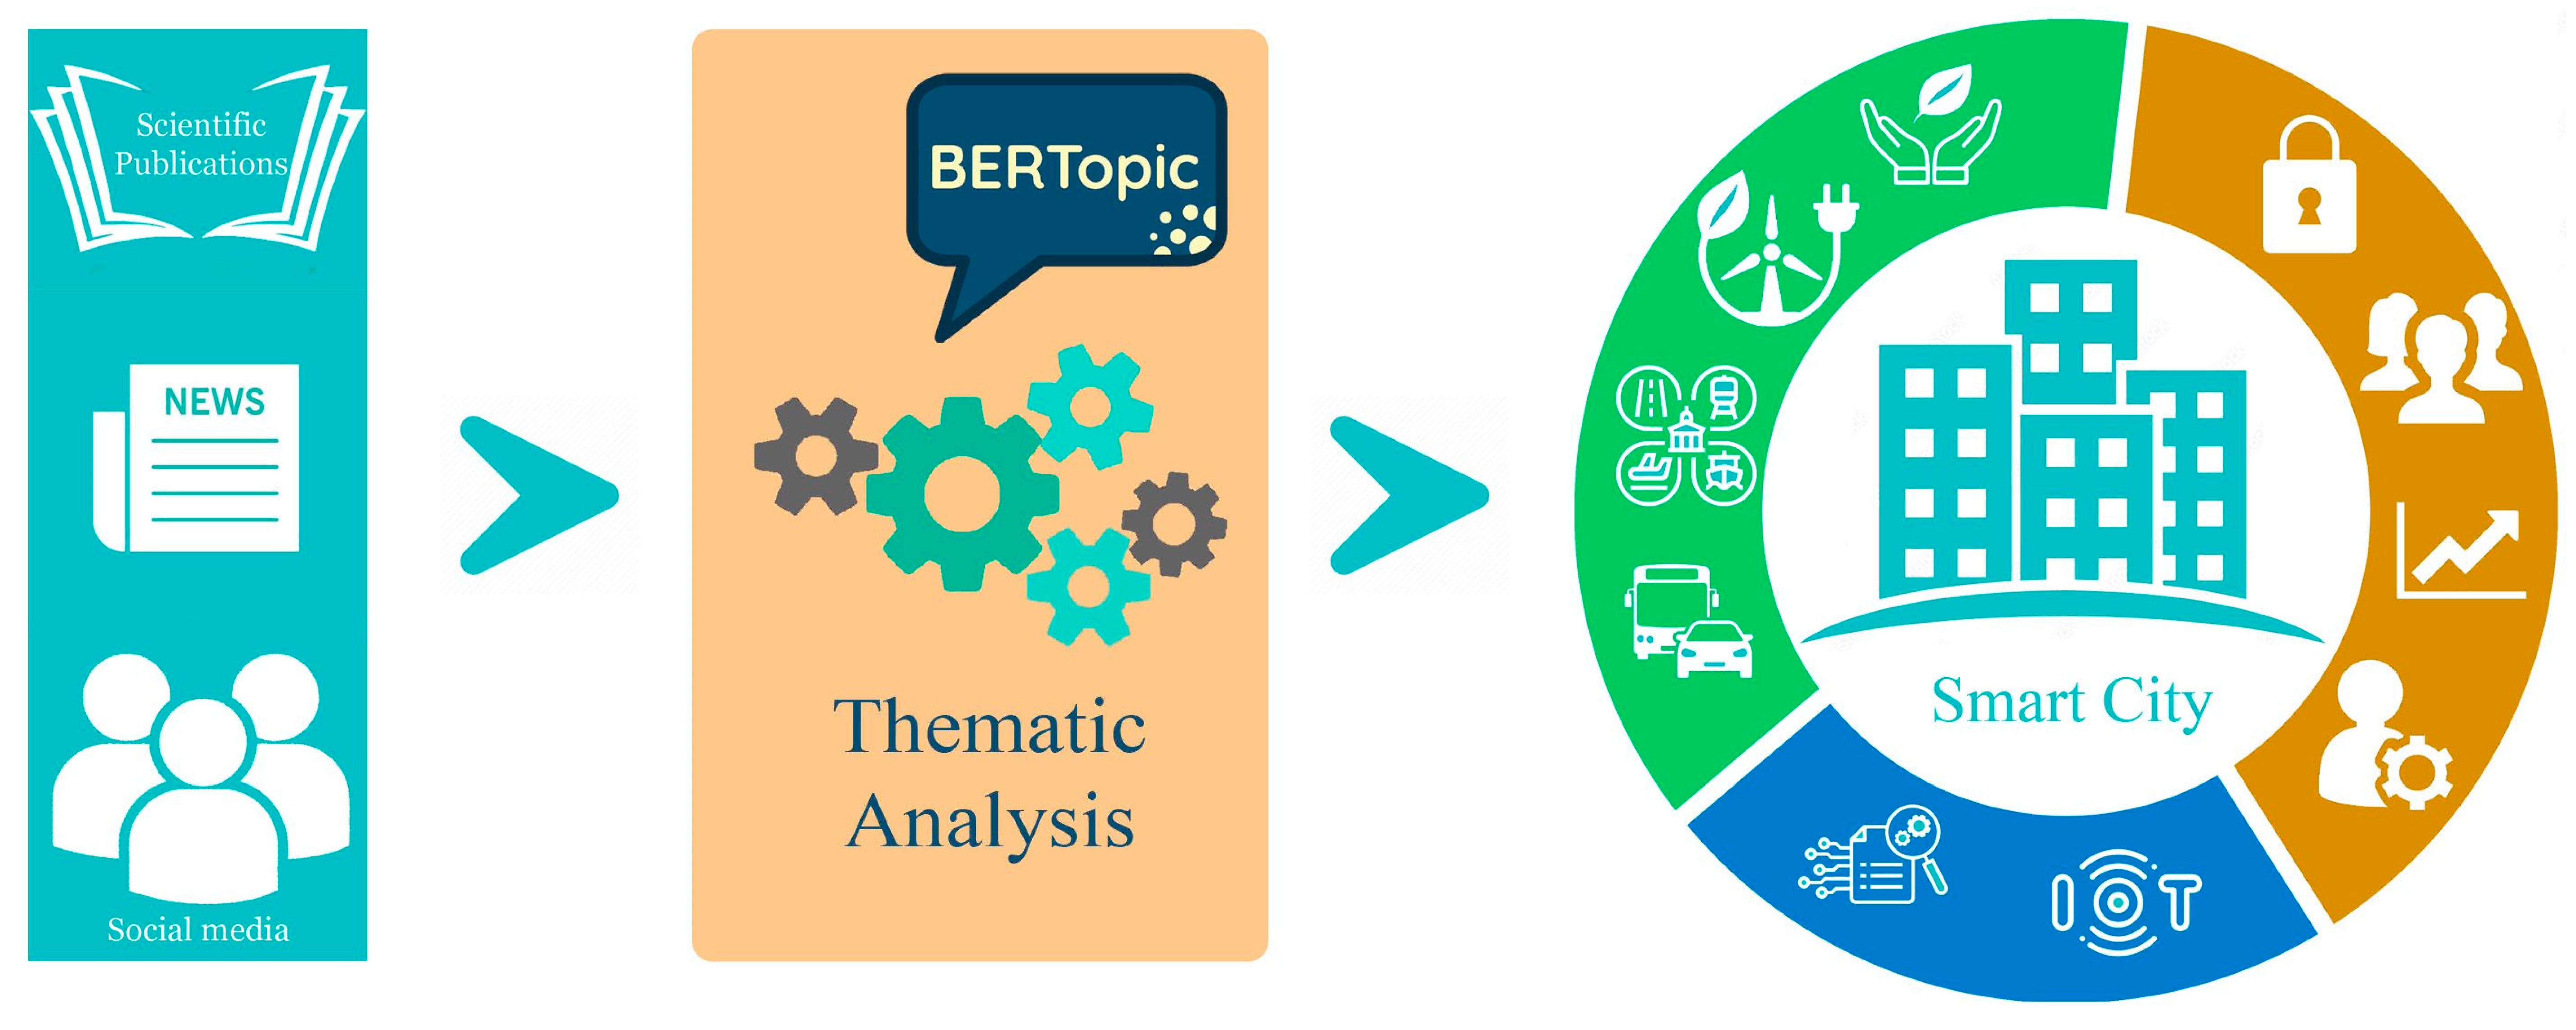
2.7. Thematic Analysis
3. Results
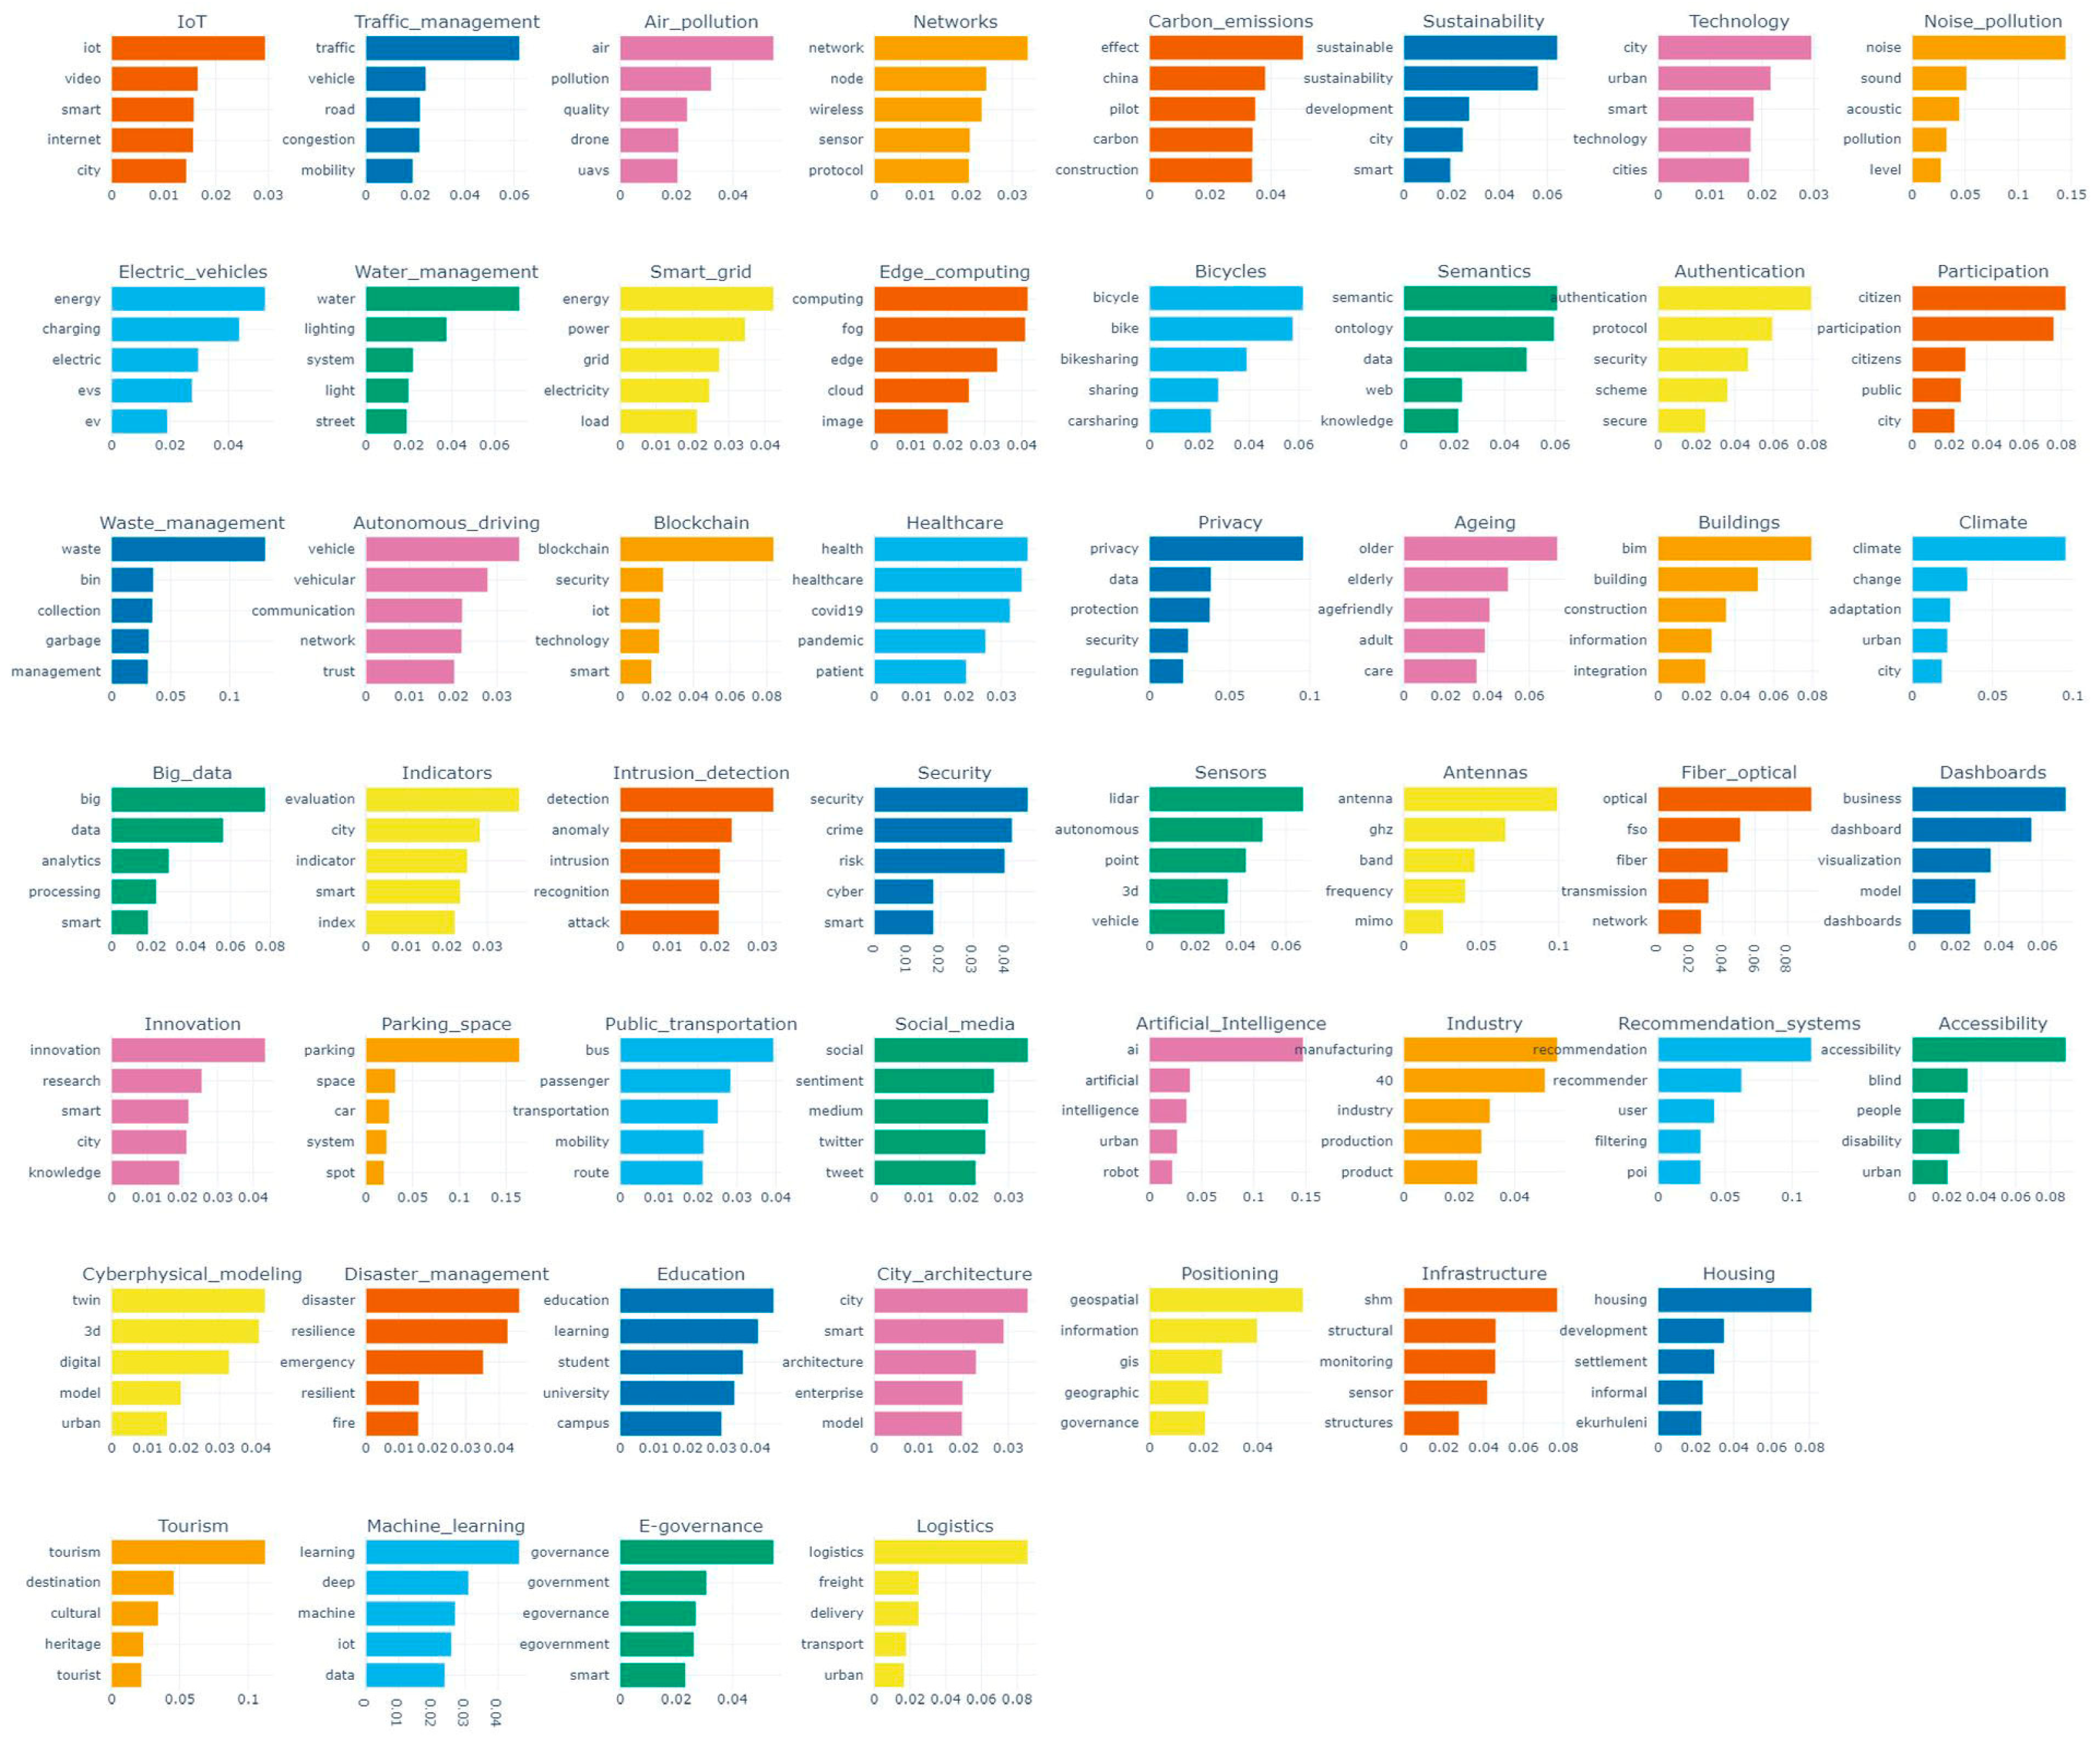
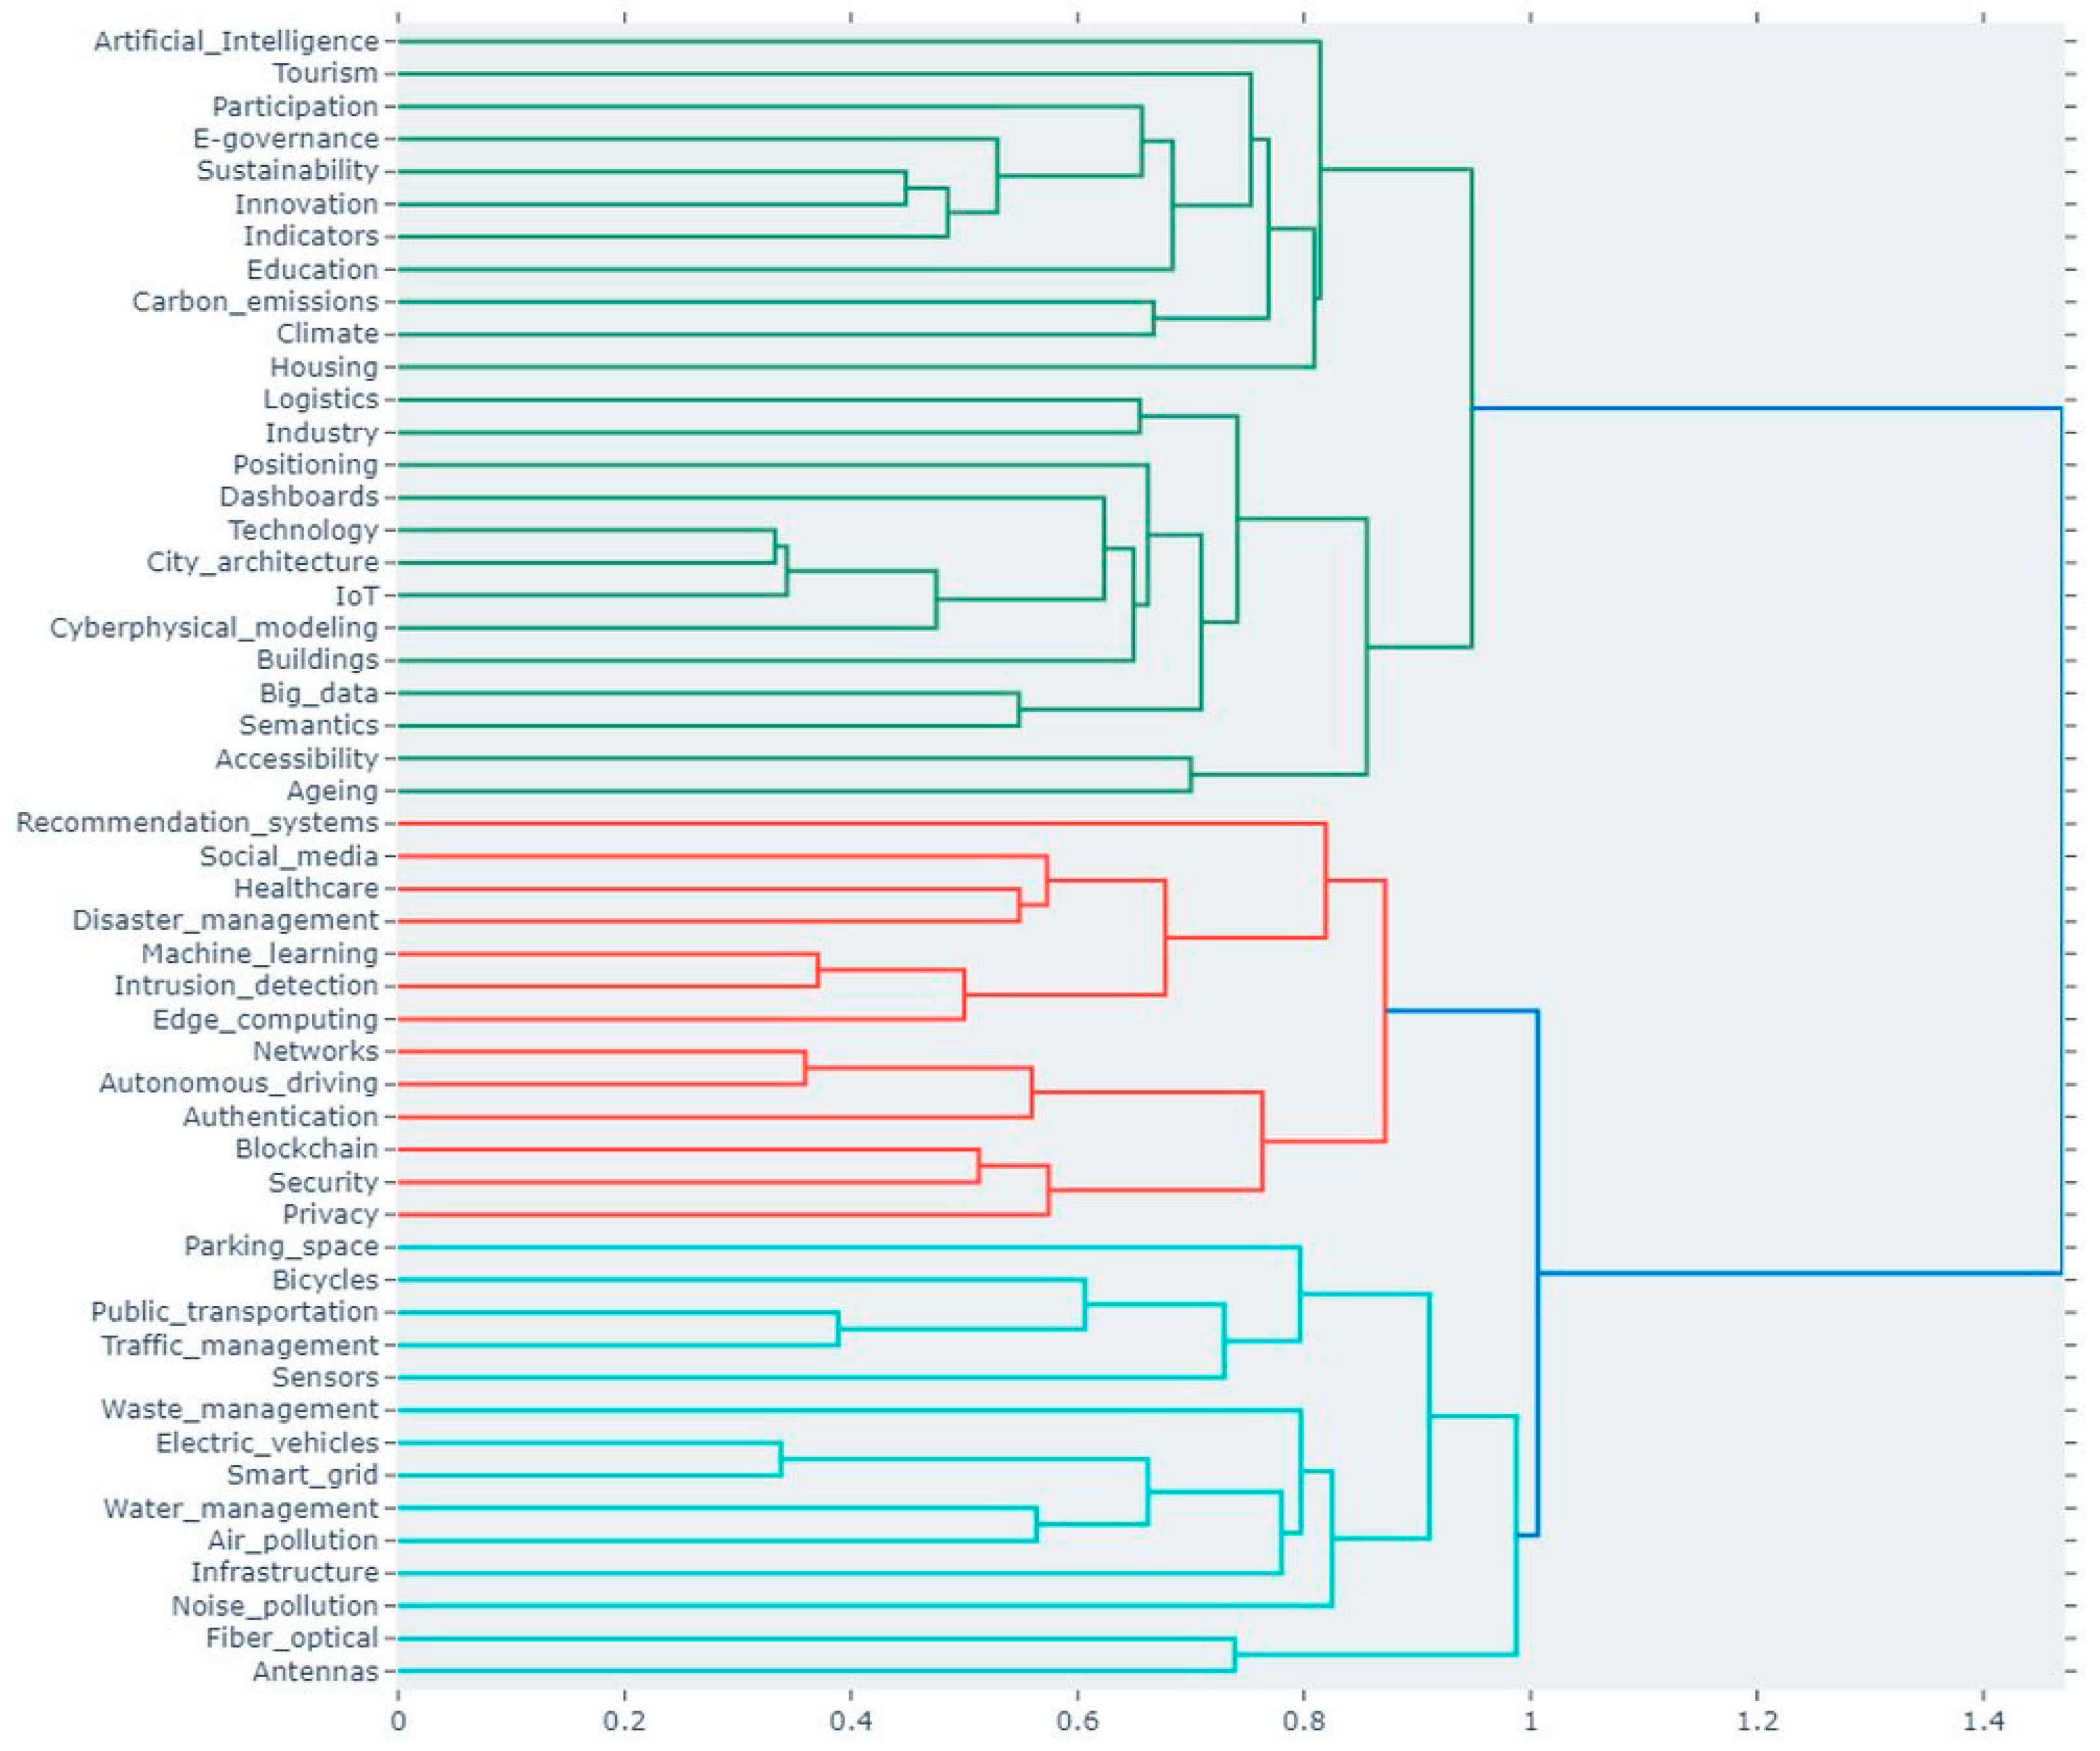
3.1. Scientific Publication Abstracts
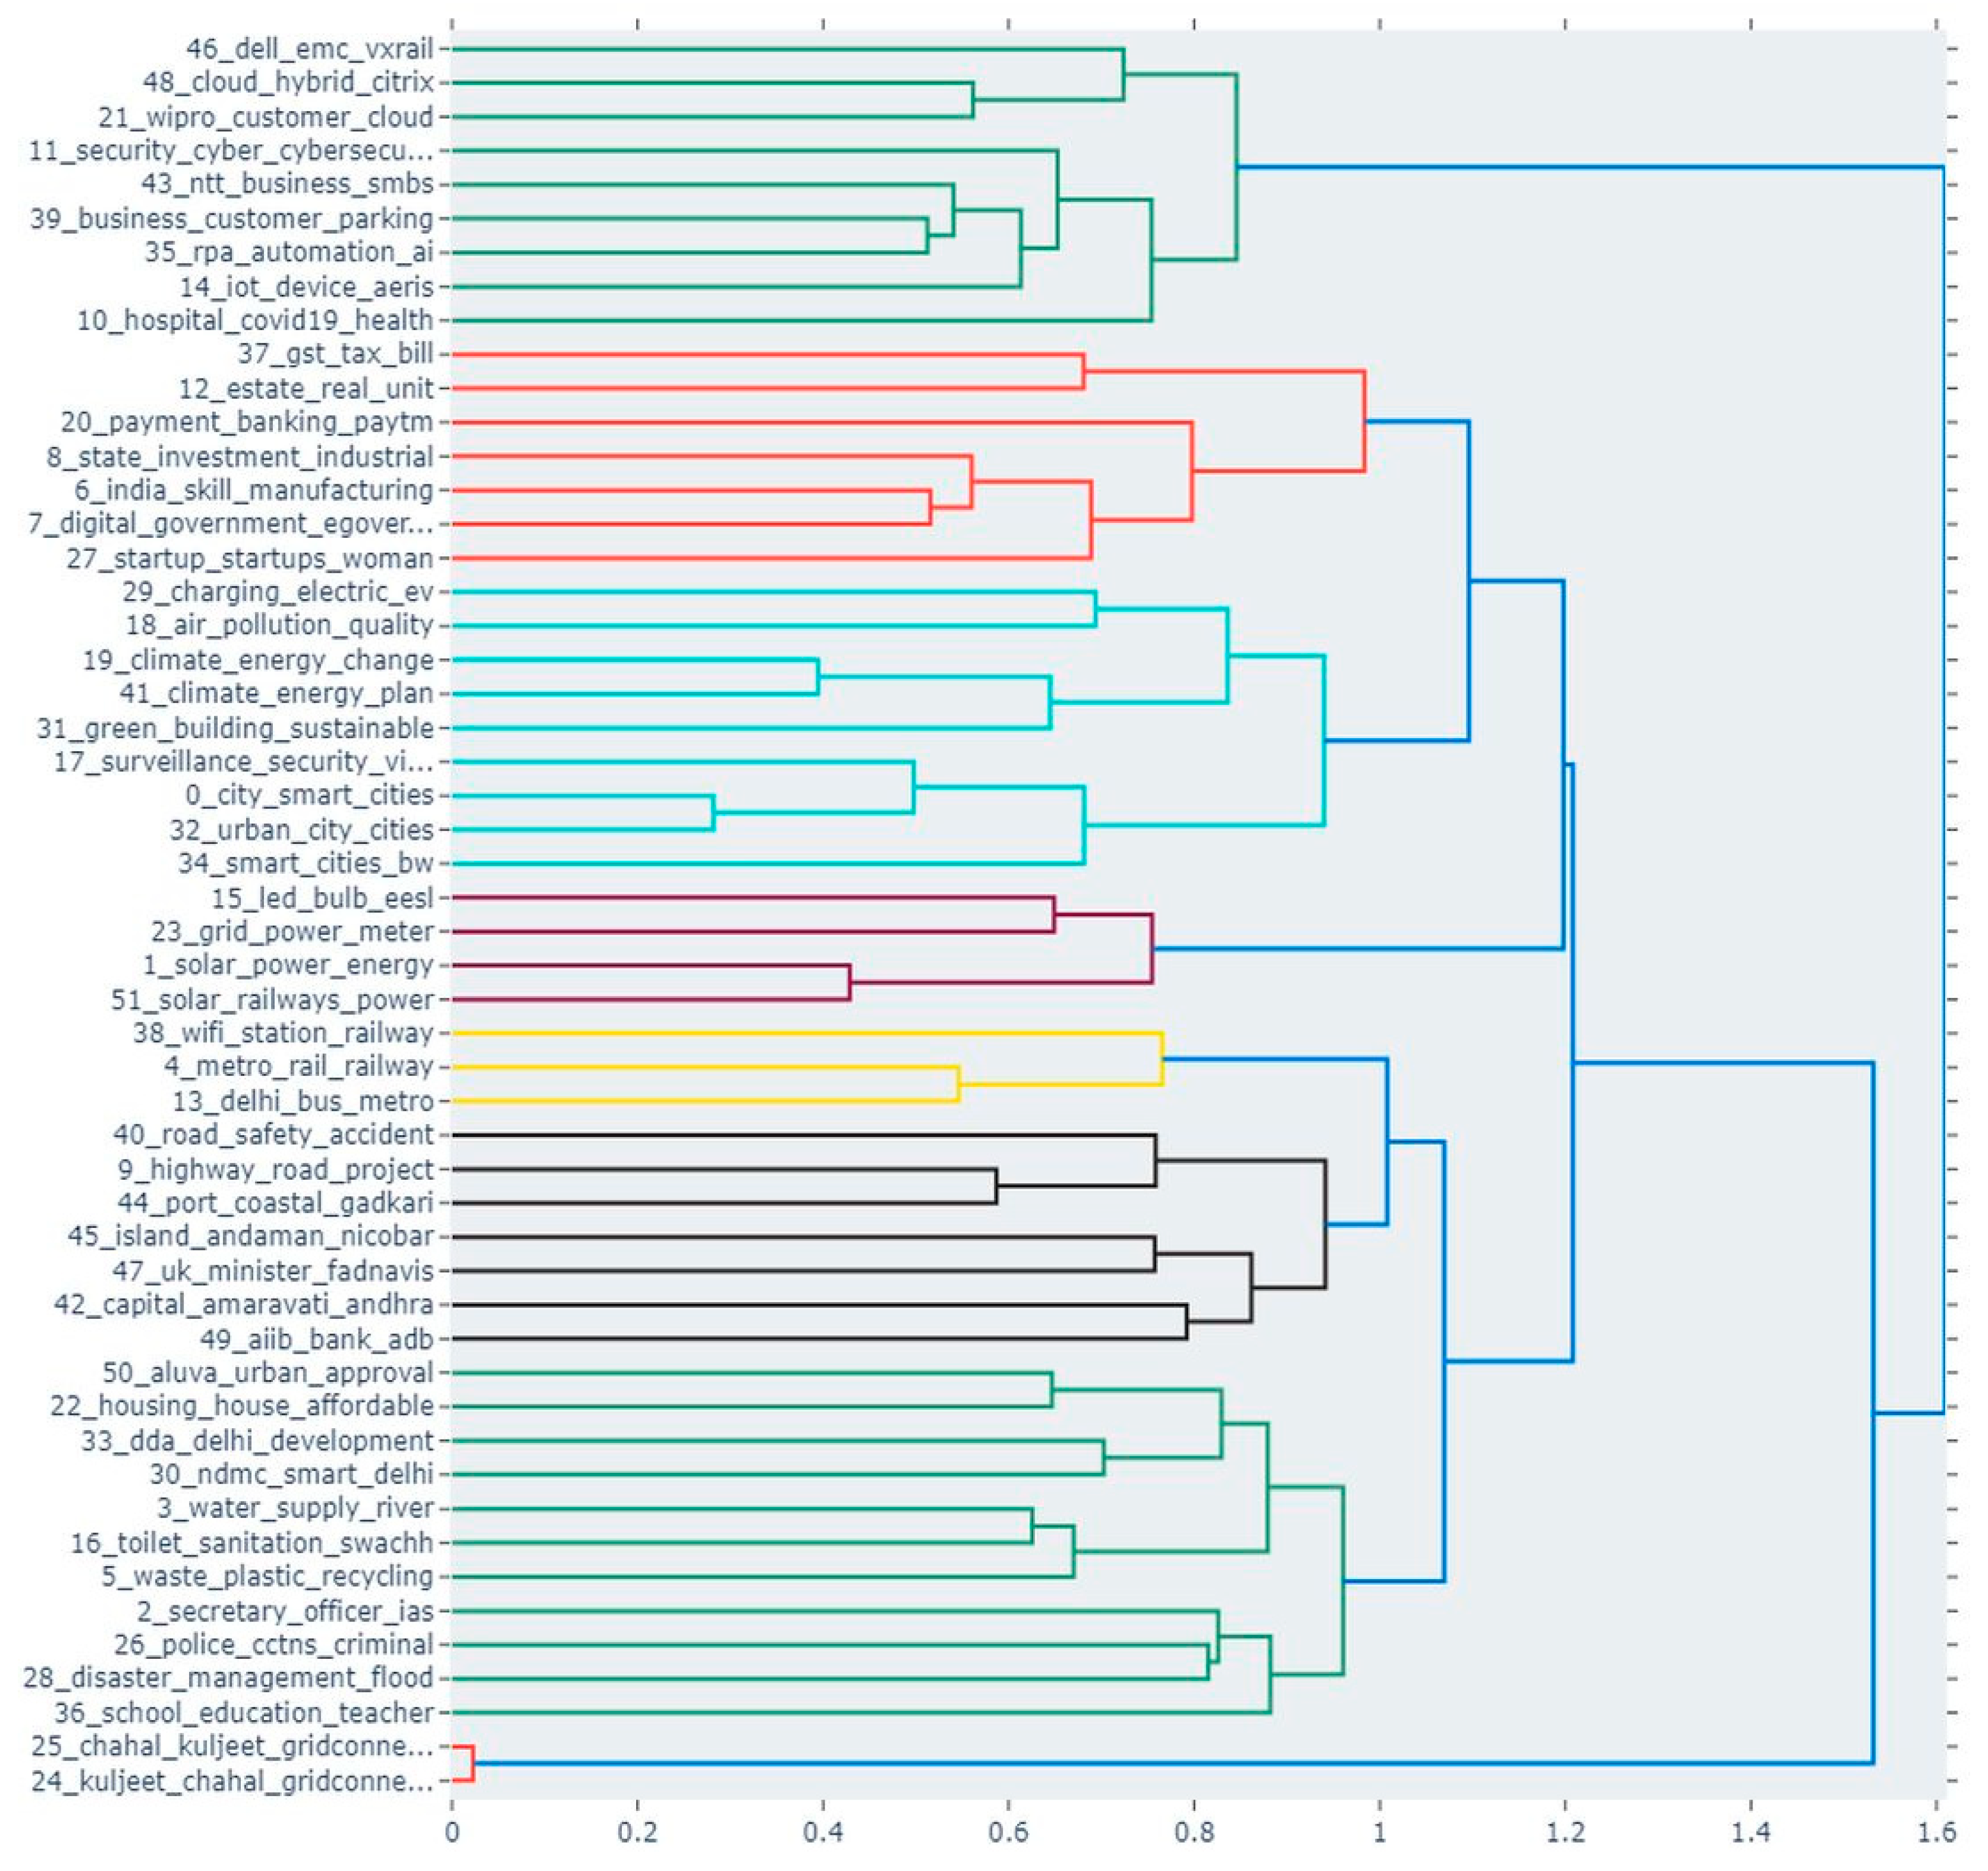
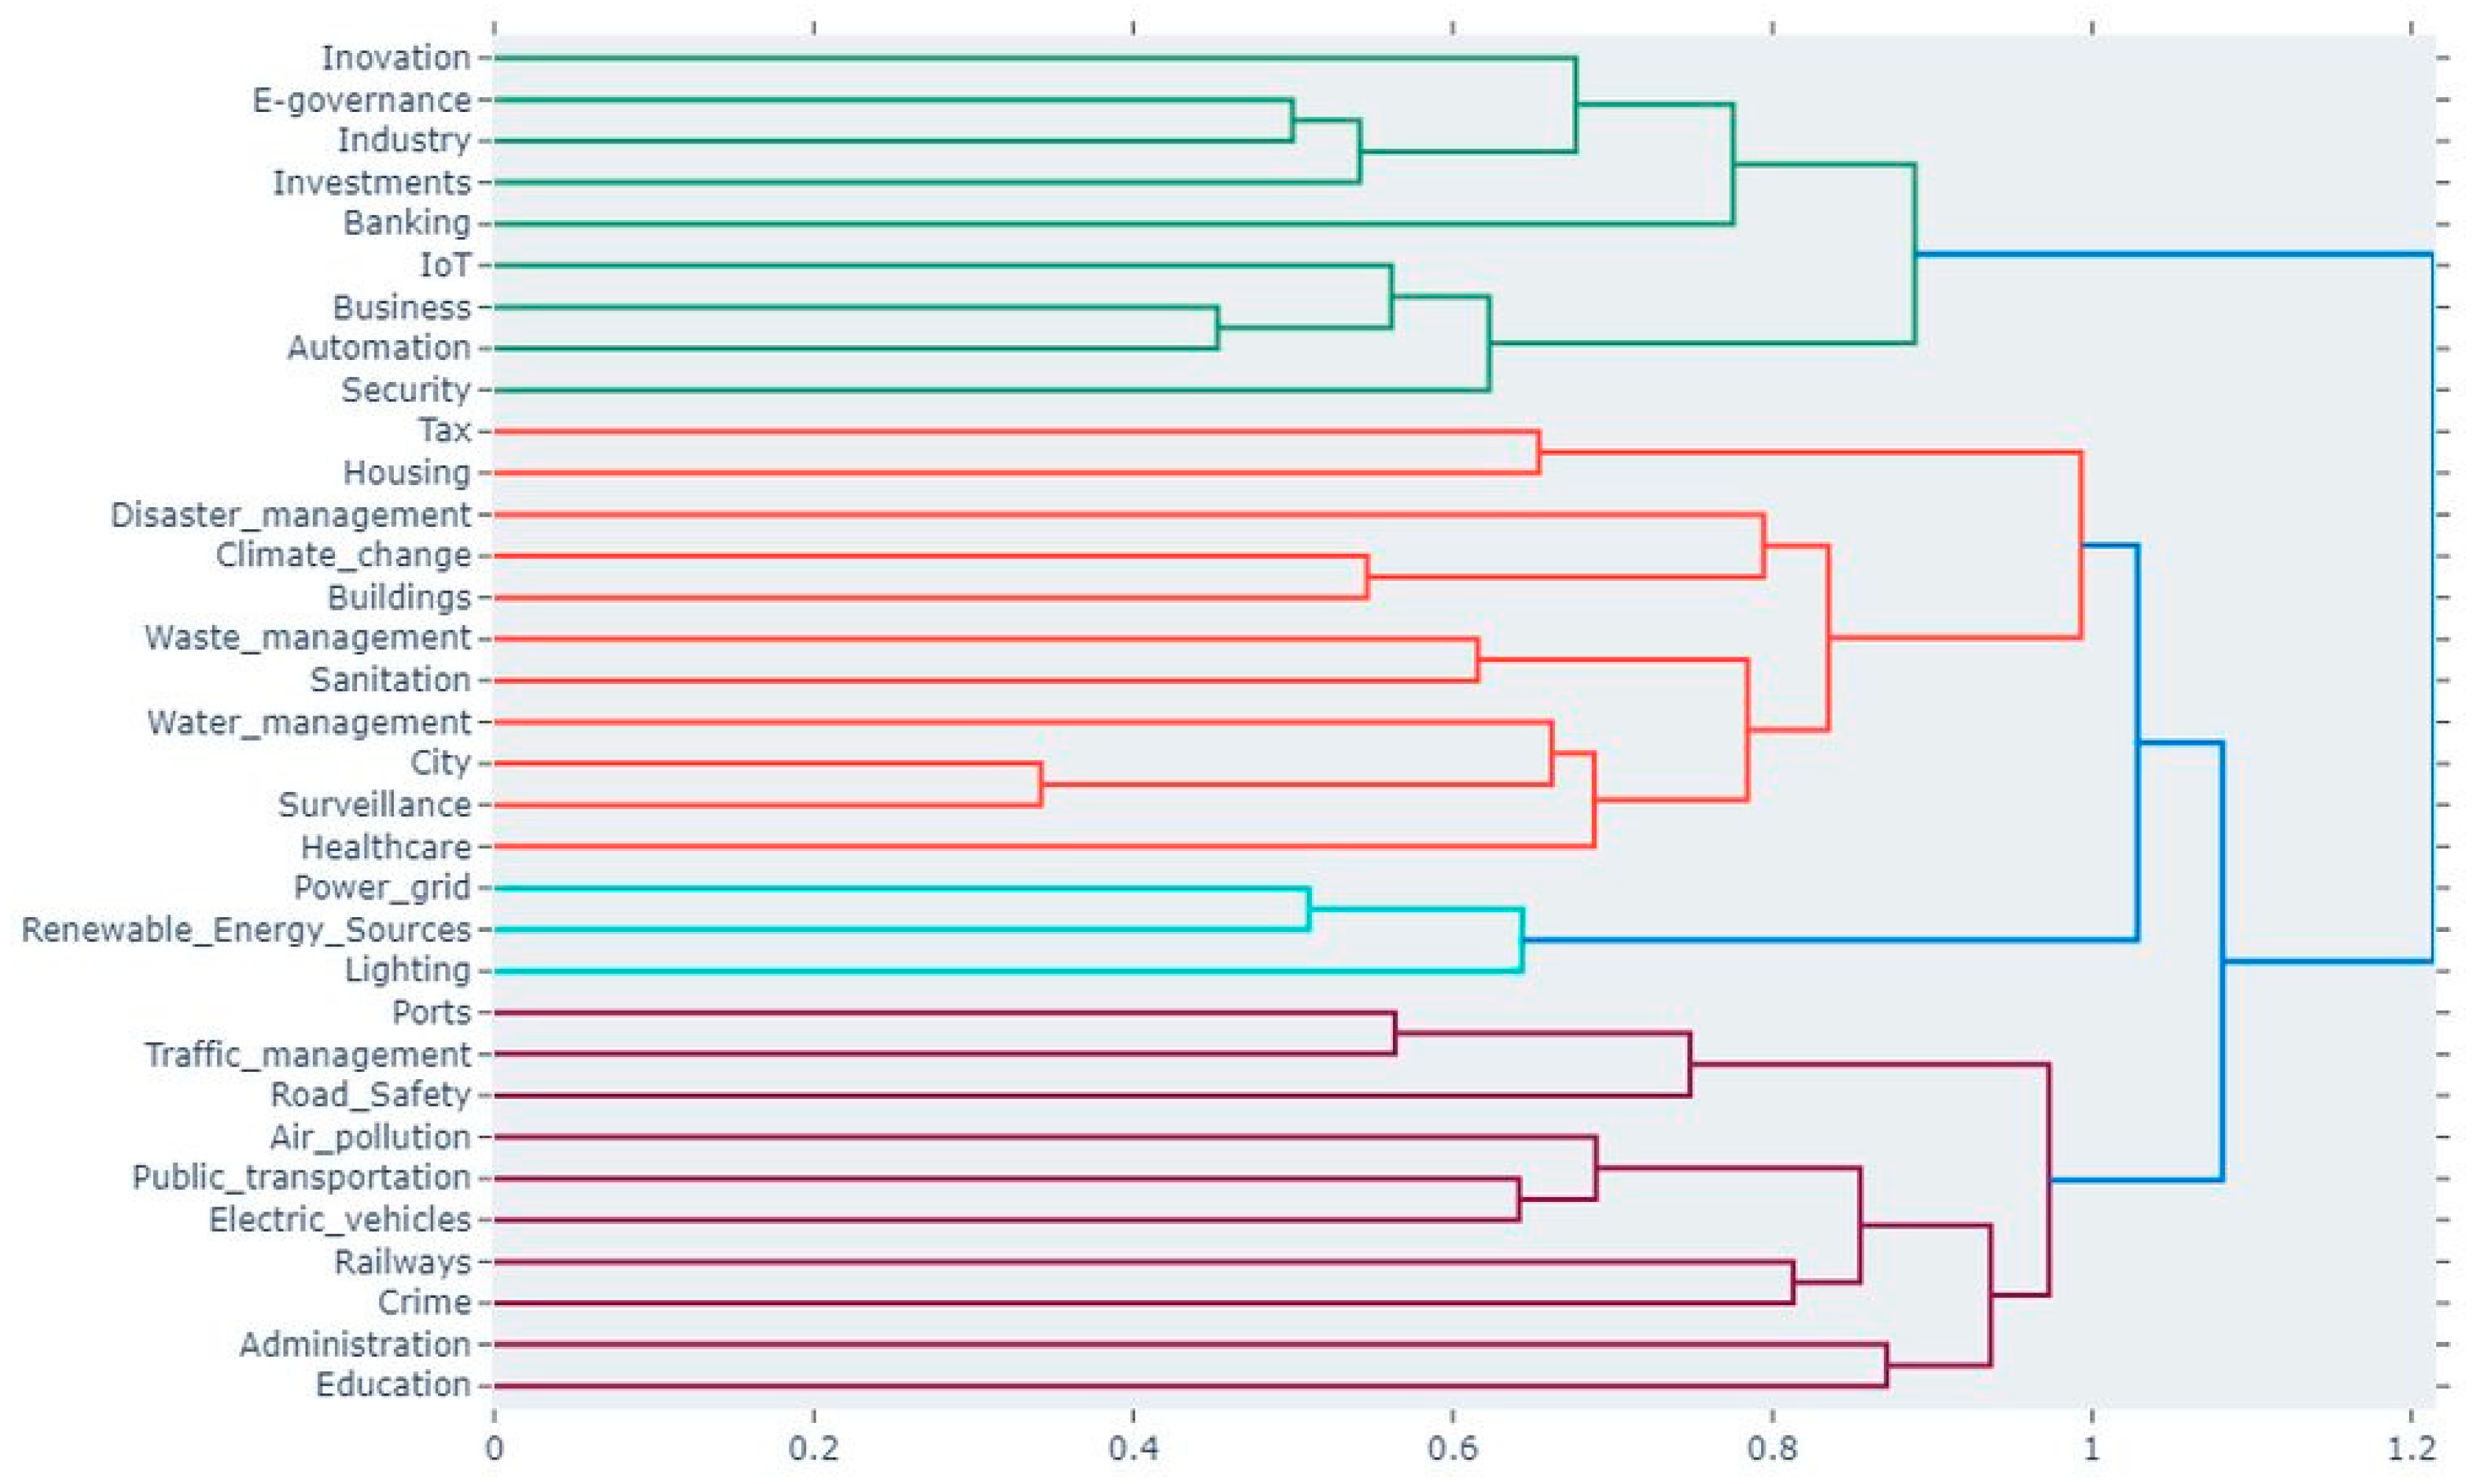
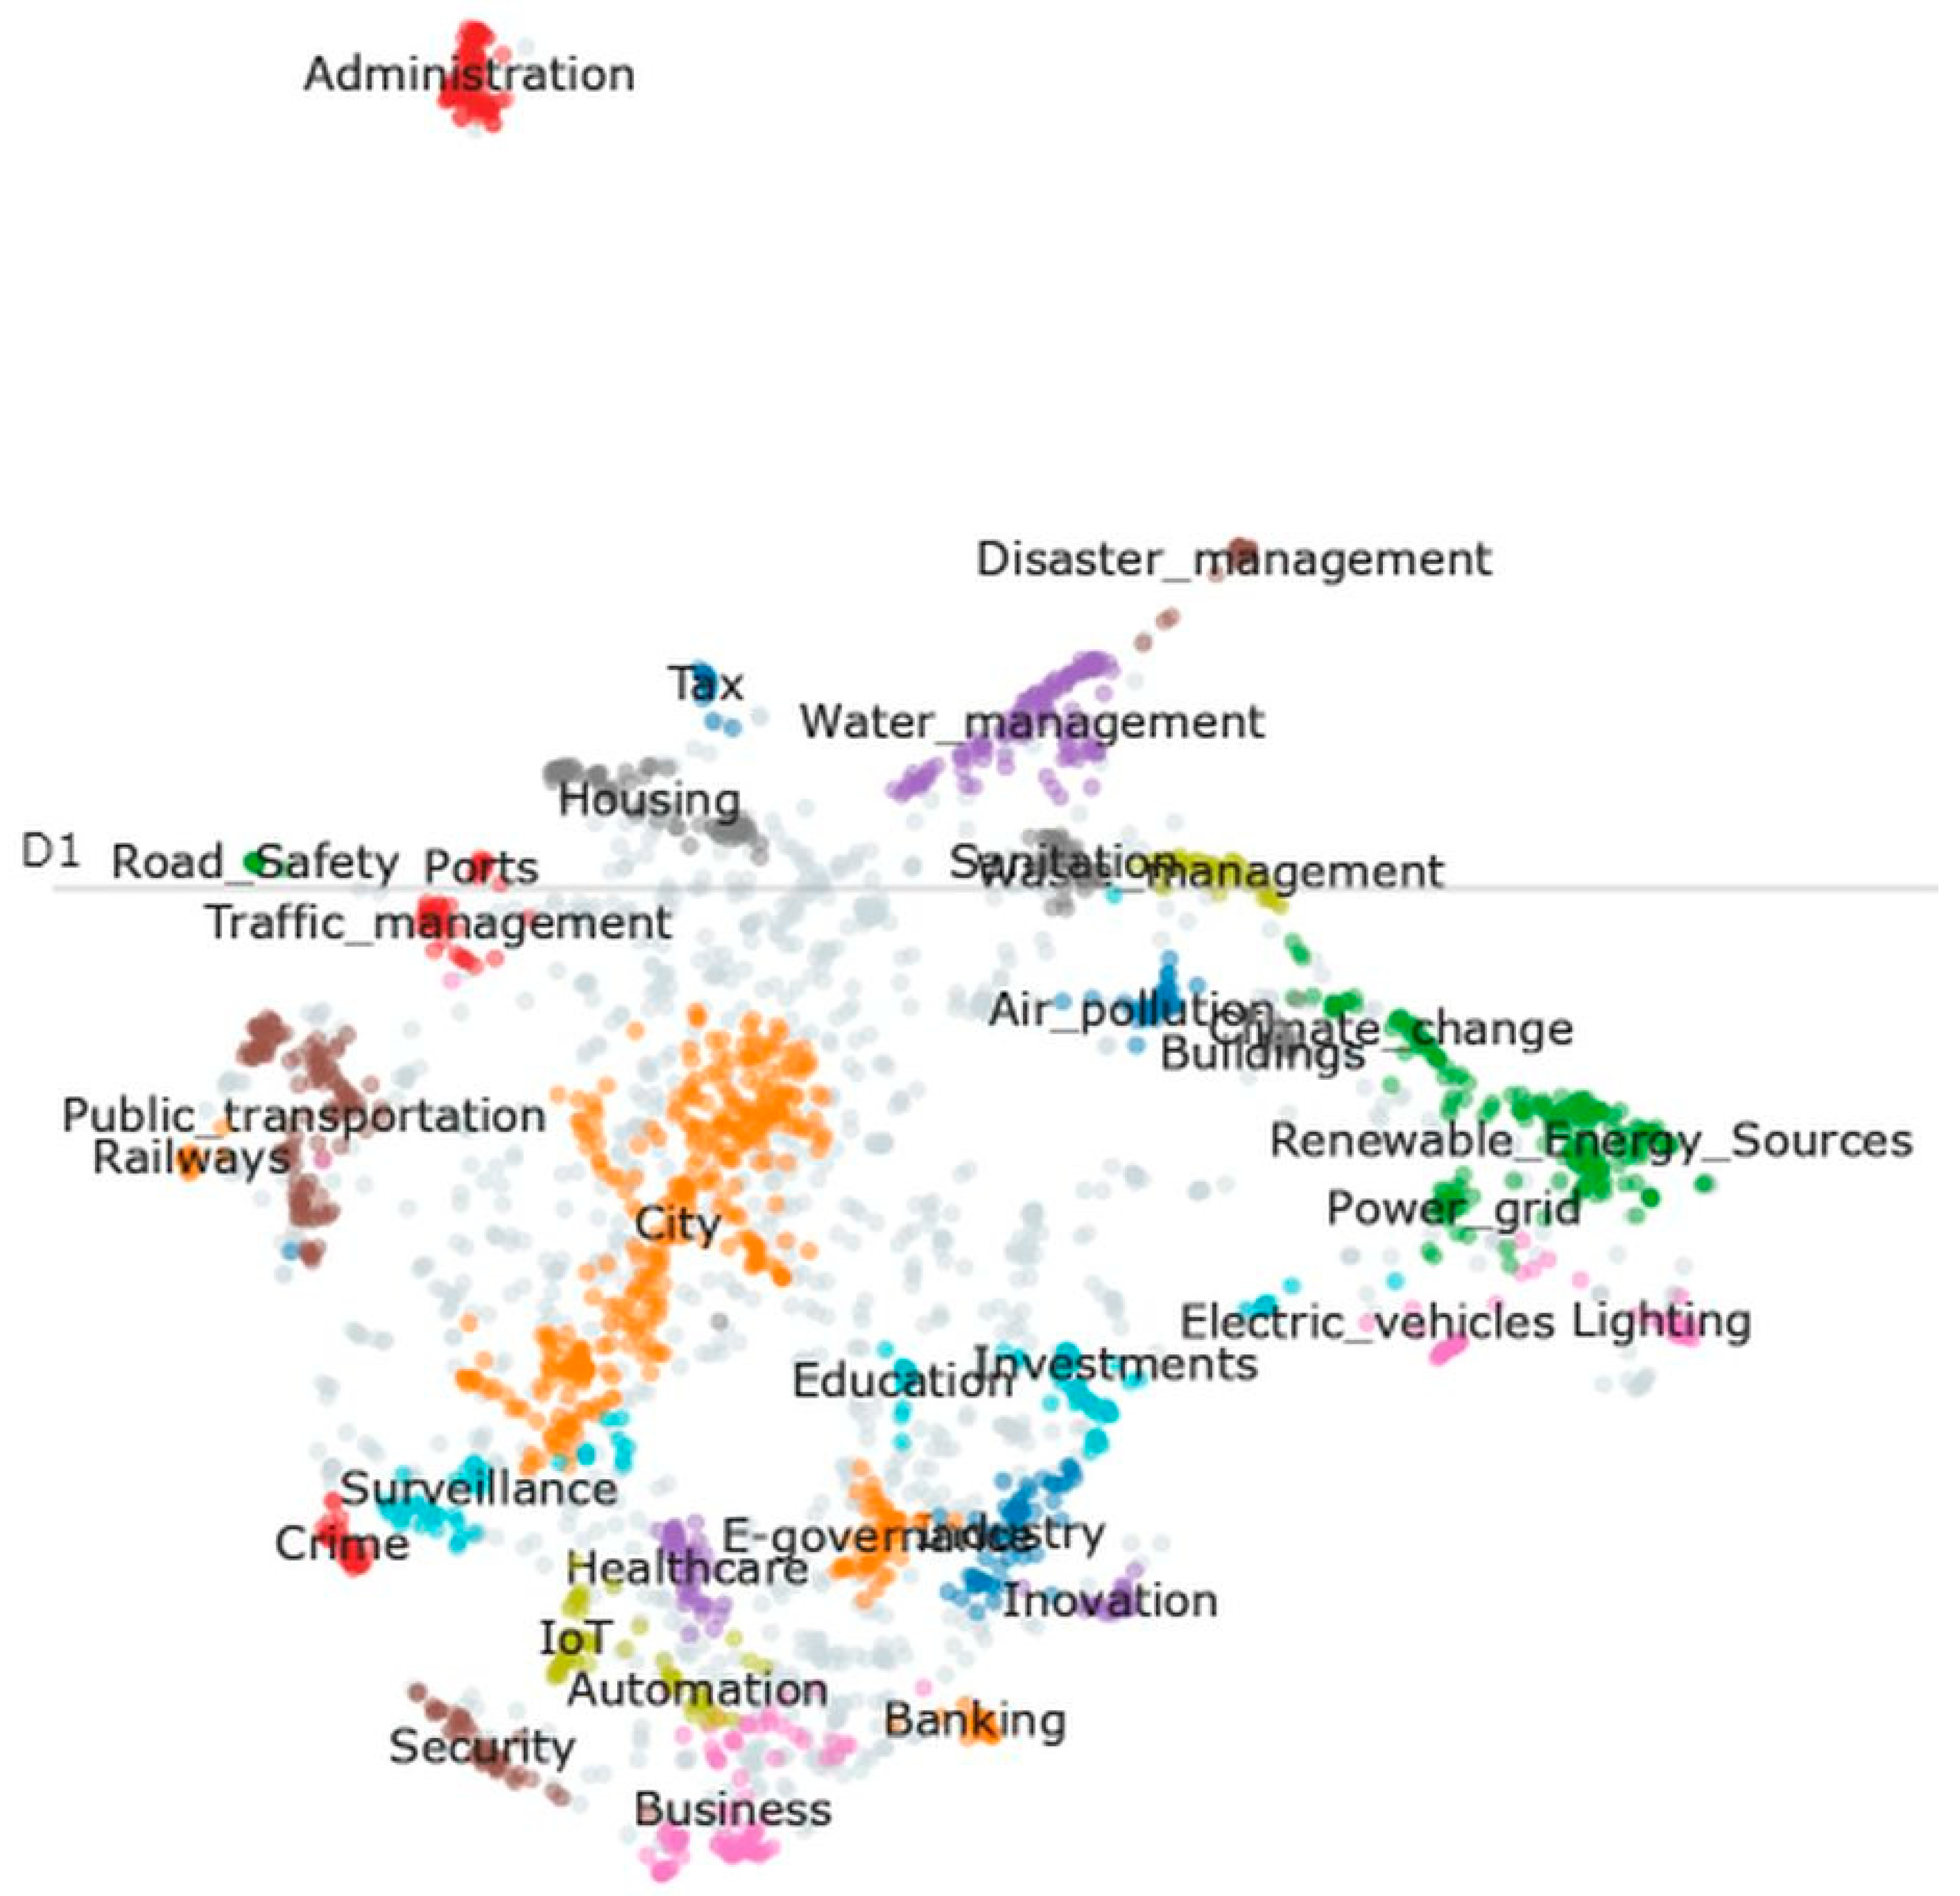
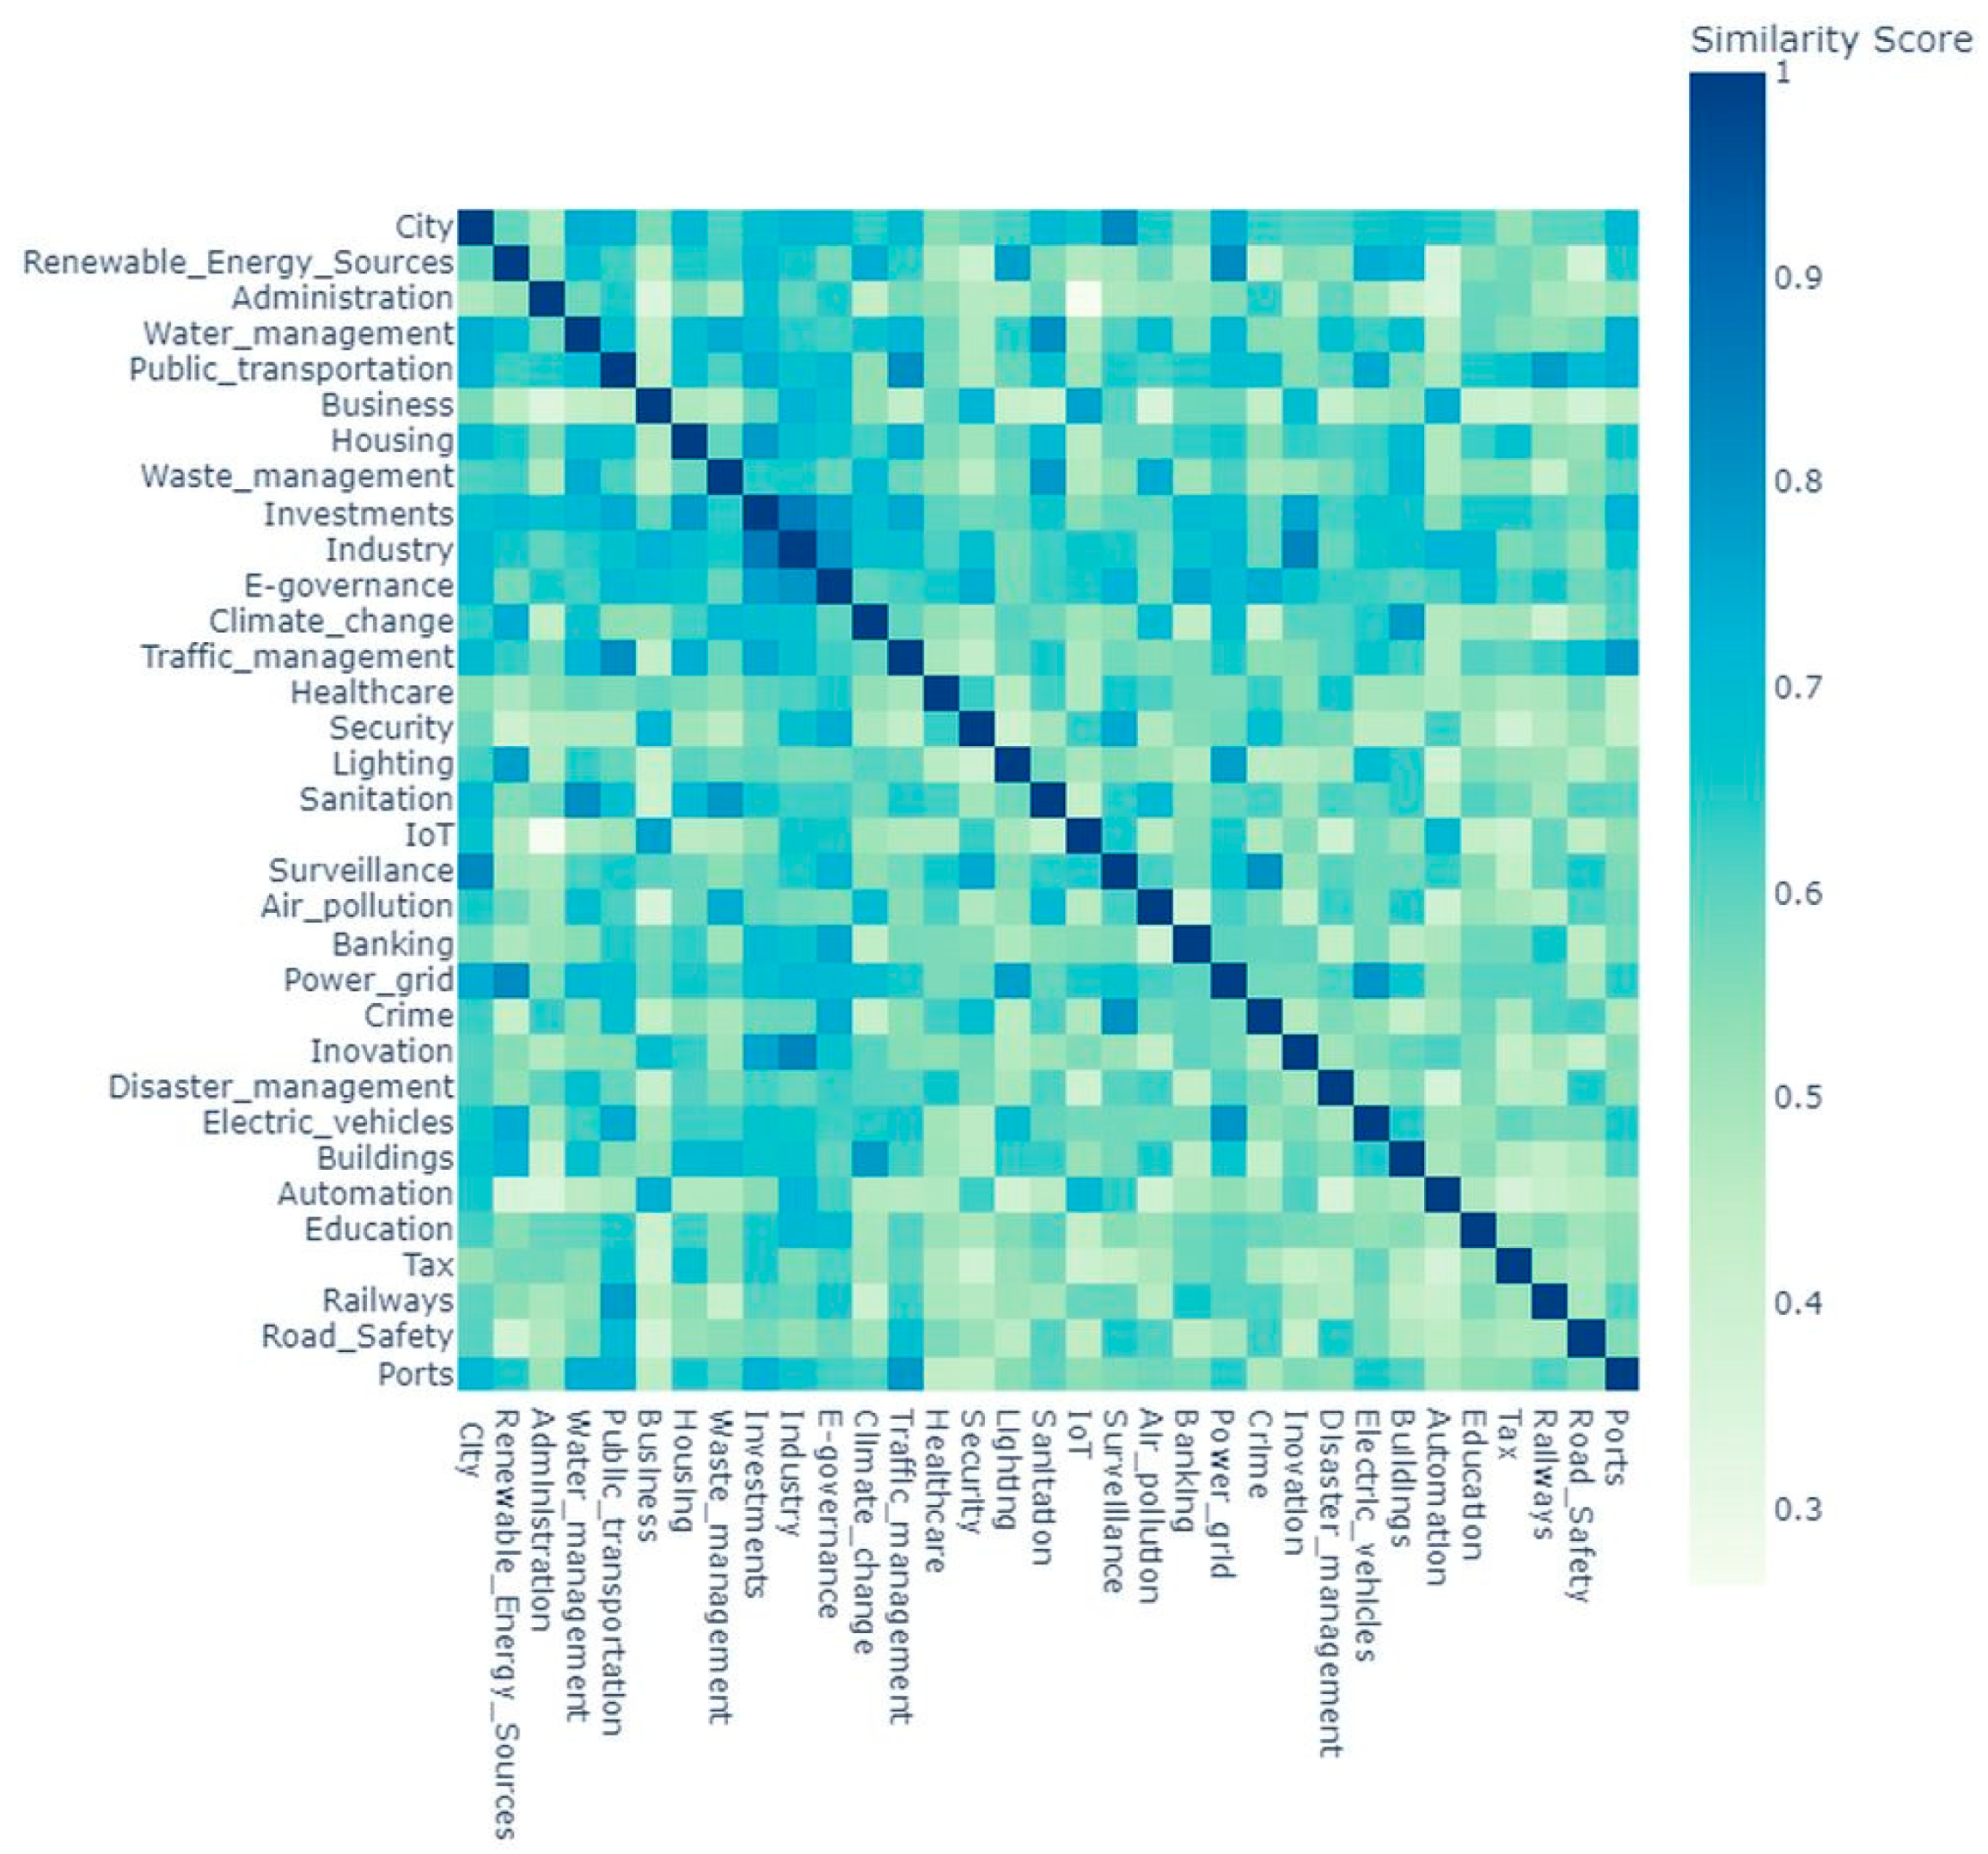
3.2. News Blog Posts
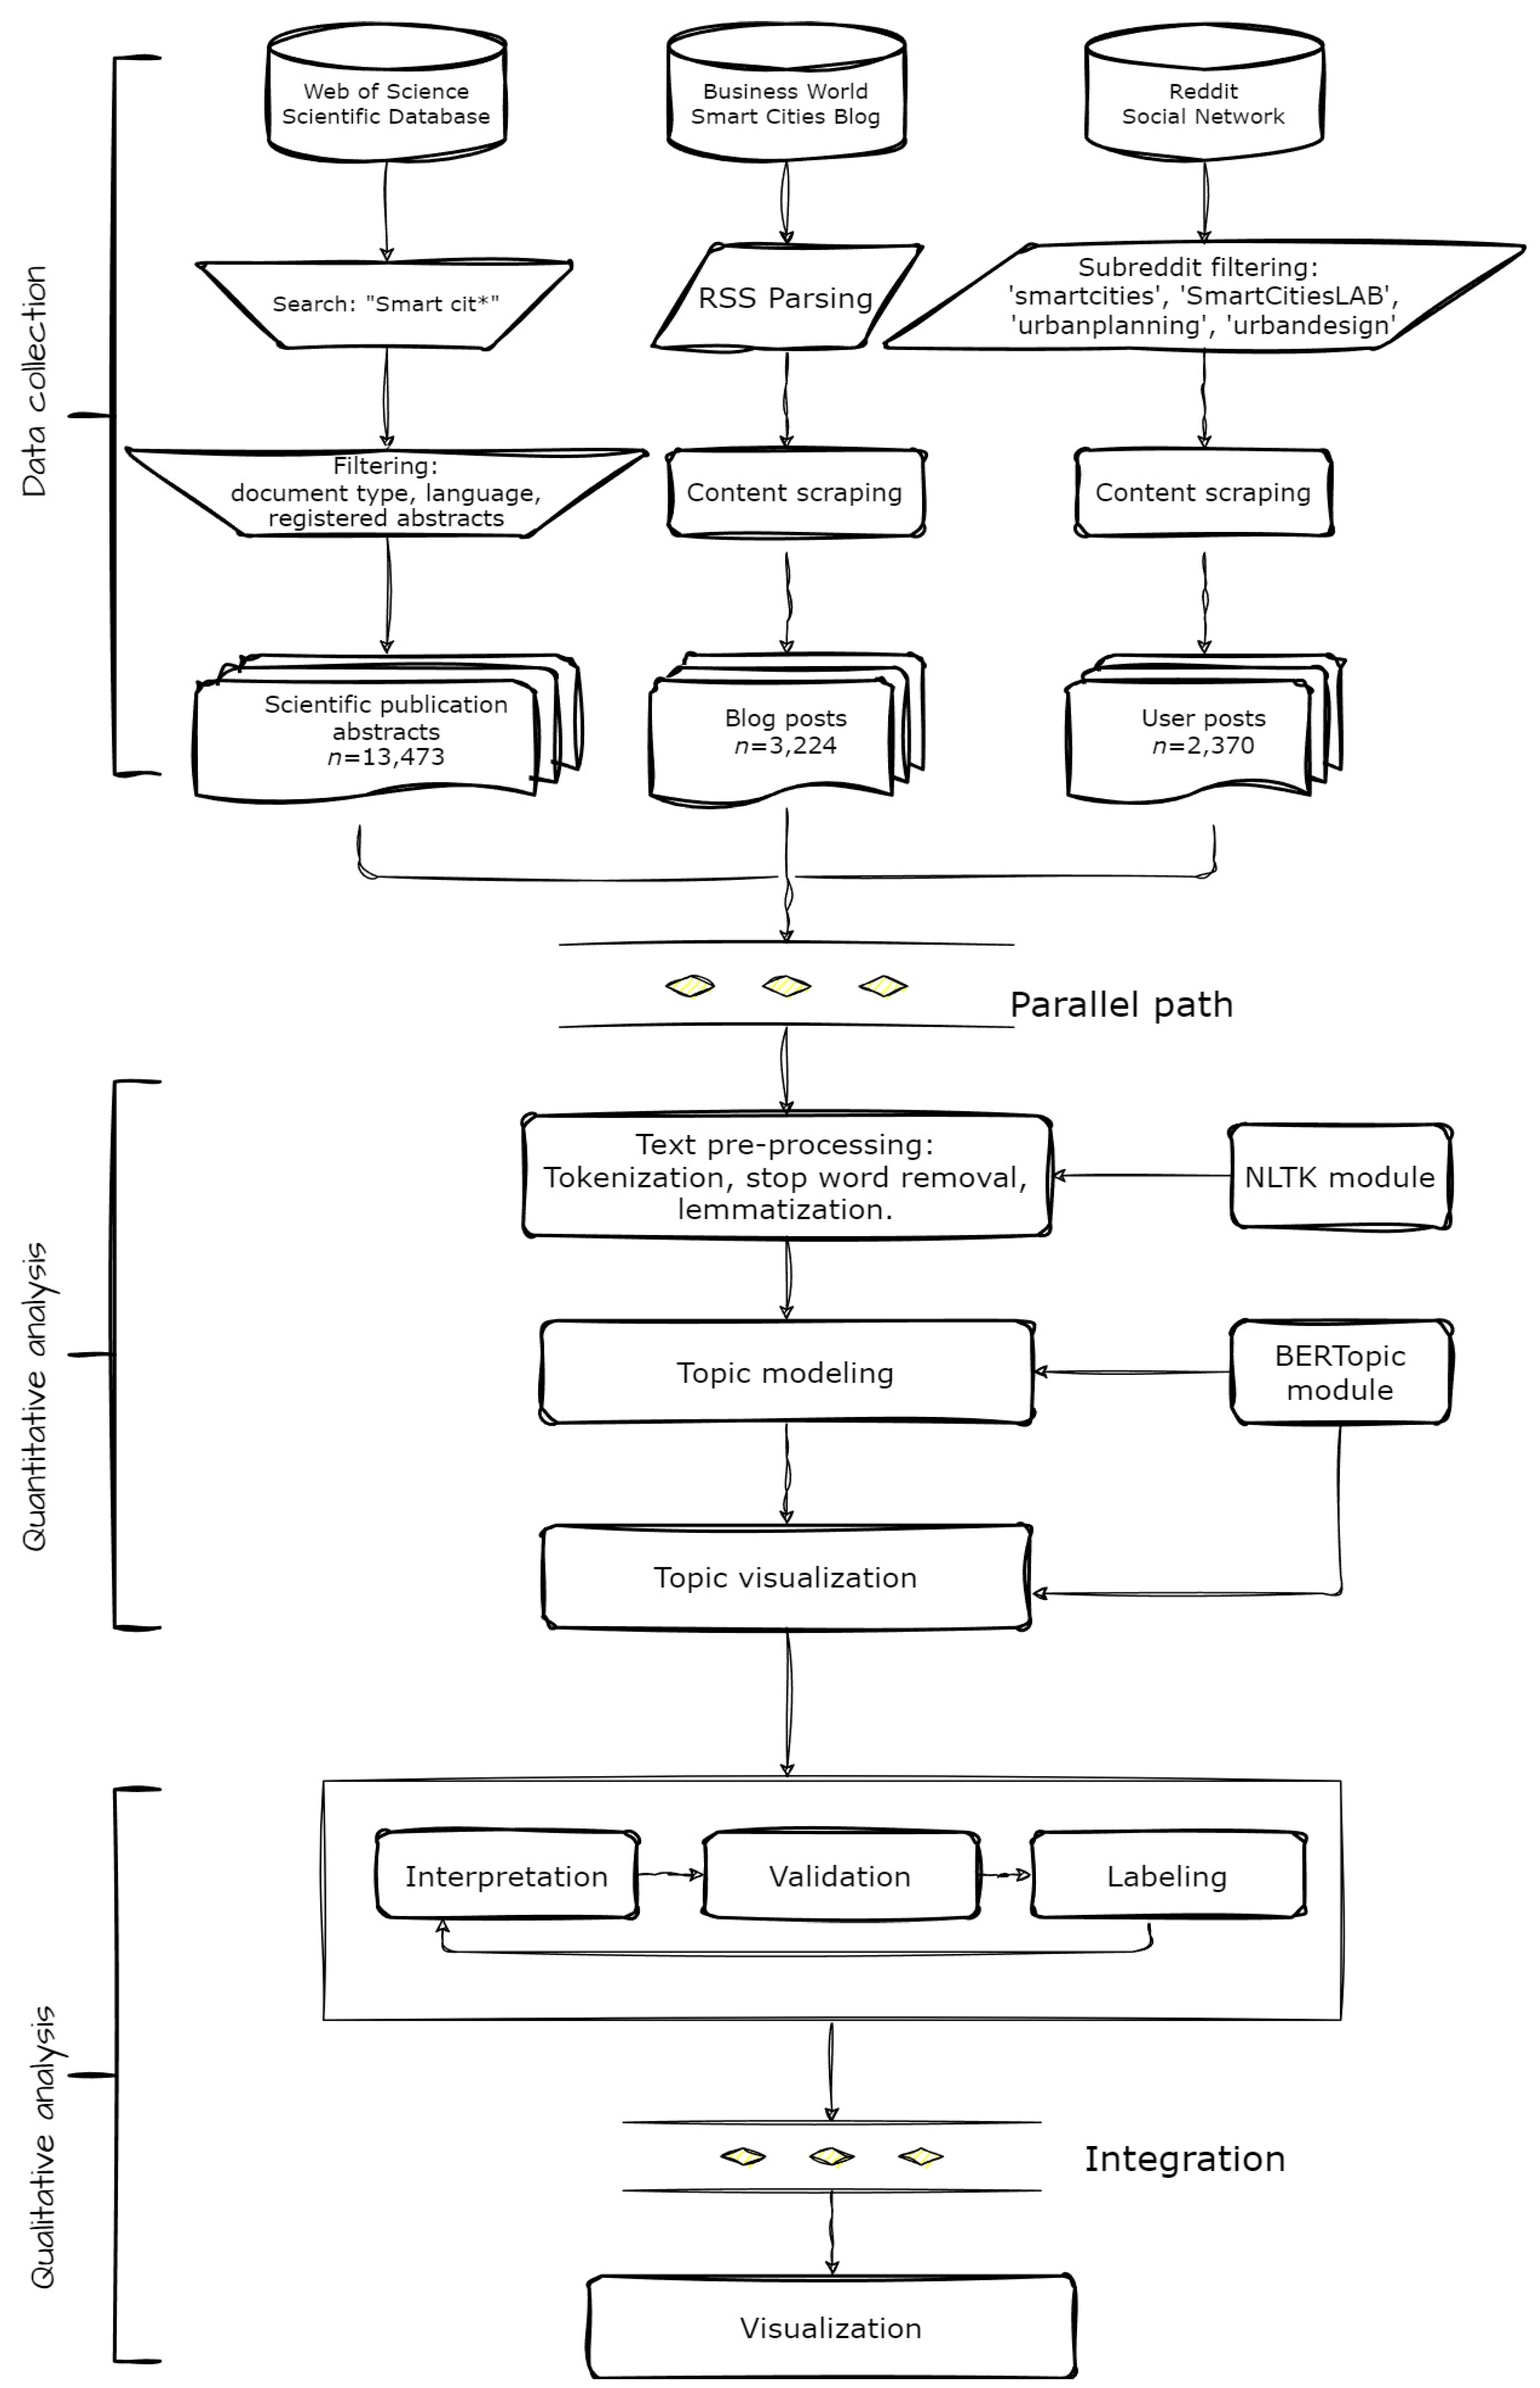
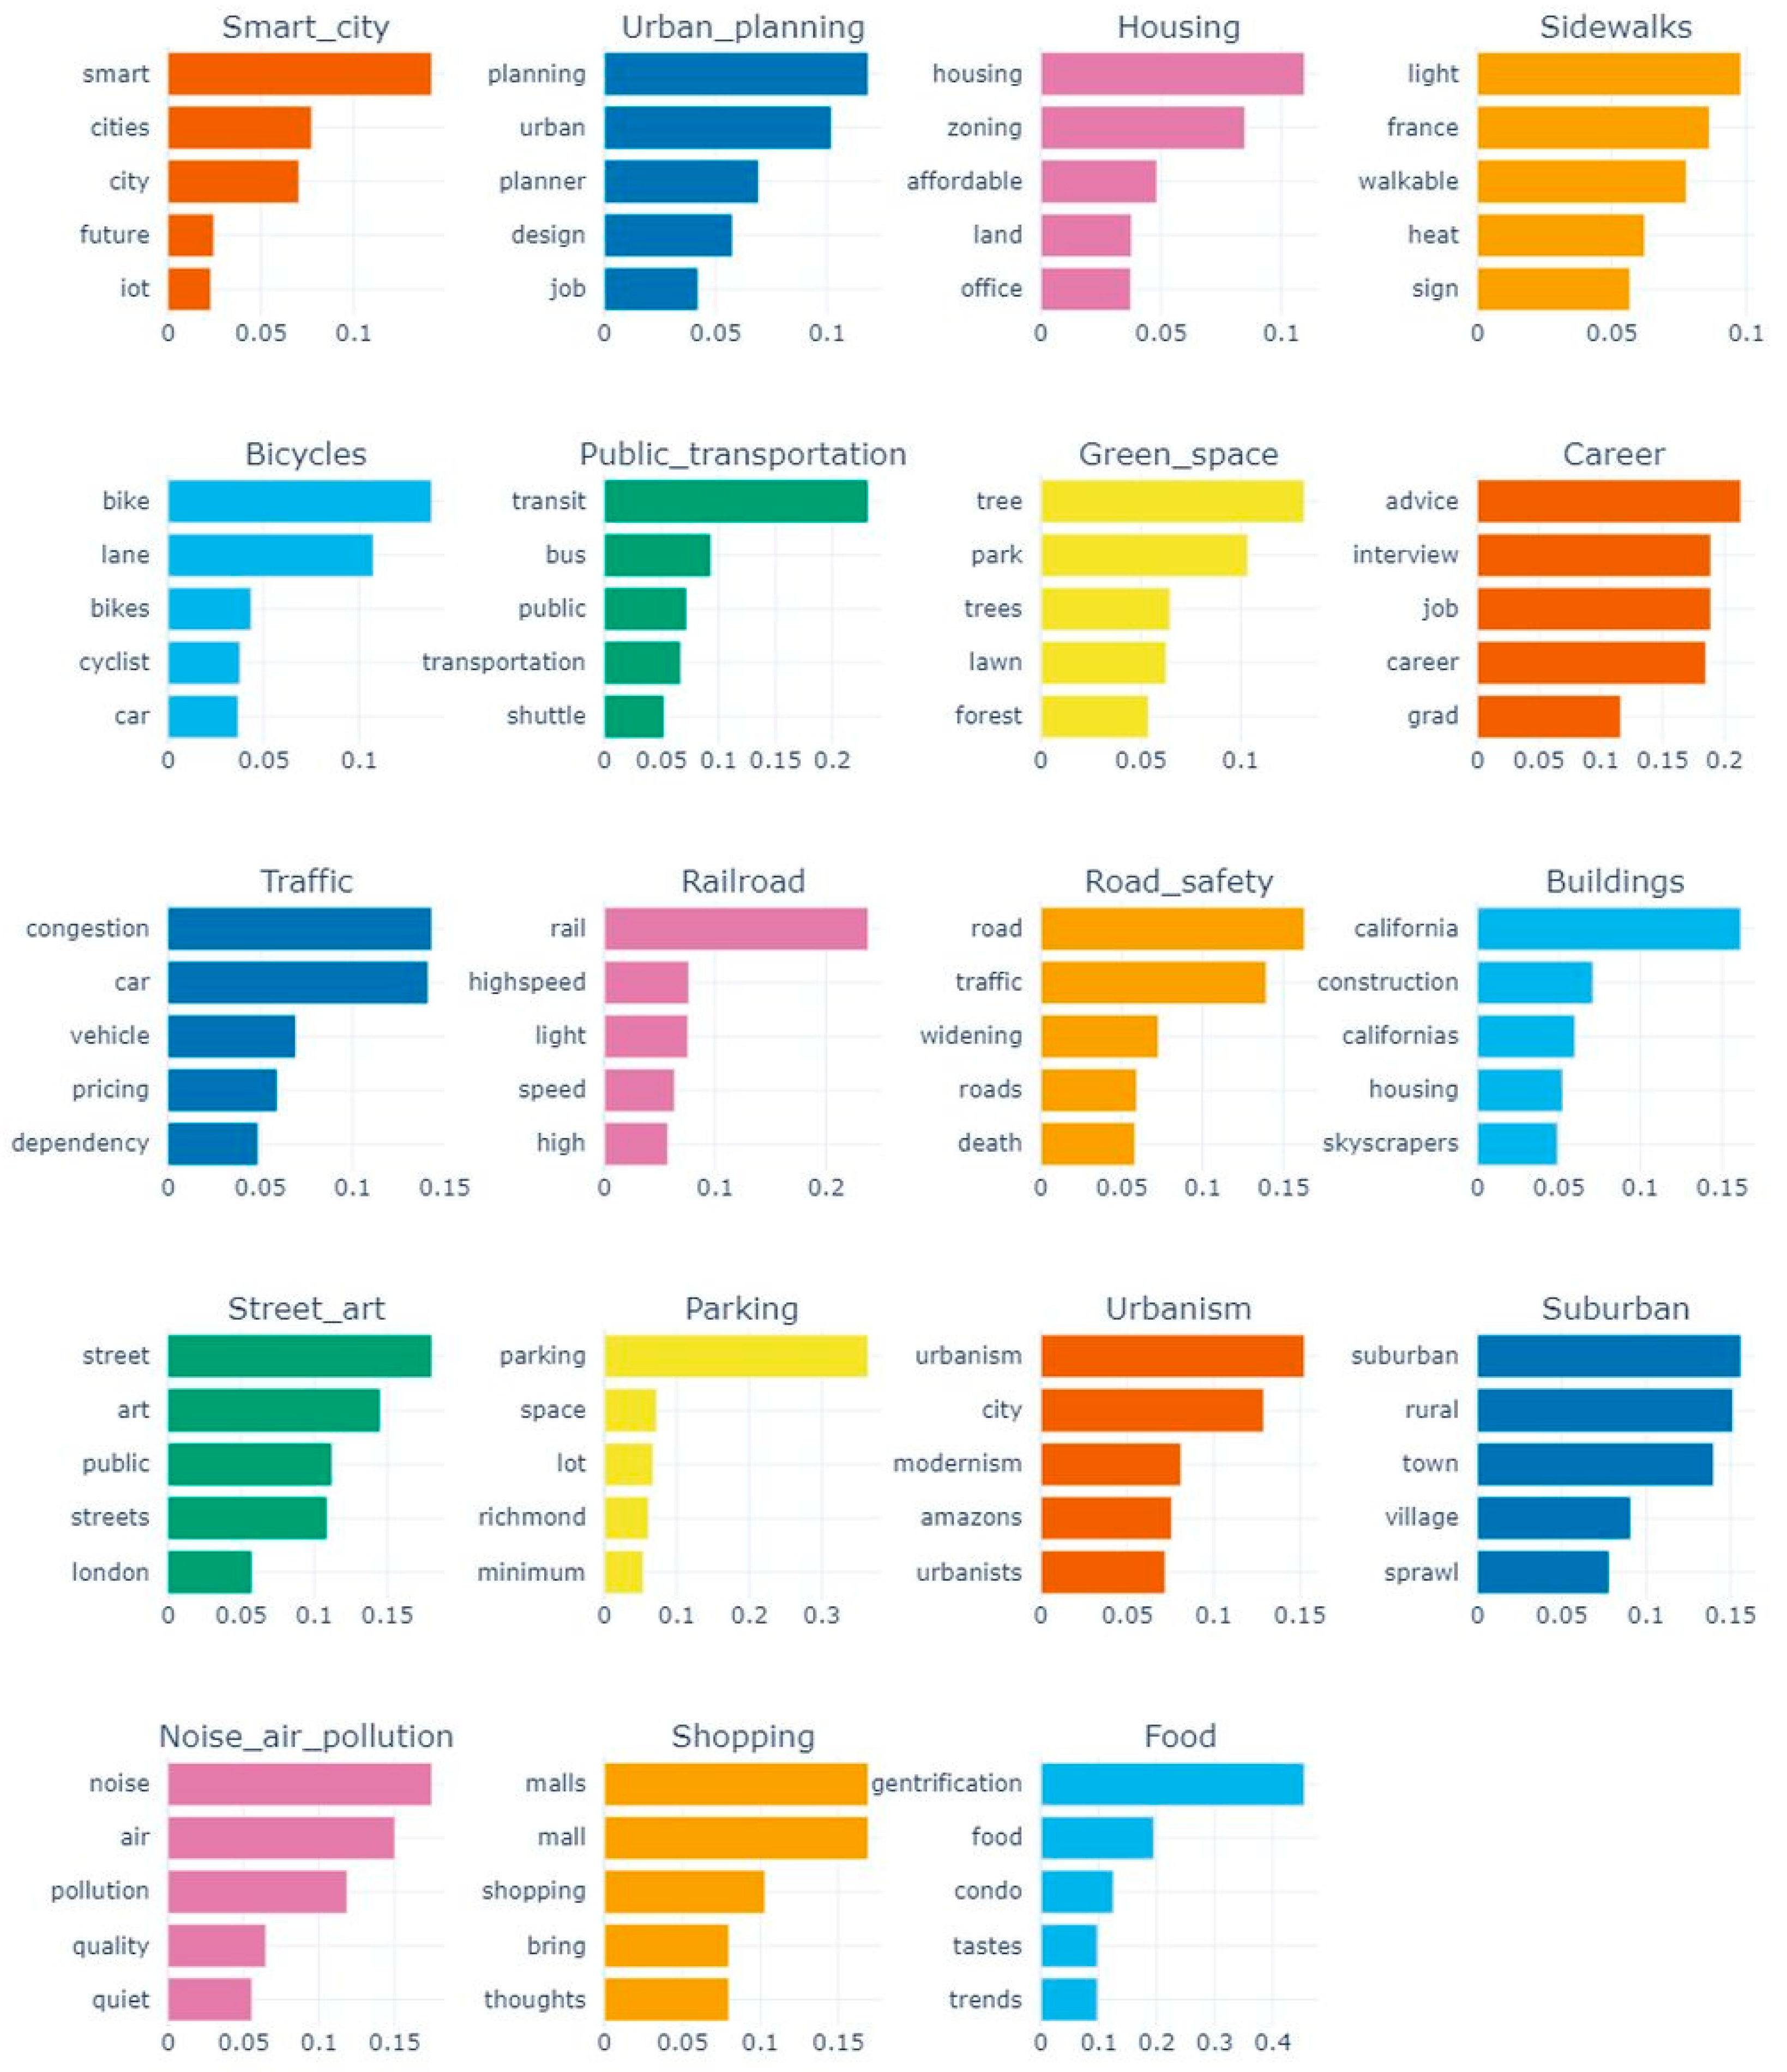
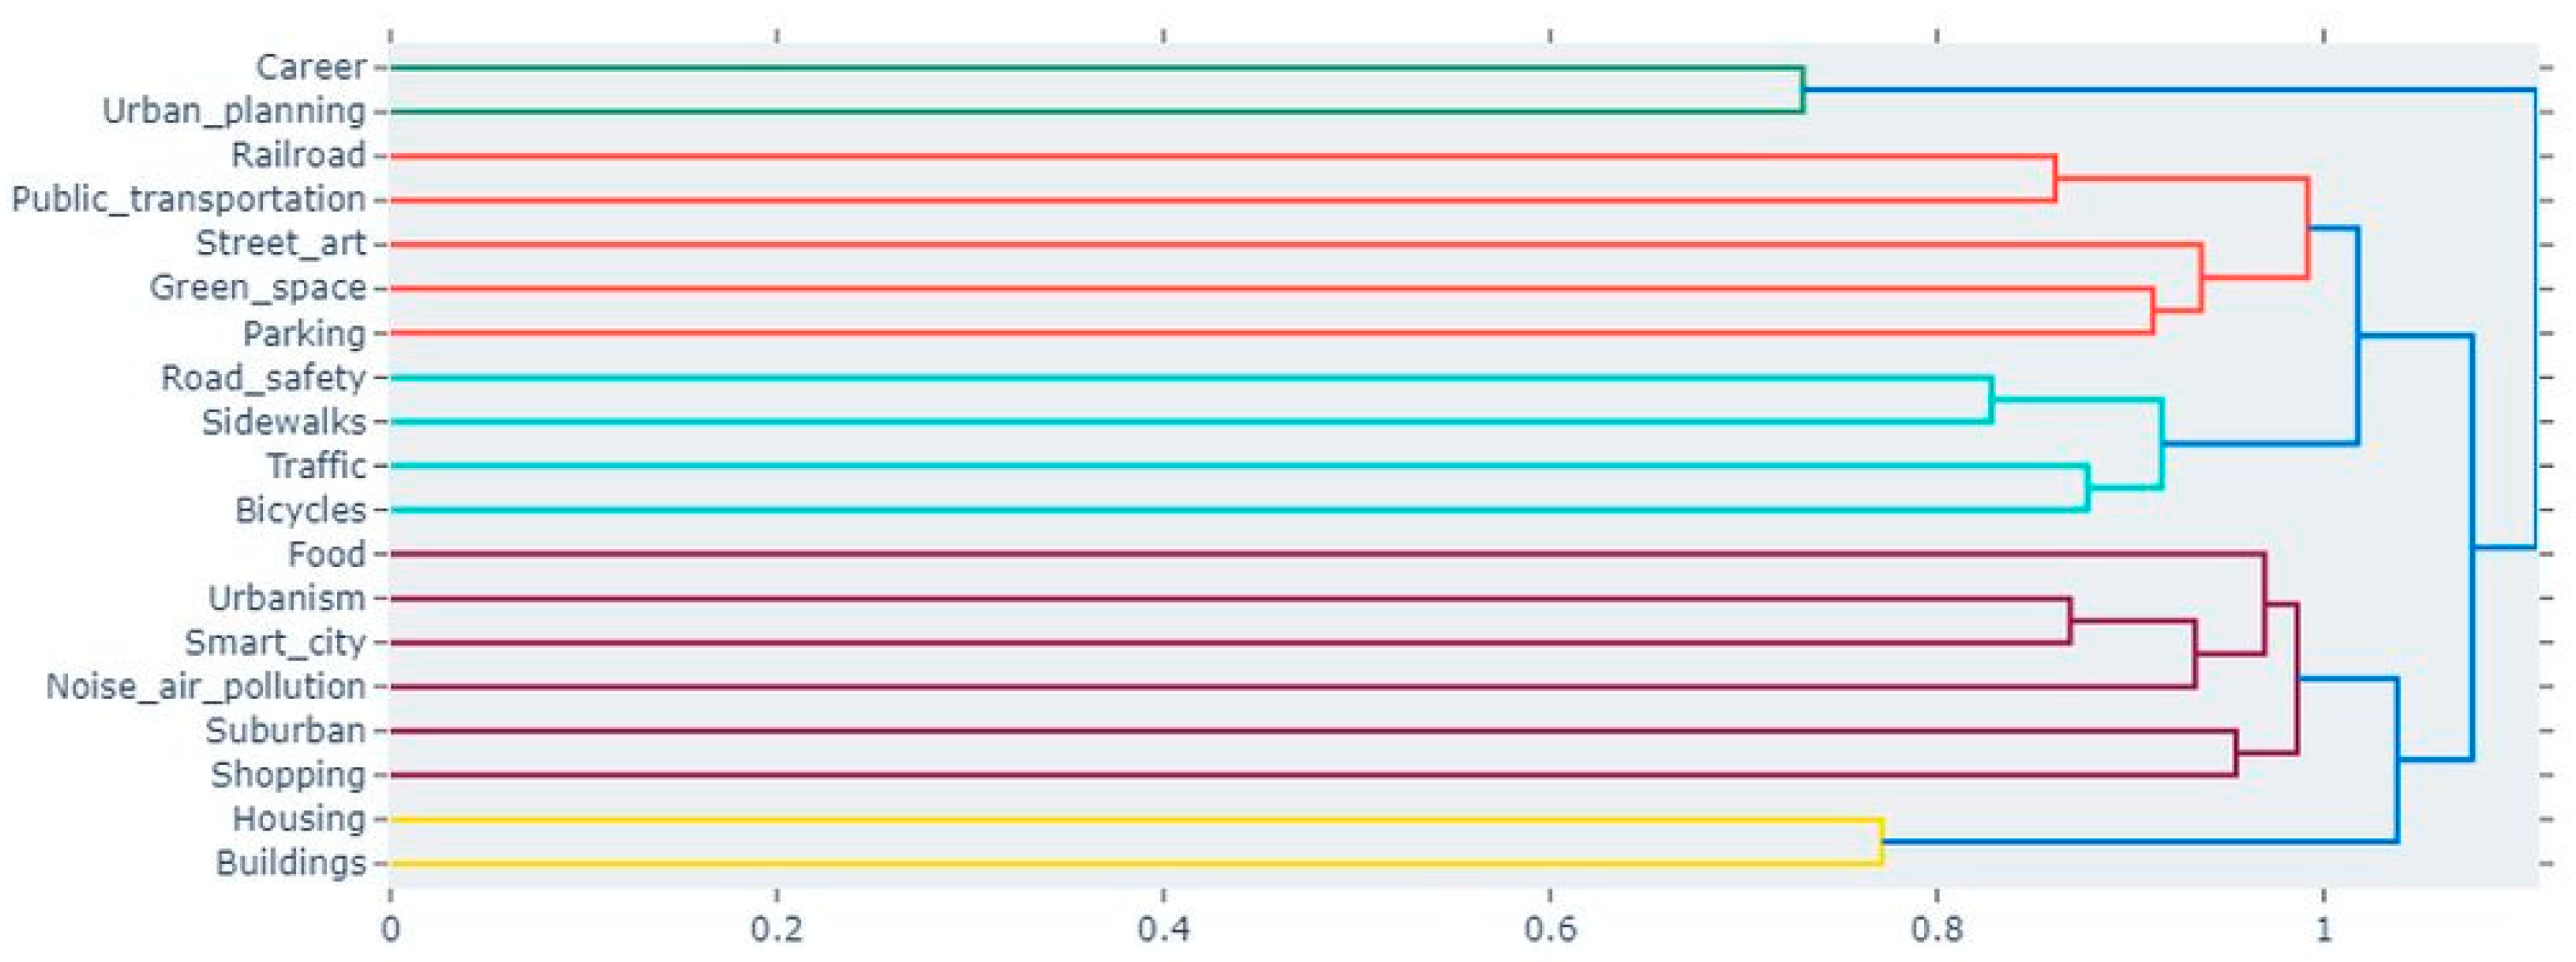
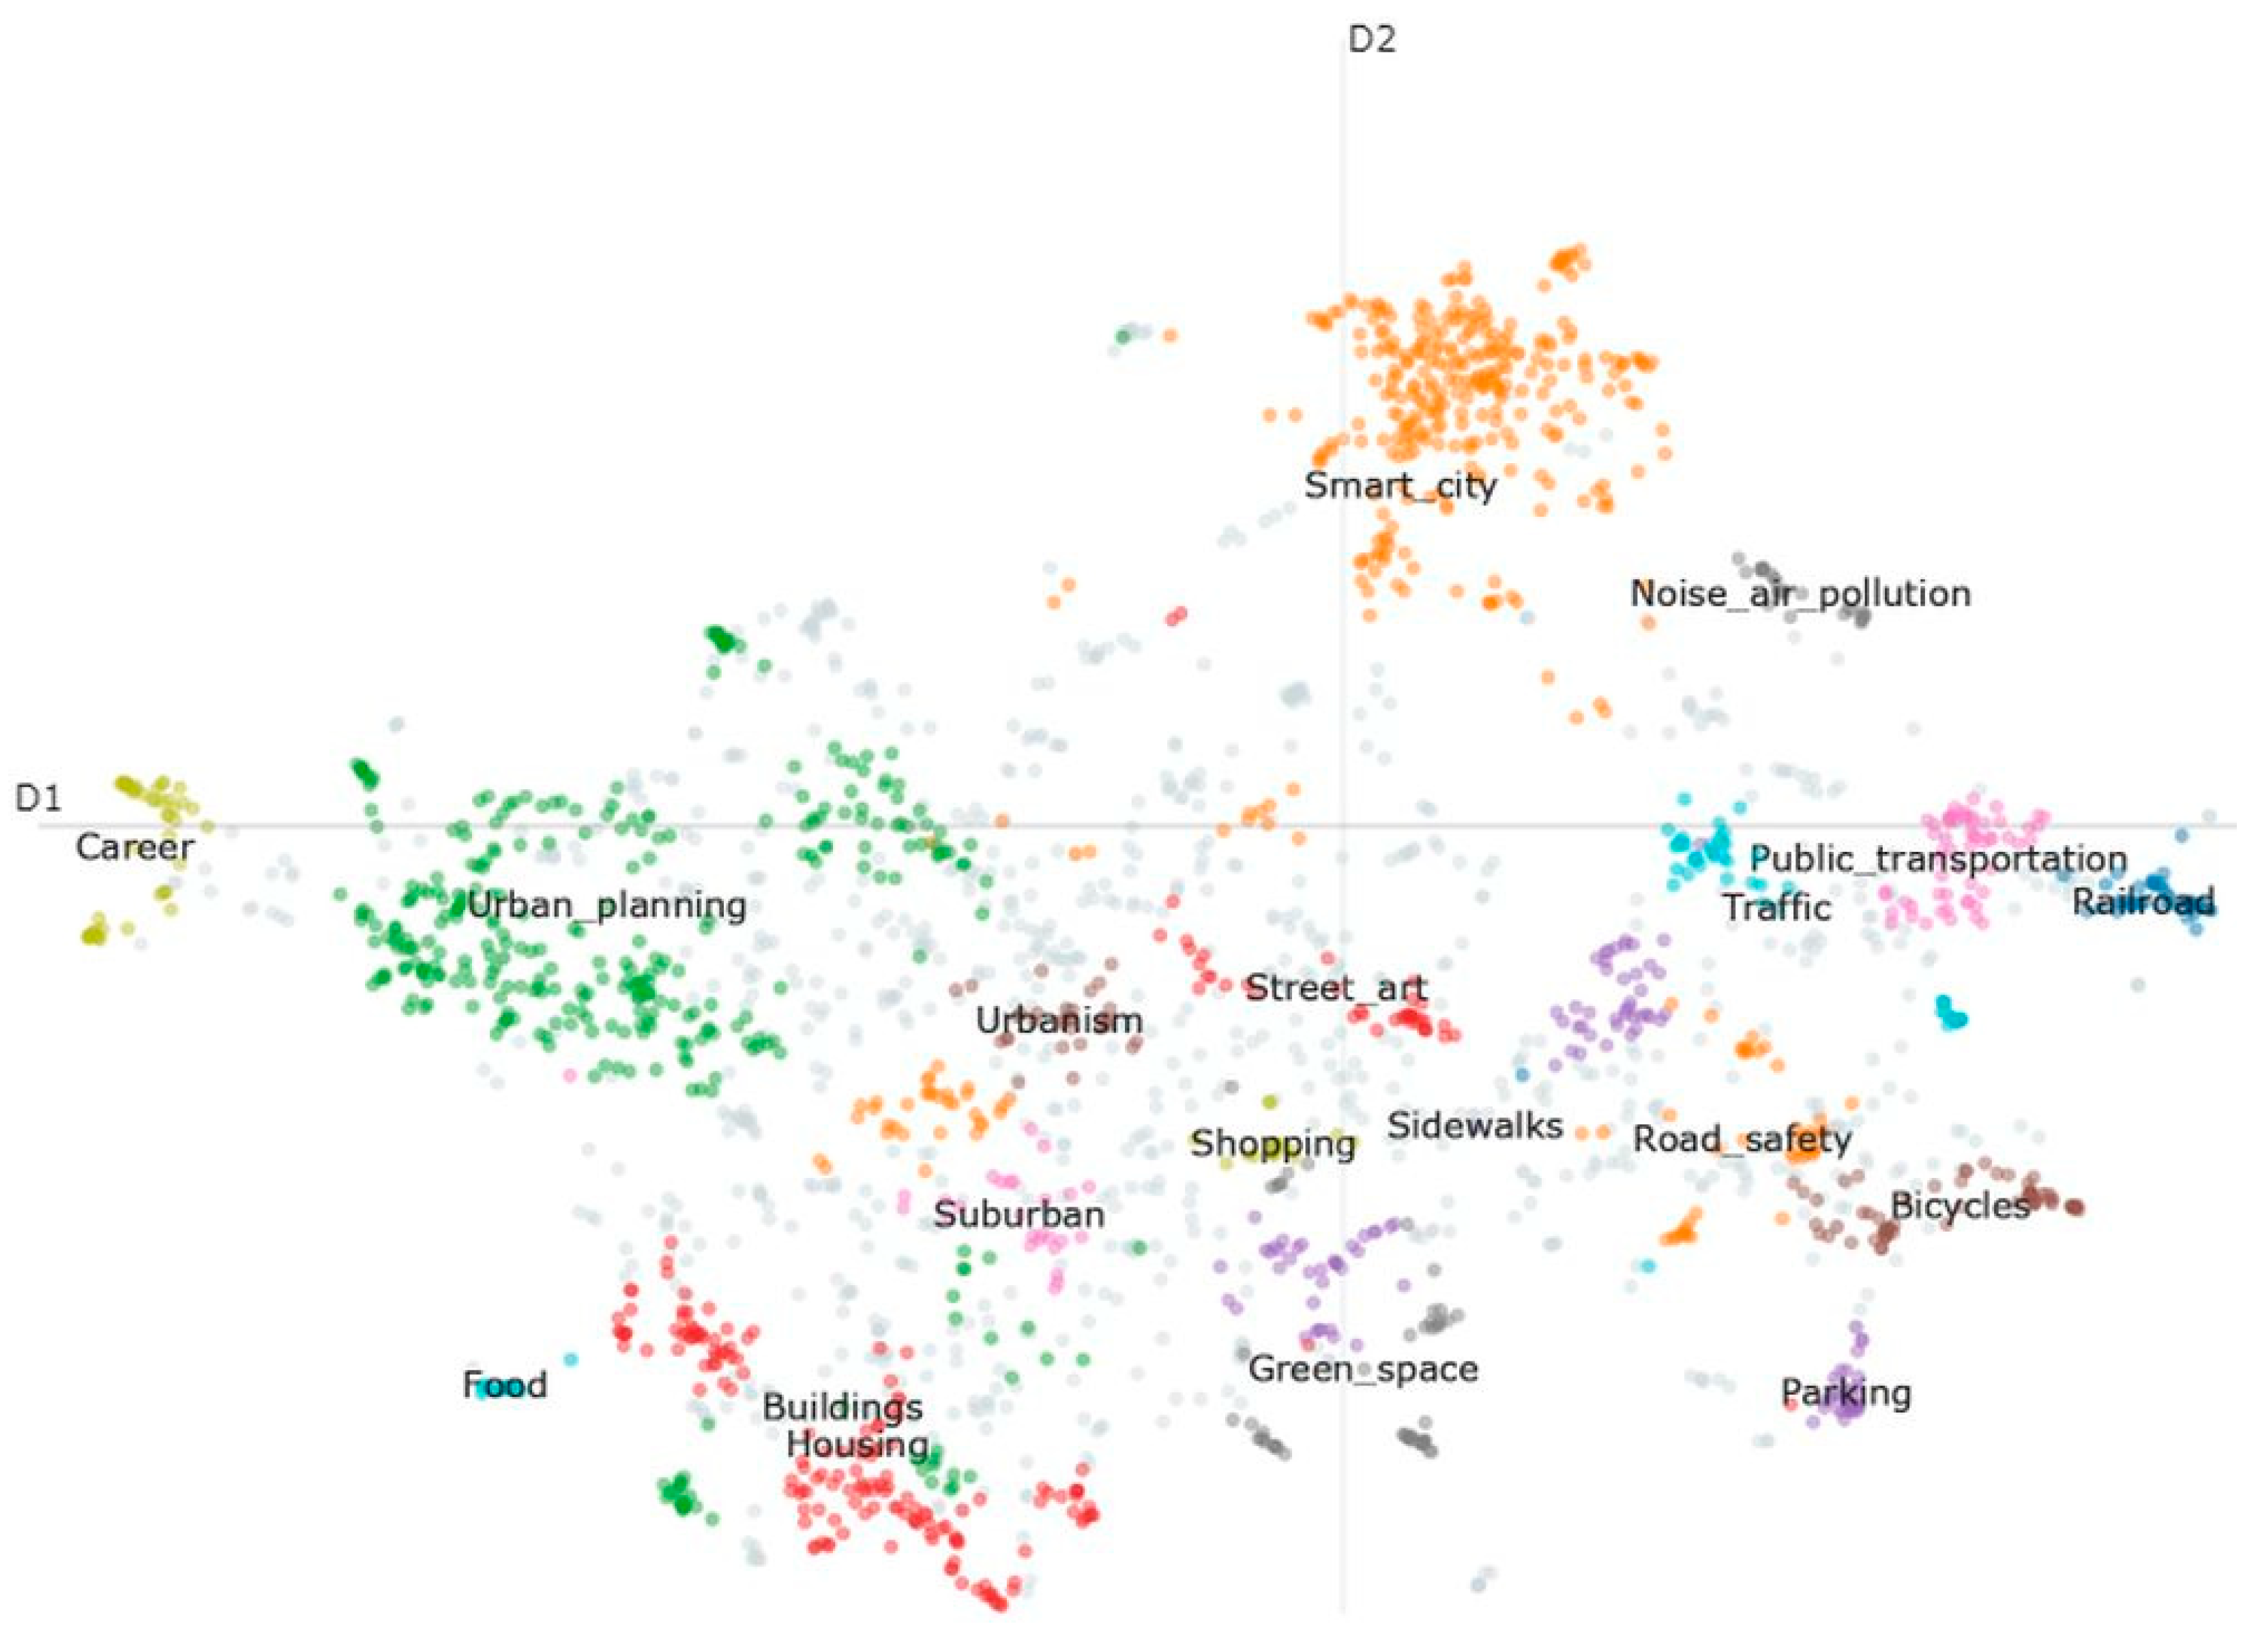
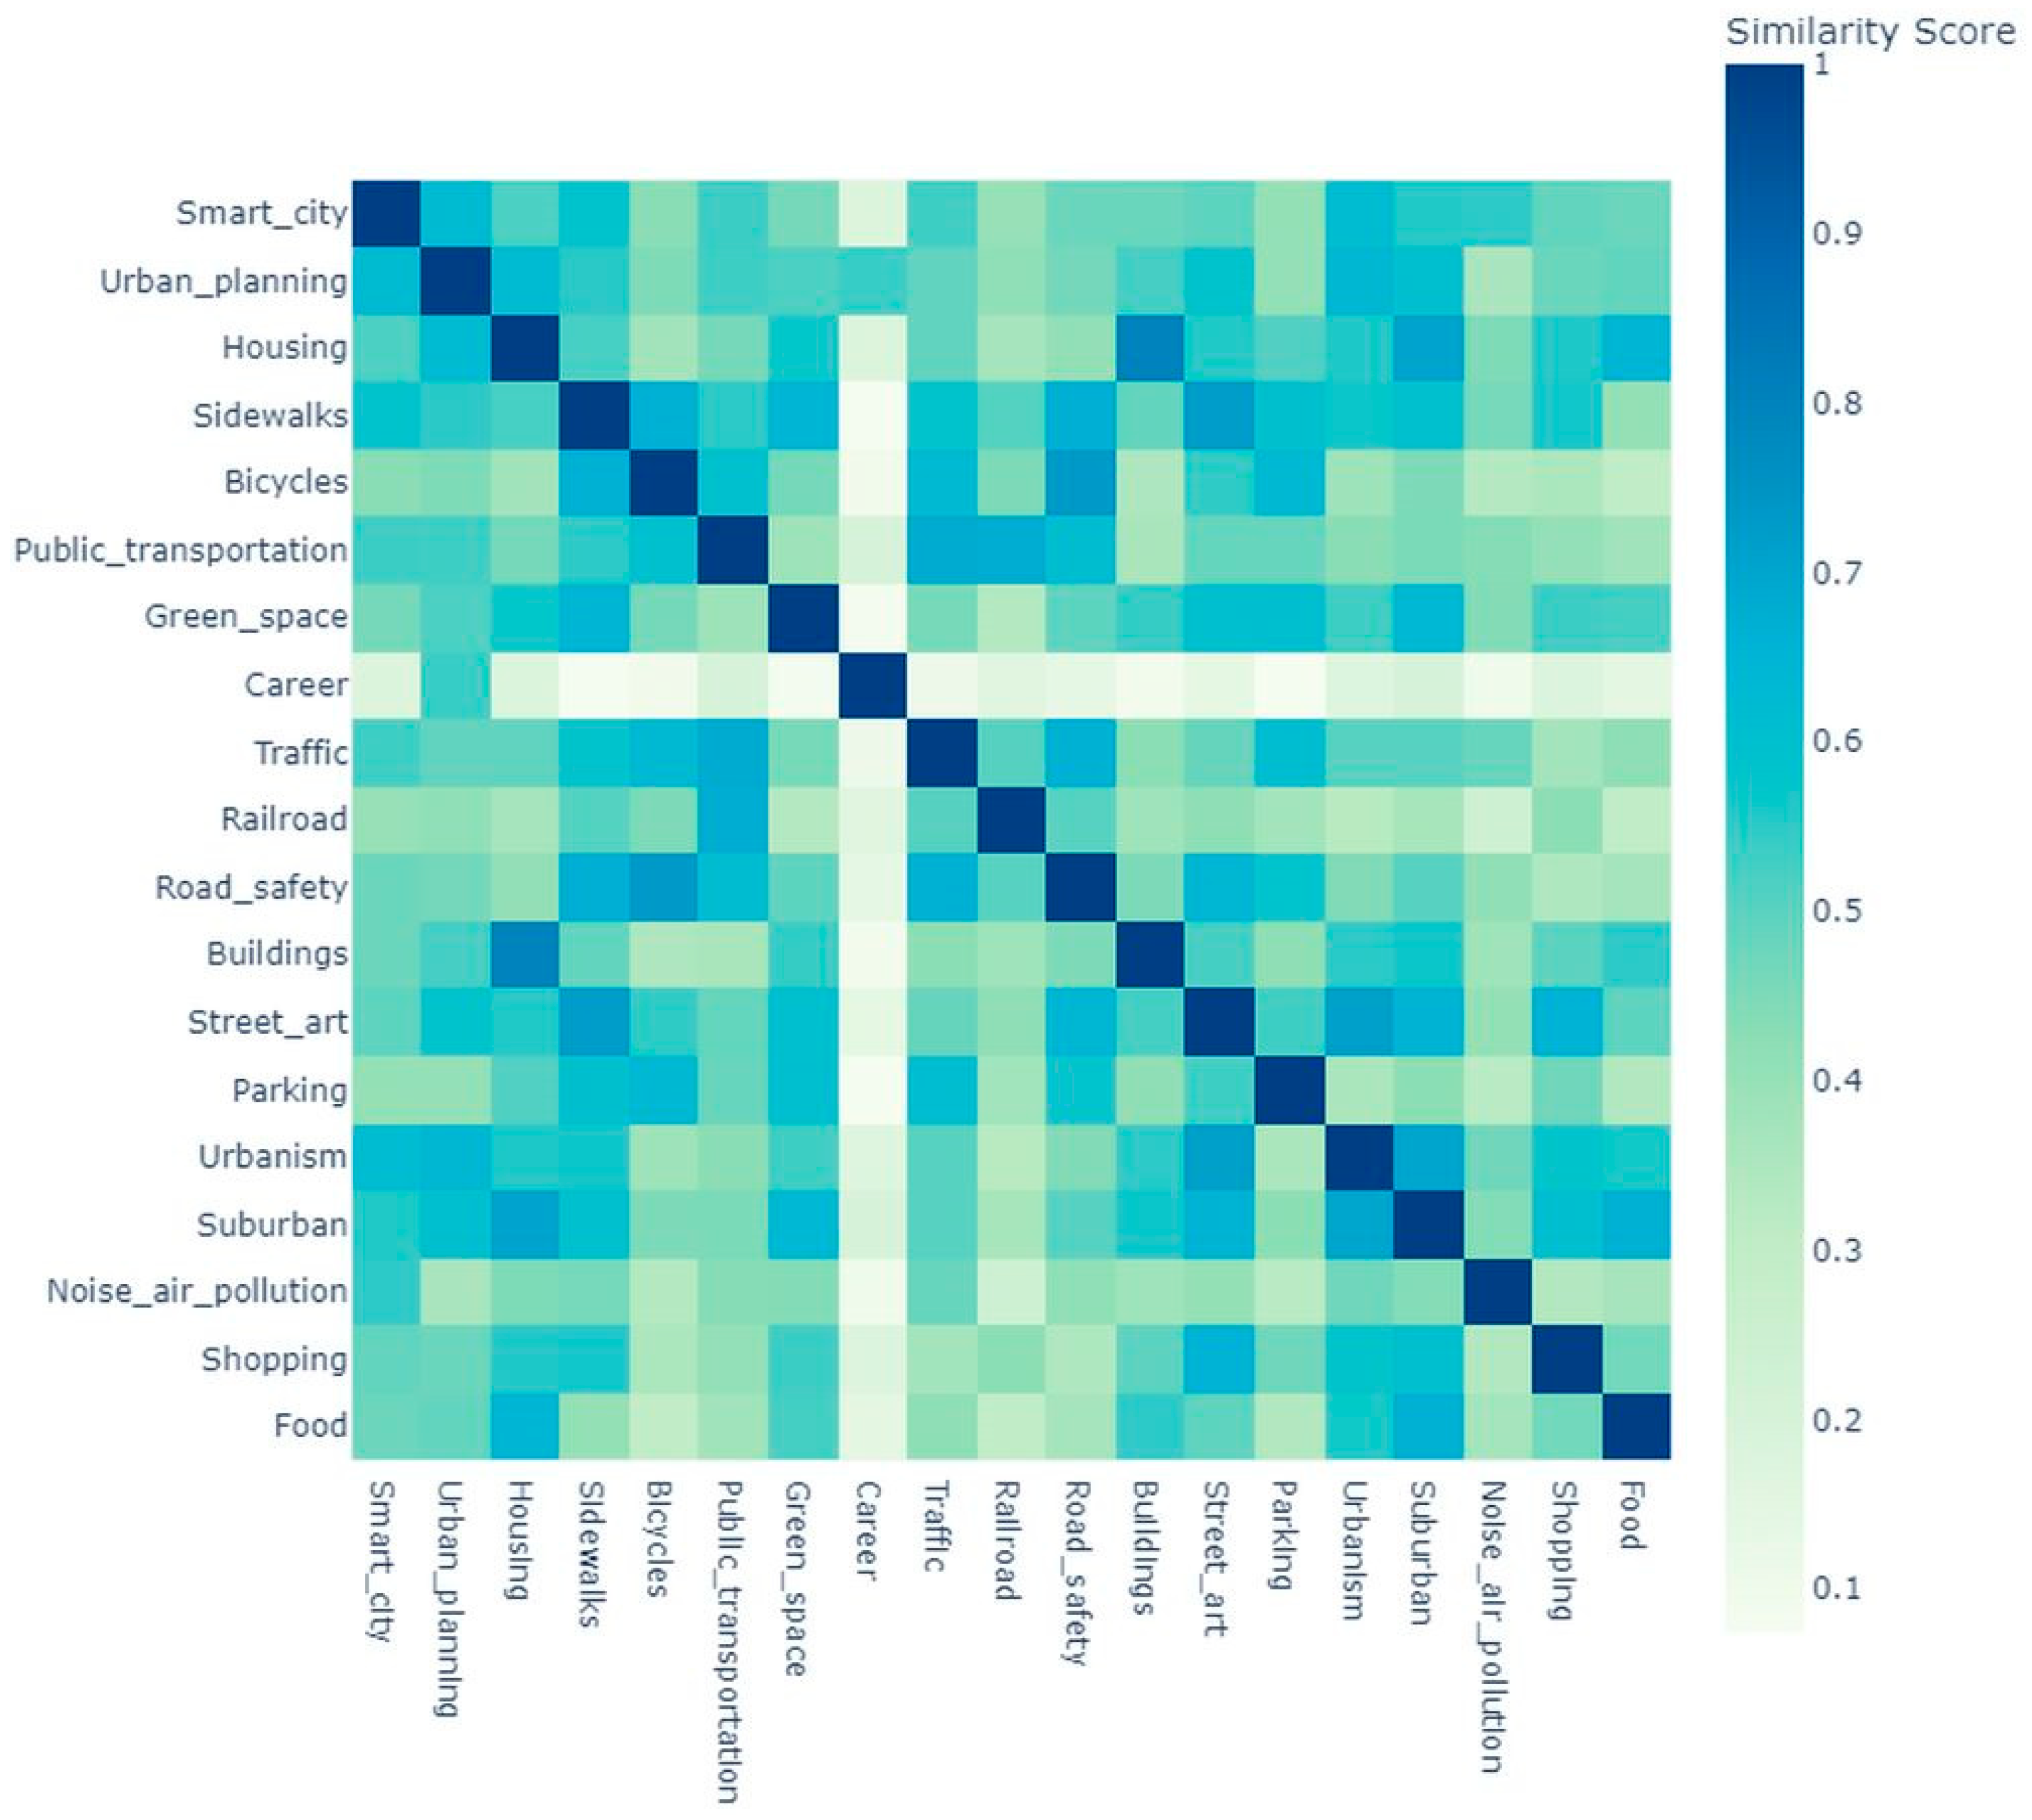
3.3. Social Media Posts
4. Discussion
4.1. Addressing RQ1
4.2. Addressing RQ2
4.3. Limitations
5. Conclusions
Future Research
Supplementary Materials
Author Contributions
Funding
Data Availability Statement
Conflicts of Interest
Abbreviations
| AI | Artificial Intelligence |
| BERT | Bidirectional Encoder Representations from Transformers |
| BW | Businessworld |
| c-TF-IDF | Class-based Term Frequency–Inverse Document Frequency |
| CTM | Contextualized Topic Models |
| HC | Hierarchical Clustering |
| HDBSCAN | Hierarchical Density-Based Spatial Clustering of Applications with Noise |
| ICT | Information and Communication Technologies |
| IoT | Internet of Things |
| LDA | Latent Dirichlet Allocation |
| LSI | Latent Semantic Indexing |
| ML | Machine Learning |
| NLP | Natural Language Processing |
| NMF | Non-negative Matrix Factorization |
| pLSI | Probabilistic Latent Semantic Indexing |
| SCC | Smart Cities Challenge |
| SVD | Singular Value Decomposition |
| TC | Topic Coherence |
| TD | Topic Diversity |
| TF-IDF | Term Frequency–Inverse Document Frequency |
| UMAP | Uniform Manifold Approximation and Projection |
| URL | Uniform Resource Locator |
| WoS | Web of Science |
Appendix A

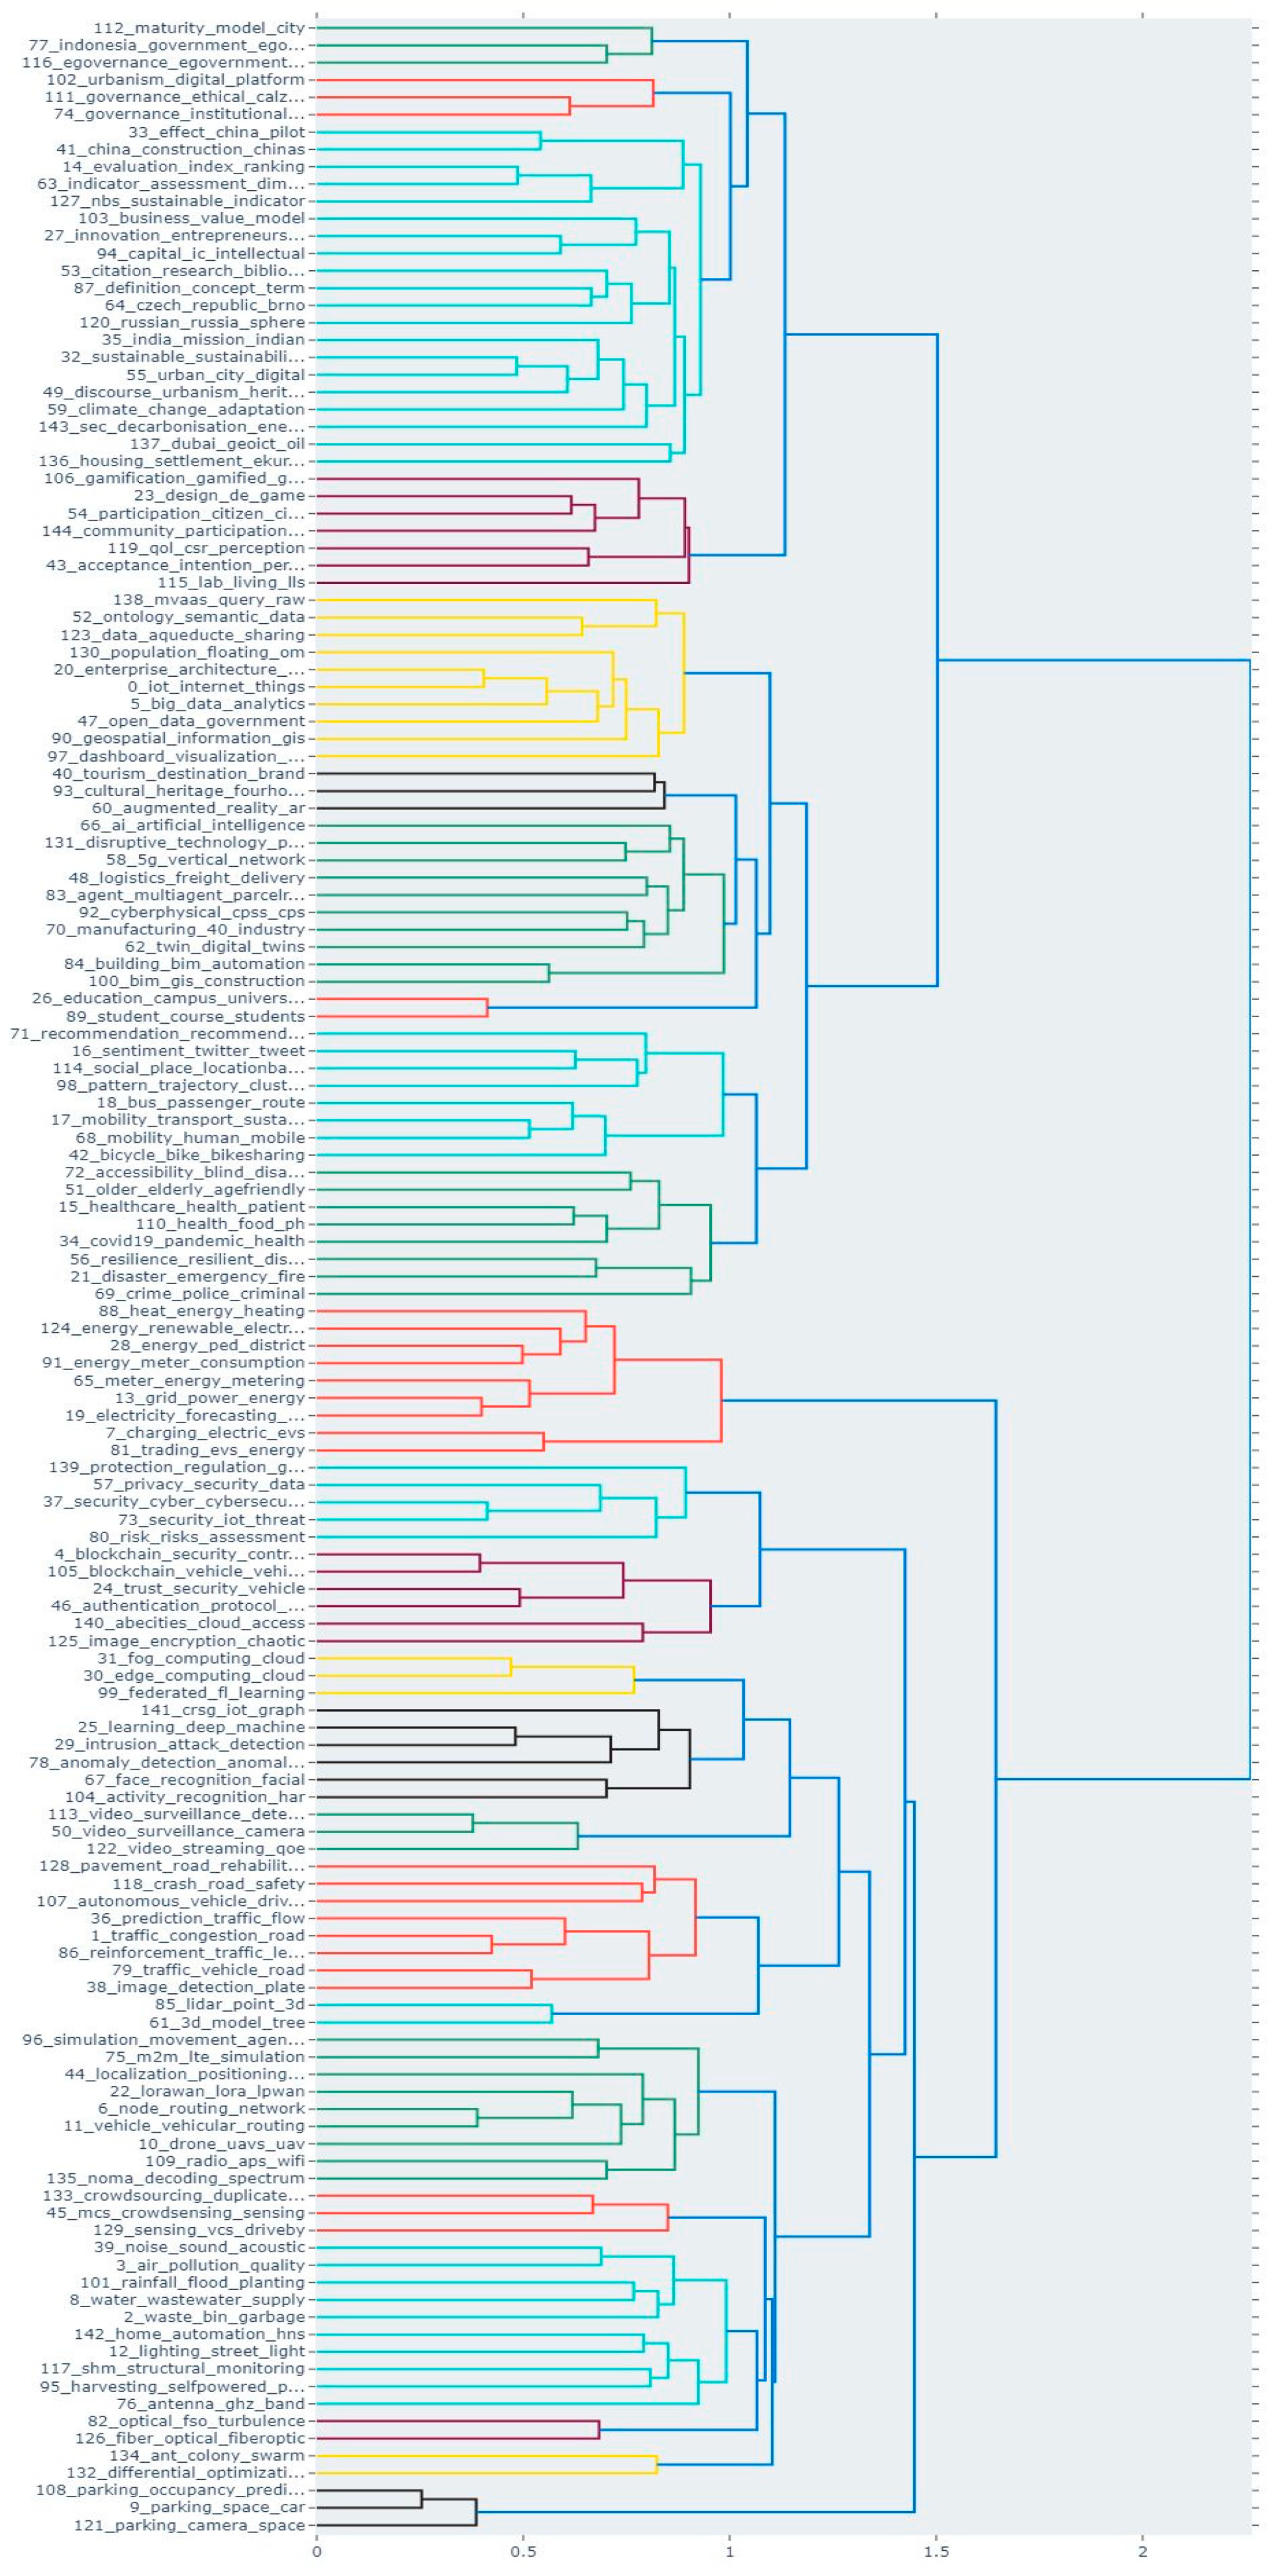
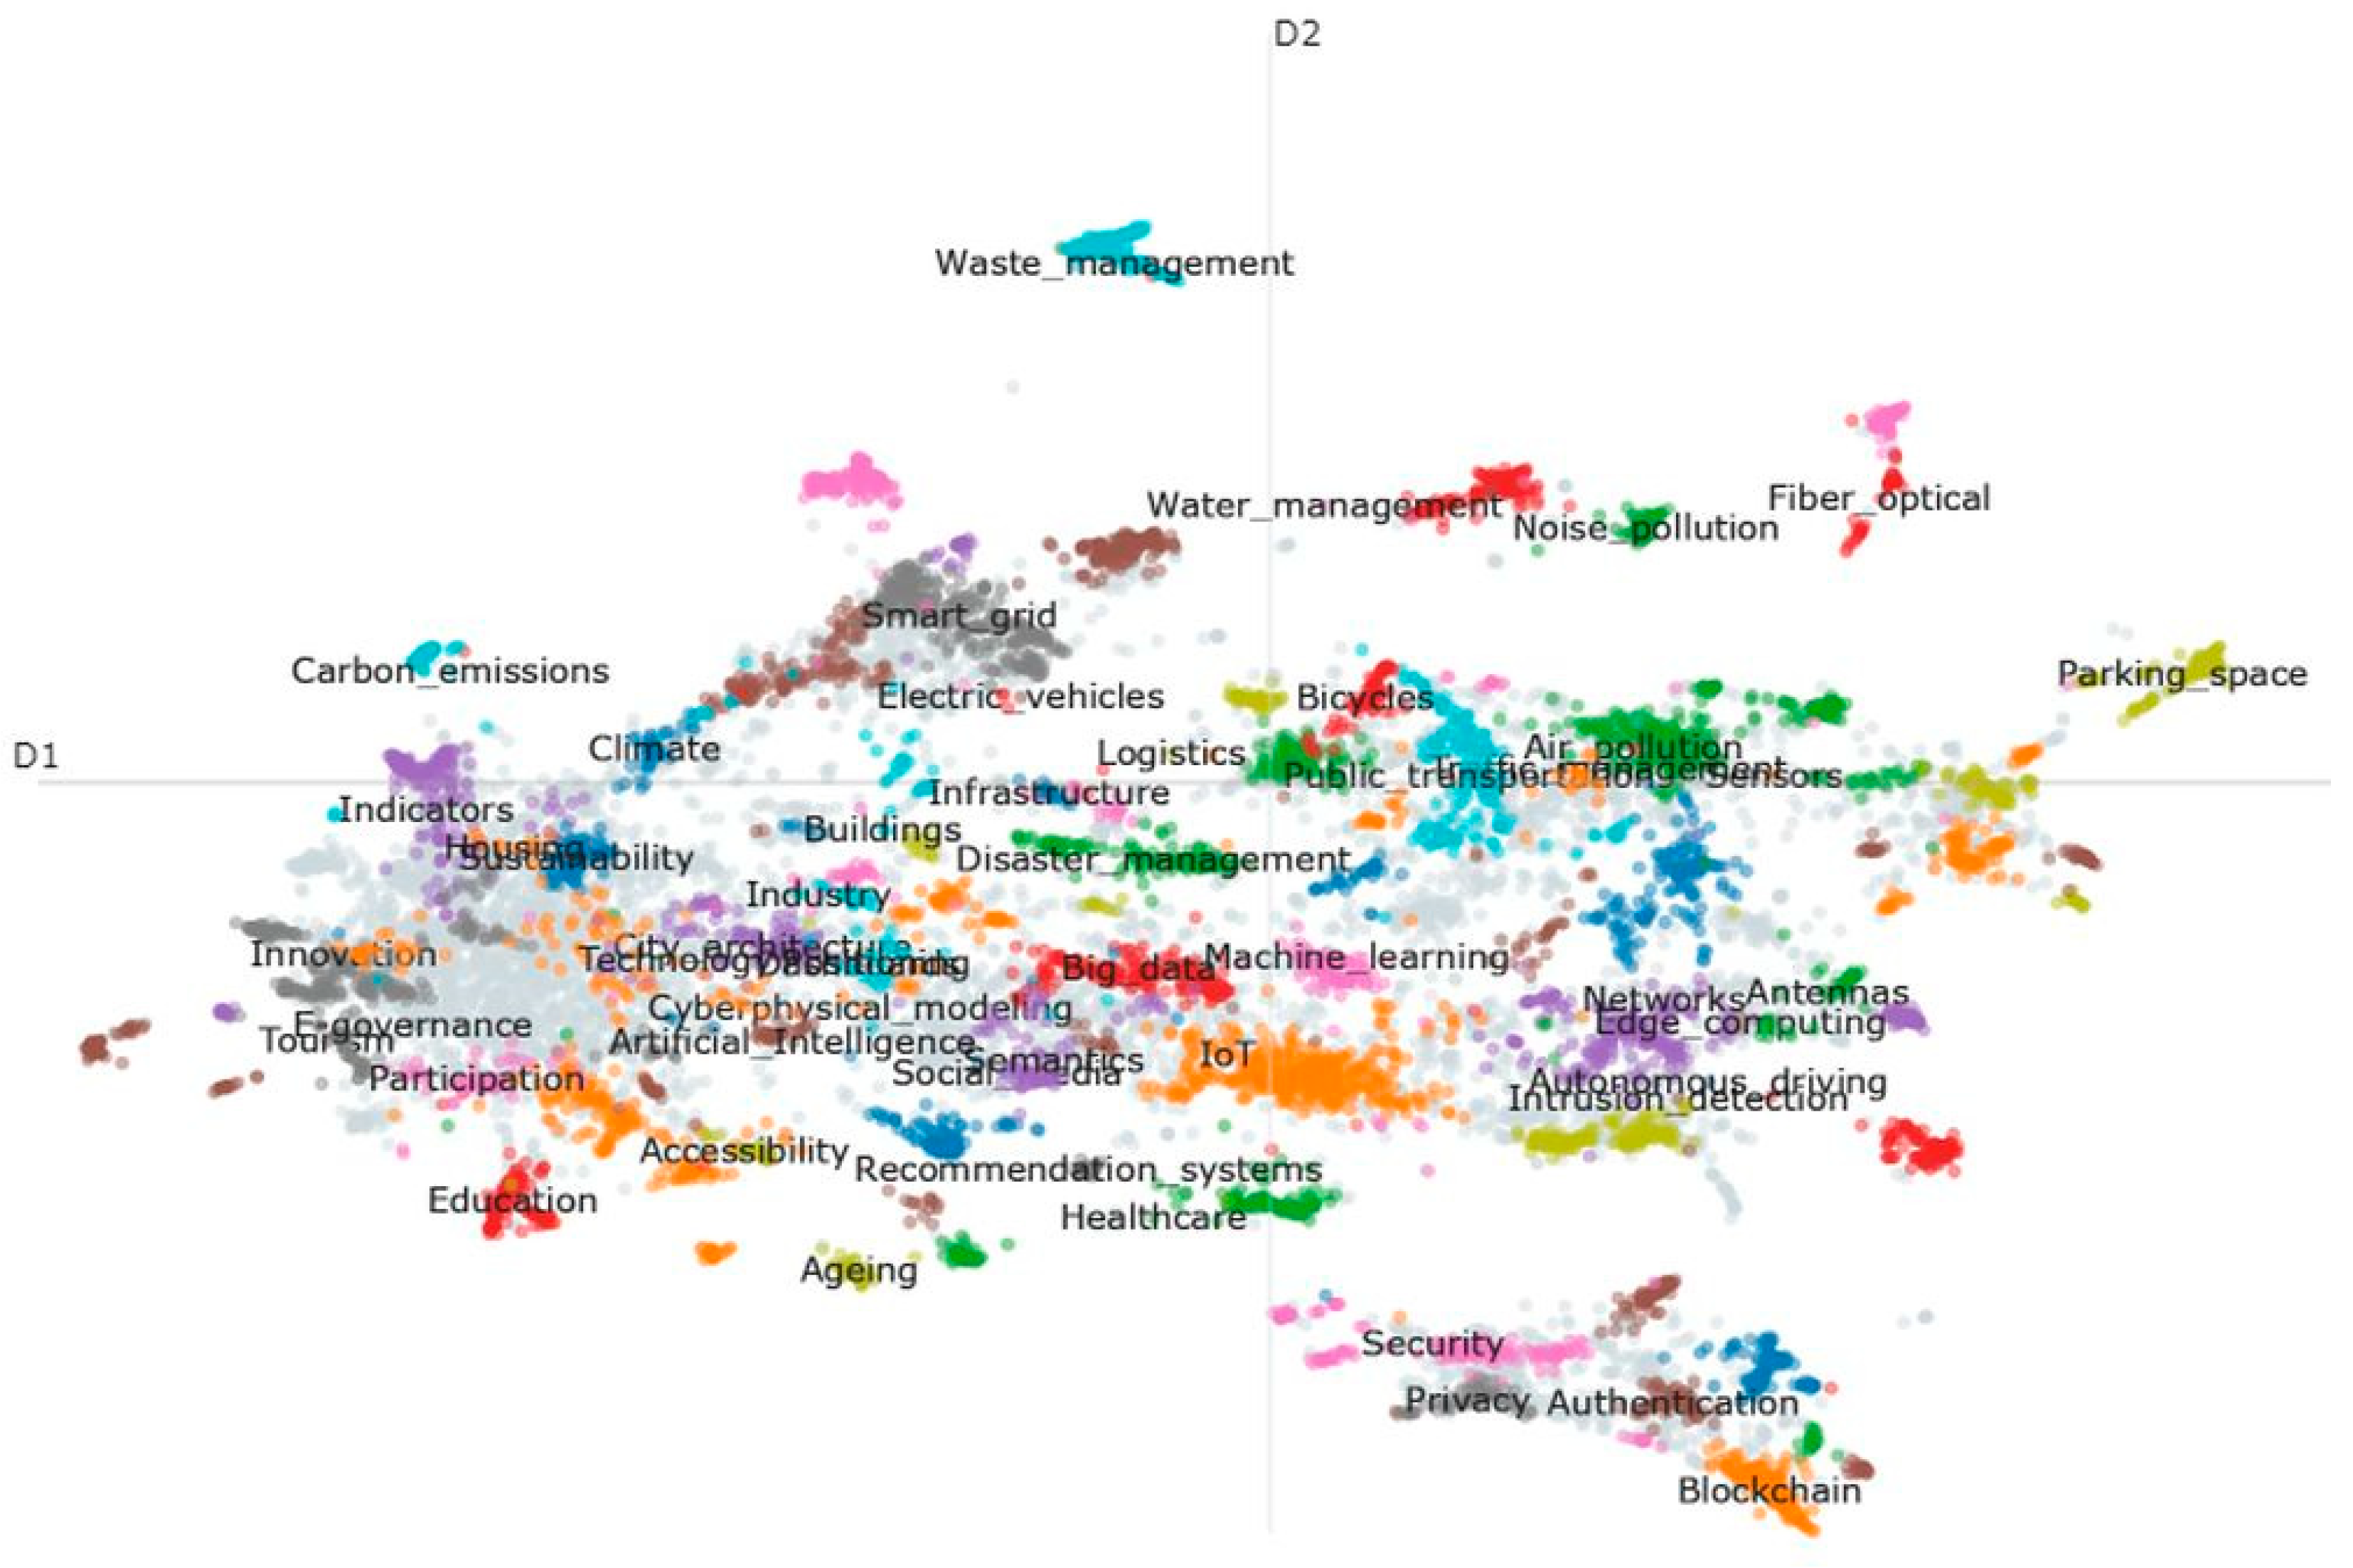
| Topic | Count | Representative Terms |
|---|---|---|
| −1 | 5377 | city, smart, urban, data, cities, development, paper, information, service, system |
| 0 | 418 | iot, internet, things, application, service, smart, technology, architecture, platform, device |
| 1 | 239 | traffic, congestion, road, vehicle, control, intersection, flow, light, time, signal |
| 2 | 235 | waste, bin, garbage, collection, solid, management, recycling, disposal, trash, system |
| 3 | 223 | air, pollution, quality, monitoring, sensor, pollutant, pm25, concentration, environmental, health |
| 4 | 212 | blockchain, security, contract, decentralized, iot, transaction, blockchain-based, technology, privacy, ledger |
| 5 | 199 | big, data, analytics, processing, bda, smart, hadoop, analysis, architecture, framework |
| 6 | 183 | node, routing, network, protocol, wireless, sensor, wsn, packet, energy, algorithm |
| 7 | 150 | charging, electric, evs, ev, vehicle, station, battery, energy, vehicles, power |
| 8 | 148 | water, wastewater, supply, monitoring, management, groundwater, treatment, system, meter, distribution |
| 9 | 147 | parking, space, car, spot, driver, slot, system, lot, free, park |
| 10 | 141 | drone, uavs, uav, unmanned, aerial, flight, drones, vehicle, algorithm, flying |
| 11 | 136 | vehicle, vehicular, routing, communication, vanet, network, protocol, vanets, delay, scheme |
| 12 | 130 | lighting, street, light, lamp, led, streetlight, control, system, energy, leds |
| 13 | 130 | grid, power, energy, load, renewable, electricity, distribution, demand, microgrids, generation |
| 14 | 127 | evaluation, index, ranking, fuzzy, construction, criterion, weight, indicator, method, multicriteria |
| 15 | 126 | healthcare, health, patient, medical, patients, disease, care, diagnosis, elderly, monitoring |
| 16 | 126 | sentiment, twitter, tweet, social, medium, event, text, opinion, emotion, analysis |
| 17 | 123 | mobility, transport, sustainable, transportation, urban, smart, sustainability, study, city, public |
| 18 | 123 | bus, passenger, route, transportation, transport, travel, carpooling, public, problem, time |
| 19 | 109 | electricity, forecasting, energy, power, demand, load, consumption, building, machine, model |
| 20 | 106 | enterprise, architecture, city, smart, modeling, model, concept, system, integration, process |
| 21 | 102 | disaster, emergency, fire, response, evacuation, event, management, natural, relief, rescue |
| 22 | 100 | lorawan, lora, lpwan, network, low, wide, lowpower, sigfox, area, packet |
| 23 | 99 | design, de, game, space, playful, participatory, urban, ambient, la, theory |
| 24 | 98 | trust, security, vehicle, vehicular, attack, scheme, malicious, vanet, message, authentication |
| 25 | 97 | learning, deep, machine, ml, iot, data, dl, internet, things, neural |
| 26 | 95 | education, campus, university, learning, student, educational, teaching, skill, program, students |
| 27 | 90 | innovation, entrepreneurship, entrepreneurial, knowledge, collaborative, sector, open, literature, public, startup |
| 28 | 88 | energy, ped, district, building, peds, transition, decision, renewable, european, project |
| 29 | 88 | intrusion, attack, detection, ids, attacks, learning, security, deep, machine, malware |
| 30 | 82 | edge, computing, cloud, mec, offloading, resource, server, latency, application, mobile |
| 31 | 80 | fog, computing, cloud, latency, iot, paradigm, node, service, resource, edge |
| 32 | 79 | sustainable, sustainability, development, city, environmental, goal, goals, economic, ict, smart |
| 33 | 76 | effect, china, pilot, carbon, scp, construction, policy, green, emission, innovation |
| 34 | 76 | covid19, pandemic, health, crisis, epidemic, digital, virus, coronavirus, spread, disease |
| 35 | 75 | india, mission, indian, indias, rs, urbanization, urban, cities, 100, city |
| 36 | 72 | prediction, traffic, flow, neural, model, deep, congestion, temporal, graph, shortterm |
| 37 | 72 | security, cyber, cybersecurity, threat, vulnerability, information, attack, smart, dubai, city |
| 38 | 72 | image, detection, plate, object, pedestrian, license, reid, deep, reidentification, convolutional |
| 39 | 70 | noise, sound, acoustic, pollution, level, audio, measurement, microphone, monitoring, environmental |
| 40 | 69 | tourism, destination, brand, tourist, branding, destinations, hospitality, marketing, los, de |
| 41 | 68 | china, construction, chinas, chinese, development, city, smart, government, urbanization, smc |
| 42 | 67 | bicycle, bike, bikesharing, carsharing, sharing, cycling, transport, cyclist, ebikes, mobility |
| 43 | 63 | acceptance, intention, perceived, adoption, factor, trust, influence, equation, use, expectancy |
| 44 | 61 | localization, positioning, navigation, gps, indoor, ble, position, ekf, bluetooth, signal |
| 45 | 61 | mcs, crowdsensing, sensing, mobile, user, participant, recruitment, trustworthiness, participact, task |
| 46 | 60 | authentication, protocol, security, scheme, secure, user, device, proposed, mobile, iot |
| 47 | 60 | open, data, government, portal, public, city, transparency, initiative, new, datadriven |
| 48 | 60 | logistics, freight, delivery, lastmile, transport, mile, distribution, urban, cargo, last |
| 49 | 60 | discourse, urbanism, heritage, urban, songdo, narrative, metaverse, political, city, smart |
| 50 | 55 | video, surveillance, camera, edge, cctv, image, frame, processing, computing, retrieval |
| 51 | 53 | older, elderly, agefriendly, adult, care, frailty, ageing, senior, adults, health |
| 52 | 50 | ontology, semantic, data, web, linked, knowledge, domain, information, ontologies, personalised |
| 53 | 50 | citation, research, bibliometric, publication, analysis, topic, journal, literature, scientific, document |
| 54 | 49 | participation, citizen, citizens, engagement, involvement, eparticipation, public, government, citizenship, citizenry |
| 55 | 47 | urban, city, digital, development, concept, new, transformation, place, technology, social |
| 56 | 46 | resilience, resilient, disaster, seismic, hazard, earthquake, capacity, disasters, smartness, index |
| 57 | 46 | privacy, security, data, protection, citizens, issue, smart, trustless, information, risk |
| 58 | 44 | 5g, vertical, network, technology, slice, gigabit, fifth, deployment, service, virtualization |
| 59 | 44 | climate, change, adaptation, roof, green, urban, planning, mitigation, european, earth |
| 60 | 44 | augmented, reality, ar, immersive, virtual, vr, experience, interaction, technology, 3d |
| 61 | 44 | 3d, model, tree, shape, building, lidar, geological, citygml, virtual, scene |
| 62 | 43 | twin, digital, twins, dt, dts, physical, virtual, igb, replica, concept |
| 63 | 42 | indicator, assessment, dimension, smartness, city, smart, evaluation, smartnesssmart, salatiga, indicators |
| 64 | 40 | czech, republic, brno, concept, slovak, implementation, municipality, region, poland, slovakia |
| 65 | 40 | meter, energy, metering, power, grid, consumption, measurement, electrical, management, system |
| 66 | 39 | ai, artificial, intelligence, robot, robotics, xai, urban, human, research, development |
| 67 | 38 | face, recognition, facial, image, biometric, biometrics, feature, expression, fingerprint, emotion |
| 68 | 37 | mobility, human, mobile, train, irma, data, subway, transportation, cellular, trajectory |
| 69 | 36 | crime, police, criminal, prevention, safety, street, crimes, incident, prism, occurrence |
| 70 | 36 | manufacturing, 40, industry, production, product, industrial, instructions, instruction, revolution, factory |
| 71 | 35 | recommendation, recommender, user, poi, filtering, personalized, ecommerce, pois, preference, collaborative |
| 72 | 35 | accessibility, blind, disability, people, impaired, visuallyimpaired, wheelchair, accessible, urban, information |
| 73 | 35 | security, iot, threat, attack, vulnerability, iotbased, secure, risk, home, internet |
| 74 | 32 | governance, institutional, itg, actor, civil, organizational, perspective, smart, local, ecology |
| 75 | 31 | m2m, lte, simulation, iot, access, simulator, machinetomachine, communication, device, massive |
| 76 | 31 | antenna, ghz, band, frequency, mimo, gain, mmwave, db, dbi, polarization |
| 77 | 30 | indonesia, government, egovernment, governance, program, nusantara, ikn, regency, bandung, local |
| 78 | 30 | anomaly, detection, anomalous, outlier, series, tir, time, data, captchas, seismic |
| 79 | 30 | traffic, vehicle, road, detection, object, violation, sign, video, counting, image |
| 80 | 28 | risk, risks, assessment, credit, financial, project, social, management, construction, smart |
| 81 | 27 | trading, evs, energy, transaction, blockchain, p2p, charging, ev, sg, blockchainbased |
| 82 | 27 | optical, fso, turbulence, wavelength, transmission, gbps, channel, atmospheric, rofso, link |
| 83 | 27 | agent, multiagent, parcelrestbox, shopping, agents, customer, product, ordering, system, mots |
| 84 | 27 | building, bim, automation, buildings, bimiot, iot, integration, sensor, construction, floor |
| 85 | 26 | lidar, point, 3d, cloud, segmentation, object, synopsis, clouds, autonomous, vehicle |
| 86 | 25 | reinforcement, traffic, learning, signal, control, rl, agent, reward, intersection, deep |
| 87 | 25 | definition, concept, term, scp, understanding, literature, sc, city, smart, strategy |
| 88 | 25 | heat, energy, heating, renewable, thermal, solar, exergetic, cooling, district, pv |
| 89 | 24 | student, course, students, teaching, elearning, educational, learning, education, teacher, college |
| 90 | 24 | geospatial, information, gis, geographic, geoportals, cartographic, map, governance, spatial, thinkcities |
| 91 | 22 | energy, meter, consumption, home, saving, behaviour, ict, res, household, consumers |
| 92 | 22 | cyberphysical, cpss, cps, cyber, physical, systems, cpsc, world, system, cyberphysicalsocial |
| 93 | 22 | cultural, heritage, fourhospitality, relic, tourist, museum, intangible, mobile, preservation, tourists |
| 94 | 22 | capital, ic, intellectual, egyptian, policy, sids, managerial, study, case, framework |
| 95 | 21 | harvesting, selfpowered, piezoelectric, energy, nanogenerators, triboelectric, solar, power, mechanical, harvester |
| 96 | 21 | simulation, movement, agentbased, agent, abs, scenario, urban, model, fleet, replicate |
| 97 | 20 | dashboard, visualization, dashboards, visual, data, adaptable, visualize, urban, analyze, tvdp |
| 98 | 20 | pattern, trajectory, clustering, multidensity, mining, discover, spatiotemporal, correlated, hotspot, densitybased |
| 99 | 20 | federated, fl, learning, edge, privacy, training, server, centralized, fedtm, data |
| 100 | 20 | bim, gis, construction, ifc, shapefile, modeling, information, cim, integration, building |
| 101 | 19 | rainfall, flood, planting, hyperspectral, prediction, weather, image, crop, meteorological, arrangement |
| 102 | 19 | urbanism, digital, platform, labor, torontos, alphabet, politics, waterfront, political, sidewalk |
| 103 | 19 | business, value, model, service, canvas, bmes, framework, bm, case, smart |
| 104 | 19 | activity, recognition, har, human, home, activities, recognize, accuracy, sensor, labeling |
| 105 | 18 | blockchain, vehicle, vehicular, consensus, transaction, vehicles, iov, blockchainbased, security, secure |
| 106 | 17 | gamification, gamified, game, coremm, participation, citizen, engagement, codesign, public, behaviour |
| 107 | 17 | autonomous, vehicle, driving, fagvs, traffic, fagvinscf, venus, avs, scc, validation |
| 108 | 17 | parking, occupancy, prediction, space, availability, onstreet, free, min, slot, traffic |
| 109 | 17 | radio, aps, wifi, cell, channel, mobile, spectrum, converged, scheme, ddsa |
| 110 | 16 | health, food, ph, cancer, ugss, physical, healthy, social, environmental, sphec |
| 111 | 16 | governance, ethical, calzada, datadriven, data, policy, cooperatives, technostakeholders, paneuropean, barcelona |
| 112 | 16 | maturity, model, city, depok, assessment, south, level, colombia, smart, dimension |
| 113 | 16 | video, surveillance, detection, violence, clip, intrusion, neural, anomaly, vd, ivs |
| 114 | 16 | social, place, locationbased, people, clustering, tourist, density, activity, profiling, venue |
| 115 | 15 | lab, living, lls, labs, innovation, virtual, initiative, turin, torino, vending |
| 116 | 15 | egovernance, egovernment, government, india, governance, eservices, chapter, stuttgart, dubai, maturity |
| 117 | 15 | shm, structural, monitoring, sensor, structures, bridges, corrosion, wsan, health, ischm |
| 118 | 15 | crash, road, safety, collision, age, hard, driver, rearend, walkway, telematics |
| 119 | 15 | qol, csr, perception, citizens, scqol, scd, csgscs, quality, life, young |
| 120 | 15 | russian, russia, sphere, development, tyumen, tire, concept, tatarstan, petersburg, kazan |
| 121 | 15 | parking, camera, space, lot, occupancy, image, vacant, gate, detection, car |
| 122 | 14 | video, streaming, qoe, bandwidth, qos, transcoding, routing, bitrate, quality, adaptive |
| 123 | 14 | data, aqueducte, sharing, api, xml, dgt, apis, source, aggregation, service |
| 124 | 14 | energy, renewable, electricity, grid, rei, efficiency, production, realizing, sources, prosumers |
| 125 | 14 | image, encryption, chaotic, security, medical, scheme, sst, ehr, images, healthcare |
| 126 | 13 | fiber, optical, fiberoptic, sensor, fault, monitoring, bragg, fibreoptic, strain, multimode |
| 127 | 13 | nbs, sustainable, indicator, sustainability, assessment, aquaponics, sdg, greenness, citys, environmental |
| 128 | 13 | pavement, road, rehabilitation, mams, condition, ipavement, pmi, rct, civil, surface |
| 129 | 12 | sensing, vcs, driveby, coverage, bus, automotive, msigc, metric, spatiotemporal, scanner |
| 130 | 12 | population, floating, om, information, functional, administration, operator, city, data, kpi |
| 131 | 12 | disruptive, technology, photonic, living, technologies, cities, sci, internet, discus, web |
| 132 | 12 | differential, optimization, bso, evolutionary, deepso, swarm, storm, brain, globalbest, particle |
| 133 | 12 | crowdsourcing, duplicate, crowdsensing, campaign, msmc, report, pcm4de, rhetoric, collective, review |
| 134 | 12 | ant, colony, swarm, algorithm, mapping, pheromone, aa, firefly, hop, foraging |
| 135 | 11 | noma, decoding, spectrum, ced, interference, lt, transmission, aoi, softcoap, lhmn |
| 136 | 11 | housing, settlement, ekurhuleni, informal, audit, development, recreational, welllocated, wlli, subsidized |
| 137 | 11 | dubai, geoict, oil, dubais, ahmadi, kuwait, arabian, political, saudi, arab |
| 138 | 11 | mvaas, query, raw, view, data, processing, streams, stream, materialized, i2dlv |
| 139 | 10 | protection, regulation, gdpr, personal, legal, eu, sll, law, general, data |
| 140 | 10 | abecities, cloud, access, scheme, attributebased, obfuscation, encryption, authorized, authorization, data |
| 141 | 10 | crsg, iot, graph, siot, clustering, common, network, discovery, attributed, gn |
| 142 | 10 | home, automation, hns, appliance, temperature, icsce, android, connected, system, user |
| 143 | 10 | sec, decarbonisation, energy, transition, sles, projects, barrier, cities4zero, decarbonization, sustainability |
| 144 | 10 | community, participation, surveillance, researcher, citizen, survey, coh, imago, right, nict |
| Topic | Count | Representative Terms |
|---|---|---|
| −1 | 1072 | city, india, smart, said, also, project, digital, technology, data, government |
| 0 | 303 | city, smart, cities, urban, data, mission, technology, development, project, infrastructure |
| 1 | 131 | solar, power, energy, mw, renewable, rooftop, wind, capacity, said, electricity |
| 2 | 127 | secretary, officer, ias, department, charge, additional, kumar, commissioner, posted, appointed |
| 3 | 126 | water, supply, river, ganga, rs, drinking, treatment, crore, sewage, urban |
| 4 | 75 | metro, rail, railway, railways, transport, train, project, corridor, crore, rs |
| 5 | 61 | waste, plastic, recycling, management, solid, ewaste, environment, packaging, india, tonne |
| 6 | 59 | india, skill, manufacturing, msmes, industry, product, training, innovation, technology, ai |
| 7 | 56 | digital, government, egovernance, kerala, service, state, governance, citizen, india, department |
| 8 | 48 | state, investment, industrial, mou, said, government, signed, business, policy, minister |
| 9 | 48 | highway, road, project, km, highways, rs, crore, nhai, expressway, construction |
| 10 | 47 | hospital, covid19, health, patient, medical, care, pandemic, healthcare, patients, doctor |
| 11 | 46 | security, cyber, cybersecurity, threat, data, attack, business, organization, breach, enterprise |
| 12 | 44 | estate, real, unit, housing, property, market, sale, home, developer, q1 |
| 13 | 44 | delhi, bus, metro, taxi, transport, card, station, uber, cab, dmrc |
| 14 | 41 | iot, device, aeris, m2m, connected, data, internet, things, business, solution |
| 15 | 41 | led, bulb, eesl, energy, light, street, lighting, ujala, saving, programme |
| 16 | 41 | toilet, sanitation, swachh, cleanliness, bharat, waste, clean, city, toilets, urban |
| 17 | 40 | surveillance, security, video, city, smart, safety, camera, police, safe, technology |
| 18 | 39 | air, pollution, quality, delhi, burning, smog, level, delhis, teri, tower |
| 19 | 36 | climate, energy, change, emission, global, india, 2030, clean, action, said |
| 20 | 34 | payment, banking, paytm, bank, digital, cash, upi, payments, merchant, transaction |
| 21 | 34 | wipro, customer, cloud, global, digital, aws, wipros, sap, company, service |
| 22 | 33 | housing, house, affordable, urban, scheme, assistance, construction, minister, said, crore |
| 23 | 33 | grid, power, meter, smart, distribution, energy, transmission, discoms, metering, electricity |
| 24 | 32 | kuljeet, chahal, gridconnected, encourage, informed, ndmc, medium, member, civic, recently |
| 25 | 32 | chahal, kuljeet, gridconnected, ndmc, encourage, informed, medium, member, civic, recently |
| 26 | 32 | police, cctns, criminal, crime, station, policing, delhi, portal, complaint, said |
| 27 | 31 | startup, startups, woman, hub, ecosystem, entrepreneur, telangana, innovation, thub, program |
| 28 | 30 | disaster, management, flood, risk, said, rain, earthquake, reduction, district, plan |
| 29 | 26 | charging, electric, ev, evs, vehicle, transport, station, cesl, public, vehicles |
| 30 | 26 | ndmc, smart, delhi, civic, municipal, council, grievance, connaught, city, app |
| 31 | 24 | green, building, sustainable, griha, energy, bamboo, construction, buildings, igbc, design |
| 32 | 24 | urban, city, cities, urbanization, development, global, population, building, like, india |
| 33 | 23 | dda, delhi, development, said, land, duda, work, flat, government, agency |
| 34 | 23 | smart, cities, bw, businessworld, city, sapna, bhardwaj, yes, idea, jury |
| 35 | 21 | rpa, automation, ai, uipath, robot, technology, human, data, process, intelligence |
| 36 | 17 | school, education, teacher, child, learning, learner, mentor, classroom, teaching, student |
| 37 | 17 | gst, tax, bill, rate, sabha, wages, estate, regime, benefit, real |
| 38 | 16 | wifi, station, railway, google, railtel, facility, hotspot, railways, bsnl, stations |
| 39 | 16 | business, customer, parking, covid19, crisis, employee, organization, digital, need, time |
| 40 | 15 | road, safety, accident, death, crash, transport, fatality, traffic, bus, corporates |
| 41 | 13 | climate, energy, plan, action, change, consumption, city, planyc, greenhouse, gas |
| 42 | 12 | capital, amaravati, andhra, master, singapore, pradesh, ap, chandrababu, plan, japanese |
| 43 | 12 | ntt, business, smbs, customer, cloud, digitalization, india, technology, transformation, data |
| 44 | 12 | port, coastal, gadkari, ports, sagarmala, inland, said, rs, crore, waterway |
| 45 | 12 | island, andaman, nicobar, kashmir, bagh, prime, modi, connectivity, minister, jsw |
| 46 | 11 | dell, emc, vxrail, storage, data, vmware, technologies, workload, hci, cloud |
| 47 | 11 | uk, minister, fadnavis, visit, summit, modi, british, maharashtra, madhya, said |
| 48 | 11 | cloud, hybrid, citrix, business, organization, microsoft, enterprise, cloudbased, respondent, azure |
| 49 | 11 | aiib, bank, adb, asian, percent, china, billion, agreement, finance, infrastructure |
| 50 | 10 | aluva, urban, approval, naidu, development, meeting, respect, minister, gc, unhabitat |
| 51 | 10 | solar, railways, power, station, panel, railway, plant, mw, depot, installed |
| Topic | Count | Representative Terms |
|---|---|---|
| −1 | 850 | city, urban, street, design, new, building, community, transportation, downtown, architecture |
| 0 | 292 | smart, cities, city, iot, tech, platform, technology, data, open, digital |
| 1 | 209 | planning, planner, urban, job, degree, career, planners, design, anyone, designer |
| 2 | 90 | housing, affordable, crisis, affordability, apartment, house, rent, renters, apartments, lessons |
| 3 | 60 | transit, bus, public, transportation, shuttle, free, system, america, commuters, beep |
| 4 | 51 | design, project, urban, software, comfort, im, writing, code, inspiring, engineered |
| 5 | 45 | rail, highspeed, light, speed, stations, amtrak, high, cost, station, trains |
| 6 | 42 | future, city, cities, tokyo, spongy, corporate, connected, small, itself, effected |
| 7 | 40 | light, france, sign, pedestrian, streetlight, lights, lighting, range, french, traffic |
| 8 | 39 | zoning, ordinance, housing, policy, commission, minneapolis, singlefamily, based, reform, code |
| 9 | 38 | street, art, streets, public, london, legitimacy, hate, vandalism, stroad, artistic |
| 10 | 38 | walkable, heat, walkability, sidewalks, extreme, neighborhood, tropical, climates, uphill, cardependency |
| 11 | 37 | bike, bikes, ebikes, important, cycling, cyclist, electric, ebike, driving, bicycle |
| 12 | 35 | parking, space, lot, richmond, minimum, repeal, fee, yard, driver, replacing |
| 13 | 33 | car, carfree, dependency, american, carcentric, gas, evs, eliminating, dependent, lets |
| 14 | 32 | career, job, advice, grad, school, bimonthly, graduate, thread, education, academiccareer |
| 15 | 30 | urbanism, city, modernism, amazons, return, urbanists, beyond, perfect, live, opinion |
| 16 | 27 | lane, bike, picture, left, protected, emergency, right, lanes, overpass, turn |
| 17 | 25 | suburban, rural, town, village, tx, sprawl, tiny, suburbs, areas, growth |
| 18 | 24 | noise, air, pollution, quality, quiet, sound, monitoring, reduce, din, mostly |
| 19 | 20 | park, france, parks, central, mixed, use, old, station, repurposing, shoups |
| 20 | 20 | interview, advice, internship, tips, first, expect, interviewing, position, prepare, job |
| 21 | 19 | california, californias, earthquake, flaw, role, law, granny, woe, easing, surprising |
| 22 | 19 | tree, trees, forest, usc, climate, summer, third, researcher, extreme, resident |
| 23 | 18 | office, conversions, converting, building, empty, 11,000, offices, that, hard, says |
| 24 | 18 | book, urban, recommendations, planning, books, designplanning, slums, politics, shape, story |
| 25 | 18 | korea, south, seoul, apartment, built, class, complex, jugong, supplied, wirye |
| 26 | 17 | road, widening, roads, stroads, highway, suburb, shrink, conventional, se, webcast |
| 27 | 17 | malls, mall, shopping, thoughts, bring, used, may, walmart, residences, substitute |
| 28 | 17 | japan, paradise, snow, tokyo, japans, vietnams, anticar, became, concrete, carcentric |
| 29 | 15 | deaths, death, safety, road, hasnt, fatality, hoboken, traffic, years, pedestrian |
| 30 | 14 | gentrification, food, condo, tastes, trends, displacement, politics, lead, development, neighborhoods |
| 31 | 14 | jacobs, jane, book, death, life, review, enjoy, american, hope, great |
| 32 | 13 | lawn, water, lawns, grass, court, plant, climate, droughtfriendly, norm, dwindles |
| 33 | 13 | saudi, arabia, riyadh, desert, worlds, mega, theme, billion, modern, largest |
| 34 | 13 | aicp, experience, exam, pas, week, education, dtlls, diploma, det, eit |
| 35 | 13 | congestion, pricing, toll, vehicle, wins, everybody, impacts, york, environmental, plan |
| 36 | 12 | land, tax, value, property, amendment, rising, 14th, ownership, flooded, depend |
| 37 | 12 | skyscrapers, skyscraper, construction, buildings, reuses, towering, emotionally, straddling, 101, 2700 |
| 38 | 11 | traffic, cameras, speeding, crashes, limit, control, reduce, light, speed, anticipating |
| 39 | 10 | build, construction, america, created, europe, honestlycan, bubbles, enuf, leaked, mainland |
| 40 | 10 | berlin, bchle, freiburg, germany, 5 min, useful, canal, 8 lane, constructing, berlins |
References
- Sharma, C.; Batra, I.; Sharma, S.; Malik, A.; Sanwar Hosen, A.S.M.; Ra, I.-H. Predicting Trends and Research Patterns of Smart Cities: A Semi-Automatic Review Using Latent Dirichlet Allocation (LDA). IEEE Access 2022, 10, 121080–121095. [Google Scholar] [CrossRef]
- United Nations. World Urbanization Prospects 2018—Highlights; Department of Economic and Social Affairs: New York, NY, USA, 2019. [Google Scholar]
- Nicolas, C.; Kim, J.; Chi, S. Natural Language Processing-Based Characterization of Top-Down Communication in Smart Cities for Enhancing Citizen Alignment. Sustain. Cities Soc. 2021, 66, 102674. [Google Scholar] [CrossRef]
- Zarindast, A.; Sharma, A.; Wood, J. Application of Text Mining in Smart Lighting Literature—An Analysis of Existing Literature and a Research Agenda. Int. J. Inf. Manag. Data Insights 2021, 1, 100032. [Google Scholar] [CrossRef]
- Wang, C.; Steinfield, E.; Maisel, J.; Kang, B. Is Your Smart Inclusive? Evaluating Proposals from the U.S. Department of Transportation’s Smart City Challenge. Sustain. Cities Soc. 2021, 74, 103148. [Google Scholar] [CrossRef]
- Stimmel, C.L. Building Smart Cities: Analytics, ICT, and Design Thinking; CRC Press: Boca Raton, FL, USA, 2016. [Google Scholar]
- Townsend, A.M. Smart Cities: Big Data, Civic Hackers, and the Quest for a New Utopia; W.W. Norton & Company: New York, NY, USA, 2013. [Google Scholar]
- Kim, B.; Yoo, M.; Park, K.C.; Lee, K.R.; Kim, J.H. A Value of Civic Voices for Smart City: A Big Data Analysis of Civic Queries Posed by Seoul Citizens. Cities 2021, 108, 102941. [Google Scholar] [CrossRef]
- Kousis, A.; Tjortjis, C. Data Mining Algorithms for Smart Cities: A Bibliometric Analysis. Algorithms 2021, 14, 242. [Google Scholar] [CrossRef]
- Kar, A.K.; Dwivedi, Y. Theory Building with Data-Driven Research—Moving Away from the “What” towards the “Why”. Int. J. Inf. Manag. 2020, 54, 102205. [Google Scholar] [CrossRef]
- Gillies, M.; Murthy, D.; Brenton, H.; Olaniyan, R. Theme and Topic: How Qualitative Research and Topic Modeling Can Be Brought Together. arXiv 2022, arXiv:2210.00707. [Google Scholar]
- Kumar, S.; Kar, A.K.; Ilavarasan, V. Applications of Text Mining in Services Management: A Systematic Literature Review. Int. J. Inf. Manag. Data Insights 2021, 1, 100008. [Google Scholar] [CrossRef]
- Zheng, Z.; Sieber, R. Interpreting the Smart City Through Topic Modeling; Springer Link: Montreal, QC, Canada, 2023; Volume 1, pp. 29–46. [Google Scholar]
- Suyanto, A.H.; Djatna, T.; Wijaya, S.H. Mapping and Predicting Research Trends in International Journal Publications Using Graph and Topic Modeling. Indones. J. Electr. Eng. Comput. Sci. 2023, 30, 1201–1213. [Google Scholar] [CrossRef]
- Braun, V.; Clarke, V. Using Thematic Analysis in Psychology. Qual. Res. Psychol. 2006, 3, 77–101. [Google Scholar] [CrossRef]
- Isoaho, K.; Gritsenko, D.; Mäkelä, E. Topic Modeling and Text Analysis for Qualitative Policy Research. Policy Stud. J. 2021, 49, 300–325. [Google Scholar] [CrossRef]
- Chang, J.; Boyd-Graber, J.; Gerrish, S.; Wang, C.; Blei, D. Reading Tea Leaves: How Humans Interpret Topic Models; Bengio, Y., Schuurmans, D., Lafferly, J., Williams, C., Culotta, A., Eds.; Curran Associates, Inc.: Vancouver, BC, Canada, 2009; Volume 22, pp. 288–296. [Google Scholar]
- Greene, D.; O’Callaghan, D.; Cunningham, P. How Many Topics? Stability Analysis for Topic Models; Calders, T., Esposito, F., Hullermeier, E., Meo, R., Eds.; Springer: Berlin/Heidelberg, Germany, 2014; Volume 8724, pp. 498–513. [Google Scholar]
- Asmussen, C.B.; Møller, C. Smart Literature Review: A Practical Topic Modeling Approach to Exploratory Literature Review. J. Big Data 2019, 6, 93. [Google Scholar] [CrossRef]
- Park, K.C.; Lee, C.H. A Study on the Research Trends for Smart City Using Topic Modeling. J. Internet Comput. Serv. 2019, 20, 119–128. [Google Scholar]
- Wang, J.; Wang, M.; Song, Y. A Study on Smart City Research Activity Using Bibliometric and Natural Language Processing Methods; ACM: Guangzhou, China, 2021; pp. 1–7. [Google Scholar]
- Lee, W.S. Analysing the Evolution of Interdisciplinary Areas: Case of Smart Cities. J. Glob. Inf. Manag. 2022, 30, 1–23. [Google Scholar] [CrossRef]
- Esposito, G.; Terlizzi, A.; Guarino, M.; Crutzen, N. Interpreting Digital Governance at the Municipal Level: Evidence from Smart City Projects in Belgium. Int. Rev. Adm. Sci. 2023, 1–17. [Google Scholar] [CrossRef]
- Zheng, Z.; Sieber, R. Putting Humans Back in the Loop of Machine Learning in Canadian Smart Cities. Trans. GIS 2021, 26, 8–24. [Google Scholar] [CrossRef]
- Alswedani, S.; Katib, L.; Abozinadah, E.; Mehmood, R. Discovering Urban Governance Parameters for Online Learning in Saudi Arabia During COVID-19 Using Topic Modeling of Twitter Data. Front. Sustain. Cities 2022, 4, 751681. [Google Scholar] [CrossRef]
- Vargas-Calderón, V.; Camargo, J. Characterization of Citizens Using Word2vec Latent Topic Analysis in a Large Ser of Tweets. Cities 2019, 92, 187–196. [Google Scholar] [CrossRef]
- Sinha, M.; Guha, S.; Varma, P.; Mukherjee, T.; Mannarswamy, S. My City, My Voice: Listening to the Citizen Views from Web Sources; ACM: Kolkata, India, 2019; pp. 52–60. [Google Scholar]
- Saheb, T.; Dehghani, M.; Saheb, T. Artificial Intelligence for Sustainable Energy: A Contextual Topic Modeling and Content Analysis. Sustain. Comput. Inform. Syst. 2022, 35, 100699. [Google Scholar] [CrossRef]
- Valença, G.; Moura, F.; de Sá, A.M. How Can We Develop Road Space Allocation Solutions for Smart Cities Using Emerging Information Technologies? A Review Using Text Mining. Int. J. Inf. Manag. Data Insights 2023, 3, 100150. [Google Scholar] [CrossRef]
- Srinivasa-Desikan, B. Natural Language Processing and Computational Linguistics; Packt Publishing Ltd.: Birmingham, UK, 2018. [Google Scholar]
- De Oliveira Capela, F.; Ramirez-Marquez, E. Detecting Urban Identity Perception via Newspaper Topic Modeling. Cities 2019, 93, 72–83. [Google Scholar] [CrossRef]
- Koukaras, P.; Tjortjis, C. Social Media Analytics, Types and Methodology. In Machine Learning Paradigms. Learning and Analytics in Intelligent Systems; Tsihrintzis, G., Virvou, M., Sakkopoulos, E., Jain, L., Eds.; Springer: Cham, Switzerland, 2019; pp. 401–427. [Google Scholar]
- Rousidis, D.; Koukaras, P.; Tjortjis, C. Social Media Prediction: A Literature Review. Multimed. Tools Appl. 2020, 79, 6279–6311. [Google Scholar] [CrossRef]
- Jeong, B.; Yoon, J.; Lee, J.-M. Social Media Mining for Product Planning: A Product Opportunity Mining Approach Based on Topic Modeling and Sentiment Analysis. Int. J. Inf. Manag. 2019, 48, 280–290. [Google Scholar] [CrossRef]
- Egger, R. Topic Modelling: Modelling Hidden Semantic Structures in Textual Data. In Applied Data Science in Tourism: Interdisciplinary Approaches, Methodologies, and Applications; Springer Nature: Cham, Switzerland, 2022; pp. 375–403. [Google Scholar]
- Storopoli, J.E. Topic Modeling: How and Why to Use in Management Research. Iberoam. J. Strateg. Manag.-IJSM 2019, 18, 316–338. [Google Scholar] [CrossRef]
- Nikolenko, S.; Koltcov, S.; Koltsova, O. Topic Modeling for Qualitative Studies. J. Inf. Sci. 2017, 43, 88–102. [Google Scholar] [CrossRef]
- Mohr, J.; Bogdanov, P. Topic Models: What They Are and Why They Matter. Poetics 2013, 41, 545–569. [Google Scholar] [CrossRef]
- Ogunleye, B.; Maswera, T.; Hirsch, L.; Gaudoin, J.; Brunsdon, T. Comparison of Topic Modelling Approach in the Banking Context. Appl. Sci. 2023, 13, 797. [Google Scholar] [CrossRef]
- Deerwester, S.; Dumais, S.; Furnas, G.; Landauer, T.; Harshman, R. Indexing by Latent Semantic Analysis. J. Am. Soc. Inf. Sci. 1990, 41, 391–407. [Google Scholar] [CrossRef]
- Hoffman, T. Probabilistic Latent Semantic Analysis; Université de Montréal: Stockholm, Sweden, 1999. [Google Scholar]
- Blei, D.; Ng, A.; Jordan, M. Latent Dirichlet Allocation. J. Mach. Learn. Res. 2003, 3, 993–1022. [Google Scholar]
- Grootendorst, M. BERTopic: Neural Topic Modeling with a Class-Based TF-IDF Procedure. arXiv 2022, arXiv:2203.05794. [Google Scholar]
- Wang, Z.; Chen, J.; Chen, J.; Chen, H. Identifying Interdisciplinary Topics and Their Evolution Based on BERTopic. In Scientometrics; Springer: Berlin/Heidelberg, Germany, 2023. [Google Scholar]
- Mazzei, D.; Ramjattan, R. Machine Learning for Industry 4.0: A Systematic Review Using Deep Learning-Based Topic Modelling. Sensors 2022, 22, 8641. [Google Scholar] [CrossRef]
- Thakur, O.; Saritha, S.K.; Jain, S. Topic Modeling, Sentiment Analysis and Text Summarization for Analyzing News Headlines and Articles; Khare, N., Tomar, D.S., Ahirwal, M.K., Semwal, V.B., Soni, V., Eds.; Springer: Cham, Switzerland, 2022; pp. 220–239. [Google Scholar]
- Reimers, N.; Gurevych, I. Sentence-Bert: Sentence Embeddings Using Siamese BERT-Networks; Association for Computational Linguistics: Hong Kong, China, 2019; Volume 1, pp. 3982–3992. [Google Scholar]
- Devlin, J.; Chang, M.-W.; Lee, K.; Toutanova, K. BERT: Pre-Training of Deep Bidirectional Transformers for Language Understanding. arXiv 2019, arXiv:1810.04805. [Google Scholar]
- McInnes, L.; Healy, J.; Saul, N.; Großberger, L. UMAP: Uniform Manifold Approximation and Projection. J. Open Source Softw. 2018, 3, 861. [Google Scholar] [CrossRef]
- Campello, R.J.G.B.; Moulavi, D.; Sander, J. Density-Based Clustering Based on Hierarchical Density Estimates; Pei, J., Tseng, V.S., Cao, L., Motoda, H., Xu, G., Eds.; Springer: Berlin/Heidelberg, Germany, 2013; Volume 7819, pp. 160–172. [Google Scholar]
- Cai, G.; Sun, F.; Sha, Y. Interactive Visualization for Topic Model Curation; ESIDA: Tokyo, Japan, 2018; Volume 2068. [Google Scholar]
- McHugh, M.L. Interrater Reliability: The Kappa Statistic. Biochem. Medica 2012, 22, 276–282. [Google Scholar] [CrossRef]
- Kherwa, P.; Bansal, P. Topic Modeling: A Comprehensive Review. EAI Endorsed Trans. Scalable Inf. Syst. 2019, 7, 1–16. [Google Scholar] [CrossRef]
- Guest, G.; MacQueen, K.; Namey, E. Applied Thematic Analysis; Sage Publications: Thousand Oaks, CA, USA, 2012. [Google Scholar]
- Khatavkar, N.; Naik, A.A.; Kadam, B. Energy Efficient Street Light Controller for Smart Cities. In Proceedings of the 2017 International Conference on Microelectronic Devices, Circuits and Systems (ICMDCS), Vellore, India, 10–12 August 2017; pp. 1–6. [Google Scholar]
- Hoang, A.T.; Pham, V.V.; Nguyen, X. Integrating Renewable Sources into Energy System for Smart City as a Sagacious Strategy towards Clean and Sustainable Process. J. Clean. Prod. 2021, 305, 127161. [Google Scholar] [CrossRef]
- Liu, Y.; Yang, C.; Jiang, L.; Xie, S.; Zhang, Y. Intelligent Edge Computing for IoT-Based Energy Management in Smart Cities. IEEE Netw. 2019, 33, 111–117. [Google Scholar] [CrossRef]
- Singh, P.; Nayyar, A.; Kaur, A.; Ghosh, U. Blockchain and Fog Based Architecture for Internet of Everything in Smart Cities. Future Internet 2020, 12, 61. [Google Scholar] [CrossRef]
- Siyam, N.; Alqaryouti, O.; Abdallah, S. Mining Government Tweets to Identify and Predict Citizens Engagement. Technol. Soc. 2020, 60, 101211. [Google Scholar] [CrossRef]
- Makarchenko, M.; Nerkararian, S.; Shmeleva, I. How Traditional Banks Should Work in Smart City. In Digital Transformation and Global Society. DTGS 2016. Communications in Computer and Information Science; Chugunov, A., Bolgov, R., Kabanov, Y., Kampis, G., Wimmer, M., Eds.; Springer: Cham, Switzerland, 2016; Volume 674, pp. 123–134. [Google Scholar]
- Braun, T.; Fung, B.; Iqbal, F.; Shah, B. Security and Privacy Challenges in Smart Cities. Sustain. Cities Soc. 2018, 39, 499–507. [Google Scholar] [CrossRef]
- Almeida, F. Prospects of Cybersecurity in Smart Cities. Future Internet 2023, 15, 285. [Google Scholar] [CrossRef]
- Li, C.; Lu, Y.; Wu, J.; Zhang, Y.; Xia, Z.; Wang, T.; Yu, D.; Chen, X.; Liu, P.; Guo, J. LDA Meets Word2Vec: A Novel Model for Academic Abstract Clustering. In Proceedings of the Companion Proceedings of the Web Conference, Lyon, France, 23–27 April 2018; International World Wide Web Conferences Steering Committee: Geneva, Switzerland, 2018; pp. 1699–1706. [Google Scholar]
- Kumar, M.; Rani, R.; Botarelli, M.; Epiophaniou, G.; Maple, C. Science and Technology Ontology: A Taxonomy of Merging Topics. arXiv 2023, arXiv:2305.04055. [Google Scholar]
- Walker, R.; Zhang, J.; Chandra, Y.; van Witteloosyuijn, A. Topic Modeling the Research-Practice Gap in Public Administration. Public Adm. Rev. 2019, 79, 931–937. [Google Scholar] [CrossRef]


| Module | Use | URL | License |
|---|---|---|---|
| BERTopic | Topic modeling and visualizations | https://maartengr.github.io/BERTopic/index.html accessed on 30 July 2023 | MIT |
| NLTK | Natural language toolkit | https://www.nltk.org/ accessed on 30 July 2023 | Apache 2.0 |
| Feedparser | RSS feed parsing | https://github.com/kurtmckee/feedparser/ accessed on 30 July 2023 | BSD-2 |
| Requests | HTTP requests | https://requests.readthedocs.io/en/latest/ accessed on 30 July 2023 | Apache 2.0 |
| BeautifulSoup | Web scraping | https://www.crummy.com/software/BeautifulSoup/ accessed on 30 July 2023 | MIT |
| Asyncpraw | Reddit wrapper | https://asyncpraw.readthedocs.io/en/stable/ accessed on 30 July 2023 | Simplified BSD |
| Matplotlib | Visualization library | https://matplotlib.org/ accessed on 30 July 2023 | BSD |
| Pandas | Data analysis and manipulation | https://pandas.pydata.org/ accessed on 30 July 2023 | BSD-3 |
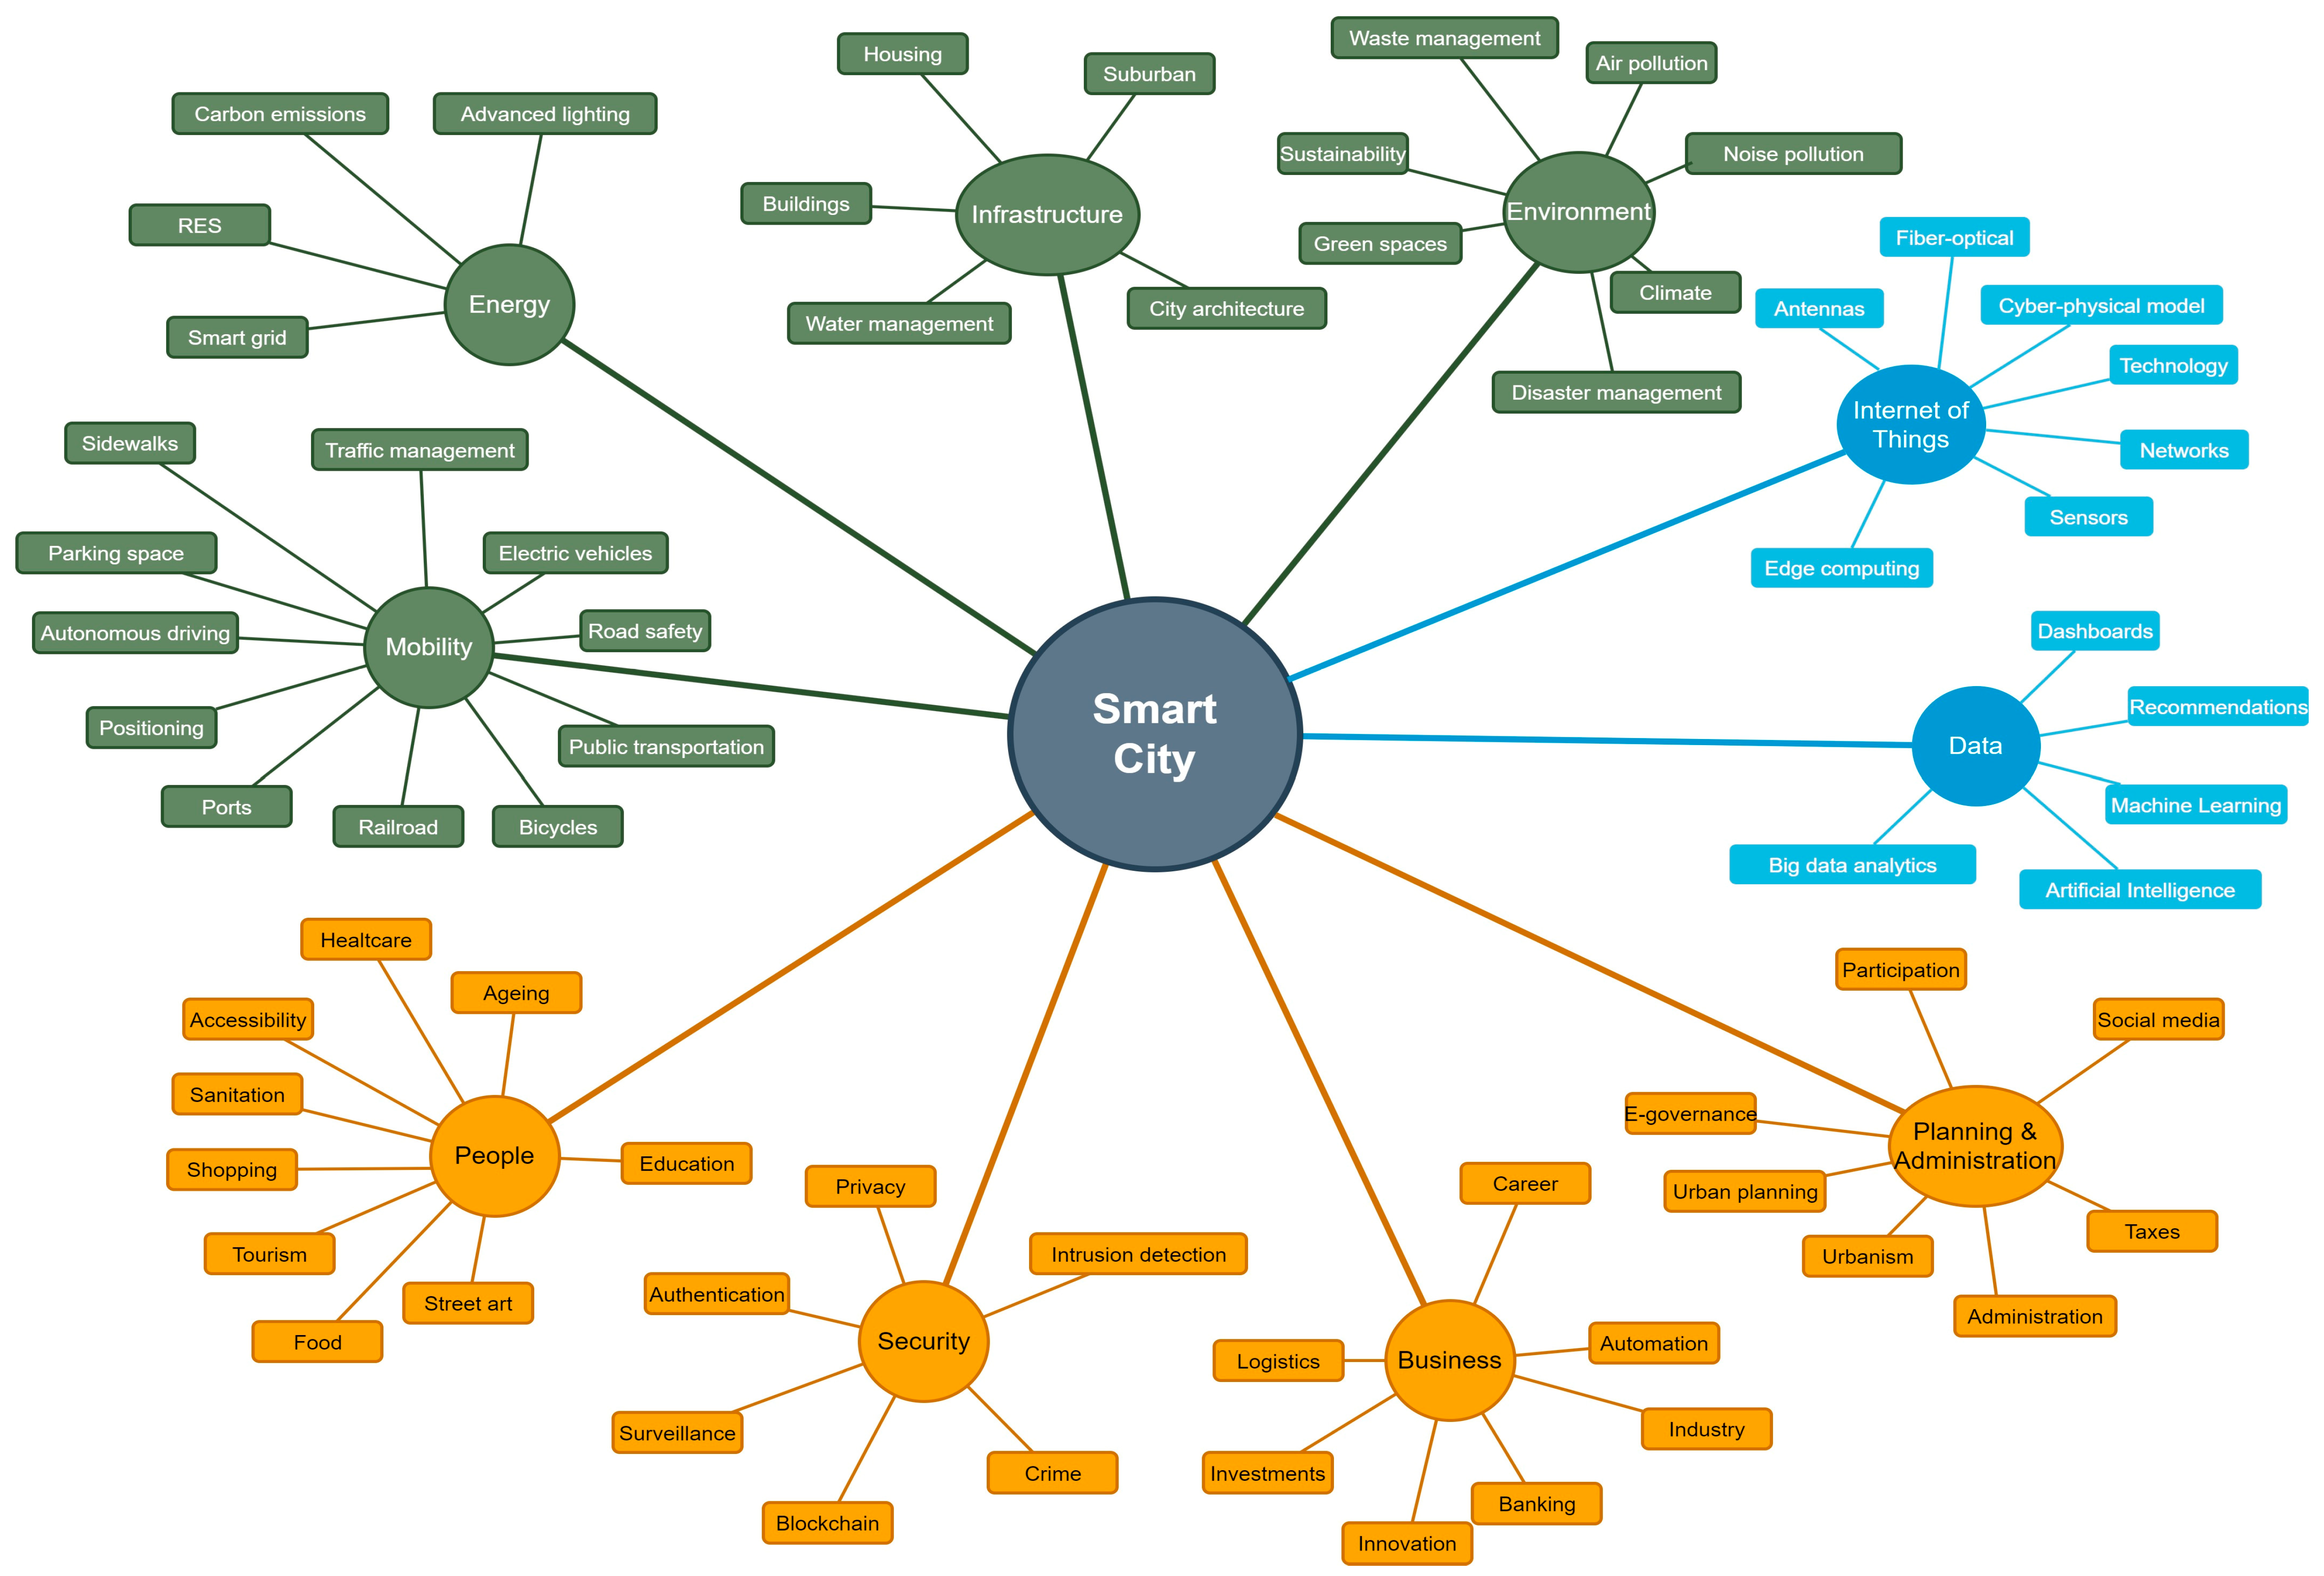
| Common | Abstracts | Blog Posts | Social Media Posts |
|---|---|---|---|
| Air pollution | Accessibility | Administration | Career |
| Bicycles | Ageing | Automation | Food |
| Buildings | Antennas | Banking | Green spaces |
| Carbon emissions | Artificial Intelligence | Business | Railroad |
| Climate | Authentication | Crime | Road safety |
| Electric vehicles | Autonomous driving | Disaster management | Shopping |
| Healthcare | Big data | Education | Sidewalks |
| Housing | Blockchain | E-governance | Street art |
| Infrastructure | City architecture | Innovation | Suburban |
| IoT | Cyber-physical model | Investments | Urban planning |
| Noise pollution | Dashboard | Lighting | Urbanism |
| Parking space | Disaster management | Ports | |
| Public transportation | Edge computing | Railways | |
| Security | Education | RES | |
| Smart grid | E-governance | Road safety | |
| Sustainability | Fiber-optical | Sanitation | |
| Traffic management | Indicators | Surveillance | |
| Waste management | Industry | Taxes | |
| Water management | Innovation | ||
| City | Intrusion detection | ||
| Logistics | |||
| Machine learning | |||
| Networks | |||
| Participation | |||
| Positioning | |||
| Privacy | |||
| Recommendations | |||
| Semantics | |||
| Sensors | |||
| Social media | |||
| Technology | |||
| Tourism |
Disclaimer/Publisher’s Note: The statements, opinions and data contained in all publications are solely those of the individual author(s) and contributor(s) and not of MDPI and/or the editor(s). MDPI and/or the editor(s) disclaim responsibility for any injury to people or property resulting from any ideas, methods, instructions or products referred to in the content. |
© 2023 by the authors. Licensee MDPI, Basel, Switzerland. This article is an open access article distributed under the terms and conditions of the Creative Commons Attribution (CC BY) license (https://creativecommons.org/licenses/by/4.0/).
Share and Cite
Kousis, A.; Tjortjis, C. Investigating the Key Aspects of a Smart City through Topic Modeling and Thematic Analysis. Future Internet 2024, 16, 3. https://doi.org/10.3390/fi16010003
Kousis A, Tjortjis C. Investigating the Key Aspects of a Smart City through Topic Modeling and Thematic Analysis. Future Internet. 2024; 16(1):3. https://doi.org/10.3390/fi16010003
Chicago/Turabian StyleKousis, Anestis, and Christos Tjortjis. 2024. "Investigating the Key Aspects of a Smart City through Topic Modeling and Thematic Analysis" Future Internet 16, no. 1: 3. https://doi.org/10.3390/fi16010003
APA StyleKousis, A., & Tjortjis, C. (2024). Investigating the Key Aspects of a Smart City through Topic Modeling and Thematic Analysis. Future Internet, 16(1), 3. https://doi.org/10.3390/fi16010003