Abstract
Distribution grids are complex networks containing multiple pieces of equipment. These components are interconnected, and each of them is described by various attributes. A knowledge graph is an interesting data format that represents pieces of information as nodes and relations between the pieces as edges. In this paper, we describe the proposed vocabulary used to build a distribution system knowledge graph. We identify the concepts used in such graphs and a set of relations to represent links between concepts. Both provide a semantically rich representation of a system. Additionally, we offer a few illustrative examples of how a distributed system knowledge graph can be utilized to gain more insight into the operations of the grid. We show a simplified analysis of how outages can influence customers based on their locations and how adding DERs can influence/change it. These demonstrative use cases show that the graph-based representation of a distribution grid allows for integrating information of different types and how such a repository can be efficiently utilized. Based on the experiments with distribution system knowledge graphs presented in this article, we postulate that graph-based representation enables a novel way of storing information about power grids and facilitates interactive methods for their visualization and analysis.
1. Introduction
Power distribution systems are made up of components for control, protection, transformation, and regulation, which govern the delivery of power to customers. The complexity of such systems is due to the multiplicity of interconnected elements. Although many actions of these elements are automated, they are geographically spread and are not easily accessible. Therefore, they cannot be fully monitored and controlled. Many of the components are considered “small” and of low value compared to the elements of a transmission system. This makes the task of overseeing, analyzing, and maintaining them even more tedious. The growing interest in smart grids and distributed energy resources further complicates the processes of controlling and managing the distribution grid.
Conventionally, electric power utilities keep the information about their assets, including grids, in relational databases spread across multiple organizational units. For example, we consider a request to access data related to certain components, their types and parameters, details of their physical location and connections, and information about linked customers and their sites. To satisfy such a request, a series of actions must be performed. They are related to accessing several databases and performing multiple operations on data structures that contain information on components of interest.
Recent developments in graph-based databases create an opportunity to store data in a different format. They allow for representing information as a network of nodes and relationships between them. The main benefits of graph databases include:
- Ease of integrating different types of data (numerical and symbolic) of different origin;
- Ability to absorb new, continuously incoming data;
- Efficiency in accessing a variety of data and performing queries, resolving multiple relations between individual elements of the database;
- Simplicity in developing and executing algorithms—working on graphs—to generate new information that is not available or very difficult to access when data are spread across multiple databases.
This paper shows how the information about the power grid’s components can be stored as a knowledge graph (KG) in a graph database [1]. We describe the vocabulary for denoting the system’s components and the relations between them needed for constructing a graph. The vocabulary addresses two facets: integrating information of different natures (topology versus maintenance, outage data) and extracting, in a simple way (compared to relational databases), information about various aspects of the grid. Subsequently, we introduce GridKG, a graph representing a fragment of a distribution grid. Several examples showing how such a graph can be used to analyze the grid are included, focusing on the effects of outages. The main contributions of this paper are as follows:
- Construction of a vocabulary—concepts and relations—for building KGs representing power distribution systems (Section 4);
- Development of queries illustrating a process of utilizing the developed graph: finding electrical paths (Section 5.1) and switching elements (Section 5.2), and occurrence of system events (Section 5.3);
- An approach for evaluating the effect of outages on customers at various geographical locations based on Monte Carlo simulations (Section 6).
2. Related Work
A major challenge associated with the operation and maintenance of power grids is keeping track of its components, as it requires the collection, management and analysis of data in hundreds of thousands of power devices [2]. Given the network nature of the grid, it can be expected that the use of KGs would enhance the efficiency of knowledge retrieval and greatly improve the quality and accuracy of the search results. However, to date, there have been only a few studies that describe domain-specific applications of KGs in power grids. Selected articles published in this area are summarized bellow.
The use of KGs improved workflow performance, improved data accessibility, and became an essential step towards intelligent engineering and production at Siemens [3]. It helped overcome traditional database challenges, provided an integrated view of data, and improved search functionality and data control.
KGs have been pivotal in advancing power system management, analysis, and smart grid development. The application of KGs in power system management, such as equipment management, Wang et al. [4], and fault diagnosis and disposal, Qiao et al. [5], has been noted for its efficiency in information retrieval, updating, and decision making. For instance, an enterprise-level KG enhanced the management of power equipment assets, studied by Tang et al. [6], while a designed architecture was applied to analyze the energization of the IEEE 118-bus system [7]. All of this demonstrated the effectiveness of graph databases over relational ones. Furthermore, recent studies, like Su et al. [8], have focused on automatic ontology extraction to build power terminal KGs, facilitating data exchange across various sources. In similar efforts, Devanand et al. [9] used ontologies to develop a knowledge management system that can model interactions across multiple domains, which proved beneficial in the building of decision support tools. Huang et al. [2] developed an AI-enhanced labeling method for creating KGs to group power grid equipment with similar characteristics. Perçuku et al. [10] demonstrated the adaptability of KGs to business needs, enhancing database response time and expansion process. The expansion of smart grids, coupled with the deployment of advanced metering infrastructure and sensors, has led to the generation of large amounts of heterogeneous data. Zhiqiang et al. [11] noted that KGs help incorporate additional information and connectivity across devices in smart grids. Addressing the issue of information islands, Huang et al. [12] used KGs for grid equipment considering the multifaceted nature of the equipment and inter-equipment relationships. Yang et al. [13] proposed a multisource information fusion method to efficiently use data from power equipment. Similarly, Cui [14] used KGs to integrate power grid and environmental information for anomaly detection, and Fan et al. [15] developed a dispatch KG for the power grid using NLP and machine learning techniques.
Zhang et al. [16] and Liu et al. [17] also demonstrated innovative KG applications in nuclear power plant fault analysis. Zhao et al. [18] and Yi and Jiang [19] applied graph-based learning for fault detection in photovoltaic arrays and wind farms, while Lv et al. [20] and Liu and Wang [21] developed KGs for specific fault location and transformer maintenance, respectively. Liu et al. [22] extended the application of KG by creating an electrical equipment fault KG based on operational and maintenance records.
This contribution introduces an ontology for concepts and relations required to represent a grid topology, its electrical elements, and information describing them. The ontology is then used to construct a KG of a real-world distribution grid. We also show that such a graph can be used to understand the interconnections of the grid and to analyze their changes.
3. Knowledge Graphs
Knowledge graphs are data management systems that combine different types of data and use graphs as representations of information [6]. Many KGs have been created using text-based extraction of content from the web, including Microsoft’s Probase [23], Google Vault [24], and DBpedia [25]. Generic KGs have been proven to be useful in applications such as semantic search and data fusion.
One way to represnt KGs is using a resource description framework (RDF). This data format [26] was introduced by the Semantic Web as a standard for linked open data. It is a popular graph-based data format in which each piece of data is stored as an RDF triple that contains two entities (two nodes in a graph), called subject and object, and a relation between them (an edge in a graph), called property. RDF-based KGs have received much attention and multiple studies have been published on their different aspects, ranging from their construction [27], through storage [28], query strategies [29] and information extraction [30] to applications [31]. The fact that subjects of triples could also be objects of other triples and vice versa means that we deal with a network of highly interconnected entities.
A single RDF-triple <subject–property–object> can be considered a feature of an entity identified by the subject. In other words, each single triple is treated as a feature of its subject. Multiple triples with the same subject constitute a description of the given entity. A set of a few RDF triples with Element as their subject is presented in Figure 1. Each triple provides a description of Element: its type—primary transformer, its connected voltage—14 kV, its service area location—XYZ, the feeder to which it is attached—123, and the connected phase—A.
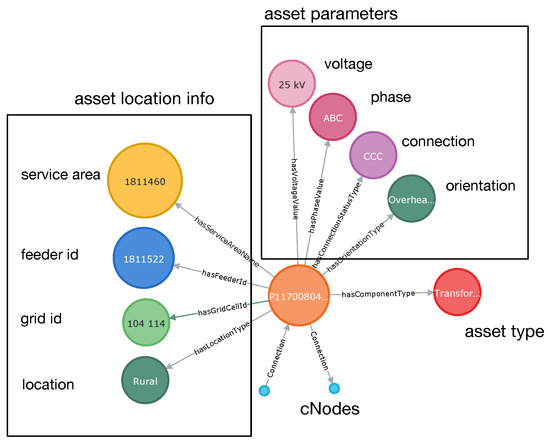
Figure 1.
RDF triples with Element-Asset as their subject.
Quite often, the subject and object of one triple can be involved in multiple other triples, i.e., they can be subjects or objects of other triples. In such cases, multiple definitions can share features, or some features can be centers of other entity descriptions. All interconnected triples constitute a network of interleaving definitions of entities.
4. Power Knowledge Graph
In this section, we introduce PowerLOV—a Power Linked Open Vocabulary. It is a set of classes and relations needed for constructing a graph-based representation of power systems.
The process of developing vocabulary is essential in building a KG. Our approach considers what already exists regarding similar vocabularies and what information can be included in the graph. We started with elements of the existing ontology PowerSystems.owl [9]. We carefully analyzed it and, eventually, extended the concepts defined there. This extension was entirely driven by the need to express the information available to us: the system’s topology, information about outages, and the components involved in them. We followed the rules from ontology budling techniques. The utility employees were involved in the process. They were asked for input in the development of the vocabulary (concepts and relations) and their opinions about the constructed distribution grid graph samples.
4.1. Concepts
Some concepts required for the construction of a power system model have already been defined in PowerSystem.owl. We extend this ontology to accommodate concepts needed to represent additional types of information, such as geographical locations, events, and maintenance activities. These concepts allow the building of a representation of the system beyond its basic electrical components.
We introduce two essential concepts—Element-Asset and cNode. Element-Asset is equivalent to the category ElectricalEquipment from PowerSystem.owl that can represent a wide range of types of assets. In the proposed PowerLOV, the concept Element-Asset has the following attributes:
- id—which is the same as the asset identifier assigned by a utility;
- x, y—for the asset location using the utility’s proprietary system of coordinates;
- longitude and latitude—representing the geographical location of the asset.
The concept cNode is a fictitious connection point that allows the connection of assets. A single Element-Asset is connected to two cNodes, each connecting two adjacent Element-Assets.
Element-Asset, as a node in the graph, is connected via cNodes to other Elment-Assets. Additionally, each asset node is connect to other nodes defined in PowerLOV for the purpose of providing descriptive information about the asset. We define three groups of nodes that can be used to describe Element-Asset.
The first group consists of nodes that identity the type of asset, its specification, and information about maintenance activities performed on the asset. The group contains:
- Components—class that contains a number of subclasses called ComponentType that identify the asset type using the following subclasses: Switch, VoltageRegulator, EnergyMeter, ElectricalLine, PowerGenerator, CapacitorBank, SwitchGear, Sectionalizer, Elbow, Recloser, Fuse, SubstationBus, FaultIndicator, IsolationPoint, Breaker, SubstationTransformer;
- ConnectionStatus—with subclasses ConnectionStatusTypes that indicate the operational status of an asset: Connected or Opened;
- Phases—class of PhaseValue which stands for the phase(s) to which an asset is connected;
- Orientations—with two subclasses of type OrientationType that indicate whether an asset is undegroundCable or overheadLine;
- Voltages—with subclasses VoltageValue which specify the rated and connected voltages of an asset;
- Customers—with subclass Customer whose instances represent customers of the modeled system.
The second group of nodes is related to the topology of the system, that is, the geographic location of the assets. Besides the obvious location indicators, such as the service area and the feeder, to which an asset is (indirectly) connected, we introduce a much finer division of service areas, a grid of polygons. The motivation to introduce such a grid of polygons is twofold: (1) to better localize different elements and events at the resolution that is “between” service areas and geographical coordinates; and (2) to introduce the possibility of adding “extra” data—for example, weather data—that enhance the possibilities of analysis of power system behavior under different (weather) conditions even further. The classes of the second group are:
- ServiceAreas—with a number of subclasses ServiceAreaNames representing names of the utility’s service coverage zones;
- Feeders—a superclass of FeederID that provides identification of the upstream feeder to which an asset is (indirectly) connected;
- GridCell—identification of an individual grid cell in the grid of polygons.
The third group of nodes represents system events in which the asset was involved. Here, we define categories describing details of an event and its cause. We have:
- OutageEvent—provides details regarding an outage, such as time of event, power interruption interval, supplementary cause;
- OutageCauses—with a subclass OutageCauseType which identifies a possible cause of an outage, examples of recognized causes are: Lightning, DefectiveEquipment, ForeignInterference, AdverseWeather, just to name a few.
4.2. Relations
As explained earlier, the nodes of a KG are connected via well-defined and semantically meaningful links—relations. These relations allow for characterizing assets and providing relevant details about them. In the context of PowerLOV, we recognize a number of relations:
- Connection—links Element-Asset to cNode;
- hasComponentType—links Element-Asset to ComponentType;
- hasConnectionStatusType—links Element-Asset to ConnectionStatusType;
- hasCustomer—links Element-Asset to Cusomer;
- hasFeederId—links Element-Asset to FeederId;
- hasGridCellId—links Element-Asset to GridCellId;
- hasLocationType—links Element-Asset to LocationType;
- hasOrientationType—links Element-Asset to OrientationType;
- hasOutageEvent—links Element-Asset to OutageEvent;
- hasOutageCauseType—links OutageEvent to OutageCauseType;
- hasPhaseValue—links Element-Asset to PhaseValue;
- hasServiceAreaName—links Element-Asset to ServiceAreaName;
- hasVoltageValue—links Element-Asset to VoltageValue.
4.3. Example of Element-Asset
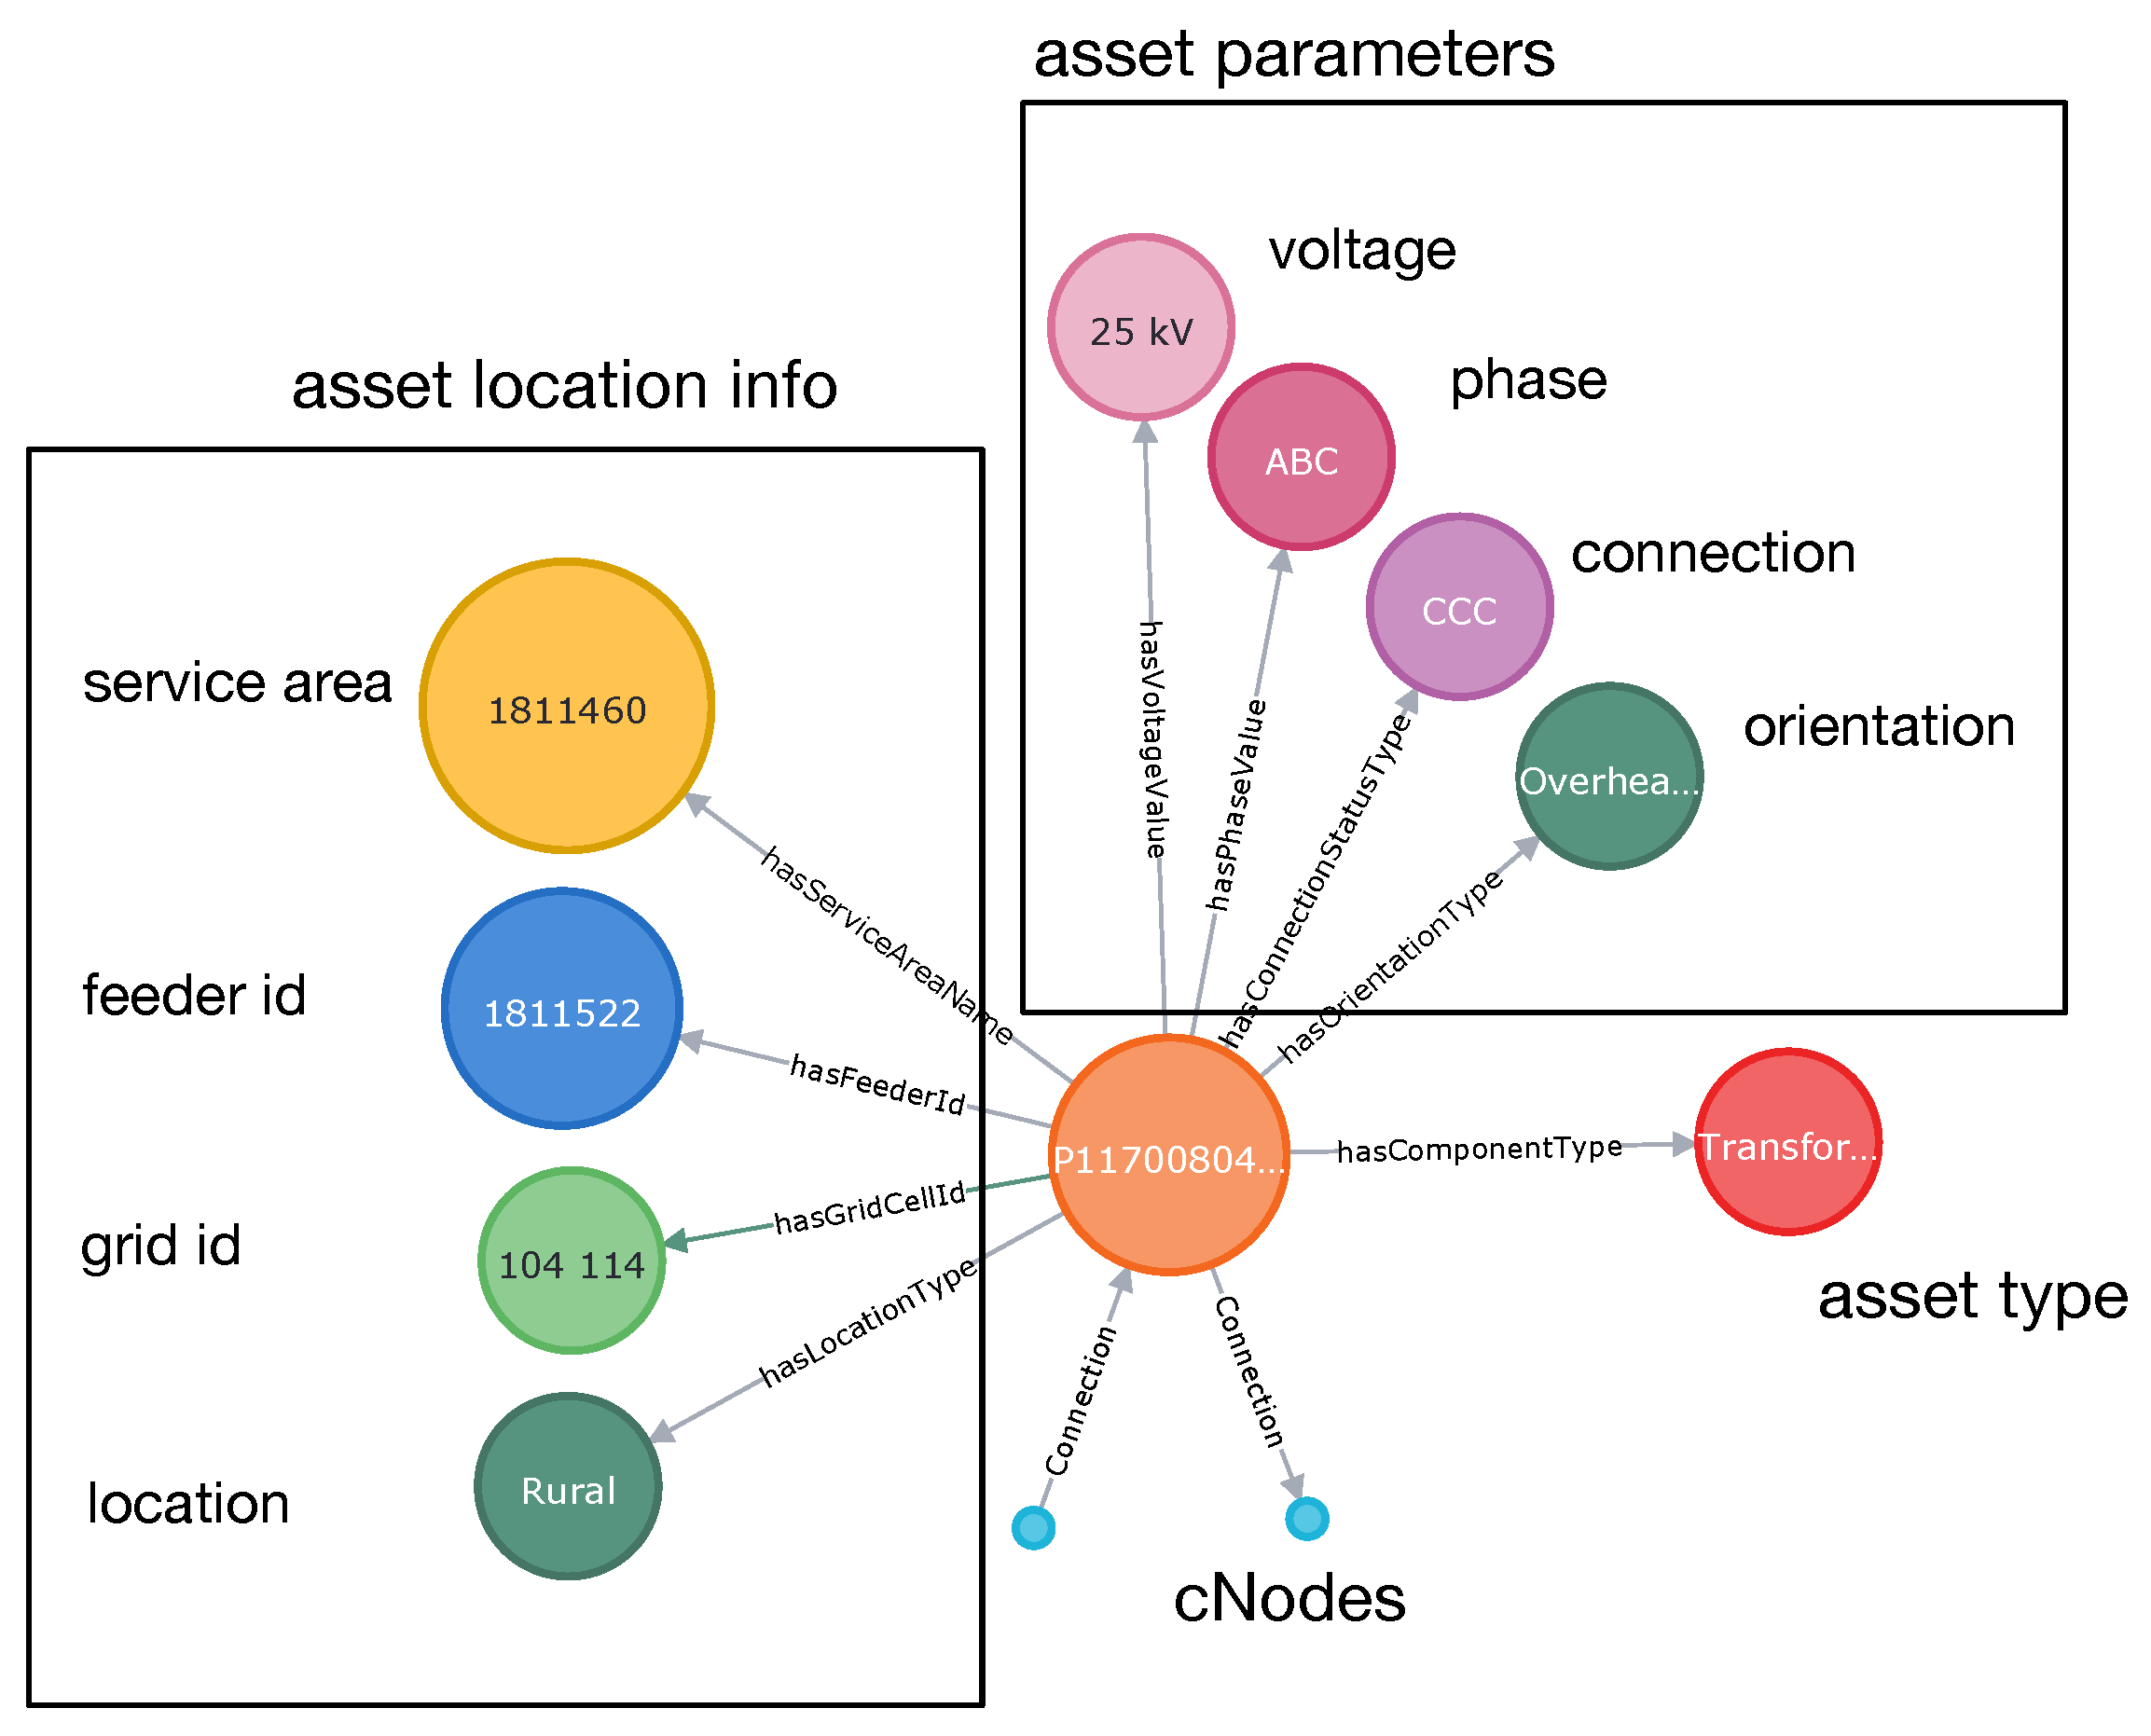
A single Element-Asset is a basic building block of a graph representing a power system. A simple example is shown in Figure 1, which includes several descriptive nodes. The graph represents a transformer in service area 1811460, corresponding to the polygon grid cell 104–114, connected to the feeder 1811522, in Rural location. Its voltage is 25 kV, it is connected to all phases (CCC) ABC, and its orientation is Overhead. Each Element-Asset that is an electrical component is linked to CNodes through Connection relations. Such an arrangement links all components together “electrically”.
5. GridKG—Graph-Based Representation of Distribution Grid
The previously defined vocabulary PowerLOV is used to construct a KG of a power distribution grid. The graph is a model of a full-sized power distribution system built based on partial information obtained from the utility. Hereafter, the graph is called GridKG. It contains more than 2 million nodes and 10 million connections. Neo4j [32] is used to store the graph.
GridKG combines several types of information of a very different nature: details of electrical equipment, system topology, and system events. All individual pieces of information are semantically interconnected. Connections between the nodes of GridKG provide the ability to process and analyze the modeled grid in several different ways.
5.1. Electrical Paths
One of the most interesting examples of processing the data included in GridKG and enhancing them at the same time is the identification of electrical paths in a system. This allows determination of upstream and downstream elements and, as a consequence, analysis of the graph from additional perspectives.
In the graph-based representation of a grid, an electrical path is considered to be a sequence of tuples
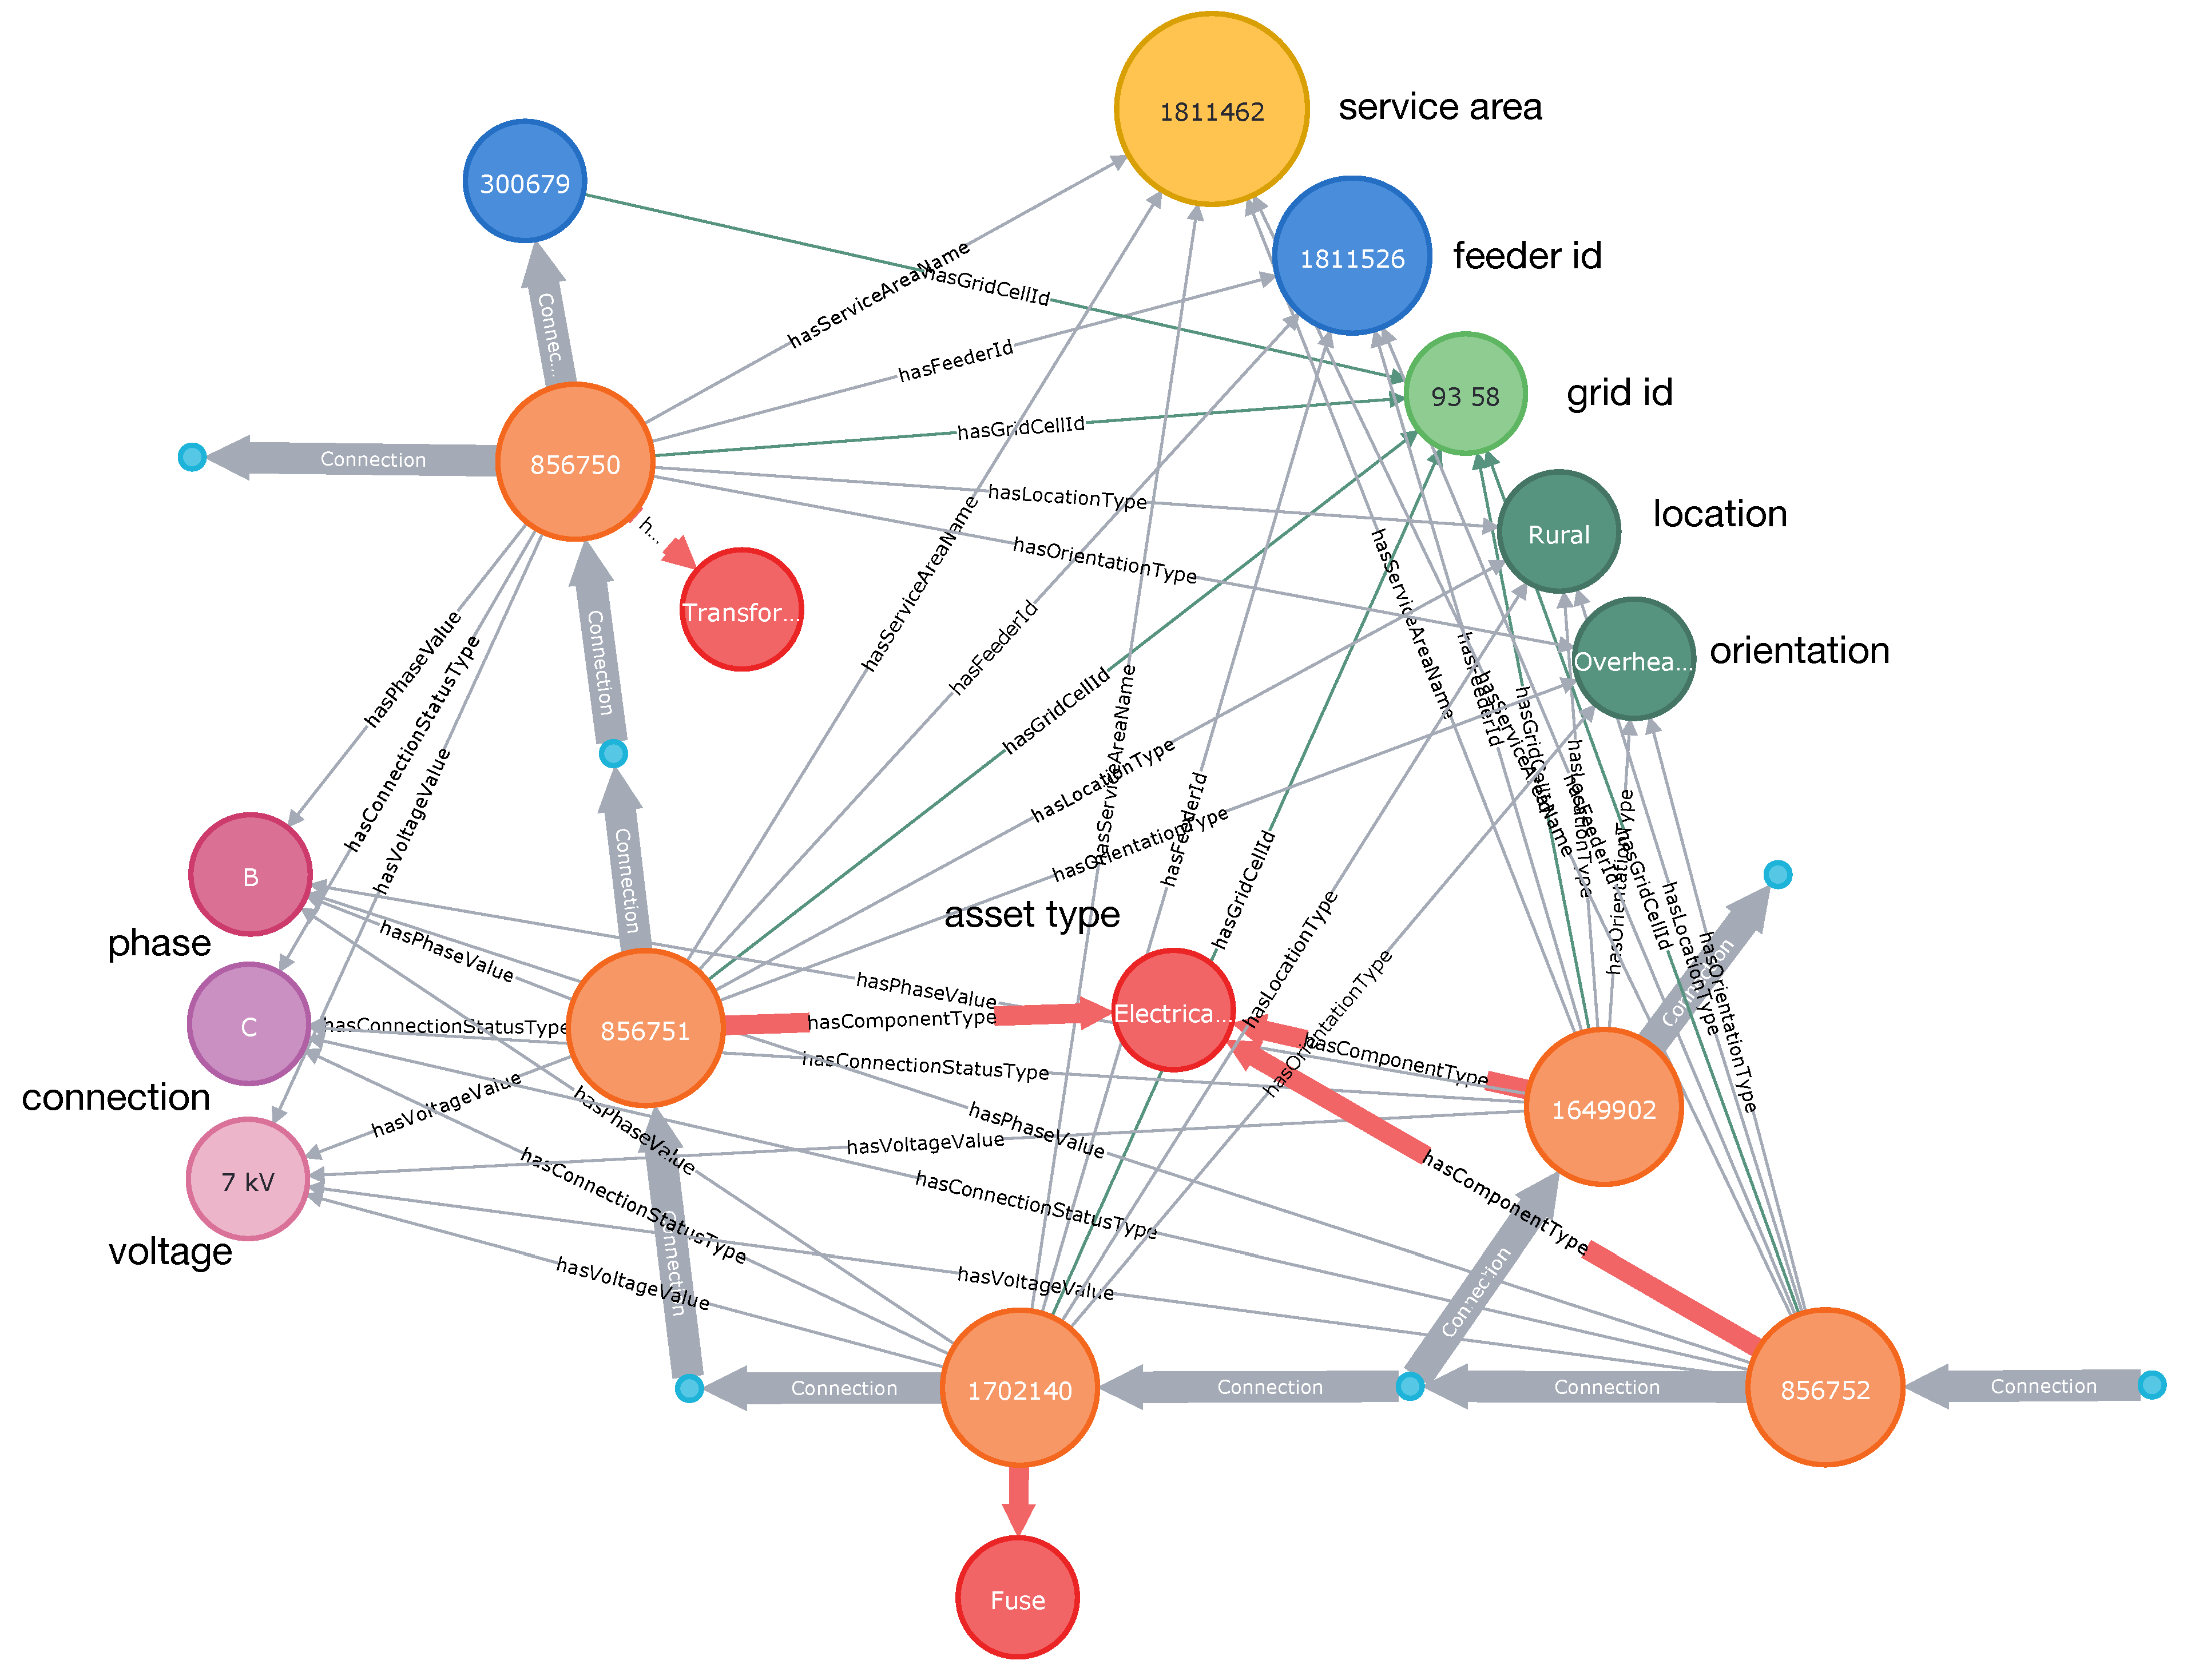
where c represents Connection relation. This tuple is composed of two triples connected via the same Element-Asset, i.e., ⟨cNode→c→Element-Asset⟩ and ⟨Element-Asset→c→cNode⟩. An example of an electrical path is shown in Figure 2 where nodes representing Element-Assets are connected via thick gray links. The proposed process for identifying paths is equivalent to “stitching” together a number of tuples in a way that cNode of the predecessor tuple matches cNode of the successor tuple.
⟨cNodex→c→Element-Assetp→c→cNodey⟩,

Figure 2.
A fragment of the distribution grid with a transformer, three electrical lines and a fuse: electrical connections are shown as thick grey lines.
Algorithm 1 shows the process in the form of a pseudocode. The input to the algorithm is queue Q of triples ⟨Element-Asset-c-cNode⟩, where Element-Asset is of type Breaker. Based on the triples from the queue, the breadth-first search algorithm finds a sequence of adjacent Element-Assets. If the encountered Element-Asset is of type Switch, then its ConnectionStatusType must be Connected. If it is Open, it is not considered part of the continuous electrical path.
Next, a special attribute of the Element-Asset class is defined, called level. It is used to keep track of the elements’ positions on the path. For each Element-Asset, the algorithm modifies a direction of connections from an element of a lower value of level to the adjacent element with a higher value of level. The algorithm terminates when the queue is empty.
| Algorithm 1 Multi-Source Path Search |
|
The process of establishing electrical paths allows easy identification of upstream and downstream elements. It can be used, for example, to determine the number of customers that “depend” on a specific element. A single application of the simple algorithm augments each element with additional information that indicates how many customers are located downstream of the element, stored in a new attribute numCustomer.
5.2. Switching Elements
With electrical paths identified, GridKG can be used to learn more about the connections between different Element-Assets. This process is illustrated in two examples presented bellow.
5.2.1. Example A
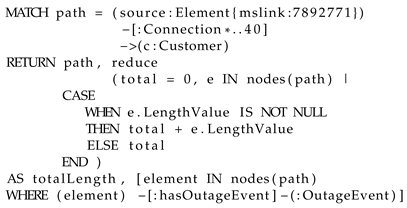
One possible way is to find all downstream (and upstream) elements and connections from a given element of the system. We consider querying GridKG about the downstream paths/components from a specific location. We can also impose conditions regarding the maximum number of components forming the path and the retrieved lengths of these paths together with basic information about certain events (e.g., outages) involving the paths’ segments.
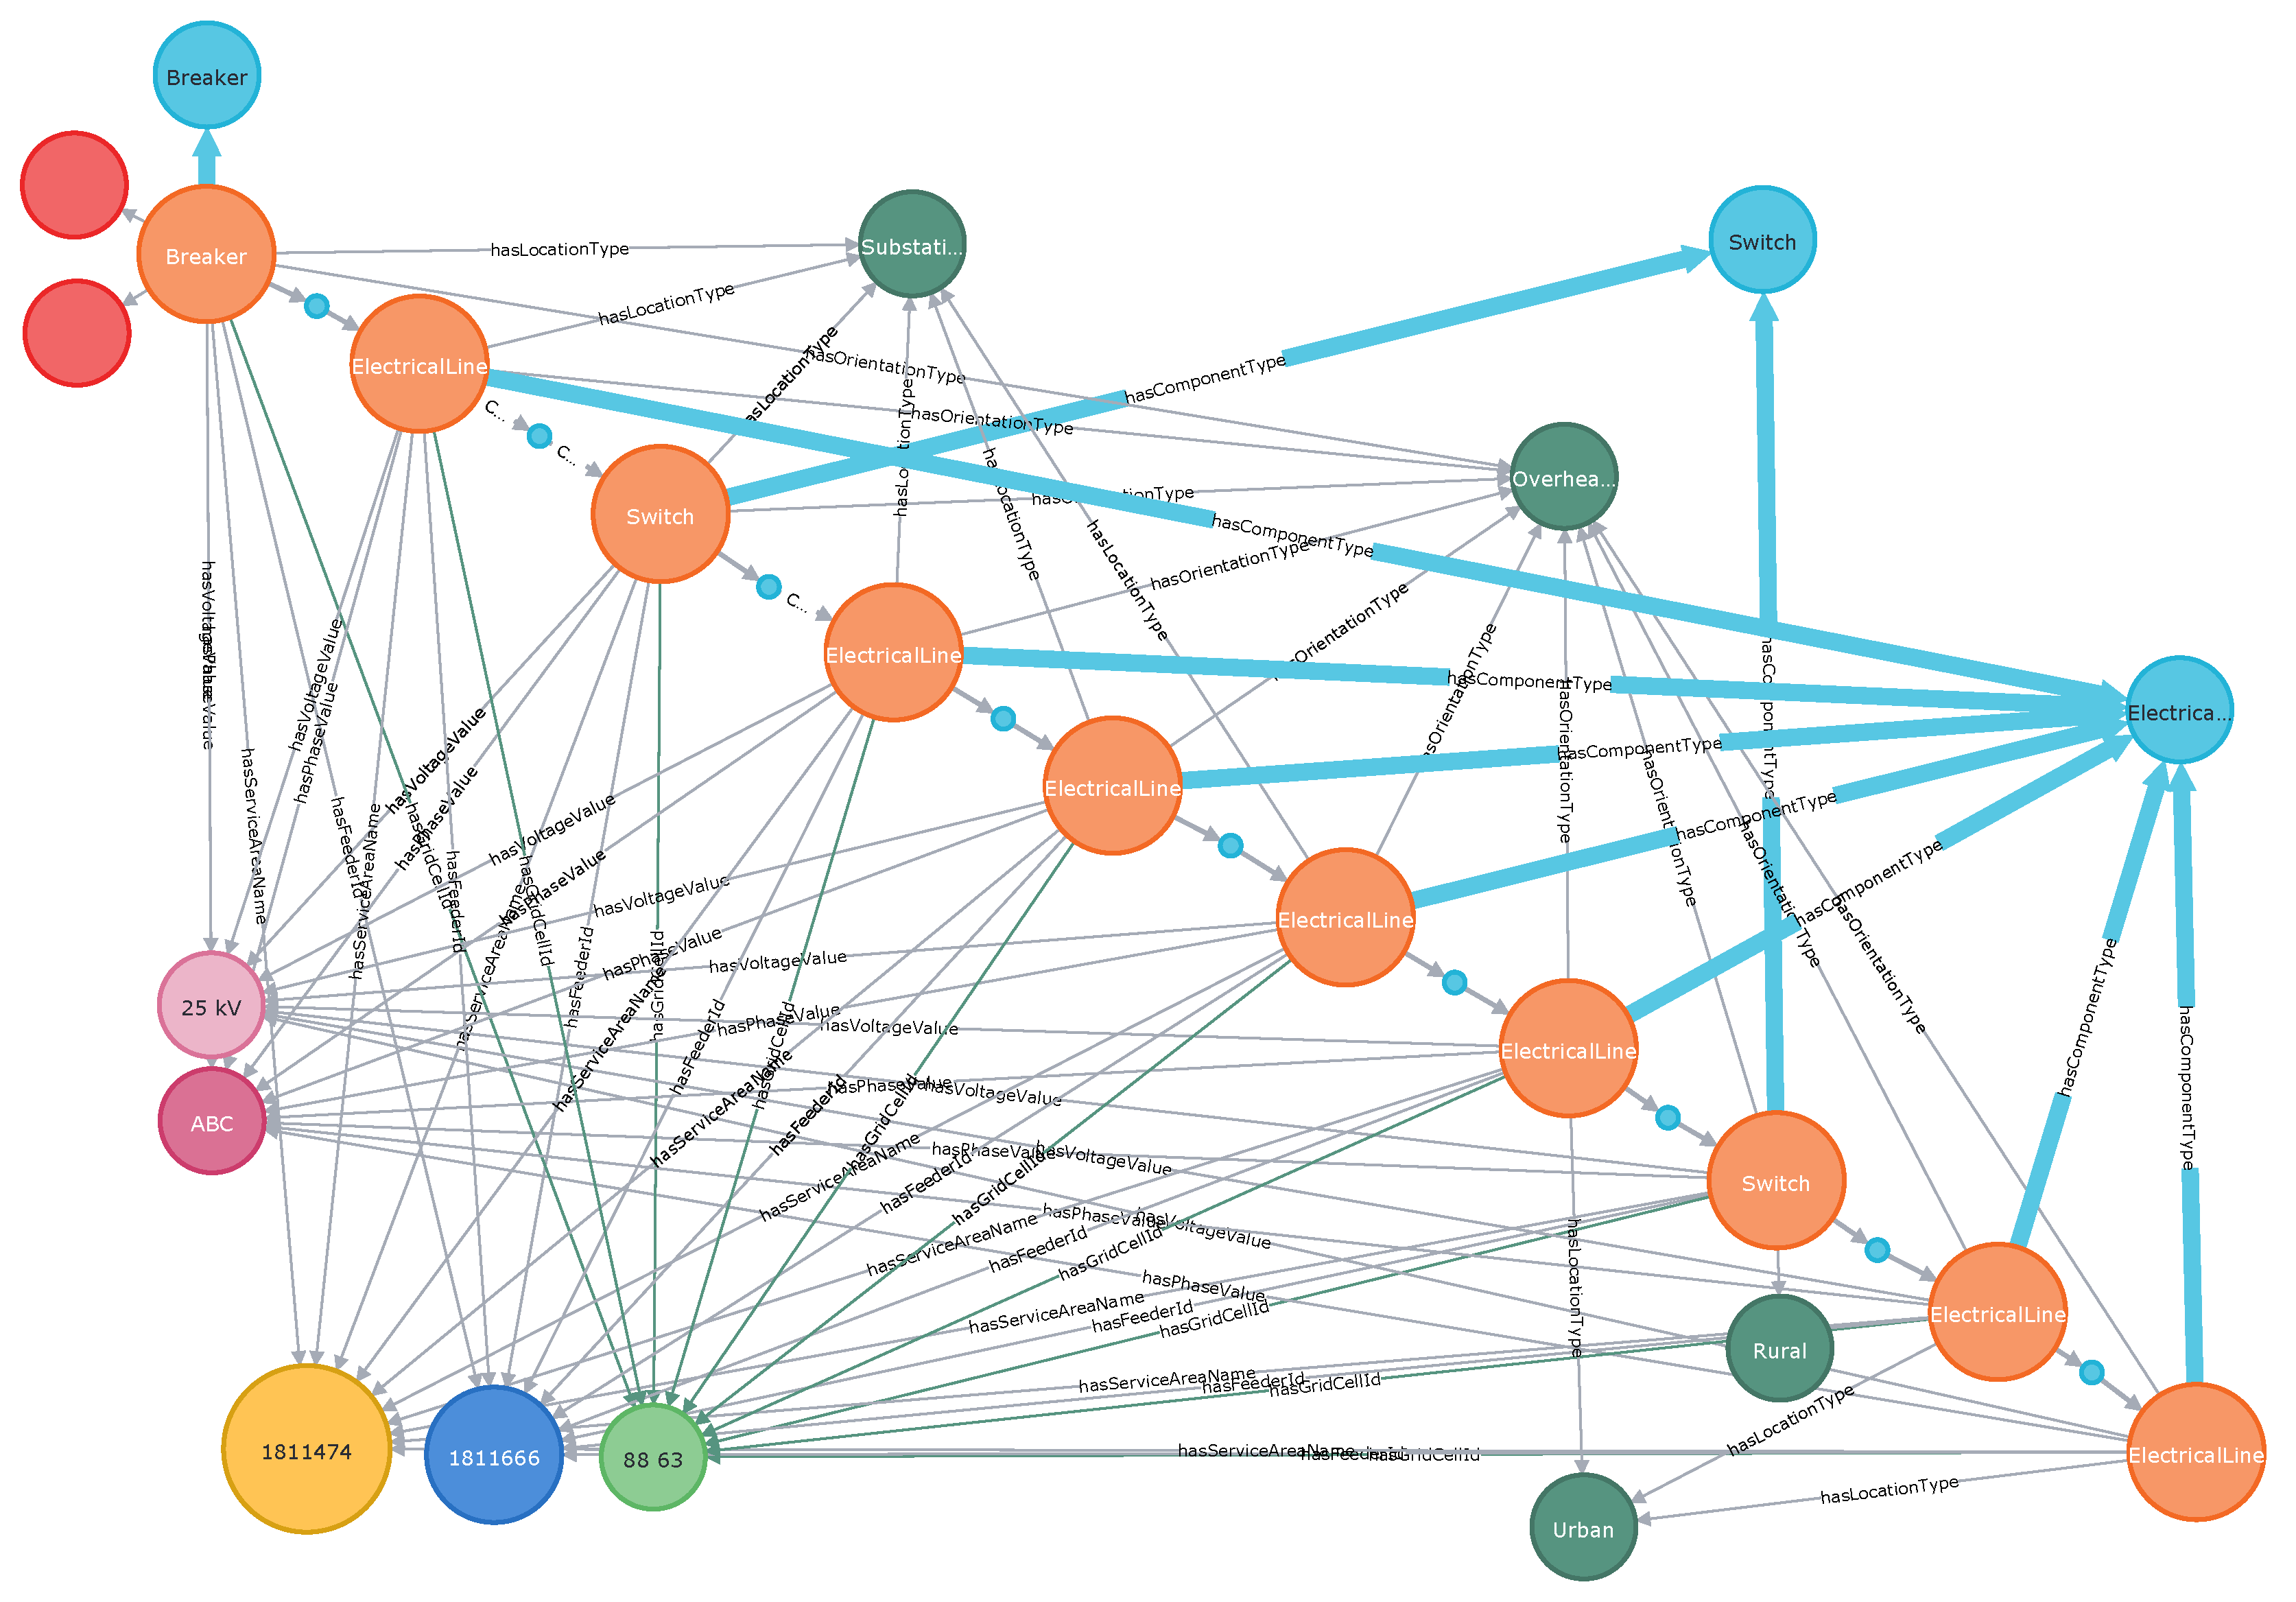
Corresponding Neo4j query, written in the language Cypher, is shown below. It contains a starting element source and a number representing a maximum number of components. As shown in Figure 3, the query returns all the elements connected downstream, including the lengths of electrical paths. There are seven paths of the following lengths: 465.21 m, 445.09 m, 595.25 m, 595.25 m, 1272.90 m, 1325.93 m and 1599.44 m. It also provides a list of Element-Assets on the path associated with power outages. The graph in Figure 3 includes information about the types of elements, their connected voltage values, phases, and related outage events (for clarity, not all details are shown).
5.2.2. Example B
Another example of distribution system analysis is the finding of the number of protective devices in a path upstream from a specific location.
This time, query returns a path of upstream elements from the specified Element-Asset to the breaker, as shown in Figure 4. The path includes two Element-Asset of type Switch, and the query can be used to locate these devices on the path. It also yields more information about the path itself, its components and details about them, as well as the number of customers connected downstream from the specified Element-Asset; in this example, there are 1828 customers (this information is not shown in the graph). This query can also be used to find the number of customers that will be affected by the activation of backup protection in the event that the primary protection fails to act. It is possible to examine the entire grid and determine critical locations that require closer attention to its protection system design.
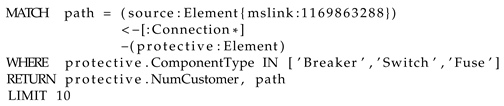
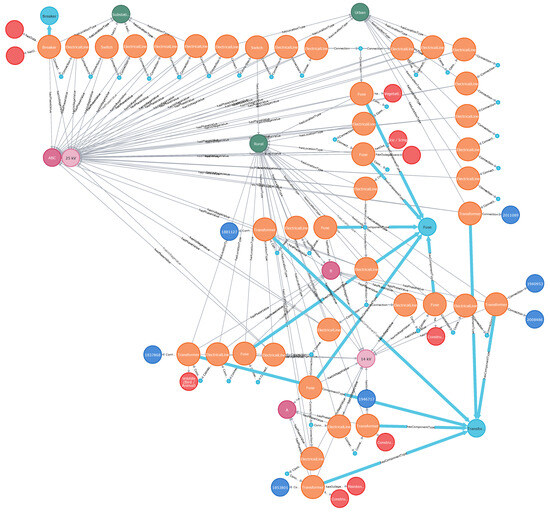
Figure 3.
Elements of downstream paths: each circle represents a different type of electrical component; element types are identified by links to light blue circles; voltages are shown in light pink circles and phases in dark pink circles; outages are depicted by red circles.
Figure 3.
Elements of downstream paths: each circle represents a different type of electrical component; element types are identified by links to light blue circles; voltages are shown in light pink circles and phases in dark pink circles; outages are depicted by red circles.

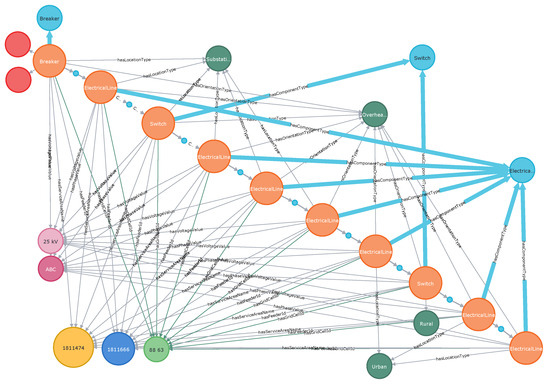
Figure 4.
Primary Switch/protective devices located on the upstream path from the top left element to the primary breaker (bottom right corner).
Figure 4.
Primary Switch/protective devices located on the upstream path from the top left element to the primary breaker (bottom right corner).
5.3. System Events
Integration of different types of information in GridKG enables analysis of system components, in particular their status and maintenance activities, as well as system events occurring at specific locations. This type of analysis is illustrated in the following two examples.
5.3.1. Example C
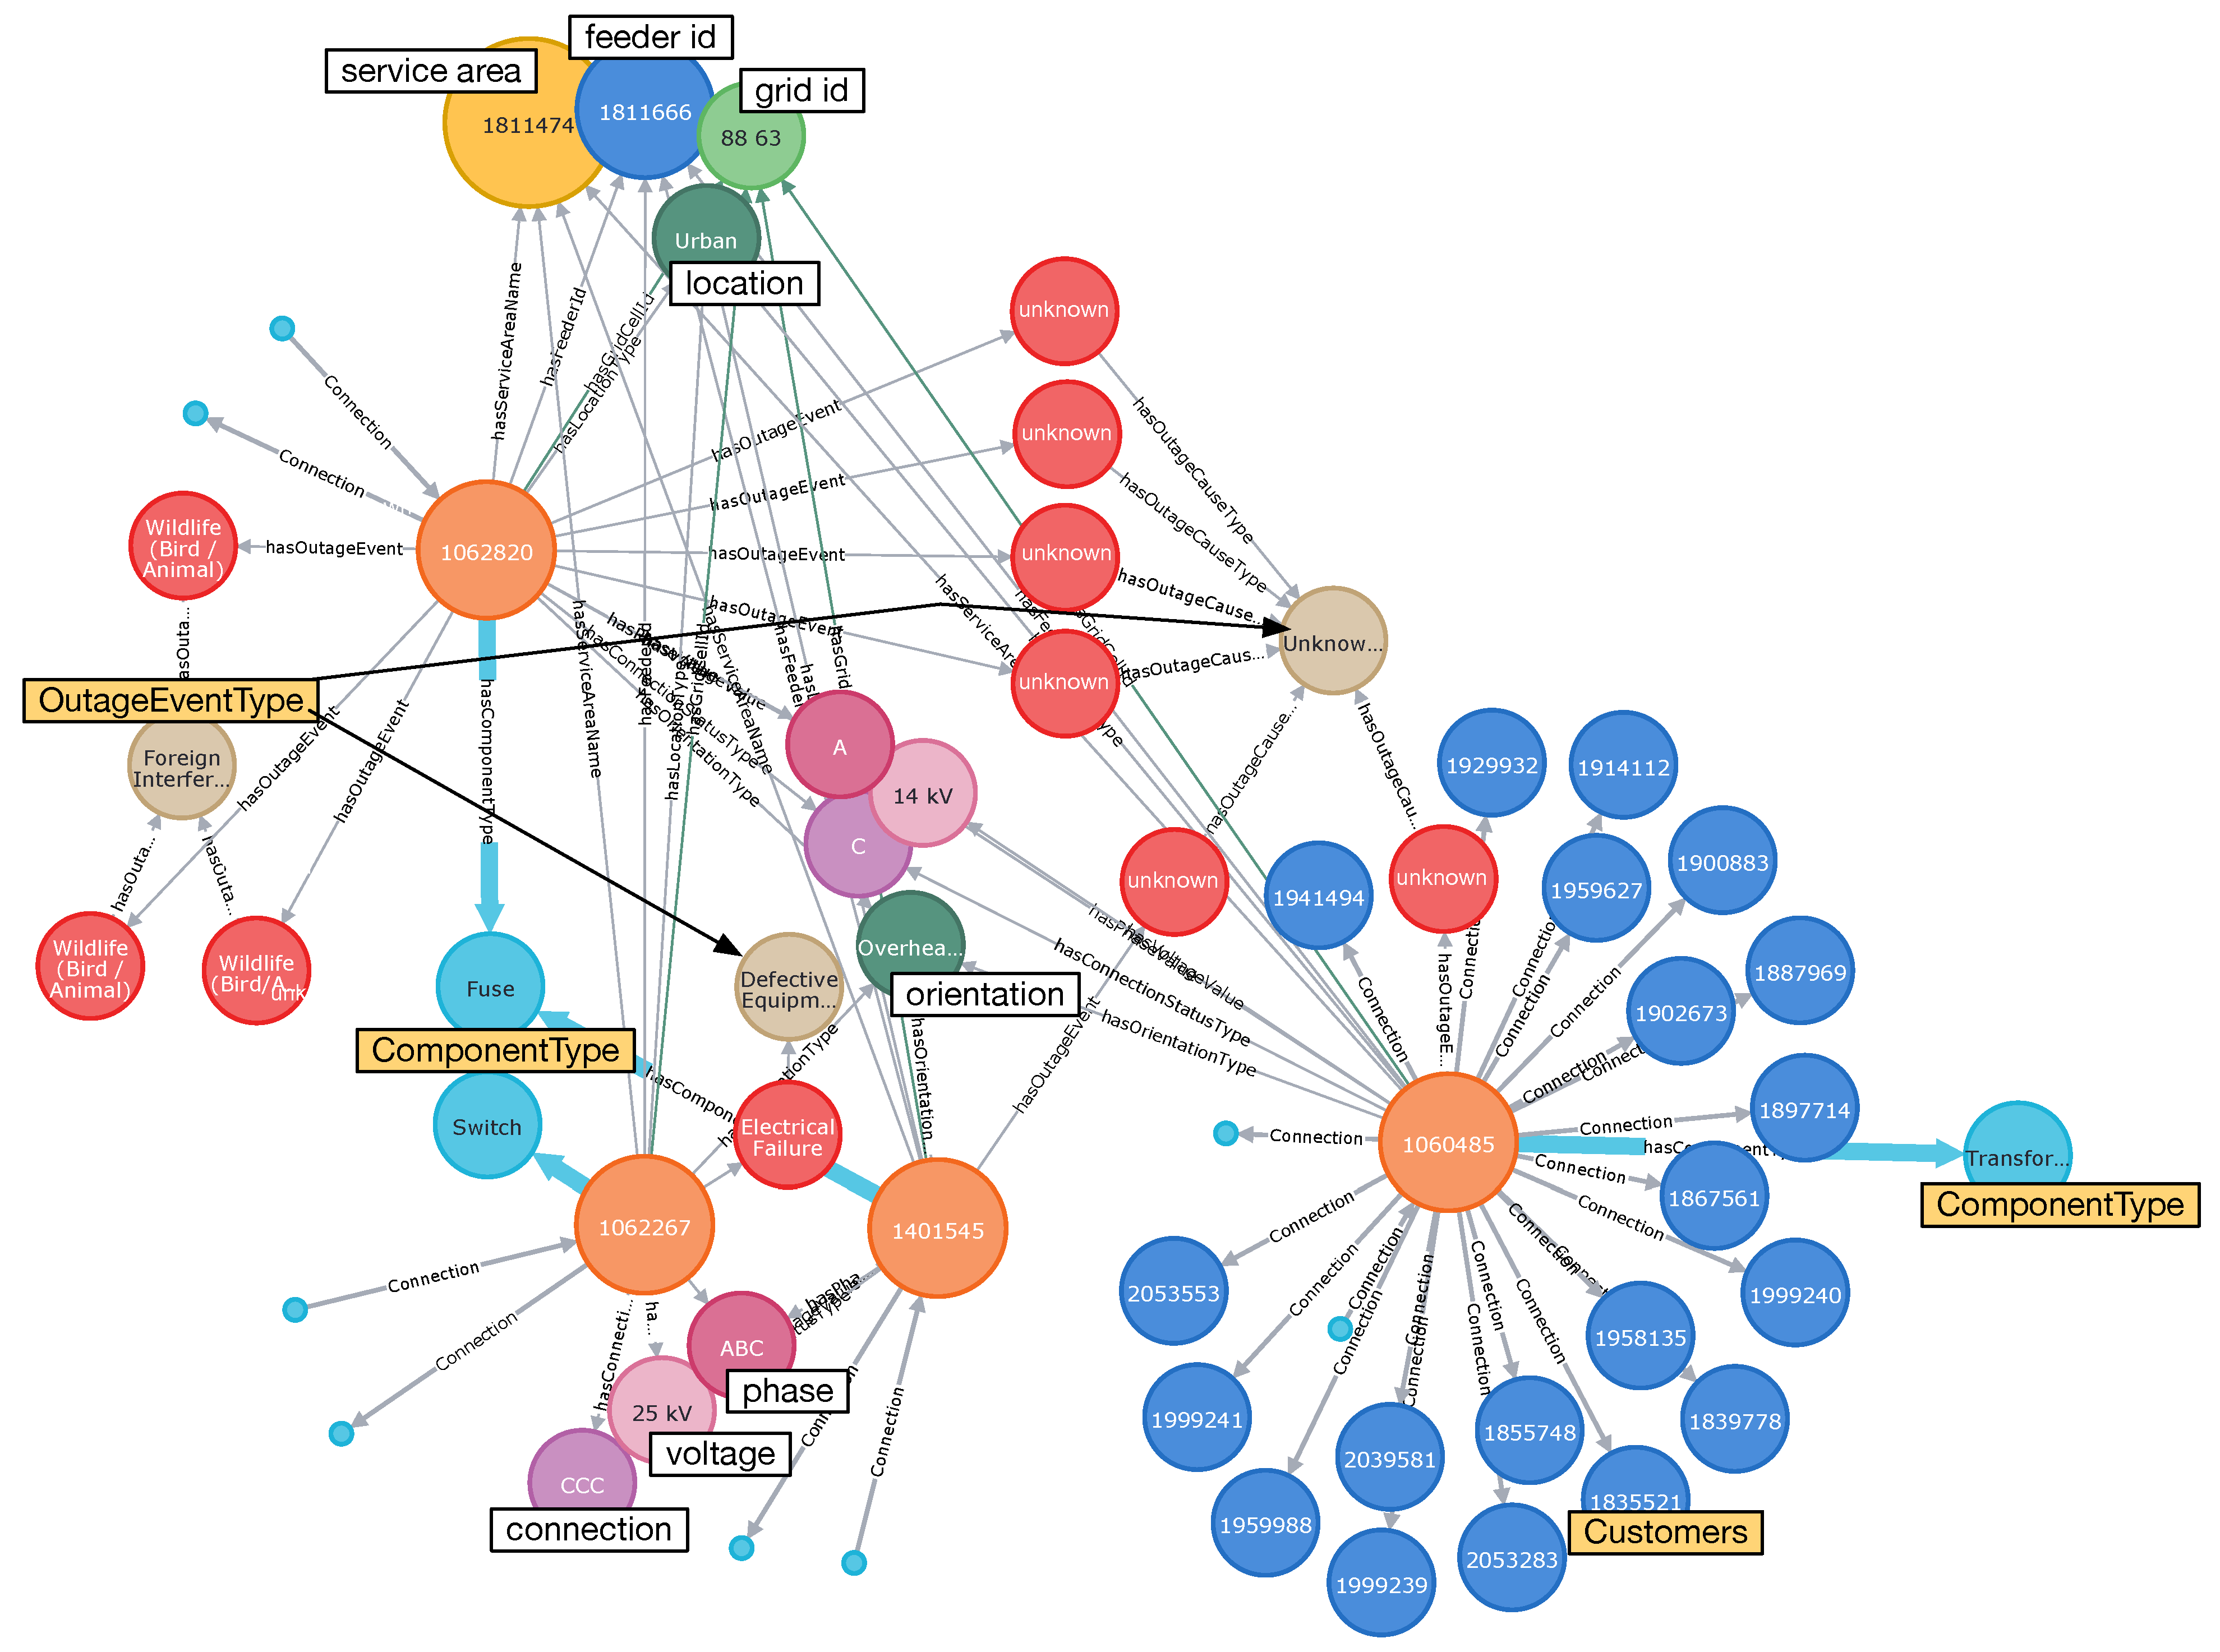
This example shows how GridKG can be used to derive a list of outage events that occurred downstream from a specific Element-Asset. This provides details of the outages, as well as a graph representing a fragment of the system with information about the components. For illustrative purposes, the response is limited to 10 outages. Query produces a list of outages, including details related to their causes and times of incidence, as shown in Table 1. Additional information on the types of involved Element-Assets and their electrical specifications is included in a graphical view of the obtained data in Figure 5. It also provides details related to the customers affected by the outages. The figure shows that one of the elements involved was Fuse, connected to phase A of a 14 kV line that was involved in seven outages. Three outages were caused by wildlife and four were of unknown causes. Other outages were associated with a transformer, a switch, and another fuse. More information about specific outages, involved Elements-Assets, as well as affected customers can be easily obtained and examined through interaction with GridKG.
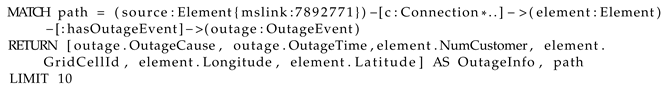

Table 1.
Details of 10 outages (selected information).
Table 1.
Details of 10 outages (selected information).
| Id | Time | Primary Cause | Secondary Cause |
|---|---|---|---|
| 1 | 1997-12-07 14:23 | Unknown | – |
| 2 | 1997-06-24 23:59 | Defective Equip. | Electrical Failure |
| 3 | 1997-06-28 22:04 | Unknown | – |
| 4 | 1998-05-13 06:06 | Unknown | – |
| 5 | 1999-09-10 18:08 | Unknown | – |
| 6 | 2000-08-14 10:53 | Foreign Intrf. | Wildlife (bird/animal) |
| 7 | 1998-07-27 18:38 | Foreign Intrf. | Wildlife (bird/animal) |
| 8 | 1998-08-09 02:25 | Unknown | – |
| 9 | 1996-07-30 08:15 | Foreign Intrf. | Wildlife (bird/animal) |
| 10 | 1997-06-28 21:53 | Unknown | – |

Figure 5.
Details of 10 outage events downstream of a specific Element-Asset.
Figure 5.
Details of 10 outage events downstream of a specific Element-Asset.
5.3.2. Example D
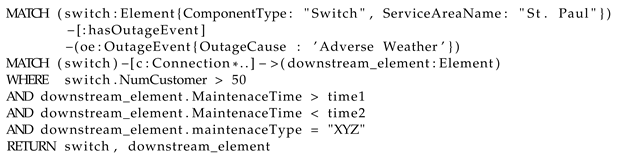
This case is related to outage events that occur in a specific service area and are related to a specific Element-Asset that satisfies particular conditions. For example, we can ask for a list of outages associated with Switches that went through maintenance activities during a specific period of time. An additional condition may narrow the query down to only switches on paths that have at least fifty customers downstream.
The Cypehr query is shown below. It asks for a list of switches that were involved in outages caused by Adverse Weather and subject to maintenance activity XYZ between time1 and time2.
6. Analysis of Outages
Generally, power utilities are interested in analysing of outages due to adverse weather conditions at a specific location. Quite often, the location refers to a per single cell on a predetermined spatial grid. However, a more appropriate way to determine the effect of outages should consider the number of affected customers [33]. This would provide the ability to estimate the effect of adverse weather conditions on the reliability of the power system by calculating the average system interruption frequency index (SAIFI), defined as the average number of interruptions that a customer would experience.
Estimation of the impact of power outages can be performed using GridKG. The graph provides easy access to the topology of the power system it represents. This alone allows consideration of differences in locations between power outages and customers. An extreme weather event that leads to a power outage in one grid cell can affect customers in various grid cells positioned downstream to the power outage or protective equipment locations. Therefore, the information stored in GridKG allows for estimation of the number of affected customers, regardless of their physical location.
6.1. Monte Carlo Simulation
To show how GridKG can be used for a more complex analysis, we present a simple technique for estimating the number of customers affected by outages. This approach uses Monte Carlo simulation to construct the distributions of affected customers.
For a target number of outages N in a given grid cell P, N outage locations are randomly selected. This process is repeated S times. The outage locations are linked to protective devices, such as breakers, switches, and fuses. The number of affected customers is determined based on available data which only allows for a rudimentary, illustrative analysis.
The locations of the outages in the cell are selected based on a probability distribution calculated for each protective device based on its involvement in previous (historical) outages stored in GridKG. If, historically, a specific location and piece of equipment was more prone to experience power outages, it has a higher probability of being selected in the simulation.
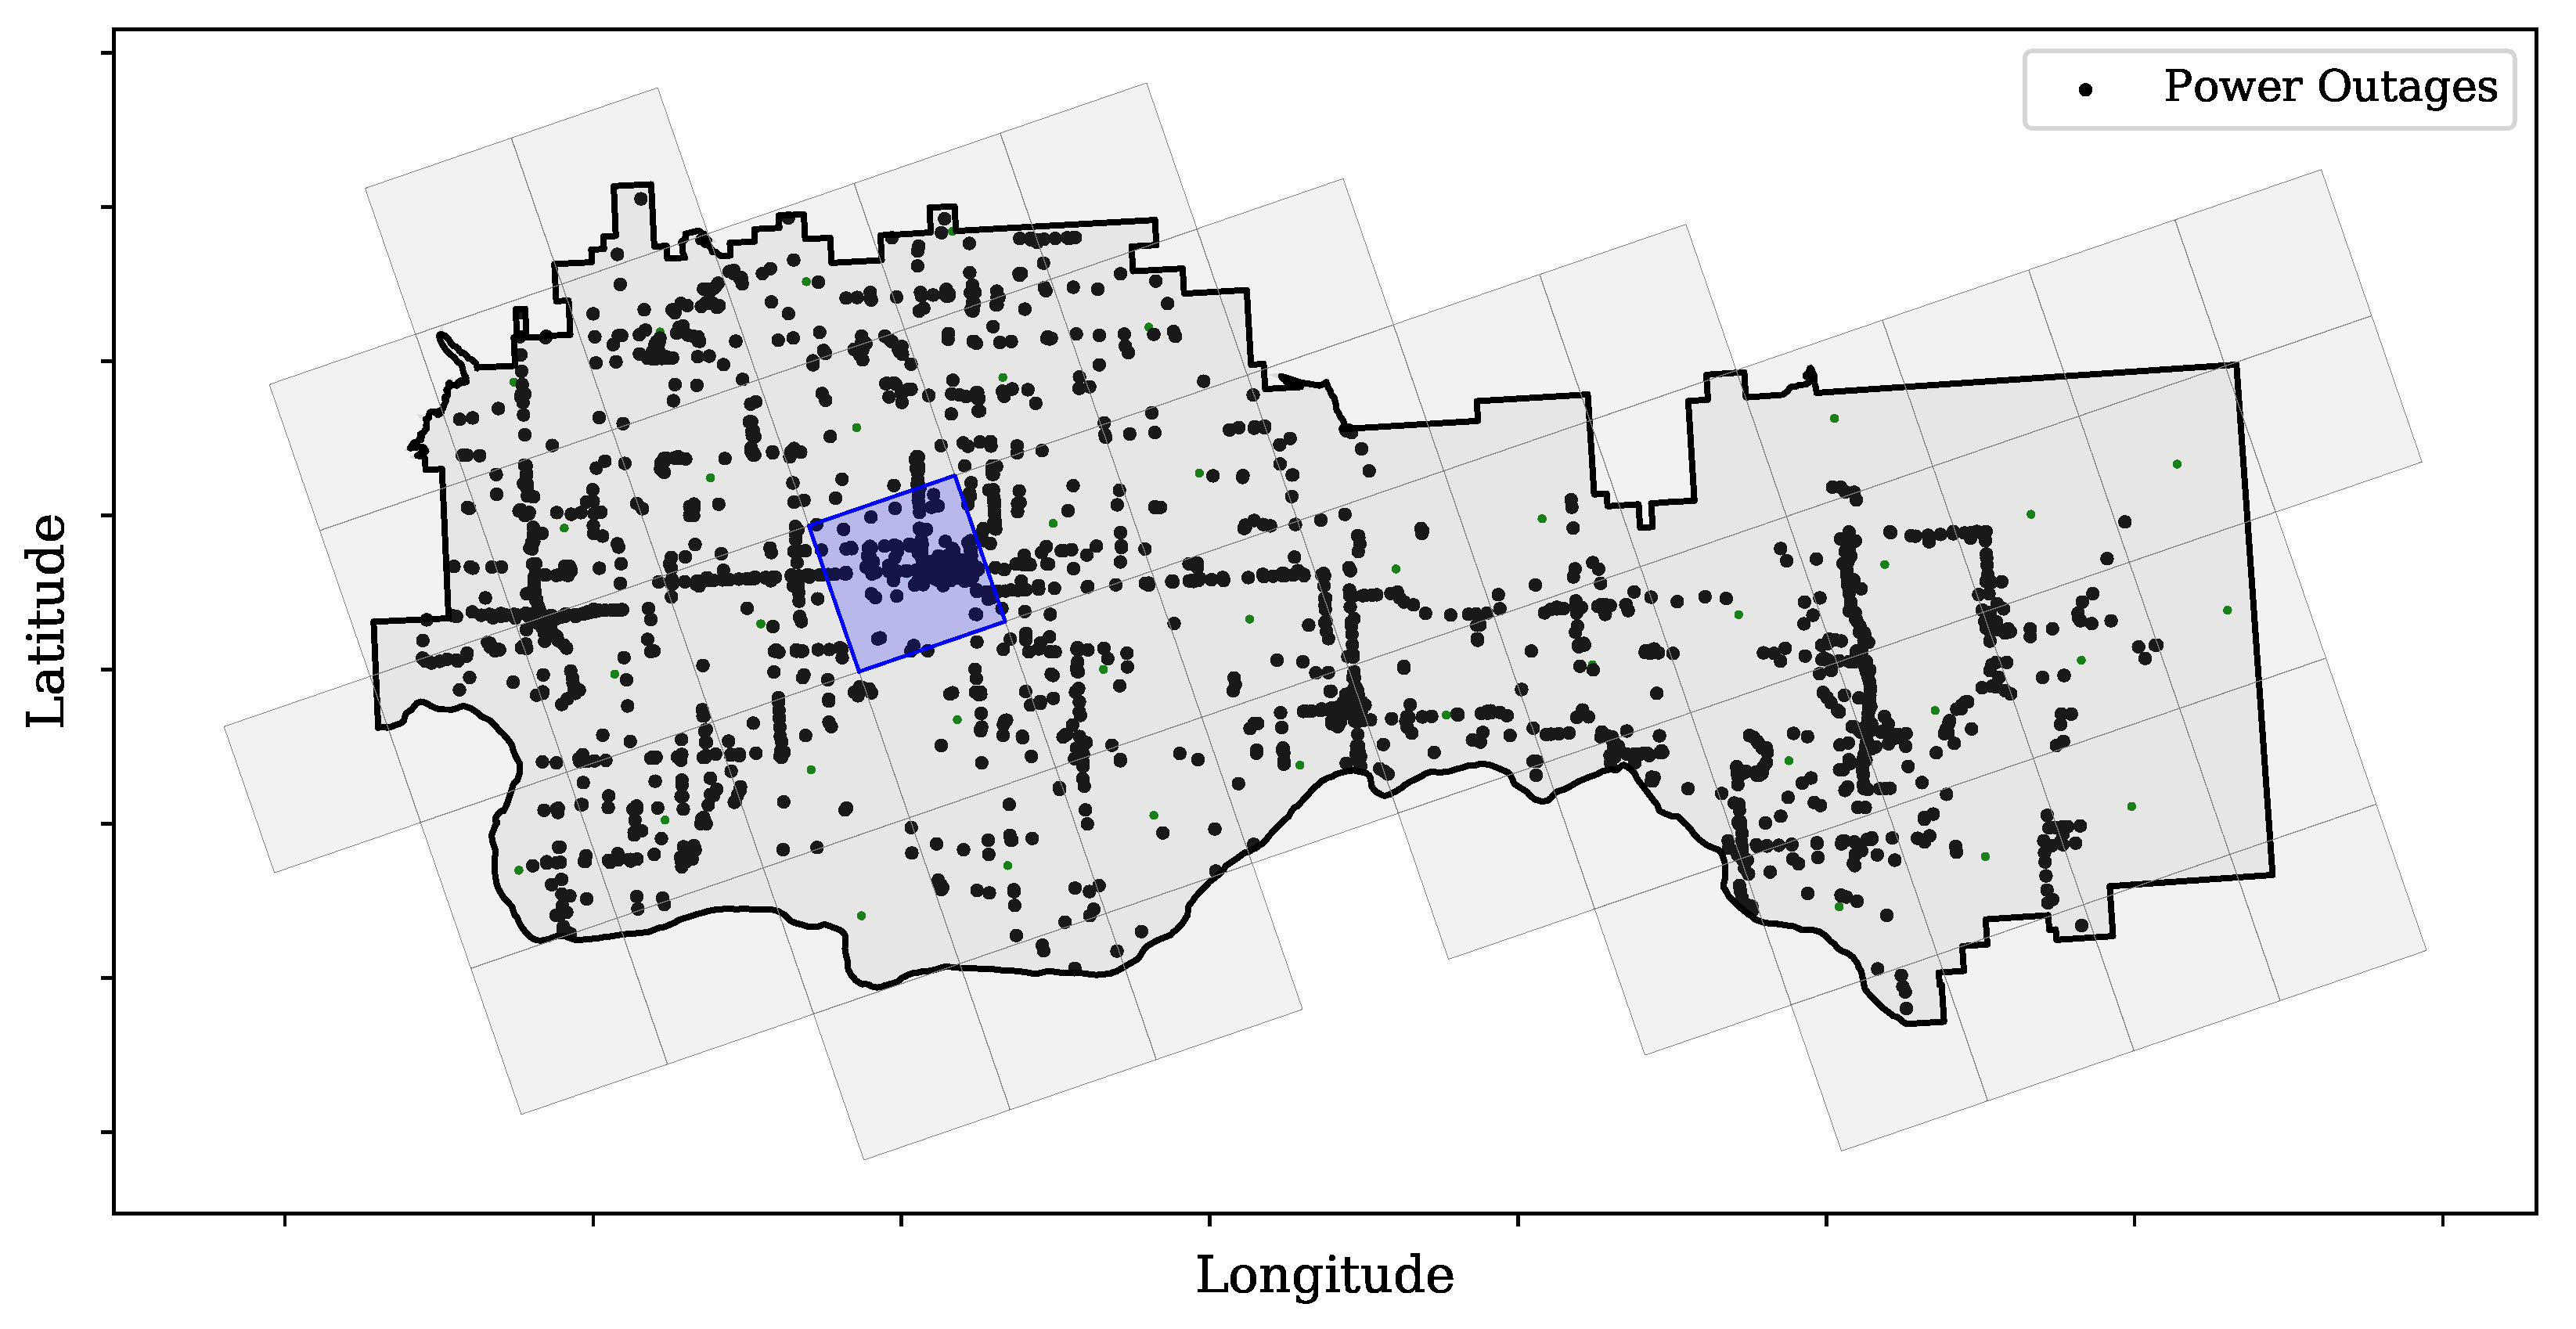
For this example, to show the potential of using GridKG, an arbitrary service area is selected and divided into a grid of 10 × 10 km cells, as shown in Figure 6. The locations of historical power outages are depicted with black dots. The impact of power outage severity is simulated for the blue grid cell.

Figure 6.
Service area grid cell with power outage locations—blue grid cell represents the cell that power outages in the simulation are located.
6.2. Analysis of Results
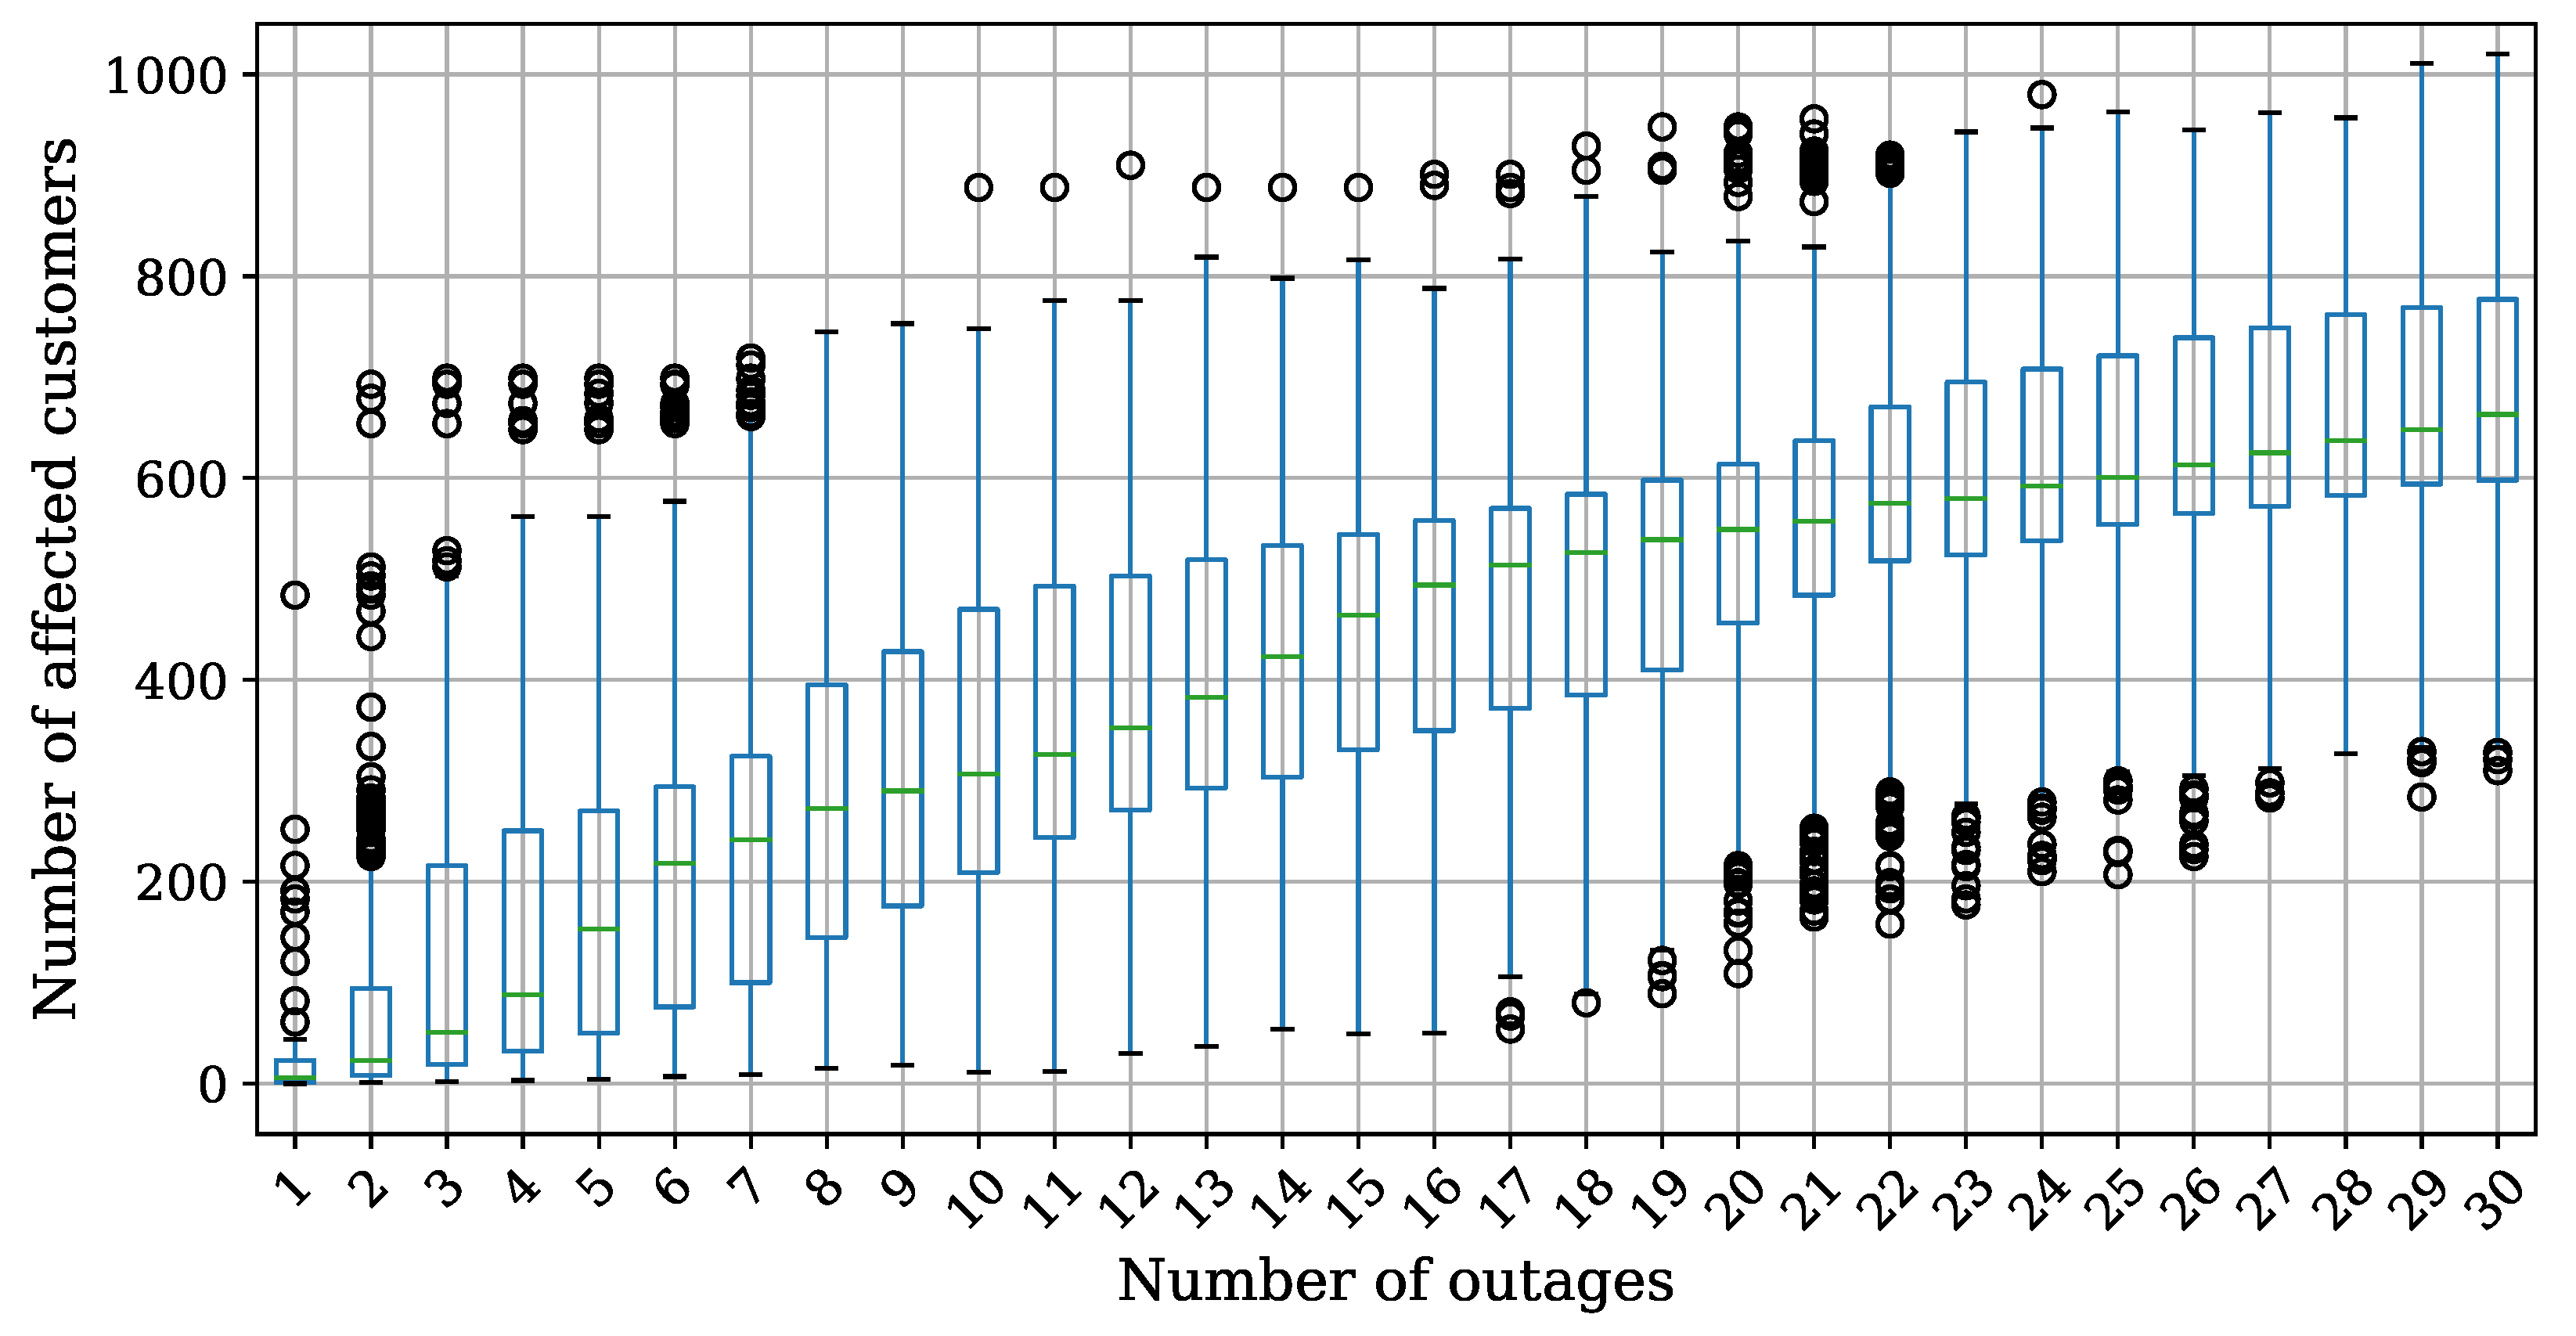
The number of power outages in the affected area (the blue grid cell) varied in a range of , each simulated times. The results are presented in Figure 7 as box plots showing the distribution of the number of affected customers relative to the number of power outages in the area. It can be seen that the slope of the curve connecting the medians of the number of affected customers decreases with the number of power outages. This is due to the high overlap between affected customers.
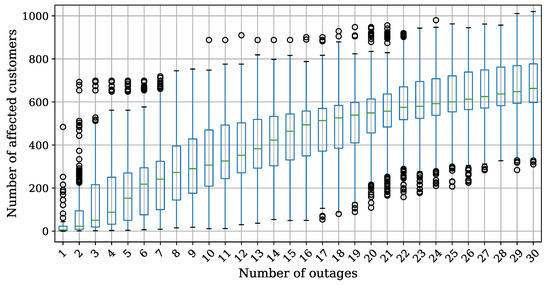
Figure 7.
Number of all affected customers distribution for various number of power outages in the blue grid cell—equipment selection based on historical power outage probability.
It is also interesting to study the distribution of the number of affected customers. Figure 8 shows the distribution for power outages.
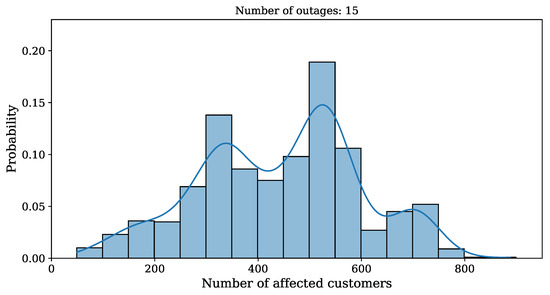
Figure 8.
Number of all affected customers distribution for power outages for equipment selection based on historical power outage probability.
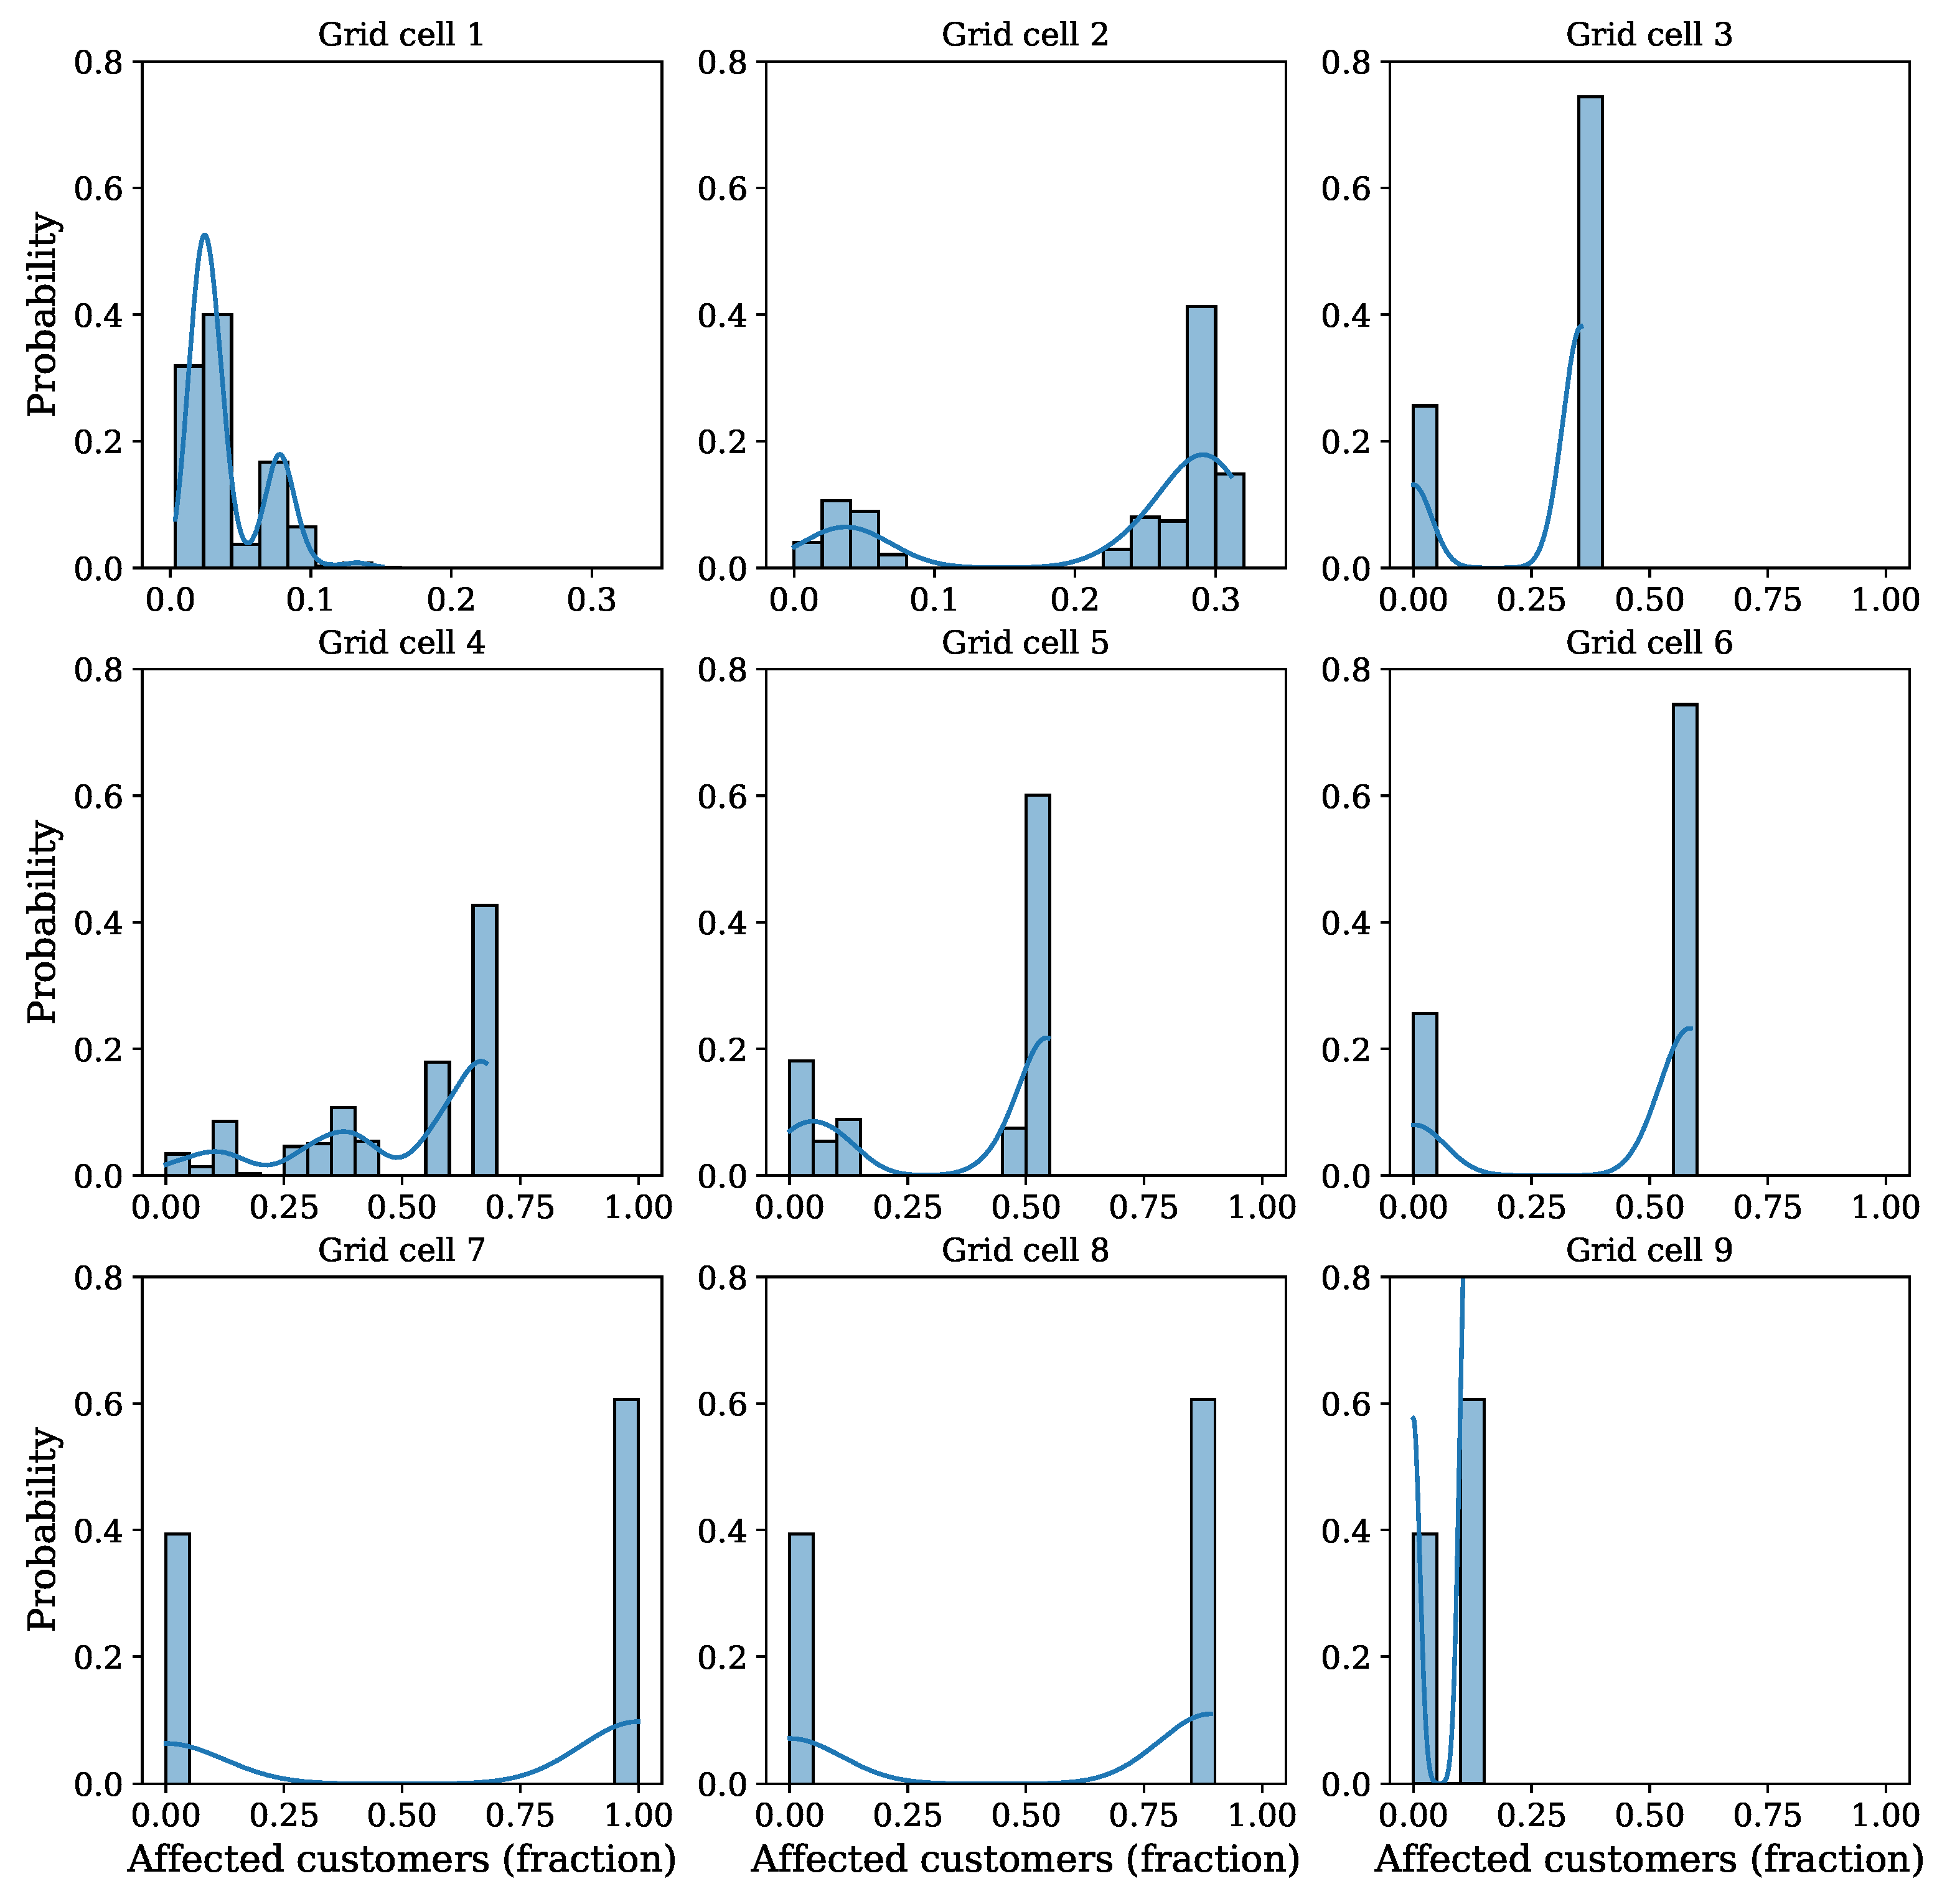
So far, only the number of customers affected by outages was considered, without looking at their location. In the next example, we take a closer look at the spatial distribution of outages. Figure 9 shows the studied service area with grid cells containing affected customers marked in green. The relative number of affected customers is represented by shading, with a darker color corresponding to a larger number. This shows that an outage in one location may affect customers in other locations downstream, and that the affected areas are connected in space. Another perspective is provided by the distribution of affected customers in individual polygons, as shown in Figure 10. It can be observed that a number of cells have bimodal distributions (Cells 3, 6, 7, 8, and 9). In Cells 7, 8, and 9, only none or all customers are affected. In Cells 3 and 6, only a fraction of customers are affected with a probability of 0.8 if an outage reaches these areas.
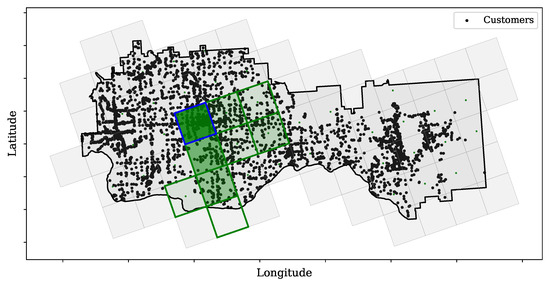
Figure 9.
Service area grid cell and customer location. The green grid cell represents the customers that experience power interruption due to power outages in the blue grid cell; the darker color represents the higher number of affected customers.
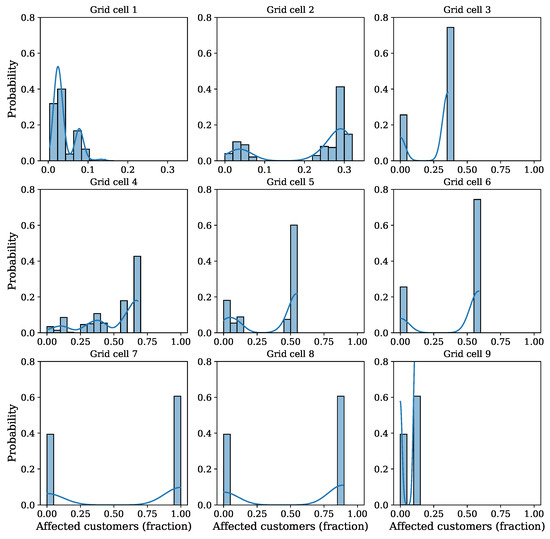
Figure 10.
Number of affected customer distribution in the affected grids (green cells, Figure 9) due to power outages in the blue grid; equipment selection based on historical power outage probability.
6.3. Analysis of a System with Microgrids
The following set of studies focuses on the effect of microgrids on the number of affected customers. We consider four grid-connected microgrids. In case of power outage, microgrids disconnect themselves from the main grid at the point of common coupling (PCC) and operate in the islanded mode. In this way, microgrids can reduce the number of affected customers. To incorporate micgrods, PCCs are added to several specific nodes of GridKG and taken into consideration during the calculations of affected customers.
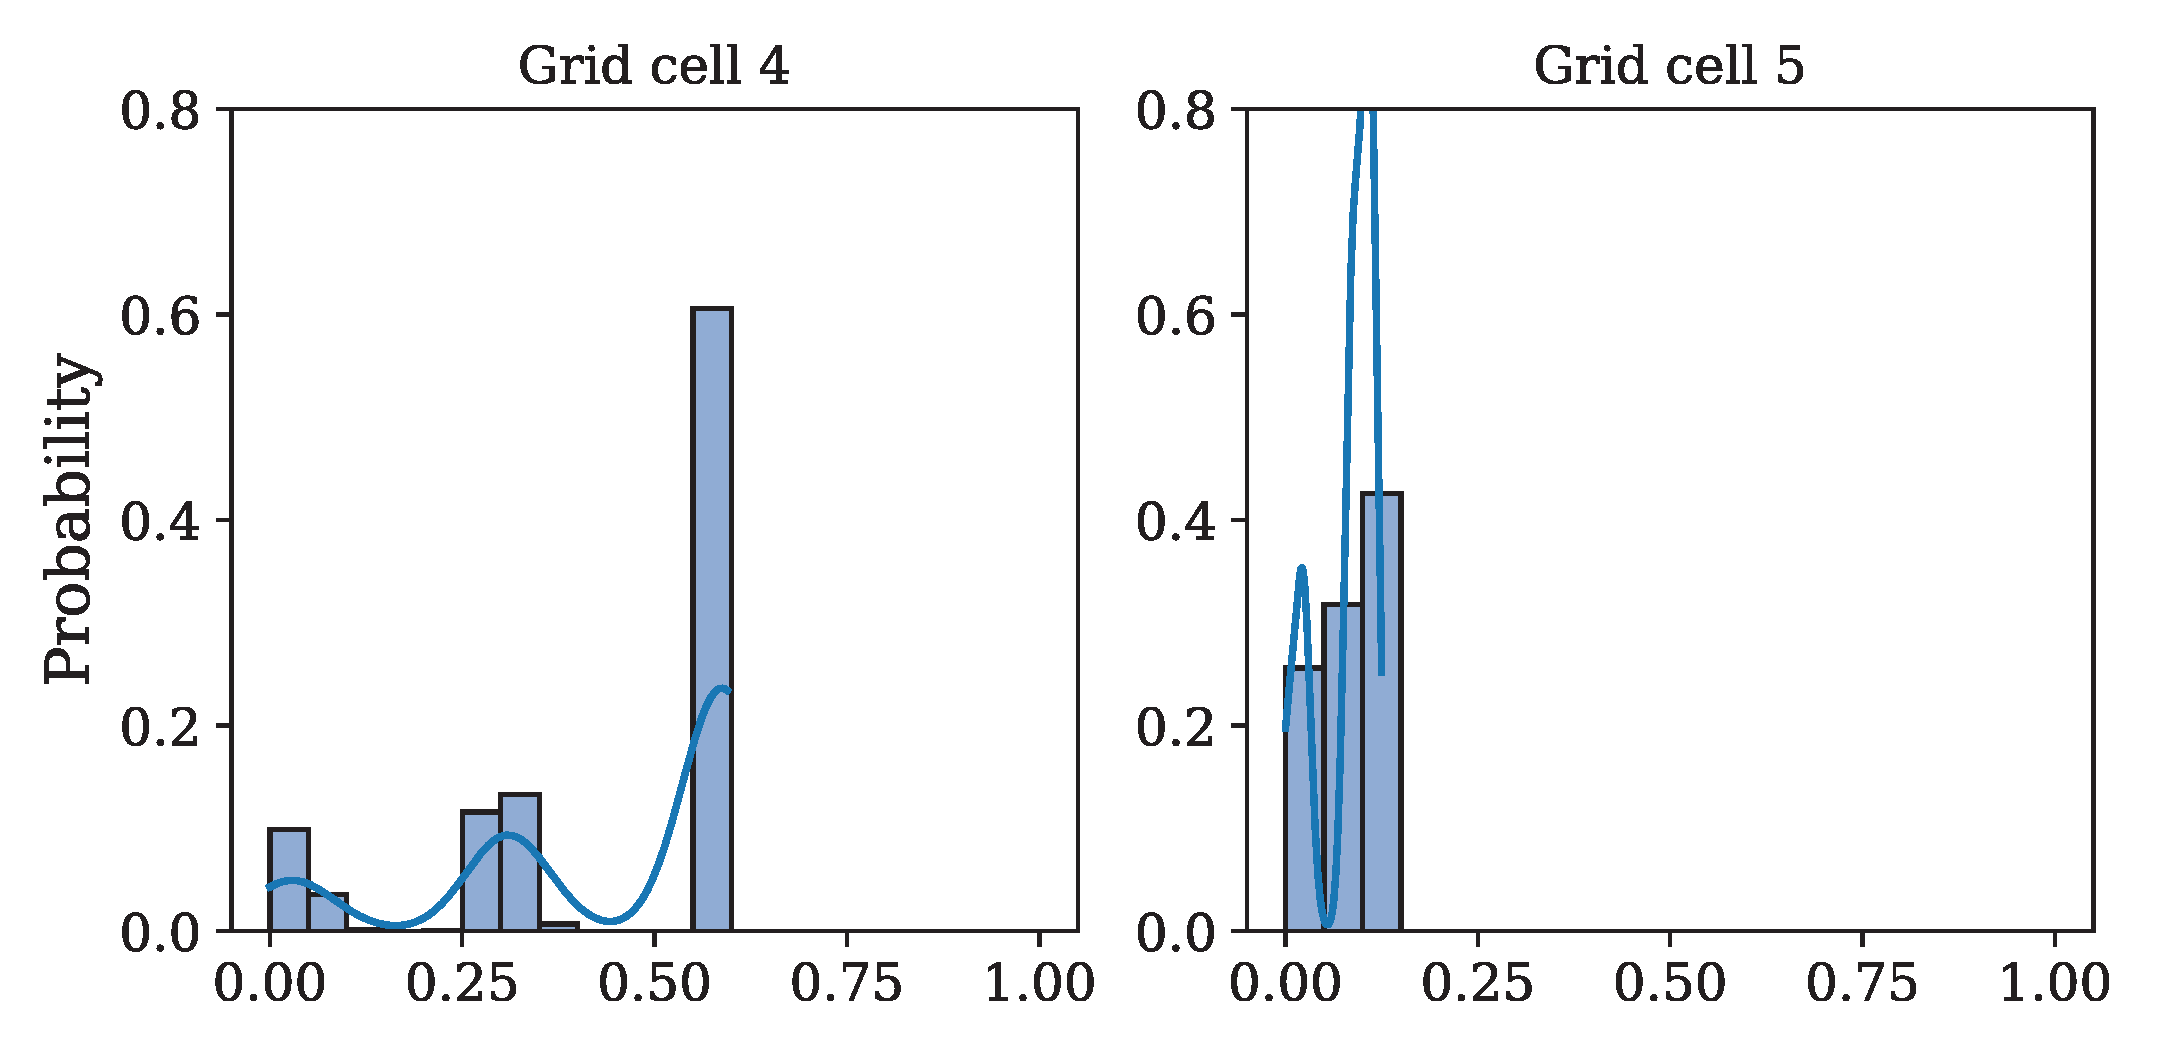
The same type of analysis as described above was performed for these studies. However, due to the limited space, only a table is presented comparing the numbers of affected customers in different grid cells for systems without and with microgrids (Table 2). Two additional plots are included in Figure 11. They show the distribution of the number of affected customers in Cells #4 and #5. There is a striking difference in comparison to the distributions for these two cells in the case without microgrids (Figure 10).
Table 2.
Mean number of affected customers with 15 power outages in the blue gridcell.
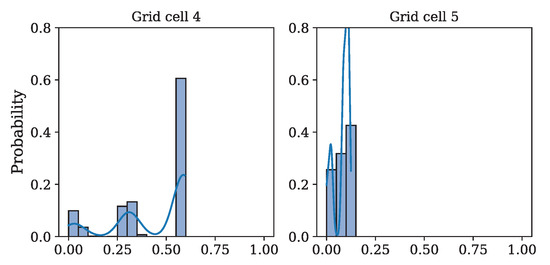
Figure 11.
Number of affected customer distribution in grid Cells $4 and #5 due to power outages in the blue grid cell considering the micro-grid connection to the PCC points—equipment selection based on historical power outage.
7. Conclusions
Modern distribution grids are complex networks with multiple components. Power utilities collect and store a large amount of information about these components, from transformers to individual poles, in relational databases. To satisfy their planning and operational needs, utilities require quick access to the data describing the components, their locations and connections, and the relations between them.
In this paper, we propose using KGs as a suitable format to represent grid data. We develop a vocabulary, powerLOV, to contain several categories of nodes representing various components of the electrical grid and their properties. A number of relations between these components (the edges connecting the nodes) are also defined.
The constructed vocabulary, powerLOV, is used to build a distribution grid KG. The graph representing a distribution system is created based on data provided to us by a utility. We develop several illustrative examples to demonstrate the usefulness of the distribution grid KG. They include an algorithm for identifying electrical paths in the grid that can determine the length of the downstream path from a specific element. Also, we provided several illustrative queries for identifying a sequence of switches/protective devices satisfying a specific condition on a given upstream path; and generating a list of outage events that occurred downstream from a specific component for a given period. Illustrative examples of determining, based on the available data, degrees of affecting customers by outages at a given location for the grid with and without microgrids are included and described.
The constructed graph of a distribution system and examples presented in this article exemplify several benefits of graph-based representation of a power grid: integrating different types of data obtained from a variety of heterogeneous (future work) sources; augmenting grid representation (graph) via leveraging connections between graph nodes; and gaining insights into various aspects of the grid, such as identifying elements of specific features and examining changes in elements within the grid.
A distribution grid KG built using the proposed power vocabulary will become a basis for developing a system for analyzing the grid from different perspectives. It will unlock new ways of accessing and analyzing stored information. The graph could be a central component of the multilevel knowledge-oriented system to answer various questions about the system, investigate the causality of events, and provide insights to decision makers.
Author Contributions
Conceptualization, M.Z.R. and P.M.; methodology, M.Z.R. and P.M.; formal analysis, Y.K., L.T. and M.Z.R.; investigation, Y.K., L.T. and M.Z.R.; resources, M.Z.R.; data curation, M.Z.R.; writing—original draft preparation, Y.K. and L.T.; writing—review and editing, M.Z.R. and P.M.; visualization, Y.K.; supervision, M.Z.R.; project administration, P.M.; funding acquisition, P.M. All authors have read and agreed to the published version of the manuscript.
Funding
This research was funded by the Natural Sciences and Engineering Research Council (NSERC) of Canada grants CRDPJ 537808-18 and RGPIN 05866-17, and by ATCO Electric.
Data Availability Statement
Data are contained within the article.
Conflicts of Interest
The authors declare no conflict of interest.
References
- Kor, Y.; Tan, L.; Reformat, M.Z.; Musilek, P. GridKG: Knowledge Graph Representation of Distribution Grid Data. In Proceedings of the 2020 IEEE Electric Power and Energy Conference (EPEC), Edmonton, AB, Canada, 9–10 November 2020; pp. 1–5. [Google Scholar]
- Huang, H.; Hong, Z.; Zhou, H.; Wu, J.; Jin, N. Knowledge Graph Construction and Application of Power Grid Equipment. Math. Probl. Eng. 2020, 2020, 8269082. [Google Scholar] [CrossRef]
- Hubauer, T.; Lamparter, S.; Haase, P.; Herzig, D.M. Use Cases of the Industrial Knowledge Graph at Siemens. In Proceedings of the Semantic Web Conference, Monterey, CA, USA, 8–12 October 2018. [Google Scholar]
- Wang, J.D.; Yang, J.; Pei, Y.Z.; Zhan, X.P.; Zhou, T.; Xie, P.Y. Distribution Network Fault Assistant Decision-Making Based on Knowledge Graph. Power Syst. Technol. 2021, 45, 2101–2112. [Google Scholar]
- Qiao, J.; Wang, X.Y.; Min, R.; Bai, S.H.; Yao, D.; Pu, T.J. Framework and Key Technologies of Knowledge-Graph-Based Fault Handling System in Power Grid. Proc. CSEE 2020, 40, 5837–5849. [Google Scholar]
- Tang, Y.; Liu, T.; Liu, G.; Li, J.; Dai, R.; Yuan, C. Enhancement of power equipment management using knowledge graph. In Proceedings of the IEEE Innovative Smart Grid Technologies-Asia, Chengdu, China, 21–24 May 2019; pp. 905–910. [Google Scholar]
- Kan, B.; Zhu, W.; Liu, G.; Chen, X.; Shi, D.; Yu, W. Topology modeling and analysis of a power grid network using a graph database. Int. J. Comput. Intell. Syst. 2017, 10, 1355–1363. [Google Scholar] [CrossRef]
- Su, Z.; Hao, M.; Zhang, Q.; Chai, B.; Zhao, T. Automatic Knowledge Graph Constr. Based on Relational Data of Power Terminal Equipment. In Proceedings of the 5th International Conference on Computer and Communication Systems, Shanghai, China, 15–18 May 2020; pp. 761–765. [Google Scholar]
- Devanand, A.; Karmakar, G.; Krdzavac, N.; Rigo-Mariani, R.; Eddy, Y.F.; Karimi, I.A.; Kraft, M. OntoPowSys: A power system ontology for cross domain interactions in an eco industrial park. Energy AI 2020, 1, 100008. [Google Scholar] [CrossRef]
- Perçuku, A.; Minkovska, D.; Stoyanova, L. Modeling and processing big data of power transmission grid substation using neo4j. Procedia Comput. Sci. 2017, 113, 9–16. [Google Scholar] [CrossRef]
- Zhiqiang, W.; Yuan, W.; Kang, Z.; Xin, W.; Hui, H. Entity alignment method for power data knowledge graph of semantic and structural information. IOP Conf. Ser. Mater. Sci. Eng. 2019, 569, 052103. [Google Scholar] [CrossRef]
- Huang, H.; Chen, Y.; Lou, B.; Hongzhou, Z.; Wu, J.; Yan, K. Constructing Knowledge Graph from Big Data of Smart Grids. In Proceedings of the 2019 10th International Conference on Information Technology in Medicine and Education (ITME), Qingdao, China, 23–25 August 2019; pp. 637–641. [Google Scholar]
- Yang, Y.; Chen, Z.; Yan, J.; Xiong, Z.; Zhang, J.; Tu, Y.; Yuan, H. Multi-source Heterogeneous Information Fusion of Power Assets Based on Knowledge Graph. In Proceedings of the 2019 IEEE International Conference on Service Operations and Logistics, and Informatics (SOLI), Zhengzhou, China, 6–8 November 2019; pp. 213–218. [Google Scholar]
- Cui, B. Electric device abnormal detection based on IoT and knowledge graph. In Proceedings of the IEEE International Conference on Energy Internet (ICEI), Nanjing, China, 27–31 May 2019; pp. 217–220. [Google Scholar]
- Fan, S.; Liu, X.; Chen, Y.; Liao, Z.; Zhao, Y.; Luo, H.; Fan, H. How to Construct a Power Knowledge Graph with Dispatching Data? Sci. Program. 2020, 2020, 8842463. [Google Scholar] [CrossRef]
- Zhang, Q.; Dong, C.L.; Cui, Y.; Yang, Z.H. Dynamic Uncertain Causality Graph for Knowledge Representation and Probabilistic Reasoning: Directed Cyclic Graph and Joint Probability Distribution. IEEE Trans. Neural Netw. Learn. Syst. 2015, 26, 1503–1517. [Google Scholar] [CrossRef]
- Liu, Y.K.; Ai, X.; Ayodeji, A.; Wu, M.P.; Peng, M.J.; Xia, H.; Yu, W.F. Enhanced Graph-Based Fault Diagnostic System for Nuclear Power Plants. Nucl. Sci. Tech. 2019, 30, 174. [Google Scholar] [CrossRef]
- Zhao, Y.; Ball, R.; Mosesian, J.; de Palma, J.F.; Lehman, B. Graph-Based Semi-Supervised Learning for Fault Detection and Classification in Solar Photovoltaic Arrays. IEEE Trans. Power Electron. 2015, 30, 2848–2858. [Google Scholar] [CrossRef]
- Yi, H.K.; Jiang, Q.C. Graph-Based Semisupervised Learning for Icing Fault Detection of Wind Turbine Blade. Meas. Sci. Technol. 2020, 32, 035117. [Google Scholar] [CrossRef]
- Lv, K.; Gao, C.X.; Si, J.K.; Feng, H.C.; Cao, W.P. Fault Coil Location of Inter-Turn Short-Circuit for Direct-Drive Permanent Magnet Synchronous Motor Using Knowledge Graph. IET Electr. Power Appl. 2020, 14, 1712–1721. [Google Scholar] [CrossRef]
- Liu, X.Y.; Wang, H.W. Knowledge Graph Construction and Decision Support Towards Transformer Fault Maintenance. In Proceedings of the 2021 IEEE 24th International Conference on Computer Supported Cooperative Work in Design (CSCWD), Dalian, China, 5–7 May 2021; pp. 661–666. [Google Scholar]
- Liu, L.; Wang, B.; Ma, F.; Zheng, Q.; Yao, L.; Zhang, C.; Mohamed, M.A. A Concurrent Fault Diagnosis Method of Transformer Based on Graph Convolutional Network and Knowledge Graph. Front. Energy Res. 2022, 10, 837553. [Google Scholar] [CrossRef]
- Wu, W.; Li, H.; Wang, H.; Zhu, K.Q. Probase: A probabilistic taxonomy for text understanding. In Proceedings of the 2012 ACM SIGMOD International Conference on Management of Data, Scottsdale, AZ, USA, 20–24 May 2012; pp. 481–492. [Google Scholar]
- Dong, X.; Gabrilovich, E.; Heitz, G.; Horn, W.; Lao, N.; Murphy, K.; Strohmann, T.; Sun, S.; Zhang, W. Knowledge vault: A web-scale approach to probabilistic knowledge fusion. In Proceedings of the 20th ACM SIGKDD International Conference on Knowledge Discovery and Data Mining, New York, NY, USA, 24–27 August 2014; pp. 601–610. [Google Scholar]
- Auer, S.; Bizer, C.; Kobilarov, G.; Lehmann, J.; Cyganiak, R.; Ives, Z. Dbpedia: A nucleus for a web of open data. In The Semantic Web; Springer: Berlin/Heidelberg, Germany, 2007; pp. 722–735. [Google Scholar]
- Resource Description Framework. Available online: https://www.w3.org/RDF/ (accessed on 25 October 2018).
- Paulheim, H. Knowledge graph refinement: A survey of approaches and evaluation methods. Semant. Web 2017, 8, 489–508. [Google Scholar] [CrossRef]
- Wang, Q.; Mao, Z.; Wang, B.; Guo, L. Knowledge graph embedding: A survey of approaches and applications. IEEE Trans. Knowl. Data Eng. 2017, 29, 2724–2743. [Google Scholar] [CrossRef]
- Arnaout, H.; Elbassuoni, S. Effective searching of RDF knowledge graphs. J. Web Semant. 2018, 48, 66–84. [Google Scholar] [CrossRef]
- Lösch, U.; Bloehdorn, S.; Rettinger, A. Graph kernels for RDF data. In Proceedings of the Extended Semantic Web Conference, Heraklion, Greece, 27–31 May 2012; pp. 134–148. [Google Scholar]
- Ruan, T.; Xue, L.; Wang, H.; Hu, F.; Zhao, L.; Ding, J. Building and exploring an enterprise knowledge graph for investment analysis. In Proceedings of the International Semantic Web Conference, Kobe, Japan, 17–21 October 2016; pp. 418–436. [Google Scholar]
- Neo4j. Available online: https://neo4j.com (accessed on 5 April 2022).
- Kabir, E.; Guikema, S.D.; Quiring, S.M. Predicting thunderstorm-induced power outages to support utility restoration. IEEE Trans. Power Syst. 2019, 34, 4370–4381. [Google Scholar] [CrossRef]


Disclaimer/Publisher’s Note: The statements, opinions and data contained in all publications are solely those of the individual author(s) and contributor(s) and not of MDPI and/or the editor(s). MDPI and/or the editor(s) disclaim responsibility for any injury to people or property resulting from any ideas, methods, instructions or products referred to in the content. |
© 2023 by the authors. Licensee MDPI, Basel, Switzerland. This article is an open access article distributed under the terms and conditions of the Creative Commons Attribution (CC BY) license (https://creativecommons.org/licenses/by/4.0/).