

Classification Tendency Difference Index Model for Feature Selection and Extraction in Wireless Intrusion Detection


Abstract
1. Introduction
2. Related Works
3. Method
3.1. Model Design
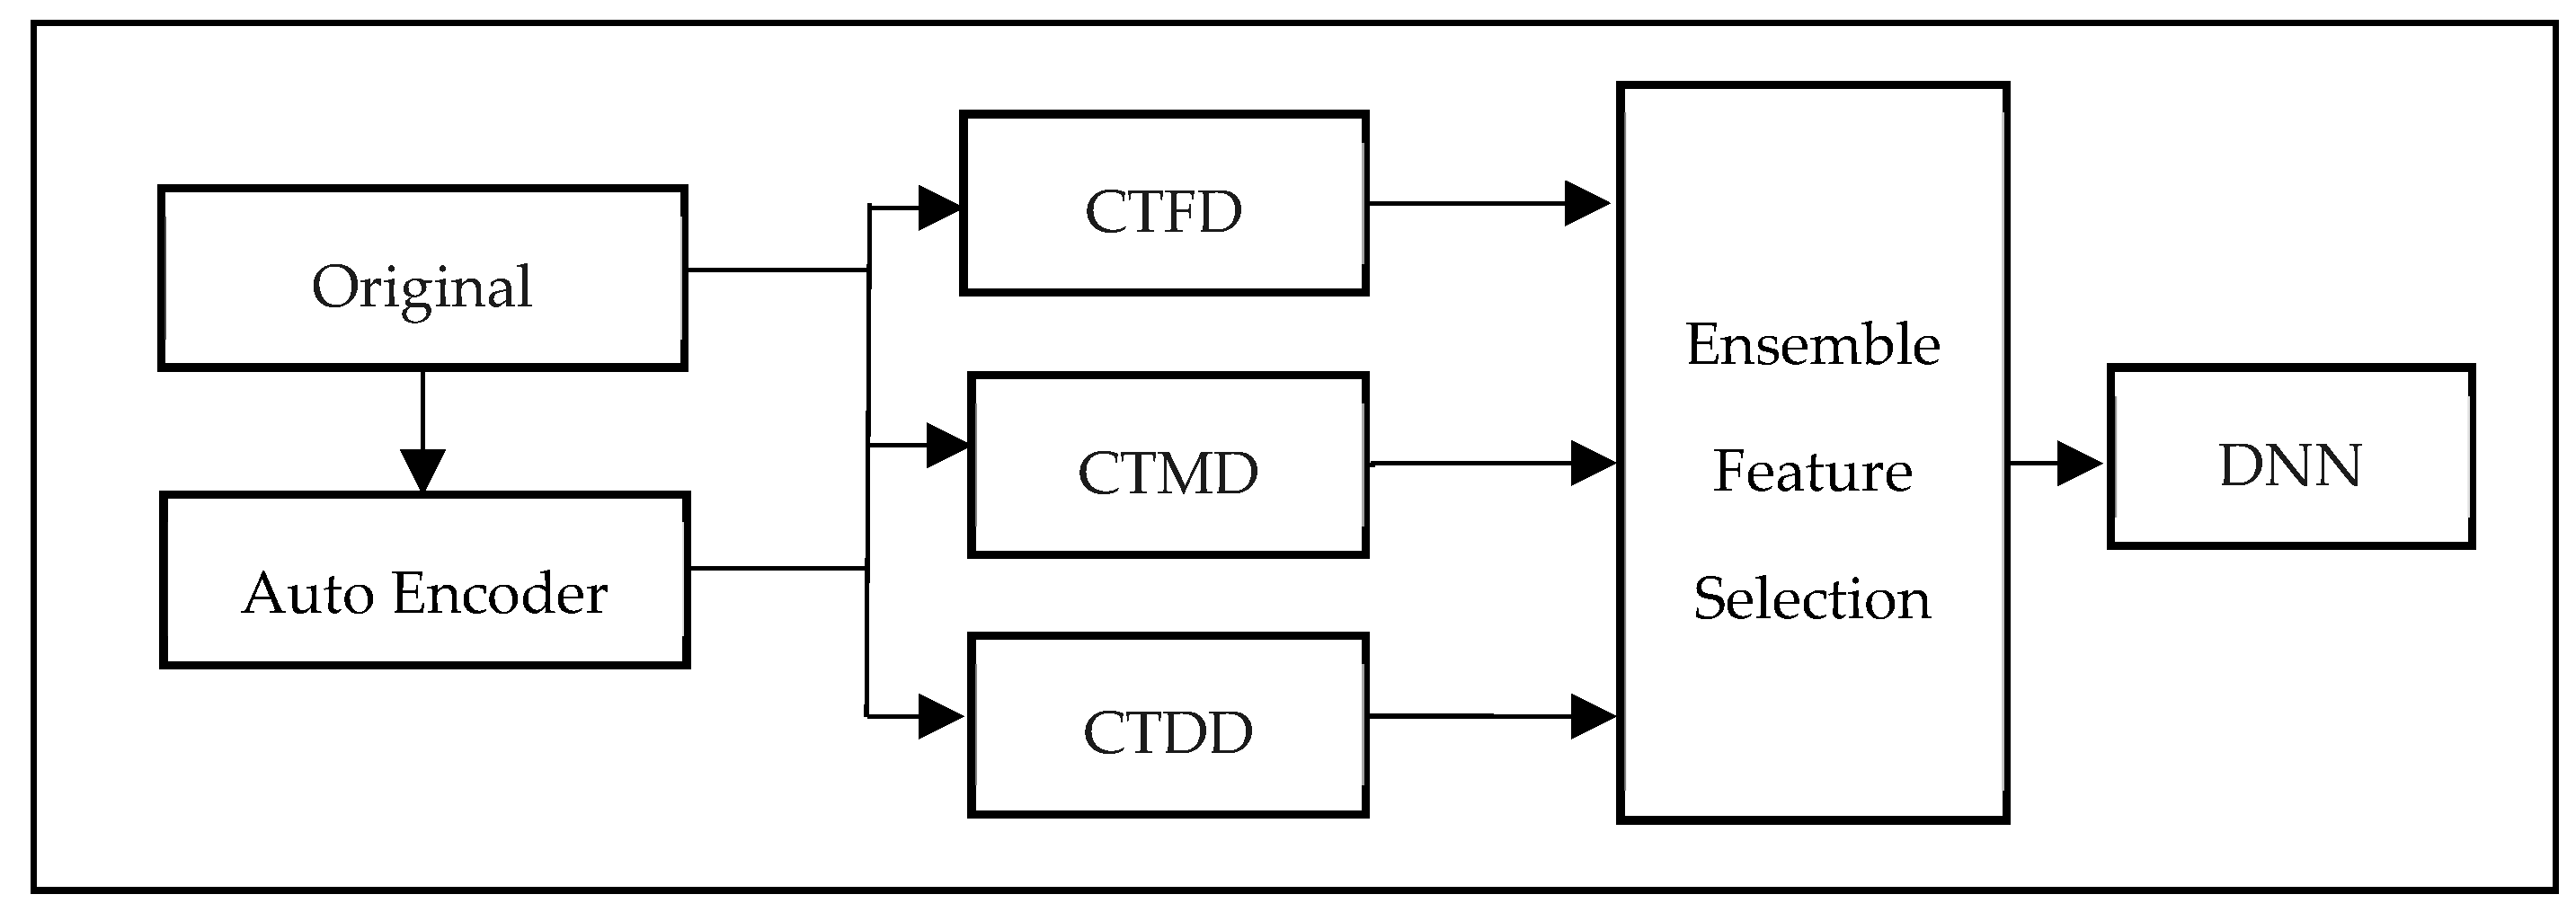
- Classification Tendency Frequency Difference (CTFD): Measures the difference in the frequency of occurrence of each FV between normal and attack samples.
- Classification Tendency Membership Difference (CTMD): Employs FCM to cluster normal and attack samples, then calculates the membership difference between the two clusters for each FV.
- Classification Tendency Distance Difference (CTDD): Calculates the distance difference between the cluster centers of normal and attack samples for each FV.
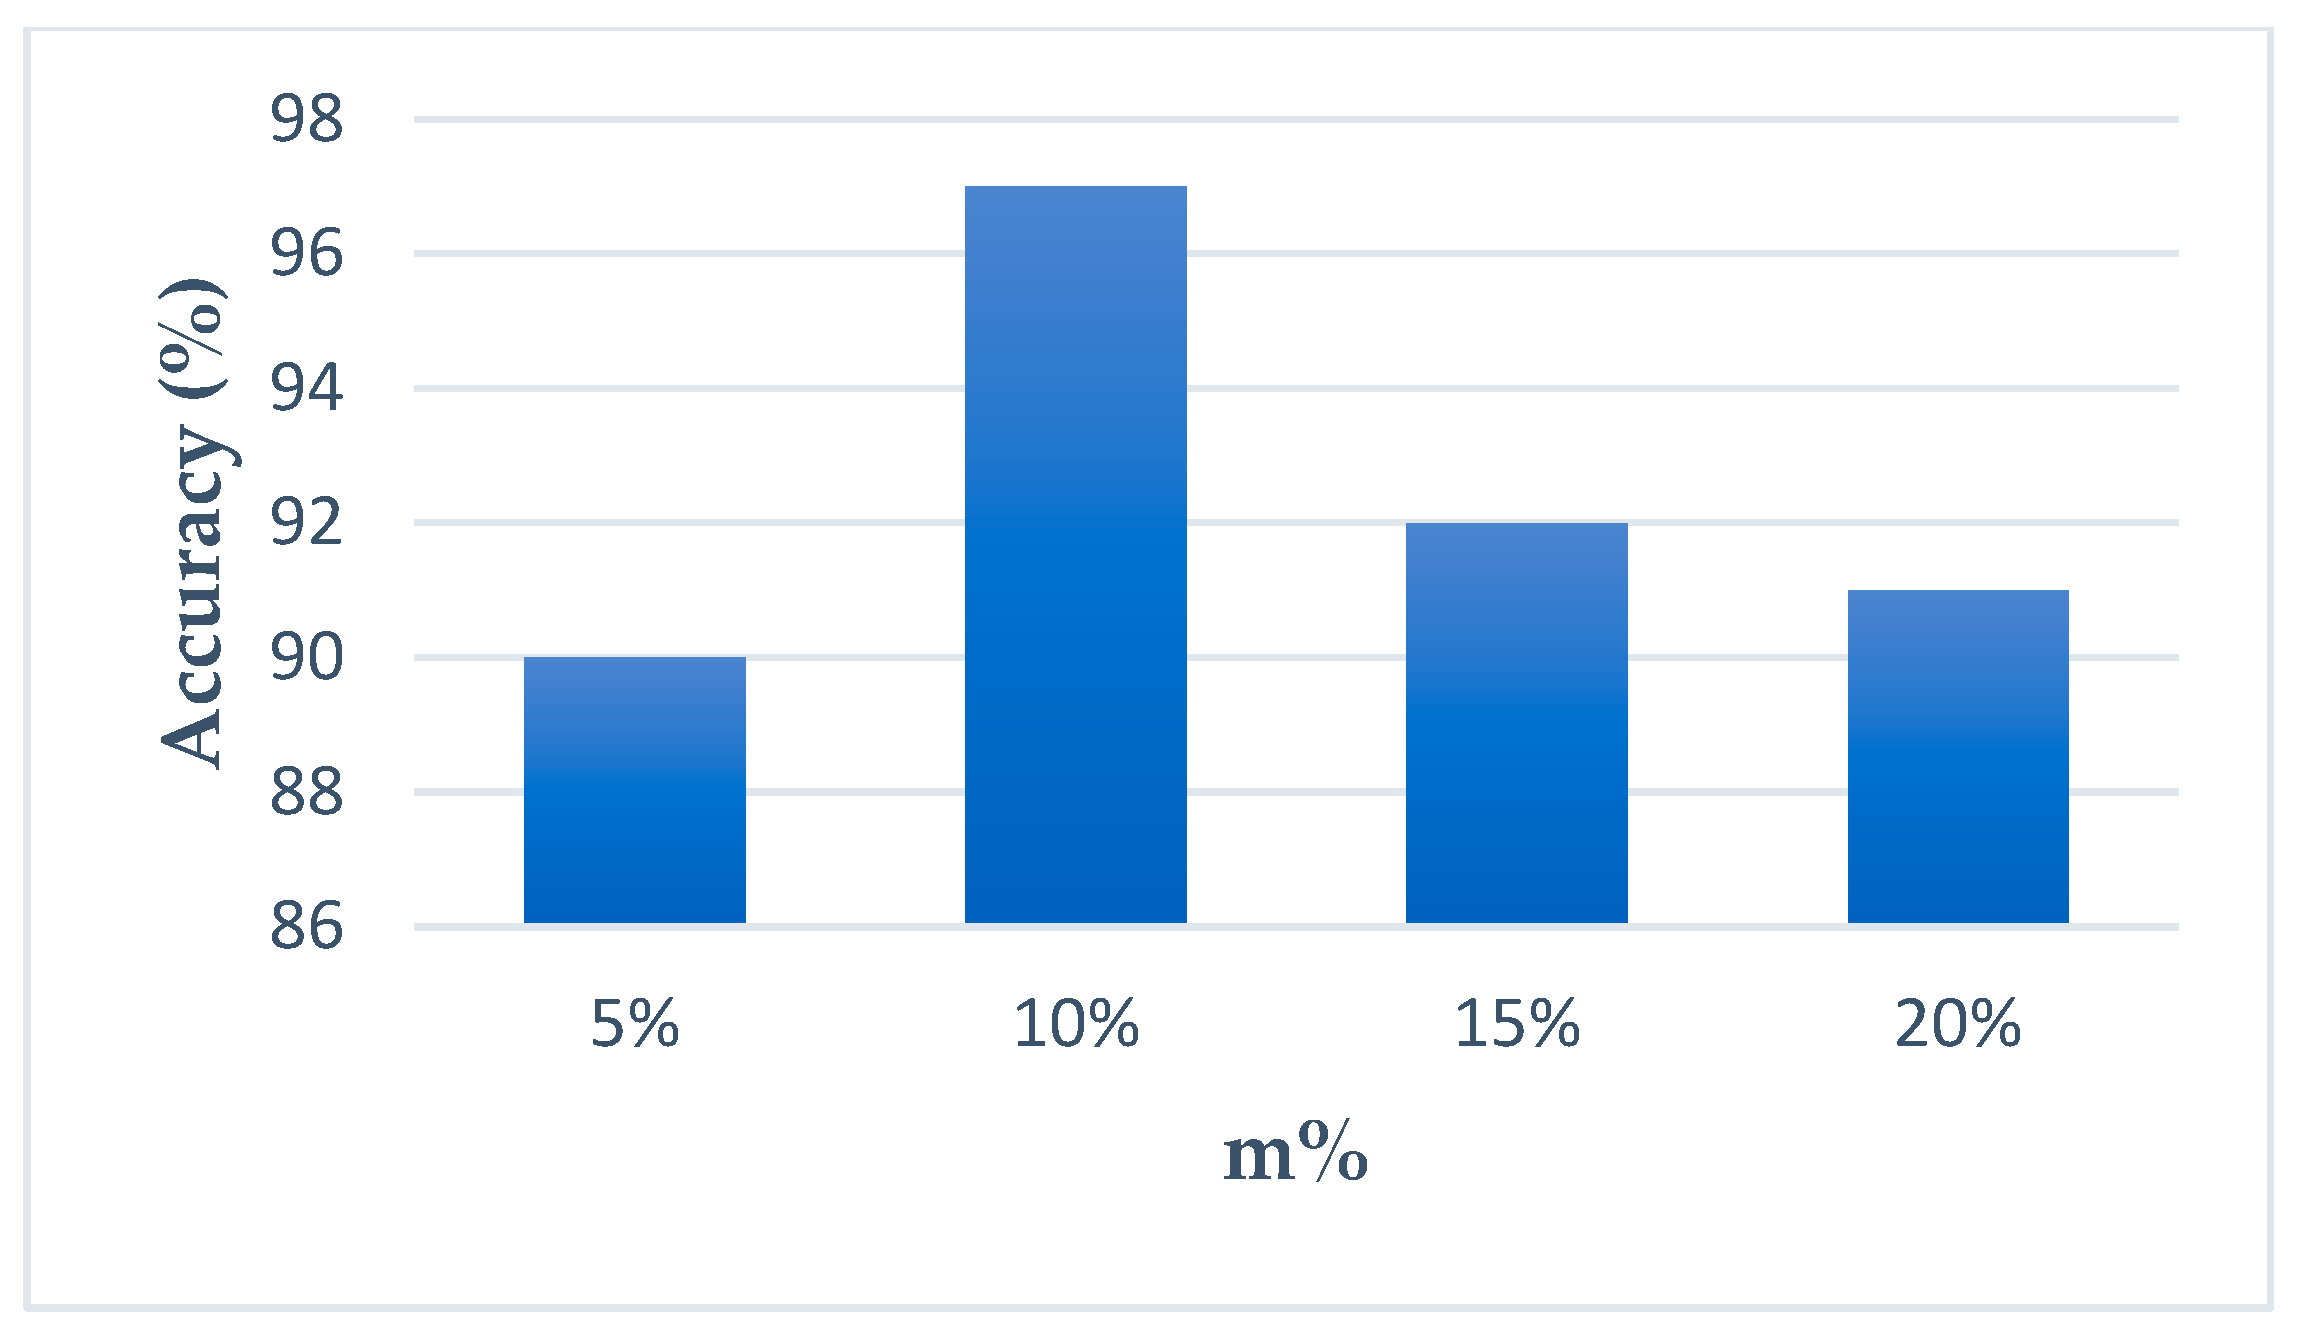
- Ensemble Feature Selection (EFS): EFS is a method that combines the results of feature selection conducted using three CTDI indexes: CTFD, CTMD, and CTDD. To identify the most pertinent features, EFS first selects those that consistently appear among the top m% of features for each index. This ensures that the selected features have a high degree of representativeness. As a feature appears in two or more of the top m% features of CTDI indexes, it suggests that it has strong representativeness, and thus, this feature is chosen in CTDI. Table 2 summarizes the common abbreviations and notations in CTDI.
3.2. CTFD
3.3. CTDD and CTMD
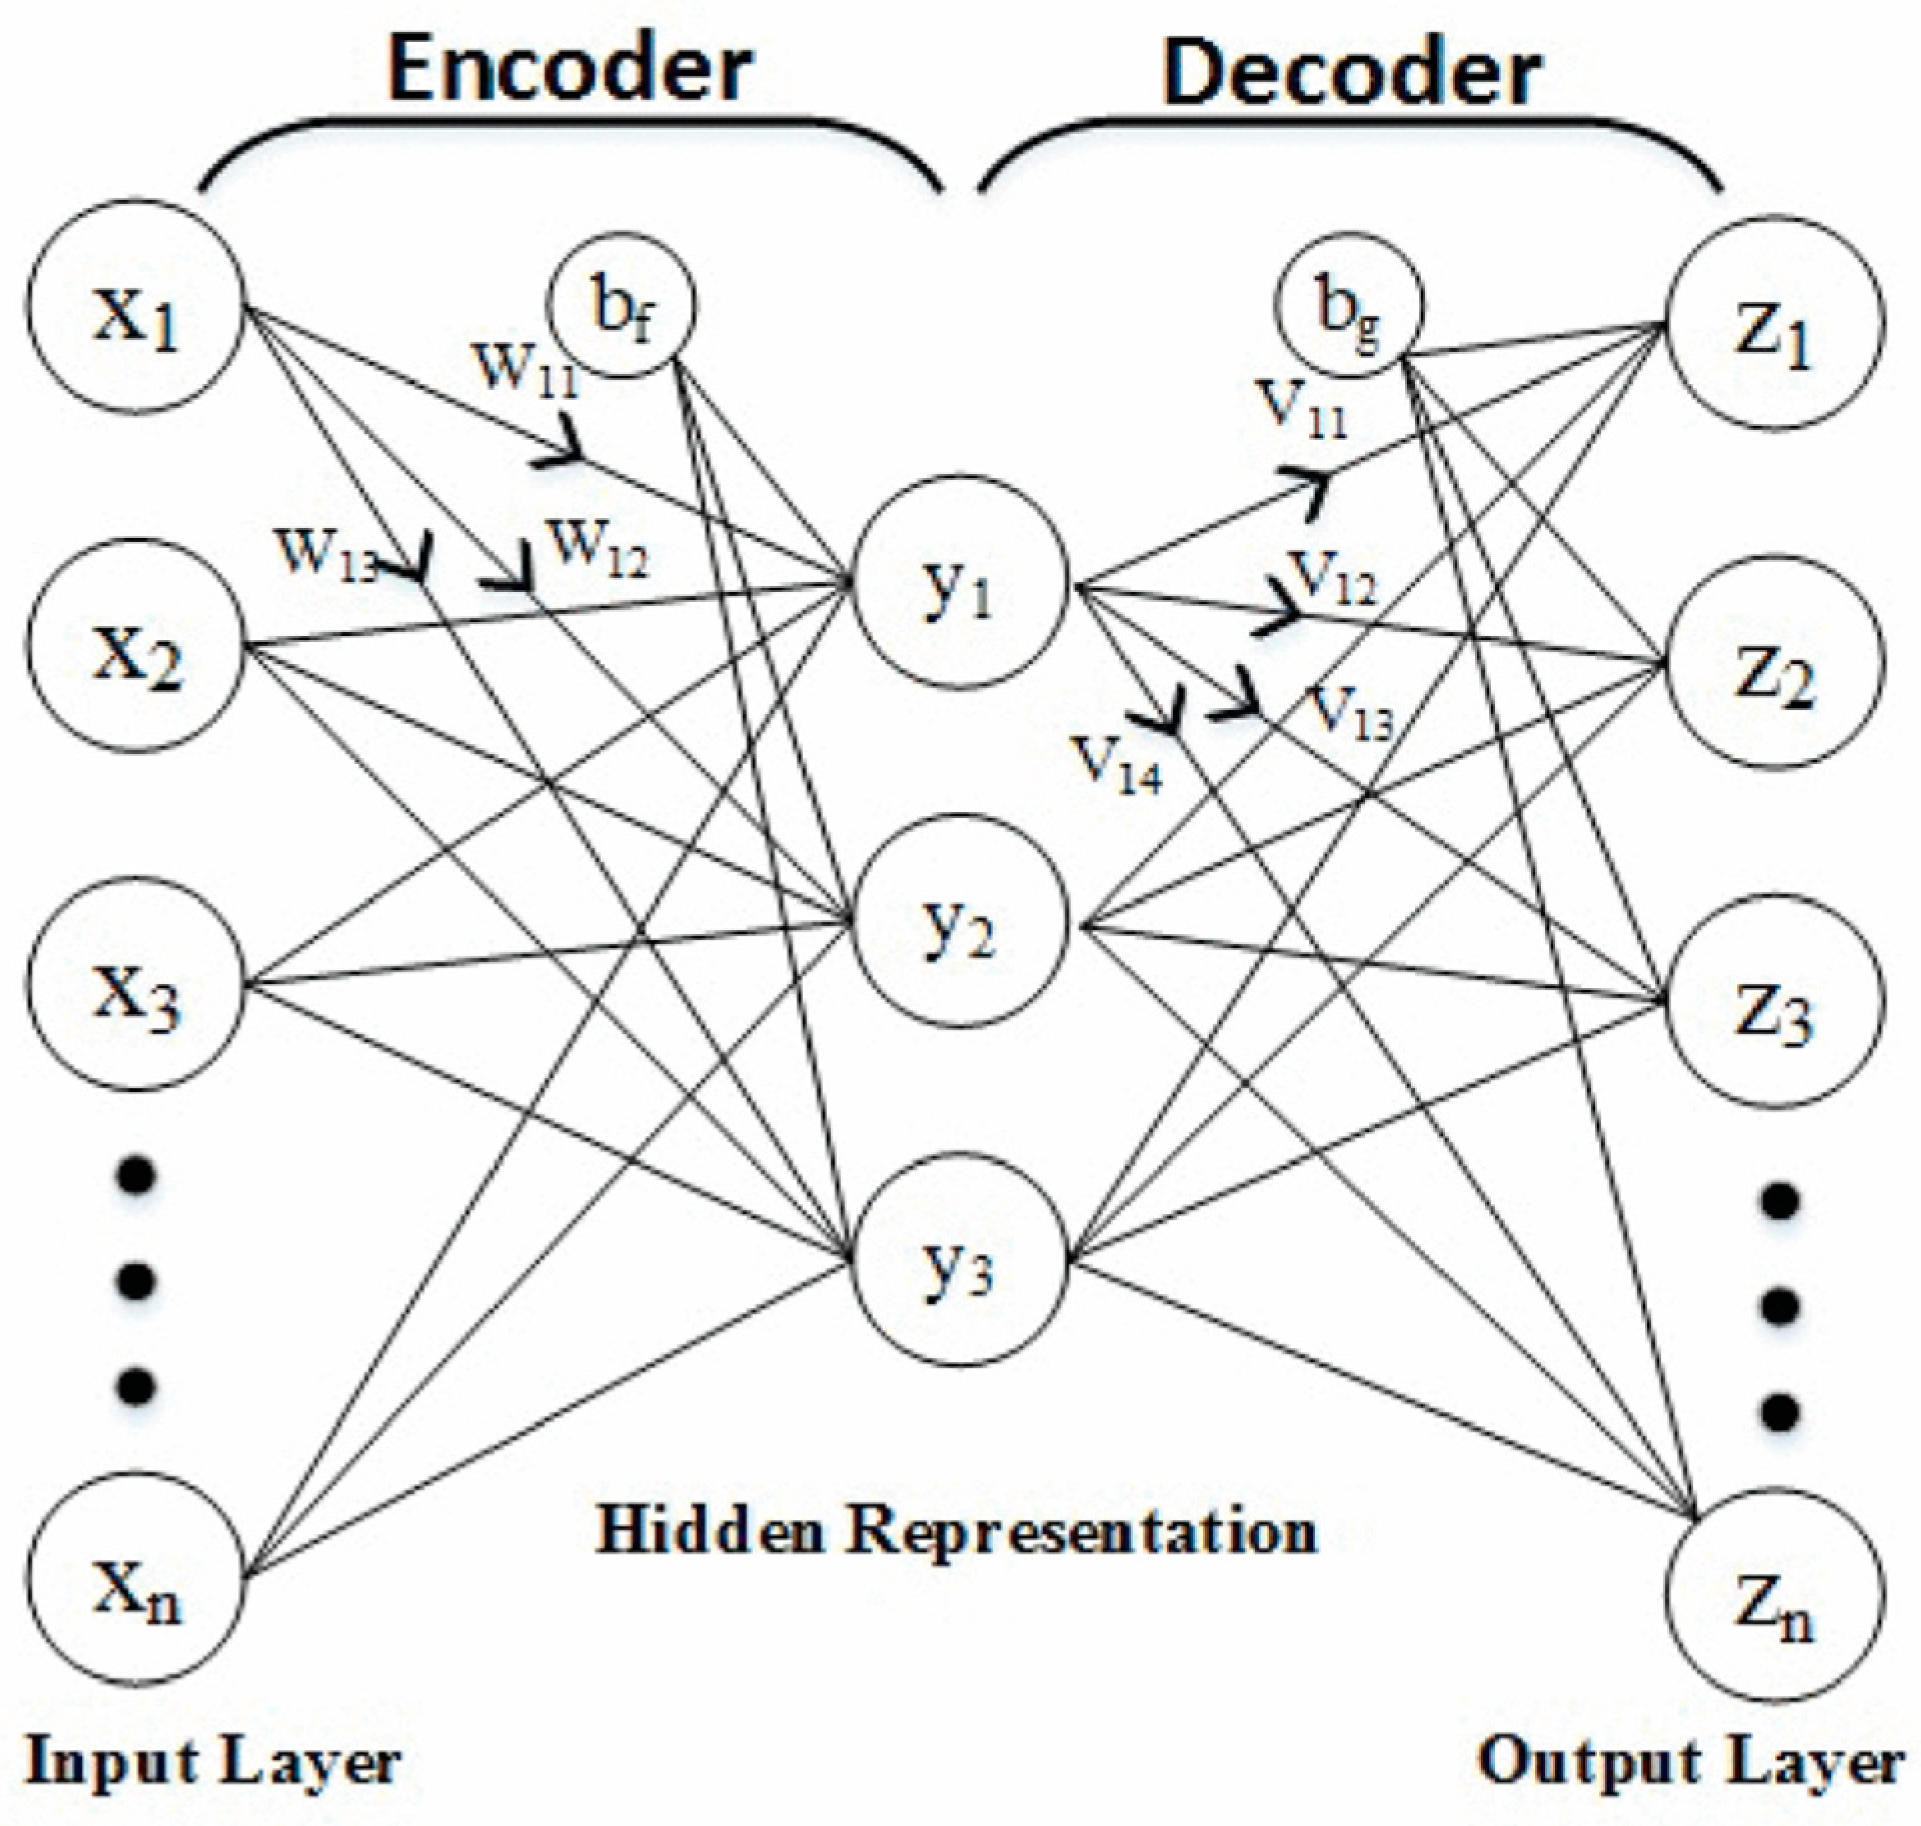
3.4. Auto Encoder
3.5. Example Scenario for CTDI
4. Experiment Results
4.1. Experiment Setting
4.2. Feature Selection Results
4.3. Detection Results
5. Comparing Detection Results with the Related Works in AWID
6. Conclusions
Author Contributions
Funding
Data Availability Statement
Conflicts of Interest
References
- Badii, C.; Bellini, P.; Difino, A.; Nesi, P. Smart City IoT Platform Respecting GDPR Privacy and Security Aspects. IEEE Access 2020, 8, 23601–23623. [Google Scholar] [CrossRef]
- Al Lail, M.; Garcia, A.; Olivo, S. Machine Learning for Network Intrusion Detection—A Comparative Study. Future Internet 2023, 15, 243. [Google Scholar] [CrossRef]
- Aldweesh, A.; Derhab, A.; Emam, A.Z. Deep learning approaches for anomaly based intrusion detection systems: A survey, taxonomy, and open issues. Knowl.-Based Syst. 2020, 189, 105124. [Google Scholar] [CrossRef]
- Alduailij, M.; Khan, Q.W.; Tahir, M.; Sardaraz, M.; Alduailij, M.; Malik, F. Machine-Learning-Based DDoS Attack Detection Using Mutual Information and Random Forest Feature Importance Method. Symmetry 2022, 14, 1095. [Google Scholar] [CrossRef]
- Subbiah, S.; Anbananthen, K.S.M.; Thangaraj, S.; Kannan, S.; Chelliah, D. Intrusion detection technique in wireless sensor network using grid search random forest with Boruta feature selection algorithm. J. Commun. Netw. 2022, 24, 264–273. [Google Scholar] [CrossRef]
- Alsaleh, A.; Binsaeedan, W. The Influence of Salp Swarm Algorithm-Based Feature Selection on Network Anomaly Intrusion Detection. IEEE Access 2021, 9, 112466–112477. [Google Scholar] [CrossRef]
- Shah, R.A.; Qian, Y.; Kumar, D.; Ali, M.; Alvi, M.B. Network Intrusion Detection through Discriminative Feature Selection by Using Sparse Logistic Regression. Future Internet 2017, 9, 81. [Google Scholar] [CrossRef]
- Sharafaldin, I.; Lashkari, A.H.; Ghorbani, A.A. Toward Generating a New Intrusion Detection Dataset and Intrusion Traffic Characterization. In Proceedings of the 4th International Conference on Information Systems Security and Privacy (ICISSP), Funchal, Portugal, 22–24 January 2018. [Google Scholar]
- Tavallaee, M.; Bagheri, E.; Lu, W.; Ghorbani, A.A. A detailed analysis of the KDD CUP 99 data set. In Proceedings of the IEEE Symposium on Computational Intelligence for Security and Defense Applications, Ottawa, ON, Canada, 8–10 July 2009. [Google Scholar]
- Moustafa, N.; Slay, J. UNSW-NB15: A comprehensive data set for network intrusion detection systems (UNSW-NB15 network data set). In Proceedings of the Military Communications and Information Systems Conference (MilCIS), Canberra, Australia, 10–12 November 2015. [Google Scholar]
- Dao, T.-N.; Lee, H. Stacked Autoencoder-Based Probabilistic Feature Extraction for On-Device Network Intrusion Detection. IEEE Internet Things J. 2022, 9, 14438–14451. [Google Scholar] [CrossRef]
- Rao, K.N.; Rao, K.V.; Prasad Reddy, P.V.G.D. A hybrid Intrusion Detection System based on Sparse autoencoder and Deep Neural Network. Comput. Commun. 2021, 180, 77–88. [Google Scholar]
- Bhardwaj, A.; Mangat, V.; Vig, R. Hyperband Tuned Deep Neural Network with Well Posed Stacked Sparse AutoEncoder for Detection of DDoS Attacks in Cloud. IEEE Access 2020, 8, 181916–181929. [Google Scholar] [CrossRef]
- Yaser, A.L.; Mousa, H.M.; Hussein, M. Improved DDoS Detection Utilizing Deep Neural Networks and Feedforward Neural Networks as Autoencoder. Future Internet 2022, 14, 240. [Google Scholar] [CrossRef]
- Kolias, C.; Kambourakis, G.; Stavrou, A.; Gritzalis, S. Intrusion Detection in 802.11 Networks: Empirical Evaluation of Threats and a Public Dataset. IEEE Commun. Surv. Tutor. 2016, 18, 184–208. [Google Scholar] [CrossRef]
- Mikhail, J.W.; Fossaceca, J.M.; Iammartino, R. A Semi-Boosted Nested Model with Sensitivity-Based Weighted Binarization for Multi-Domain Network Intrusion Detection. ACM Trans. Intell. Syst. Technol. 2019, 10, 1–27. [Google Scholar] [CrossRef]
- Aminanto, M.E.; Choi, R.; Tanuwidjaja, H.C.; Yoo, P.D.; Kim, K. Deep Abstraction and Weighted Feature Selection for Wi-Fi Impersonation Detection. IEEE Trans. Inf. Forensics Secur. 2018, 13, 621–636. [Google Scholar] [CrossRef]
- Lee, S.J.; Yoo, P.D.; Asyhari, A.T.; Jhi, Y.; Chermak, L.; Yeun, C.Y.; Taha, K. IMPACT: Impersonation Attack Detection via Edge Computing Using Deep Autoencoder and Feature Abstraction. IEEE Access 2020, 8, 65520–65529. [Google Scholar] [CrossRef]
- Parker, L.R.; Yoo, P.D.; Asyhari, T.A.; Chermak, L.; Jhi, Y.; Taha, K. DEMISe: Interpretable deep extraction and mutual information selection techniques for IoT intrusion detection. In Proceedings of the International Conference on Availability, Reliability and Security (ARES ‘19), New York, NY, USA, 26–29 August 2019. [Google Scholar]
- Caminero, G.; Lopez-Martin, M.; Carro, B. Adversarial environment reinforcement learning algorithm for intrusion detection. Comput. Netw. 2019, 159, 96–109. [Google Scholar] [CrossRef]


| Study | Classifier | Enhancement | Dataset |
|---|---|---|---|
| Alduailij et al. [4] | Random Forest | Mutual Information, Random Forest Gini impurity | CIC-IDS2017 |
| Subbiah et al. [5] | Random Forest | Boruta Feature Selection | NSL-KDD |
| Alsaleh et al. [6] | XGBoost | Salp Swarm algorithm | NSL-KDD UNSW-NB15 |
| Shah et al. [7] | Logistic Regression | Logistic Regression | NSL-KDD |
| Dao et al. [11] | DNN | Auto Encoder | CIC-IDS2017 UNSW-NB15 |
| Rao et al. [12] | DNN | Auto Encoder | NSL-KDD UNSW-NB15 |
| Bhardwaj et al. [13] | DNN | Auto Encoder | CIC-IDS2017 NSL-KDD |
| Yaser et al. [14] | DNN | Auto Encoder | ISCX-IDS-2012 UNSW2018 |
| Kolias et al. [15] | J48 | Manual Feature Selection | AWID |
| Mikhail et al. [16] | Semi-boosted Tree | Gini Impurity | AWID |
| Aminanto et al. [17] | DNN | Auto Encoder, three feature selection methods | AWID |
| Lee et al. [18] | Support Vector Machines (SVM) | Feature selection, data balancing, Auto Encoder | AWID |
| Parker et al. [19] | Logistic Regression | Auto Encoder | AWID |
| Caminero et al. [20] | Reinforcement Learning | Auto Encoder | AWID |
| CTDI | Classification Tendency Difference Index |
| CTFD | Classification Tendency Frequency Difference |
| CTMD | Classification Tendency Membership Difference |
| CTDD | Classification Tendency Distance Difference |
| EFS | Ensemble Feature Selection |
| DNN | Deep neural network |
| FCM | Fuzzy C Means |
| AWID | Aegean Wi-Fi Intrusion Dataset |
| ith feature value | |
| Total Frequency of the repeating | |
| The custer center for the cluster k | |
| The membership of the cluster k for | |
| D | The size of the dataset. |
| Label | Class | Training | Test |
|---|---|---|---|
| Normal | Unbalanced | 1,633,190 | 530,785 |
| Balanced | 162,385 | - | |
| Attack | Impersonation | 48,522 | 20,079 |
| Flooding | 48,484 | 8097 | |
| Injection | 65,379 | 16,682 | |
| Total | 162,385 | 44,858 |
| Method | Selected Features | Number of Features |
|---|---|---|
| Original Feature | ||
| CTFD | 4, 7, 8, 9, 38, 47, 50, 51, 64, 67, 70, 71, 73, 140, 142, 154 | 16 |
| CTMD | 8, 9, 47, 50, 51, 64, 66, 67, 68, 70, 71, 73, 90, 118, 142, 154 | 16 |
| CTDD | 4, 7, 8, 9, 47, 50, 51, 66, 67, 68, 71, 82, 118, 140, 142, 154 | 16 |
| EFS | 4, 7, 8, 9, 47, 50, 51, 64, 66, 67, 68, 70, 71, 73, 118, 140, 142, 154 | 18 |
| Auto Encoder Feature | ||
| CTFD | 10, 16, 24, 27, 35, 49, 51, 55, 68, 76, 78, 82, 87, 109, 139, 143 | 16 |
| CTMD | 8, 13, 22, 30, 39, 42, 66, 69, 76, 78, 100, 103, 115, 118, 139, 141 | 16 |
| CTDD | 5, 8, 9, 31, 39, 41, 50, 54, 66, 71, 75, 80, 86, 92, 98, 102, 112, 147 | 16 |
| EFS | 8, 39, 66, 76, 78, 139 | 6 |
| CTDI | Original: 4, 7, 8, 9, 47, 50, 51, 64, 66, 67, 68, 70, 71, 73, 118, 140, 142, 154; Auto Encoder: 8, 39, 66, 76, 78, 139 | 24 |
| Original Feature | |||||
|---|---|---|---|---|---|
| No. | Name | No. | Name | No. | Name |
| 4 | frame.time_epoch | 51 | radiotap.channel.type.ofdm | 71 | wlan.fc.pwrmgt |
| 7 | frame.time_relative | 64 | wlan.fc.type_subtype | 73 | wlan.fc.protected |
| 8 | frame.len | 66 | wlan.fc.type | 118 | wlan_mgt.tagged.all |
| 9 | frame.cap_len | 67 | wlan.fc.subtype | 140 | wlan.wep.iv |
| 47 | radiotap.datarate | 68 | wlan.fc.ds | 142 | wlan.wep.icv |
| 50 | fradiotap.channel.type.cck | 70 | wlan.fc.retry | 154 | data.len |
| Auto Encoder Feature | |||||
| 8 | frame.len | 66 | wlan.fc.type | 78 | wlan.ta |
| 39 | radiotap.flags.cfp | 76 | wlan.ra | 139 | wlan_mgt.tcprep.link_mrg |
| Method | Accuracy (%) | F1 (%) | Precision (%) | Recall (%) |
|---|---|---|---|---|
| CTDI | 99.92% | 99.52% | 99.98% | 99.06% |
| Original Feature | ||||
| CTFD | 98.31% | 90.08% | 98.32% | 83.12% |
| CTMD | 98.07% | 88.72% | 97.14% | 81.64% |
| CTDD | 97.10% | 83.29% | 92.74% | 75.58% |
| Auto Encoder Feature | ||||
| CTFD | 94.65% | 73.11% | 93.35% | 60.09% |
| CTMD | 98.25% | 89.52% | 95.86% | 83.97% |
| CTDD | 97.43% | 85.03% | 93.75% | 77.80% |
| Study | Classifier | Enhancement | ACC | F1 |
|---|---|---|---|---|
| Kolias et al. [15] | J48 | FS | 96.28% | 68.86% |
| Aminanto et al. [17] | DNN | FS, DB, AE | 99.97% | 99.94% |
| D-FES Reproduced | DNN | FS, DB, AE | 96.11% | 78.40% |
| Lee et al. [18] | SVM | FS, DB, AE | 98.22% | 98.21% |
| Parker et al. [19] | LR | AE | 98.04% | 98.01% |
| Caminero et al. [20] | RL | AE | 95.90% | 96.29% |
| Mikhail et al. [16] | Semi-boosted | FS, DB | 95.26% | 82.09% |
Disclaimer/Publisher’s Note: The statements, opinions and data contained in all publications are solely those of the individual author(s) and contributor(s) and not of MDPI and/or the editor(s). MDPI and/or the editor(s) disclaim responsibility for any injury to people or property resulting from any ideas, methods, instructions or products referred to in the content. |
© 2024 by the authors. Licensee MDPI, Basel, Switzerland. This article is an open access article distributed under the terms and conditions of the Creative Commons Attribution (CC BY) license (https://creativecommons.org/licenses/by/4.0/).
Share and Cite
Tseng, C.H.; Tsaur, W.-J.; Shen, Y.-M. Classification Tendency Difference Index Model for Feature Selection and Extraction in Wireless Intrusion Detection. Future Internet 2024, 16, 25. https://doi.org/10.3390/fi16010025
Tseng CH, Tsaur W-J, Shen Y-M. Classification Tendency Difference Index Model for Feature Selection and Extraction in Wireless Intrusion Detection. Future Internet. 2024; 16(1):25. https://doi.org/10.3390/fi16010025
Chicago/Turabian StyleTseng, Chinyang Henry, Woei-Jiunn Tsaur, and Yueh-Mao Shen. 2024. "Classification Tendency Difference Index Model for Feature Selection and Extraction in Wireless Intrusion Detection" Future Internet 16, no. 1: 25. https://doi.org/10.3390/fi16010025
APA StyleTseng, C. H., Tsaur, W.-J., & Shen, Y.-M. (2024). Classification Tendency Difference Index Model for Feature Selection and Extraction in Wireless Intrusion Detection. Future Internet, 16(1), 25. https://doi.org/10.3390/fi16010025