
RSSI and Device Pose Fusion for Fingerprinting-Based Indoor Smartphone Localization Systems

 , and
, and
Abstract
1. Introduction
1.1. Research Contribution
- A conceptual data-level framework is proposed that combines a smartphone’s device pose obtained from accelerometer measurements with the smartphone’s BLE RSSI for indoor fingerprinting localization.
- We employed cascaded neural networks to implement and evaluate the proposed framework’s model improvement (i.e., RSSI-only vs. RSSI-and-device-pose) via the neural network cross-entropy loss function improvement.
- We applied the Kolmogorov–Smirnov statistical test to link the accuracy improvement seen in the neural network implementation to the data distribution.
- We experimentally evaluated the localization accuracy improvement provided by the neural network implementation of the framework in an indoor environment.
- We demonstrate the robustness of the conceptual framework by also implementing it using K-Nearest Neighbour and Naïve Bayes algorithms showing the localization accuracy improvement.
1.2. Scope and Outline
2. Related Work and Motivation
3. Methodology
3.1. Proposed Framework
3.2. Cascaded Neural Network Implementation of Proposed Framework
- Because the RF-fingerprinting localization approach and phone’s device pose identification are both fundamentally pattern recognition problems, machine learning classifiers and in particular neural networks were a prime choice for implementation due to their robustness and generalization capabilities with noisy and uncertain data. The trends in the literature also indicate their increased adoption for indoor localization [2].
- The universal approximation theorem [21] for neural networks implies that a single hidden layer neural network with enough neurons can approximate any hyperfunction to an arbitrarily high accuracy, thereby forming arbitrary decision boundaries in the classification input space. Because the proposed framework changes the input data vector for classification, this makes neural networks a good candidate to evaluate the effect.
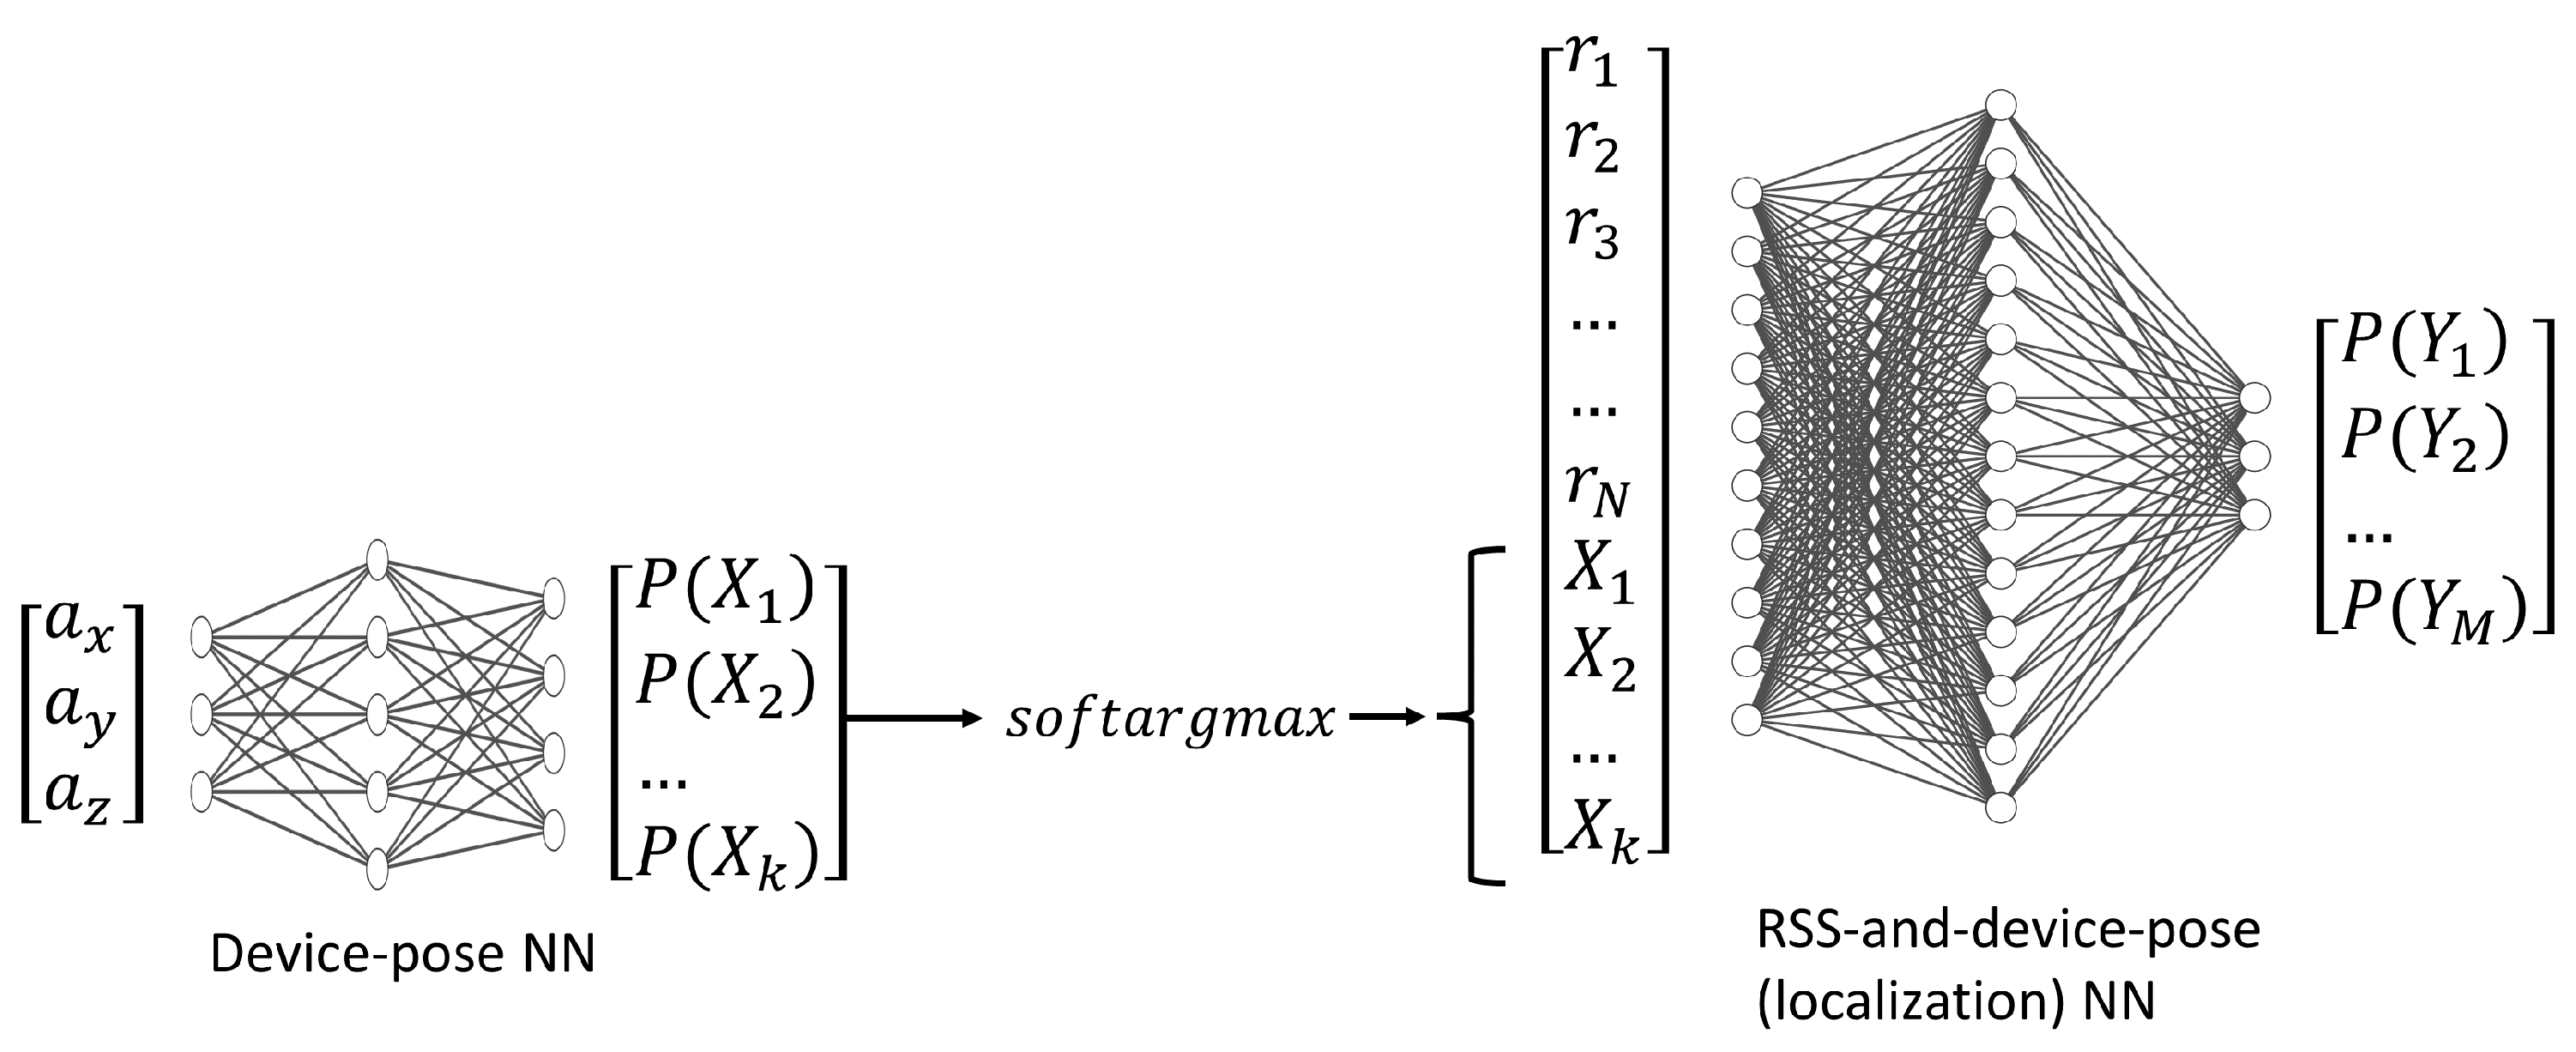
- RSSI-and-device-pose: In order to combine the device pose and RSSI data, a neural network was trained using the accelerometer data to produce a device pose classification (neural network on the left in Figure 4), and we added this binary output classification vector as additional dimensions to the RSSI vector (thus, . This projects the RSSI measurements from the different device poses onto orthogonal dimensions in the input space for the localization neural network. A second neural network (the neural network on the right in Figure 4) was then used on the combined RSSI-and-device-pose input vectors to produce the location output.
- RSSI-only: In contrast, an RSSI-only neural network was trained on to produce the location labels Y (only the neural on the right in Figure 4, with removed in the input vector).
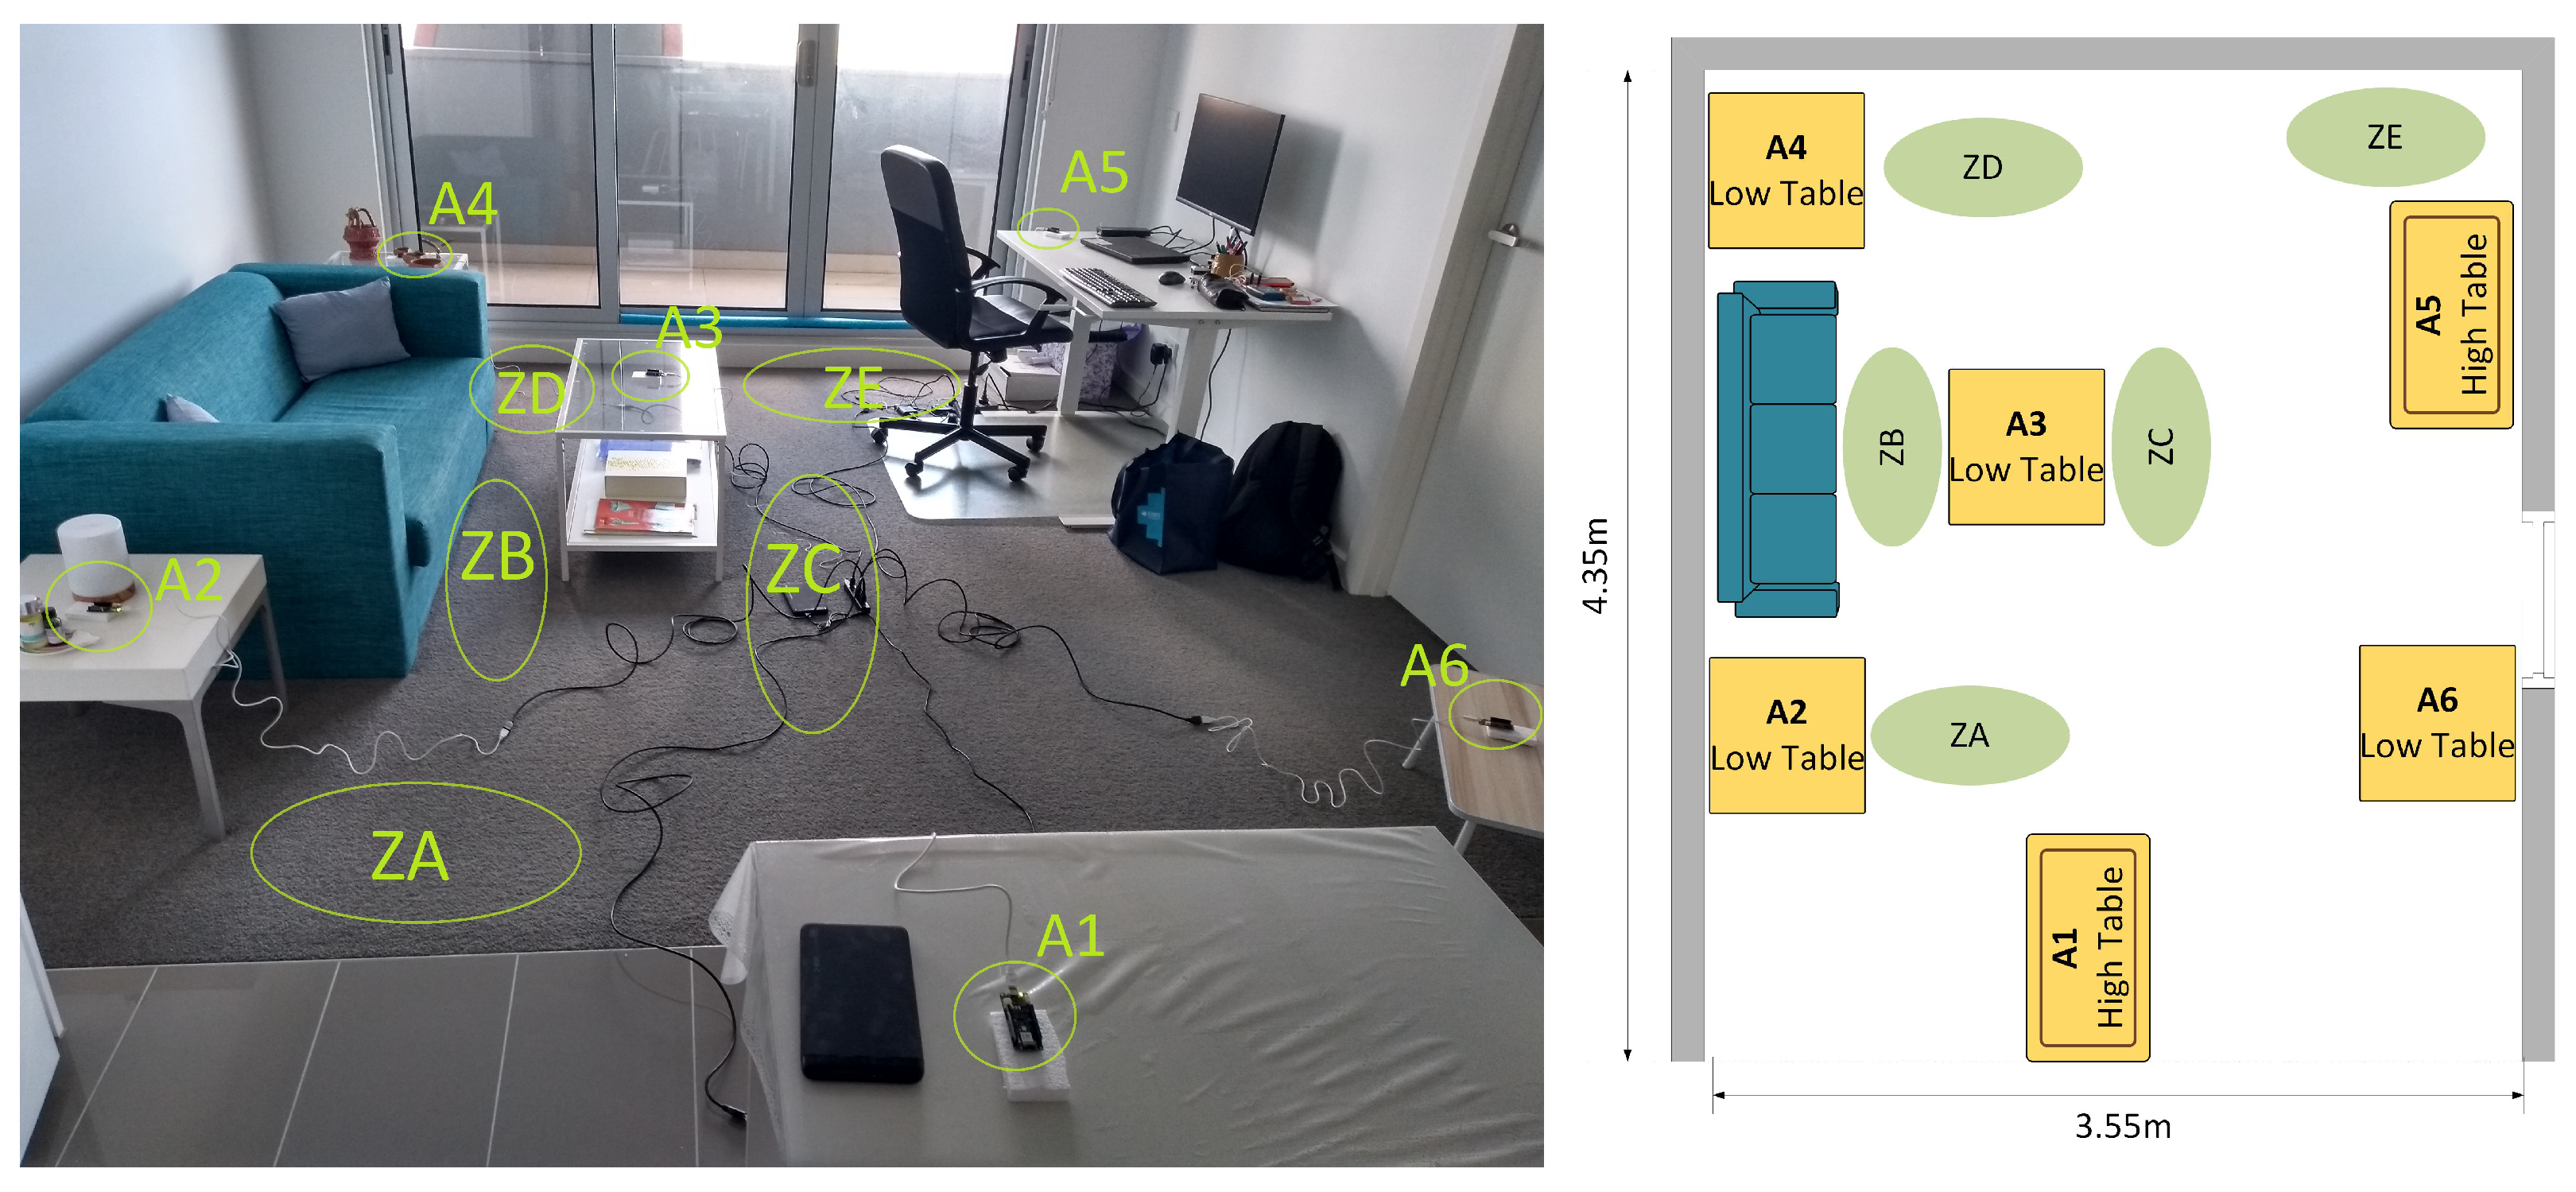
3.3. Experimental Setup
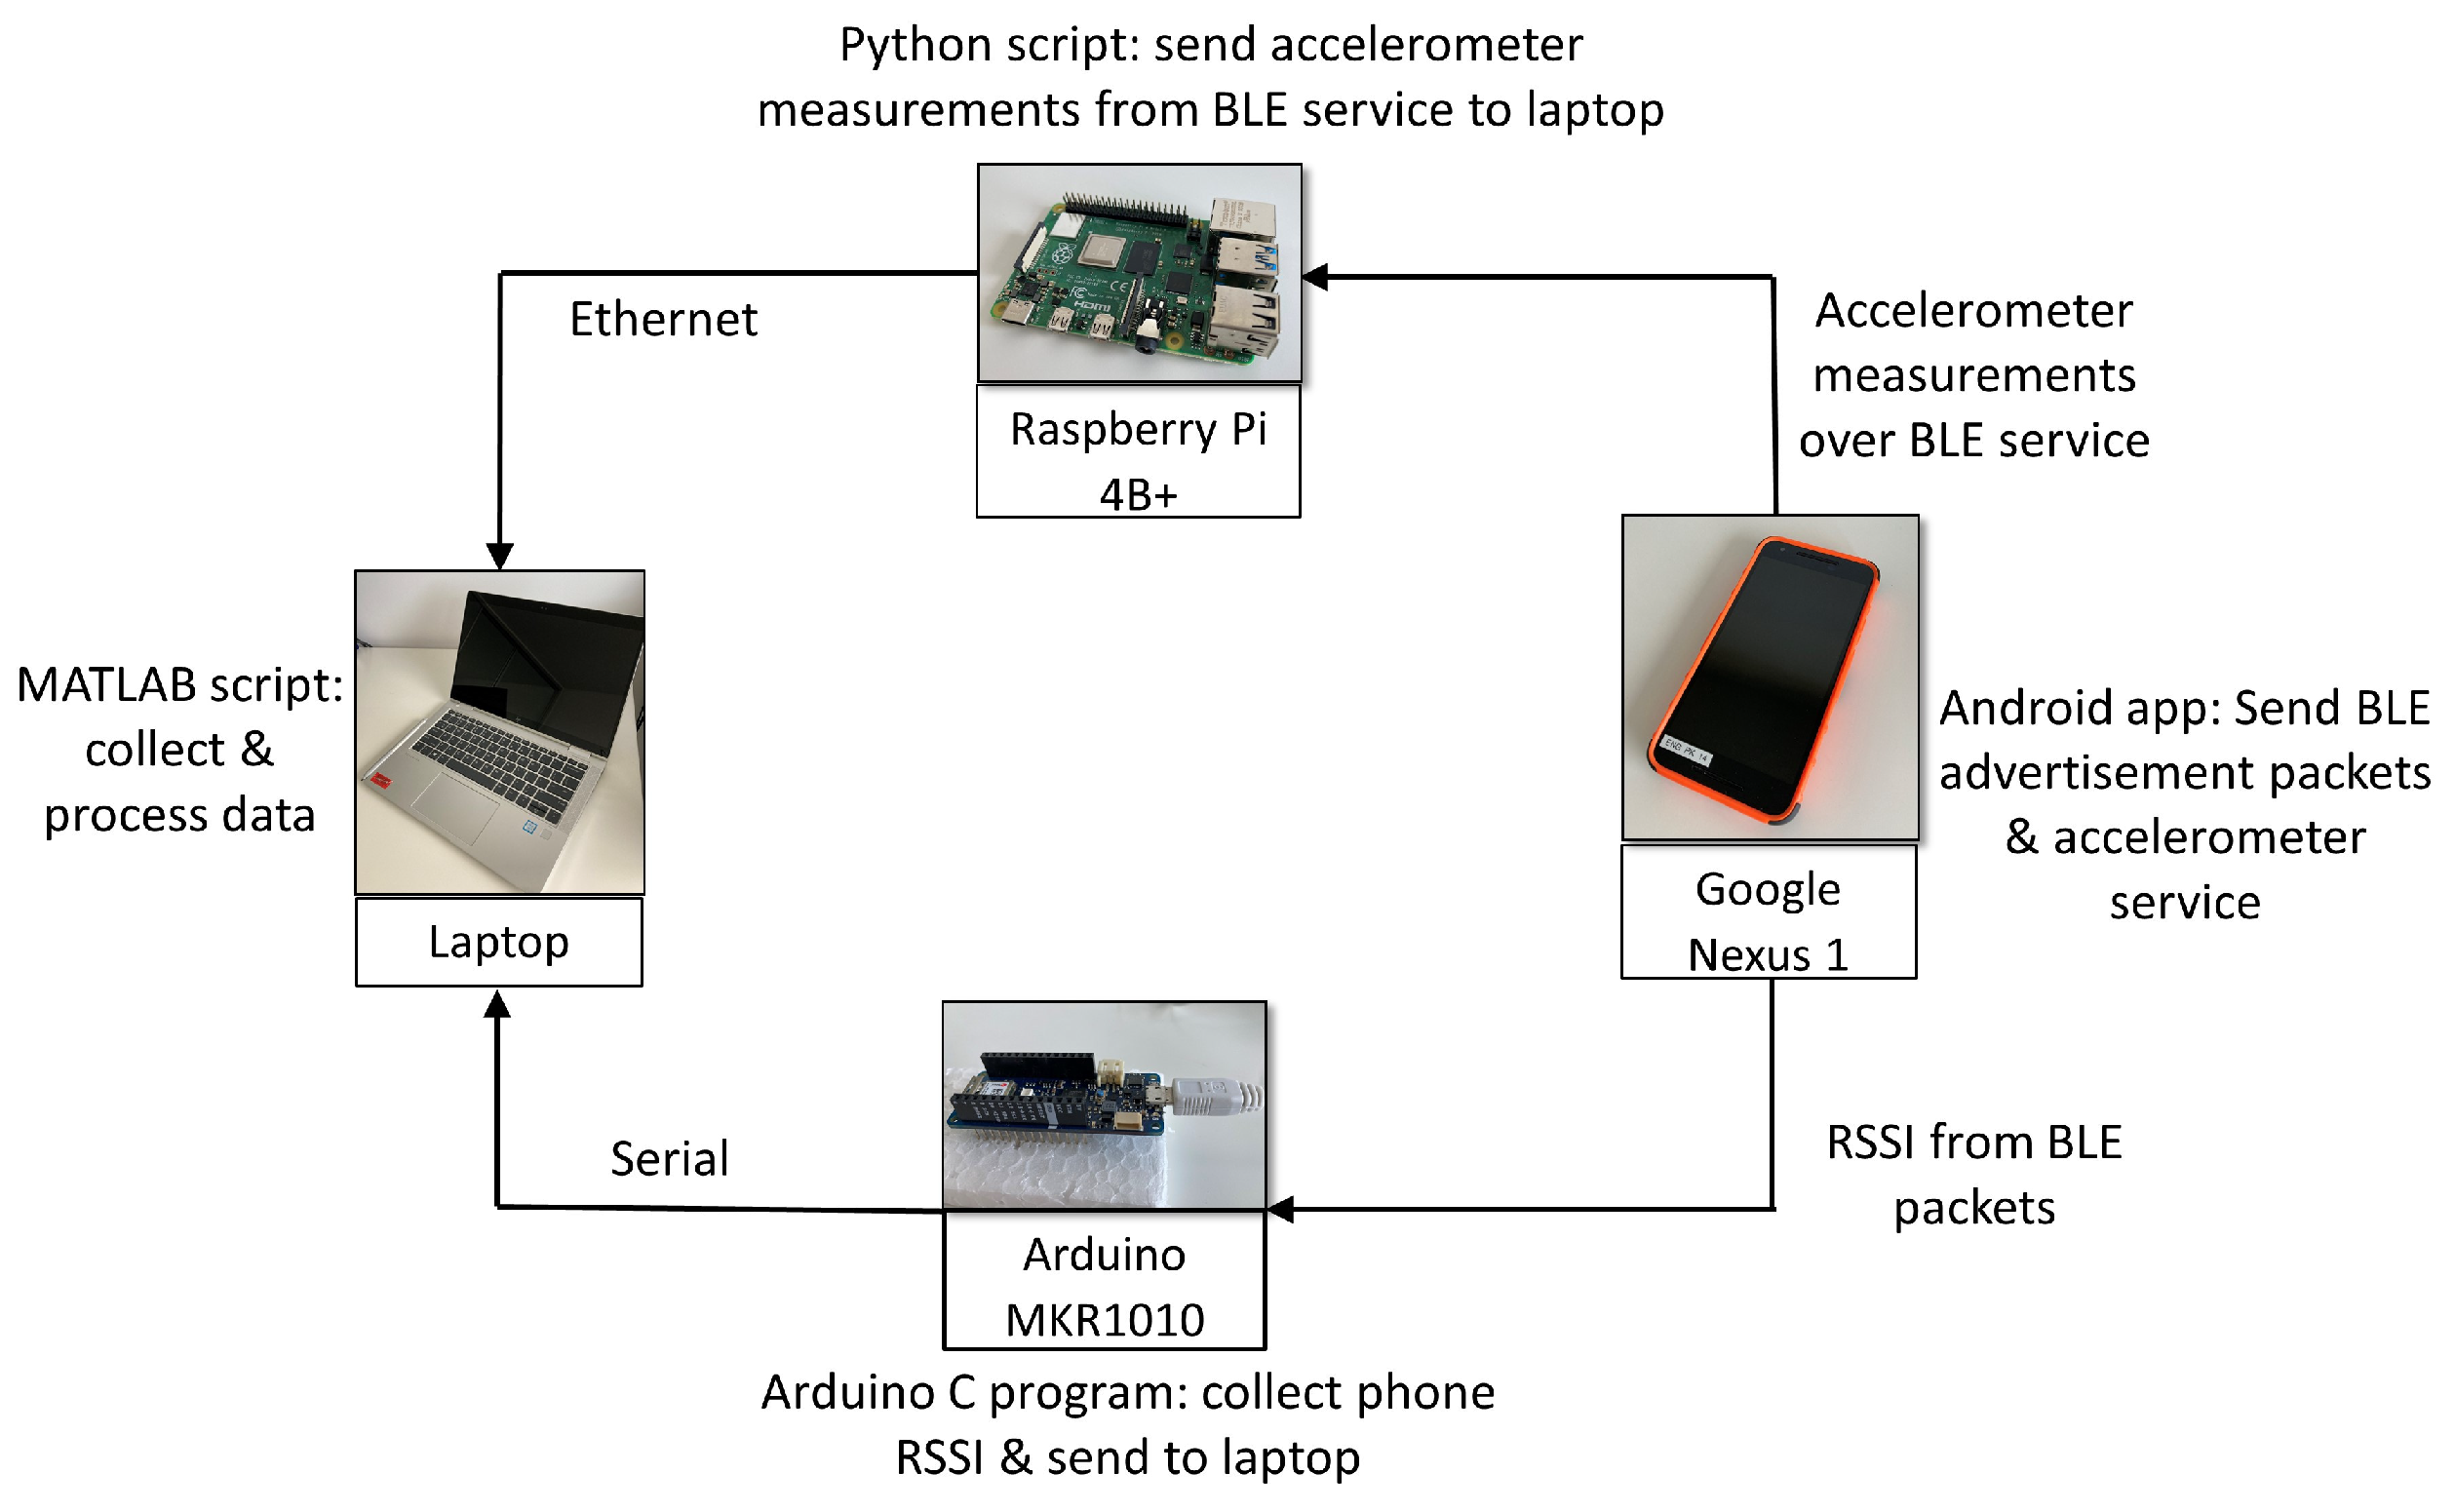
- RSSI data were obtained from the BLE advertisements of a Google Nexus 5X phone with Arduino MKR1010 microcontrollers employed as anchors. The standard ArduinoBLE library was used to obtain the phone’s BLE advertisement packet RSSI, which was then sent over a USB serial connection to an HP EliteBook x360 (Intel i5 quadcore with 8GB RAM) laptop running MATLAB 2022Rb.
- Accelerometer data were obtained from the BLE-notify messages of a Google Nexus 5X phone with a GATT client programmed on a RaspberryPi 4B+, which then sent the accelerometer measurements over UDP to the laptop. The RaspberryPi was used to offload the processing for receiving the higher sampling rate BLE-notify messages for the accelerometer service. The RaspberryPi’s clock was time-synced with the laptop with Network Time Protocol to ensure synchronized timestamps.
- A 1-element buffer was used to hold the RSSI vector. This buffer was filled before being considered the first complete RSSI vector. Therefore, every anchor returned at least one measurement from the beginning of the recording of the data file for the first valid RSSI vector to be recorded.
- After the first complete RSSI vector was recorded, as described above, every new RSSI value from an anchor was added to the 1-element buffer and the contents of the buffer recorded as a new RSSI vector. This simulated the behavior of systems that attempt a localization step every time a new RSSI measurement is received from an anchor.
- Because the accelerometer sampling rate was higher than the RSSI sampling rate, the accelerometer measurement closest in timestamp to the latest timestamp of the RSSI measurements in the buffer was recorded to be the accelerometer measurement corresponding to that RSSI vector.
4. Results and Analysis
4.1. RSSI Data Distribution
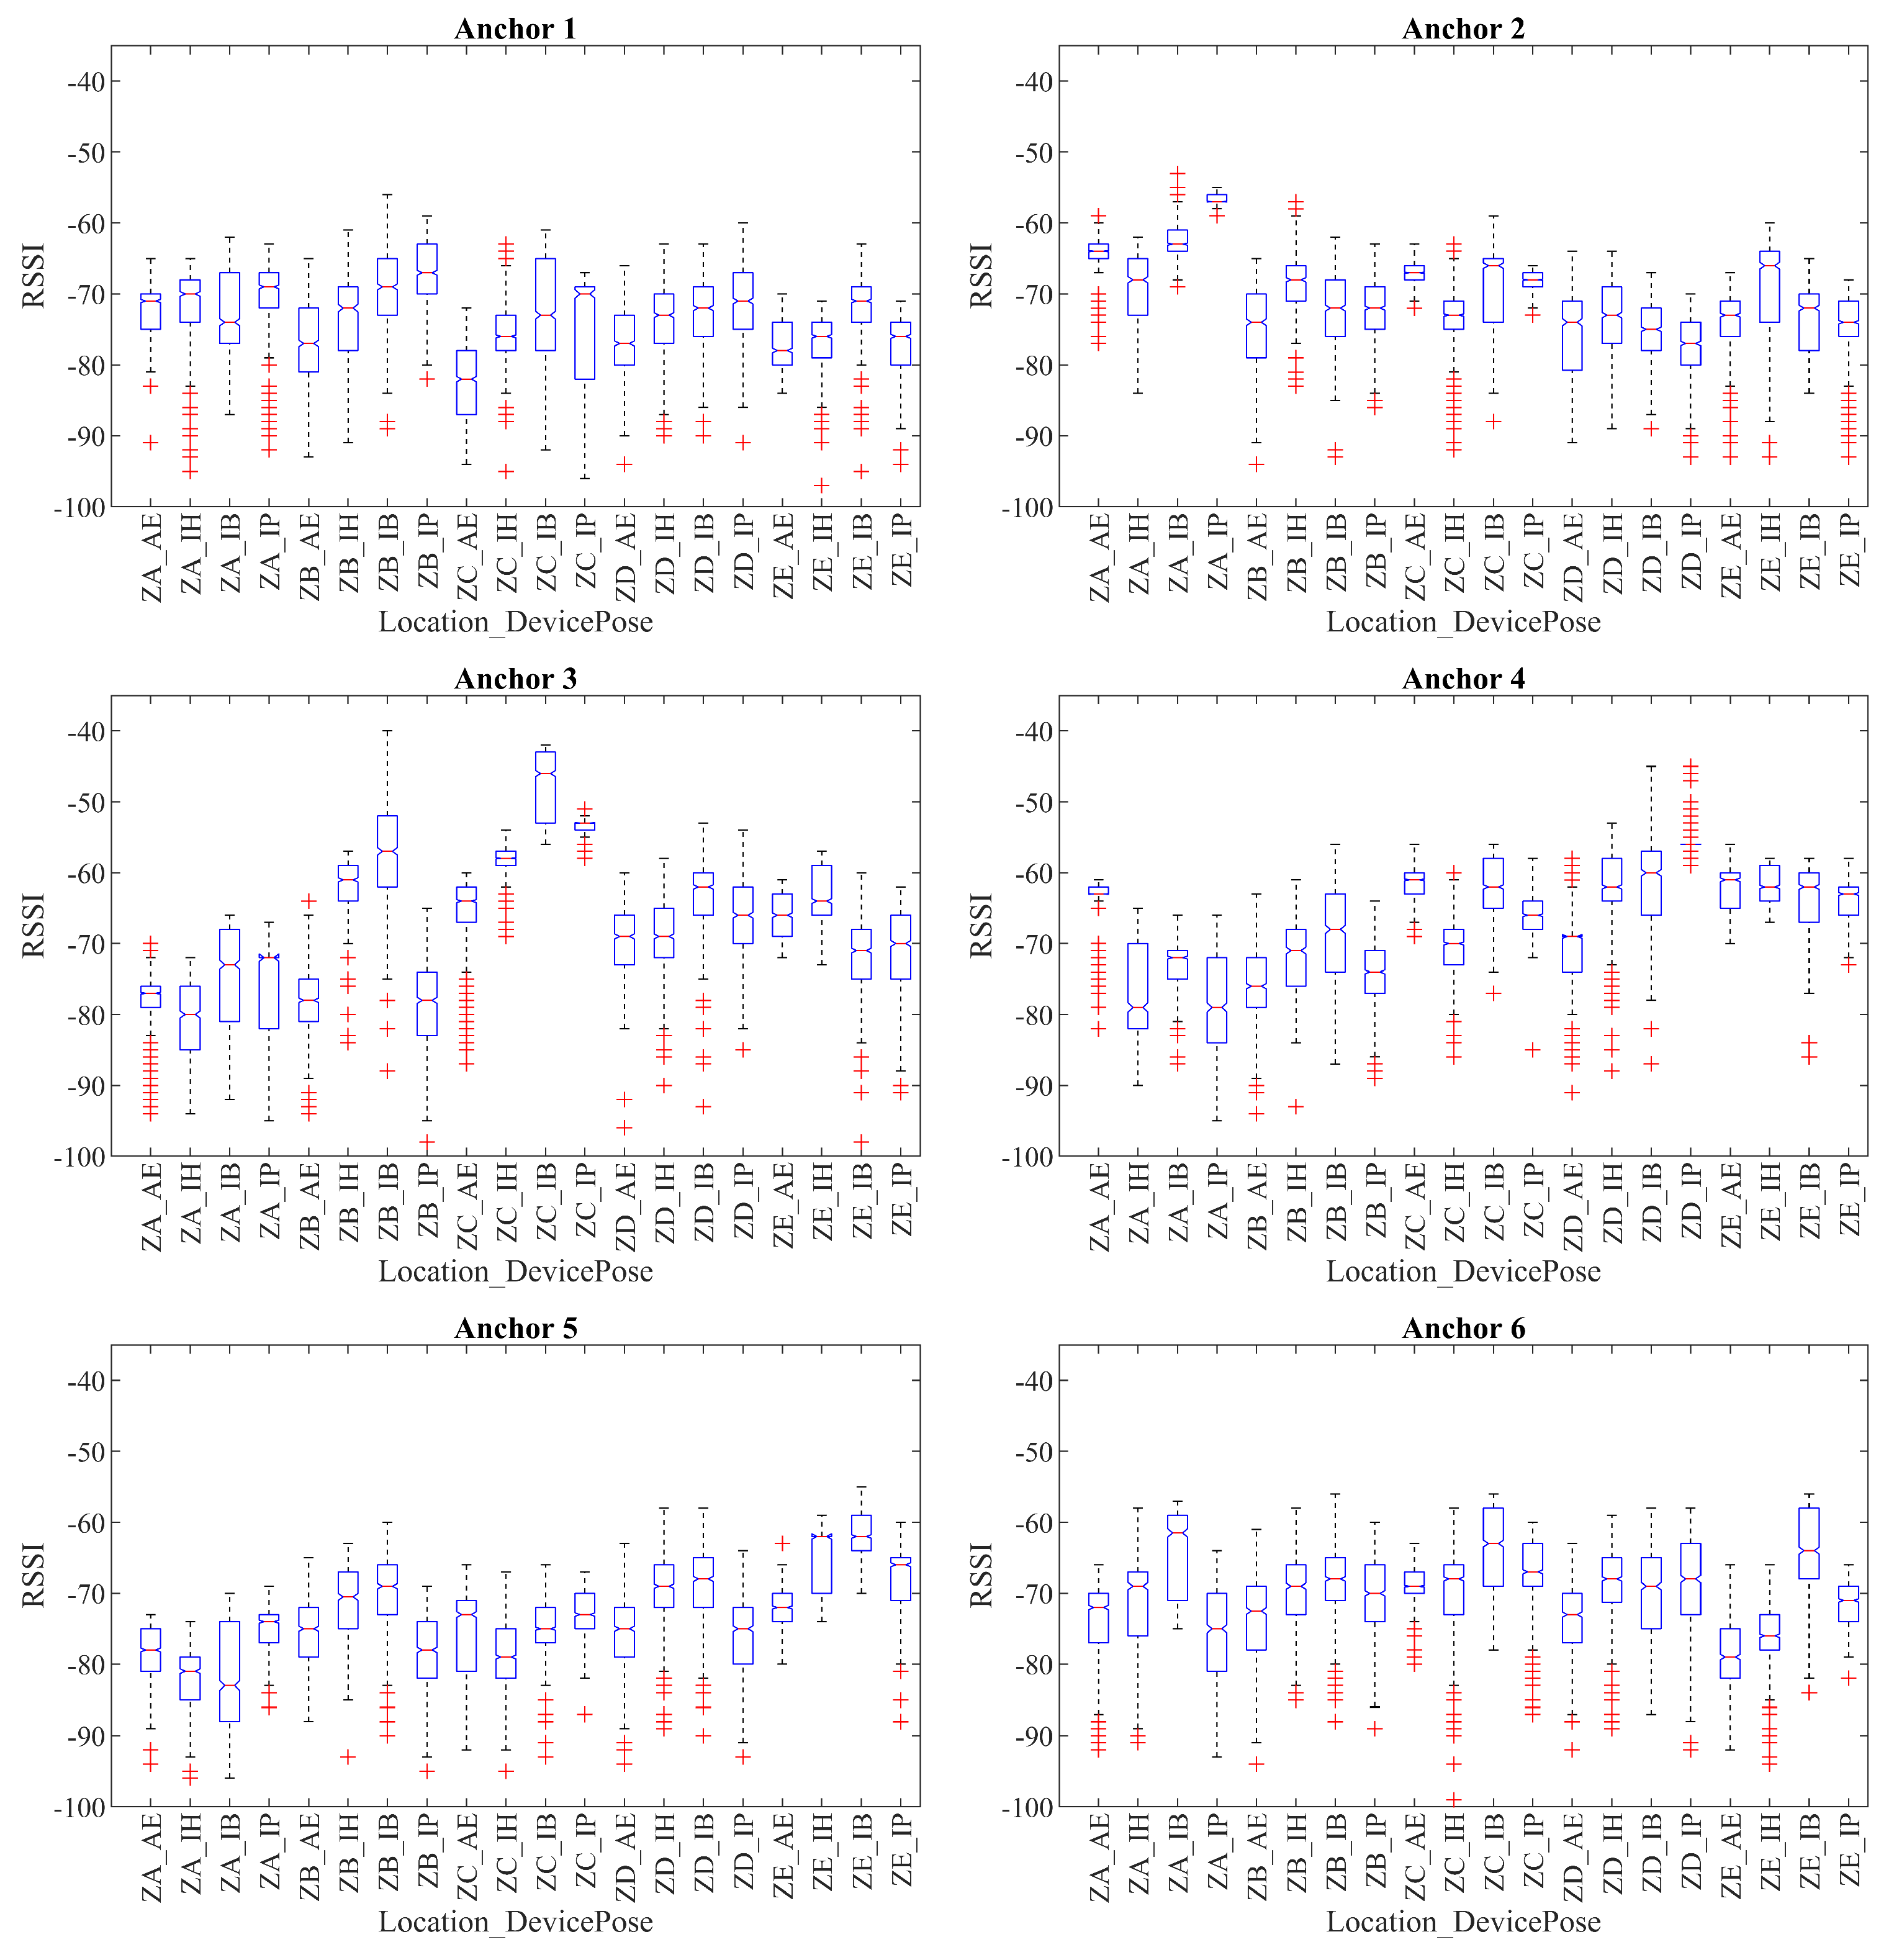
- Anchors closest to a location tended to have the highest RSSI: As mentioned in Section 3.3, each zone had a nearby anchor. The trend of an elevated median RSSI value at that zone for its nearest anchor is clearly depicted in Figure 8, where Anchor 2, Anchor 3, Anchor 4, and Anchor 5 have high median values for nearly every use case for their corresponding closest positions.
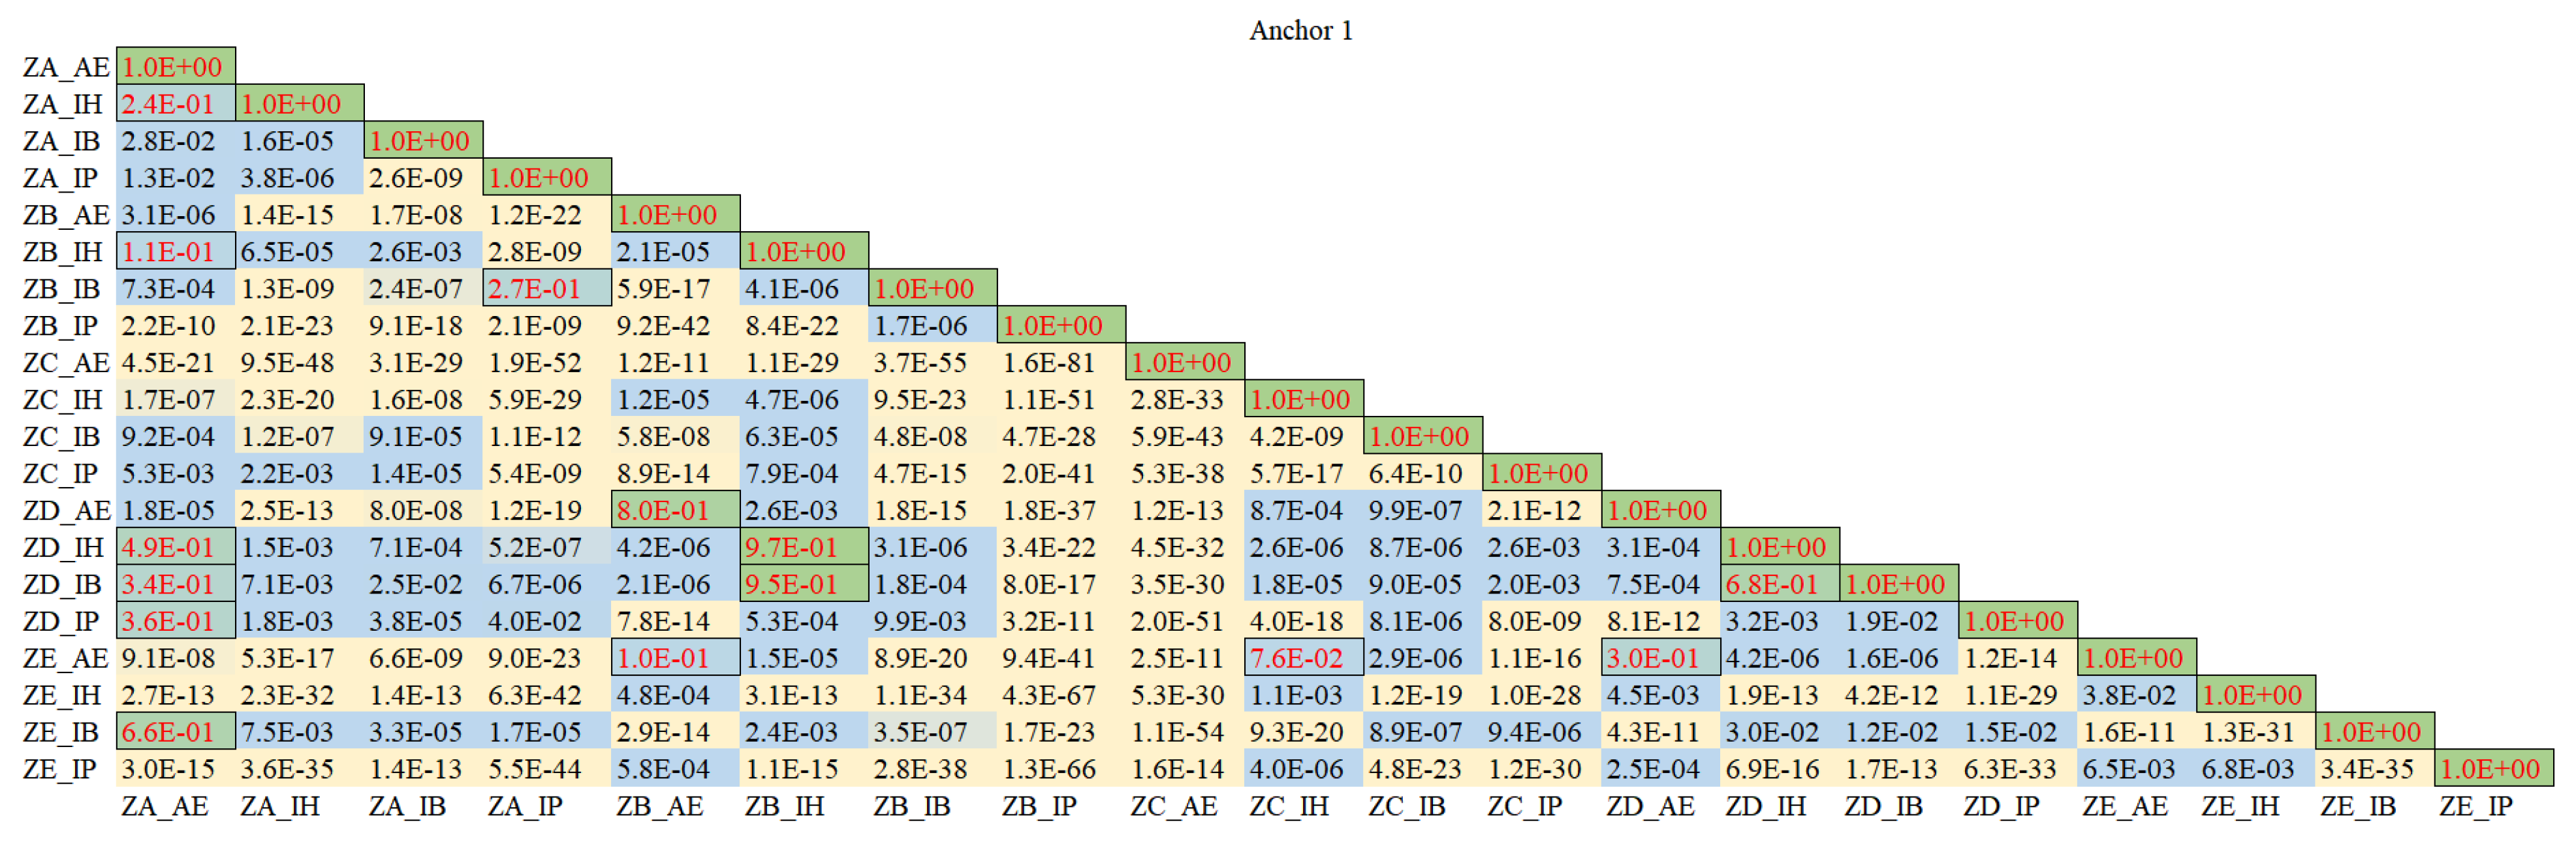
- RSSI variation due to device pose that resulted in distributions from different locations seemed alike: This trend encapsulates the premise of the proposed framework. For example, referring to column ZA_AE and row ZB_IH in Figure 9, the RSSI distribution for Anchor 1 in the static dataset while standing in the ZA zone and holding device AtEar leads to the null hypothesis acceptance of the KS test, implying that it is from the same RSSI distribution as the ZB zone while the device is held InHand (i.e., a KS test type II error for the distribution conditioned on location). Thus, based on the RSSI of Anchor 1 alone, it would be difficult to distinguish the ZA location from the ZB location while the phone is in those device poses. This would reduce the localization accuracy of any pattern recognition approach wherever Anchor 1’s distribution emerges as an important feature for classifying the ZA and ZB locations. Importantly, as Table 3 shows, the KS test has type II errors more often for RSSI distributions grouped by different locations (which would affect localization accuracy) than for distributions grouped in the same location (which would not affect localization accuracy).
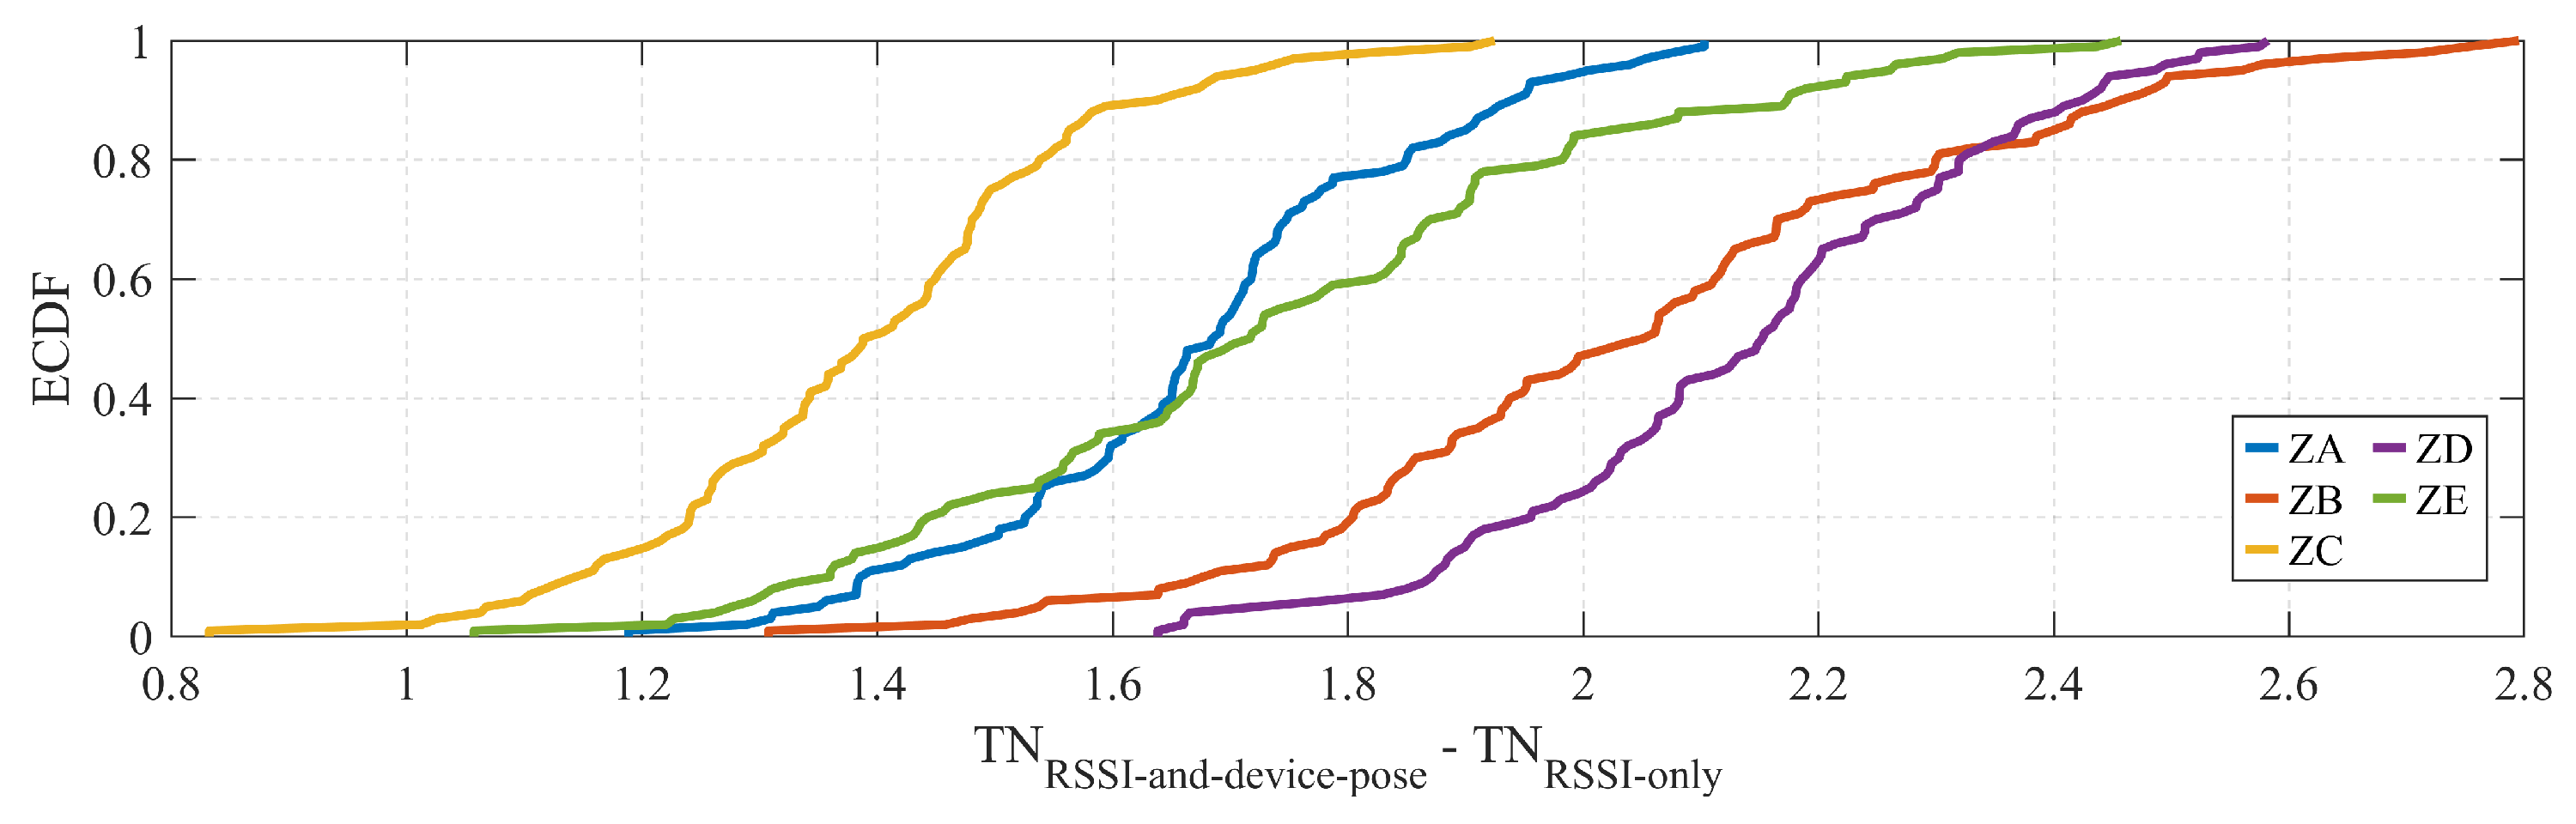
- Most KS test Type II errors involving ZB: From Table 3, looking at the zones with the three highest numbers of KS test type II errors (bold and underlined in the right-most column of the table), these are for ZB and ZD, and ZA and ZB. Therefore, given the hypothesis of this study, it could be predicted that adding device pose information likely results in the highest improved TN rates for zone ZB.
4.2. Device Pose Neural Network
4.3. RSSI-Only vs. RSSI-and-Device-Pose Neural Network Cross-Entropy Results
4.4. RSSI-Only vs. RSSI-and-Device-Pose Localization Results (NN)
4.5. KNN, NB and NN Localization Results for Proposed Framework
- KNN relies on the Euclidean distance, so its performance typically degrades in higher-dimensional spaces (i.e., the curse of dimensionality). As depicted in Figure 4, when the device pose was added to the RSSI vector, the input vector increased in dimensionality. Thus, for KNN, the RSSI-and-device-pose performance could be expected to be lower than that of RSSI-only. However, we found that the performance was slightly higher, indicating that useful information for a better model existed in the combined RSSI-and-device-pose input vectors.
- The naïve assumption of the NB algorithm presumes that the components of the input vector are independent. However, this is almost certainly untrue because any movement (e.g., in the dynamic files) affects the correlation between the anchor RSSI readings; and, importantly, the device pose affects the RSSI. It is possible that because the naïve assumption does not hold for the additional features in the RSSI-and-device-pose vector, the accuracy improvement is low.
5. Discussion
- The KS test statistics indicate that the device pose could contribute toward the RSSI distributions for the anchors having higher type II errors between zones (and hence a lower true negative rate for a class). This allowed for the prediction of zone ZB to be the zone that would result in the greatest TN rate improvement after the addition of device-pose information, which was the case in the neural network implementation of the framework.
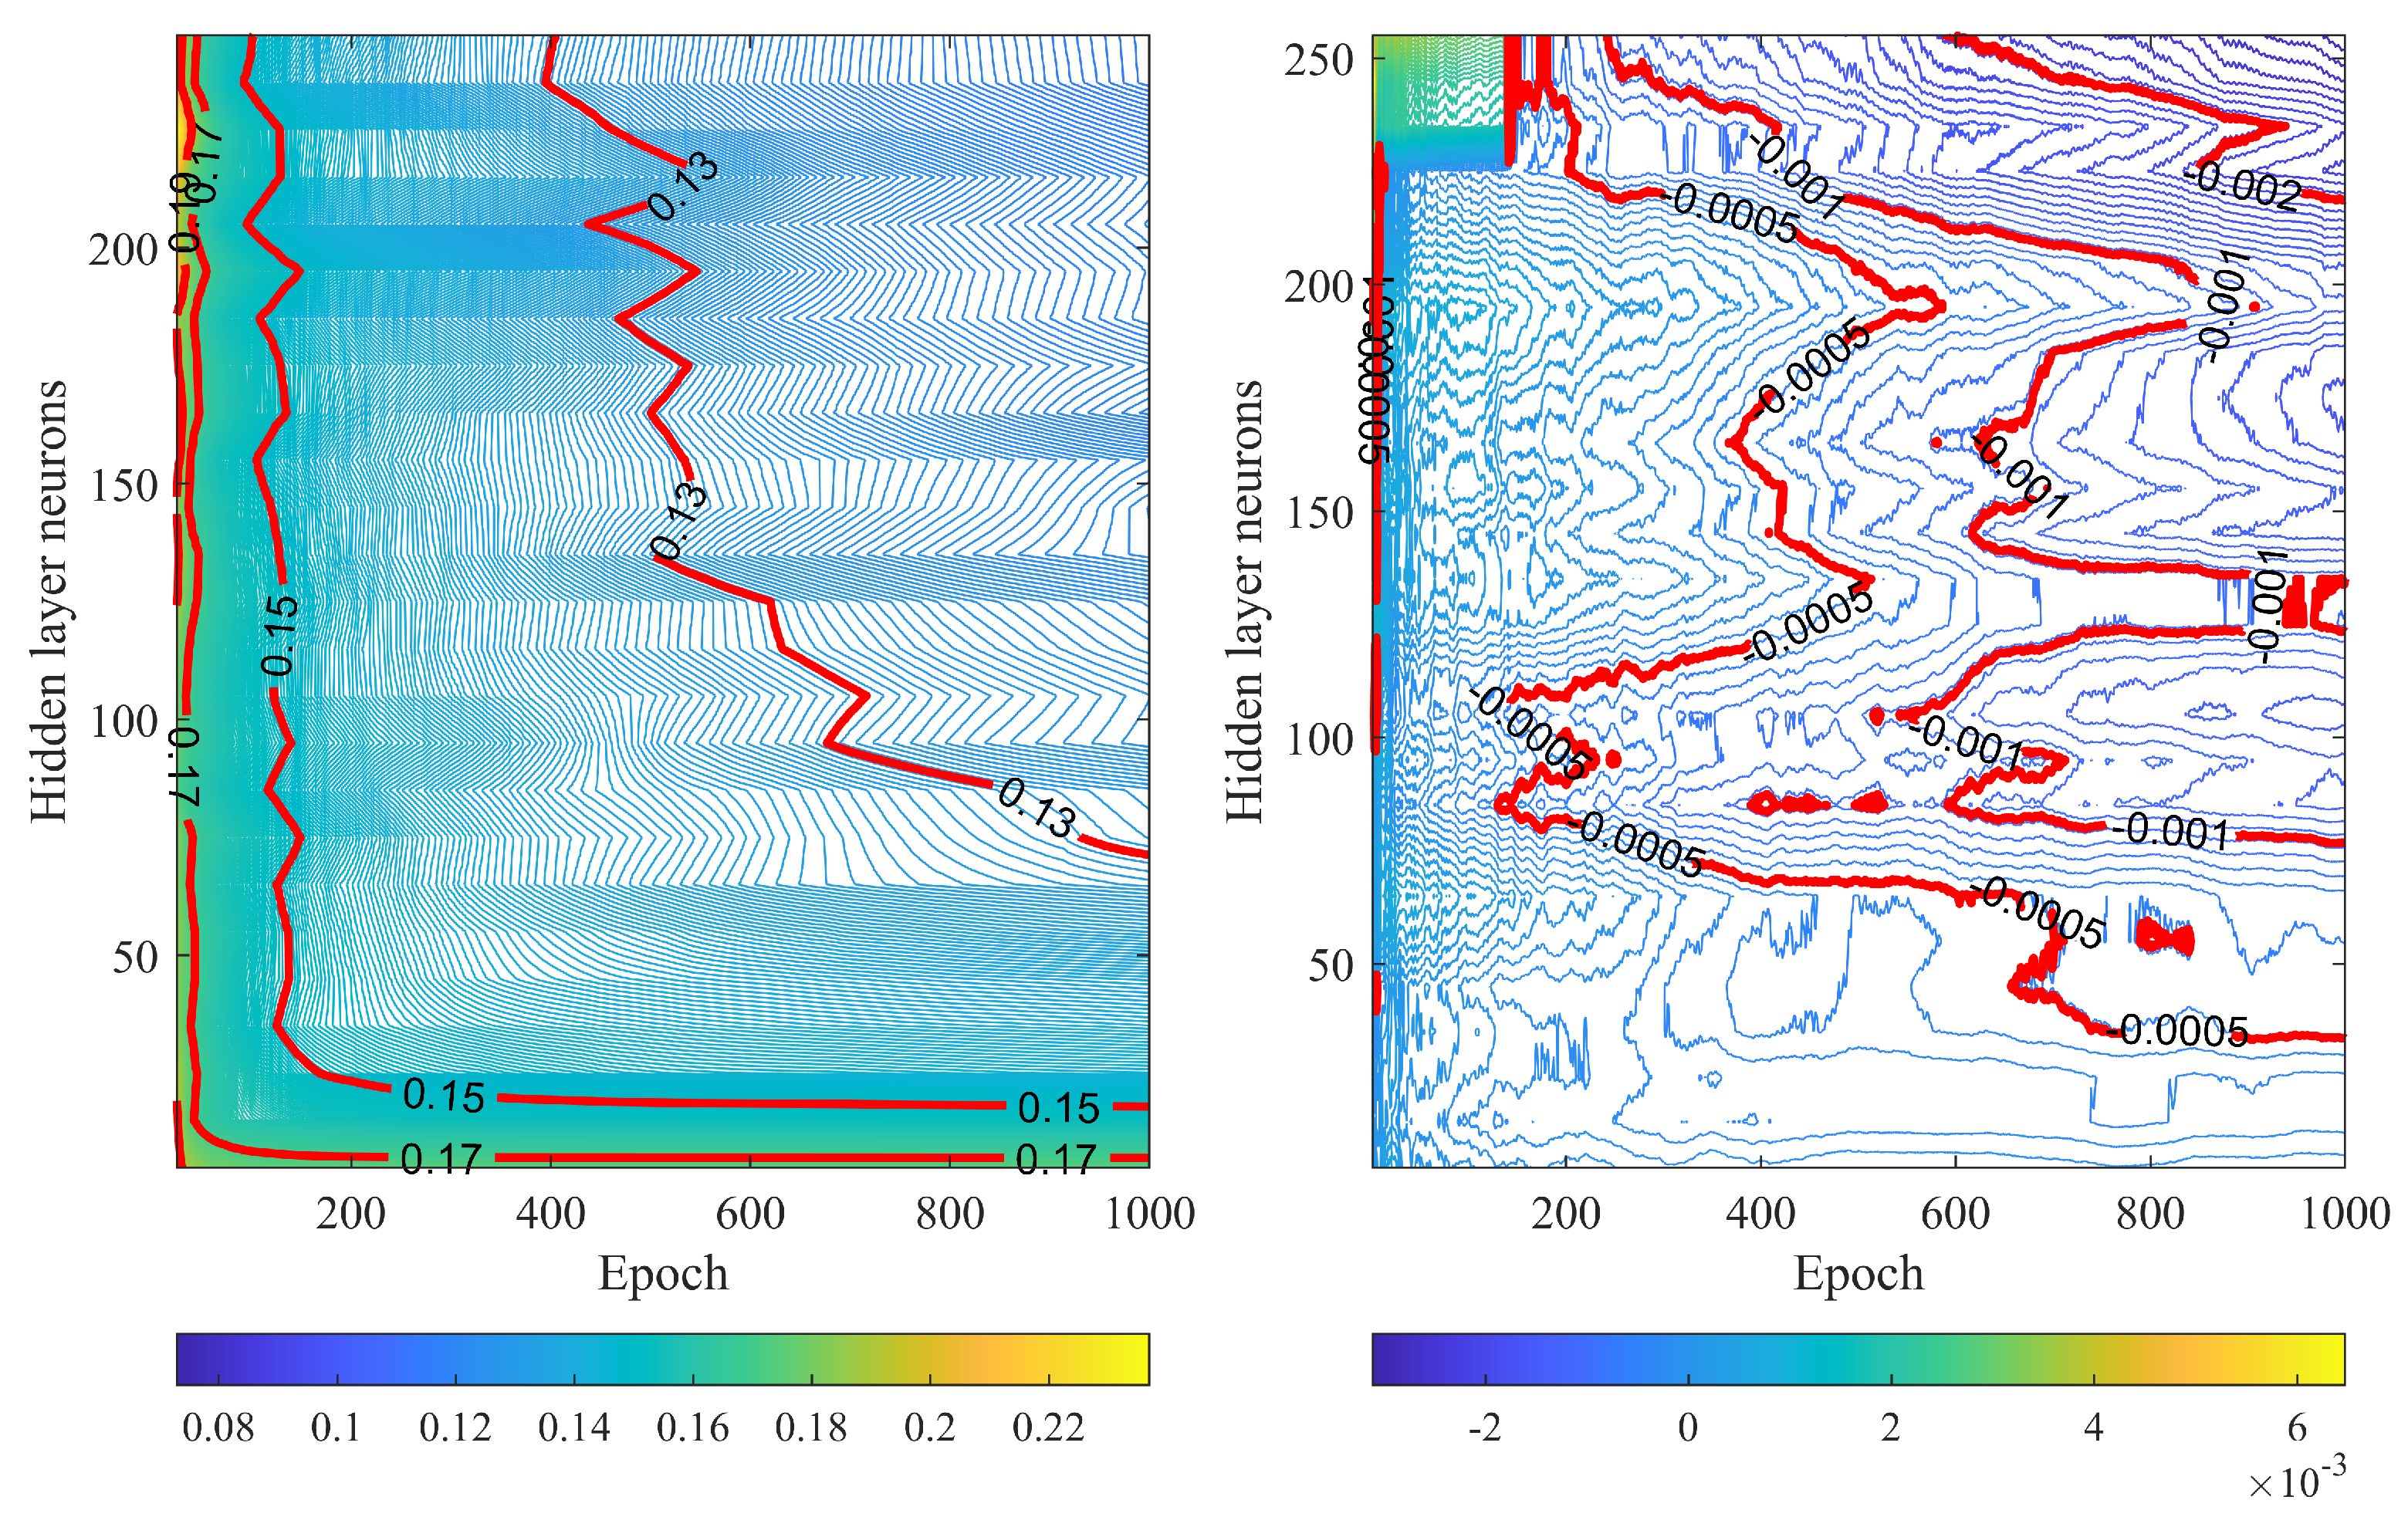
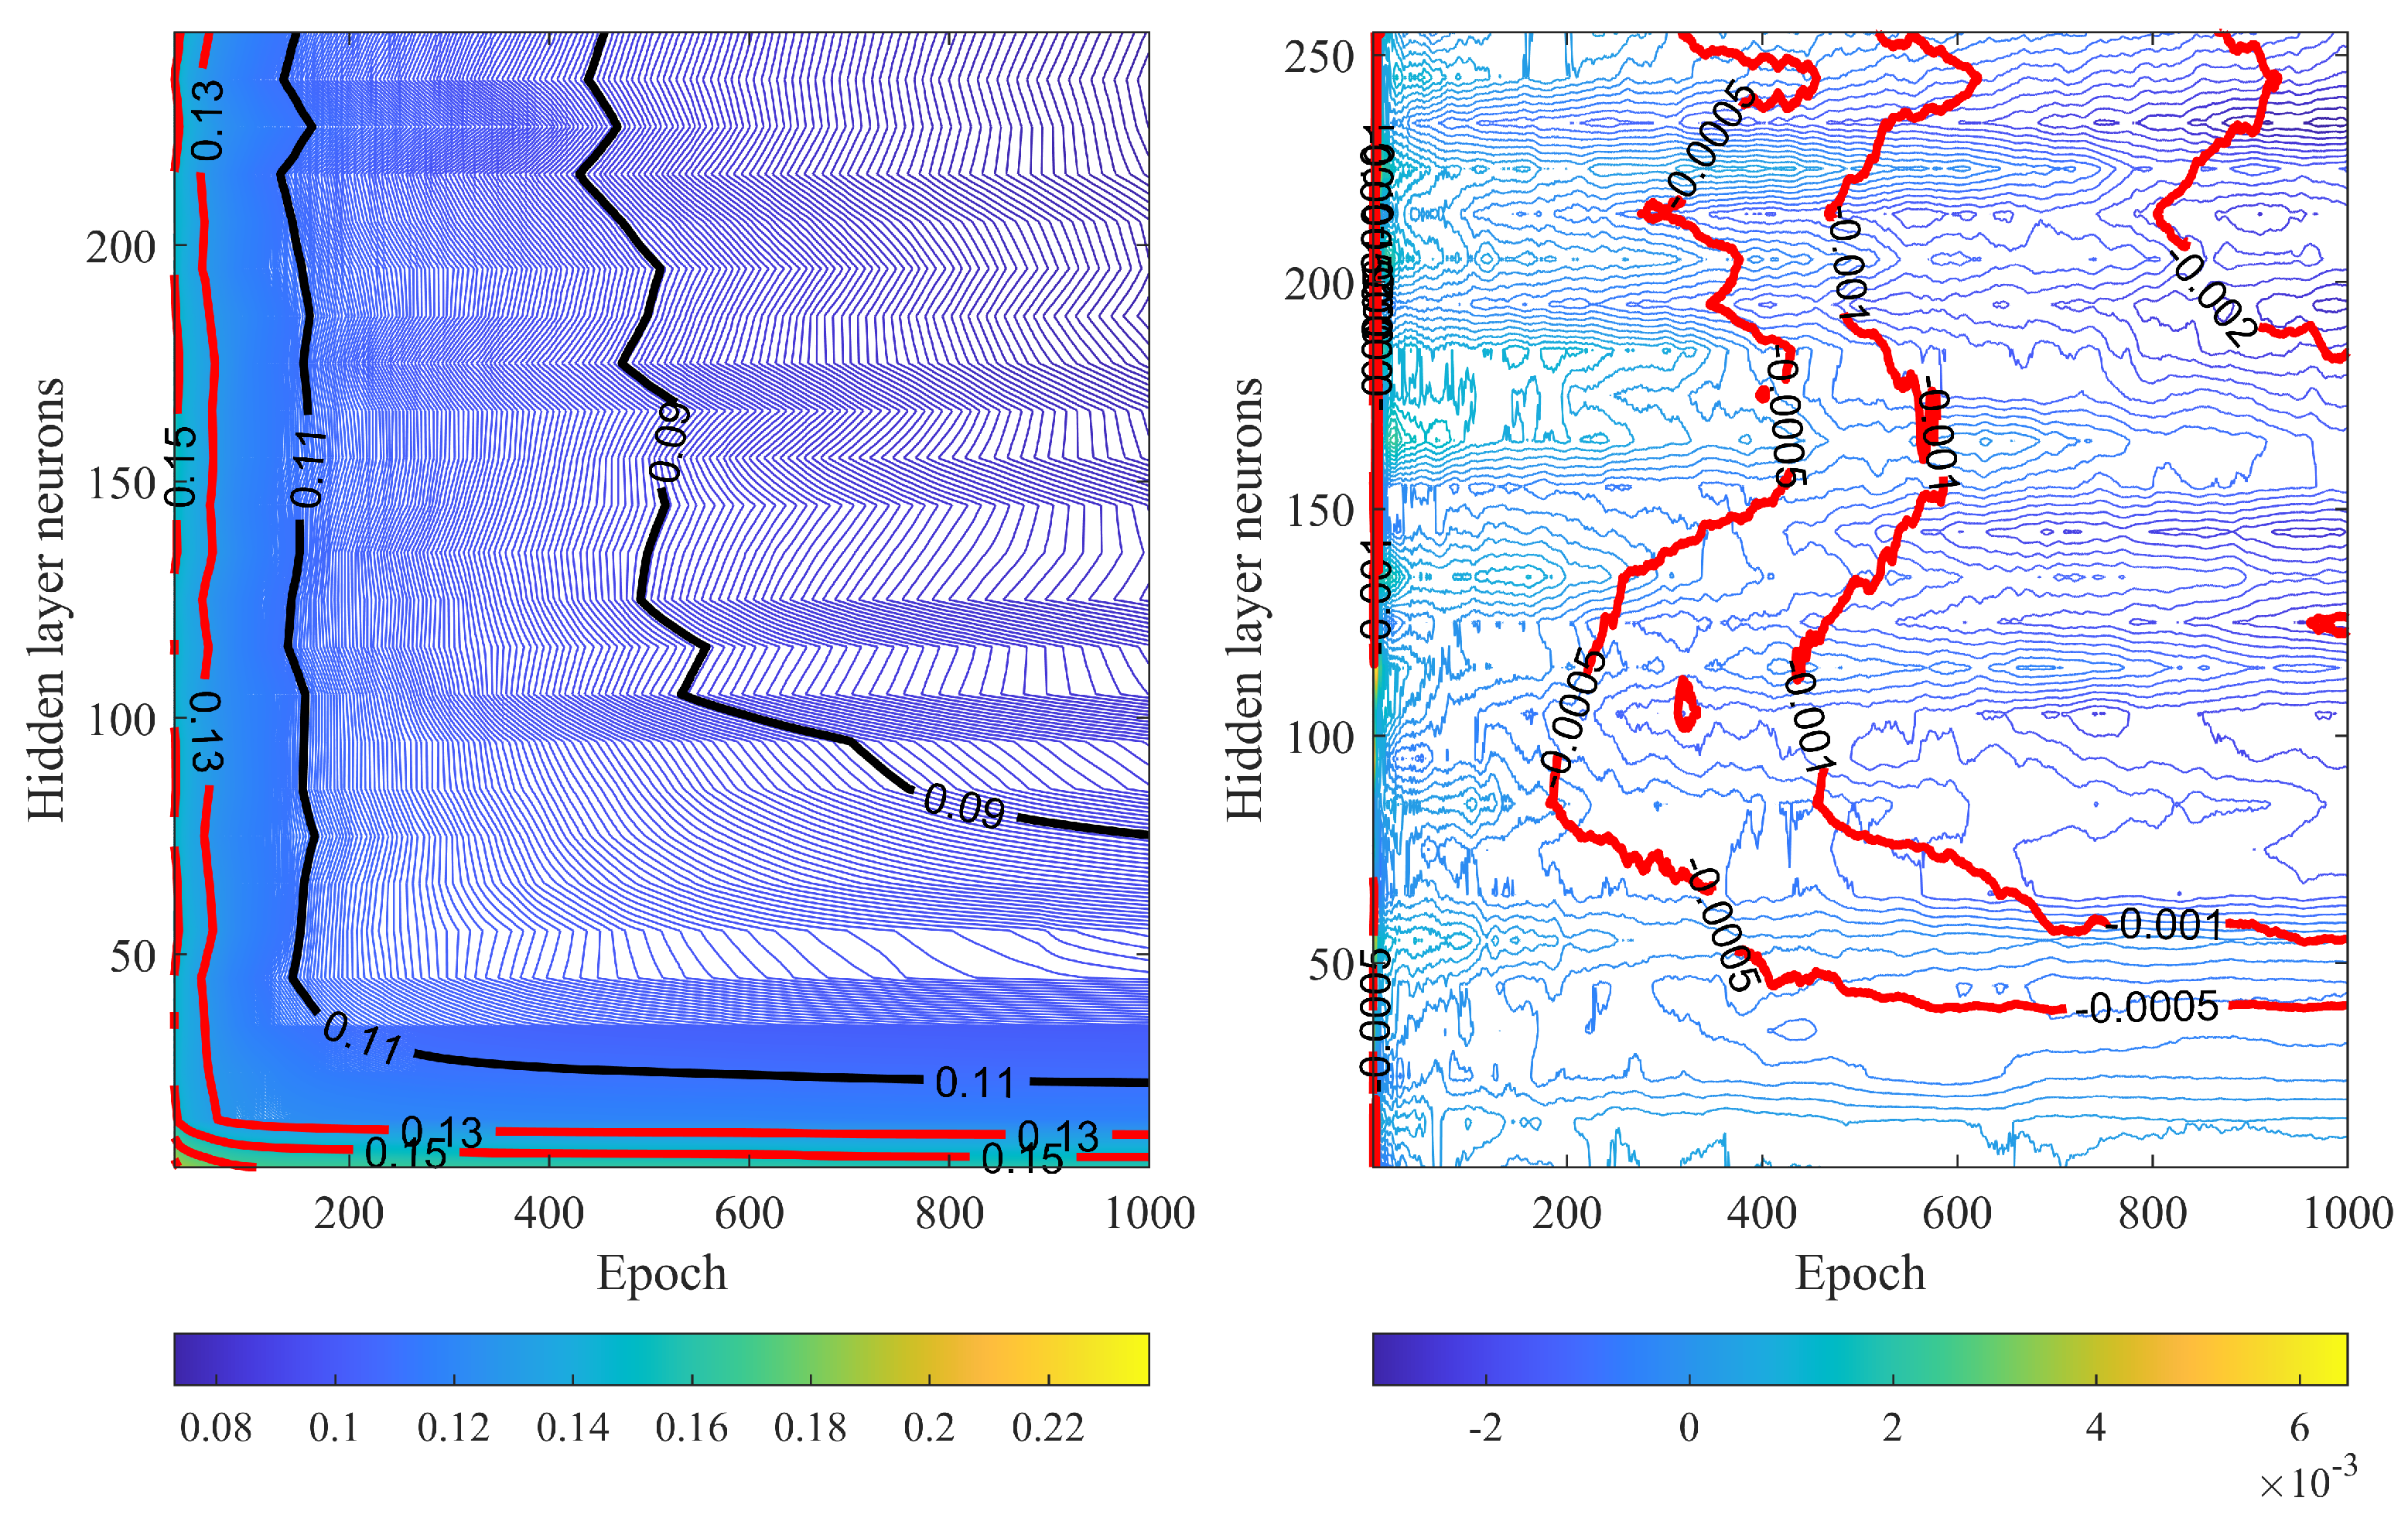
- The results of the hyperparameter sweep of the neural networks indicates that RSSI-and-device-pose achieved a lower with fewer neurons and with less epochs, indicating that a better model was learned when the RSSI vector was augmented with device-pose information
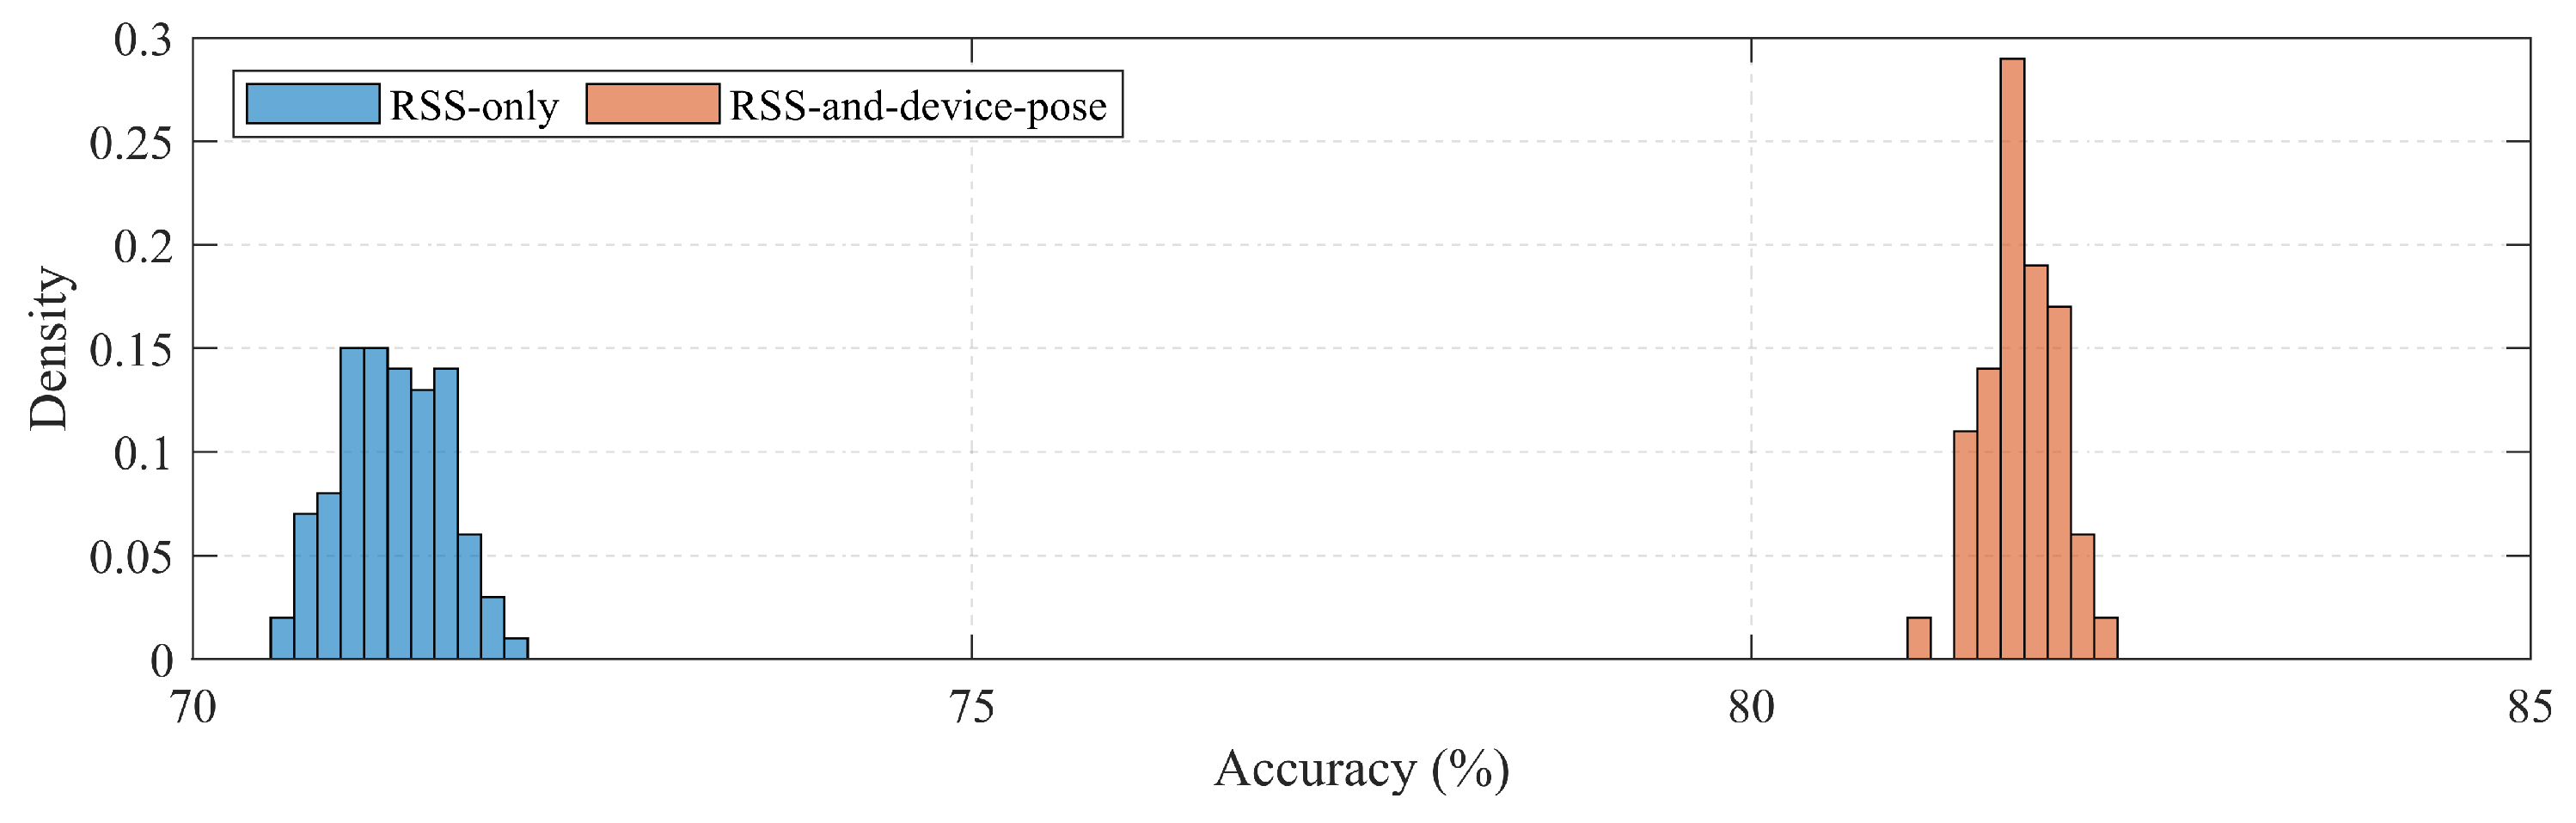
- The results of the 100 randomized runs of the RSSI-only and RSSI-and-device-pose neural networks indicate that the RSSI-and-device-pose consistently had higher classification accuracy. It should be noted that both these neural networks were equally sized and trained for the same number of epochs with the same training and testing vector dataset (with device-pose information added for the RSSI-and-device-pose neural network).
- With the framework implemented using other classification algorithms such as kNN and naïve Bayes, a consistent increase in accuracy was also seen but at lower rates.
- As mentioned in Section 4.2, the device-pose identification neural network is very small (five neurons). In the cascaded neural network runs on the collected dataset, the average difference in training time was 4.6% between the frameworks, and the average difference in inference time was less than 1 s. Thus, the accuracy improvement achieved came at a very low computational cost and memory overhead given the right selection of algorithm.
- In fingerprinting localization systems, RSSI-based zone classification is not carried out on the smartphone, as it does not hold the RSSI fingerprint database, but rather on a central system that holds the fingerprint database. If a method such as pedestrian dead reckoning (PDR) is to be used for improving the zoning accuracy, this means that either accelerometer or PDR (heading and velocity) measurements must be communicated to the central system, or the central system must communicate the zone classification to the smartphone for it to combine with the PDR data. In either case, some sort of PDR location/zoning information must be conveyed over a wireless channel that may be intercepted by a malicious actor, posing a significant privacy risk. However, for the proposed framework, it is possible to conduct device-pose identification on the smartphone using a small neural network that has been calibrated for the individual and to send only a standardized device-pose class to the central system. In this case, no zoning or PDR location data are communicated, avoiding the risk of being intercepted.
Author Contributions
Funding
Data Availability Statement
Conflicts of Interest
References
- Kasebzadeh, P.; Radnosrati, K.; Hendeby, G.; Gustafsson, F. Joint pedestrian motion state and device pose classification. IEEE Trans. Instrum. Meas. 2019, 69, 5862–5874. [Google Scholar] [CrossRef]
- Guo, X.; Ansari, N.; Hu, F.; Shao, Y.; Elikplim, N.R.; Li, L. A survey on fusion-based indoor positioning. IEEE Commun. Surv. Tutorials 2019, 22, 566–594. [Google Scholar] [CrossRef]
- He, S.; Long, H.; Zhang, W. Multi-antenna array-based aoa estimation using bluetooth low energy for indoor positioning. In Proceedings of the 2021 7th International Conference on Computer and Communications (ICCC), Chengdu, China, 10–13 December 2021; pp. 2160–2164. [Google Scholar]
- Fascista, A.; Coluccia, A.; Ricci, G. A Pseudo Maximum likelihood approach to position estimation in dynamic multipath environments. Signal Process. 2021, 181, 107907. [Google Scholar] [CrossRef]
- Zafari, F.; Gkelias, A.; Leung, K.K. A survey of indoor localization systems and technologies. IEEE Commun. Surv. Tutor. 2019, 21, 2568–2599. [Google Scholar] [CrossRef]
- Feng, D.; Wang, C.; He, C.; Zhuang, Y.; Xia, X.G. Kalman-filter-based integration of IMU and UWB for high-accuracy indoor positioning and navigation. IEEE Internet Things J. 2020, 7, 3133–3146. [Google Scholar] [CrossRef]
- Ali, R.; Liu, R.; Nayyar, A.; Qureshi, B.; Cao, Z. Tightly Coupling Fusion of UWB Ranging and IMU Pedestrian Dead Reckoning for Indoor Localization. IEEE Access 2021, 9, 164206–164222. [Google Scholar] [CrossRef]
- Kozlowski, M.; Santos-Rodriguez, R.; Piechocki, R. Sensor modalities and fusion for robust indoor localisation. EAI Endorsed Trans. Ambient. Syst. 2019, 6, e5. [Google Scholar] [CrossRef]
- Zhou, B.; Elbadry, M.; Gao, R.; Ye, F. Towards scalable indoor map construction and refinement using acoustics on smartphones. IEEE Trans. Mob. Comput. 2019, 19, 217–230. [Google Scholar] [CrossRef]
- Mahfouz, S.; Mourad-Chehade, F.; Honeine, P.; Farah, J.; Snoussi, H. Target tracking using machine learning and Kalman filter in wireless sensor networks. IEEE Sens. J. 2014, 14, 3715–3725. [Google Scholar] [CrossRef]
- Ashraf, I.; Hur, S.; Park, Y. Smartphone Sensor Based Indoor Positioning: Current Status, Opportunities, and Future Challenges. Electronics 2020, 9, 891. [Google Scholar] [CrossRef]
- Davidson, P.; Piché, R. A survey of selected indoor positioning methods for smartphones. IEEE Commun. Surv. Tutor. 2016, 19, 1347–1370. [Google Scholar] [CrossRef]
- Ng, P.C.; Spachos, P.; She, J.; Plataniotis, K. A Kernel Method to Nonlinear Location Estimation with RSS-based Fingerprint. IEEE Trans. Mob. Comput. 2022. Early Access. [Google Scholar] [CrossRef]
- Mamun, M.A.A.; Anaya, D.V.; Wu, F.; Yuce, M.R. Landmark-Assisted Compensation of User’s Body Shadowing on RSSI for Improved Indoor Localisation with Chest-Mounted Wearable Device. Sensors 2021, 21, 5405. [Google Scholar] [CrossRef] [PubMed]
- Faragher, R.; Harle, R. An analysis of the accuracy of bluetooth low energy for indoor positioning applications. In Proceedings of the 27th International Technical Meeting of The Satellite Division of the Institute of Navigation (ION GNSS+ 2014), Tampa, FL, USA, 8–12 September 2014; pp. 201–210. [Google Scholar]
- Tsanousa, A.; Xefteris, V.R.; Meditskos, G.; Vrochidis, S.; Kompatsiaris, I. Combining rssi and accelerometer features for room-level localization. Sensors 2021, 21, 2723. [Google Scholar] [CrossRef] [PubMed]
- Filus, K.; Nowak, S.; Domańska, J.; Duda, J. Cost-effective filtering of unreliable proximity detection results based on BLE RSSI and IMU readings using smartphones. Sci. Rep. 2022, 12, 2440. [Google Scholar] [CrossRef] [PubMed]
- Motani, K.; Wong, K.; Kamijo, S. Classifying Human Activity and Smartphone Holding Mode Using Accelerometer and Gyroscope. In Proceedings of the 2019 IEEE 8th Global Conference on Consumer Electronics (GCCE), Osaka, Japan, 15–18 October 2019; pp. 11–12. [Google Scholar]
- Guiry, J.J.; Karr, C.J.; van de Ven, P.; Nelson, J.; Begale, M. A single vs. multi-sensor approach to enhanced detection of smartphone placement. In Proceedings of the 2014 36th Annual International Conference of the IEEE Engineering in Medicine and Biology Society, Chicago, IL, USA, 26–30 August 2014; pp. 3691–3694. [Google Scholar]
- Shoaib, M.; Bosch, S.; Incel, O.D.; Scholten, H.; Havinga, P.J. Fusion of smartphone motion sensors for physical activity recognition. Sensors 2014, 14, 10146–10176. [Google Scholar] [CrossRef] [PubMed]
- Cybenko, G. Approximation by superpositions of a sigmoidal function. Math. Control Signals Syst. 1989, 2, 303–314. [Google Scholar] [CrossRef]
- Bluetooth SIG. Bluetooth Core Specification v5.1; Bluetooth SIG: Kirkland, DC, USA, 2019. [Google Scholar]
- Press, W.H.; Teukolsky, S.A. Kolmogorov-Smirnov Test for Two-Dimensional Data: How to tell whether a set of (x, y) data paints are consistent with a particular probability distribution, or with another data set. Comput. Phys. 1988, 2, 74–77. [Google Scholar] [CrossRef]
- Khan, I.M.; Sun, S.; Rowe, W.S.; Thompson, A.; Al-Hourani, A.; Sithamparanathan, K. Comparison of classifiers for use case detection using onboard smartphone sensors. In Proceedings of the 2022 32nd International Telecommunication Networks and Applications Conference (ITNAC), Wellington, New Zealand, 30 November–2 December 2022; pp. 261–266. [Google Scholar]
- Manning, C.D. An Introduction to Information Retrieval; Cambridge University Press: Cambridge, UK, 2009; p. 299. [Google Scholar]


| Framework | Advantages | Disadvantages |
|---|---|---|
| Pedestrian dead reckoning (PDR) fusion with RSSI using standard data fusion algorithms (e.g., Kalman filter) [6,9,10] |
|
|
| Accelerometer-based activity recognition for: | Practical due to absence of constraints on carrying smartphone |
| Setup in [17] | Setup in This Study | |
|---|---|---|
| Number of zones | 5 | 5 |
| Number of anchors | 5 | 6 |
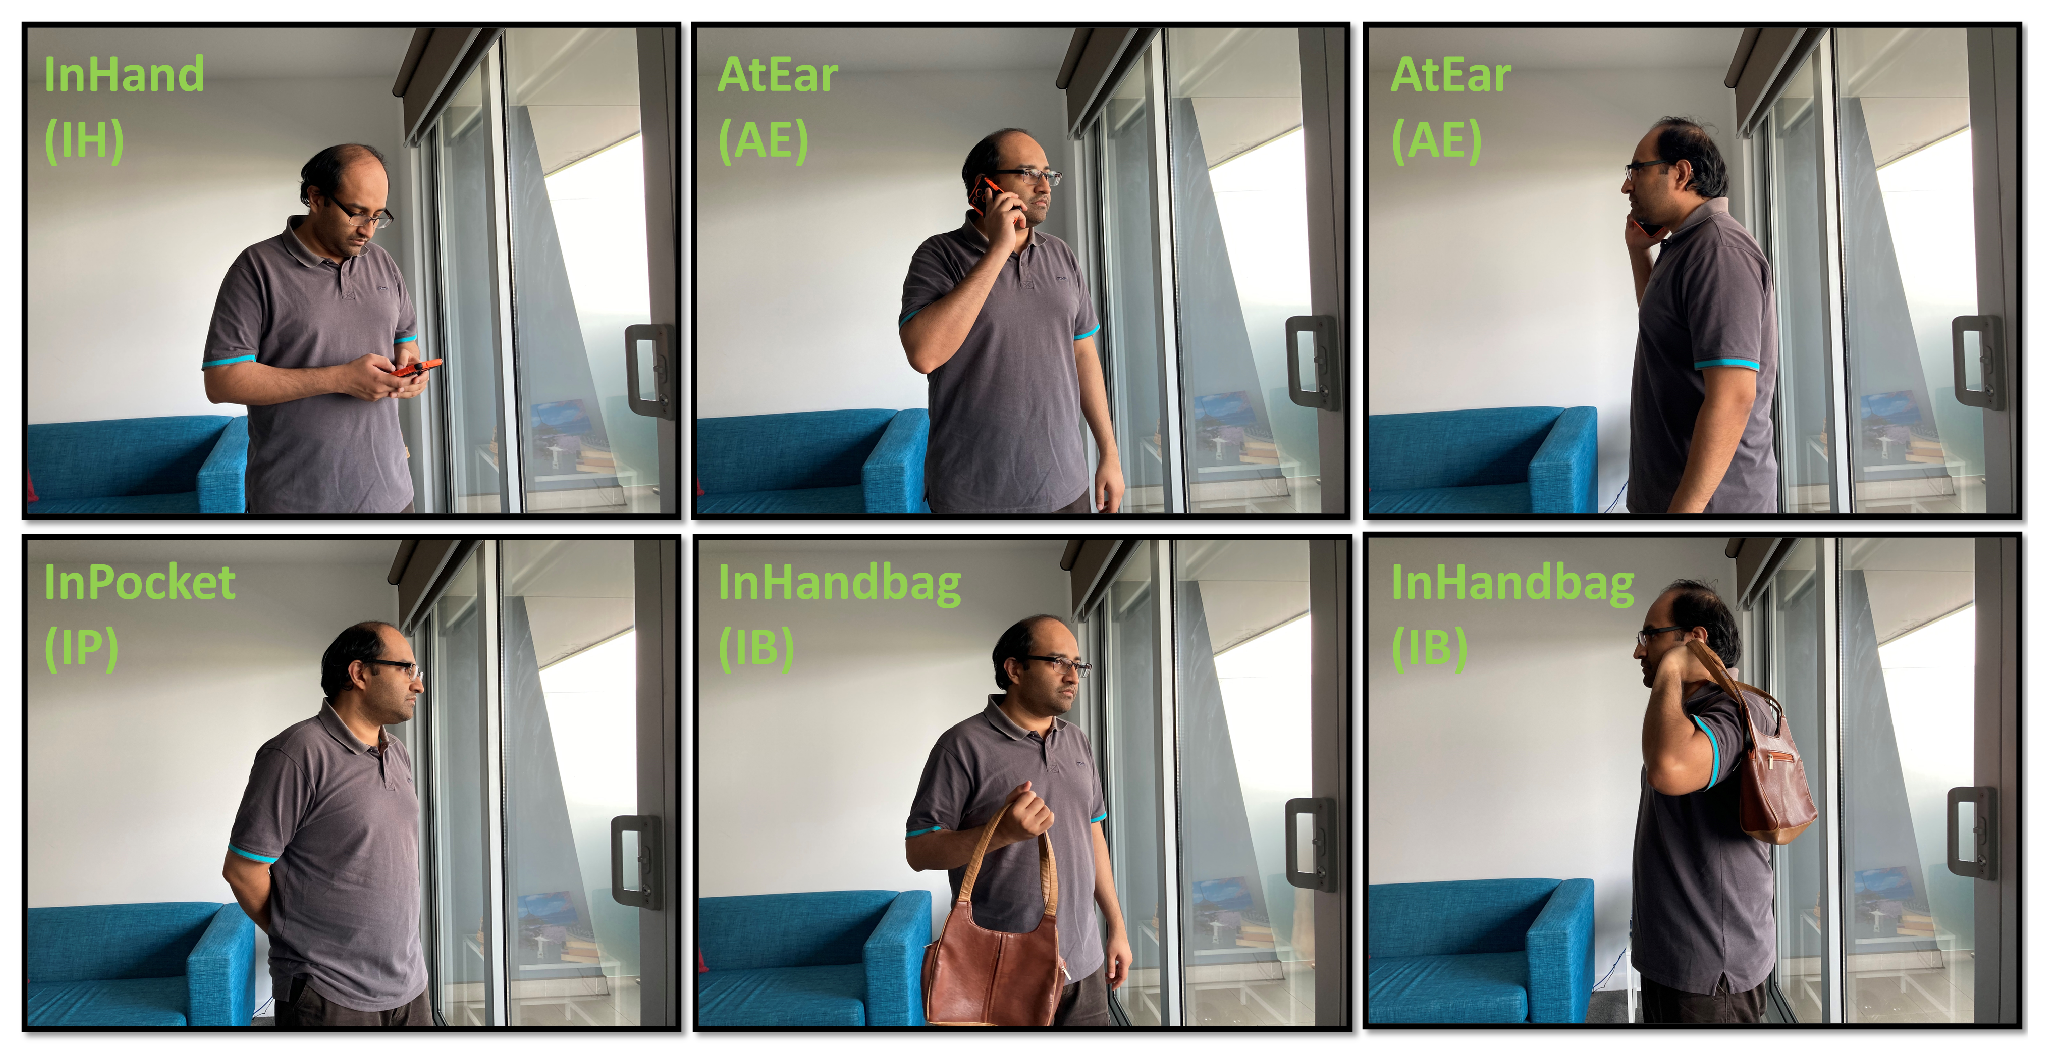
| Number of HAR device poses | 4 (Hand, trouser pockets, jacket pocket, bag) | 4 (AtEar, InHand, InPocket, InHandbag) |
| Movement type | Static and dynamic | Static and dynamic |
| Static/Dynamic | Zone | Anchor 1 | Anchor 2 | Anchor 3 | Anchor 4 | Anchor 5 | Anchor 6 | Total |
|---|---|---|---|---|---|---|---|---|
| Static | A and B | 2 | 1 | 0 | 0 | 1 | 2 | 6 |
| A and C | 0 | 0 | 0 | 0 | 1 | 0 | 1 | |
| A and D | 3 | 0 | 0 | 0 | 1 | 2 | 6 | |
| A and E | 1 | 0 | 0 | 0 | 0 | 1 | 2 | |
| B and C | 0 | 1 | 0 | 0 | 2 | 1 | 4 | |
| B and D | 3 | 3 | 1 | 1 | 3 | 9 | 20 | |
| B and E | 1 | 3 | 0 | 0 | 0 | 0 | 4 | |
| C and D | 0 | 0 | 0 | 1 | 2 | 2 | 5 | |
| C and E | 1 | 1 | 0 | 0 | 0 | 1 | 3 | |
| D and E | 1 | 4 | 1 | 0 | 0 | 0 | 6 | |
| Same location | 2 | 3 | 3 | 2 | 1 | 4 | 15 | |
| Total | 14 | 16 | 5 | 4 | 11 | 22 | ||
| Dynamic1 | A and B | 9 | 2 | 3 | 9 | 6 | 4 | 33 |
| A and C | 2 | 2 | 1 | 1 | 4 | 2 | 12 | |
| A and D | 6 | 0 | 1 | 0 | 6 | 2 | 15 | |
| A and E | 1 | 0 | 2 | 0 | 3 | 5 | 11 | |
| B and C | 3 | 4 | 2 | 4 | 2 | 4 | 19 | |
| B and D | 8 | 1 | 2 | 1 | 4 | 6 | 22 | |
| B and E | 1 | 2 | 0 | 3 | 4 | 2 | 12 | |
| C and D | 1 | 1 | 2 | 3 | 1 | 4 | 12 | |
| C and E | 4 | 2 | 2 | 5 | 1 | 1 | 15 | |
| D and E | 1 | 4 | 3 | 1 | 3 | 2 | 14 | |
| Same location | 6 | 4 | 3 | 10 | 5 | 4 | 33 | |
| Total | 42 | 22 | 21 | 37 | 39 | 36 | ||
| Dynamic2 | A and B | 0 | 0 | 1 | 2 | 0 | 1 | 4 |
| A and C | 4 | 3 | 0 | 0 | 4 | 3 | 14 | |
| A and D | 1 | 0 | 0 | 0 | 2 | 2 | 5 | |
| A and E | 1 | 0 | 3 | 0 | 2 | 1 | 7 | |
| B and C | 1 | 0 | 0 | 0 | 4 | 4 | 9 | |
| B and D | 0 | 2 | 0 | 0 | 0 | 1 | 3 | |
| B and E | 0 | 0 | 1 | 2 | 1 | 0 | 4 | |
| C and D | 0 | 0 | 0 | 0 | 0 | 1 | 1 | |
| C and E | 3 | 2 | 1 | 8 | 2 | 1 | 17 | |
| D and E | 1 | 1 | 0 | 0 | 0 | 2 | 4 | |
| Same location | 2 | 4 | 3 | 9 | 3 | 6 | 27 | |
| Total | 13 | 12 | 9 | 21 | 17 | 22 |
| Framework | Algorithm | Accuracy (%) Average [Min, Max] | Training Time (s) Average [Min, Max] | Testing Time (s) Average [Min, Max] |
|---|---|---|---|---|
| RSSI-Only | KNN | 74.3 [73.8, 74.9] | 0.043 [0.038, 0.260] | 0.745 [0.657, 0.888] |
| NB | 66.2 [65.5, 66.7] | 0.024 [0.019, 0.301] | 0.014 [0.011, 0.046] | |
| NN | 71.01 [70.5, 72.3] | 520.75 [509.82, 532.25] | 2.179 [2.052, 2.736] | |
| RSSI-and-device-pose | KNN | 76.6 [76.2, 77.1] | 0.078 [0.071, 0.164] | 1.360 [1.080, 1.702] |
| NB | 68.7 [67.9, 69.3] | 0.126 [0.110, 0.395] | 0.022 [0.021, 0.023] | |
| NN | 81.73 [81.1, 82.3] | 544.71 [539.56, 557.30] | 2.945 [2.74, 4.69] |
Disclaimer/Publisher’s Note: The statements, opinions and data contained in all publications are solely those of the individual author(s) and contributor(s) and not of MDPI and/or the editor(s). MDPI and/or the editor(s) disclaim responsibility for any injury to people or property resulting from any ideas, methods, instructions or products referred to in the content. |
© 2023 by the authors. Licensee MDPI, Basel, Switzerland. This article is an open access article distributed under the terms and conditions of the Creative Commons Attribution (CC BY) license (https://creativecommons.org/licenses/by/4.0/).
Share and Cite
Khan, I.M.; Thompson, A.; Al-Hourani, A.; Sithamparanathan, K.; Rowe, W.S.T. RSSI and Device Pose Fusion for Fingerprinting-Based Indoor Smartphone Localization Systems. Future Internet 2023, 15, 220. https://doi.org/10.3390/fi15060220
Khan IM, Thompson A, Al-Hourani A, Sithamparanathan K, Rowe WST. RSSI and Device Pose Fusion for Fingerprinting-Based Indoor Smartphone Localization Systems. Future Internet. 2023; 15(6):220. https://doi.org/10.3390/fi15060220
Chicago/Turabian StyleKhan, Imran Moez, Andrew Thompson, Akram Al-Hourani, Kandeepan Sithamparanathan, and Wayne S. T. Rowe. 2023. "RSSI and Device Pose Fusion for Fingerprinting-Based Indoor Smartphone Localization Systems" Future Internet 15, no. 6: 220. https://doi.org/10.3390/fi15060220
APA StyleKhan, I. M., Thompson, A., Al-Hourani, A., Sithamparanathan, K., & Rowe, W. S. T. (2023). RSSI and Device Pose Fusion for Fingerprinting-Based Indoor Smartphone Localization Systems. Future Internet, 15(6), 220. https://doi.org/10.3390/fi15060220