
Predicting Football Team Performance with Explainable AI: Leveraging SHAP to Identify Key Team-Level Performance Metrics

 ,
,  ,
, 
 and
and 
Abstract
1. Introduction
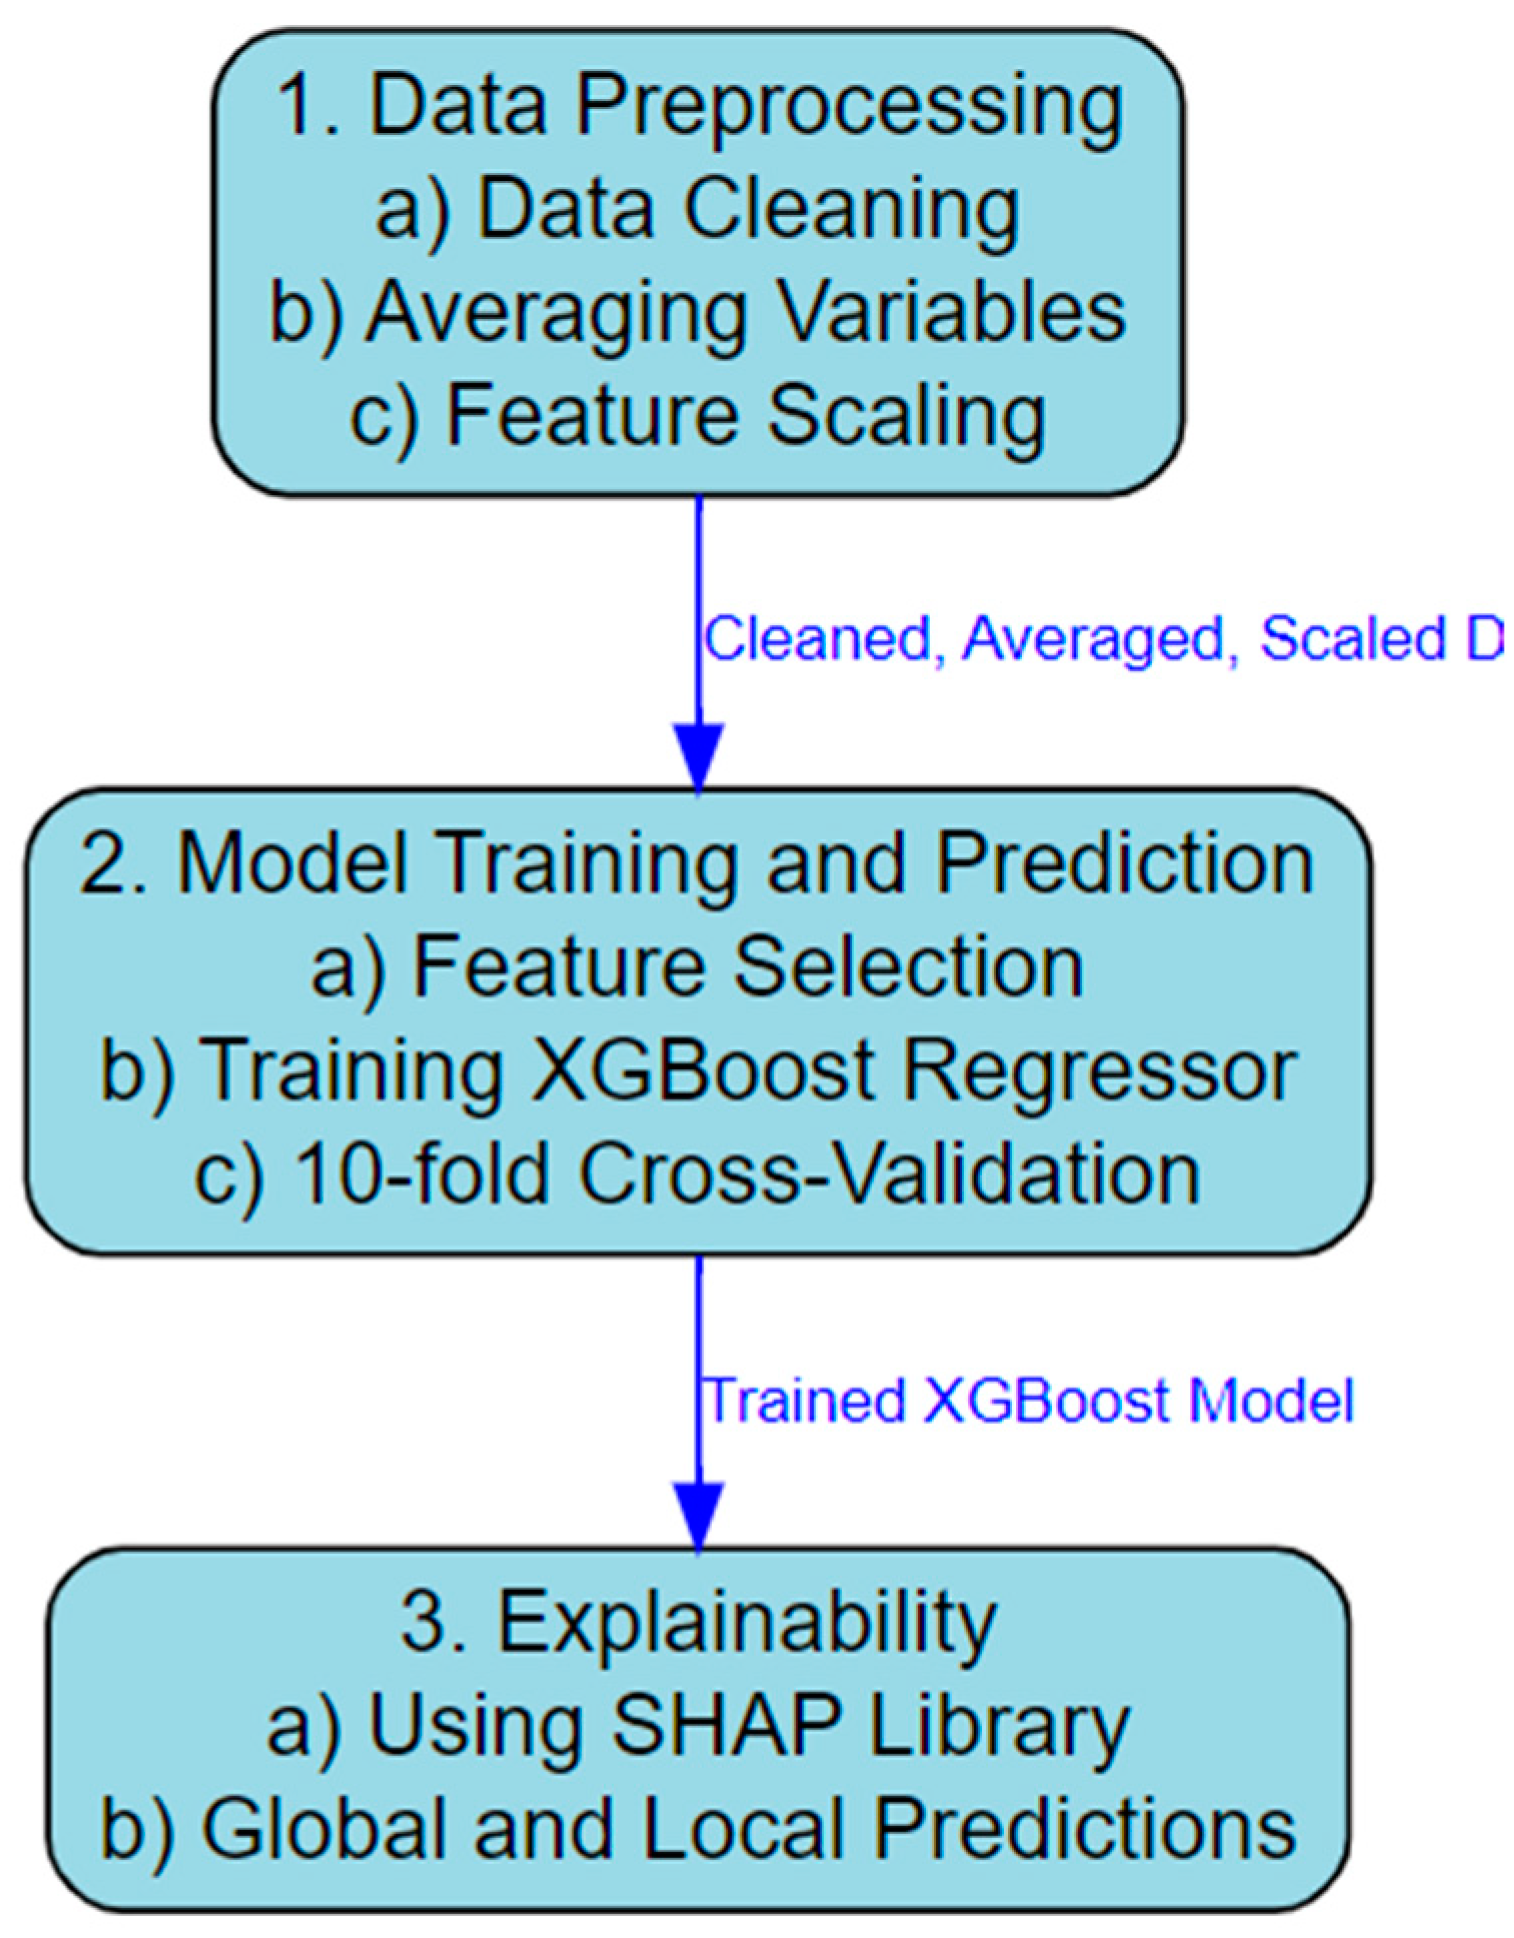
2. Materials and Methods
2.1. Dataset
2.2. Data Pre-Processing
2.3. Machine Learning
2.4. Explainability
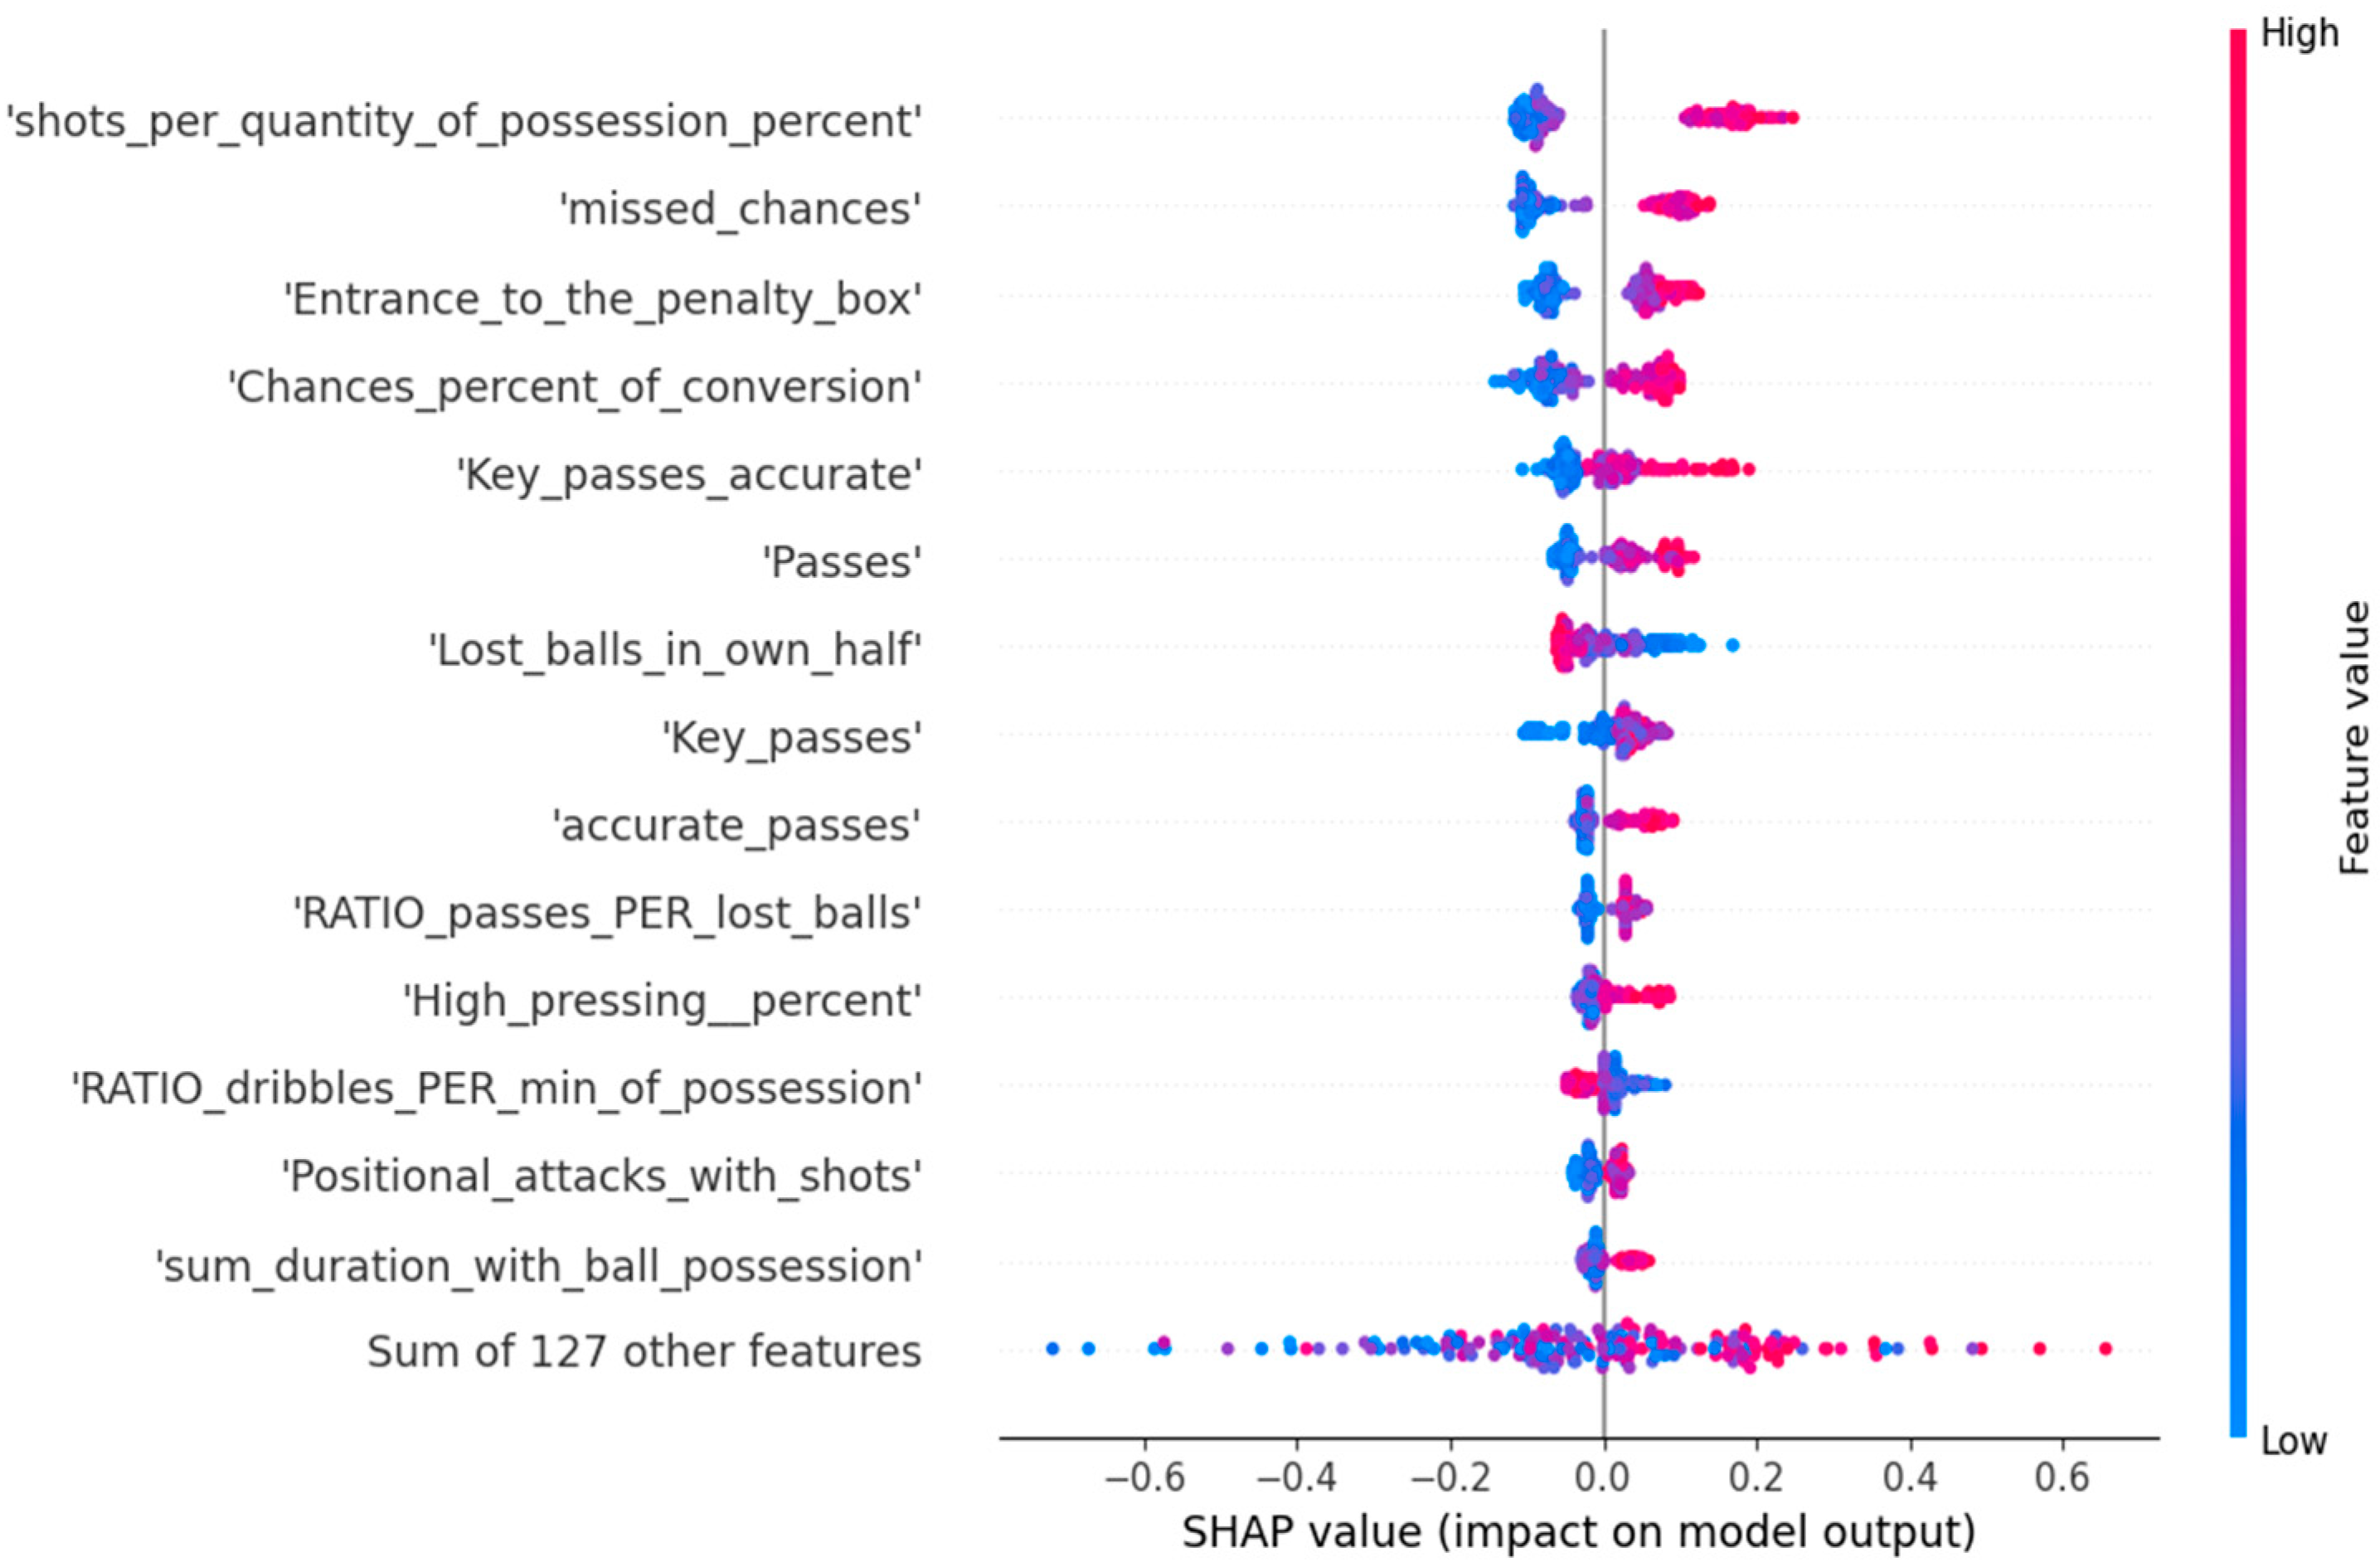
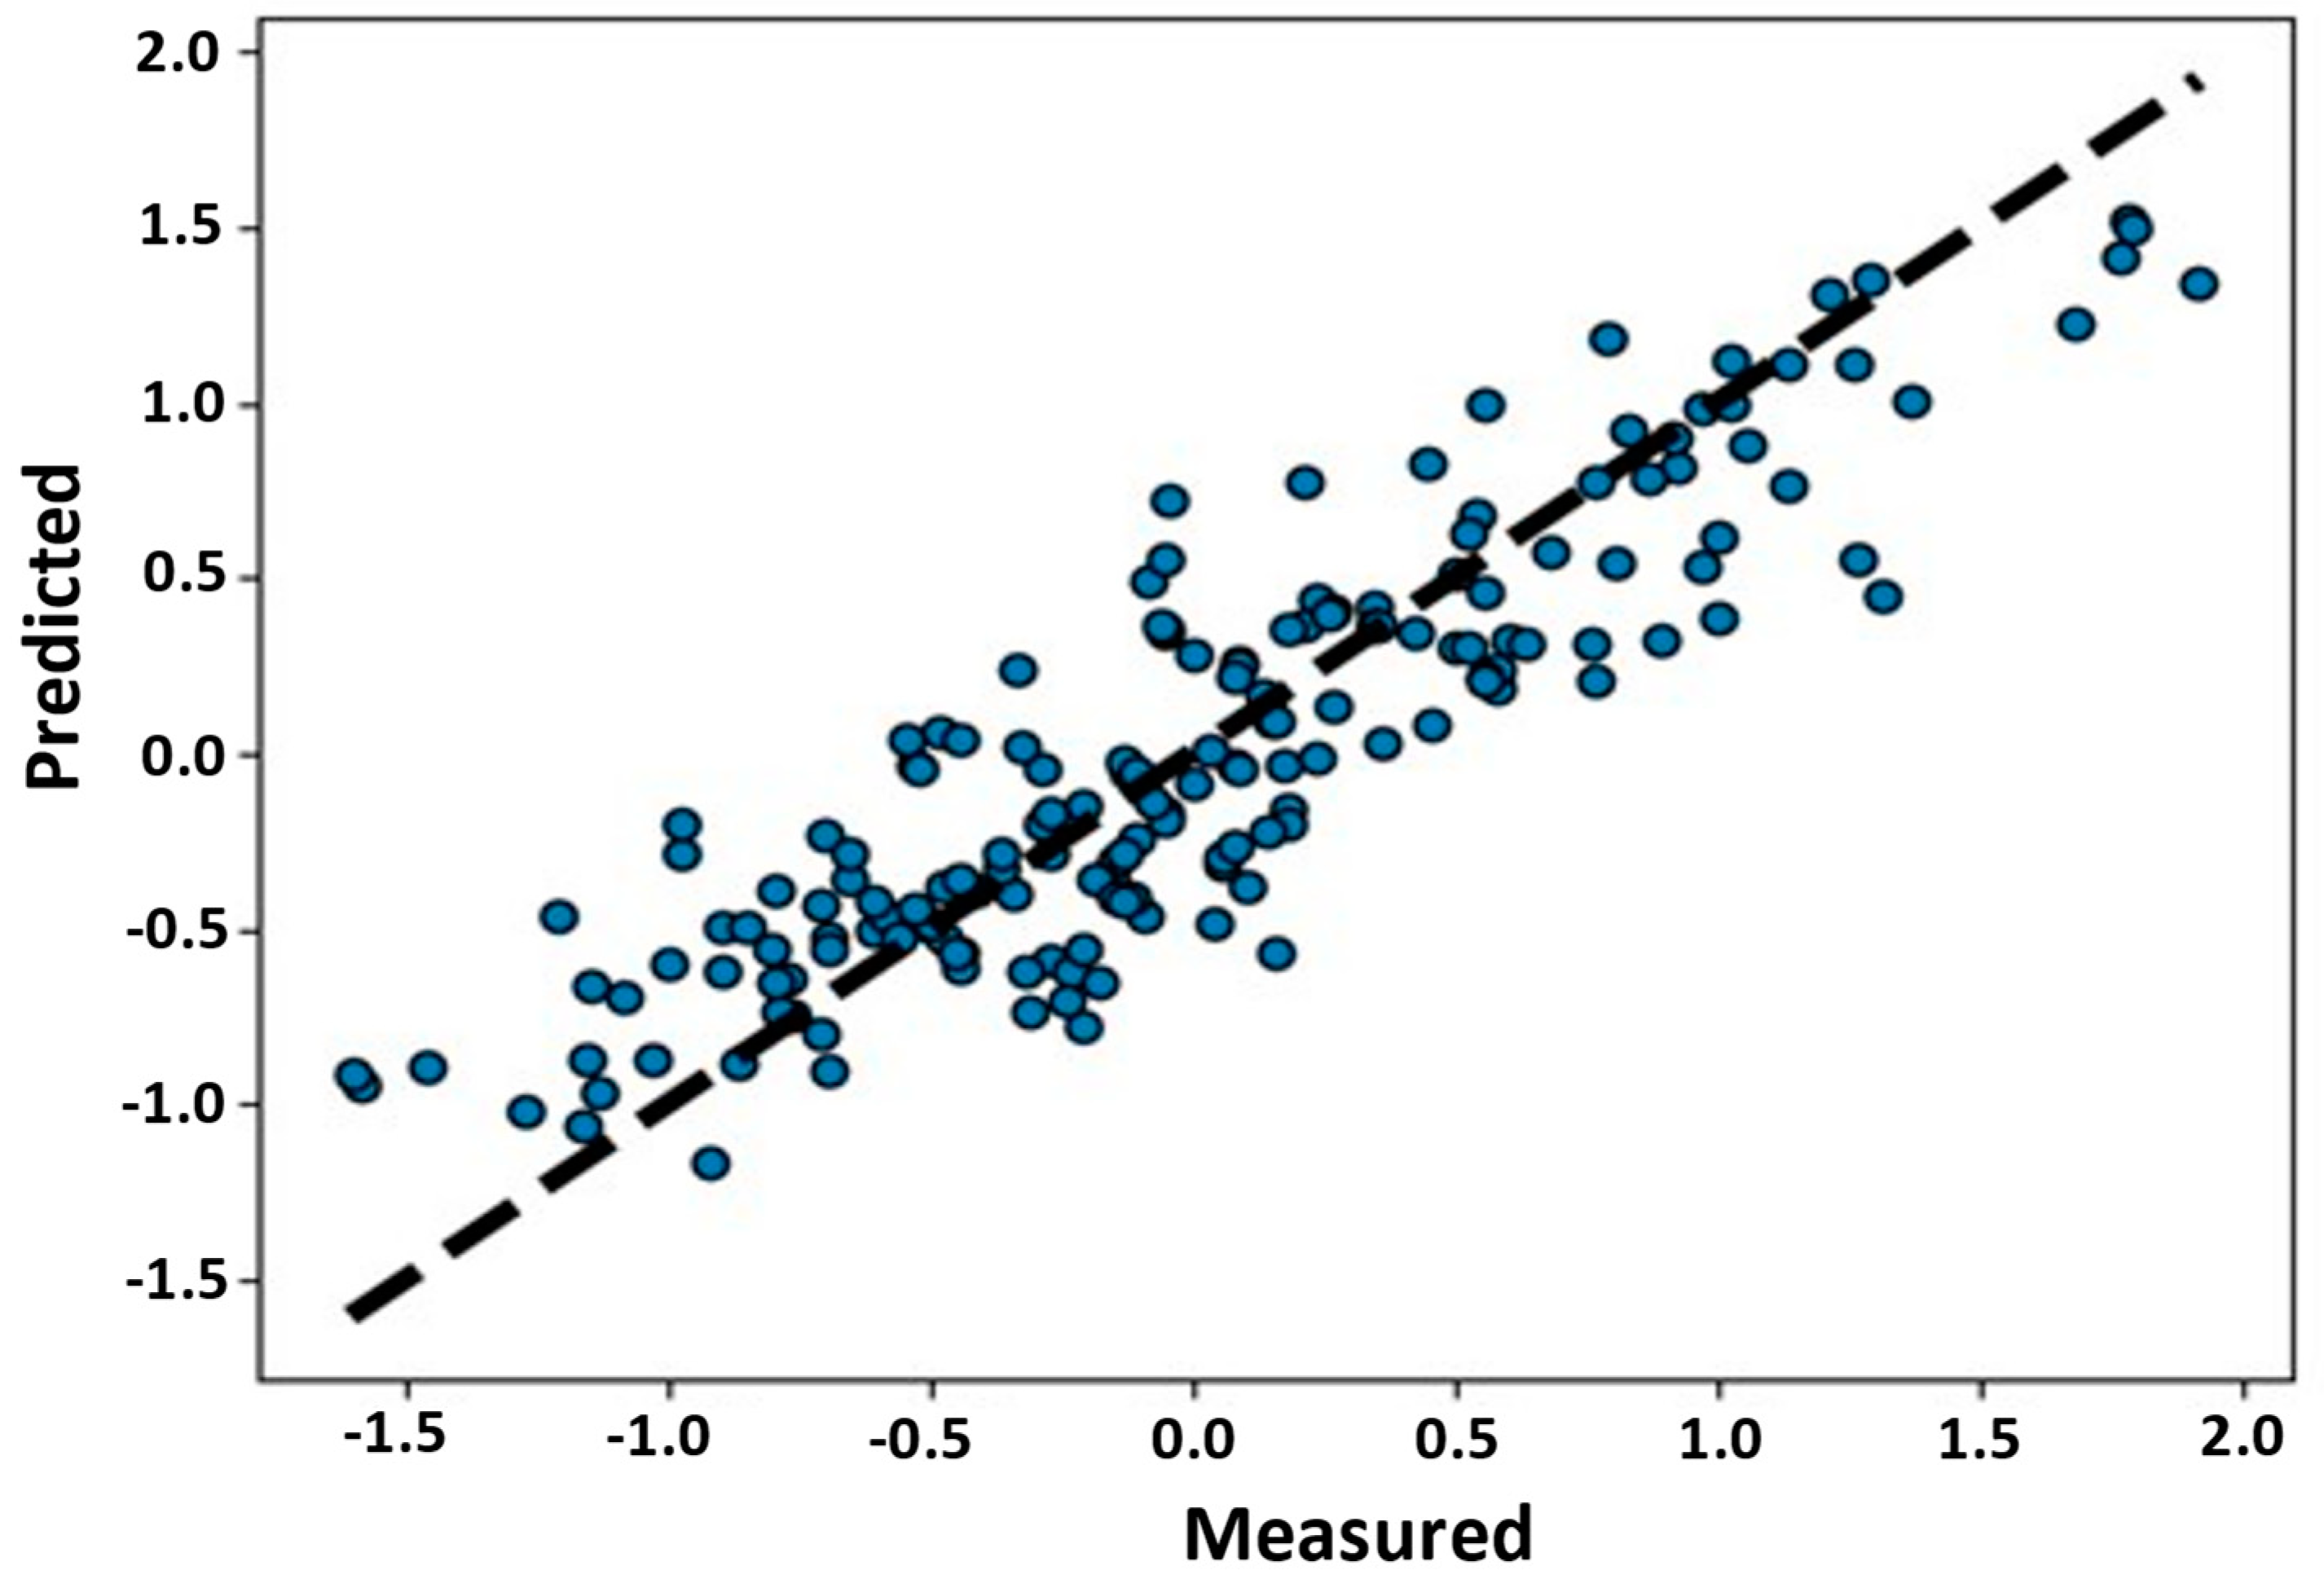
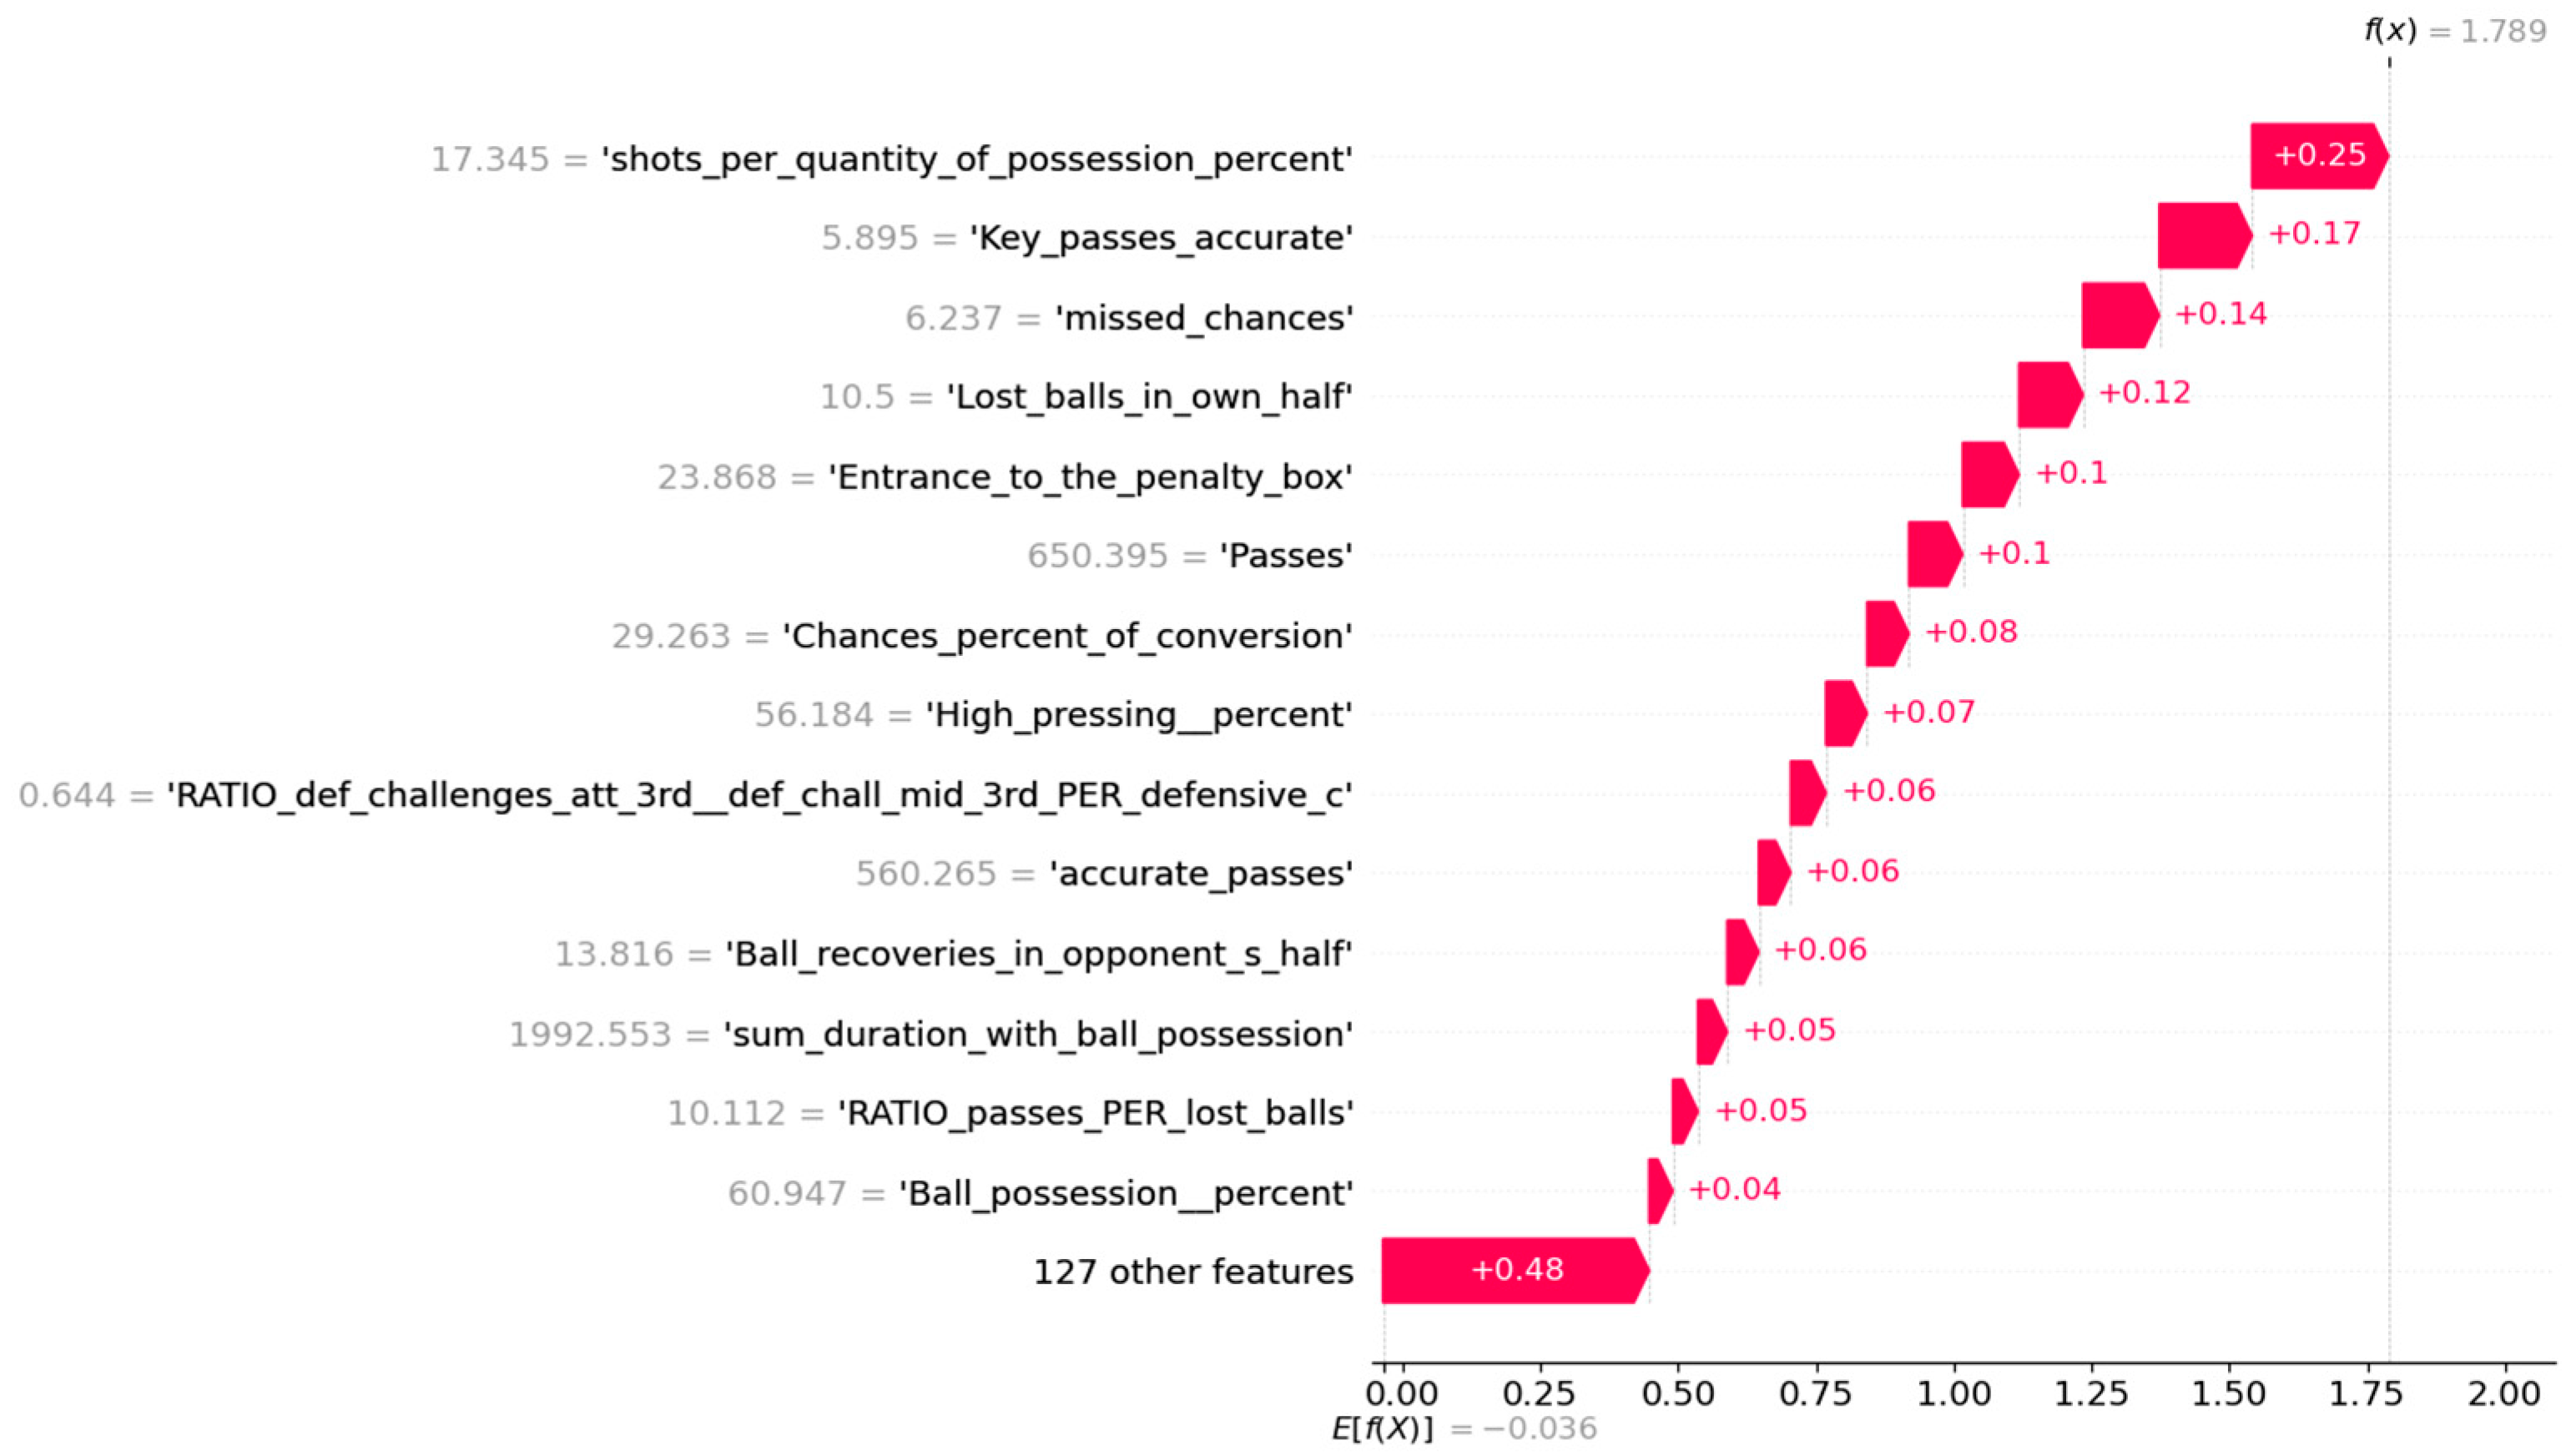
3. Results
4. Discussion
5. Conclusions
Author Contributions
Funding
Data Availability Statement
Conflicts of Interest
Appendix A

| Features | Description |
|---|---|
| Sum_long_passes | Passes with a length of at least 40 m, regardless of the area from which they were made |
| Pass_long_def_3rd | Passes made in the defensive third that were at least 40 m long |
| Pass_long_mid_3rd | Passes made in the midfield third that were at least 40 m long |
| Pass_long_att_3rd | Passes made in the attacking third that were at least 40 m long |
| RATIO_long_passes_PER_passes | Passes with a length of at least 40 m/total number of passes |
| Defensive_challenges | Duels involving the players of the defending team |
| Def_challenges_def_3rd | Duels involving the players of the defending team and taking place in the defensive third of that team |
| Def_challenges_mid_3rd | Duels involving the players of the defending team and taking place in the midfield third of that team |
| Def_challenges_att_3rd | Duels involving the players of the defending team and taking place in the attacking third of that team |
| Air_challenges | Duels in which the ball is above shoulder height and players try to play with their heads |
| Air_challenges_won | Successful air challenges |
| Air_challenges_missed | Unsuccessful air challenges |
| Air_challenges_won__percent | Air challenges won/air challenges (%) |
| Air_challenges_def_3rd | Air challenges in the team’s defensive third |
| Air_challenges_mid_3rd | Air challenges in the team’s midfield third |
| Air_challenges_att_3rd | Air challenges in the team’s attacking third |
| Challenges | Total number of duels |
| Challenges_won | Successful challenge is registered for a team that keeps possession of a ball after a duel |
| Challenges_missed | Duels that a team does not keep the possession of the ball |
| Challenges_won__percent | Challenges won/challenges (%) |
| Defensive_challenges_won | Successful attempts of defensive challenges that lead to a touch made by own team player |
| Defensive_challenges_missed | Defensive challenges minus defensive challenges won |
| Challenges_in_defence_won__percent | Defensive challenges won/defensive challenges (%) |
| Attacking_challenges | Duels involving the players of the attacking team |
| Attacking_challenges_won | Successful attacking challenges |
| Attacking_challenges_missed | Unsuccessful attacking challenges |
| Challenges_in_attack_won__percent | Attacking challenges won/attacking challenges (%) |
| Ground_challenges | Challenges minus air challenges |
| Ground_challenges_won | Successful ground challenges |
| Ground_challenges_missed | Unsuccessful ground challenges |
| Ground_challenges_won_percent | Successful ground challenges/ground challenges (%) |
| RATIO_ground_challenges_PER_air_challenges | Ground challenges/air challenges |
| RATIO_def_challenges_def_3rd_PER_defensive_challenges | Duels involving the players of the defending team and taking place in the defensive third of that team/total duels involving the players of the defending team |
| RATIO_def_challenges_mid_3rd_PER_defensive_challenges | Duels involving the players of the defending team and taking place in the midfield third of that team/total duels involving the players of the defending team |
| RATIO_def_challenges_att_3rd_PER_defensive_challenges | Duels involving the players of the defending team and taking place in the attacking third of that team/total duels involving the players of the defending team |
| RATIO_def_challenges_att_3rd__def_chall_mid_3rd_PER_defensive_c | Duels involving the players of the defending team and taking place in the midfield and attacking third of that team/total duels involving the players of the defending team |
| DIFFERENCE_air_challenges_att_3rd_MINUS_air_challenges_def_3rd | Air challenges in the team’s attacking third minus air challenges in the team’s defensive third |
| RATIO_air_challenges_att_3rd___air_challenges_def_3rd_PER_air_c | Duels involving the players of the defending team and taking place in the defensive and attacking third of that team/total duels involving the players of the defending team |
| Chances | A goal-scoring opportunity |
| Missed_chances | A goal-scoring opportunity which did not result in a goal |
| Fouls | An action that is not compatible with the rules of the game and is used to stop the progress of the opponent’s attack |
| Yellow_cards | An illegal action punishable by a yellow card from the referee |
| Yellow_cards_Fouls | The ratio yellow cards/fouls |
| Red_cards | An illegal action punishable by a red card by the referee and results in the player being sent off from the match |
| Corners | The total number of corners for a team |
| Shots | Total number of all shots made by a team |
| RATIO_shots_PER_10_minOf_ball_possession | The average number of shots a team made for every 10 min they had the ball |
| Shots_on_target | Shots going inside the goal, might end in a goal or be deflected by the goalkeeper or by a field player from the GK zone. |
| Shots_on_target__percent | Shots on target/shots (%) |
| Shots_wide | Shots out of target |
| Blocked_shots | Shots when an opposing player stopped the ball |
| Shots_on_post_Bar | Shots ended on a post/bar |
| Passes | Total number of passes |
| Accurate_passes | Successful attempt to pass a ball from one teammate to another |
| Accurate_passes__percent | Successful passes/passes (%) |
| Wrong_passes | Passes minus accurate passes |
| RATIO_passes_PER_wrong_passes | Passes/wrong passes |
| Key_passes | Pass that if successful creates a goal scoring opportunity |
| Key_passes_accurate | Successful pass that creates a goal scoring opportunity |
| Crosses | Passes from a wide area of the field towards the opponent’s box |
| Crosses_accurate | Successful crosses |
| Accurate_crosses__percent | Successful crosses/crosses (%) |
| Lost_balls | Any loss of ball for a team whether it comes from an unsuccessful pass, dribble or control |
| RATIO_passes_PER_lost_balls | Passes/lost balls |
| Lost_balls_in_own_half | Lost balls in the team’s own half |
| Lost_balls_in_opponent_s_half | Lost balls in the opposite half |
| Ball_recoveries | Action by which the team wins possession of the ball from the opponent |
| Ball_recoveries_in_opponent_s_half | Ball recoveries in the opposite half |
| Ball_recoveries_in_own_half | Ball recoveries in the team’s own half |
| Pressing_efficiency__percent | Percentage share of successful team pressing in the total number of team pressing attempts |
| Entrances_to_the_opposition_half | Number of team possessions during which at least one entrance into the opponent’s half was made |
| Entrances_to_the_finalThird | Number of team possessions during which at least one entrance into the opponent’s final third was made |
| Entrance_to_the_penalty_box | Number of team possessions during which at least one entrance into the opponent’s penalty box was made |
| RATIO_Entrances_to_the_final_third_PER_10_min_of_ball_possessio | Average entries into the attacking third per 10 min of possession |
| RATIO_Entrance_to_the_penalty_box_PER_10_min_of_ball_possession | Average entries into the opponent’s penalty box per 10 min of possession |
| Dribbles | The ball possessor’s attempt to outrun an opponent while maintaining possession of the ball |
| RATIO_dribbles_PER_min_of_possession | Average number of dribbles attempted by a team per minute of possession |
| Dribbles_successful | When the player attempting a dribble retains possession of the ball |
| Successful_dribbles__percent | Successful dribbles/dribbles (%) |
| Tackles | The attempt of a player to stop an opponent who is dribbling |
| RATIO_tackles_PER_min_of_opponent_s_ball_possession | The average number of tackles attempted by a team per minute of possession by the opposing team |
| Tackles_successful | When the opponent player attempts a dribble and loses the ball possession. |
| Tackles_won__percent | Tackles successful/tackles (%) |
| Ball_interceptions | A player’s attempt to stop a pass |
| Free_ball_pick_ups | When a player wins possession of the ball, when it was not in the possession of either team |
| Opponent_s_passes_per_defensive_action | Total number of passes attempted by the opponent team/total number of defensive challenges |
| Building_ups | When a team builds an attack in its own half |
| Building_ups_without_pressing | Build-up without pressing from the opponent |
| Team_pressing | Is counted for the opponents of a team that is building its attack when players are actively trying to get the ball back |
| Team_pressing_successful | When pressing results in the ball being recovered |
| High_pressing | pressing in the attacking third |
| High_pressing_successful | Successful pressing in the attacking third |
| High_pressing__percent | Successful high pressing/high pressing (%) |
| Low_pressing | Pressing in the defensive and midfield third |
| Low_pressing_successful | Successful pressing in the defensive and midfield third |
| Low_pressing__percent | Successful low pressing/low pressing (%) |
| Passing_rate | Average passes per minute of possession |
| AVERAGE_passes_PER_ball_possession | Average passes per possession |
| Ball_possessions__quantity | The number of ball possessions |
| Average_duration_of_ball_possession_sec | The average duration of each ball possession |
| Sum_duration_with_ball_possession | The total duration of possession for a team |
| Ball_possession__percent | The percentage of ball possession for a team |
| Opponent_s_ball_possession_percent | The percentage of ball possession for the opponent’s team |
| RATIO_interceptions___free_balls_pick_up_PER_min_of_opponents_b | Interceptions plus free balls pick up/minutes of opponent’s ball possession |
| RATIO_defensive_challenges_PER_min_of_opponent_s_ball_possessio | Defensive challenges/minutes of opponent’s ball possession |
| Opponent_s_sum_duration_of_ball_possession_sec | The total duration of possession for the opponent’s team |
| Effective_time_secs | The total time that the ball is in the possession of one or the other team (i.e., the time that the ball is contestable, and the interruptions of the match are not included) |
| Attacks | Possession contains at least one action made by the team in the opposition half (except fouls) and continues for more than 3 s |
| Attacks_Left_flank | Attacks from left flank (flank is the zone on the side of the pitch 20 m from each sideline) |
| Attacks_with_shots_Left_flank | Attacks from left flank which resulted in a shot |
| Attacks_Center | Attacks that are not made from the flanks |
| Attacks_with_shots_Center | Attacks from center which resulted in a shot |
| Attacks_Right_flank | Attacks from right flank |
| Attacks_with_shots_Right_flank | Attacks from right flank which resulted in a shot |
| RATIO_left_attacks_PER_total_attacks_percent | Attacks left flank/attacks (%) |
| RATIO_right_attacks_PER_total_attacks_percent | Attacks right flank/attacks (%) |
| Wide_attacks_percent | Attacks left flank plus attacks right flank/attacks (%) |
| Attacks_center_percent | Attacks center/attacks (%) |
| Counterattacks | Open play situation where the team that wins the ball from the opponent makes a quick offensive transition (<8 s) |
| Positional_attacks | Open play attacks minus counterattacks |
| Positional_attacks_with_shots | Positional attacks which resulted in a shot |
| RATIO_counterattacks_PER_ballRecoveries | Counterattacks/ball recoveries |
| Counterattacks_with_a_shot | Counterattacks which resulted in a shot |
| Set_pieces_attacks | Attacks from free kick, corner kick, throw in and penalty |
| Set_pieces_attacks_with_shots | Attacks from set pieces which resulted in a shot |
| Free_kick_attacks | Attacks from free kicks |
| Free_kick_attacks_with_shots | Attacks from free kicks which resulted in a shot |
| Corner_attacks | Attacks from corner kicks |
| Corner_attacks_with_shots | Attacks from corner kicks which resulted in a shot |
| Throw_in_attacks | Attacks from throw ins |
| Throw_in_attacks_with_shots | Attacks from throw ins which resulted in a shot |
| Free_kick_shots | Free kicks taken directly towards the goal |
| Penalties | Penalty kicks |
| Chances_percent_of_conversion | The chances that resulted in goals |
| Shots_on_target_per_shot_percent | Shots on target/shots (%) |
| Open_play_attacks | Attacks minus set pieces attacks |
| Open_play_attacks_percent | Open play attacks/attacks (%) |
| Set_pieces_attacks_percent | Set pieces attacks/attacks (%) |
| Counterattacks_percent | Counterattacks/attacks (%) |
| Positional_attacks_percent | Positional attacks/attacks (%) |
| Ratio_counterattacks_per_open_play_attacks_percent | Counterattacks/open play attacks (%) |
| Ratio_posit_att_from_openplay_PER_openplay_att_percent | Positional attacks from open play/open play attacks (%) |
| Offsides | When a team player is caught offside |
| Opponent_Attacks | Attacks by the opposing team |
| Opponent_Positional_attacks | Positional attacks by the opposing team |
| Opponent_Counterattacks | Counterattacks by the opposing team |
| Opponent_Set_pieces_attacks | Set pieces attacks by the opposing team |
| Opponent_Open_play_attacks | Open play attacks by the opposing team |
| Opponent_open_play_attacks_percent | Open play attacks by the opposing team/attacks by the opposing team (%) |
| Opponent_set_pieces_attacks_percent | Set pieces attacks by the opposing team/attacks by the opposing team (%) |
| Opponent_Counterattacks_percent | Counterattacks/attacks (%) for the opponent’s team |
| Opponent_Positional_attacks_percent | Positional attacks/attacks (%) for the opponent’s team |
| Opp_Ratio_counteratt_per_openplay_att_percent | Counterattacks/open play attacks (%) for the opponent’s team |
| Opp_Ratio_posit_att_from_openplay_PER_openplay_att_percent | Positional attacks from open play/open play attacks (%) for the opponent’s team |
| Opponent_Offsides | When a player of the opposing team is caught offside |
| Crosses_per_quantity_of_possession_percent | Crosses/quantity of possessions (%) |
| Crosses_per_attacks_percent | Crosses/attacks (%) |
| Shots_per_quantity_of_possession_percent | Shots/quantity of possessions (%) |
| Shots_per_entrances_to_final_third_percent | Shots/entrances to final third (%) |
| GoalDif | Goals for minus goals against |
References
- Rathi, K.; Somani, P.; Koul, A.V.; Manu, K. Applications of Artificial Intelligence in the Game of Football: The Global Perspective. Res. World 2020, 11, 18–29. [Google Scholar]
- Fernandez-Navarro, J.; Fradua, L.; Zubillaga, A.; Ford, P.R.; McRobert, A.P. Attacking and Defensive Styles of Play in Soccer: Analysis of Spanish and English Elite Teams. J. Sport. Sci. 2016, 34, 2195–2204. [Google Scholar] [CrossRef] [PubMed]
- Rein, R.; Memmert, D. Big Data and Tactical Analysis in Elite Soccer: Future Challenges and Opportunities for Sports Science. SpringerPlus 2016, 5, 1410. [Google Scholar] [CrossRef] [PubMed]
- Brand, A.; Niemann, A.; Spitaler, G. The Europeanization of Austrian Football: History, Adaptation and Transnational Dynamics. Soccer Soc. 2010, 11, 761–774. [Google Scholar] [CrossRef]
- Goes, F.; Kempe, M.; Lemmink, K.; Goes, F.; Kempe, M.; Lemmink, K. Predicting Match Outcome in Professional Dutch Football Using Tactical Performance Metrics Computed from Position Tracking Data; Propobos Publications: Athens, Greece, 2019; pp. 105–115. [Google Scholar]
- Park, E.-M.; Seo, J.-H.; Ko, M.-H. The Effects of Leadership by Types of Soccer Instruction on Big Data Analysis. Clust. Comput. 2016, 19, 1647–1658. [Google Scholar] [CrossRef]
- Decroos, T.; Van Roy, M.; Davis, J. SoccerMix: Representing Soccer Actions with Mixture Models; Springer: Berlin/Heidelberg, Germany, 2021; pp. 459–474. [Google Scholar]
- Plakias, S.; Moustakidis, S.; Kokkotis, C.; Tsatalas, T.; Papalexi, M.; Plakias, D.; Giakas, G.; Tsaopoulos, D. Identifying Soccer Teams’ Styles of Play: A Scoping and Critical Review. J. Funct. Morphol. Kinesiol. 2023, 8, 39. [Google Scholar] [CrossRef]
- Lago-Peñas, C.; Gómez-Ruano, M.; Yang, G. Styles of Play in Professional Soccer: An Approach of the Chinese Soccer Super League. Int. J. Perform. Anal. Sport 2017, 17, 1073–1084. [Google Scholar] [CrossRef]
- Decroos, T.; Van Haaren, J.; Davis, J. Automatic Discovery of Tactics in Spatio-Temporal Soccer Match Data. In Proceedings of the KDD ‘18: Proceedings of the 24th ACM SIGKDD International Conference on Knowledge Discovery and Data Mining, Long Beach, CA, USA, 6–10 August 2018; pp. 223–232. [Google Scholar]
- Perl, J.; Grunz, A.; Memmert, D. Tactics Analysis in Soccer–an Advanced Approach. Int. J. Comput. Sci. Sport 2013, 12, 33–44. [Google Scholar]
- Fialho, G.; Manhães, A.; Teixeira, J.P. Predicting Sports Results with Artificial Intelligence—A Proposal Framework for Soccer Games. Procedia Comput. Sci. 2019, 164, 131–136. [Google Scholar] [CrossRef]
- Ulmer, B.; Fernandez, M.; Peterson, M. Predicting Soccer Match Results in the English Premier League. Ph.D. Thesis, Stanford University, Stanford, CA, USA, 2013. [Google Scholar]
- Bilek, G.; Ulas, E. Predicting Match Outcome According to the Quality of Opponent in the English Premier League Using Situational Variables and Team Performance Indicators. Int. J. Perform. Anal. Sport 2019, 19, 930–941. [Google Scholar] [CrossRef]
- Patel, R.; Passi, K. Sentiment Analysis on Twitter Data of World Cup Soccer Tournament Using Machine Learning. IoT 2020, 1, 14. [Google Scholar] [CrossRef]
- Naik, B.T.; Hashmi, M.F.; Bokde, N.D. A Comprehensive Review of Computer Vision in Sports: Open Issues, Future Trends and Research Directions. Appl. Sci. 2022, 12, 4429. [Google Scholar] [CrossRef]
- Barris, S.; Button, C. A Review of Vision-Based Motion Analysis in Sport. Sport. Med. 2008, 38, 1025–1043. [Google Scholar] [CrossRef] [PubMed]
- Danisik, N.; Lacko, P.; Farkas, M. Football Match Prediction Using Players Attributes; IEEE: Piscataway, NJ, USA, 2018; pp. 201–206. [Google Scholar]
- Inan, T. Using Poisson Model for Goal Prediction in European Football. 2021. Available online: https://rua.ua.es/dspace/bitstream/10045/107443/6/JHSE_16-4_16.pdf (accessed on 24 April 2023).
- Robberechts, P.; Davis, J. Forecasting the FIFA World Cup–Combining Result-and Goal-Based Team Ability Parameters; Springer: Berlin/Heidelberg, Germany, 2019; pp. 16–30. [Google Scholar]
- Prasetio, D. Predicting Football Match Results with Logistic Regression; IEEE: Piscataway, NJ, USA, 2016; pp. 1–5. [Google Scholar]
- Bunker, R.P.; Thabtah, F. A Machine Learning Framework for Sport Result Prediction. Appl. Comput. Inform. 2019, 15, 27–33. [Google Scholar] [CrossRef]
- Hubáček, O.; Šourek, G.; Železný, F. Learning to Predict Soccer Results from Relational Data with Gradient Boosted Trees. Mach. Learn. 2019, 108, 29–47. [Google Scholar] [CrossRef]
- Hsu, Y.-C. Using Convolutional Neural Network and Candlestick Representation to Predict Sports Match Outcomes. Appl. Sci. 2021, 11, 6594. [Google Scholar] [CrossRef]
- Zhang, Q.; Zhang, X.; Hu, H.; Li, C.; Lin, Y.; Ma, R. Sports Match Prediction Model for Training and Exercise Using Attention-Based LSTM Network. Digit. Commun. Netw. 2022, 8, 508–515. [Google Scholar] [CrossRef]
- Wunderlich, F.; Memmert, D. The Betting Odds Rating System: Using Soccer Forecasts to Forecast Soccer. PLoS ONE 2018, 13, e0198668. [Google Scholar] [CrossRef]
- Samek, W.; Montavon, G.; Vedaldi, A.; Hansen, L.K.; Müller, K.-R. Explainable AI: Interpreting, Explaining and Visualizing Deep Learning; Springer: Berlin/Heidelberg, Germany, 2019; Volume 11700, ISBN 3-030-28954-0. [Google Scholar]
- Lundberg, S.M.; Erion, G.; Chen, H.; DeGrave, A.; Prutkin, J.M.; Nair, B.; Katz, R.; Himmelfarb, J.; Bansal, N.; Lee, S.-I. From Local Explanations to Global Understanding with Explainable AI for Trees. Nat. Mach. Intell. 2020, 2, 56–67. [Google Scholar] [CrossRef]
- Geurkink, Y.; Boone, J.; Verstockt, S.; Bourgois, J.G. Machine Learning-Based Identification of the Strongest Predictive Variables of Winning and Losing in Belgian Professional Soccer. Appl. Sci. 2021, 11, 2378. [Google Scholar] [CrossRef]
- Ren, Y.; Susnjak, T. Predicting Football Match Outcomes with EXplainable Machine Learning and the Kelly Index. arXiv 2022, arXiv:2211.15734. [Google Scholar]
- Gómez, M.-Á.; Mitrotasios, M.; Armatas, V.; Lago-Peñas, C. Analysis of Playing Styles According to Team Quality and Match Location in Greek Professional Soccer. Int. J. Perform. Anal. Sport 2018, 18, 986–997. [Google Scholar] [CrossRef]
- Casal, C.A.; Maneiro, R.; Ardá, A.; Losada, J.L. Gender Differences in Technical-Tactical Behaviour of Laliga Spanish Football Teams. J. Hum. Sport Exerc. 2019, 16, 37–52. [Google Scholar]
- Castellano, J.; Echeazarra, I. Network-Based Centrality Measures and Physical Demands in Football Regarding Player Position: Is There a Connection? A Preliminary Study. J. Sport. Sci. 2019, 37, 2631–2638. [Google Scholar] [CrossRef]
- Kumar, R.; Kumar, P.; Tripathi, R.; Gupta, G.P.; Garg, S.; Hassan, M.M. A Distributed Intrusion Detection System to Detect DDoS Attacks in Blockchain-Enabled IoT Network. J. Parallel Distrib. Comput. 2022, 164, 55–68. [Google Scholar] [CrossRef]
- Zhang, Z.; Li, Y.; Jin, S.; Zhang, Z.; Wang, H.; Qi, L.; Zhou, R. Modulation Signal Recognition Based on Information Entropy and Ensemble Learning. Entropy 2018, 20, 198. [Google Scholar] [CrossRef]
- Shahani, N.M.; Zheng, X.; Liu, C.; Hassan, F.U.; Li, P. Developing an XGBoost Regression Model for Predicting Young’s Modulus of Intact Sedimentary Rocks for the Stability of Surface and Subsurface Structures. Front. Earth Sci. 2021, 9, 761990. [Google Scholar] [CrossRef]
- Malik, A.; Tikhamarine, Y.; Souag-Gamane, D.; Kisi, O.; Pham, Q.B. Support Vector Regression Optimized by Meta-Heuristic Algorithms for Daily Streamflow Prediction. Stoch. Environ. Res. Risk Assess. 2020, 34, 1755–1773. [Google Scholar] [CrossRef]
- Babar, B.; Luppino, L.T.; Boström, T.; Anfinsen, S.N. Random Forest Regression for Improved Mapping of Solar Irradiance at High Latitudes. Sol. Energy 2020, 198, 81–92. [Google Scholar] [CrossRef]
- Zhou, Y.; Huang, M.; Pecht, M. Remaining Useful Life Estimation of Lithium-Ion Cells Based on k-Nearest Neighbor Regression with Differential Evolution Optimization. J. Clean. Prod. 2020, 249, 119409. [Google Scholar] [CrossRef]
- Lipovetsky, S.; Conklin, M. Analysis of Regression in Game Theory Approach. Appl. Stoch. Model. Bus. Ind. 2001, 17, 319–330. [Google Scholar] [CrossRef]
- Palatnik de Sousa, I.; Maria Bernardes Rebuzzi Vellasco, M.; Costa da Silva, E. Local Interpretable Model-Agnostic Explanations for Classification of Lymph Node Metastases. Sensors 2019, 19, 2969. [Google Scholar] [CrossRef] [PubMed]
- Lago-Ballesteros, J.; Lago-Peñas, C. Performance in Team Sports: Identifying the Keys to Success in Soccer. J. Hum. Kinet. 2010, 25, 85–91. [Google Scholar] [CrossRef]
- Liu, H.; Gomez, M.-Á.; Lago-Peñas, C.; Sampaio, J. Match Statistics Related to Winning in the Group Stage of 2014 Brazil FIFA World Cup. J. Sport. Sci. 2015, 33, 1205–1213. [Google Scholar] [CrossRef]
- Liu, H.; Hopkins, W.G.; Gómez, M.-A. Modelling Relationships between Match Events and Match Outcome in Elite Football. Eur. J. Sport. Sci. 2016, 16, 516–525. [Google Scholar] [CrossRef]
- Castellano, J.; Casamichana, D.; Lago, C. The Use of Match Statistics That Discriminate between Successful and Unsuccessful Soccer Teams. J. Hum. Kinet. 2012, 31, 137–147. [Google Scholar] [CrossRef]
- Rathke, A. An Examination of Expected Goals and Shot Efficiency in Soccer. J. Hum. Sport Exerc. 2017, 12, 514–529. [Google Scholar] [CrossRef]
- Muazu Musa, R.; PP Abdul Majeed, A.; Abdullah, M.R.; Ab. Nasir, A.F.; Arif Hassan, M.H.; Mohd Razman, M.A. Technical and Tactical Performance Indicators Discriminating Winning and Losing Team in Elite Asian Beach Soccer Tournament. PLoS ONE 2019, 14, e0219138. [Google Scholar] [CrossRef] [PubMed]
- Pappalardo, L.; Cintia, P. Quantifying the Relation between Performance and Success in Soccer. Adv. Complex Syst. 2018, 21, 1750014. [Google Scholar] [CrossRef]
- Zhou, C.; Zhang, S.; Lorenzo Calvo, A.; Cui, Y. Chinese Soccer Association Super League, 2012–2017: Key Performance Indicators in Balance Games. Int. J. Perform. Anal. Sport 2018, 18, 645–656. [Google Scholar] [CrossRef]
- Zhou, C.; Calvo, A.L.; Robertson, S.; Gómez, M.-Á. Long-Term Influence of Technical, Physical Performance Indicators and Situational Variables on Match Outcome in Male Professional Chinese Soccer. J. Sport. Sci. 2021, 39, 598–608. [Google Scholar] [CrossRef]
- Harrop, K.; Nevill, A. Performance Indicators That Predict Success in an English Professional League One Soccer Team. Int. J. Perform. Anal. Sport 2014, 14, 907–920. [Google Scholar] [CrossRef]
- Yang, G.; Leicht, A.S.; Lago, C.; Gómez, M.-Á. Key Team Physical and Technical Performance Indicators Indicative of Team Quality in the Soccer Chinese Super League. Res. Sport. Med. 2018, 26, 158–167. [Google Scholar] [CrossRef] [PubMed]
- Akyildiz, Z.; Nobari, H.; González-Fernández, F.T.; Praça, G.M.; Sarmento, H.; Guler, A.H.; Saka, E.K.; Clemente, F.M.; Figueiredo, A.J. Variations in the Physical Demands and Technical Performance of Professional Soccer Teams over Three Consecutive Seasons. Sci. Rep. 2022, 12, 2412. [Google Scholar] [CrossRef]
- Cakmak, A.; Uzun, A.; Delibas, E. Computational Modeling of Pass Effectiveness in Soccer. Adv. Complex Syst. 2018, 21, 1850010. [Google Scholar] [CrossRef]
- MULAZIMOGLU, O. The Effect of Special Technical Events in the Game on the Success of Professional Soccer Teams: Turkish Super League. Rev. Line Política Gestão Educ. 2021, 25, 1418–1431. [Google Scholar] [CrossRef]
- Almeida, C.H.; Ferreira, A.P.; Volossovitch, A. Effects of Match Location, Match Status and Quality of Opposition on Regaining Possession in UEFA Champions League. J. Hum. Kinet. 2014, 41, 203–214. [Google Scholar] [CrossRef]
- Bojinov, I.; Bornn, L. The Pressing Game: Optimal Defensive Disruption in Soccer. In Proceedings of the 10th MIT Sloan Sports Analytics Conference, Boston, MA, USA, 12 March 2016. [Google Scholar]
- Merckx, S.; Robberechts, P.; Euvrard, Y.; Davis, J. Measuring the Effectiveness of Pressing in Soccer. In Proceedings of the Workshop on Machine Learning and Data Mining for Sports Analytics, Virtual, 13 September 2021. [Google Scholar]
- Iván-Baragaño, I.; Maneiro, R.; Losada, J.L.; Ardá, A. Multivariate Analysis of the Offensive Phase in High-Performance Women’s Soccer: A Mixed Methods Study. Sustainability 2021, 13, 6379. [Google Scholar] [CrossRef]
- Maneiro, R.; Casal, C.A.; Álvarez, I.; Moral, J.E.; López, S.; Ardá, A.; Losada, J.L. Offensive Transitions in High-Performance Football: Differences between UEFA Euro 2008 and UEFA Euro 2016. Front. Psychol. 2019, 10, 1230. [Google Scholar] [CrossRef]
- Scanlan, M.; Harms, C.; Cochrane Wilkie, J.; Ma’ayah, F. The Creation of Goal Scoring Opportunities at the 2015 Women’s World Cup. Int. J. Sport. Sci. Coach. 2020, 15, 803–808. [Google Scholar] [CrossRef]
- Hughes, M.; Lovell, T. Transition to Attack in Elite Soccer. J. Hum. Sport Exerc. 2019, 14, 1. [Google Scholar] [CrossRef]
- Warwick, J. The efficacy of counter-pressing as an offensive-defensive philosophy. Master’s Thesis, University of Miami, Miami, FL, USA, 2019. [Google Scholar]
- Stöckl, M.; Seidl, T.; Marley, D.; Power, P. Making Offensive Play Predictable-Using a Graph Convolutional Network to Understand Defensive Performance in Soccer. In Proceedings of the 15th MIT Sloan Sports Analytics Conference, Virtual, 8–9 April 2021; Volume 2022. [Google Scholar]
- Davies, J.C. Coaching the Tiki Taka Style of Play; SoccerTutor.com Limited: Essex, UK, 2013; ISBN 978-0-9576705-4-9. [Google Scholar]
- Llopis-Goig, R.; Llopis-Goig, R. The Decline of the Spanish Fury. In Spanish Football and Social Change: Sociological Investigations; Palgrave Macmillan: London, UK, 2015; pp. 64–85. [Google Scholar]
- Rashid, M.F.F.A. Tiki-Taka Algorithm: A Novel Metaheuristic Inspired by Football Playing Style. Eng. Comput. 2020, 38, 313–343. [Google Scholar] [CrossRef]
- Cintia, P.; Pappalardo, L. Coach2vec: Autoencoding the Playing Style of Soccer Coaches. arXiv 2021, arXiv:2106.15444. [Google Scholar]
- Ahmed, A.M.; Deo, R.C.; Feng, Q.; Ghahramani, A.; Raj, N.; Yin, Z.; Yang, L. Deep Learning Hybrid Model with Boruta-Random Forest Optimiser Algorithm for Streamflow Forecasting with Climate Mode Indices, Rainfall, and Periodicity. J. Hydrol. 2021, 599, 126350. [Google Scholar] [CrossRef]


| Sample Characteristics | |
|---|---|
| Number of leagues | 11 |
| Number of teams | 174 |
| Number of matches | 2996 |
| Variables | |
| Number of variables related to attack | 74 |
| Number of variables related to defense | 44 |
| Number of variables related to attacking transition | 5 |
| Number of variables related to defensive transition | 3 |
| Number of variables related to attacking set pieces | 12 |
| Number of variables related to defensive set pieces | 2 |
| Number of variables not related to a specific phase | 20 |
| Machine Learning Model Specifications | ||||
|---|---|---|---|---|
| Model | XGBRegressor | SVR | RF | kNN |
| Hyperparameters: | {Colsample bytree: 0.3; learning rate: 0.1; max depth: 3; n estimators: 500} | {C: 1; kernel: ‘sigmoid’; epsilon:1} | {min_samples_leaf’: 2; ‘min samples split’: 6; ‘n_estimators’: 25} | {leaf size: 1, n_neighbors: 9, p: 2} |
| Validation Strategy | ||||
| Approach | Cross-validation | |||
| Number of folds | 10 | |||
| Performance | ||||
| Root mean squared error | 32.09% | 42.41% | 36.01% | 40.71% |
Disclaimer/Publisher’s Note: The statements, opinions and data contained in all publications are solely those of the individual author(s) and contributor(s) and not of MDPI and/or the editor(s). MDPI and/or the editor(s) disclaim responsibility for any injury to people or property resulting from any ideas, methods, instructions or products referred to in the content. |
© 2023 by the authors. Licensee MDPI, Basel, Switzerland. This article is an open access article distributed under the terms and conditions of the Creative Commons Attribution (CC BY) license (https://creativecommons.org/licenses/by/4.0/).
Share and Cite
Moustakidis, S.; Plakias, S.; Kokkotis, C.; Tsatalas, T.; Tsaopoulos, D. Predicting Football Team Performance with Explainable AI: Leveraging SHAP to Identify Key Team-Level Performance Metrics. Future Internet 2023, 15, 174. https://doi.org/10.3390/fi15050174
Moustakidis S, Plakias S, Kokkotis C, Tsatalas T, Tsaopoulos D. Predicting Football Team Performance with Explainable AI: Leveraging SHAP to Identify Key Team-Level Performance Metrics. Future Internet. 2023; 15(5):174. https://doi.org/10.3390/fi15050174
Chicago/Turabian StyleMoustakidis, Serafeim, Spyridon Plakias, Christos Kokkotis, Themistoklis Tsatalas, and Dimitrios Tsaopoulos. 2023. "Predicting Football Team Performance with Explainable AI: Leveraging SHAP to Identify Key Team-Level Performance Metrics" Future Internet 15, no. 5: 174. https://doi.org/10.3390/fi15050174
APA StyleMoustakidis, S., Plakias, S., Kokkotis, C., Tsatalas, T., & Tsaopoulos, D. (2023). Predicting Football Team Performance with Explainable AI: Leveraging SHAP to Identify Key Team-Level Performance Metrics. Future Internet, 15(5), 174. https://doi.org/10.3390/fi15050174