Article

Study of Coded ALOHA with Multi-User Detection under Heavy-Tailed and Correlated Arrivals

by
María E. Sousa-Vieira
* and
Manuel Fernández-Veiga
atlanTTic Research Center, Universidade de Vigo, 36310 Vigo, Spain
*
Author to whom correspondence should be addressed.
Future Internet 2023, 15(4), 132; https://doi.org/10.3390/fi15040132
Submission received: 1 March 2023 / Revised: 21 March 2023 / Accepted: 27 March 2023 / Published: 30 March 2023

Abstract

:
In this paper, we study via simulation the performance of irregular repetition slotted ALOHA under multi-packet detection and different patterns of the load process. On the one hand, we model the arrival process with a version of the M/G/ process able to exhibit a correlation structure decaying slowly in time. Given the independence among frames in frame-synchronous coded-slotted ALOHA (CSA), this variation should only take effect on frame-asynchronous CSA. On the other hand, we vary the marginal distribution of the arrival process using discrete versions of the Lognormal and Pareto distributions, with the objective of investigating the influence of the right tail. In this case, both techniques should be affected by the change, albeit to a different degree. Our results confirm these hypotheses and show that these factors must be taken into account when designing and analyzing these systems. In frameless operations, both the shape of the packet arrivals tail distribution and the existence of short-range and long-range correlations strongly impact the packet loss ratio and the average delay. Nevertheless, these effects emerge only weakly in the case of frame-aligned operations, because this enforces the system to introduce a delay in the newly arrived packets (until the beginning of the next frame), and implies that the backlog of accumulated packets is the key quantity for calculating the performance.

1. Introduction

Since the introduction of the ALOHA protocol [1,2], many random access schemes have been proposed. Uncoordinated multiple access is necessary in communications systems where coordinated resource allocation is not possible or is too costly. Classical uncoordinated techniques, such as the ALOHA systems and carrier-sense-based techniques [3,4], such as carrier-sense multiple access with collision avoidance (CSMA-CA), require a retransmission policy to provide reliable communications, which introduces the need for a separate feedback channel and incurs in a possibly large delay.
Recently, a considerable interest for finding new solutions to provide reliable, low-latency communication in dynamical systems has emerged, motivated by the requirements of 5G communications, e.g., in visible light communications [5], in CDMA systems [6], or in LoRa-based communications [7]. An account of modern random access protocols is given in [8], and the role of multiple-access in non-orthogonal communications with many users is discussed in [9,10].
One promising uncoordinated multiple access technique is coded-slotted ALOHA (CSA), also known as irregular repetition ALOHA (IRSA), which has been extensively studied in the literature in the asymptotic regime (where the packet replicas are spread over a large interval) and in the finite-length regime [11,12,13]. In CSA, transmissions are organized into fixed-length frames, each consisting of n slots, and users arrange the transmission of several copies of a packet in randomly chosen slots within the frame. This approach is known as frame-synchronous CSA (FS-CSA) [14]. Alternatively, the transmission of the packet copies can be performed immediately after the packet arrival, randomly within the next n slots, avoiding the need for synchronization among users at the frame level. This approach is known as frameless or frame-asynchronous CSA [15,16] (FA-CSA), where the time span for the transmission of the packet copies forms implicitly the local frame for each individual user. Extensions of CSA, and in particular of FA-CSA, to asynchronous, non-slotted random access have also been proposed and analyzed [17,18].
In either version, CSA creates time diversity for the transmissions and makes it possible to sustain high throughput and low energy-consumption compared to slotted ALOHA, making this approach of combining random transmission with encoding at the packet level a good candidate for next generation random access with many simultaneous active users.
CSA has recently been adopted in commercial satellite communication systems, such as in DVB-RCS2 [19], and is currently under study as the basis for next-generation multiple-access technology in internet-of-things (IoT) applications [20], and for massive machine-type communications (mMTC) in 5G networks under the so-called unsourced model where all users use the same codebook and the receiver aims to return an unordered list of messages. In these settings, CSA attains much better throughput and energy efficiency than random coding and pure ALOHA [21].
The majority of works on CSA assume a collision channel where decoding is possible only if a slot contains a single packet. As shown in [22,23,24,25], for instance, there exists a connection among different types of systems and codes in graphs. Indeed, a CSA system can be described by a bipartite graph and successive interference cancellation (SIC) can be performed over the graph similarly to decoding of graph-based codes [26,27,28]. Therefore, the performance of CSA resembles that of graph-based codes, i.e., the packet loss rate curve displays generally a waterfall region for medium-to-high system loads and it shows and error floor for low loads.
In the aforementioned protocols, all the replicas are transmitted using the same transmit power. Thus, the received power diversity caused by natural fading is not significant enough and the capture effect is not fully used to enhance the throughput of these protocols. Further improvement is obtained by exploiting the capture effect, which can be achieved by introducing transmit power diversity or exploiting the natural fading [29]. In [30] enhancing the physical layer of CSA-like protocols is investigated and an optimal received packet power distribution is obtained. In [31], transmit power diversity is proposed to enhance the performance of CSA-like protocols and an optimal transmit power distribution is derived and analyzed. In [32], author exploit non-orthogonal multiple access techniques (NOMA) into FA-CSA-like systems, optimizing the degree distribution to maximize the throughput.
Related to the FS-CSA and FA-CSA techniques, several of the studies assume that users join the system according to a slot-based Poisson arrival process, and that arrivals in different slots are statistically independent. This has the main advantage of allowing a tractable mathematical model for the packet loss ratio ( PLR ) and an analysis of the system stability [33]. This mathematical framework can be extended to the case of multi-packet or multi-user detection (MUD) [34,35], which consists in having receivers capable of successfully decoding  k > 1  packets transmitted in the same slot, by employing successive interference cancellation (SIC) at the receiver. Under k-MUD, the throughput scales almost linearly with k until saturation (for Poisson arrival processes), increasing significantly the capacity of the system.
Nevertheless, it has long been noted that traffic of communications networks is statistically long-range dependent and heavy-tailed, and these properties cannot be overlooked in their performance studies (see [36] and references therein). For instance, in massive random access or in mMTC, network traffic at the packet level is a superposition of numerous individual data flows between pairs of hosts, possibly correlated. A high variance in the on and off periods in these individual streams can physically induce LRD in the aggregated traffic, which can be mathematically modeled with heavy-tailed distributions. Further, though CSA has been extensively analyzed in the literature under the throughput-stability trade-off, these works assume a Poisson point process for the packet arrivals for mathematical tractability, so their results and insights are limited to an idealized traffic model. For this reason, in this work, we study the impact of the correlation and the marginal distribution of the load process on the performance of the system. On the one hand, we model the arrival process with a version of the M/G/ process able to exhibit a correlation structure decaying slowly in time. Given the independence among frames in FS-CSA, this variation should only take effect on FA-CSA. On the other hand, we vary the marginal distribution of the arrival process using discrete versions of the Lognormal and the Pareto distributions, with the objective of investigating the influence of the right tail. In this case, both techniques should be affected by the change. Results obtained confirm these hypotheses.
The remainder of the paper is organized as follows. In Section 2, we review the operations of frame-synchronous and frame-asynchronous slotted ALOHA multiple access protocols. The different arrival processes considered in this work are introduced in Section 3. The performance evaluation and numerical results are presented in Section 4, and finally some concluding remarks are summarized in Section 5.

2. System Model

2.1. Coded-Slotted ALOHA
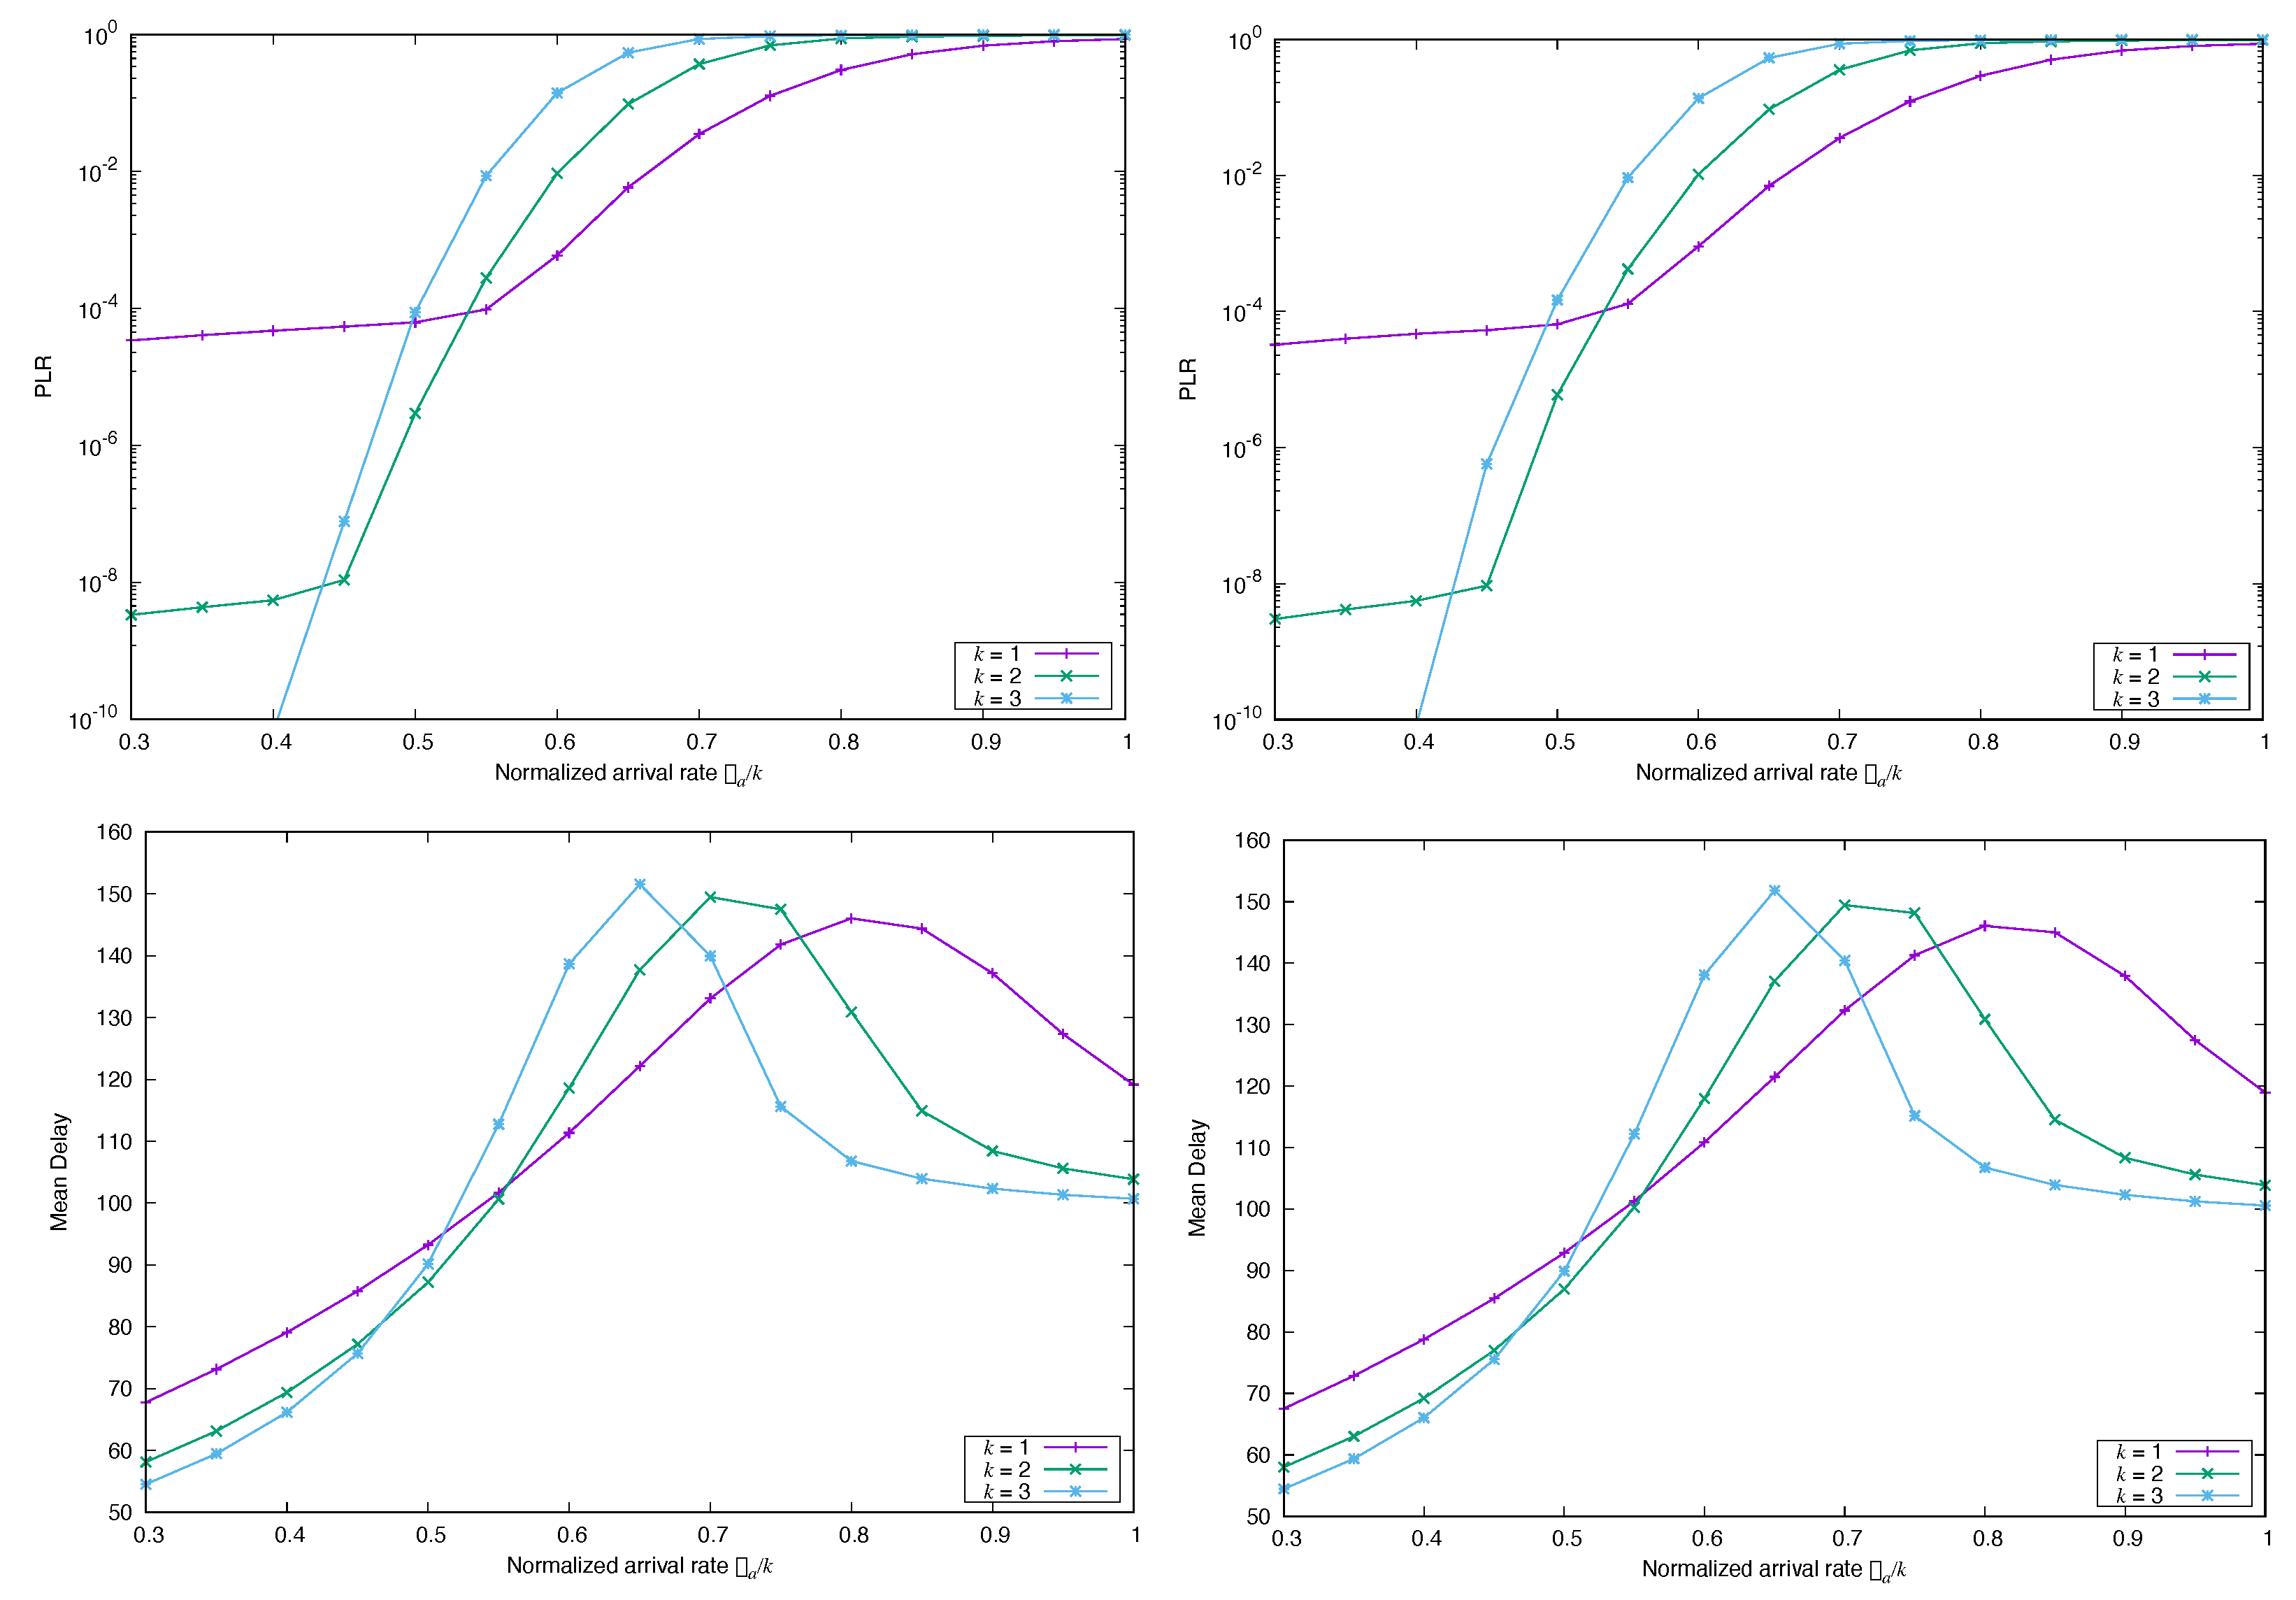
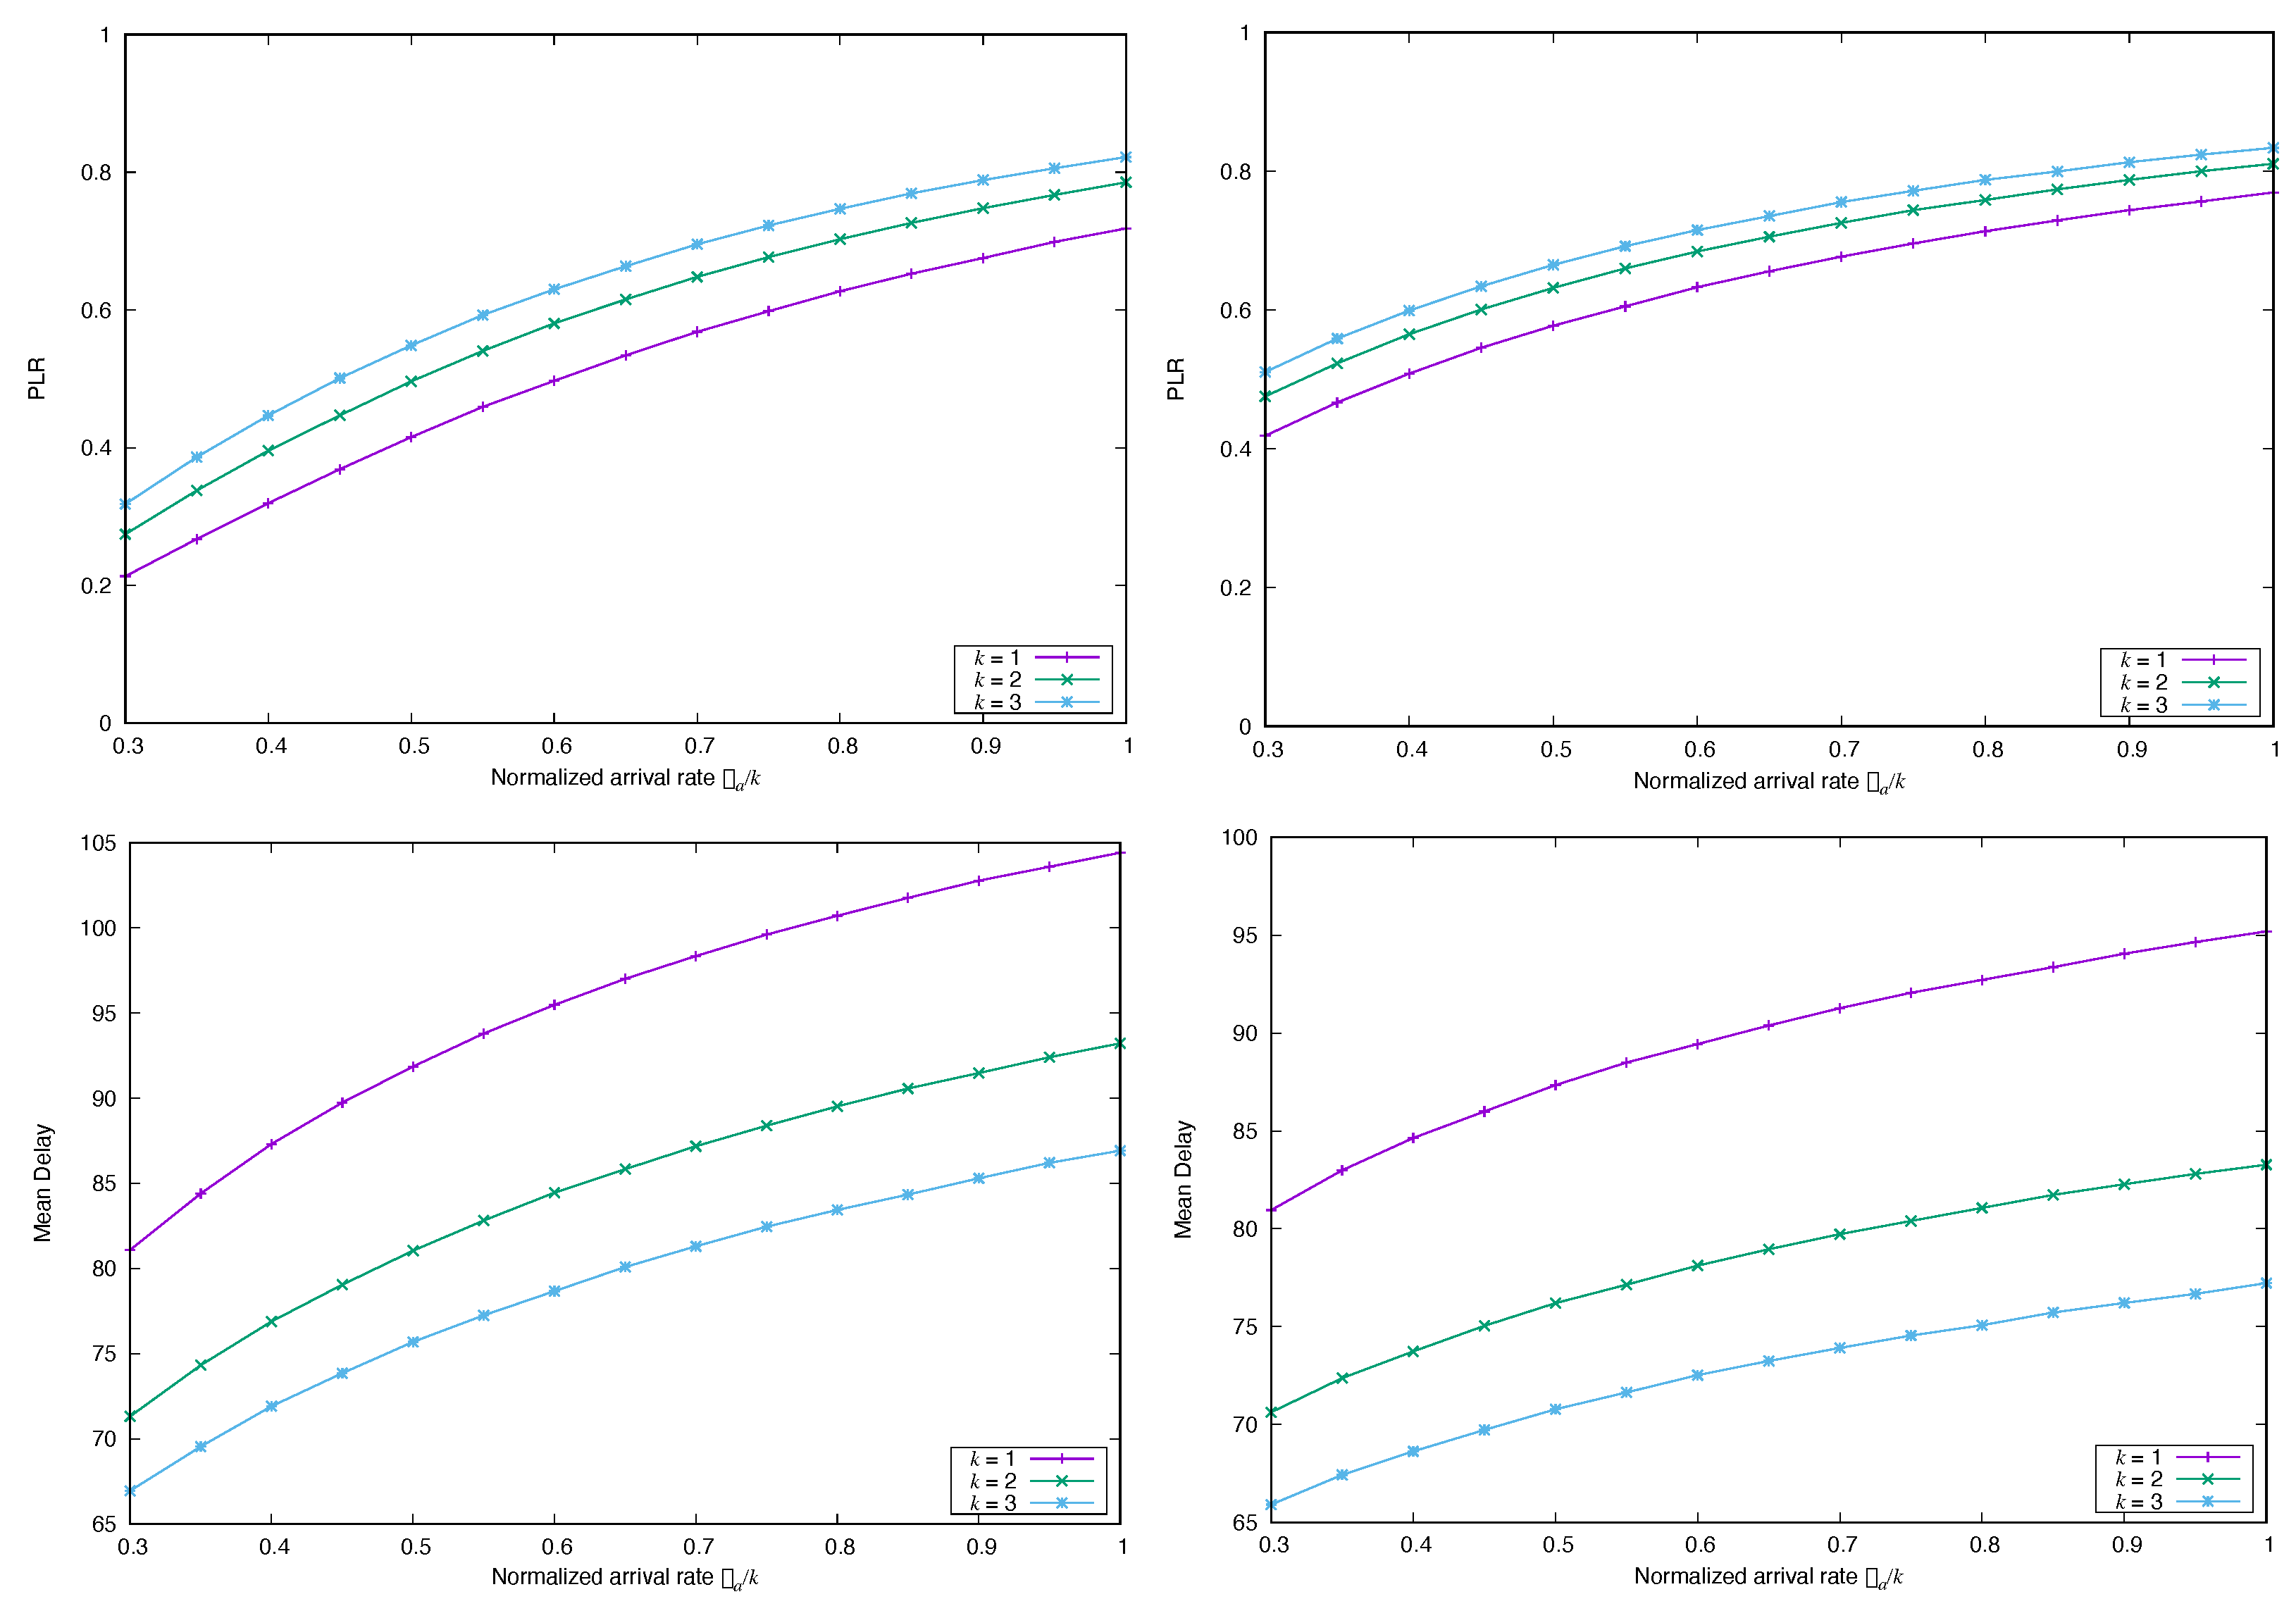
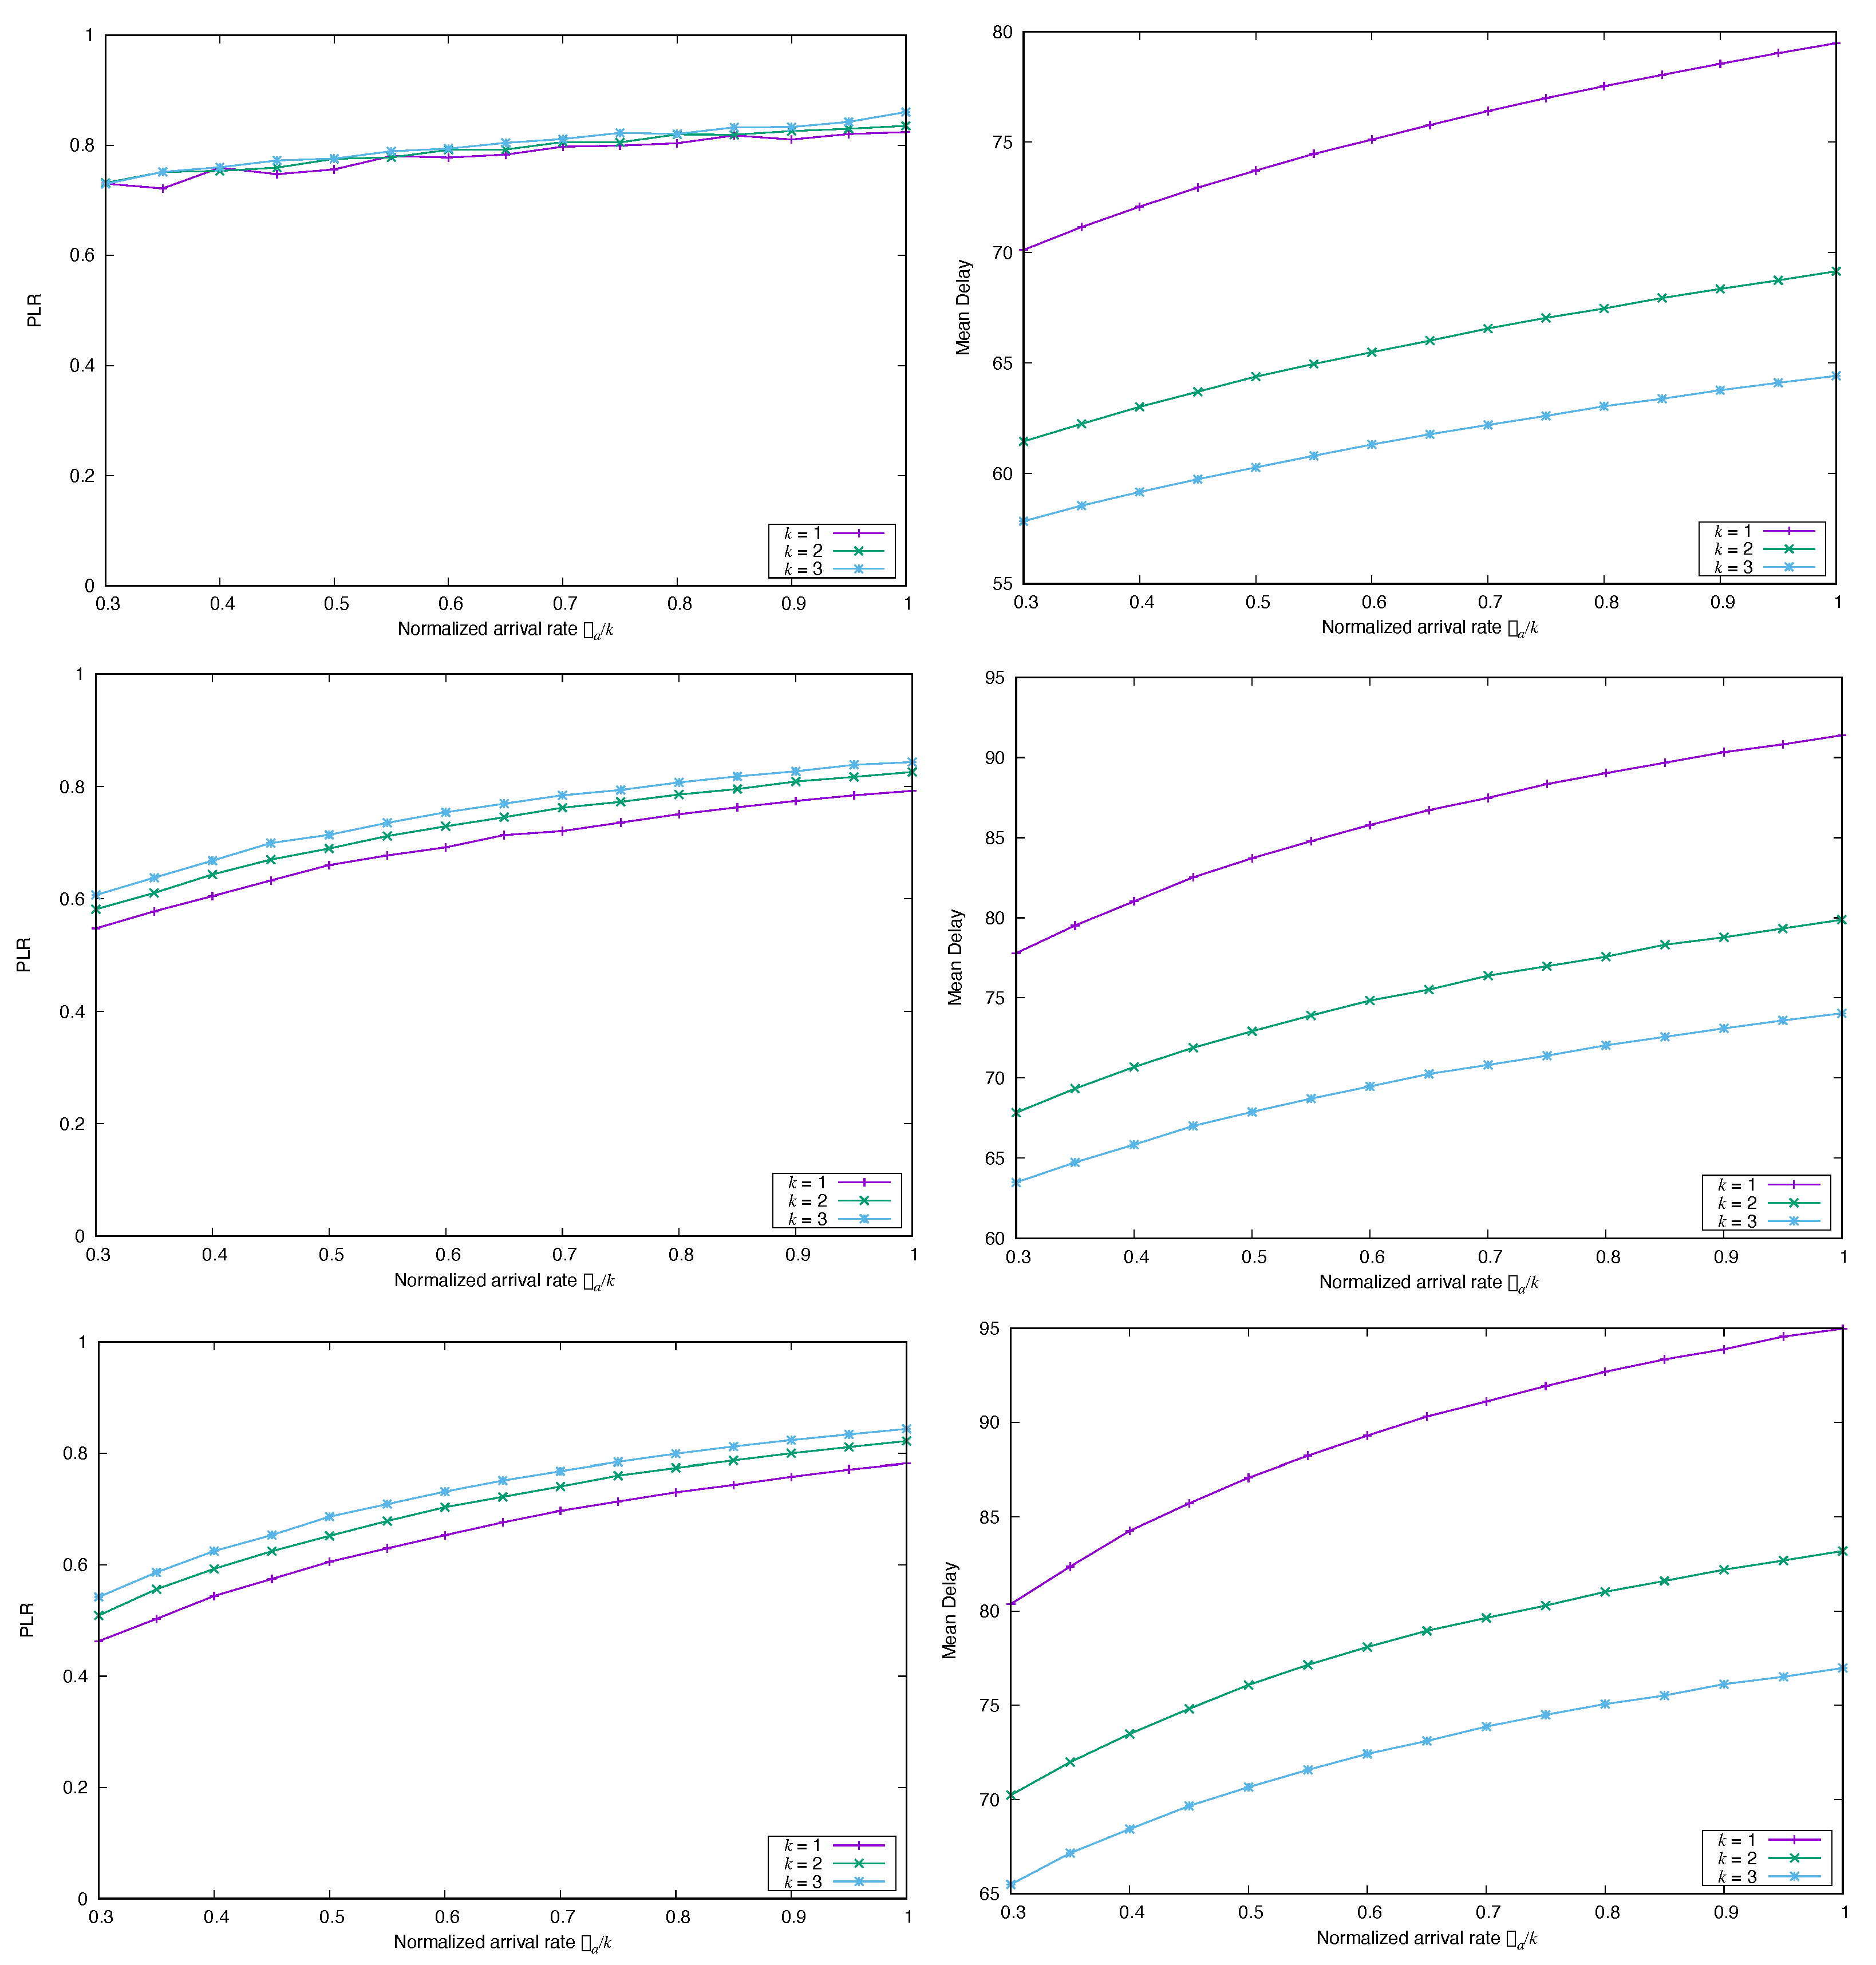
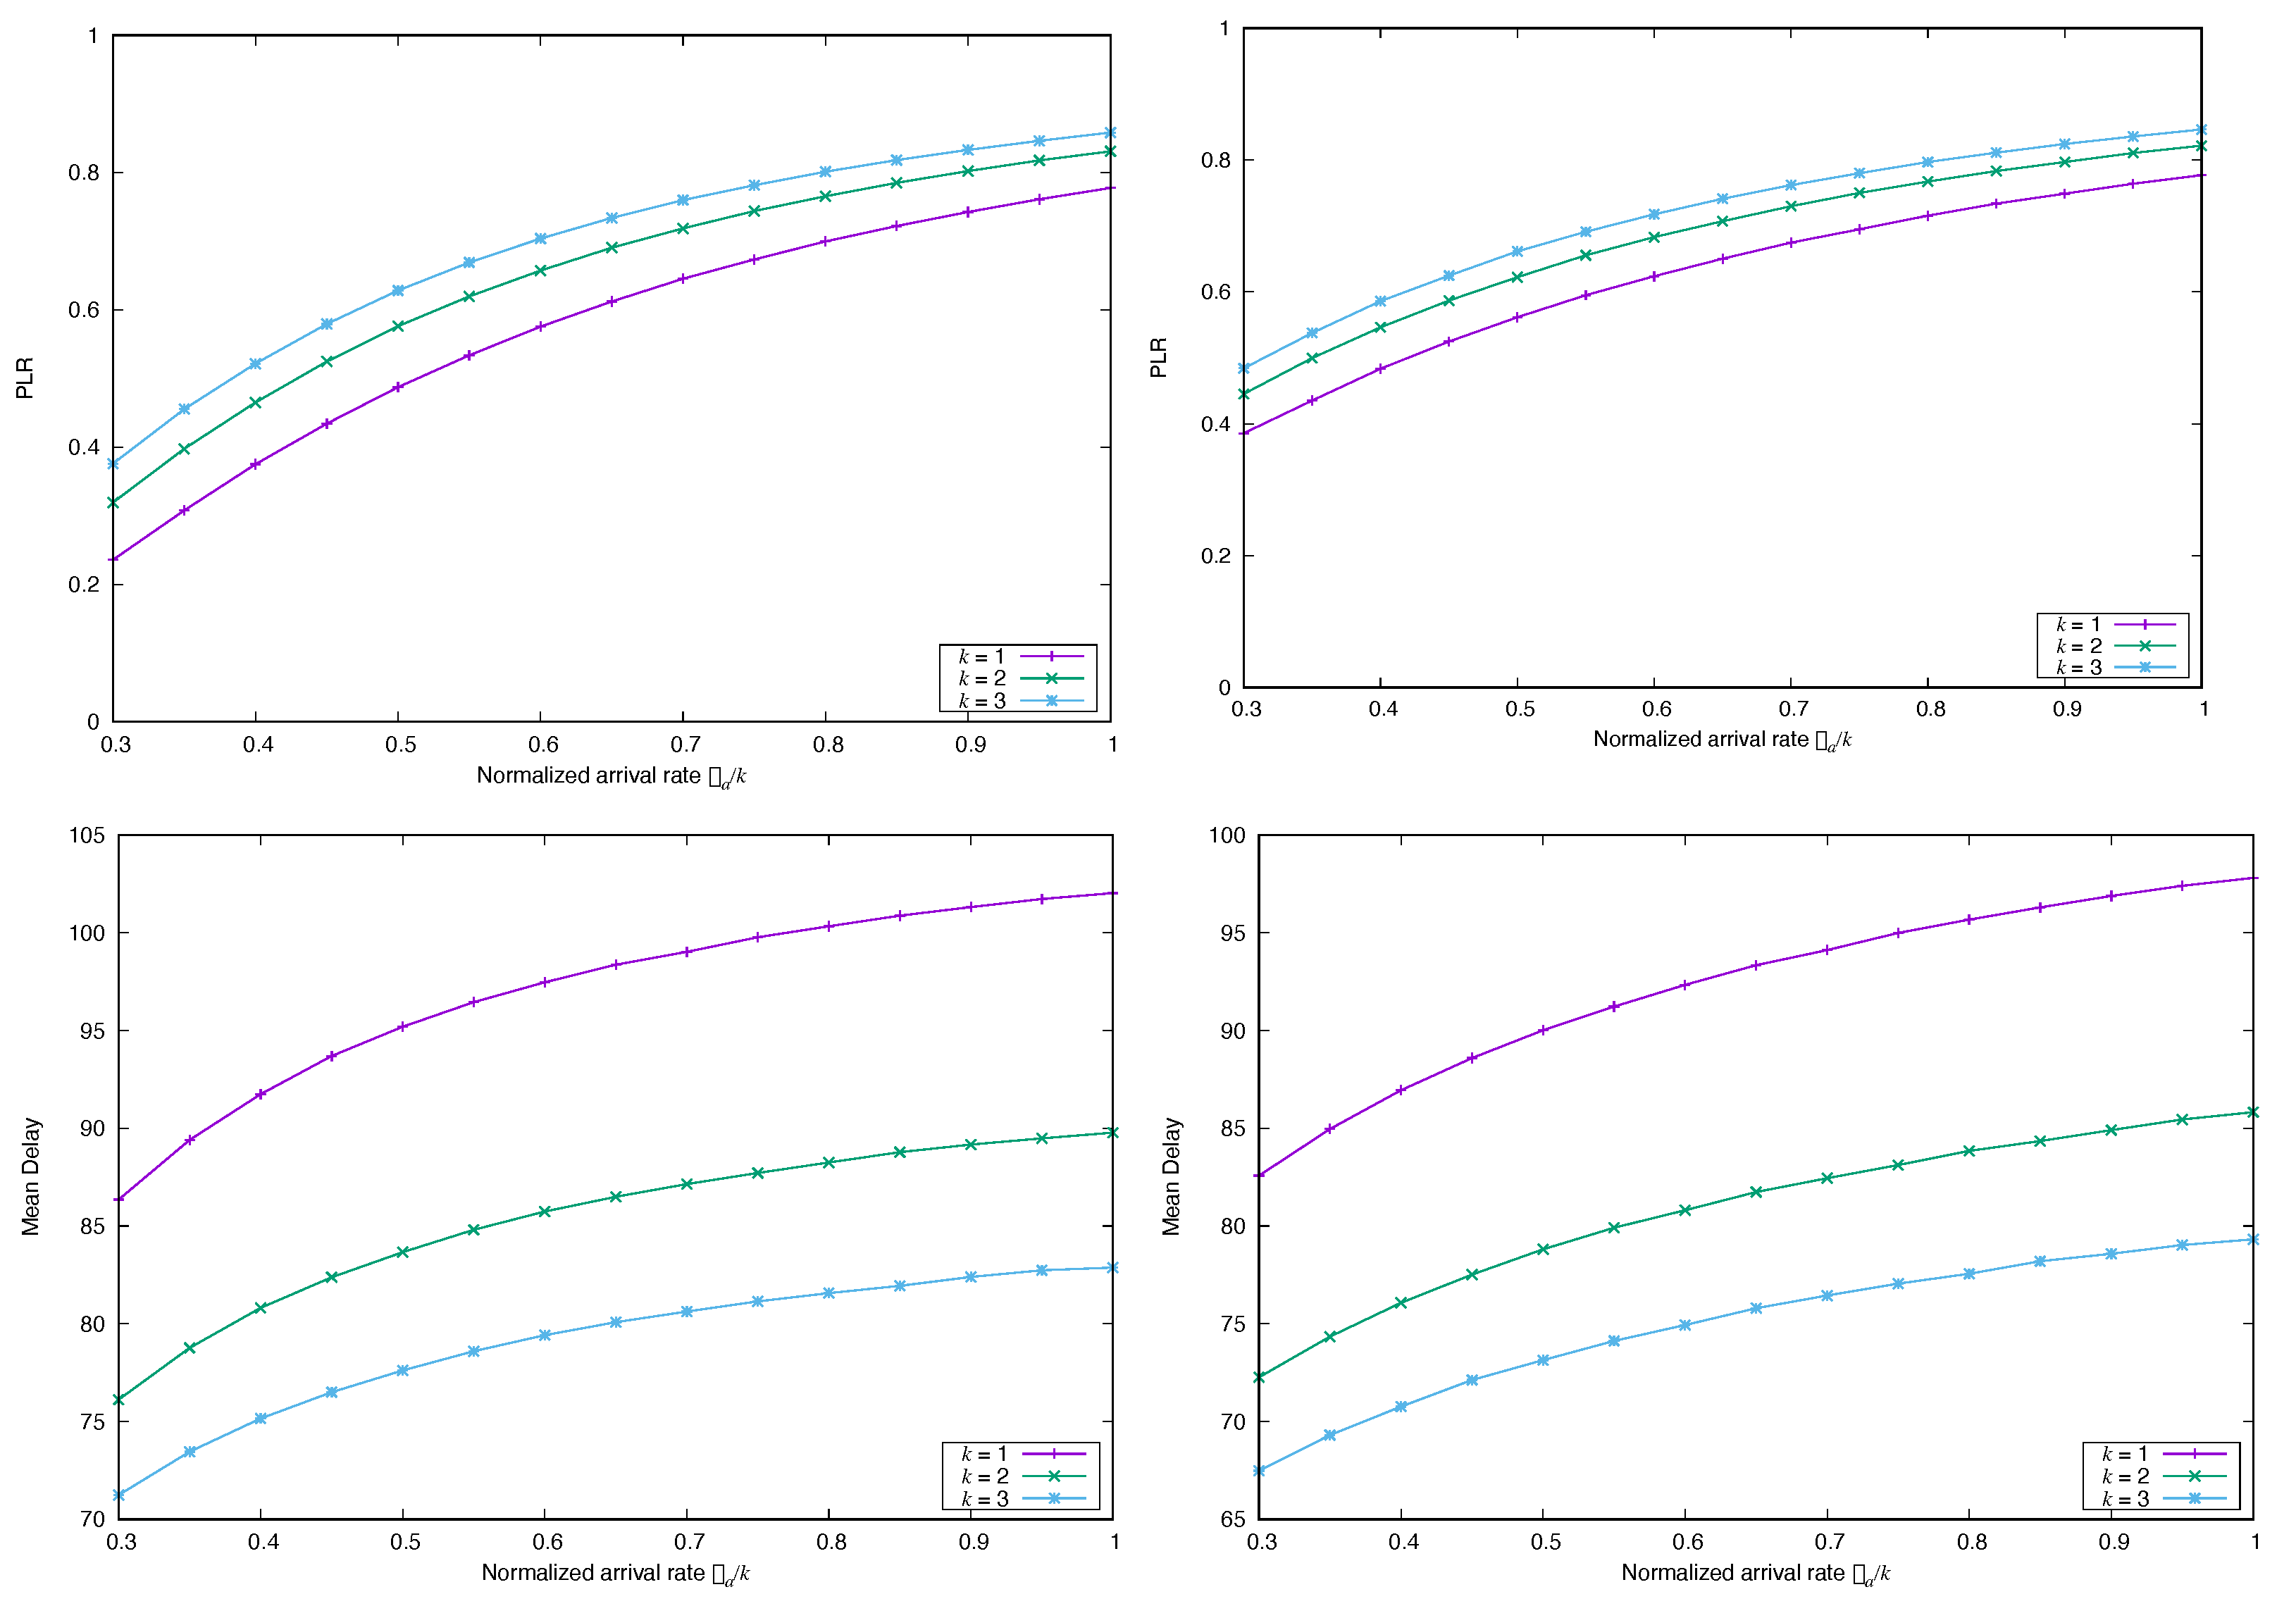
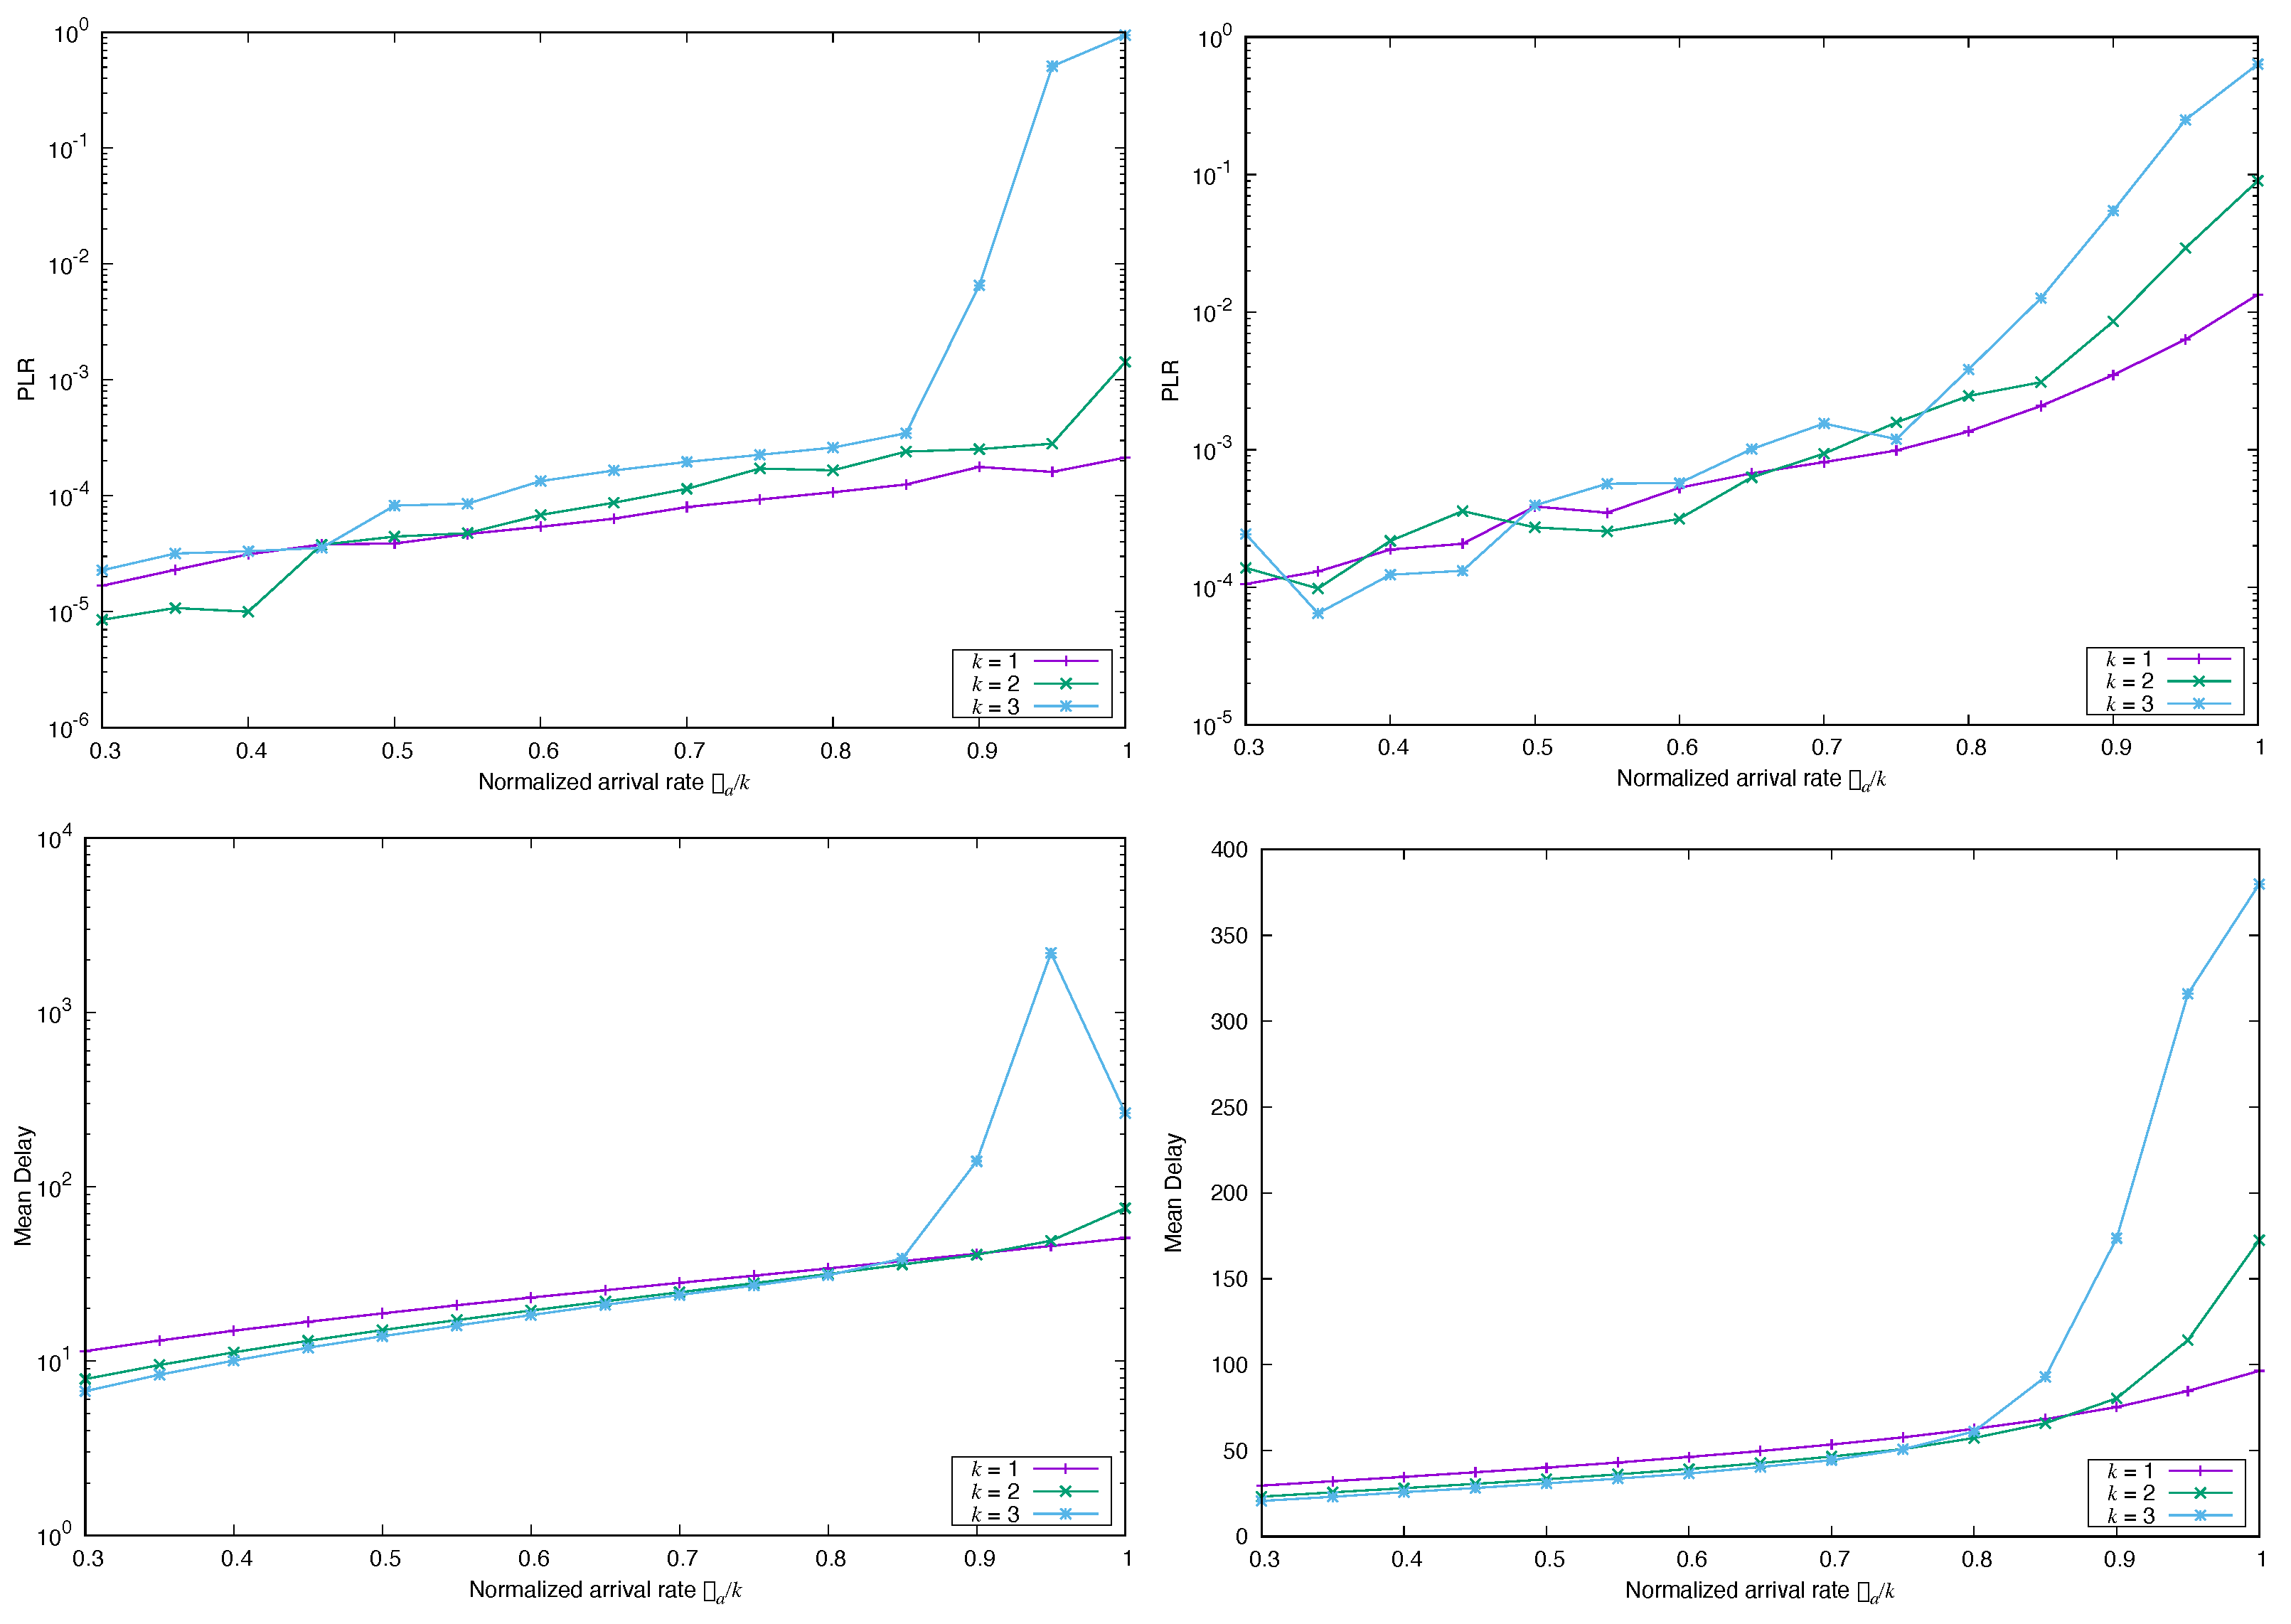
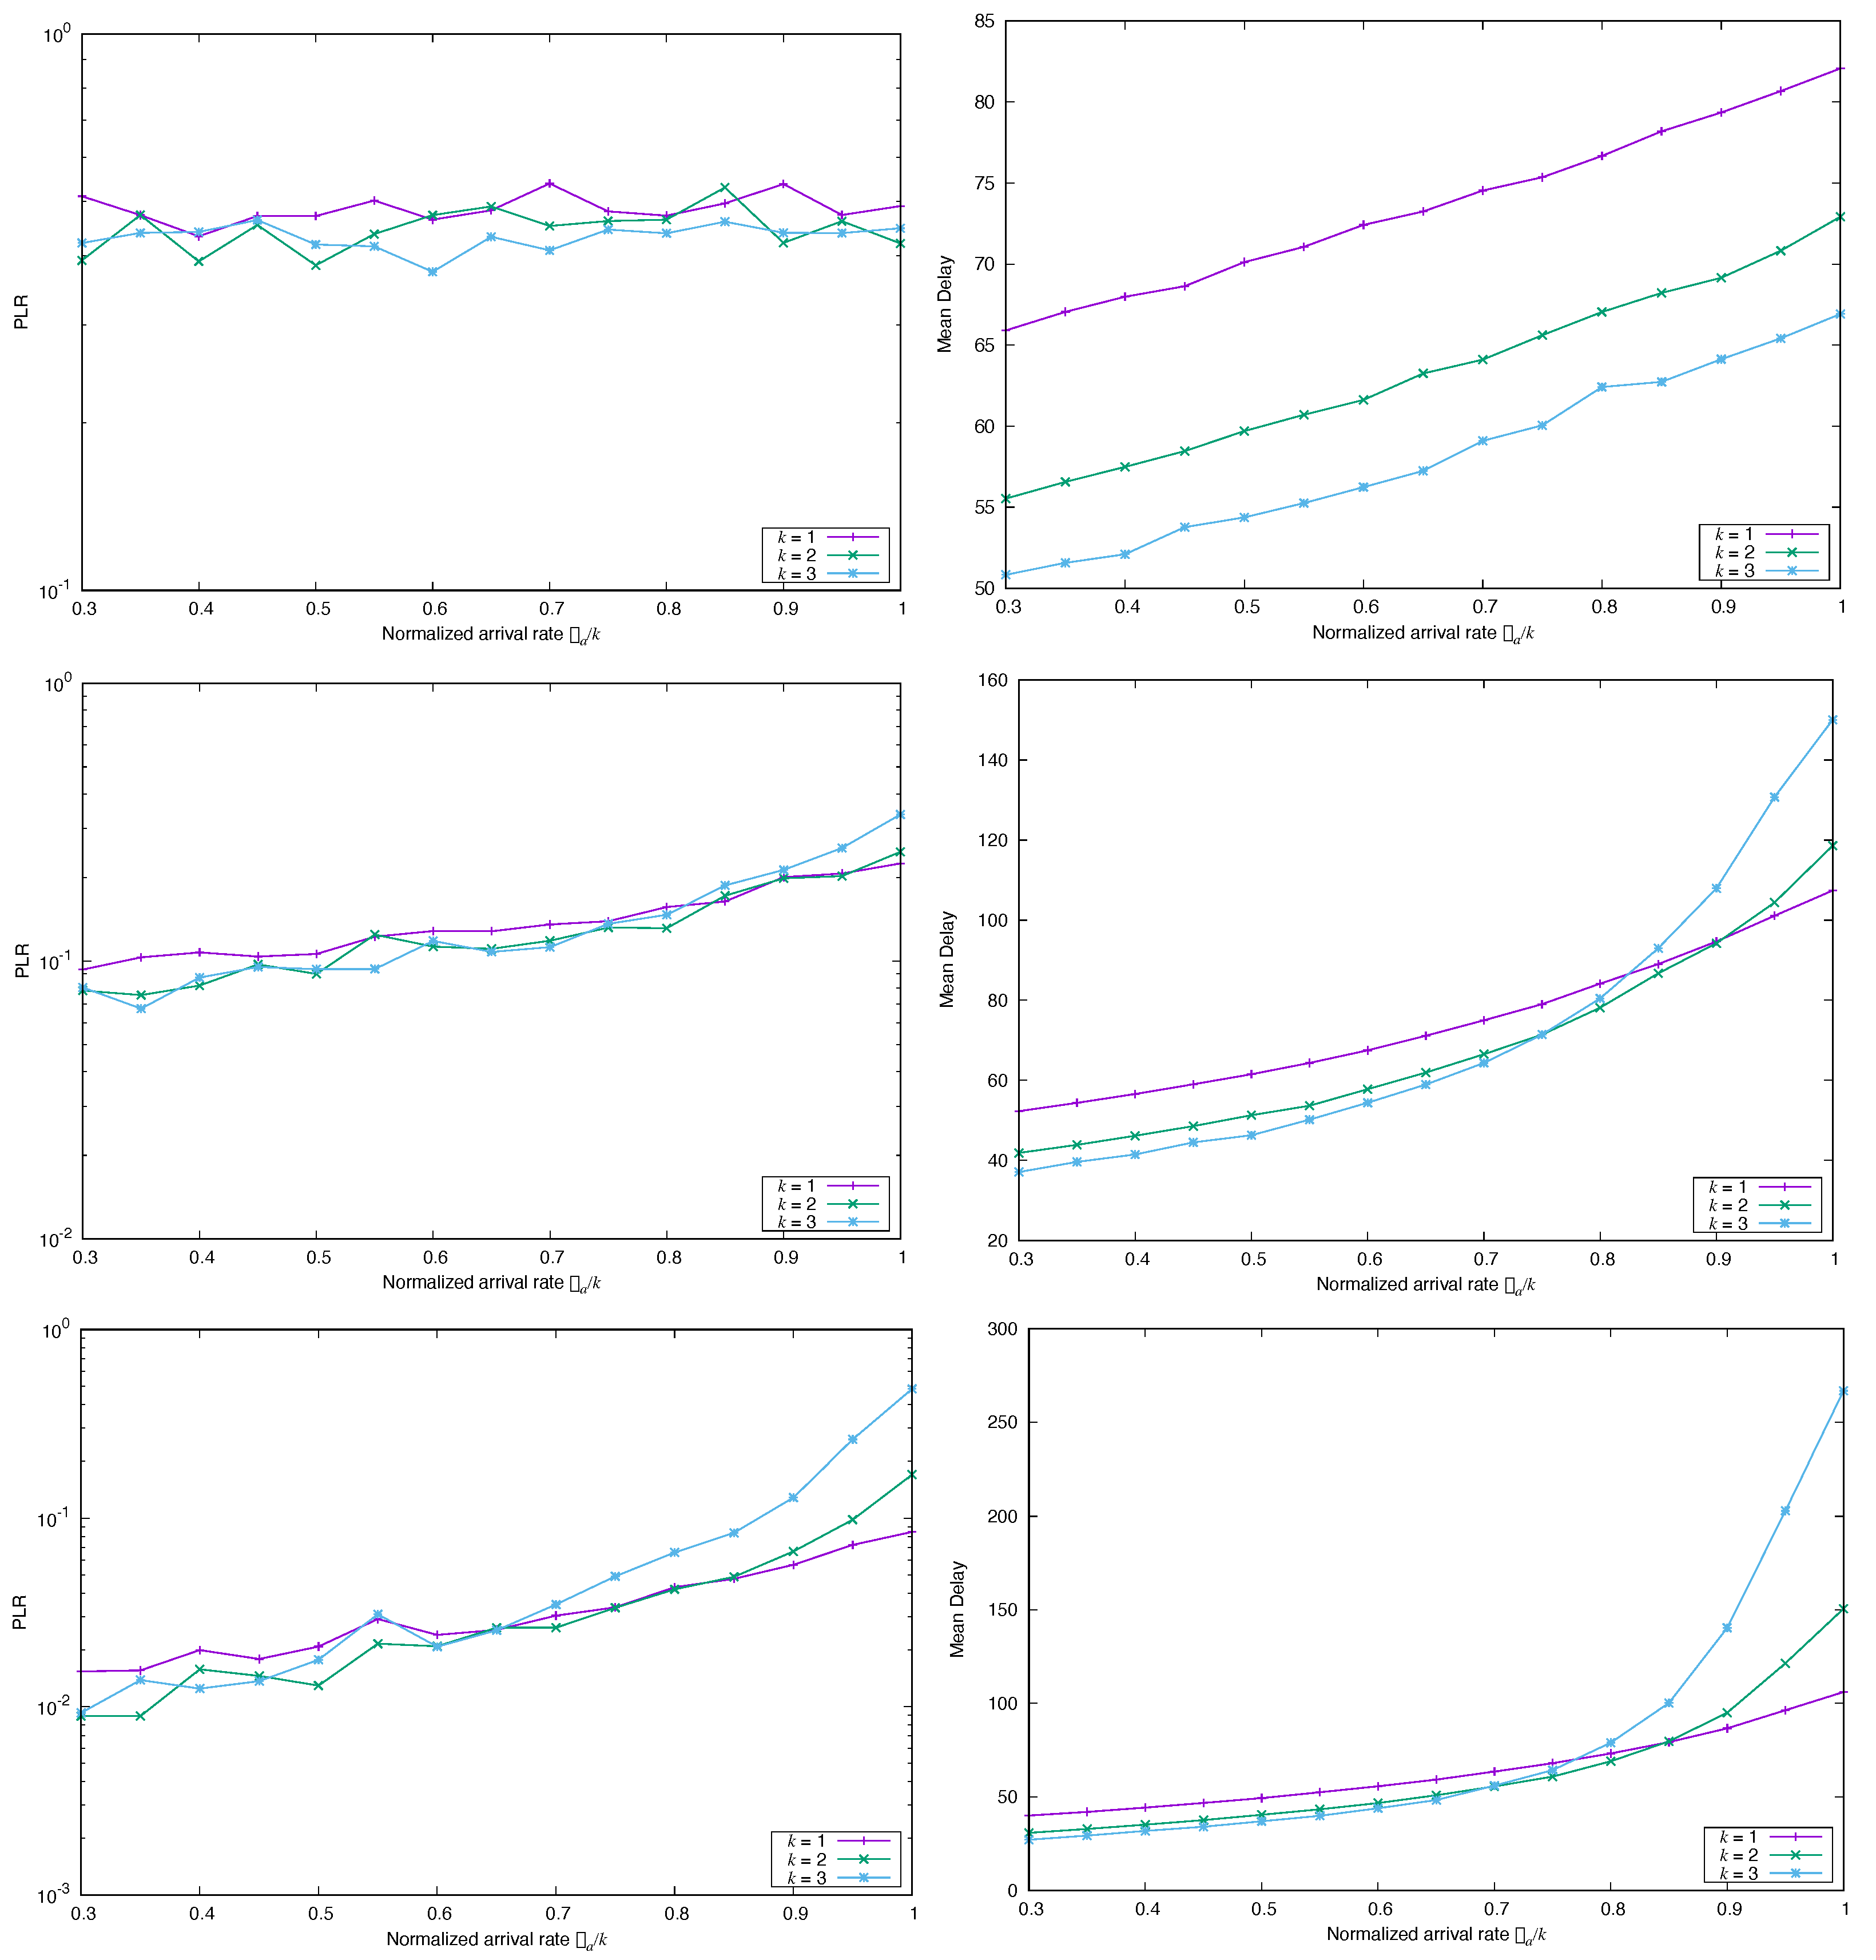
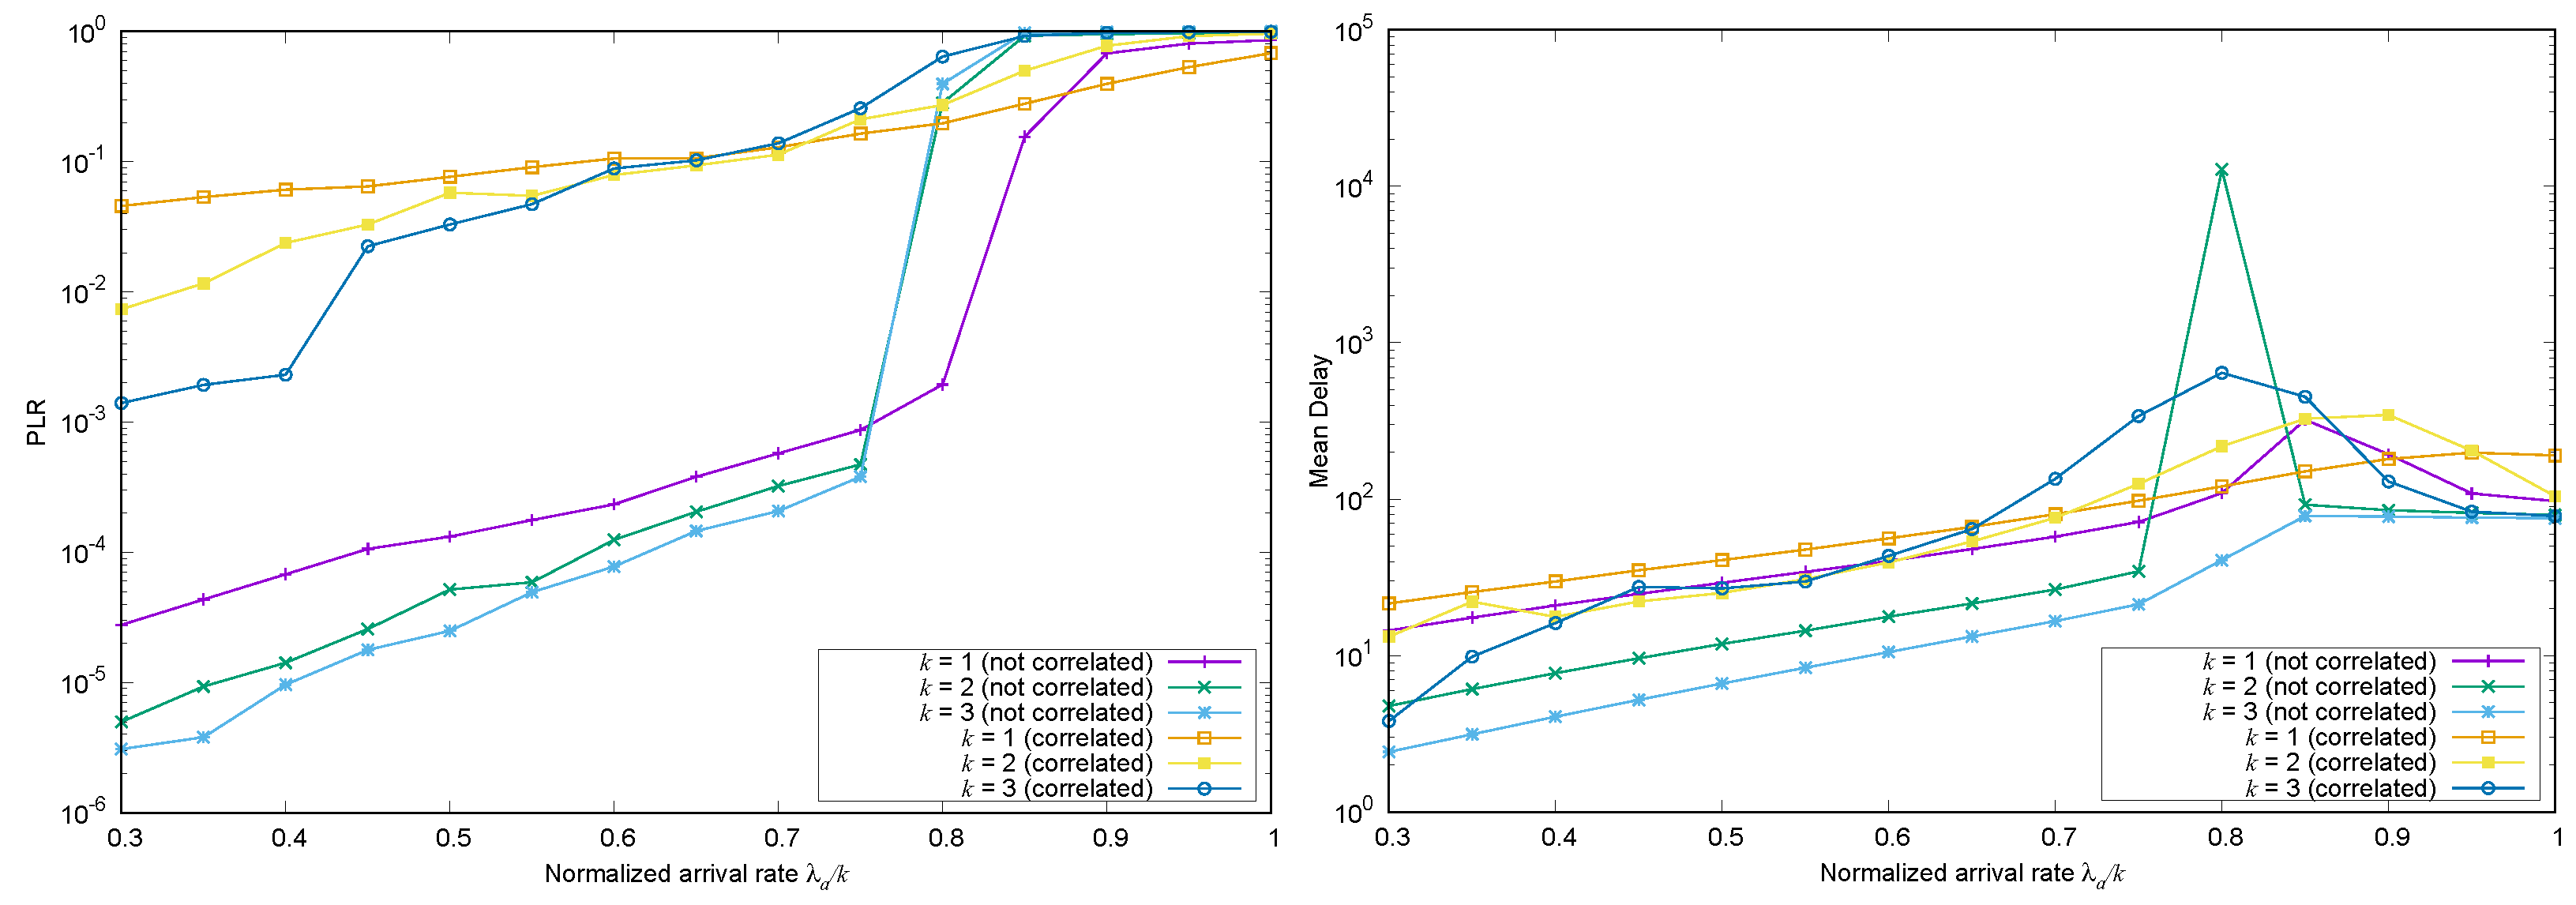
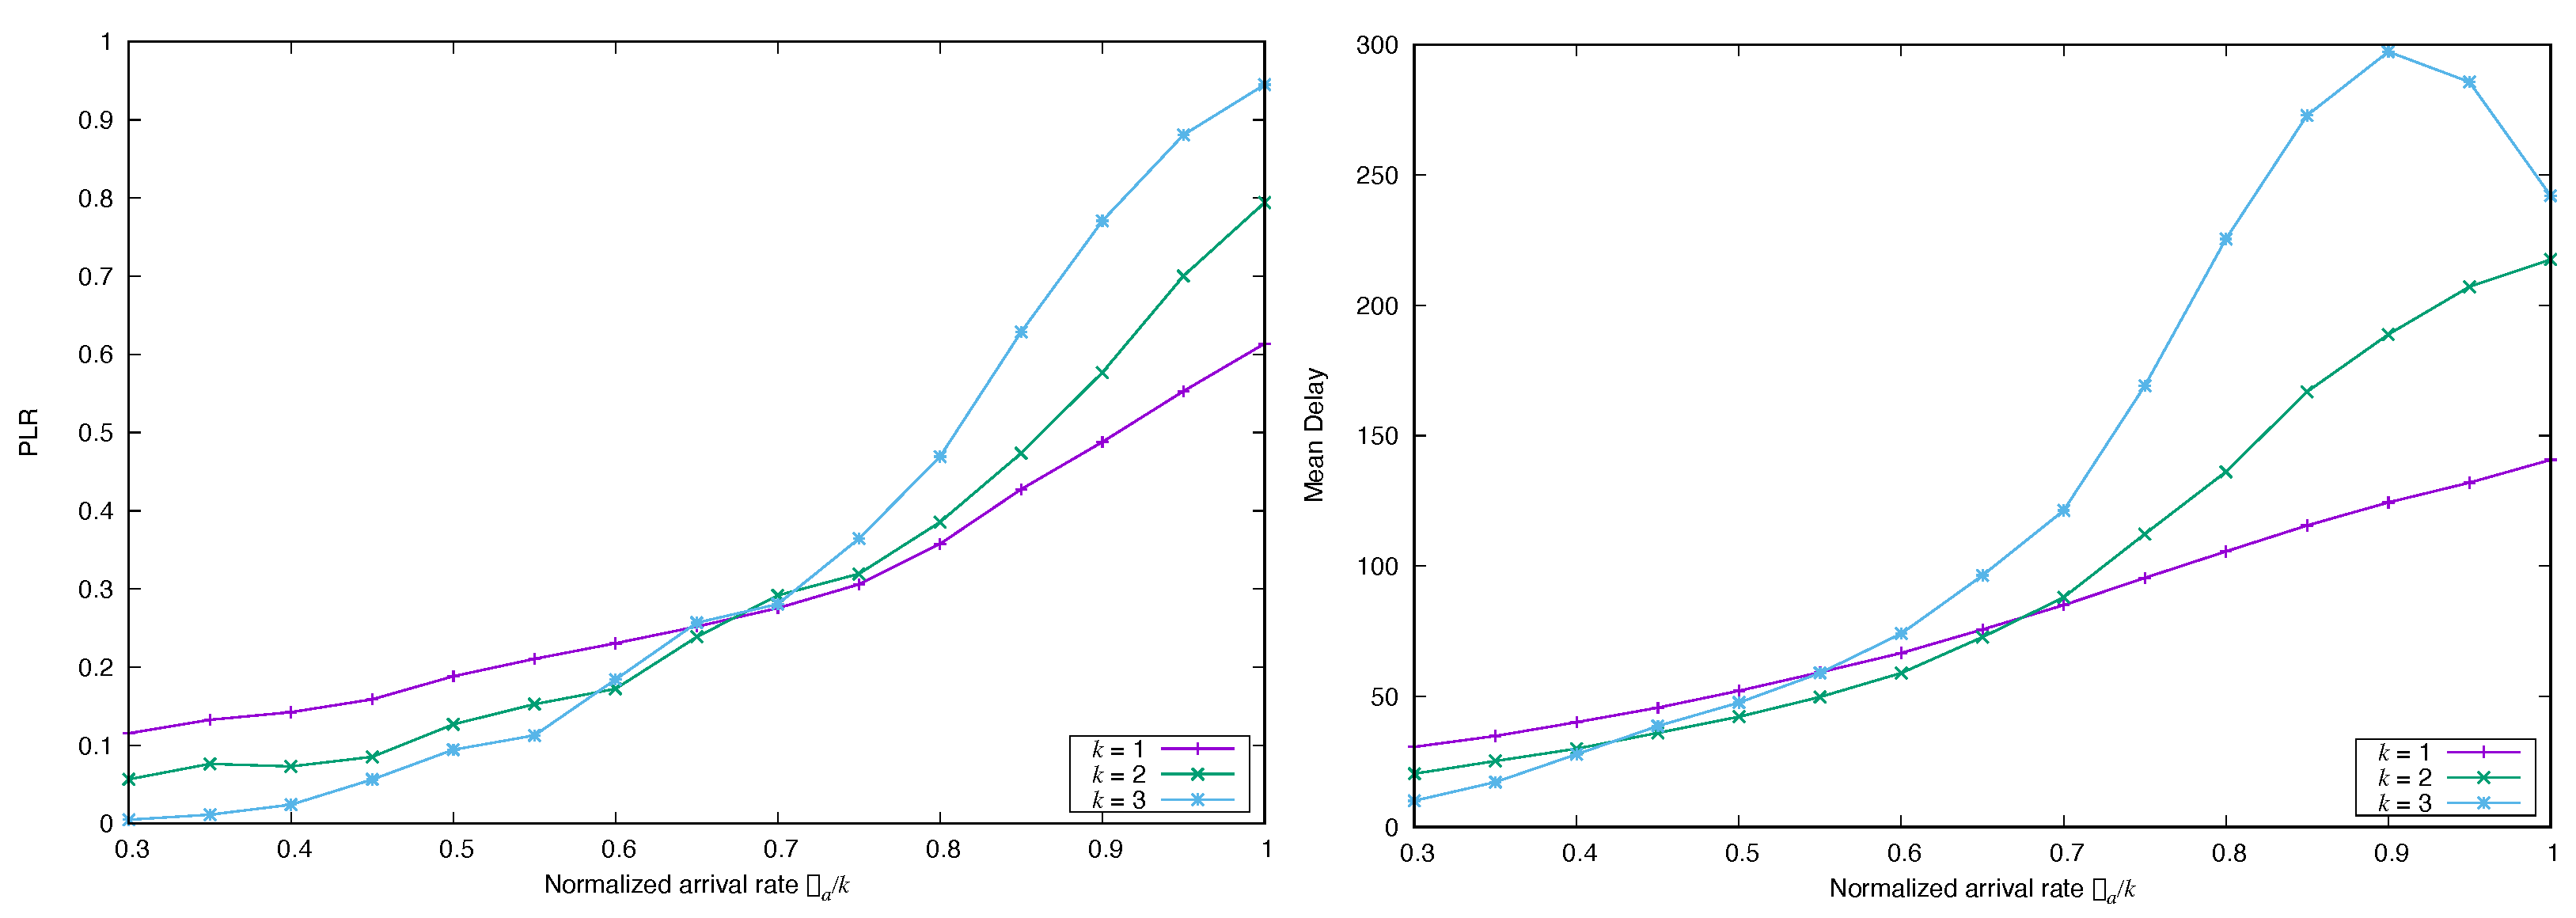
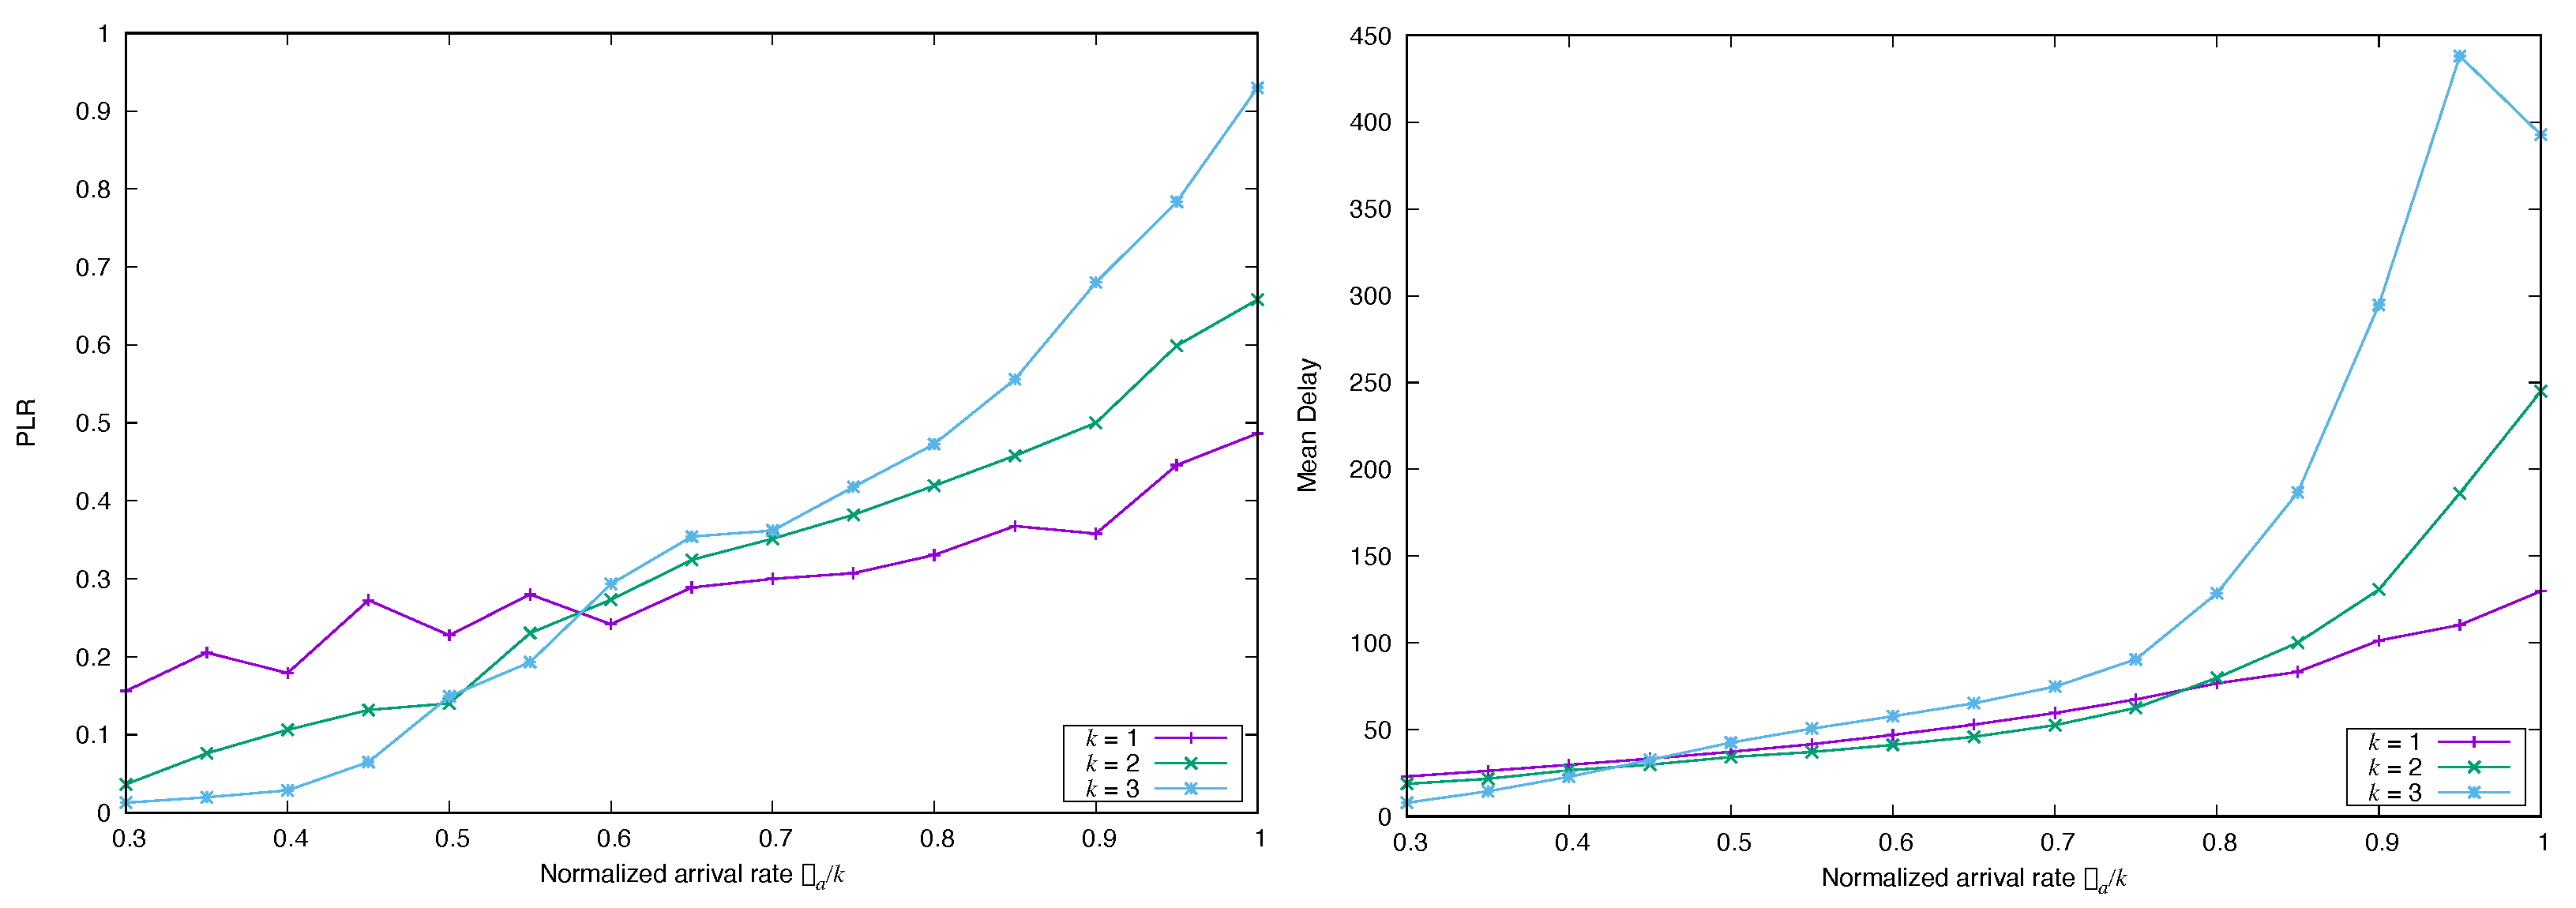
In our system, packets arrive randomly to a group of nodes which share a slotted channel. We denote by  λ a  the mean arrival rate (packets per slot), and do not assume that arrivals in different slots are statistically independent. Without loss of generality, we consider that all the packets have a transmission time equal to the duration of the time slot, and that the nodes attempt transmission independently at the beginning of a slot without sensing the channel previously. Contrary to ordinary ALOHA, for every packet to be transmitted, the sender generates copies or replicas according to a predefined probability mass function that will be specified below in Section 2.2, and each of these replicas is transmitted in a random slot. Thus, the replicas constitute a form of repetition encoding as seen from each transmitting node. We introduce at this point some useful terminology: a node which picks a value as its repetition schedule for a packet is a degree- node, and a time slot in which r packets are transmitted simultaneously will be termed a degree-r slot. A key assumption in this paper is the k-MUD or k-MPR (multi-user detection, or multi-packet reception, equivalently) capability achievable with the use of SIC (successive interference cancellation): we suppose that, all the packets in a degree-i slot, for any  1 i k  can be successfully decoded at the intended receiver. This implies also that the interference due to a correctly decoded packet can be completely removed from any other slot containing a replica of this packet, thus reducing the effective interference that would remain at that slot and enabling other decoding decisions. Note that, regardless of its successful or unsuccessful decoding, every packet is transmitted times, where is a random number.
In this paper, we focus on two basic performance metrics for this system
  • The packet loss ratio ( PLR ). It is the probability that a packet is not decoded correctly. Observe that this event is the non-existence of resolvable patterns of decoding in any of the slots containing some replica of the packet.
  • The delay of a decoded packet. This is defined as the number of slots between the user’s arrival and the slot where the packet is resolved and correctly decoded.
As for the operation of the system, we distinguish and analyze two variants of coded-slotted ALOHA, depending on the use of a coordinated frame for grouping the transmissions.
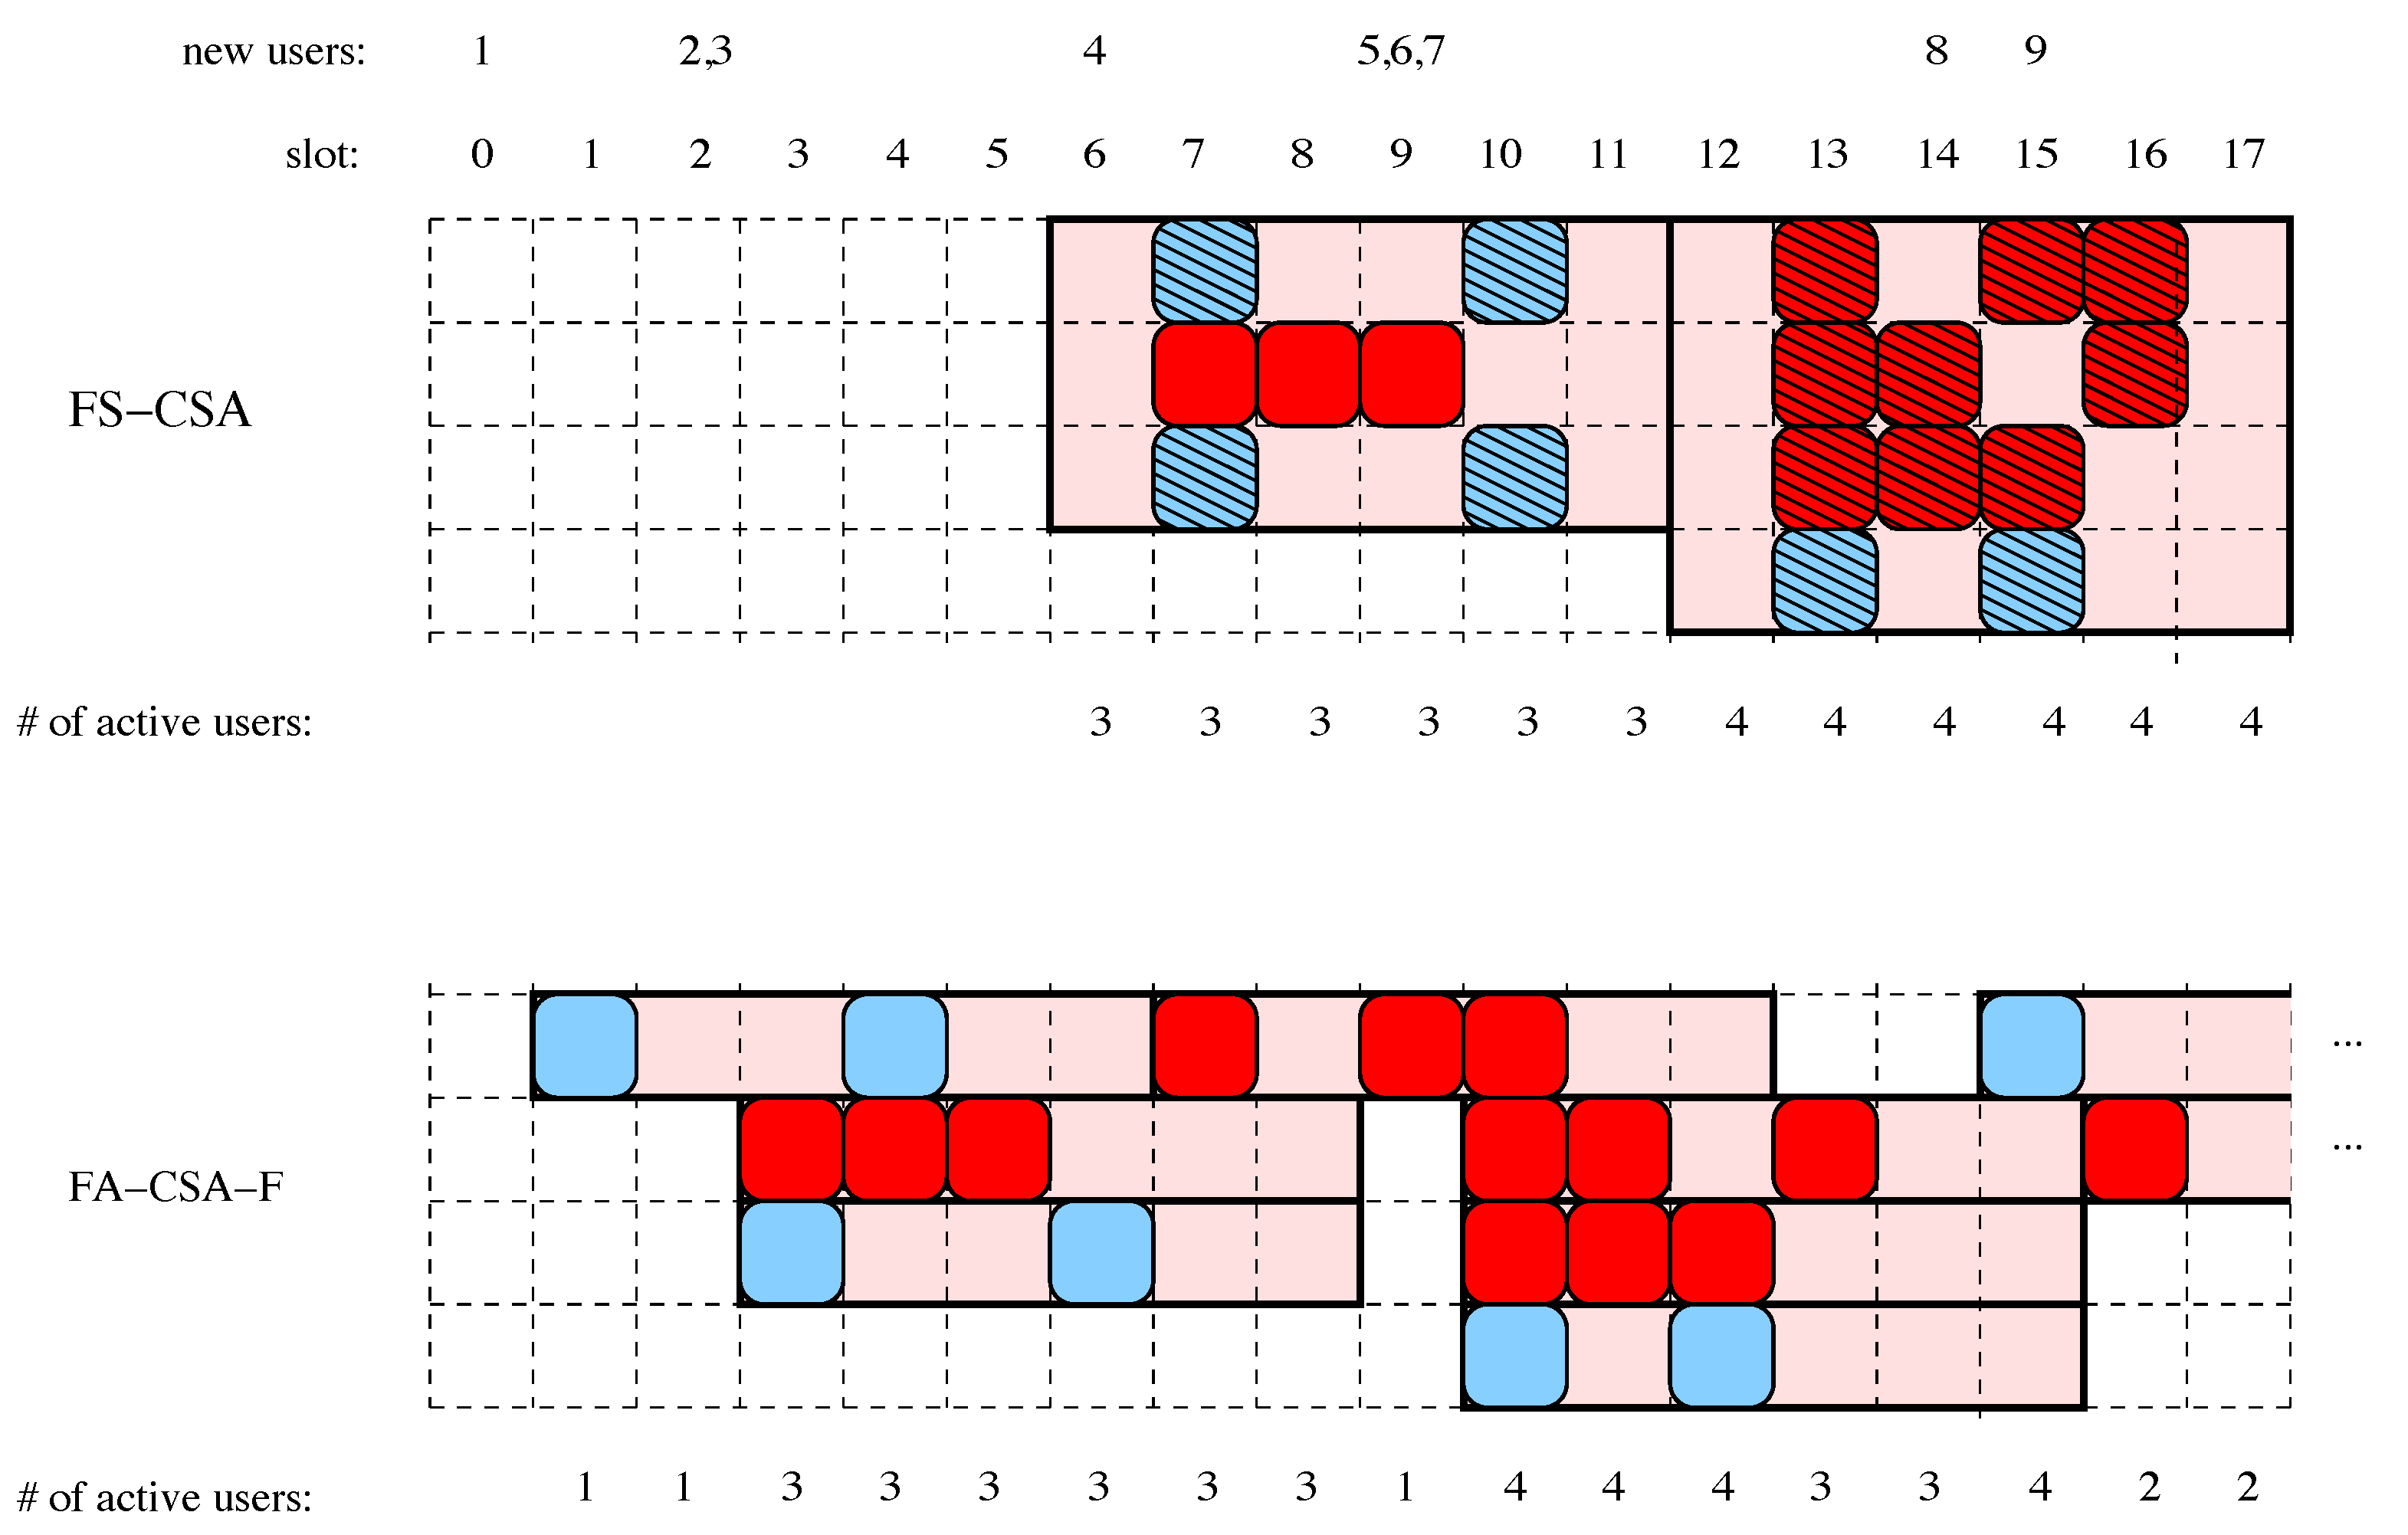
  • Frame synchronous CSA (FS-CSA). In this scheme, time is divided in frames, each consisting of n slots. Any new packet from a transmitter must wait until the beginning of the next frame for attempting the transmission of its replicas, which are randomly and uniformly distributed over the frame time. A node with packets being scheduled for transmission in a frame is called an active node, thus the number M of active nodes in the frame is a random variable.
    For the receiver, in FS-CSA decoding is performed slot-by-slot by applying the following strategy: first, in a given slot all the interference caused by packets that have been successfully decoded in the previous slots of the frame is removed. If, after this step, the result is a degree-k (or lower) slot, then all the packets in it are decoded and the receiver proceeds to look for other slots in the frame from which the interference due to those newly decoded packets can be further removed. The decoding process finishes when the receiver cannot find any slots in the frame to which k-MUD can be applied to. Thus, notice that, at the end of a frame, all the packets from the active users will have been either decoded successfully or dropped at the receiver.
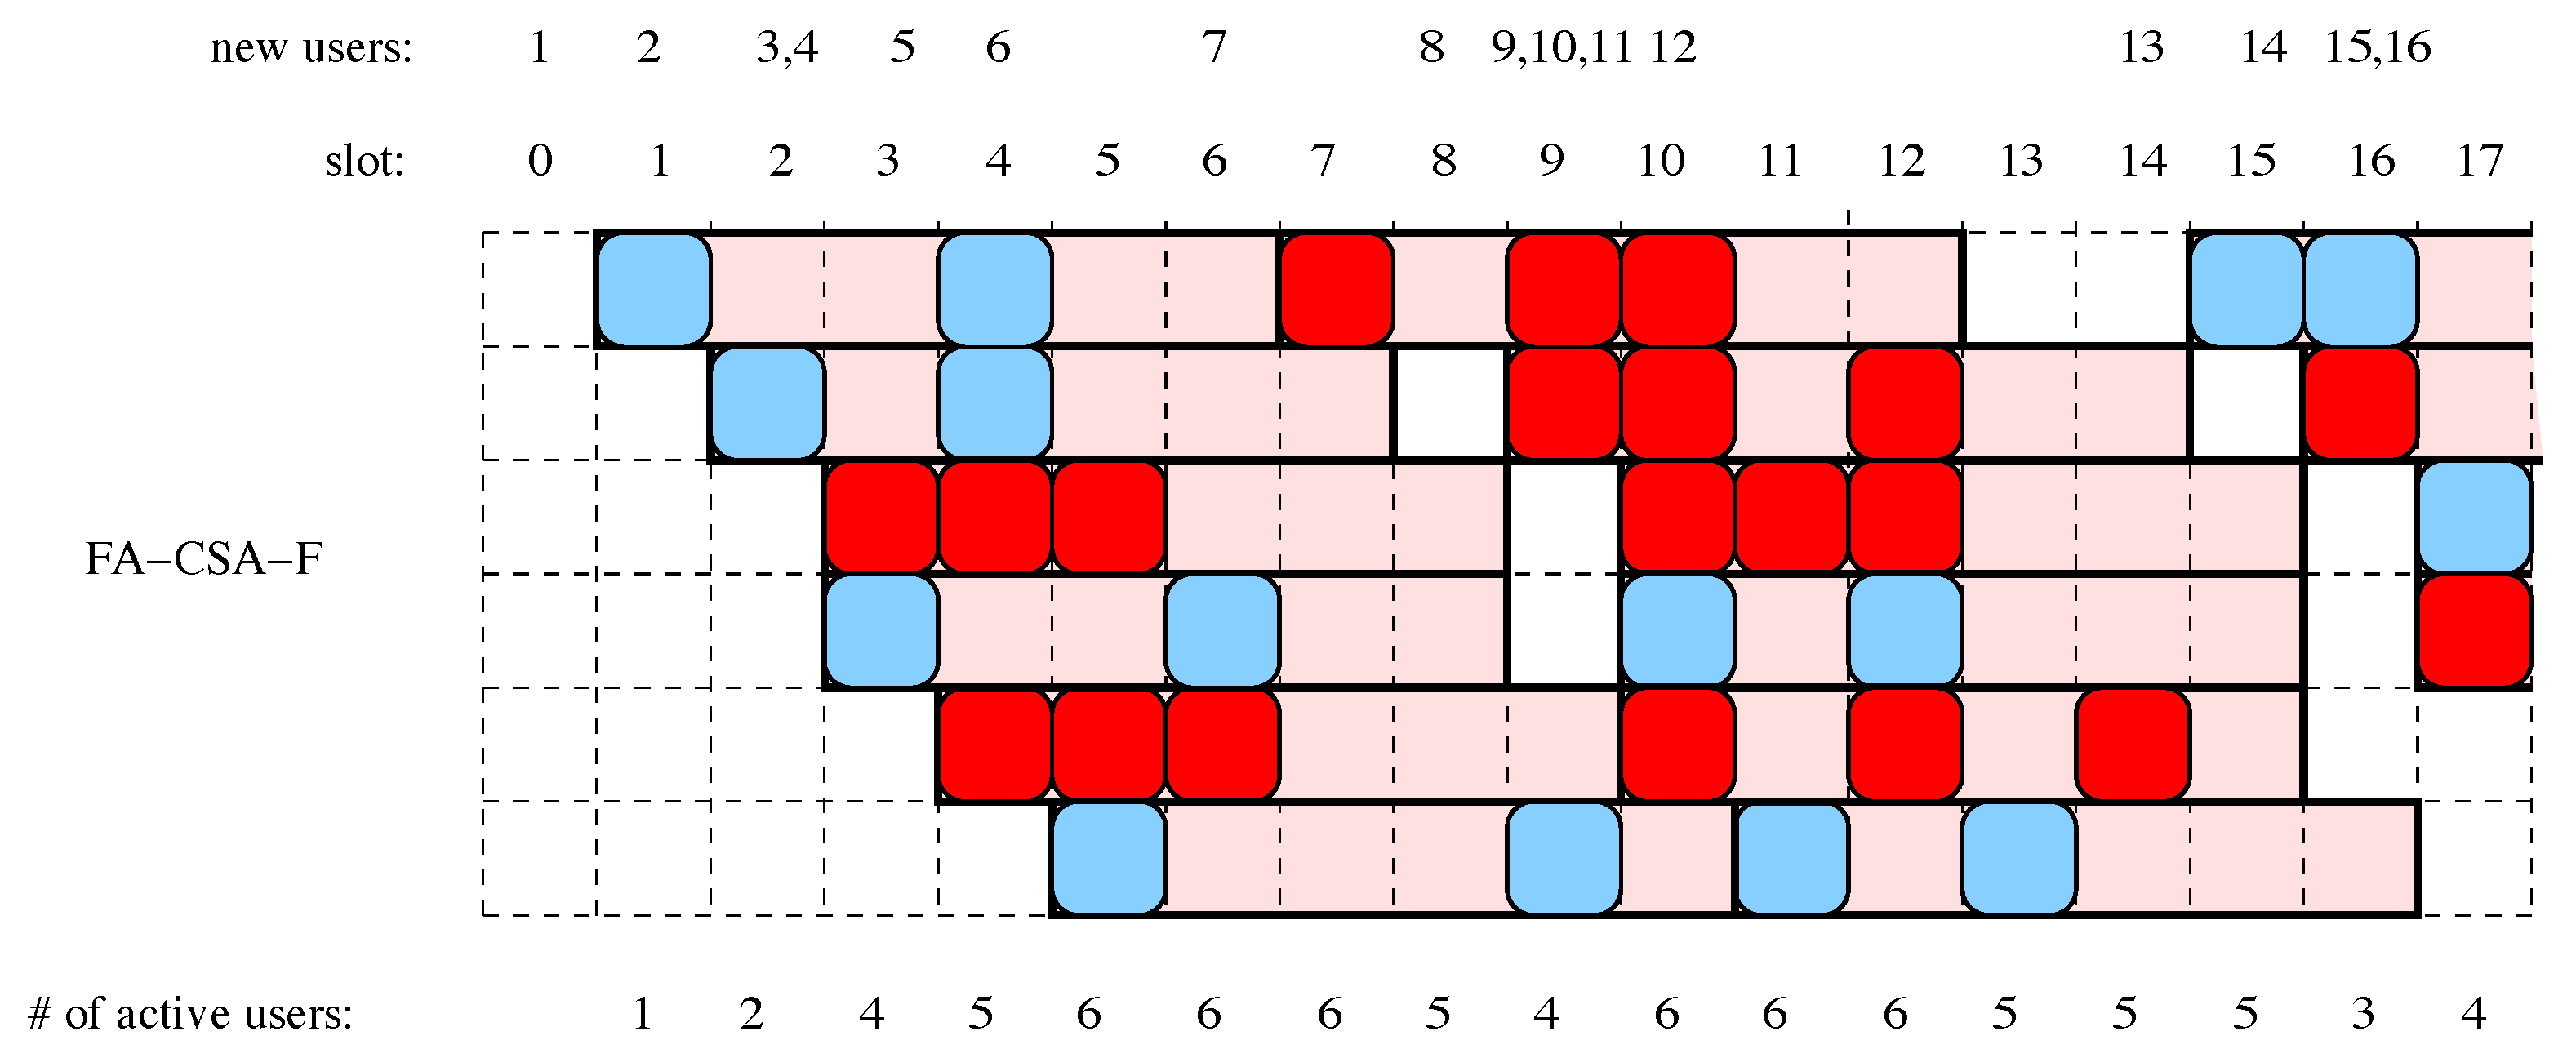
  • Frame asynchronous CSA (FA-CSA). In this scheme, a new packet is transmitted immediately after its arrival, in the next slot, and its remaining replicas are transmitted at random times within the subsequent  n 1  slots, uniformly drawn. Therefore, in FA-CSA there also exists a time period of n slots for sending the copies of a packet, but the nodes are no longer enforced to be synchronized in global frames. Nodes are active (i.e., they have some replica of a packet awaiting for transmission) during the n slots following the new arrival, and again the total number M of active nodes in a slot is a random value. Unlike FS-CSA, where M only changes from frame to frame, here in FA-CSA M varies on a lost basis. In the literature, two minor variants of FA-CSA have been considered. One is the system described here, when the transmission of the first copy of a packet is immediate. The second consists in treating the first copy in the same way as the remaining ones, i.e., the  n  replicas are transmitted randomly and uniformly over the next n time slots.
    The decoding process in FA-CSA is performed following the same steps as with FS-CSA, but with the important difference that the receiver needs to keep memory of all the slots that precede the current one (FS-CSA works only on the set of slots of the current frame, n). However, it is clear that in practice the receivers in FA-CSA would need a finite memory during the decoding decisions in order to keep the memory finite. We will denote by  n RX  this finite size of the receiver memory counted in number of slots. To all matters,  n RX  operates as a sliding window for the recovery of the packets, and we will assume that any packets received in a slot out of this window and not yet recovered are dismissed.

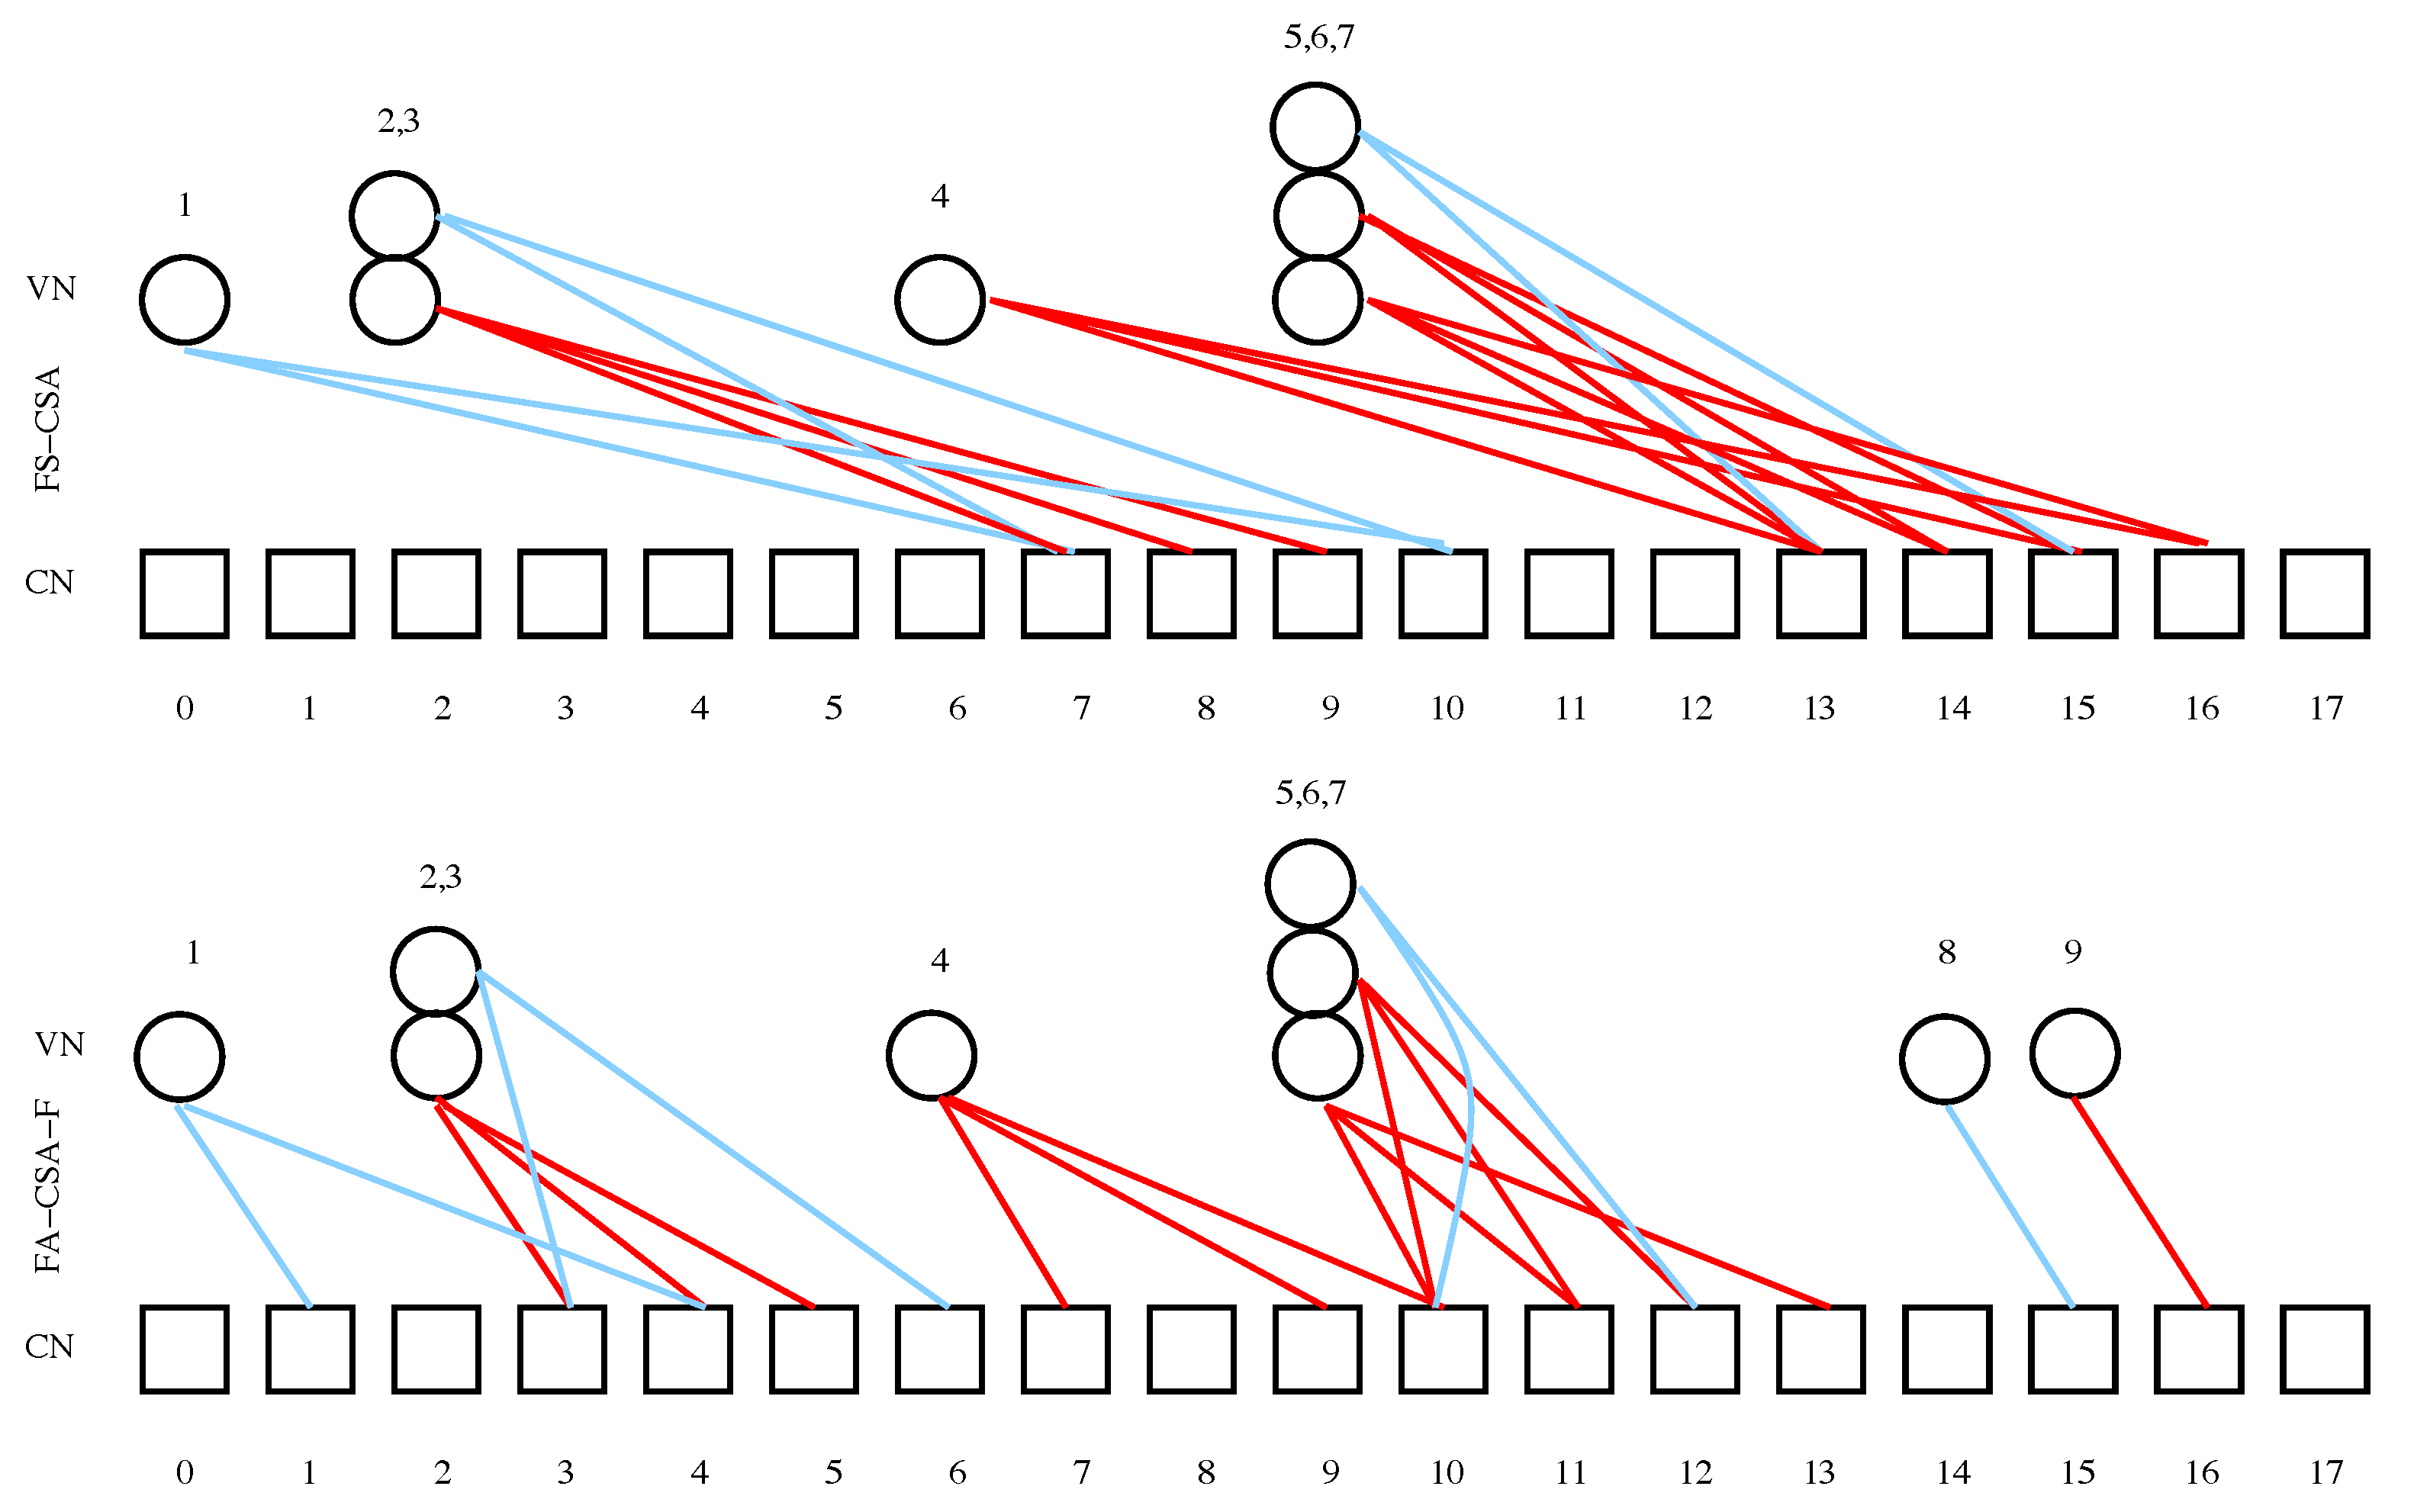
2.2. Bipartite Graph Representation and Degree Distributions

It is well known in the literature [28,37] that a CSA system can be modeled as a bipartite graph between the set  V  of variable nodes and the set  C  of constraint (or check) nodes. In the graph, an edge between  i V  and  j C  represents the transmission of a packet (one of its copies) from node i in slot j. Hence, the number of outgoing links from node i is equal to the number of replicas generated for that packet, and the number of incoming edges into j is r if j is a degree-r slot. The main advantage of the bipartite graph representation can be summarized by noting that this graphical model allows us to understand the iterative decoding procedure described in Section 2.1 as an instance in the framework of message passing algorithms over graphs (see [37]).
Figure 1 shows in detail in its top panel an example of FS-CSA for a system with frames of  n = 6  slots and  λ a = 0.5 . The nodes select degrees 2 or 3 for their packets. These are depicted as slots filled with blue (degree-2) and red (degree-3), respectively. The shaded areas depict the frames, the same for all users, and the striped blocks show the slots in which packets cannot be decoded, since this example assumes standard ALOHA ( k = 1 , no MUD).
In Figure 2, the graphical representation for the two scenarios of Figure 1 is depicted, while in Figure 3 we plot an example of FA-CSA-F, with with  n = 6 λ a = 1  and where users select degree 2 or 3. In this case only if  k > 1  all the packets can be decoded.
As is customary for the analysis of codes defined on graphs, the different degrees of the nodes is represented in polynomial compact form as
Λ ( x ) i Λ i x i , P ( x ) j P j x j
for variable and check nodes, respectively. Here  Λ i  is the probability that a variable node (VN) has degree i, and  P j  is the probability that a check node (CN) has degree equal to j. The VN degree polynomial  Λ ( x )  is a system design parameter and can be optimized for maximizing the system performance.
Similarly, the degree polynomials defined as
λ ( x ) i λ i x i 1 , ρ ( x ) j ρ j x j 1 ,
summarize the distribution of degrees for a random edge in the bipartite graph. More precisely, in the definition  λ i  denotes the probability that an edge is connected to a degree-i VN, and the probability that the edge is connected to a degree-j CN is given by  ρ j . The relationship between the coefficients that appear in (1) and (2) is
λ i = i Λ i m m Λ m , ρ j = j P j m m P m .
Thus,  λ ( x ) = Λ ( x ) / Λ ( 1 )  and  ρ ( x ) = P ( x ) / P ( 1 ) , where  f  is the derivative of function f.

3. Modeling the Arrival Processes

3.1. Marginal Distribution of the Arrivals

In order to check the impact of the tail of the marginal distribution of the arrival process on the performance of the system, we consider the following distributions to model the number of users joining the system in a given slot. Arrivals in different slots are assumed to be statistically independent, i.e., the arrival point process is memoryless. Specifically, we will consider two possible point processes for the arrivals: discrete versions of the Lognormal and the Pareto probability distributions, in addition to the classical Poisson process on the line.

3.1.1. Poisson Distribution

The Poisson random variable has the probability mass function
P ( X = j ) = e λ λ j j ! , j 0 , j Z + ,
with mean value and variance equal to  λ .

3.1.2. Lognormal Distribution

Consider a normal (Gaussian) random variable  N ( μ , σ 2 )  with mean value  μ  and variance  σ 2 . The related Lognormal random variable X has the density function
f ( x ) = 1 x σ 2 π exp log x μ 2 σ 2 , x R + ,
where the logarithms are natural. Thus  log X N ( μ , σ 2 ) . The expected value of X is  exp μ + σ 2 2 , and the variance is  exp ( σ 2 1 ) exp 2 μ + σ 2 . We will use for our numerical evaluations the quantization  X  as the point arrival process in each slot.

3.1.3. Pareto Distribution

The density function of the Pareto random variable X with parameters m and  α  is
f ( x ) = α m α x α + 1 , x ( m , + ) .
If  α > 1  the expectation is finite, with value  μ = α m α 1 , and if  α > 2  the variance is finite, with value  σ 2 = α m 2 ( α 2 ) ( α 1 ) 2 . More generally, the k-th moment of X is given by
E [ X k ] = + , if α k , α m k α k , if α > k ,
so the k-th moment is finite only if  α > k . The related Pareto distribution shifted to zero is  X m , and has, in the same ranges of values of  α , expected value  m α 1  and variance  α m 2 α 2 ( μ + m ) 2 . The conditions for finiteness of the k-th moments are obviously equal for the shifted and non-shifted Pareto random variables. We will use for our numerical evaluations the quantization  X  as the point arrival process in each slot.

3.2. Correlated Arrivals

We also consider for the experimental evaluation in this paper a versatile process able to generate correlated arrivals in the different slots. Specifically, we use the occupancy process of an M/G/ queuing system as our model for non-memoryless arrivals.
The M/G/ process [38], denoted as X, is a stationary version of the occupancy process of an M/G/ queuing system. In this queuing system, users arrive according to a Poisson process, occupy a server for a random time with a generic distribution S with finite mean and leave the system.
In its discrete version—which means that the service times S of users are iid and take discrete values—if the initial number of users in the system  X 0 Poisson ( λ E [ S ] ) , and the users’ service times have the same distribution as the residual life  S ^  of the random variable S, i.e.,
P ( S ^ = k ) = P ( S k ) E ( S ) ,
then X is strictly stationary, ergodic and satisfies the following properties:
  • The marginal distribution is  Poisson ( λ E [ S ] ) .
  • The covariance function is  r k = P ( S ^ > k ) , k 0 .
When the covariance function is summable, namely,  k = 0 r k < , the process is termed as short range dependent (SRD); in contrast, if the covariance is not summable,  k = 0 r k = , the process is termed as long-range dependent (LRD). In particular, the M/G/ process exhibits LRD when S has infinite variance, as in the case of some heavy-tailed distributions. The latter are the discrete probability distribution functions satisfying  P ( S = k ) k α , asymptotically as  k . The (discrete) Pareto distribution is a clear example of a heavy-tailed distribution.
In this work, we choose S [39] as a discrete heavy-tailed distribution with two parameters, m and  α , that allow to model simultaneously the short-term correlation behavior (by means for example of the one-lag correlation coefficient,  r 1 ) and the long-term correlation behavior (by means of the Hurst [40] parameter, H).
For this choice of S, the correlation function can be computed and is given by
r k = 1 ( α 1 ) k m α k ( 0 , m ] , 1 α ( m k ) α 1 k m .
So, if  α ( 1 , 2 ) , then  H = 3 α 2 ( 0.5 , 1 ) , and  k = 0 r k = . Hence, in this case, this correlation structure gives rise to an LRD process. In this work, we use the efficient generator of this version of the M/G/ process described in [41].

4. Numerical Experiments

In this section, we report the results of simulation tests to assess the  PLR  and average delay of both frame-synchronous and frame-asynchronous slotted ALOHA with k multi-user detection (MUD). This means that we assume that the receiver is able to decode perfectly up to k simultaneous transmissions in a slot, but fails if the slot contains more than k packets. Using MUD jointly with coded ALOHA improves both the throughput and energy consumption of the system, which is especially important in applications with massive number of devices (e.g., in massive machine type communications (mMTC), as envisioned for 5G/6G networks). However, even though analytical results for k-MUD coded ALOHA exist in the literature for Poisson arrival point processes [22,37], the analysis turns out to be intractable when more general, non-memoryless or correlated arrival processes are considered. In other words, the memoryless property of the arrival process is a key property for analytical tractability of the model. Motivated by the strong impact that heavy tails and LRD have on general queuing systems [36], our purpose in this work is to gain some understanding on this expected impact through simulation tests.
In all the simulation test cases that follow, we used replica factors  = 3  and  = 8 , and the k-MUD capability is  k = 1 , 2 , 3 . A small MUD capability is generally enough to sustain a high throughput, while keeping the complexity of the receivers to a practical level. SIC quickly becomes very complex as the number of receivers increases [42].
In the next sections, we empirically test the performance of the system when the arrivals are heavy-tailed and/or correlated with SRD or LRD. It is important to note that in all the figures the x-axis plots  λ a / k , so the load offered to the system increases with k.

4.1. Impact of the Marginal Distribution of the Arrival Process

4.1.1. Frame Synchronous Coded-Slotted ALOHA

We first analyze the impact of the marginal distribution of the arrivals in the key performance variables. To this end, we compare the results (Figure 4) between Poisson arrivals (memoryless) and discrete Lognormal arrivals with  μ = σ 2 . For frame-synchronous CSA, there is no noticeable difference between both cases when  μ = σ 2 . Clearly, performance of k-MUD CSA in this special case is unaffected or only mildly affected by the marginal distribution, and the key parameter in this respect is only the mean arrival rate (for fixed and replica distribution  Λ ( x ) , of course). The reason for this behavior is that FS-CSA acts really as a gated system at the frame level: all the arrivals must await until the next frame begins, and then the replicas for each user’s packets are uniformly distributed over the frame. Therefore, it seems logical that, if the variance in the number of packets is low, it is the average number of packets received during the previous frame, and not their marginal distribution, the fundamental measure of the system load and performance. Accordingly, we conjecture that the performance in this case is insensitive to the marginal distribution and is only a function of the system load, as expected.
Contrarily, if we increase the variance, performance with the Lognormal marginal degrades substantially. Figure 5 depicts the  PLR  and average delay in two asymmetric cases, when  σ 2 = 1.1 μ 2  and with  σ 2 = 4 μ 2 . We can see clearly that the  PLR  is now orders of magnitude higher for the same normalized traffic load, and that the average delay increases monotonically with  λ a / k . Most likely, this happens because the SIC decoder cannot find any slot within the frame such that k-decoding can be used, and the recovery of the (replica) packets becomes trapped. In other words, for arrival processes with high variability—Poisson arrivals do not possess this property—the SIC decoder quickly hits the error floor region of the decoding process [28], which suggests that a larger window or a different, optimized degree distribution should be used in the system. Increasing k would also improve performance and shift the error floor region threshold, but at the cost of a high hardware complexity at the receiver.
To test if the type of marginal distribution implies some change in the performance of the system, we also conducted simulation experiments with the discrete Pareto distribution shifted to zero, for  α = 1.1 α = 1.5  and  α = 1.9  ( α  is the rate of hyperbolic decay of the tail of the distribution). The results are shown in Figure 6. Now, for heavy-tailed marginal distributions, both the  PLR  and the average delay show a strong degradation, and are very sensitive to the value of  α . We conclude from this set of experiments that the presence of heavy tails in the marginal distribution of the arrivals induces a notable change in performance for CSA, and that the performance degrades fast as the tail of the distribution becomes heavier, particularly for the average delay.
A second test with the discrete Pareto distribution shifted to zero, but with  σ 2 = 1.1 μ 2  and  σ 2 = 4 μ 2 , yields the results depicted in Figure 7. The numerical results are very similar, quantitatively and qualitatively, to those in Figure 5, confirming that the second-order moments of the arrival process cannot be ignored at all when calculating or predicting the system performance. Again, note that the differences in average delay for  k = { 1 , 2 , 3 }  can be large, even for a finite decoding window (the frame length in these experiments is  n = 200  slots).

4.1.2. Frame Asynchronous Coded-Slotted ALOHA

We now turn our attention to the performance of frame asynchronous CSA. In this case, the frameless structure suggests that the effects of LRD and/or heavy-tailed distributions could be sharper, since correlations in the input traffic are not affected by the finite frame structure, only by the memory used by the decoder. Thus, we analyze several tests to confirm this hypothesis.
First, we change the marginal distribution of the point arrivals only, considering both Poisson and Lognormal distributions with  μ = σ 2 . Figure 8 confirms that, in this particular case with average and variance having the same value, the marginal distribution (both are light-tailed) has the effect of shifting the  PLR  and average delay to the right, i.e., system overload appears later with the discrete Lognormal marginal. Actually, it is quite remarkable that, for  k = 1 , 2 , we do not see the exponential increase of  PLR  for  λ a / k 1  in the case of Lognormal marginals, suggesting that the threshold for overloading the SIC receiver is farther and appears at higher arrival rates. It is reached for  λ a / k 0.9  when  k = 3 , instead.
A second test if to check whether the parameters of the Lognormal distributions have any impact on the dynamics of the system. To verify this, we simulated two types of arrivals with marginal Lognormal with  σ 2 = 1.1 μ 2  and  σ 2 = 4 μ 2 . The results are displayed in Figure 9, and we see that the  PLR  is roughly one or two orders of magnitude higher when the variance is larger. The average delay is also larger when the variance increases, and there is not a significant difference in average decoding delay if  k = 1 , 2 , 3 , at least until the arrival rate reaches the threshold of system overload.
Next, we want to investigate how the existence of heavy tails in the input point process influences the packet loss and the delay. In order to gain some insights, we simply simulated the system changing the input process and using three discrete Pareto marginal distribution for the arrivals, with parameters  α = 1.1 α = 1.5 , and  α = 1.9 , respectively. Remember that the three cases have infinite variance, since  α < 2 . According to the results shown in Figure 10, for heavy-tailed arrivals and unbounded second moment, the  PLR  is high but not very much sensitive to the normalized load  λ a / k . As for the average delay, notable differences among the cases  k = 1 , 2 , 3  arise only for the slowest decay rate of the pdf tail (top-right panel in Figure 10) whereas for faster decay rates the behavior is very similar with respect to the normalized loads. If one ignores for the moment the variations due to the intensity of the arrival rate  λ a , then Figure 10 allows us to conclude that even for heavy-tailed input traffic k-MUD for  k > 1  has a good performance, since both the packet loss ratio and the average delay are almost independent of the value of k. Alternatively, we obtain approximately the same performance for arrival rates  λ a = λ k , and  k = 1 , 2 , 3 , . This quasi-linear response is perhaps the main advantage in CSA, and our results show that it is preserved even for different marginals, unless the input traffic has a very long tail in its marginal distribution.
If instead we set as arrivals two discrete Pareto with different variances, i.e.,  σ 2 = 1.1 μ 2  and  σ 2 = 4 μ 2 , then we observe (Figure 11) the same shapes for the  PLR  and average delays, with the only expected difference that performance is worse as the second moment  σ 2  increases.

4.2. Impact of the Correlation Structure of the Arrival Process

Next, we conducted some experiments to clarify whether the presence of correlations (SRD or LRD) in the arrival pattern induces any changes in the performance metrics. We used as input traffic the occupancy process of the a M/G/ queuing system, as described in Section 3.2. Recall that the marginal distribution is Poissonian.

4.2.1. Frame Synchronous Coded-Slotted ALOHA

Figure 12 presents the numerical results for frame synchronous CSA. We cannot notice in the graphs differences in performance with respect to the case with no correlations (i.e., Poisson point arrivals, cf. Figure 4). Figure 12 was produced with  H = 0.75 —a moderate value for LRD—and  r 1 = 0.5  —also an intermediate value for the short-range correlation, but the results obtained with other combinations of H and  r 1  are identical. This can be explained with the same reason conjectured in Section 4.1.1: since all the arrivals during a frame must wait until the start of the next one for transmitting their replica packets, and since these replica packets are uniformly distributed over the frame, the original correlation structure vanishes and only the average number of new packet arrivals matters. So, in this case, the synchronous structure and gated service make the correlations possibly inherent in the input traffic inessential for the system performance. This insensitivity is not unexpected, yet its empirical verification is still interesting. As it is also shown in Figure 4, MUD has a clear advantage over single detection as long as the normalized traffic load is light ( λ a / k 0.5 , approx.), but increases quickly beyond that threshold. This is reflected in the average delay in the same fashion, since the delay reaches a maximum near that threshold for the input traffic, too, and then starts to decrease and eventually stabilizes. This decay is due to the high fraction of discarded (non-decoded packets), obviously.

4.2.2. Frame Asynchronous Coded-Slotted ALOHA

The same arrival process as in the precedent Section was used with frame asynchronous CSA. In this case, new packets do not wait for transmission (or wait randomly and independently until their first replica is transmitted). Similarly, there is not now a “natural” frame length for decoding the packets. As a consequence, it seems intuitive that the LRD or SRD correlations existing in the arrivals persist, without significant alterations, and could make performance much worse, either for  PLR  or for average delay. This is indeed the case, as Figure 13 shows, where we used moderated values of the parameters,  H = 0.75  and  r 1 = 0.5  (we compare this case with respect to the case with no correlations, i.e., Poisson point arrivals, cf. Figure 8). We see clearly in these graphs that, in the lightly loaded regime,  PLR  is similar for  k = 1 , 2 , 3  and a fixed  λ a / k , but deviates when the normalized input traffic exceeds  0.7 , and is worse for k-MUD with  k > 1 . To explain this, recall that due to LRD and SRD correlations, large bursts of packets can arrive in short time periods to the system (with non-negligible probability), and a fraction of these are replicated times. Thus, k-MUD with persistent correlations can amplify the total number of replicas to be transmitted within the current transmission window, increasing the system load substantially.
Figure 14 and Figure 15 show the effect of increasing the parameter that models the degree of SRD or LRD, respectively, maintaining the other parameter in a moderate value. We can see that in both cases the performance is degraded.

5. Discussion

In this paper, we studied, via simulation, the performance of irregular repetition slotted ALOHA under multi-packet detection. Our results suggest that there is a clear difference between frame-synchronous and frame-asynchronous systems, in that with frameless operations both the shape of the packet arrivals tail distribution and the existence of short-range and long-range correlations strongly impact the packet loss ratio and the average delay. To a large extent, these effects emerge only weakly in the case of frame-aligned operations, because this enforces the system to introduce a delay in the newly arrived packets (until the beginning of the next frame), and implies that the backlog of accumulated packets is the key quantity for calculating the performance. These observations seem to suggest that, for massive random access based on coded-slotted ALOHA, those in which the number of active transmitters can be in the order of hundreds or more, frame-synchronous operations are preferable for system stability (i.e., low  PLR ) over the frameless operations, since the latter is highly sensitive to the presence of correlations and/or heavy tails.

Author Contributions

Both authors contributed equally to this work. All authors have read and agreed to the published version of the manuscript.

Funding

This work was supported by grant “ICARUS - Information Centric Satellite Network for Vehicular Communications” PID2020-113240RB-I00, funded by MCIN/AEI/10.13039/501100011033, and by grant “COMPROMISE - Enhancing Communication Protocols with Machine Learning while Protecting Sensitive Data” PID2020-113795RB-C33, funded by MCIN/AEI/10.13039/501100011033.

Data Availability Statement

The data presented in this study are available on request from the corresponding author.

Conflicts of Interest

The authors declare no conflict of interest.

References

  1. Abramson, N. The Throughput of Packet Broadcasting Channels. IEEE Trans. Commun. 1977, 25, 117–128. [Google Scholar] [CrossRef] [Green Version]
  2. Abramson, N. Development of the Alohanet. IEEE Trans. Inf. Theory 1985, 31, 119–123. [Google Scholar] [CrossRef]
  3. Kleinrock, L.; Tobagi, F. Packet Switching in Radio Channels: Carrier Sense Multiple-Access Modes and Their Throughput-Delay Characteristics. IEEE Trans. Commun. 1975, 23, 1400–1416. [Google Scholar] [CrossRef]
  4. Bianchi, G. Performance Analysis of the IEEE 802.11 Distributed Coordination Function. IEEE J. Sel. Areas Commun. 2000, 18, 535–547. [Google Scholar] [CrossRef]
  5. Mulyanasari, A.R.; Pamukti, B.; Hambali, A. Frameless Coded Slotted ALOHA Scheme with Frequency Domain-Extended on NLOS Visible Light Communication Channel. In Proceedings of the 2022 International Conference of Science and Information Technology in Smart Administration (ICSINTESA), Denpasar, Indonesia, 10–12 November 2022. [Google Scholar] [CrossRef]
  6. Tseng, S.M.; Chang, C.K.; Liu, M.Y.; Wang, Y.C. Throughput analysis of 2-D OCDMA/pure ALOHA Networks with Access Control and Two User Classes of Variable Length for Multimedia Traffic. Int. J. Light Electron Opt. 2021, 241, 166928. [Google Scholar] [CrossRef]
  7. Abid, M.; Ma, H.; Muhammad, S.; Jin, Y. Optimizing the Performance of Pure ALOHA for LoRa-Based ESL. Sensors 2021, 21, 5060. [Google Scholar] [CrossRef]
  8. Berioli, M.; Cocco, G.; Liva, G.; Munari, A. Modern Random Access Protocols; Now Publishers: Norwell, MA, USA, 2016. [Google Scholar] [CrossRef] [Green Version]
  9. Vem, A.; Narayanan, K.R.; Chamberland, J.F.; Cheng, J. A User-Independent Successive Interference Cancellation Based Coding Scheme for the Unsourced Random Access Gaussian Channel. IEEE Trans. Commun. 2019, 67, 8258–8272. [Google Scholar] [CrossRef]
  10. Liu, Y.; Zhang, S.; Mu, X.; Ding, Z.; Schober, R.; Al-Dhahir, N.; Hossain, E.; Shen, X. Evolution of NOMA toward Next Generation Multiple Access (NGMA) for 6G. IEEE J. Sel. Areas Commun. 2022, 4, 1037–1071. [Google Scholar] [CrossRef]
  11. Sandgren, E.; Amat, A.G.; Brannstrom, F. On Frame Asynchronous Coded Slotted ALOHA: Asymptotic, Finite-Length and Delay Analysis. IEEE Trans. Commun. 2017, 65, 691–704. [Google Scholar] [CrossRef] [Green Version]
  12. Amat, A.G.; Liva, G. Finite-Length Analysis of Irregular Repetition Slotted ALOHA in the Waterfall Region. IEEE Commun. Lett. 2018, 22, 886–889. [Google Scholar] [CrossRef] [Green Version]
  13. Ivanov, M.; Brannstrom, F.; Amat, A.G.; Popovski, P. Error Floor Analysis of Coded Slotted ALOHA over Packet Erasure Channels. IEEE Commun. Lett. 2015, 19, 419–422. [Google Scholar] [CrossRef] [Green Version]
  14. Casini, E.; Gaudenzi, R.D.; Río, O. Contention Resolution Diversity Slotted ALOHA (CRDSA): An Enhanced Random Access Scheme for Satellite Access Packet Networks. IEEE Trans. Wirel. Commun. 2007, 6, 1408–1419. [Google Scholar] [CrossRef]
  15. Meloni, A.; Murroni, M.; Kissling, C.; Berioli, M. Sliding Window-based Contention Resolution Diversity Slotted ALOHA. In Proceedings of the 2012 IEEE Global Communications Conference (GLOBECOM), Anaheim, CA, USA, 3–7 December 2012. [Google Scholar] [CrossRef] [Green Version]
  16. Río, O.; Gaudenzi, R. Generalized Analytical Framework for the Performance Assessment of Slotted Random Access Protocols. IEEE Trans. Wirel. Commun. 2014, 13, 809–821. [Google Scholar] [CrossRef]
  17. Akyildiz, T.; Demirhan, U.; Duman, T.M. Energy Harvesting Irregular Repetition ALOHA with Replica Concatenation. IEEE Trans. Wirel. Commun. 2021, 20, 955–968. [Google Scholar] [CrossRef]
  18. Clazzer, F.; Amat, A.G. Error Floor Analysis of Irregular Repetition ALOHA. In Proceedings of the 2022 IEEE International Conference on Conmunications, Foshan, China, 11–13 August 2022. [Google Scholar] [CrossRef]
  19. EN 301 545-2; Digital Video Broadcasting (DVB); Second Generation DVB Interactive Satellite System (DVB-RCS2); Part 2: Lower Layers for Satellite Standard. Technical Report; ETSI: Sophia Antipolis, France, 2020.
  20. Munari, A.; Clazzer, F. Modern Random Access for Beyond-5G Systems: A Multiple-Relay ALOHA Perspective. arXiv 2019, arXiv:1906.02054. [Google Scholar] [CrossRef]
  21. Polyanskiy, Y. A Perspective on Massive Random-Access. In Proceedings of the 2017 IEEE International Symposium on Information Theory (ISIT), Aachen, Germany, 25–30 June 2017. [Google Scholar] [CrossRef]
  22. Liva, G. Graph-Based Analysis and Optimization of Contention Resolution Diversity Slotted ALOHA. IEEE Trans. Commun. 2011, 59, 477–487. [Google Scholar] [CrossRef]
  23. Paolini, E.; Liva, G.; Chiani, M. Coded Slotted ALOHA: A Graph-Based Method for Uncoordinated Multiple Access. IEEE Trans. Inf. Theory 2015, 61, 6815–6832. [Google Scholar] [CrossRef] [Green Version]
  24. Paolini, E.; Valentini, L.; Tralli, V.; Chiani, M. Irregular Repetition Slotted ALOHA in an Information-Theoretic Setting. In Proceedings of the 2022 IEEE International Symposium on Information Theory (ISIT), IEEE, Espoo, Finland, 26 June–1 July 2022. [Google Scholar] [CrossRef]
  25. Tseng, S.M.; Chen, W.Y. Cross-Layer Codebook Allocation for Uplink SCMA and PDNOMA-SCMA Video Transmission Systems and a Deep Learning-Based Approach. IEEE Trans. Inf. Theory 2023, 17, 294–305. [Google Scholar] [CrossRef]
  26. Gallager, R. Low-Density Parity-Check Codes. IEEE Trans. Inf. Theory 1962, 8, 21–28. [Google Scholar] [CrossRef] [Green Version]
  27. Luby, M.; Mitzenmacher, M.; Shokrollahi, M.A.; Spielman, D.A. Improved Low-Density Parity-Check Codes using Irregular Graphs. IEEE Trans. Inf. Theory 2001, 47, 585–598. [Google Scholar] [CrossRef] [Green Version]
  28. Richardson, T.J.; Shokrollahi, M.A.; Urbanke, R.L. Design of Capacity-Approaching Irregular Low-Density Parity-Check Codes. IEEE Trans. Inf. Theory 2001, 47, 619–637. [Google Scholar] [CrossRef] [Green Version]
  29. Clazzer, F.; Kissling, C.; Marchese, M. Enhancing contention resolution ALOHA using combining techniques. IEEE Trans. Commun. 2018, 66, 2576–2587. [Google Scholar] [CrossRef] [Green Version]
  30. Mengali, A.; Gaudenzi, R.; Arapoglou, P.D. Enhancing the Physical Layer of Contention Resolution Diversity Slotted ALOHA. IEEE Trans. Commun. 2017, 65, 4295–4308. [Google Scholar] [CrossRef]
  31. Alvi, S.; Durrani, S.; Zhou, X. Enhancing CRDSA With Transmit Power Diversity for Machine-Type Communication. IEEE Trans. Veh. Technol. 2018, 67, 7790–7794. [Google Scholar] [CrossRef]
  32. Shao, X.; Sun, Z.; Yang, M.; Gu, S.; Guo, Q. NOMA-Based Irregular Repetition Slotted ALOHA for Satellite Networks. IEEE Commun. Lett. 2019, 23, 624–627. [Google Scholar] [CrossRef]
  33. Munari, A.; Lazaro, F.; Durisi, G.; Liva, G. The Dynamic Behavior of Frameless ALOHA: Stability, Throughput, and Age of Information. arXiv 2023, arXiv:2301.10078. [Google Scholar] [CrossRef]
  34. Ghanbarinejad, M.; Schlegel, C. Irregular Repetition Slotted ALOHA with Multiuser Detection. In Proceedings of the 2013 Annual Conference on Wireless On-Demand Network Systems and Services (WONS), Banff, AB, Canada, 18–20 March 2013. [Google Scholar] [CrossRef]
  35. Hmedoush, I.; Adjih, C.; Muhlethaler, P.; Kumar, V. On the Performance of Irregular Repetition Slotted ALOHA with Multiple Packet Reception. In Proceedings of the 2020 International Wireless Communications and Mobile Computing (IWCMC), Limassol, Cyprus, 15–19 June 2020. [Google Scholar] [CrossRef]
  36. Pipiras, V.; Taqqu, S.M. Long-Range Dependence and Self-Similarity; Cambridge University Press: Cambridge, UK, 2017. [Google Scholar] [CrossRef] [Green Version]
  37. Ivanov, M.; Brannstrom, F.; Graell, A.; Popovski, P. Broadcast Coded Slotted ALOHA: A Finite Frame Length Analysis. IEEE Trans. Commun. 2017, 65, 651–662. [Google Scholar] [CrossRef] [Green Version]
  38. Cox, D.R. Point Processes; Chapman and Hall: London, UK, 1980. [Google Scholar] [CrossRef]
  39. Suárez-González, A.; López-Ardao, J.C.; López-García, C.; Fernández-Veiga, M.; Rodríguez-Rubio, R.F.; Sousa-Vieira, M.E. A New Heavy-Tailed Discrete Distribution for LRD M/G/ Sample Generation. Perform. Eval. 2002, 47, 197–219. [Google Scholar] [CrossRef]
  40. Hurst, H.E. Long-Term Storage Capacity of Reservoirs. Trans. Am. Soc. Civ. Eng. 1951, 116, 770–799. [Google Scholar] [CrossRef]
  41. Sousa-Vieira, M.E.; Suárez-González, A.; López-García, C.; Fernández-Veiga, M.; López-Ardao, J.C.; Rodríguez-Rubio, R.F. Fast Simulation of Self-Similar and Correlated Processes. Math. Comput. Simul. 2010, 80, 2040–2061. [Google Scholar] [CrossRef]
  42. Mao, Y.; Dizdar, O.; Clerckx, B.; Schober, R.; Popovski, P.; Vincent, H. Rate-Splitting Multiple Access: Fundamentals, Survey, and Future Research Trends. IEEE Commun. Surv. Tutor. 2022, 24, 2073–2126. [Google Scholar] [CrossRef]
Figure 1. An example of FS-CSA and FA-CSA-F with  k = 1 .
Futureinternet 15 00132 g001
Figure 2. Equivalent graph representation of the system depicted in Figure 1.
Futureinternet 15 00132 g002
Figure 3. An example of FA-CSA-F with  k = 2 .
Futureinternet 15 00132 g003
Figure 4. Simulated  PLR  (top) and Mean Delay (bottom) for FS-CSA versus  λ a / k , with  Λ ( x ) = 0.86 x 3 + 0.14 x 8 n = 200  and  k = { 1 , 2 , 3 } , and marginal distribution Poissonian (left) and Lognormal (right), in both cases  μ = σ 2 .
Futureinternet 15 00132 g004
Figure 5. Simulated  PLR  (top) and Mean Delay (bottom) for FS-CSA versus  λ a / k , with  Λ ( x ) = 0.86 x 3 + 0.14 x 8 n = 200  and  k = { 1 , 2 , 3 } , and marginal distribution Lognormal, with  σ 2 = 1.1 μ 2  (left) and  σ 2 = 4 μ 2  (right).
Futureinternet 15 00132 g005
Figure 6. Simulated  PLR  (top) and Mean Delay (bottom) for FS-CSA versus  λ a / k , with  Λ ( x ) = 0.86 x 3 + 0.14 x 8 n = 200  and  k = { 1 , 2 , 3 } , and marginal distribution Pareto, with  α = 1.1  (top-left),  α = 1.5  (top-right) and  α = 1.9  (bottom).
Futureinternet 15 00132 g006
Figure 7. Simulated  PLR  (top) and Mean Delay (bottom) for FS-CSA versus  λ a / k , with  Λ ( x ) = 0.86 x 3 + 0.14 x 8 n = 200  and  k = { 1 , 2 , 3 } , and marginal distribution Pareto, with  σ 2 = 1.1 μ 2  (left) and  σ 2 = 4 μ 2  (right).
Futureinternet 15 00132 g007
Figure 8. Simulated  PLR  (top) and Mean Delay (bottom) for FA-CSA versus  λ a / k , with  Λ ( x ) = 0.86 x 3 + 0.14 x 8 n = 200  and  k = { 1 , 2 , 3 } , and marginal distribution Poissonian (left) and Lognormal (right), in both cases  μ = σ 2 .
Futureinternet 15 00132 g008
Figure 9. Simulated  PLR  (top) and Mean Delay (bottom) for FA-CSA versus  λ a / k , with  Λ ( x ) = 0.86 x 3 + 0.14 x 8 n = 200  and  k = { 1 , 2 , 3 } , and marginal distribution Lognormal, with  σ 2 = 1.1 μ 2  (left) and  σ 2 = 4 μ 2  (right).
Futureinternet 15 00132 g009
Figure 10. Simulated  PLR  (left) and Mean Delay (right) for FA-CSA versus  λ a / k , with  Λ ( x ) = 0.86 x 3 + 0.14 x 8 n = 200  and  k = { 1 , 2 , 3 } , and marginal distribution Pareto, with  α = 1.1  (top),  α = 1.5  (middle), and  α = 1.9  (bottom).
Futureinternet 15 00132 g010
Figure 11. Simulated  PLR  (top) and Mean Delay (bottom) for FA-CSA versus  λ a / k , with  Λ ( x ) = 0.86 x 3 + 0.14 x 8 n = 200  and  k = { 1 , 2 , 3 } , and marginal distribution Pareto, with  σ 2 = 1.1 μ 2  (left) and  σ 2 = 4 μ 2  (right).
Futureinternet 15 00132 g011
Figure 12. Simulated  PLR  (left) and Mean Delay (right) for FS-CSA versus  λ a / k , with  Λ ( x ) = 0.86 x 3 + 0.14 x 8 n = 200  and  k = { 1 , 2 , 3 } , and correlated arrivals with marginal Poissonian distribution.
Futureinternet 15 00132 g012
Figure 13. Simulated  PLR  (left) and Mean Delay (right) for FA-CSA versus  λ a / k , with  Λ ( x ) = 0.86 x 3 + 0.14 x 8 n = 200  and  k = { 1 , 2 , 3 } , and correlated arrivals ( H = 0.75  and  r 1 = 0.5 ) with marginal Poissonian distribution.
Futureinternet 15 00132 g013
Figure 14. Simulated  PLR  (left) and Mean Delay (right) for FA-CSA versus  λ a / k , with  Λ ( x ) = 0.86 x 3 + 0.14 x 8 n = 200  and  k = { 1 , 2 , 3 } , and correlated arrivals ( H = 0.75  and  r 1 = 0.9 ) with marginal Poissonian distribution.
Futureinternet 15 00132 g014
Figure 15. Simulated  PLR  (left) and Mean Delay (right) for FA-CSA versus  λ a / k , with  Λ ( x ) = 0.86 x 3 + 0.14 x 8 n = 200  and  k = { 1 , 2 , 3 } , and correlated arrivals ( H = 0.9  and  r 1 = 0.5 ) with marginal Poissonian distribution.
Futureinternet 15 00132 g015
Disclaimer/Publisher’s Note: The statements, opinions and data contained in all publications are solely those of the individual author(s) and contributor(s) and not of MDPI and/or the editor(s). MDPI and/or the editor(s) disclaim responsibility for any injury to people or property resulting from any ideas, methods, instructions or products referred to in the content.

