Article

A Transmission Rate Control Method for Active Congestion Reduction Based on Network Node Bandwidth Allocation

1
National Network New Media Engineering Research Center, Institute of Acoustics, Chinese Academy of Sciences, No. 21, North Fourth Ring Road, Haidian District, Beijing 100190, China
2
School of Electronic, Electrical and Communication Engineering, University of Chinese Academy of Sciences, No. 19(A), Yuquan Road, Shijingshan District, Beijing 100049, China
*
Author to whom correspondence should be addressed.
Future Internet 2023, 15(12), 385; https://doi.org/10.3390/fi15120385
Submission received: 10 November 2023 / Revised: 25 November 2023 / Accepted: 25 November 2023 / Published: 29 November 2023

Abstract

:
The control of transmission rates is currently a major topic in network research, as it plays a significant role in determining network performance. Traditional network design principles suggest that network nodes should only be responsible for forwarding data, while the sending node should manage control. However, sending nodes often lack information about network resources and must use slow-start algorithms to increase the transmission rate, potentially leading to wasted bandwidth and network congestion. Furthermore, incorrect judgments about network congestion by sending nodes may further reduce network throughput. The emergence of new Internet architectures, such as information-centric networks (ICNn), has empowered network nodes with more capabilities, including computation and caching. This paper proposes a method for transmission rate control that actively avoids congestion through network node bandwidth allocation. The sending, network, and receiving nodes each calculate the available transmission rate, and the sending node negotiates with the other nodes through a rate negotiation message to obtain the maximum transmission rate possible given the current state of the network. The network nodes notify the sending node to adjust the transmission rate to adapt to changes in the network through a rate adjustment message. Simulation experiments show that the proposed method is better than traditional methods in reducing network congestion, providing a stable transmission rate, increasing the network throughput capacity, and improving performance in high-latency and high-bandwidth networks. Additionally, the proposed transmission rate control method is fairer than traditional methods.

1. Introduction

Controlling transmission rates is crucial for improving network performance and the user experience. It is essential to balance the differences in processing power between the sender and receiver to avoid overwhelming the receiver with data. Additionally, network congestion can result in packet loss, decreasing network throughput and negatively impacting the user experience. To strike a balance, transmission rates should not be too fast but should not be too slow, as that can lead to resource waste and a poor user experience. The ideal transmission rate maximizes network bandwidth utilization without causing congestion and ensures that data are received smoothly. Researchers have conducted extensive research to achieve this goal with the development of the Internet.
The latest advancements in network architecture, specifically the ICN, offer various solutions to address multiple network issues. These include the identification being separate from the address, which can be utilized to represent content, devices, and services. By using transmission identification, we can distinguish between transmissions in the network with greater accuracy. Network nodes are now equipped with caching and more powerful computing capabilities, allowing them to operate as data transmission forwarders and senders or controllers.
Our objective is to involve network nodes in controlling transmission rates, allowing for better matching of the maximum transmission rate provided by the current network. This will improve the network throughput. This article proposes a transmission rate control method for active congestion avoidance through network node bandwidth allocation. Unlike traditional approaches, where network nodes only forward data and control is handled by the sending node, each node—the sending node, network node, and receiving node—calculates the transmission rate it can provide in our solution. The sending node obtains the maximum transmission rate that the current network can provide through the transmission rate negotiation message and adjusts the transmission rate according to the adjustment message. This article’s main contributions are as follows:
  • We implement a bandwidth allocation algorithm on network nodes which allocates bandwidth for transmission at the beginning of the transmission to quickly determine a reasonable transmission rate and adjust the bandwidth size of transmissions according to changes in network status during the transmission process.
  • We propose a bandwidth allocation scheme based on transmission identification, which makes the bandwidth allocation algorithm on network nodes suitable for both bandwidth allocation between single-path transmissions and bandwidth allocation between multi-path transmissions.
  • We have designed and implemented a transmission rate negotiation mechanism between sending, network, and receiving nodes based on the bandwidth allocation method of network nodes and a rate adjustment mechanism based on network nodes.
The rest of this article is organized as follows. In Section 2, we introduce the related work on transmission rate control. We raise questions in Section 3. In Section 4, we provide a detailed introduction to the bandwidth allocation algorithm proposed in this paper on network nodes. In Section 5, we introduce a rate control mechanism based on network node bandwidth allocation. Section 6 provides experimental results and analysis. We discuss these in Section 7. Finally, we summarize the article in Section 8.

2. Related Work

In traditional schemes, the sending node mainly handles transmission rate control. The authors of [1] proposed Reno, and the authors of [2] proposed NewReno. These classic TCP congestion control algorithms use packet loss events as signals of network congestion. After detecting packet loss, the sending node uses the additive increase multiplicative decrease (AIMD) mechanism to reduce the congestion window and reduce the transmission rate sharply. However, when the network is not congested, packet loss may also occur, and reducing the transmission rate will result in a loss of throughput performance. The authors of [3] proposed the CUBIC algorithm to solve this problem. When the window grows, CUBIC uses a cubic function of the time since the last packet loss to achieve high performance, making it the default congestion control algorithm in Linux systems. The authors of [4] proposed the first method to use delay as a congestion signal, called TCP Vegas. The authors of [5] combined the advantages of packet loss-based and delay-based methods to design Compound TCP. The authors of [6] developed a new method called BBR. BBR will periodically increase and decrease the transmission rate in an attempt to detect larger bandwidths while emptying the queued packets in the network node queue to measure the minimum round-trip time (RTT). This method achieves optimal performance by estimating the RTT and bottleneck bandwidth, keeping the congestion window equal to the bandwidth-delay product (BDP). The authors of [7] developed the Multipath TCP (MPTCP) protocol, which allows a single data stream of TCP to be divided into multiple subflows, and each subflow can choose different paths for data transmission [8,9,10]. However, when various subflows of an MPTCP stream are routed and assigned to a common bottleneck link (shared bottleneck) [11,12], they will occupy more bandwidth than regular single-path TCP streams. The authors of [13] designed a coupling COUPLED algorithm similar to Reno window adjustment. When a subflow encounters congestion, the transmission of that path is immediately cut off, and the total window sum of all subflows is halved. This algorithm is based on the assumption that all subflows have equal RTTs. The authors of [14] proposed a SEMI-COUPLED algorithm to improve the COUPLED algorithm. When a subflow encounters congestion, the SEMI-COUPLED algorithm reduces the sending window of the subflow by half to replace the cutoff of congested subflow transmission in the COUPLED algorithm. The authors of [15] further improved the SEMI-COUPLED algorithm. It is proposed that the LIA algorithm solves the problem of fairness from the perspective of load balancing between subflows, which cannot be guaranteed between subflows with different RTTs.
To fundamentally address the demand for content distribution, researchers have proposed an ICN that completely changes the existing network architecture, including different solutions such as CCNs [16], NDNs [17], and SEANET [18]. Under this new network architecture, the receiving node is responsible for congestion control. The authors of [19] proposed an ICP algorithm using a mechanism similar to TCP’s AIMD window adjustment method. The congestion window of the ICP algorithm increases the size of a data packet by one for every successful transmission of data with a congestion window size and becomes A (0 < A < 1) times the original length when congestion occurs. The authors of [20] also adopted a TCP-like congestion window adjustment algorithm to design the ICTP algorithm. In addition, the ICTP algorithm also considers the trade-off between traffic control, security, and overhead caused by the size of data blocks. The authors of [21] designed the BBR-CD method to apply the BBR algorithm to an ICN. It improved the estimation of the RTT, such as through using the average RTT instead of the minimum RTT and using filters to remove noise from RTT samples.
Some studies involve network nodes in transmission rate control. The authors of [22] introduced the explicit congestion notification (ECN) algorithm, which must be used with the AQM algorithm. When the network node discovers congestion, it sets flag bits in the data packet, and the sending node adjusts the rate based on the flag bits in the received data packet. This scheme can effectively reduce packet loss and improve the accuracy of the end node’s perception of congestion. The authors of [23] introduced the XCP scheme. On packet departure, the sender attaches a consensus header to the packet. The XCP controllers on the router make a single control decision for every average RTT (the control interval).
We have summarized the relevant studies in Table 1. The proposed scheme in this article adopts a transmission rate control method based on network node bandwidth allocation. The sending, network, and receiving nodes each calculate the transmission rate that can be provided. The sending node negotiates the transmission rate with the network node and receiving node with negotiation messages to obtain the maximum transmission rate the current network state can provide. The network nodes notify the sending node to adjust the transmission rate to adapt to network changes through rate adjustment messages. Compared with the methods of only sending node control and only receiving node control, the participation of network nodes enables the transmission rate to be closer to the maximum transmission rate that the current network state can provide. Compared with other network nodes participating in transmission rate control methods, our scheme allows network nodes to provide more accurate information than the ECN method. Compared with the XCP scheme of adding control information at the head of each data packet, this paper uses negotiation and adjustment messages for control, separating control information from data and reducing the processing complexity of data packet forwarding.

3. Problem Statement

Most transmission rate control schemes currently use only sending or receiving nodes for control, with network nodes only responsible for forwarding. This control method has three issues.

3.1. Slow Start

The slow start algorithm has been used as a tentative growth plan for data transmission rates when the network state and resources are unknown. On the one hand, transmission with a small amount of data will likely be completed in the slow start stage, reducing data transmission efficiency [24]. On the other hand, to reach the performance limit as soon as possible, the initial threshold for a slow start should be set to the maximum value. This means that the first slow start transmission process always ends with the occurrence of congestion events, which means that congestion is inevitable. Therefore, the exponential growth of congestion windows in classic slow start algorithms is undoubtedly a behavior that may harm network performance. To obtain higher average speeds, algorithms need to increase transmission rates faster, exacerbating the adverse impact on network performance.

3.2. Congestion Detection

The perception of network congestion by sending nodes is often inaccurate. In classic congestion control schemes such as Reno and NewReno, packet loss is considered a signal of congestion in the network. When the sending node discovers packet loss but there is no congestion in the network, these algorithms significantly reduce the congestion window, reduce the sending rate, and lead to a decrease in bandwidth utilization and throughput performance. This phenomenon is particularly evident in networks with high latency and high bandwidth. Tests have shown that in links with a bandwidth of 10 Gbps, the performance of NewReno and other solutions can be reduced by more than 90% with only 0.0049% packet loss, which is much lower than 1%.

3.3. Bandwidth Competition

Multipath transmission has been proposed and applied. Content can be forwarded and transmitted from multiple paths to achieve a better overall transmission rate. Although we expect the differences in the paths traveled by different subflows of the same transmission to be as large as possible, there will always be subflows passing through the same bottleneck link, known as shared bottlenecks. It is difficult for sending nodes to identify shared bottlenecks accurately. In shared bottleneck links, the transmission of multiple subflows will have more substantial bandwidth competitiveness, leading to bandwidth encroachment of other transmissions.

4. Network Node Bandwidth Allocation Method

In this section, we introduced the bandwidth allocation algorithm on network nodes and the bandwidth allocation algorithm for subflows when facing multipath transmission.

4.1. Motivation

As we discussed earlier, when relying on the sending or receiving nodes to control the transmission rate, network nodes only being responsible for forwarding inevitably leads to inaccurate network status detection. Therefore, utilizing network nodes to participate in transmission rate control is a feasible solution. The information network nodes provided in the ECN scheme are not accurate enough. The XCP scheme adds rate control information to each packet and processes it during network node forwarding, which increases the burden of forwarding packets.
Based on the above discussion, we propose a bandwidth allocation method for network nodes which allocates the bandwidth for each transmission based on information such as the current available bandwidth of the network node and the number of serviced transmissions. To implement this algorithm, the transmission rate control scheme proposed in this article is based on the following network characteristics. Network nodes, namely routing nodes, adopt a new network architecture that separates control and forwarding and has sufficient computing resources. In addition to forwarding data packets, they can perform operations such as computing, storing information, and sending control messages using controllers on nodes.
The transmission adopts a new network architecture that separates the identification and address for transmission protocols. Identification can represent receiving nodes, sending nodes, and transmissions.

4.2. Method Description

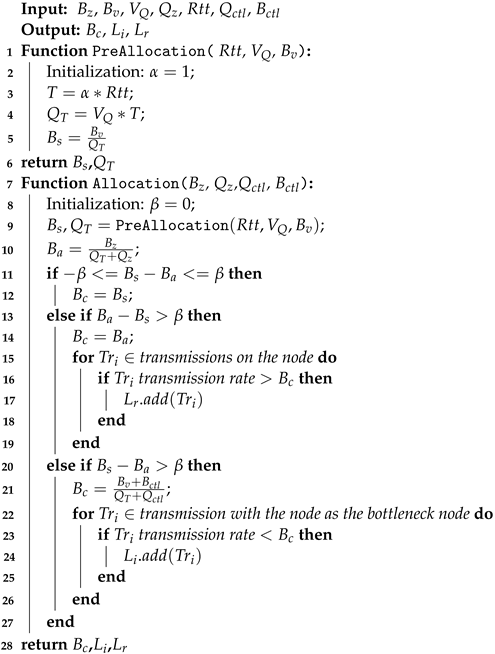
The bandwidth allocation algorithm is based on the above analysis and runs port by port. Each port on the network node allocates bandwidth for its transmission, and the detailed steps are described in Algorithm 1. Inputs B z and B v represent the current node port’s total and free bandwidth, respectively. V Q represents the speed at which new transmissions arrive, and Q z represents the total number of transmissions serviced by the current port. This information is obtained from the statistics of network nodes. R t t comes from the rate negotiation message, where Q c t l and B c t l represent the number and bandwidth occupied by the transmission with the current network node as the bottleneck, respectively. The following section will detail the rate negotiation message and the method of determining whether a network node is the bottleneck node for transmission. The output is the bandwidth allocation result B c of the current transmission, the list of transmissions that need to increase the transmission rate L i , and the list of transmissions that need to decrease it L r .
The algorithm consists of two parts. From line 1 to line 6 in Algorithm 1, the first part calculates the bandwidth the current network node can provide for new transmissions without adjusting existing transmissions. There is a delay of at least one R t t between the completion of bandwidth allocation by the network node and the data arriving at the network node. The bandwidth allocation results of the network nodes must be valid when the data truly come. Otherwise, this may cause congestion. Therefore, we first calculate the control delay T (line 3), where α is a constant coefficient and α should be greater than or equal to one to make the allocation result effective within one R t t . The larger the α , the longer the network changes must be predicted, and the lower its accuracy. By default, we take α to be equal to one (line 2). Then, based on the current new transmission arrival rate, we predict the number of transmissions Q T that will arrive within the control delay T (line 4) and evenly allocate the remaining bandwidth to them, obtaining the transmission bandwidth B s that should be given to the current transmission without adjusting other existing transmissions (line 5).
The second part of the algorithm from line 7 to line 28 in Algorithm 1 calculates the bandwidth that the current network node can provide for new transmissions while adjusting other existing transmissions, as well as a list of transmissions that need to be changed and the corresponding adjustment results. Based on previous statistics, we predict the number of new transmissions in the future T time, and the network situation is constantly changing. If the actual number increases in the future, then the bandwidth allocated to subsequent nodes will decrease. In the contrary situation, the bandwidth allocated to subsequent nodes will increase. We need to adjust the allocation results to ensure fair bandwidth allocation. Firstly, we calculate the bandwidth allocated for the current B s (line 9) followed by the average bandwidth of all B a , including the transmissions in the future T time (line 10), and then compare the two. To avoid minor changes causing oscillation adjustment, we set an unfair tolerance coefficient β , where β > = 0 . The stability of the transmission rate is directly proportional to β while adjusting the frequency, and the fairness is inversely proportional to β . This article considers a relatively ideal state, taking β = 0 (line 8). When the difference between the newly allocated bandwidth B s and the average bandwidth B a is within the unfair tolerance coefficient range (line 11), no adjustment is needed, and the freshly allocated B s bandwidth can be used as the result B c (line 12). Otherwise, adjustments need to be made. The bottleneck node determines the transmission rate. Therefore, we adopt the principle of a cautious rate increase and active rate decrease for adjustments, which means that all network nodes can force transmissions to slow down. In contrast, only the bottleneck node can recommend transmissions to increase their rate. When the average bandwidth minus the newly allocated bandwidth exceeds the tolerance coefficient (line 13), the average bandwidth is taken as the result (line 14), and all existing transmissions that exceed the average bandwidth are added to the adjustment list L r (lines 15–19). Among them, T r i is the ith transmission of all transmissions that pass through the node. When the newly allocated bandwidth minus the average bandwidth exceeds the tolerance coefficient (line 20), it is necessary to calculate the average bandwidth allocation result (line 21) that includes the number of transmissions in the future T time and all transmissions with this node as the bottleneck and add all existing transmissions below this result to the adjustment list L i (lines 22–26). It is worth noting that if this node is not a bottleneck node for any transmission, as both Q c t l and B c t l are zero, and the average value degrades to B s , meaning no adjustment is needed. It is impossible to initiate an adjustment to increase the transmission rate when this node is not a bottleneck node.
Algorithm 1: Bandwidth allocation algorithm.
Futureinternet 15 00385 i001
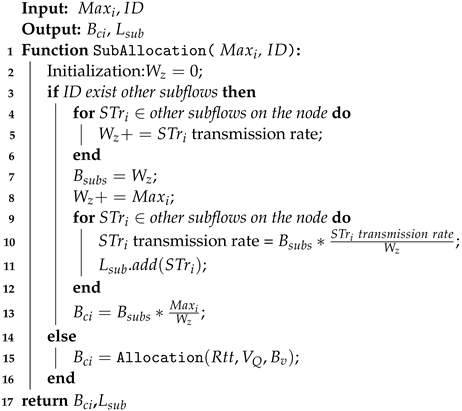
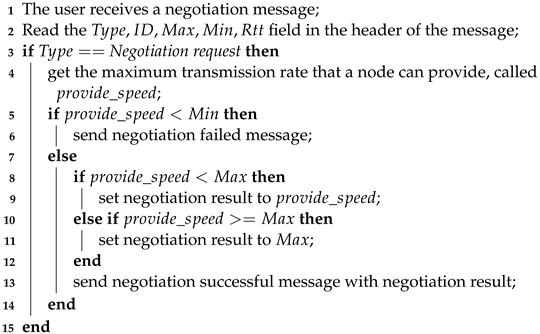
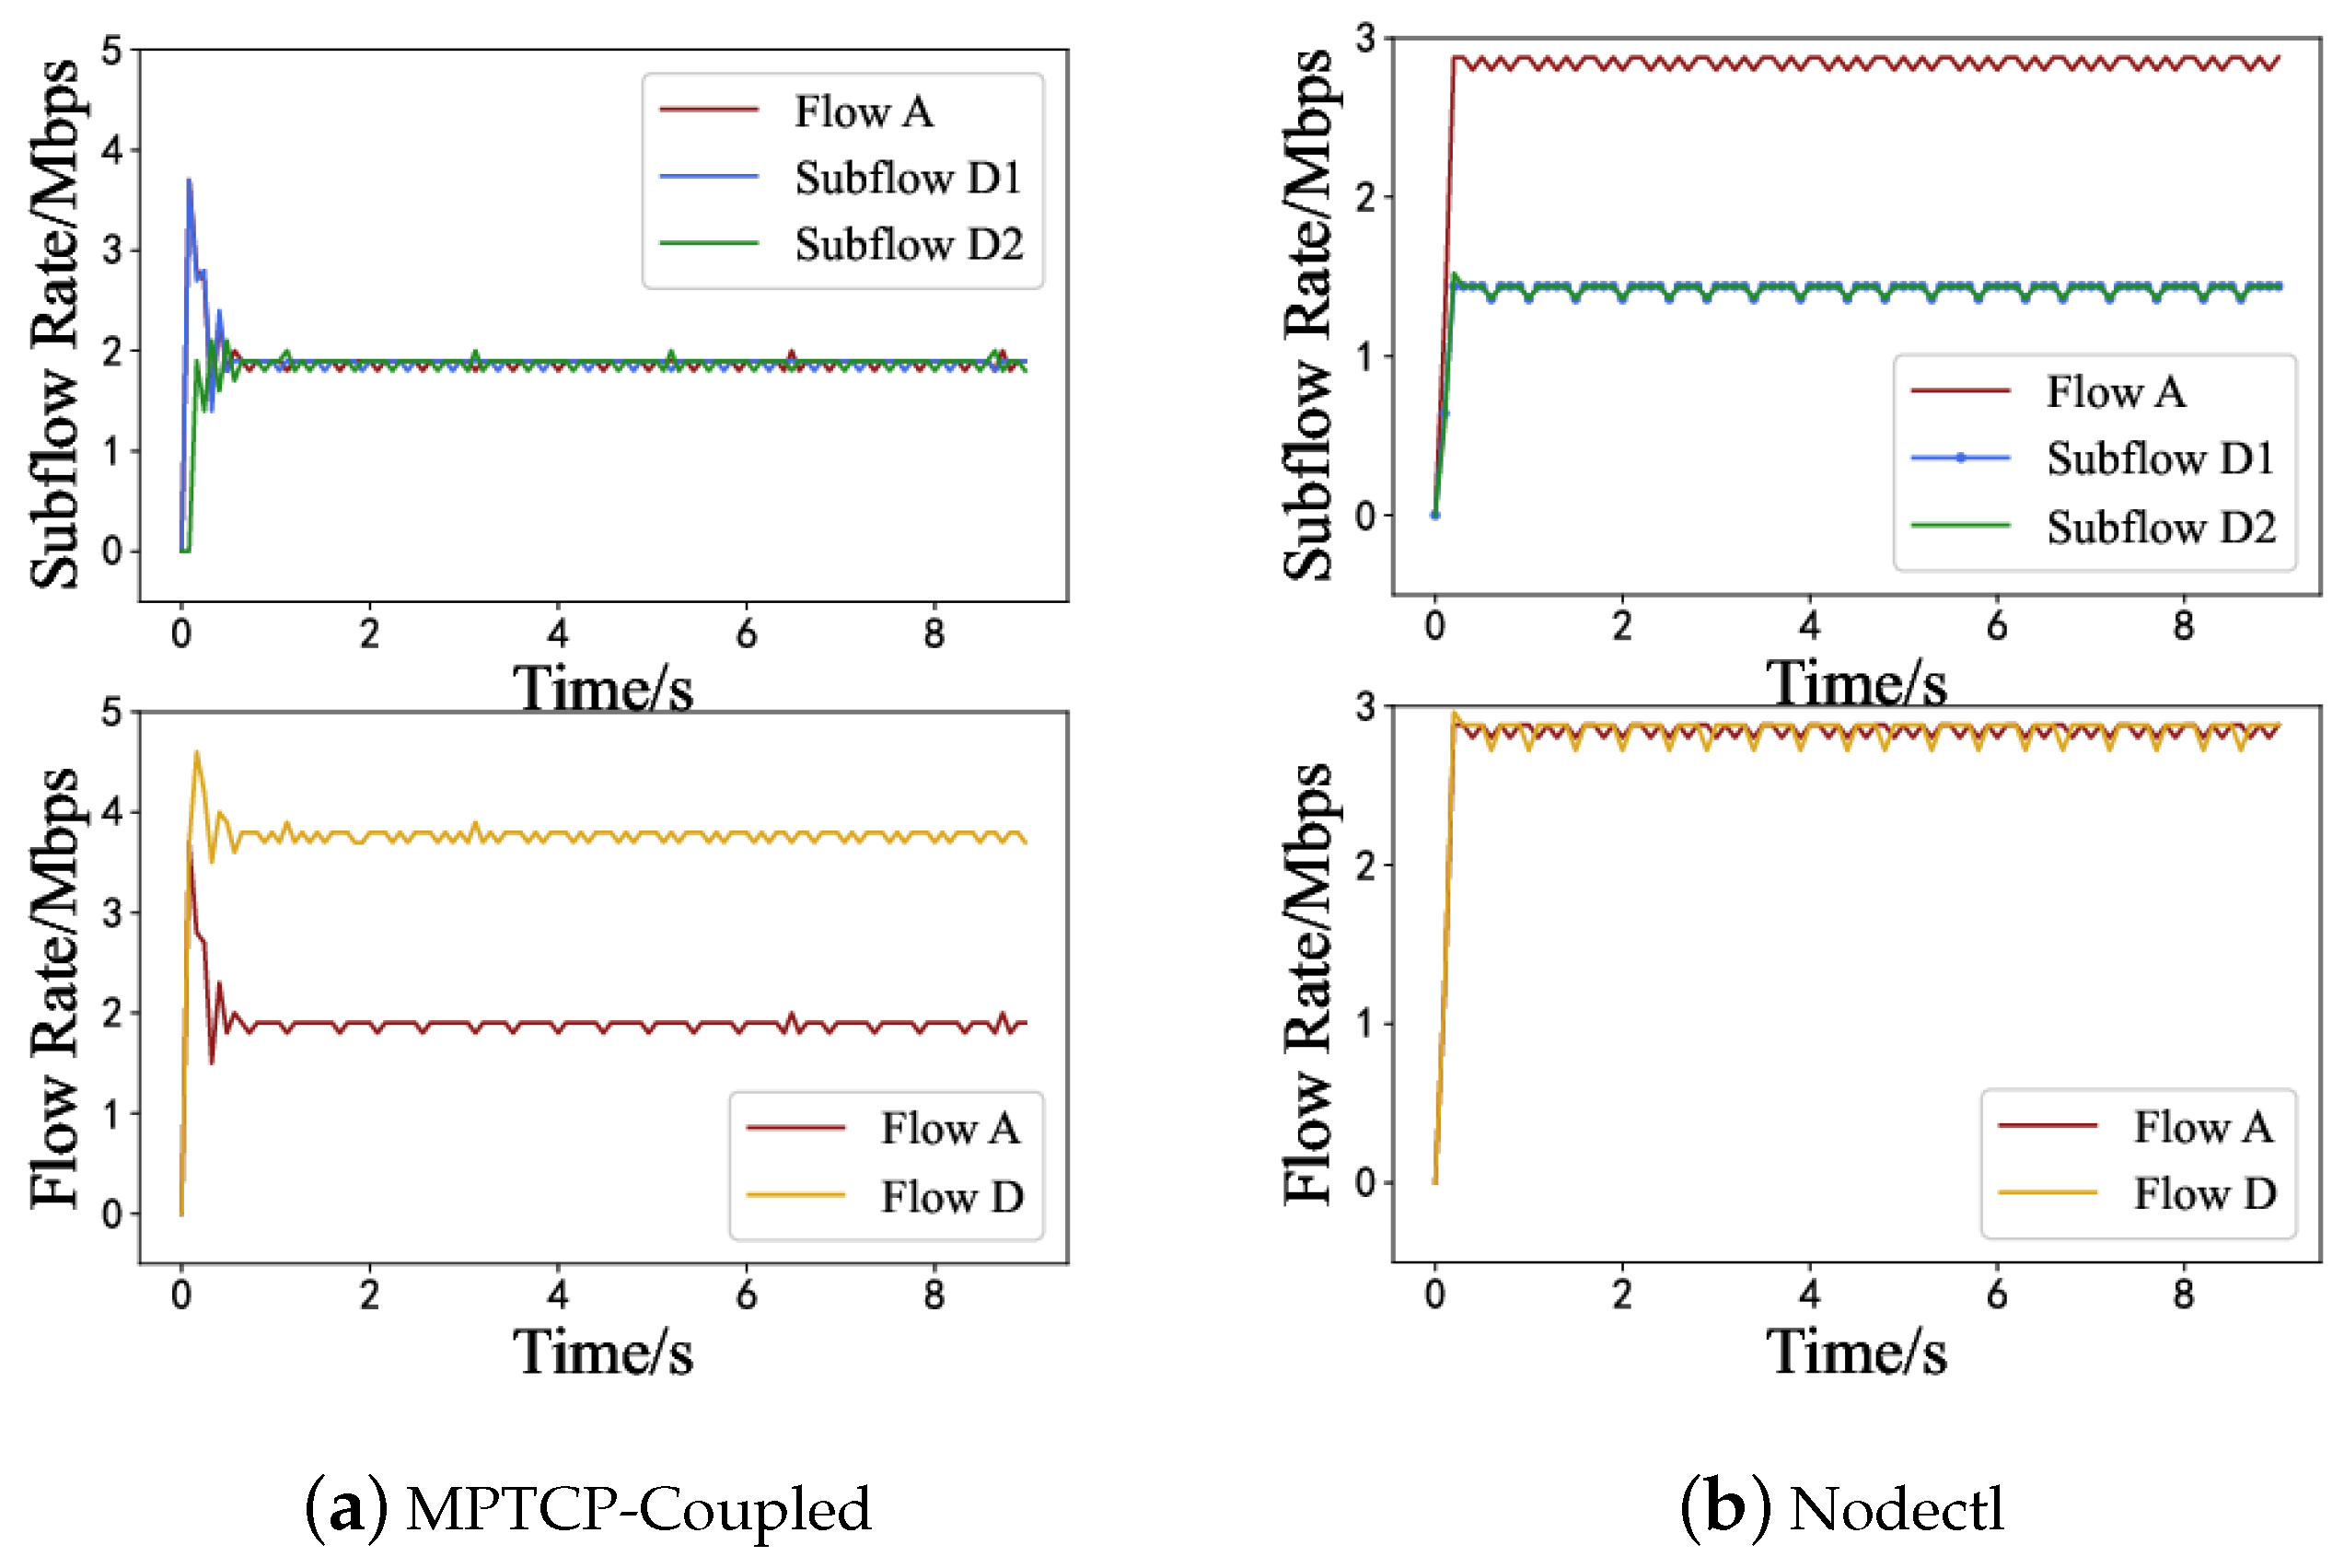
Multipath transmission involves multiple flows which should be considered as a whole. Using the transmission ID, we determine the transmission to which the subflow belongs and can also distinguish different subflows of the same transmission. Flows with the same transmission content ID and transmission destination ID are different subflows in the same transmission. To maintain fairness in bandwidth allocation and avoid multiple subflows from preempting bandwidth, we propose a bandwidth allocation algorithm for subflows based on the bandwidth allocation algorithm of the network nodes mentioned above. The specific steps are shown in Algorithm 2. The inputs are the transmission rate negotiation values M a x i and I D of the subflow taken from the corresponding fields of the transmission negotiation message, which will be detailed in the next section. The outputs are the bandwidth allocation result B c i and adjustment list L s u b for the subflow.
Firstly, we determine whether there are already allocated subflows of the same transmission (line 3) on this port, where multiple subflows are transferred from the same port. If it exists, then this indicates that the bandwidth has already been allocated for the transmission. Based on the transmission rate of each subflow, the total bandwidth B s u b s and total weight W z for all subflows are calculated (lines 4–8). Then, the bandwidth is allocated according to the weight, and adjustments are made to other subflows (lines 9–13). Among them, S T r i is the ith subflow of all subflows belonging to the same transmission that passes through the node. If it does not exist, then the subflow can obtain all the newly allocated bandwidth (line 15).
Algorithm 2: Subflow bandwidth allocation algorithm.
Futureinternet 15 00385 i002

5. Transmission Rate Control Scheme Based on Network Node Bandwidth Allocation

This section introduces the transmission rate control model we designed based on the network node bandwidth allocation algorithm, which can obtain the maximum transmission rate that the current network can provide.

5.1. Scheme Description

The rate control scheme based on node bandwidth allocation is achieved through rate negotiation and adjustment messages. Consider the simplified network model shown in Figure 1, where the S e r v e r is the data-sending node and the U s e r is the data-requesting and receiving node. R o u t e r A and R o u t e r B are intermediate forwarding nodes. After completing the connection establishment, the S e r v e r sends a negotiation request message before sending data. It then sends a termination message after the end of data transmission. R o u t e r A and R o u t e r B can process and forward the negotiation request message, and the U s e r replies to the S e r v e r to complete the rate negotiation. After the negotiation, R o u t e r A and R o u t e r B can notify the S e r v e r to adjust the transmission rate through the adjustment message.
The header format of the negotiation message is shown in Figure 2, with the T y p e field used to identify the type of signaling, while 0x0011 represents the negotiation request message, 0x0012 represents the negotiation success message, and 0x0013 represents the negotiation failure message. The M a x field is used to identify the maximum transmission rate currently achievable for this transmission. The M i n field indicates the minimum transmission rate accepted for this transmission. If the actual transmission rate is lower than this value, then it is considered meaningless, and the transmission is abandoned. If there is no minimum rate requirement, then it can be set to zero. The I D field is used to identify different transmissions or different subflows of the same transmission. The R t t field represents the current round-trip delay time of the link.
The rate adjustment message is shown in Figure 3, with the T y p e field used to identify the type of signaling, while 0x0021 represents the reduce transmission rate adjustment message, 0x0022 represents the increase transmission rate adjustment message, and 0x0023 represents the termination message. The I D field is used to identify different transmissions or different subflows of the same transmission. The S p e e d field represents the new transmission rate.

5.2. Scheme Process

The process of the S e r v e r is shown in Algorithm 3. After the S e r v e r sends a negotiation request message, it receives the negotiation message and adjustment message for processing. After reading the header information (line 2) in the message, it first determines the type of received message (line 3), and if it is a negotiation successful message, then it sets the sending rate to the rate M a x in the message (line 4). If the message type is for failed negotiation (line 5), then it reselects the transmission path for negotiation or waits for some time before proceeding with negotiation (line 6). If there is an increase transmission rate message (line 7), then it uses the rate S p e e d in the message as the current provide rate of the node and sends a negotiation request (lines 8–9). If there is a reduce transmission rate message (line 10), then it is necessary to judge the current transmission rate and the size of the adjusted rate S p e e d in the message. Since other nodes may have adjusted it, the smaller value (line 11) is taken.
Algorithm 3: Server negotiation process
Futureinternet 15 00385 i003
The processing process of R o u t e r A and R o u t e r B is shown in Algorithm 4. The router receives the negotiation message, reads the header information (line 2), and determines the received message type. If it is a negotiation request message (line 3), then it calculates the allocatable bandwidth value (line 4) based on the bandwidth allocation algorithm. If the allocated bandwidth is less than the M i n field value (line 5) in the message, then it sends a negotiation failed message and no longer forwards the negotiation request message (line 6). If the allocated bandwidth is less than the M a x field value (line 8), then it updates the message’s M a x field (line 9). The network node records the bandwidth allocation result (line 11), continues to forward the negotiation request message (line 12), and then sends the increase transmission rate message according to the list of transmissions L i that need to increase their transmission rates (lines 13–15) and sends the reduce transmission rate message according to the list of transmissions L r that need to decrease their transmission rates (lines 16–18). If there is a negotiation successful message (line 20), and if the transmission rate in the record is greater than the M a x field value (line 21) in the message, then it sets the bottleneck flag of the transmission c t l _ f l a g to false (line 22). If the transmission rate in the record is equal to the M a x field value (line 23) in the message, then it sets the bottleneck flag to true (line 24). If the transmission termination message or record timeout occurs (line 26), then it deletes the corresponding transmission record (line 27).
Algorithm 4: Router negotiation process.
Futureinternet 15 00385 i004
The U s e r processing process is shown in Algorithm 5. The U s e r receives a negotiation message, reads the header information (line 2) in the message, and determines whether it is a negotiation request message (line 3). Firstly, it obtains the maximum transmission rate it can provide, known as the p r o v i d e _ s p e e d (line 4). If it is less than the M i n field (line 5) in the message, then it sends a negotiation failed message (line 6); otherwise, it takes the smaller value of M a x and the allocated bandwidth as the negotiation result (lines 8–12) and sends a negotiation successful message (line 13).
Algorithm 5: User negotiation process.
Futureinternet 15 00385 i005

6. Results

The transmission rate control algorithm and mechanism for active congestion avoidance based on network node bandwidth allocation have been elucidated. Next, we will introduce the experimental process in this section. Firstly, we will introduce the experimental parameters, followed by the results and analysis.

6.1. Experimental Set-Up

We chose the NS-3 simulation platform based on C++ implementation for the experiment. NS-3 is an easy-to-use discrete event network simulator. This simulation experiment mainly includes three types of nodes: the server node that sends data, the user node that receives data, and the router node that forwards data. These nodes form the simulation experimental network topology shown in Figure 4.
In the simulation experimental network shown in Figure 4, R o u t e r A and R o u t e r B are routing nodes with rate control and packet processing capabilities, and their connections form the bottleneck link required for the experiment. R o u t e r A connects to the server nodes, which includes the data transmission access links necessary for the experiment. All transmission access links have the same bandwidth and latency attributes. The R o u t e r B is connected to the user nodes, forming the data-receiving end access link required for the experiment. All receiving end access links have the same bandwidth and delay attributes.
We chose the FIFO + DropTail queue management method on the router with a queue length of 100 packets. In terms of selecting the rate control strategy for the sending node, we chose the NewReno scheme optimized based on the classical Reno scheme, the Cubic scheme widely used as the default scheme for Linux systems, and the Bbr scheme representing the new control concept for performance comparison with the proposed scheme (represented as Nodctl) in this paper. To maintain consistency with the comparison scheme and avoid other factors interfering and affecting the results, the Nodectl scheme proposed in this paper, like the three comparison schemes, selected the server for rate control during the experimental process. We conducted simulation experiments on the three aspects proposed in Section 3: the start-up speed, throughput capacity, and multipath transmission. The main parameter settings are shown in Table 2. We set the bandwidth of all server and user nodes to 200 Mbps, and the latency of the sending and receiving access links was 5 ms. The bandwidth and latency of the bottleneck links varied with the experimental requirements, and the maximum bandwidth was smaller than the bandwidth of the access links at both ends. The purpose of this experiment was to compare the performance of different rate control schemes under network resource constraints, and thus it was necessary to avoid performance limitations caused by the sending nodes. We tested the throughput performance of various schemes under different transmission data volumes. When testing other scenarios, the data size was set to zero, which means there is no limit on the data size sent. The sending end would continue to send data until the end of the experiment.
During the simulation experiment, the NewReno, Cubic, and BBR schemes we used were all built-in versions of NS-3. We implemented the algorithms introduced in Section 4 and Section 5 in NS-3. We implemented the Nodctl scheme based on the TCP transmission protocol to maintain consistency with the three comparison schemes.

6.2. Start-Up Speed

In this section, we selected a pair of nodes, S e r v e r a and U s e r a , for the experiment, with the transmission path being S e r v e r a R o u t e r A R o u t e r B U s e r a .

6.2.1. Inflighting Bytes

We set the initial send window to one. We tested the bandwidth and total link delay of different bottleneck links and recorded the changes in flight data over time in the links of the four schemes. Flight data were sent by the source server but not received (i.e., the data transmitted in the connection). The experimental results are shown in Figure 5.
Figure 5 shows the variation in inflighting bytes over time. The subtitles show the bottleneck bandwidth and total delay of the links in the experiment. The graph shows that under the four experimental bandwidths and conditions, the Nodectl scheme had the fastest start-up speed and the slightest fluctuation in flight data.
Table 3 shows the time taken for the flight bytes of the four schemes to reach the BDP. The table shows that the impact of delay was more significant than the bandwidth. The Nodectl scheme took much less time to achieve the BDP than the other three schemes, and its advantages became more apparent with the increase in bandwidth and latency. After completing the connection, Nodectl initiates rate negotiation to determine the transmission rate, which takes approximately 2 RTTs. NewReno and Cubic use similar slow start methods, and thus their time to reach the BDP is the same. The BBR scheme was the slowest to reach the BDP.

6.2.2. Throughput of Small File Transmission

We further evaluated the impact of the start-up speed on the small file transfer performance by testing the throughput of four schemes for transferring small files. We set the bottleneck link bandwidth to 80 Mbps and tested four rate control schemes under link latency conditions of 30 ms, 35 ms, 40 ms, and 45 ms, transmitting files of different sizes from 3 KB to 90 MB (3 KB, 9 KB, 30 KB, 90 KB, 300 KB, 900 KB, 3 MB, 9 MB, 30 MB, and 90 MB). The transmission throughputs of the four transmission rate control schemes obtained in the experiment are shown in Figure 6.
Figure 6 shows the variation in the link throughput with the amount of transmitted data, and the subtitles show the total delay of the links in the experiment. The graph shows that the smaller the file, the more significant the impact of the start-up speed was on the throughput. The larger the file, the closer the throughput was to the bottleneck bandwidth. Due to its fast start-up speed, the Nodectl scheme had the best throughput performance under the same file size. When the file size was 3 MB, Nodectl had the greatest improvement compared with other schemes. We present the bandwidth utilization of a 3 MB file transfer in Table 4. Table 4 shows that although the bandwidth utilization of the Nodectl scheme decreased with an increasing link delay, under the same link delay conditions, Nodectl approximately doubled the performance compared with the other three schemes.

6.3. Single Transmission

In this section, we still selected a pair of nodes, S e r v e r a and U s e r a , for the experiment, with the transmission path being S e r v e r a R o u t e r A R o u t e r B U s e r a .

6.3.1. Delay and Throughput Stability

The transmission rate and delay stability significantly impact network performance and user experience. We set the bottleneck link bandwidth to 40 Mbps and the total transmission delay to 20 ms. Four schemes were tested for instantaneous transmission rate and time-delay changes, as shown in Figure 7.
Figure 7a shows the variation in the transmission delay over time, and Figure 7b shows the transmission throughput over time. The graph shows that the transmission delay and transmission throughput of the three comparison schemes showed periodic fluctuations, with the NewReno scheme having the largest delay fluctuation and the BBR scheme having the largest rate fluctuation. The Nodectl scheme had a relatively stable transmission delay and transmission throughput.
Table 5 shows the fluctuation differences in the transmission delay and transmission throughput among the four schemes, and it can be seen that the Nodectl scheme had better delay stability and throughput stability than the other three schemes. Among the three comparison schemes, BBR had the smallest delay fluctuation but the highest throughput fluctuation.

6.3.2. Impact of Packet Loss on the Throughput

Throughput is one of the most important performance measures of transmission. We tested and recorded the throughputs of four schemes under different conditions with a bottleneck link bandwidth of 80 Mbps.
Figure 8a shows the four schemes’ throughput variation with the link packet loss rate. From this, it can be seen that all four schemes had good throughput performance when there was no packet loss and could approach the bandwidth limit of the bottleneck link. However, as the packet loss rate increased, the performance loss of the NewReno and Cubic schemes was significant, as both schemes use packet loss as a signal of network congestion. The BBR and Nodctl schemes do not use packet loss as a network congestion signal, and thus a small packet loss value did not affect their throughput performance.
Figure 8b shows the bandwidth utilization of the four schemes as a function of the bottleneck bandwidth when the packet loss rate was 0.015%. Although NewReno and Cubic may significantly reduce their rates due to packet loss, they can quickly recover to the bottleneck link bandwidth when the bandwidth is low. However, with a bandwidth increase, the performance loss of the NewReno and Cubic schemes was severe. The BBR scheme also experienced a specific decrease in bandwidth utilization when the bandwidth was high, while the Nodectl scheme consistently maintained the best performance in bandwidth utilization.
Figure 8c shows the impact of latency on the throughput of four schemes at a packet loss rate of 0.15%. The figure shows that as the delay increased, the transmission time increased, and the throughput capacity of all four schemes significantly decreased. The Nodectl scheme had the slowest performance degradation rate.
Table 6 shows the four schemes and three parameters: the ratio of the throughput at a 0.3% packet loss rate to the throughput without packet loss; the ratio of bandwidth utilization in a 90 Mbps link to bandwidth utilization in a 10 Mbps link under a 0.015% packet loss condition; and the ratio of the throughput in a 150 ms delay link to throughput in a 10 ms delay link under 0.15% packet loss conditions. It can be seen that when the latency and bandwidth were small, the performance of BBR and Nodectl was not affected by the packet loss rate. As the bandwidth increased, the packet loss resistance performance of Nodectl remained stable, while the performance of BBR slightly decreased. As the latency increased, the performance of Nodectl decreased, but it still outperformed the other three schemes. The performance of BBR was reduced significantly, and it no longer had advantages compared with NewReno and Cubic.

6.4. Multiple Transmissions

6.4.1. Single-Path Transmission

In this section, we selected three pairs of nodes, S e r v e r a U s e r a , S e r v e r b U s e r b , and S e r v e r c U s e r c , for the experiment. They passed through a common transmission path: R o u t e r A R o u t e r B . We started the first set of transmissions at 12 o’clock with a bottleneck bandwidth of 36 Mbps and a link delay of 20 ms. Afterward, we added one set of transmissions every 5 s, totaling three sets of transmissions. We tested and recorded the throughput changes and the number of packet losses occurring in the link for the four schemes, as shown in Figure 9.
In Figure 9, the upper half represents the amount of packet loss, while the lower half represents the transmission throughput. Figure 9 shows that all three comparison schemes would result in packet loss when new transmissions were added. The changes in the NewReno and Cubic schemes were similar, with the Cubic schemes experiencing more packet loss when new transmissions were added due to Cubic’s more aggressive window-lifting algorithm. After experiencing packet loss caused by the addition of new transmissions, the original transmission rate of BBR rapidly decreased. This is due to the overestimation of the BDP by the later initiated connections, resulting in a queue backlog or congestion at network nodes. The RTT would also increase sharply for earlier connected transmissions, rapidly decreasing the transmission rate over several cycles. The Nodectl scheme did not generate congestion or packet loss. The graph shows that in the Nodectl scheme, the original transmission rate decreased before the new transmission rate increased. When a new transmission sends a negotiation request, the network node notifies the original transmission to adjust the rate. Currently, the newly transmitted data have not started transmission, avoiding congestion.
Table 7 shows each transmission’s average throughput after 10 s when three sets of transmissions were in progress simultaneously. It can be seen that the NewReno and Cubic schemes had higher transmission throughputs when starting transmission first. In the BBR scheme, the transmission throughput of the first initiated connection was greatly affected due to queue congestion at network nodes caused by connections created later. The Nodectl scheme allocates bandwidth among the network nodes, with almost the same transmission rates among the three groups.

6.4.2. Multi-Path Transmission

The work in [25] implemented the MPTCP protocol in NS-3 using a coupled rate control method. We made some modifications based on it and used it as a comparison plan. We tested a scenario where two subflows had shared bottlenecks. S e r v e r a sends data to U s e r a , and S e r v e r d sends data to U s e r d . S e r v e r d and U s e r d use the MPTCP protocol to send data from both links, denoted as subfow D 1 and subfow D 2 . We set the bottleneck bandwidth to 6 Mbps, and the test results are shown in Figure 10.
From Figure 10, we can see that although any subflow in the coupled scheme detected congestion, the rate of all coupled subflows would decrease, but the effect was not ideal. In the Nodectl scheme, the rates of D 1 and D 2 were both half of that of A, and the overall rate was similar to A.
Table 8 shows the average transmission rates of single-path transmission A and multi-path transmission D. It can be seen that in the comparison scheme, multi-path transmission D significantly infringed on the bandwidth of transmission A, while in the Nodctl scheme, the transmission rates of the two were consistent and competed fairly for bandwidth.

6.5. Network Transmission

To simulate and test the performance of the proposed scheme in the network, we used 26 nodes to construct the network, as shown in Figure 11a. These included 16 routing nodes, 2 service nodes, and 8 user nodes. The bandwidth of the routing node was 40 Mbps, and the bandwidth of both the service node and the user node was 100 Mbps. S e r v e r a and S e r v e r b sent data to eight user nodes. We conducted multiple repeated experiments on the total network throughput of the four schemes under different link loss rates.
Figure 11b shows the average result of the total network throughput. When there was no link packet loss, the throughput of the BBR scheme was the lowest, while the throughputs of the other three schemes were similar. Like in the previous experiments, the BBR scheme overestimated the BDP in the connections initiated later, resulting in a queue backlog or congestion at the network nodes. The previously connected transmission RTT would also increase sharply, resulting in the original transmission rapidly reducing the transmission rate within several cycles and taking some time to recover to a reasonable rate. As the packet loss rate increased, the throughput of Cubic and NewReno significantly decreased. The throughput performance of the BBR scheme was unstable, but overall, it was superior to Cubic and NewReno. The Nodectl scheme performed best, consistently maintaining the highest throughput, with only minor throughput decreases and fluctuations as the packet loss rates increased.
Table 9 shows the throughput ratio at a packet loss rate of 0.5% to the throughput without packet loss for four schemes. The Nodectl scheme had the smallest performance loss, while the NewReno and Cubic schemes had severe performance losses.

7. Discussion

7.1. Transmission Arrival Prediction

Currently, we have network nodes calculating the rate at which new transmission requests arrive and estimate the number of transmission requests that will arrive in the future based on the current new transmission arrival rate. The number of transmissions in the network varies over time, but it does not change sharply, and thus it is reasonable to estimate the current rate for a short period in the future. However, there is still room for further improvement in the accuracy of this estimation.

7.2. Local Hotspots

Currently, the transmission rate control scheme proposed in this article only considers rate negotiation and adjustment on the established path and does not actively modify the transmission path. The transmission in the network is unevenly distributed in space, with some hot network nodes congested while others may be idle.

7.3. Future Research

In future research, we will further optimize the prediction algorithm for transmission arrival, establish a suitable transmission arrival probability model, and improve the accuracy of predicting the number of transmission requests that arrive within the control delay to ingestion. At the same time, we will consider selecting a more suitable transmission path during the rate adjustment process to avoid congestion of hotspot nodes, balance network load, and improve the network’s overall bandwidth utilization and throughput.

8. Conclusions

This article proposes an active congestion avoidance transmission rate control method based on network node bandwidth allocation, establishes a joint rate control mechanism between network nodes and sending nodes, designs an initial value allocation algorithm for the transmission rate, a rate adjustment algorithm that adapts to network changes, and a substream rate allocation algorithm. The initial value algorithm for the transmission rate has a constant time complexity O ( 1 ) . The rate adjustment algorithm must traverse all adjustable transmissions with a time complexity of O ( N ) , where N is the number of transmissions the node passes. The subflow rate allocation algorithm must traverse all sublows belonging to the same transmission with a time complexity of O ( M ) , where M is the number of subflows included in the transmission. Through simulation, it was found that in terms of the start-up speed, the transmission rate control scheme proposed achieved a link BDP faster than that for a slow start-up speed and therefore had better throughput performance even when the transmission data volume was small. In terms of congestion control, compared with controlling the transmission rate at the sending node, the network nodes could more accurately grasp the network congestion status. Therefore, the transmission rate and delay of the proposed scheme could remain stable without periodic fluctuations. Moreover, in the face of link packet loss, NewReno and Cubic can misjudge network congestion and cause throughput degradation, especially in high-latency and bandwidth networks where performance loss is severe. The proposed scheme can maintain good throughput performance. In terms of fairness, the proposed scheme not only maintained fairness in bandwidth allocation between single-path transmissions but also avoided subflows from encroaching on the bandwidth of other transmissions through shared bottlenecks during multipath transmission.

Author Contributions

Conceptualization, H.L., H.N. and R.H.; methodology, H.L., H.N. and R.H.; software, H.L.; writing—original draft preparation, H.L.; writing—review and editing, H.L. and R.H.; supervision, H.N. and R.H.; project administration, H.N. and R.H.; funding acquisition, H.N. and R.H. All authors have read and agreed to the published version of the manuscript.

Funding

This work was funded by the Strategic Priority Research Program of Chinese Academy of Sciences: Information Collaborative Service and Data Sharing (Grant No. XDA031050100).

Data Availability Statement

The data presented in this study are available on request from the corresponding author.

Acknowledgments

We would like to express our gratitude to Hong Ni, Rui Han, Yong Xu, and Younan Lu for their meaningful support for this work.

Conflicts of Interest

The authors declare no conflict of interest.

References

  1. Allman, M.; Paxson, V.; Blanton, E. TCP Congestion Control. No. rfc5681. 2009. Available online: https://www.rfc-editor.org/rfc/rfc5681 (accessed on 1 November 2023).
  2. Floyd, S.; Henderson, T.; Gurtov, A. The NewReno Modification to TCP’s Fast Recovery Algorithm. No. rfc3782. 2004. Available online: https://www.rfc-editor.org/rfc/rfc6582.html (accessed on 1 November 2023).
  3. Ha, S.; Rhee, I.; Xu, L. CUBIC: A new TCP-friendly high-speed TCP variant. ACM SIGOPS Oper. Syst. Rev. 2008, 42, 64–74. [Google Scholar] [CrossRef]
  4. Brakmo, L.S.; O’Malley, S.W.; Peterson, L.L. TCP Vegas: New techniques for congestion detection and avoidance. In Proceedings of the Conference on Communications Architectures, Protocols and Applications, London, UK, 31 August–2 September 1994. [Google Scholar]
  5. Tan, K.; Song, J.; Zhang, Q.; Sridharan, M. A compound TCP approach for high-speed and long distance networks. In Proceedings of the IEEE INFOCOM, Catalunya, Spain, 23–29 April 2006. [Google Scholar]
  6. Cardwell, N.; Cheng, Y.; Gunn, C.S.; Yeganeh, S.H.; Jacobson, V. Bbr: Congestion-based congestion control: Measuring bottleneck bandwidth and round-trip propagation time. Queue 2016, 14, 20–53. [Google Scholar] [CrossRef]
  7. Ford, A.; Raiciu, C.; Handley, M.; Bonaventure, O. TCP Extensions for Multipath Operation with Multiple Addresses; IETF: Wilmington, DE, USA, 2013. [Google Scholar]
  8. Zongor, L.; Heszberger, Z.; Pašić, A.; Tapolcai, J. The Performance of Multi-Path TCP with Overlapping Paths. In Proceedings of the ACM SIGCOMM 2019 Conference Posters and Demos (SIGCOMM Posters and Demos ’19), Beijing, China, 19–23 August 2019; pp. 116–118. [Google Scholar]
  9. Huang, J.; Li, W.; Li, Q.; Zhang, T.; Dong, P.; Wang, J. Tuning High Flow Concurrency for MPTCP in Data Center Networks. J. Cloud Comput. Adv. Syst. Appl. 2020, 9, 13. [Google Scholar] [CrossRef]
  10. Dong, P.; Yang, W.; Xue, K.; Tang, W.; Gao, K.; Huang, J. Tuning the Aggressive Slow-Start Behavior of MPTCP for Short Flows. IEEE Access 2019, 7, 6010–6024. [Google Scholar] [CrossRef]
  11. Ferlin, S.; Alay, Ö; Dreibholz, T.; Hayes, D.A.; Welzl, M. Revisiting Congestion Control for Multipath TCP with Shared Bottleneck Detection. In Proceedings of the IEEE International Conference on Computer Communications (INFOCOM), San Francisco, CA, USA, 10–14 April 2016; IEEE: Piscataway, NJ, USA, 2015. [Google Scholar]
  12. Hayes, D.A.; Welzl, M.; Ferlin, S.; Ros, D.; Islam, S. Online Identification of Groups of Flows Sharing a Network Bottleneck. IEEE/ACM Trans. Netw. 2020, 28, 2229–2242. [Google Scholar] [CrossRef]
  13. Kelly, F.; Voice, T. Stability of end-to-end algorithms for joint routing and rate control. Computer Communication Review. ACM SIGCOMM Comput. Commun. Rev. 2005, 35, 5–12. [Google Scholar] [CrossRef]
  14. Usach, R.; Kühlewind, M. Implementation and Evaluation of Coupled Congestion Control for Multipath TCP. In Proceedings of the European Network of Universities & Companies in Information & Communication Engineering, Budapest, Hungary, 29–31 August 2012; Springer: Berlin/Heidelberg, Germany, 2012. [Google Scholar]
  15. Fan, Y.; Amer, P.; Ekiz, N. A Scheduler for Multipath TCP. In Proceedings of the International Conference on Computer Communications & Networks, Nassau, Bahamas, 30 July–2 August 2013; IEEE: Piscataway, NJ, USA, 2013; pp. 1–7. [Google Scholar]
  16. Jacobson, V.; Smetters, D.K.; Thornton, J.D.; Plass, M.F.; Briggs, N.H.; Braynard, R.L. Networking Named Content. In Proceedings of the 5th International Conference on Emerging Networking Experiments and Technologies, Rome, Italy, 1–4 December 2009; Association for Computing Machinery: New York, NY, USA, 2009; pp. 1–12. [Google Scholar]
  17. Zhang, L.; Afanasyev, A.; Burke, J.; Jacobson, V.; Claffy, K.; Crowley, P.; Papadopoulos, C.; Wang, L.; Zhang, B. Named Data Networking. ACM SIGCOMM Comput. Commun. 2014, 44, 66–73. [Google Scholar] [CrossRef]
  18. Wang, J.; Cheng, G.; You, J.; Sun, P. SEANet: Architecture and Technologies of an On-site, Elastic, Autonomous Network. J. Netw. New Med. 2020, 6, 1–8. [Google Scholar]
  19. Carofiglio, G.; Gallo, M.; Muscariello, L. ICP: Design and evaluation of an interest control protocol for content-centric networking. In Proceedings of the 2012 IEEE INFOCOM Workshops, Orlando, FL, USA, 25–30 March 2012; IEEE: Piscataway, NJ, USA, 2012. [Google Scholar]
  20. Salsano, S.; Detti, A.; Cancellieri, M.; Pomposini, M.; Blefari-Melazzi, N. Transport-layer issues in information centric networks. In Proceedings of the Second Edition of the ICN Workshop on Information-Centric Networking, Helsinki, Finland, 17 August 2012. [Google Scholar]
  21. Hu, Y.; Serban, C.; Wang, L.; Afanasyev, A.; Zhang, L. BBR-Inspired Congestion Control for Data Fetching over NDN. In Proceedings of the MILCOM 2021–2021 IEEE Military Communications Conference (Milcom), San Diego, CA, USA, 29 November–2 December 2021; IEEE: Piscataway, NJ, USA, 2021. [Google Scholar]
  22. Ramakrishnan, K.; Floyd, S.; Black, D. The Addition of Explicit Congestion Notification (ECN) to IP. No. rfc3168. 2001. Available online: https://www.rfc-editor.org/rfc/rfc3168 (accessed on 1 November 2023).
  23. Katabi, D.; Handley, M.; Rohrs, C. Congestion control for high bandwidth-delay product networks. In Proceedings of the 2002 Conference on Applications, Technologies, Architectures, and Protocols for Computer Communications, Pittsburgh, PA, USA, 19–23 August 2002. [Google Scholar]
  24. Wang, Z.; Luo, H.; Zhou, H.; Li, J. R2T: A Rapid and Reliable Hop-by-Hop Transport Mechanism for Information-Centric Networking. IEEE Access 2018, 6, 15311–15325. [Google Scholar] [CrossRef]
  25. Nadeem, K.; Jadoon, T.M. An ns-3 MPTCP Implementation. In Quality, Reliability, Security and Robustness in Heterogeneous Systems, Proceedings of the 14th EAI International Conference, Qshine 2018, Ho Chi Minh City, Vietnam, 3–4 December 2018; Proceedings 14; Springer International Publishing: Berlin/Heidelberg, Germany, 2019; pp. 48–60. [Google Scholar]
Figure 1. Bandwidth allocation-based transmission rate control model.
Futureinternet 15 00385 g001
Figure 2. Negotiation message.
Futureinternet 15 00385 g002
Figure 3. Adjustment message.
Futureinternet 15 00385 g003
Figure 4. Experimental topology.
Futureinternet 15 00385 g004
Figure 5. Inflighting bytes.
Futureinternet 15 00385 g005
Figure 6. Throughput.
Futureinternet 15 00385 g006
Figure 7. Delay and throughput performance.
Futureinternet 15 00385 g007
Figure 8. Transmission performance with packet loss.
Futureinternet 15 00385 g008
Figure 9. Multiple single-flow transmission.
Futureinternet 15 00385 g009
Figure 10. Shared bottleneck.
Futureinternet 15 00385 g010
Figure 11. Network simulation.
Futureinternet 15 00385 g011
Table 1. Research on transmission rate control.
ControllerSchemeCharacteristic
RenoSlow start and congestion avoidance
NewRenoImproved fast retransmit
CubicUse a cubic function of the time since the last packet loss when the window grows
VegasUsing delay as a congestion signal
Compound TCPCombining two methods based on packet loss and delay
Sending nodeBbrRegularly adjust the transmission rate to detect bandwidth and RTT
COUPLEDCongestion of a subflow results in a halving of the window length for all subflows, and the congested subflows are terminated
SEMI-COUPLEDCongestion of a subflow only results in a halving of the subflow window length
LIASolved the problem of unequal fairness between subflows of different RTTs
ICPReduce the sending window to A (0 < A < 1) times when congested
Receiving nodeICTPConsidering the trade-off between traffic control, security, and overhead brought about by the size of data blocks
BBR-CDUsing average RTT instead of minimum RTT and using filters to remove noise from RTT samples
Network node, sending node, and receiving nodeECNWhen a network node discovers congestion, it sets flag bits in the data packet, and the sending node adjusts the rate based on the flag bits in the received data packet
XCPAdd congestion control information to the data packet, and the router performs periodic decision processing
Table 2. Experimental parameter set-up.
ParametersValue
Test PlatformNS-3
Tested SchemeNodectl, NewReno, Cubic, Bbr
Server Access Link Bandwidth, Delay200 Mbps, 5 ms
User Access Link Bandwidth, Delay200 Mbps, 5 ms
Bottleneck Link Bandwidth, Delay10–90 Mbps, 1–140 ms
Queue Length100 packets
Receive Cache Size10 MB
Send Cache Size10 MB
Packet Size1052 B
Transferred Data Amount0–90 MB
Table 3. Time when infighting bytes reach BDP.
Bandwidth × RttNewRenoCubicBbrNodectl
10 Mbps × 20 ms = 25 KB121 ms121 ms139 ms41 ms
10 Mbps × 80 ms = 100 KB596 ms596 ms702 ms162 ms
80 Mbps × 20 ms = 200 KB168 ms168 ms194 ms40 ms
80 Mbps × 80 ms = 800 KB820 ms820 ms920 ms160 ms
Table 4. Bandwidth utilization of 3 MB file transfer.
Link DelayNewRenoCubicBbrNodectl
30 ms37.5%37.5%35.0%77.5%
35 ms32.5%32.5%30.0%75.0%
40 ms30.0%30.0%26.2%72.1%
45 ms26.2%26.2%23.7%70.0%
Table 5. Range of transmission RTT and throughput fluctuations.
Fluctuation RangeNewRenoCubicBbrNodectl
RTT41 ms25 ms9 ms0.2 ms
Throughput37.4 Mbps21.8 Mbps46.8 Mbps0.2 Mbps
Table 6. Ratio of change in performance.
ParameterNewRenoCubicBbrNodectl
(a)24.7%37.9%100.7%99.8%
(b)43.1%46.9%92.0%100%
(c)42.7%53.1%40.7%86.7%
Table 7. Average transmission throughput.
TransmissionNewRenoCubicBbrNodectl
A12.81 Mbps15.25 Mbps0.01 Mbps11.38 Mbps
B13.80 Mbps9.64 Mbps1.77 Mbps11.38 Mbps
C7.65 Mbps9.39 Mbps29.5 Mbps11.38 Mbps
Table 8. Average flow throughput.
TransmissionMPTCP-CoupledNodectl
A1.89 Mbps2.79 Mbps
D3.74 Mbps2.79 Mbps
Table 9. Ratio of change in network performance.
Packet LossNewRenoCubicBbrNodectl
0.5%76%73%97.3%99.1%
Disclaimer/Publisher’s Note: The statements, opinions and data contained in all publications are solely those of the individual author(s) and contributor(s) and not of MDPI and/or the editor(s). MDPI and/or the editor(s) disclaim responsibility for any injury to people or property resulting from any ideas, methods, instructions or products referred to in the content.

