
kClusterHub: An AutoML-Driven Tool for Effortless Partition-Based Clustering over Varied Data Types †


Abstract
:1. Introduction
2. Related Work
3. Partition-Based Clustering
3.1. K-Means
| Algorithm 1 K-means clustering. |
|
3.2. K-Modes
3.3. K-Prototypes
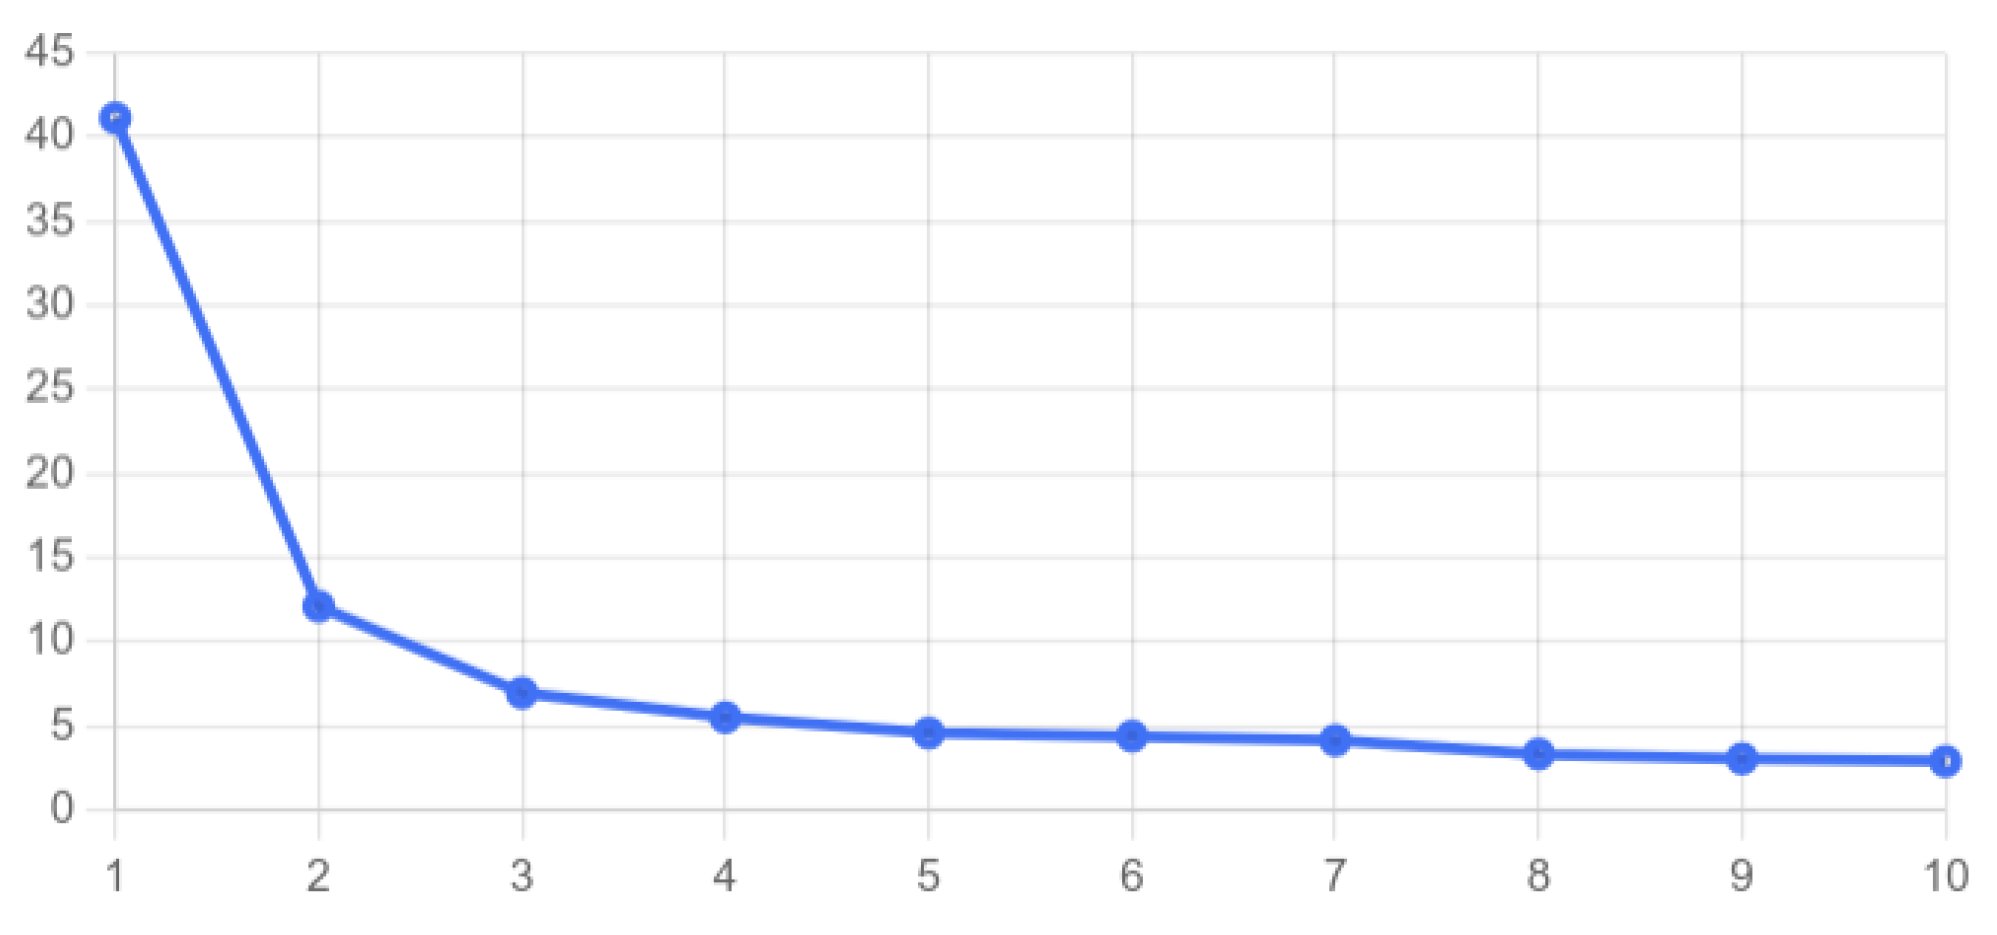
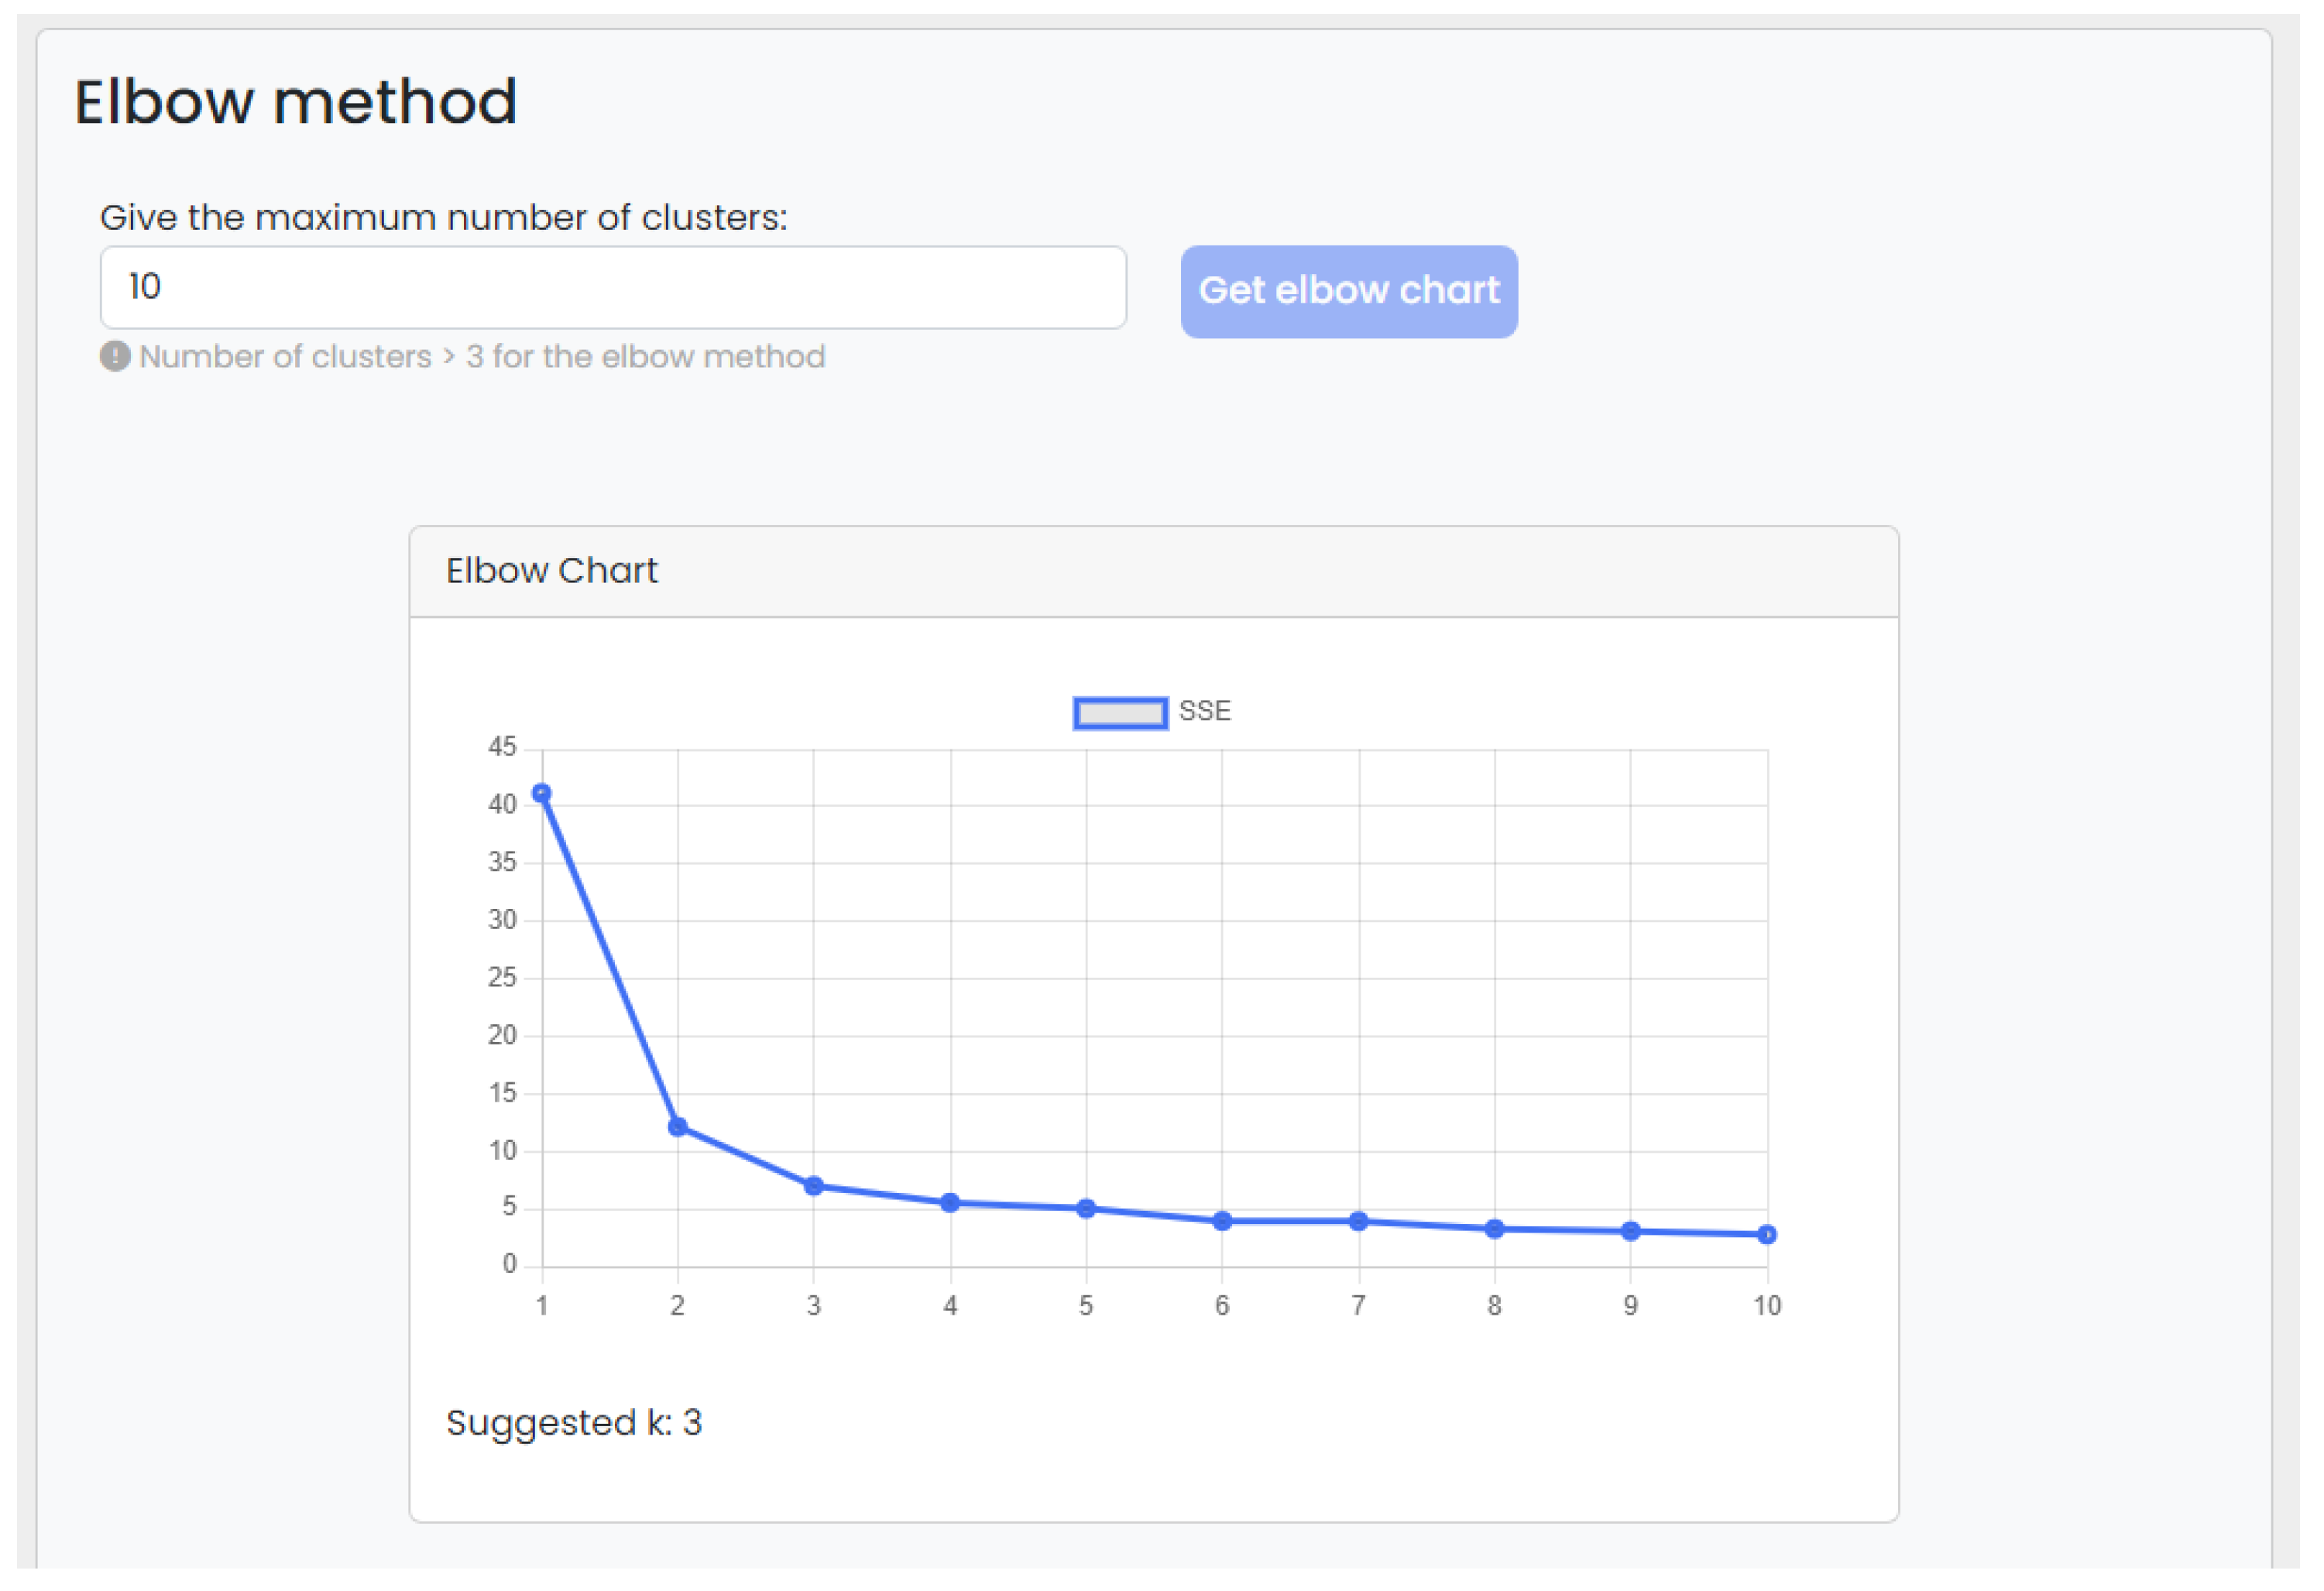
3.4. Elbow Method
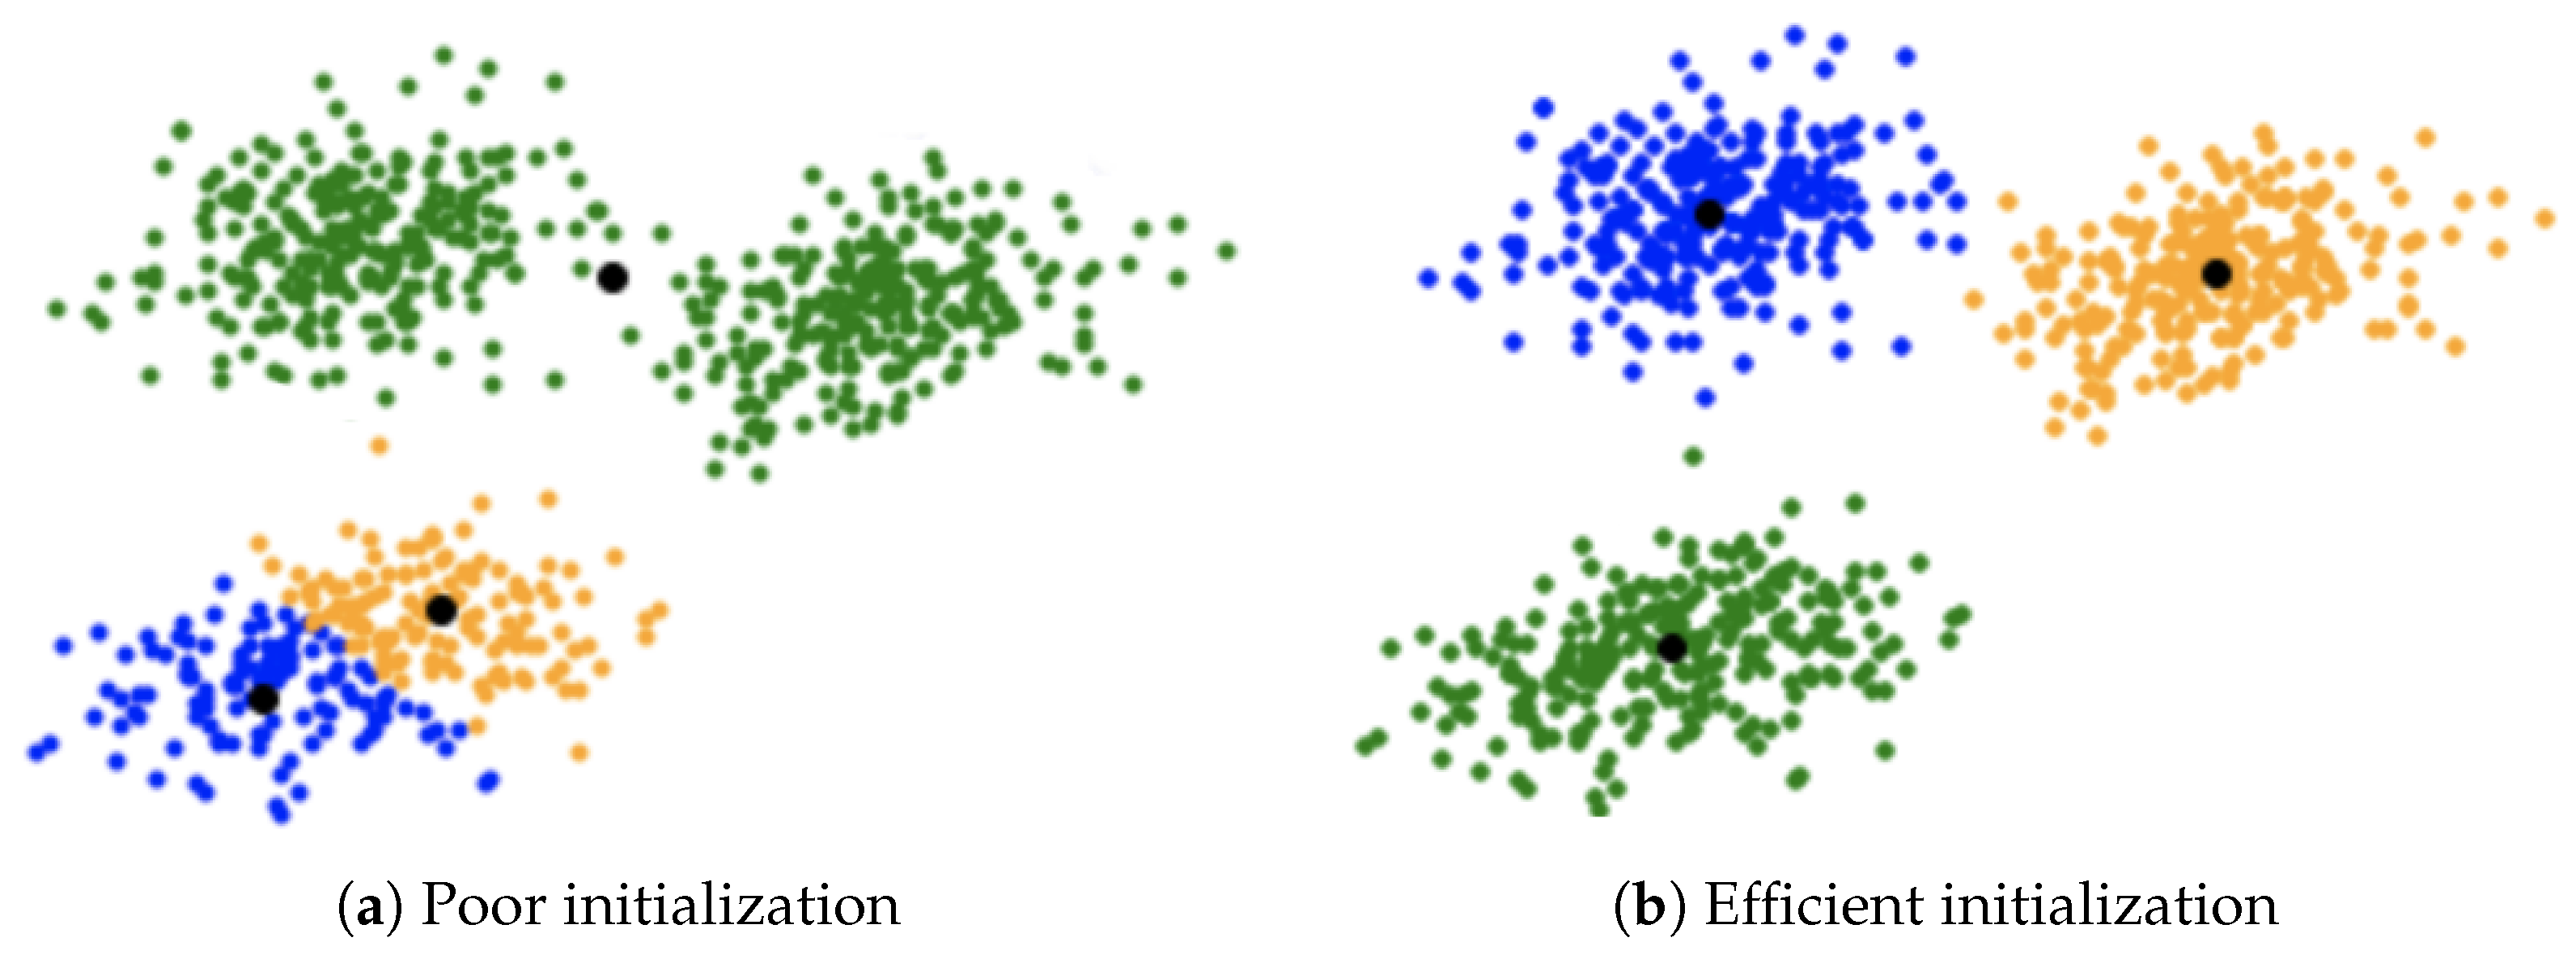
3.5. Initial Centroids Selection
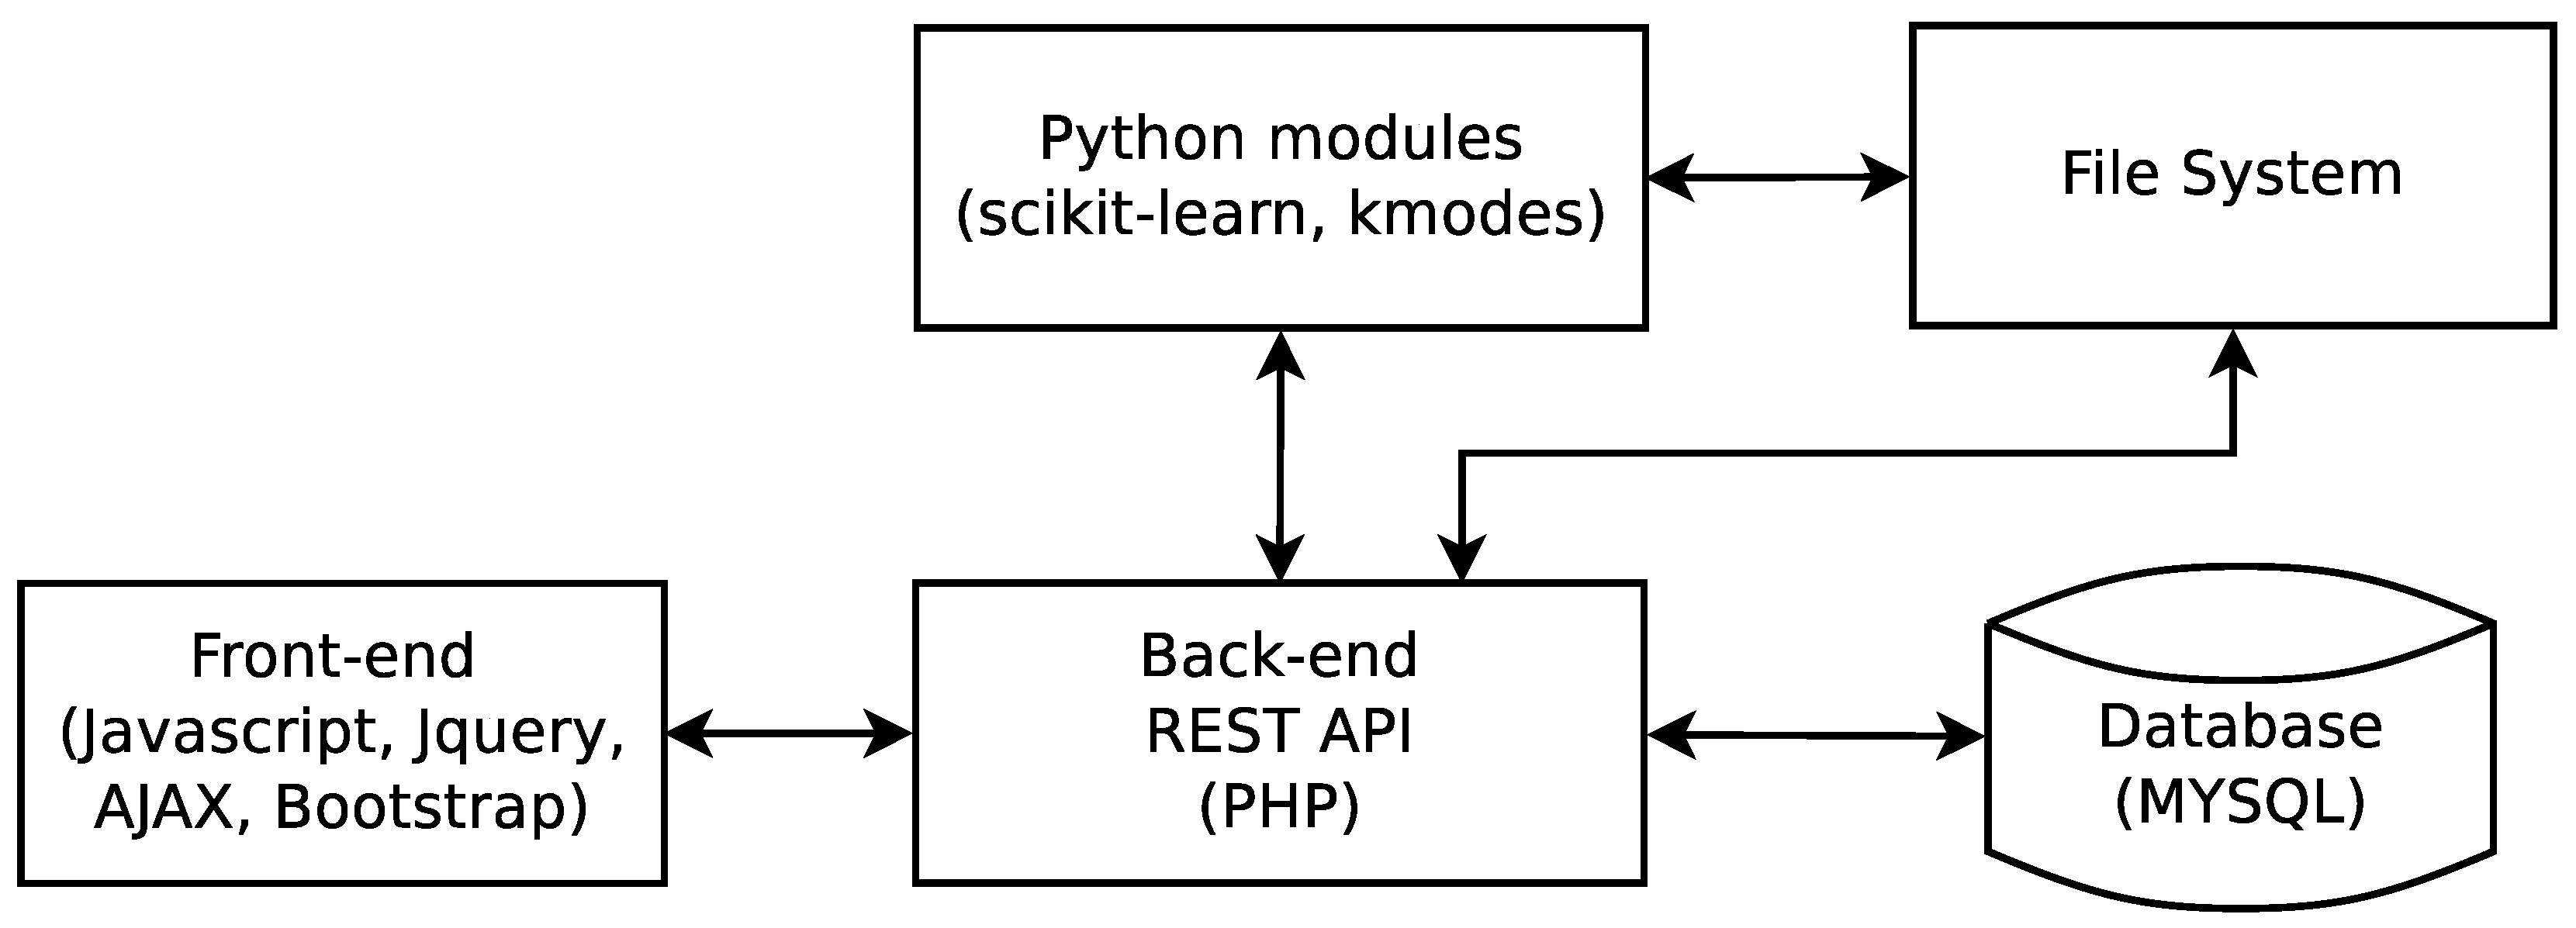
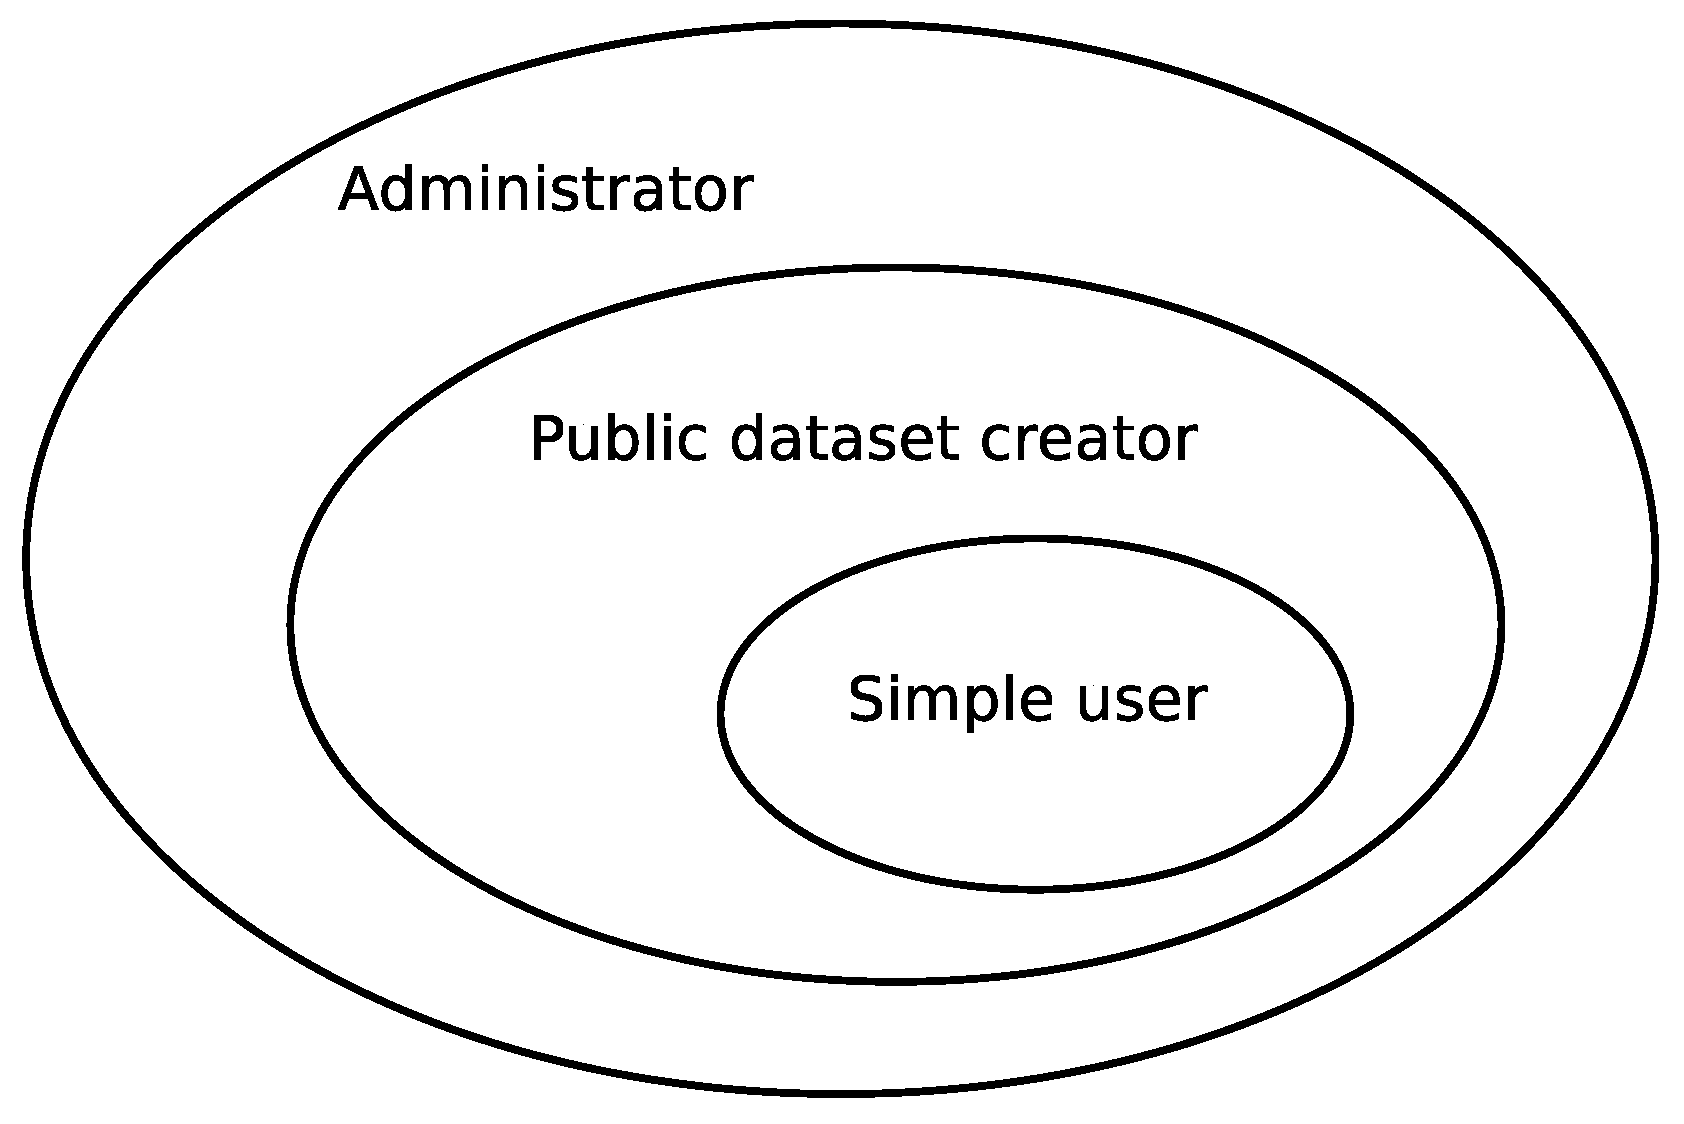
4. The kClusterHub Application
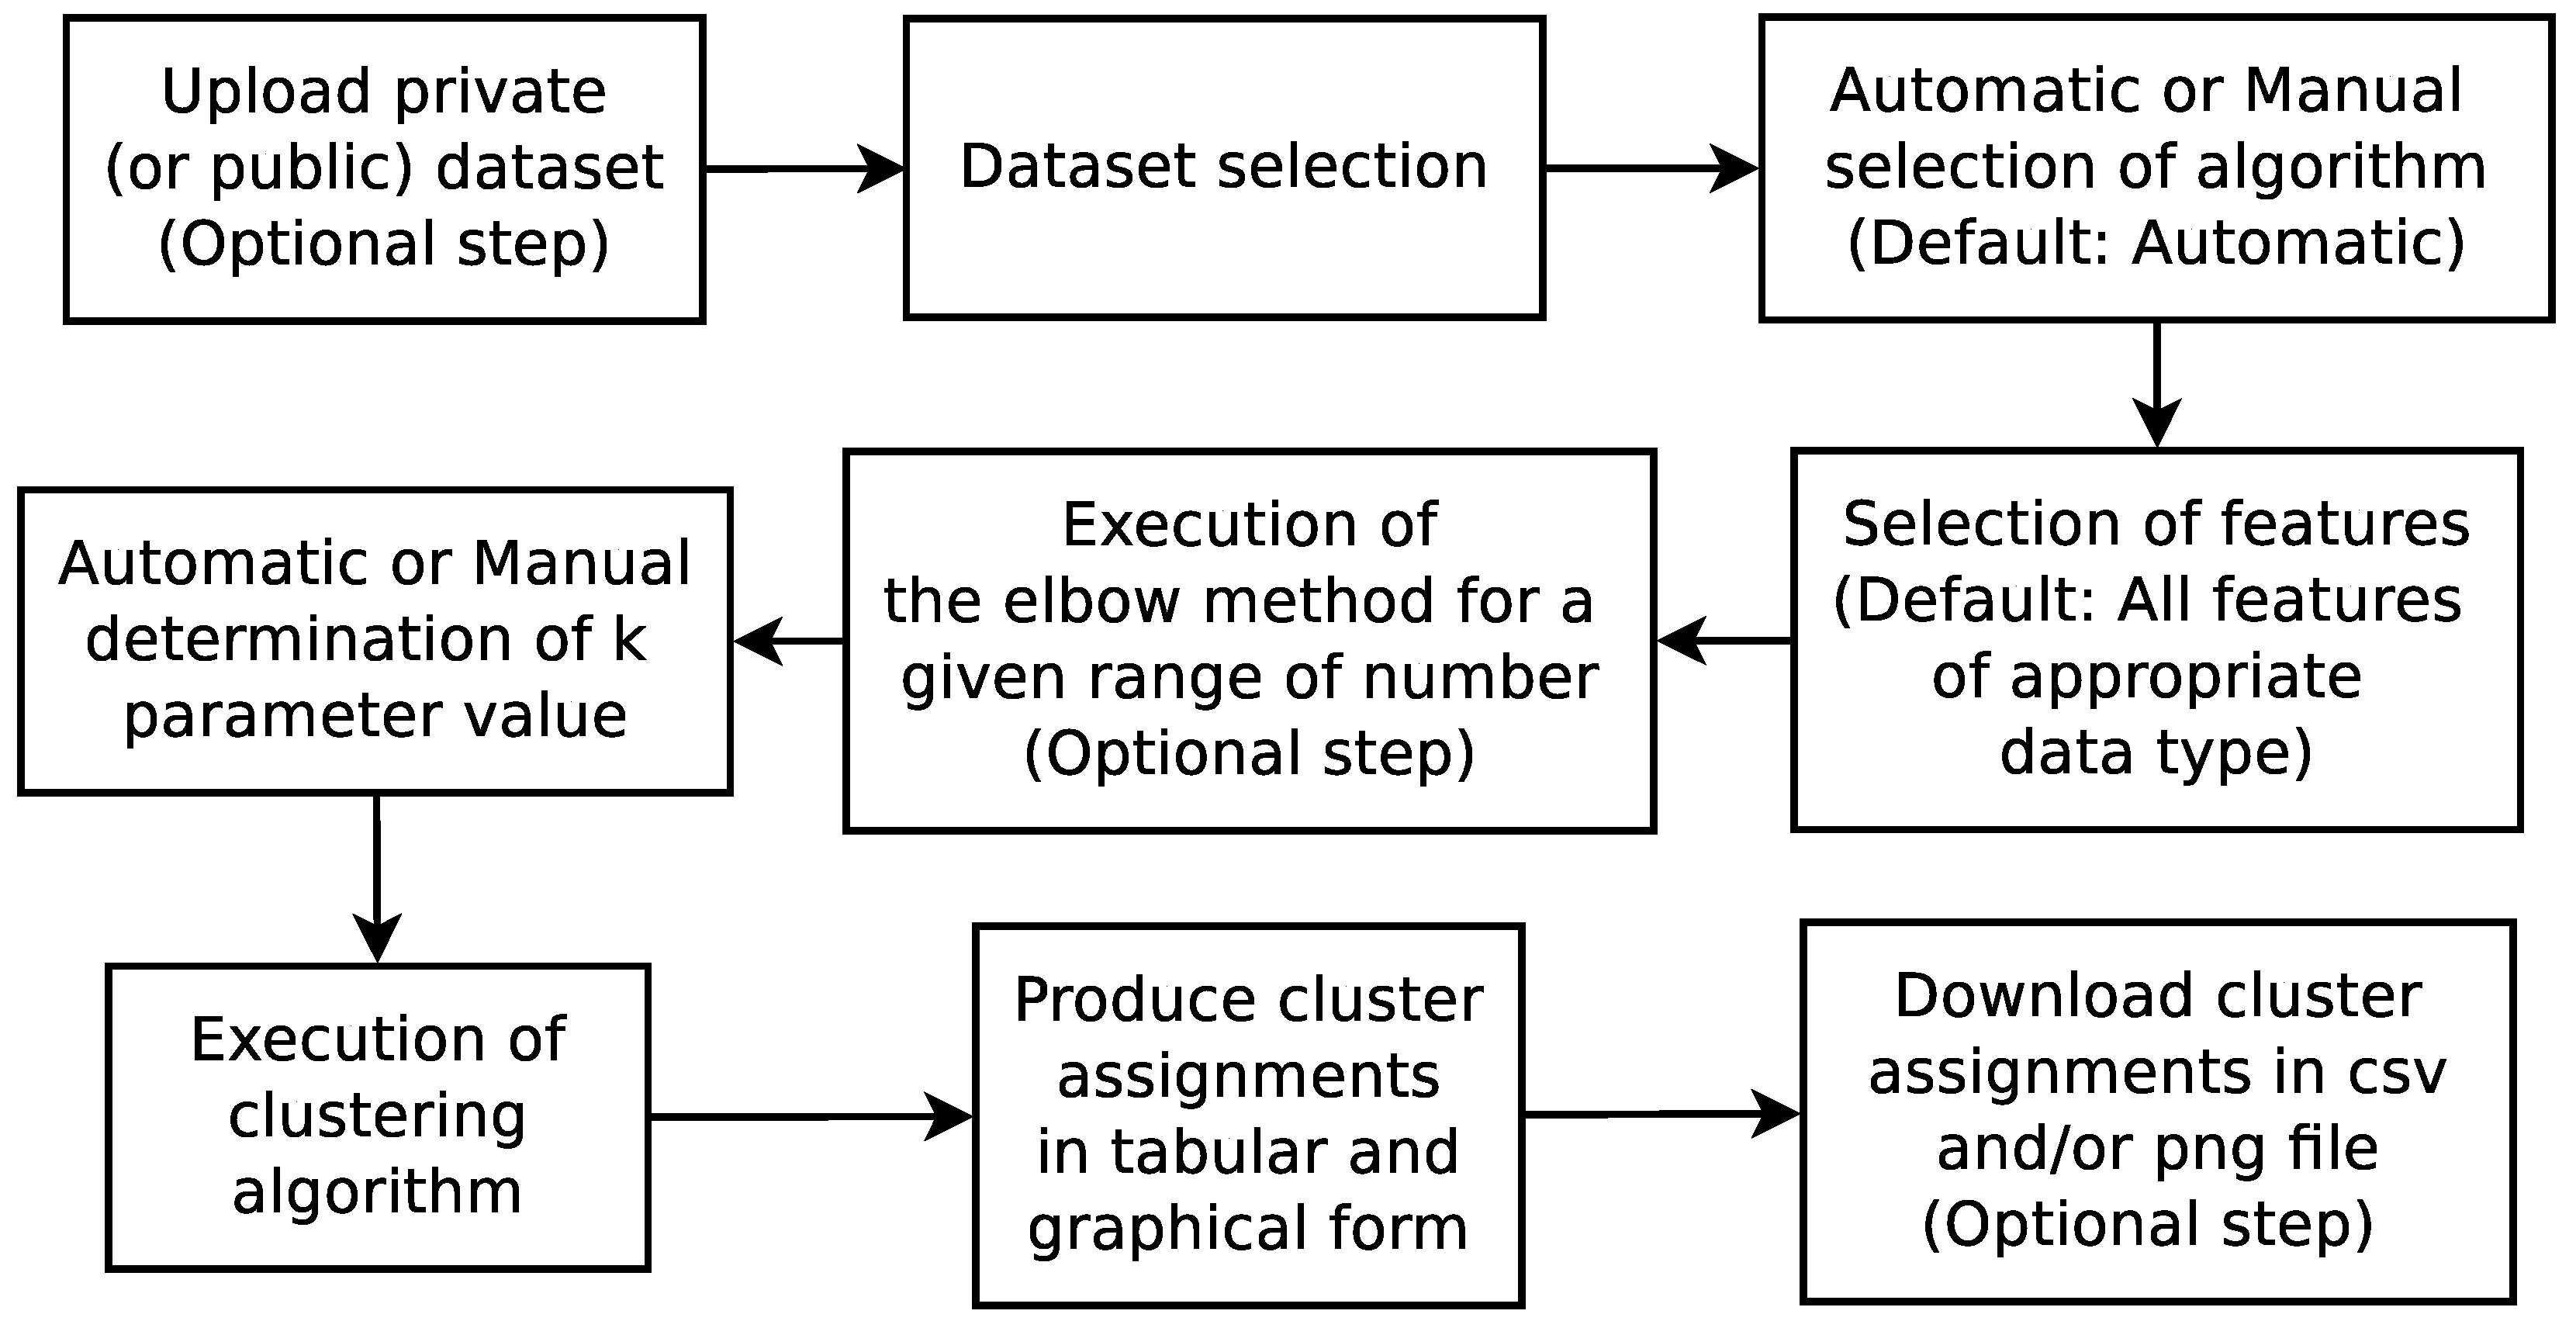
4.1. Description
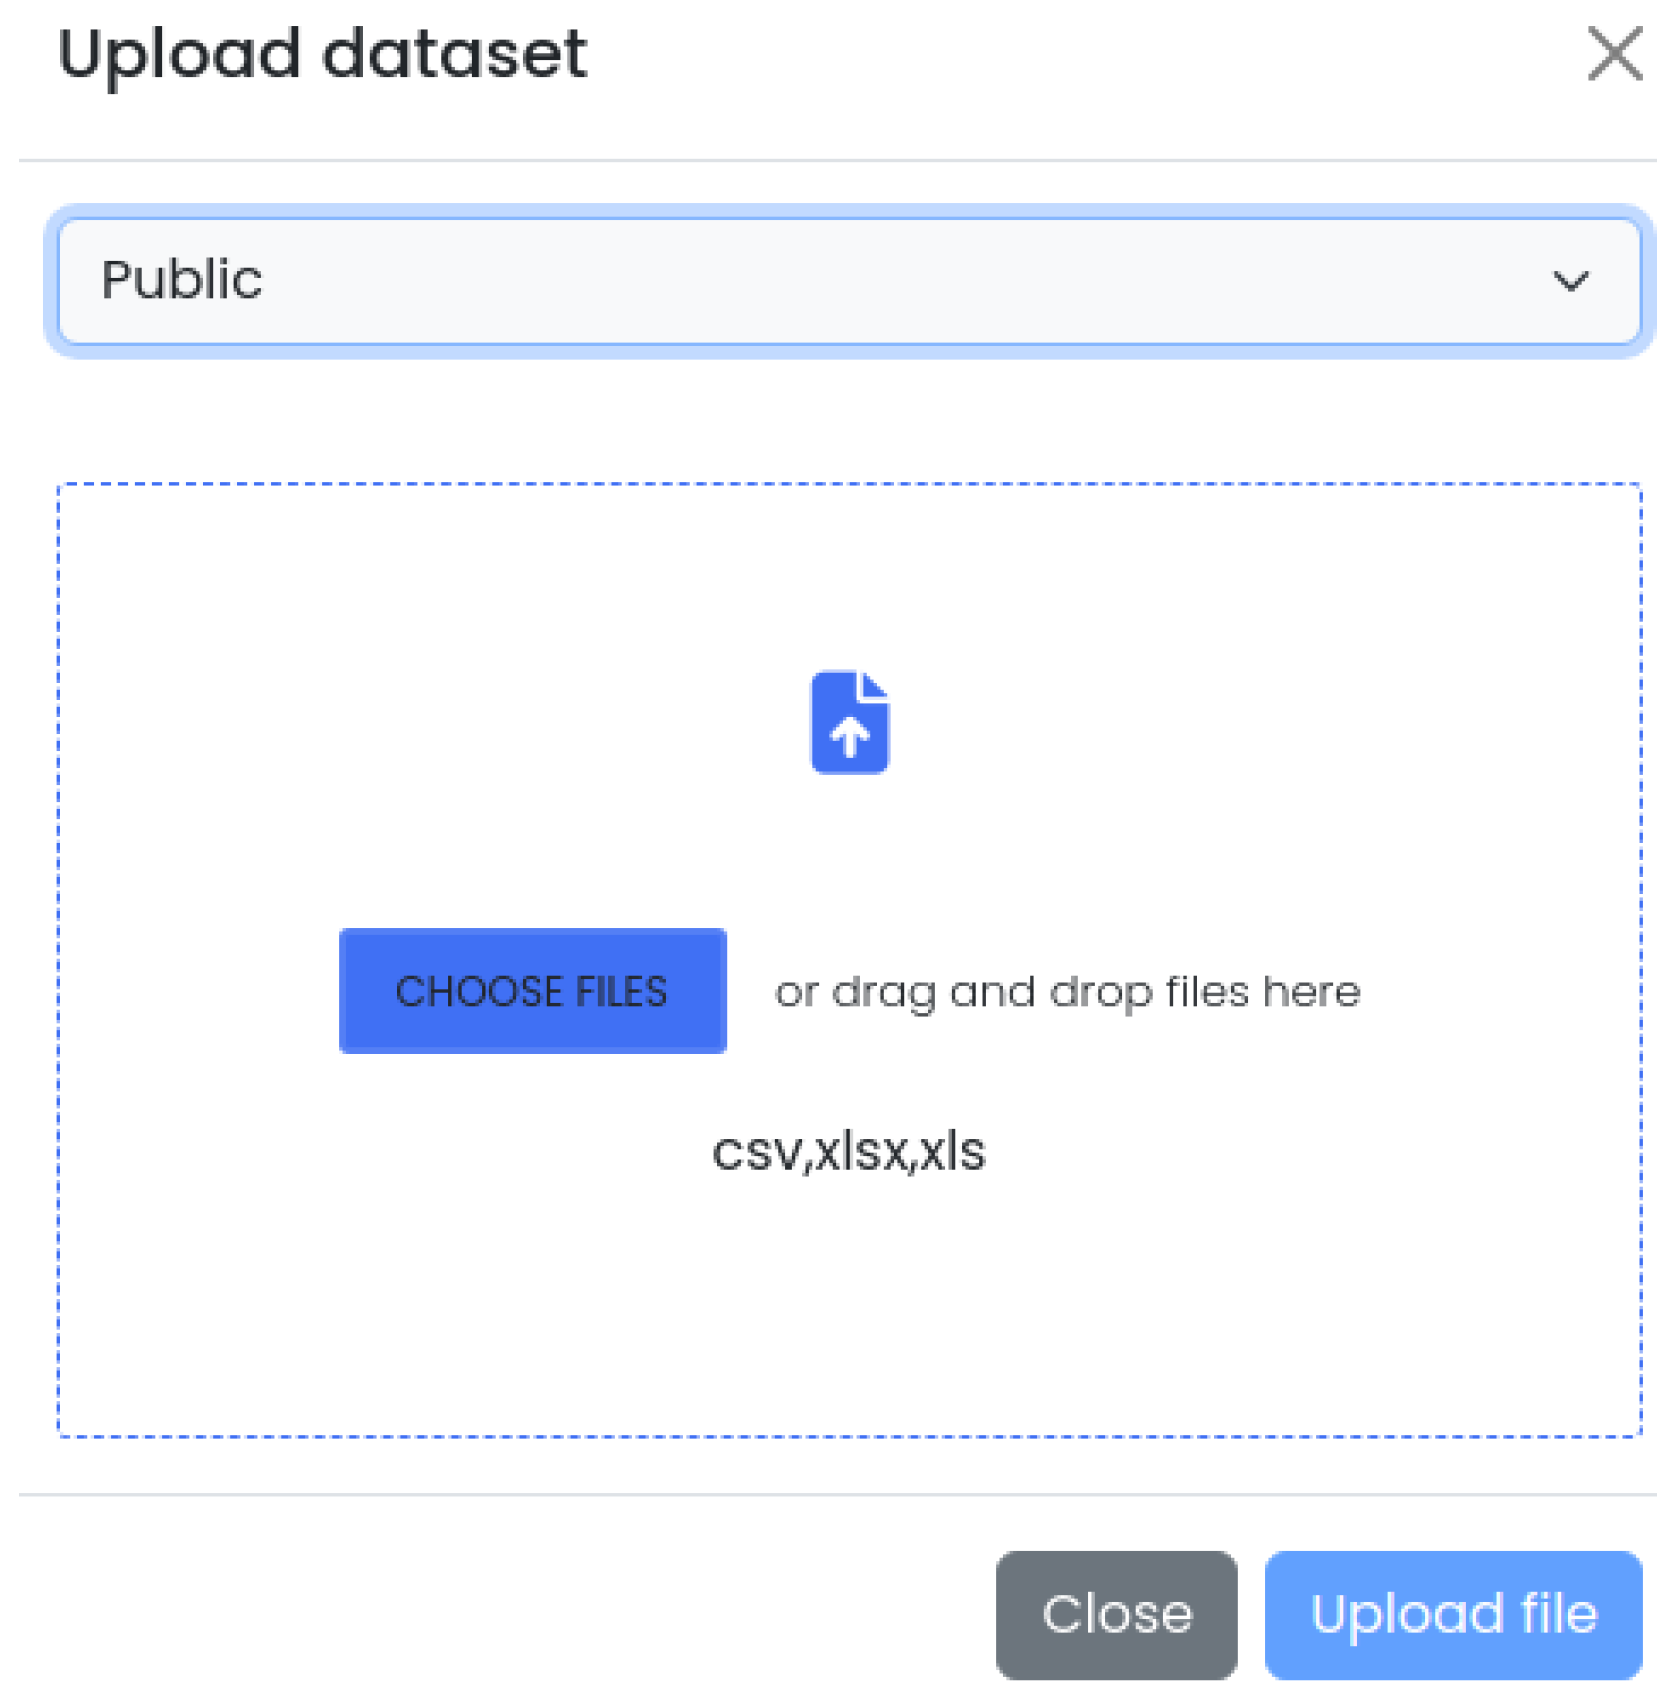
- The development of kClusterHub, a user-friendly web application that allows users to upload datasets, utilizes the elbow method for finding the optimal number of clusters and uses partition-based clustering on any data types;
- kClusterHub is able to automatically select the appropriate clustering algorithm for the selected attributes of the dataset;
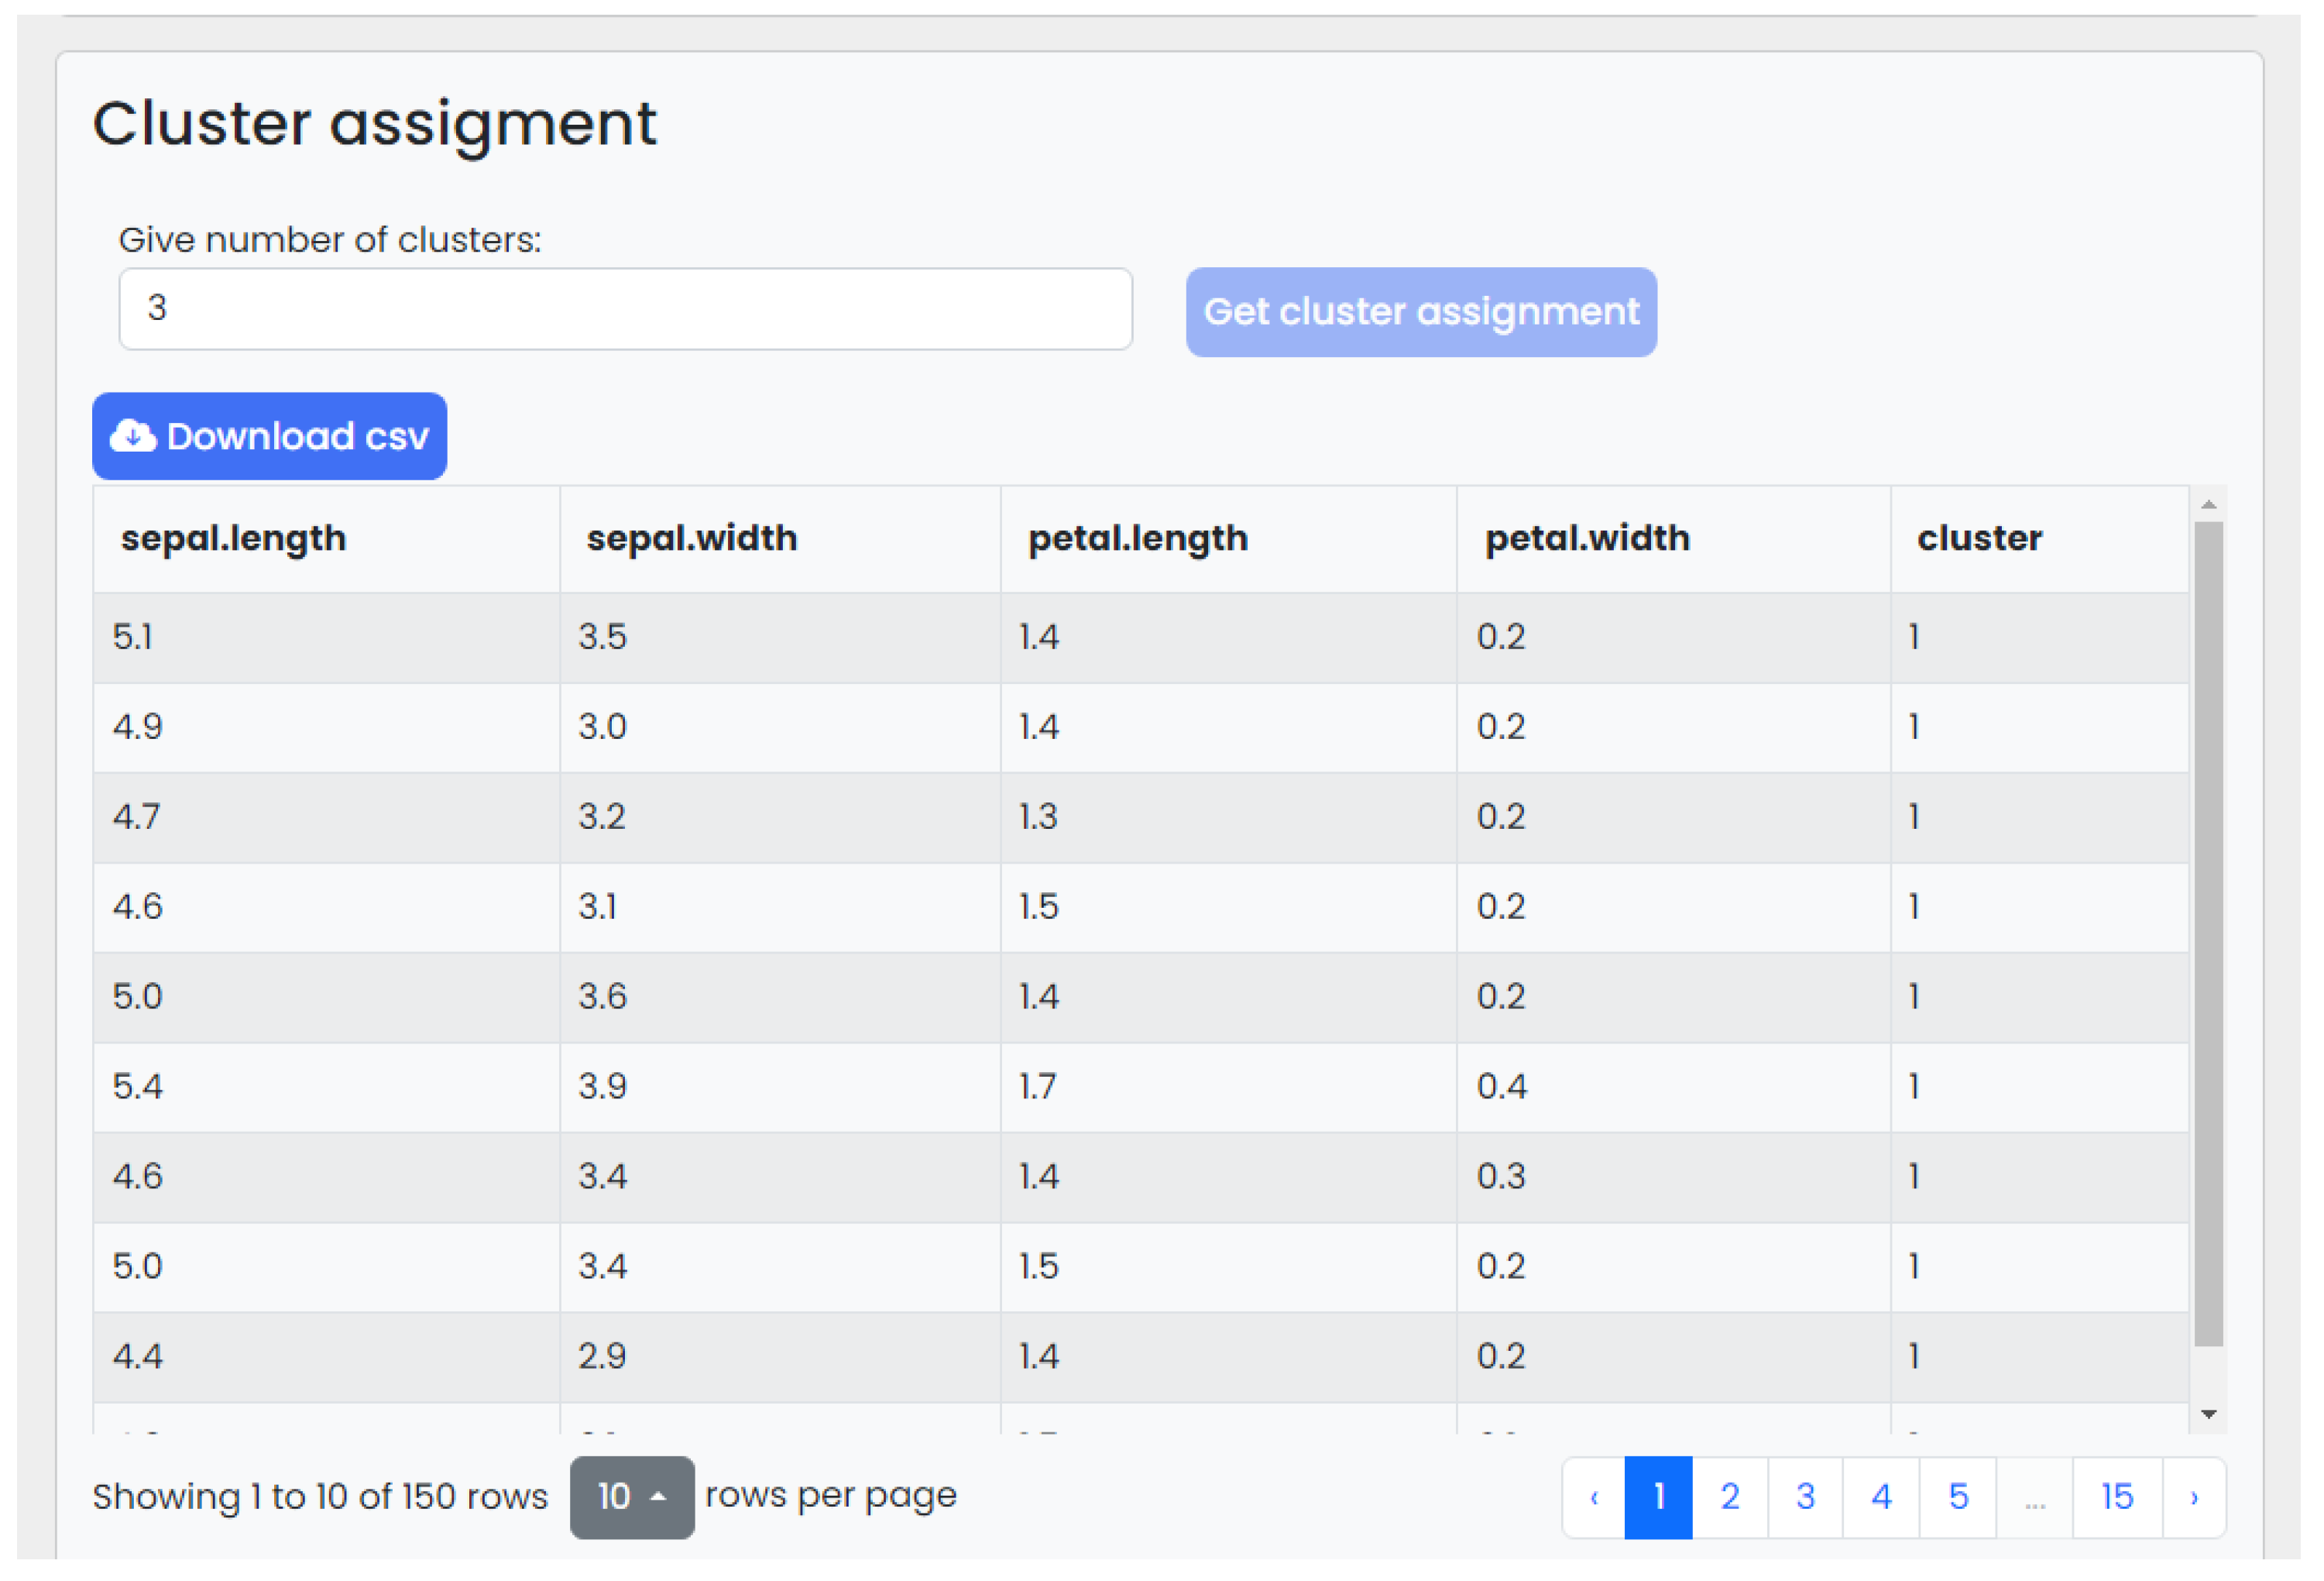
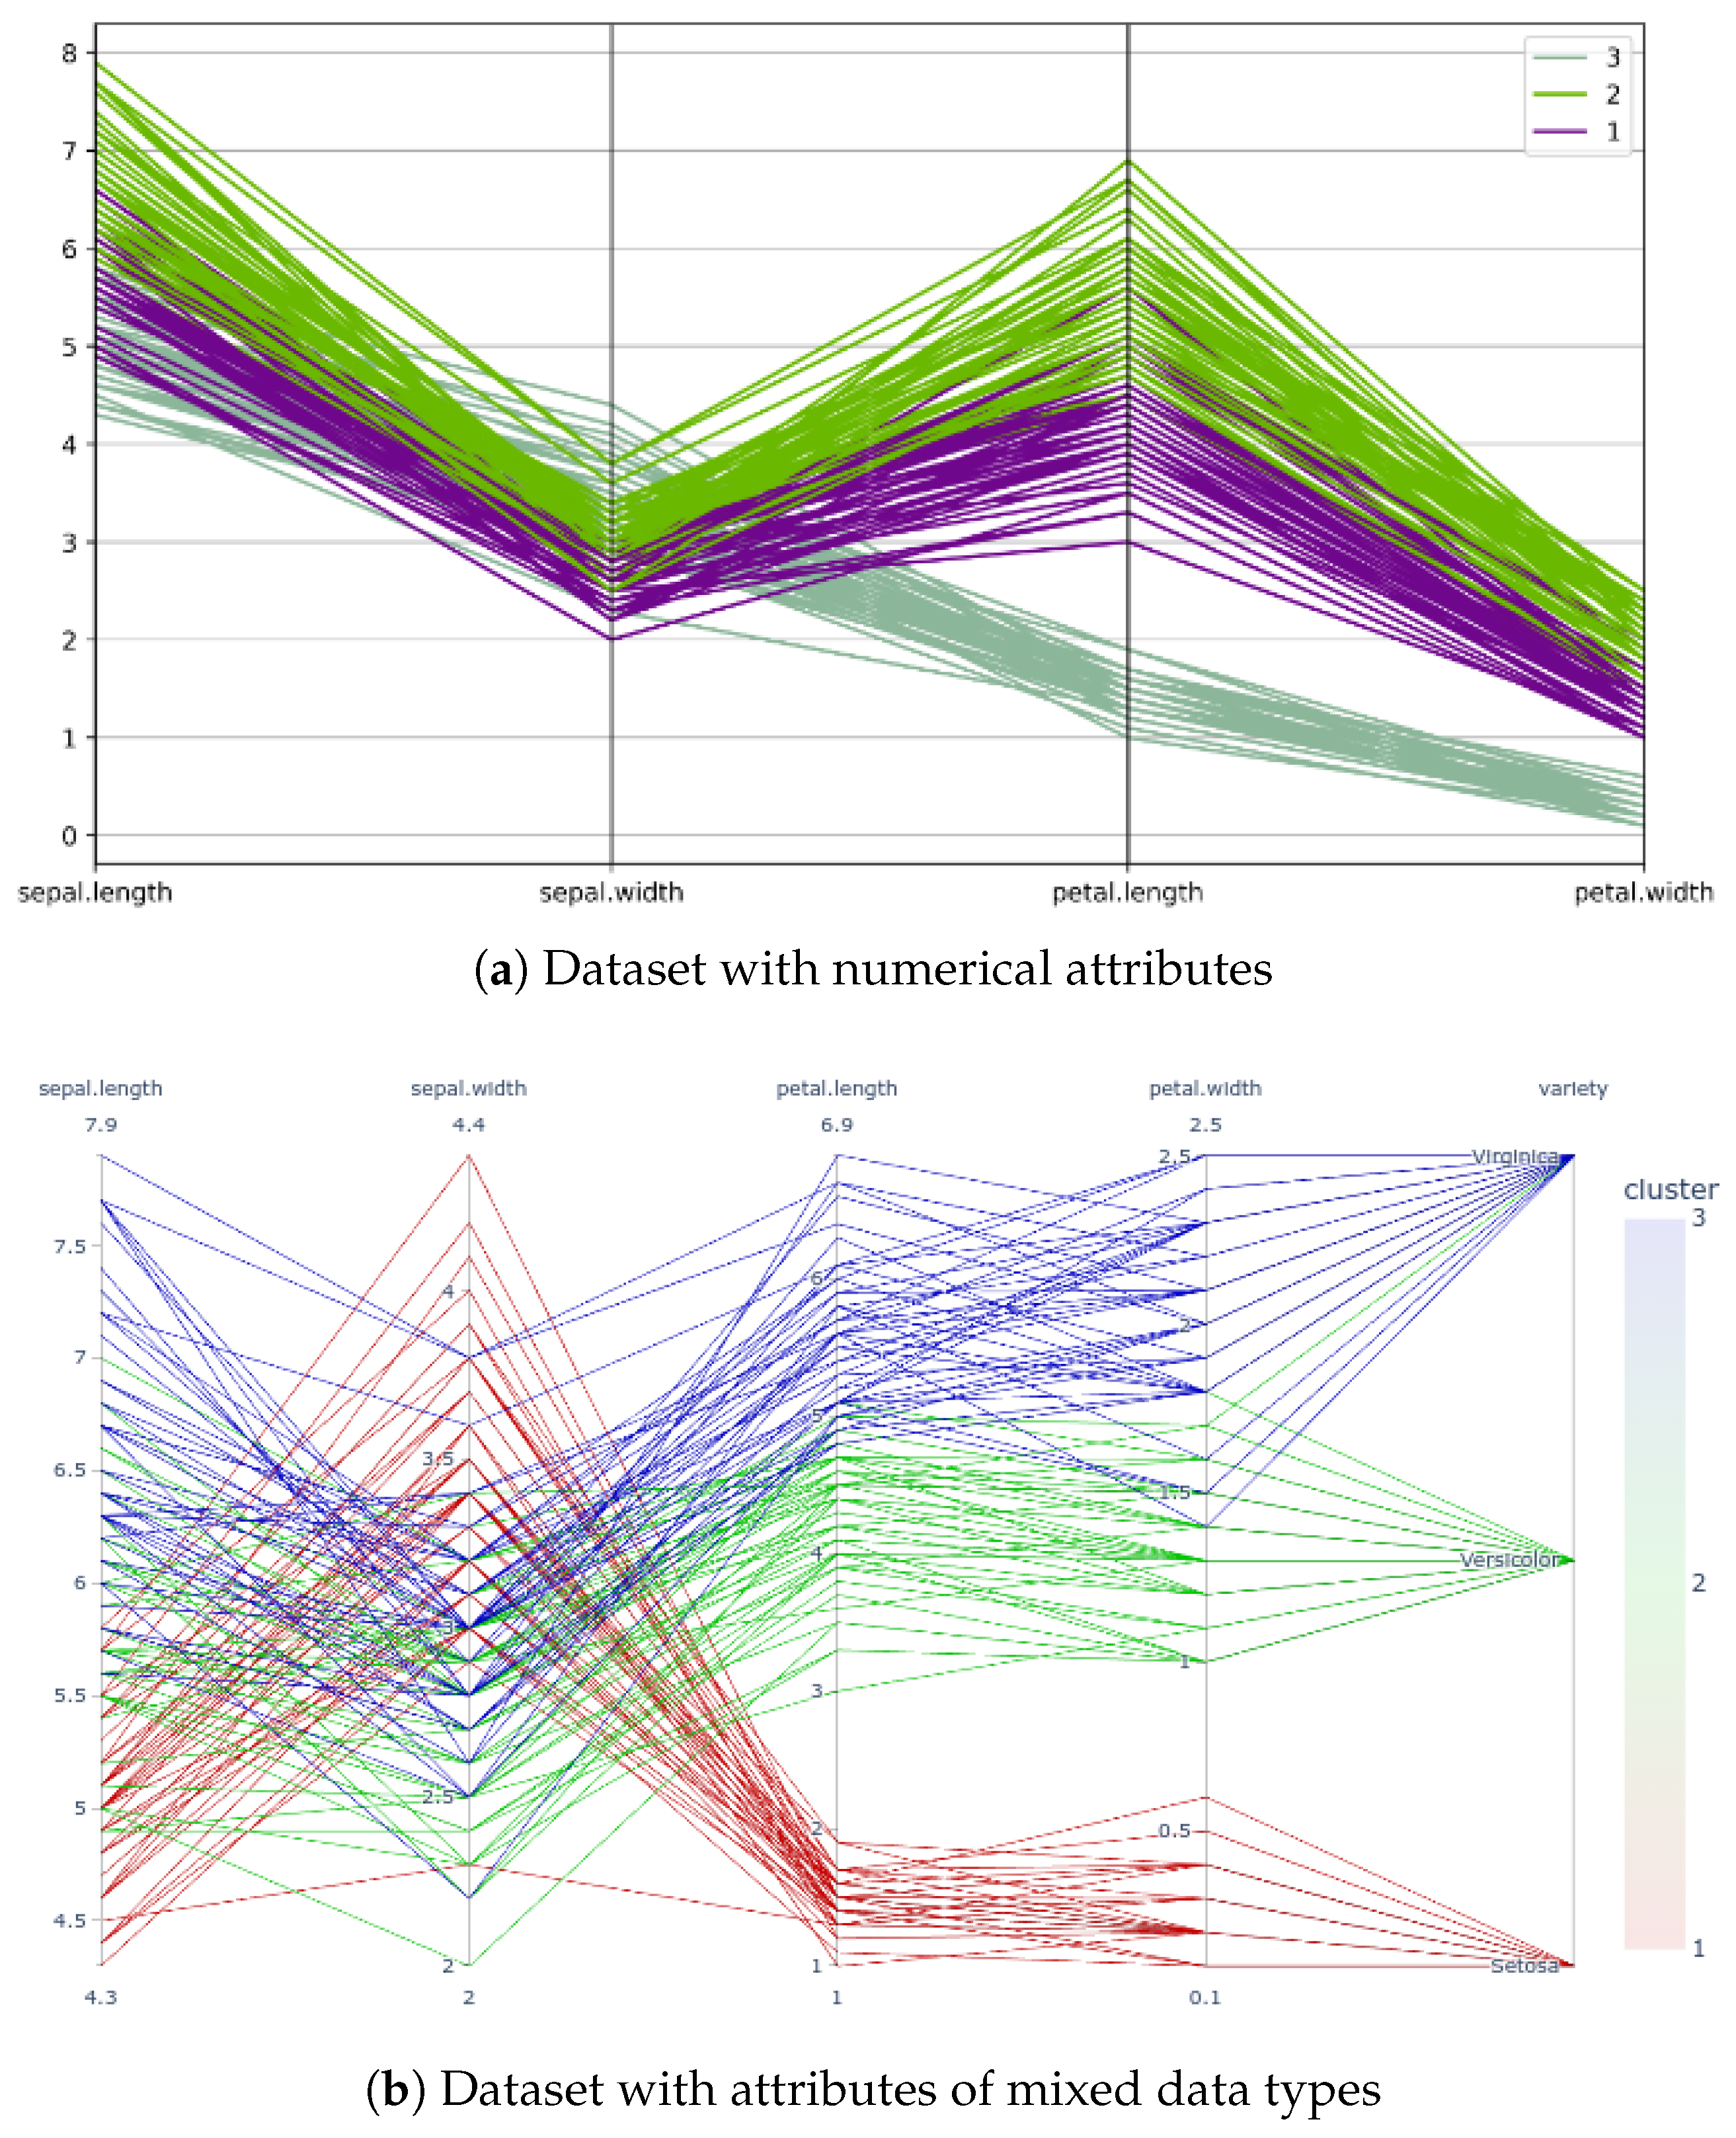
- The cluster assignments are presented in a tabular form and in data plots—they can be downloaded;
- The development of a free REST API which offers all operations to developers who wish to integrate kClusterHub’s functionality into their own applications.
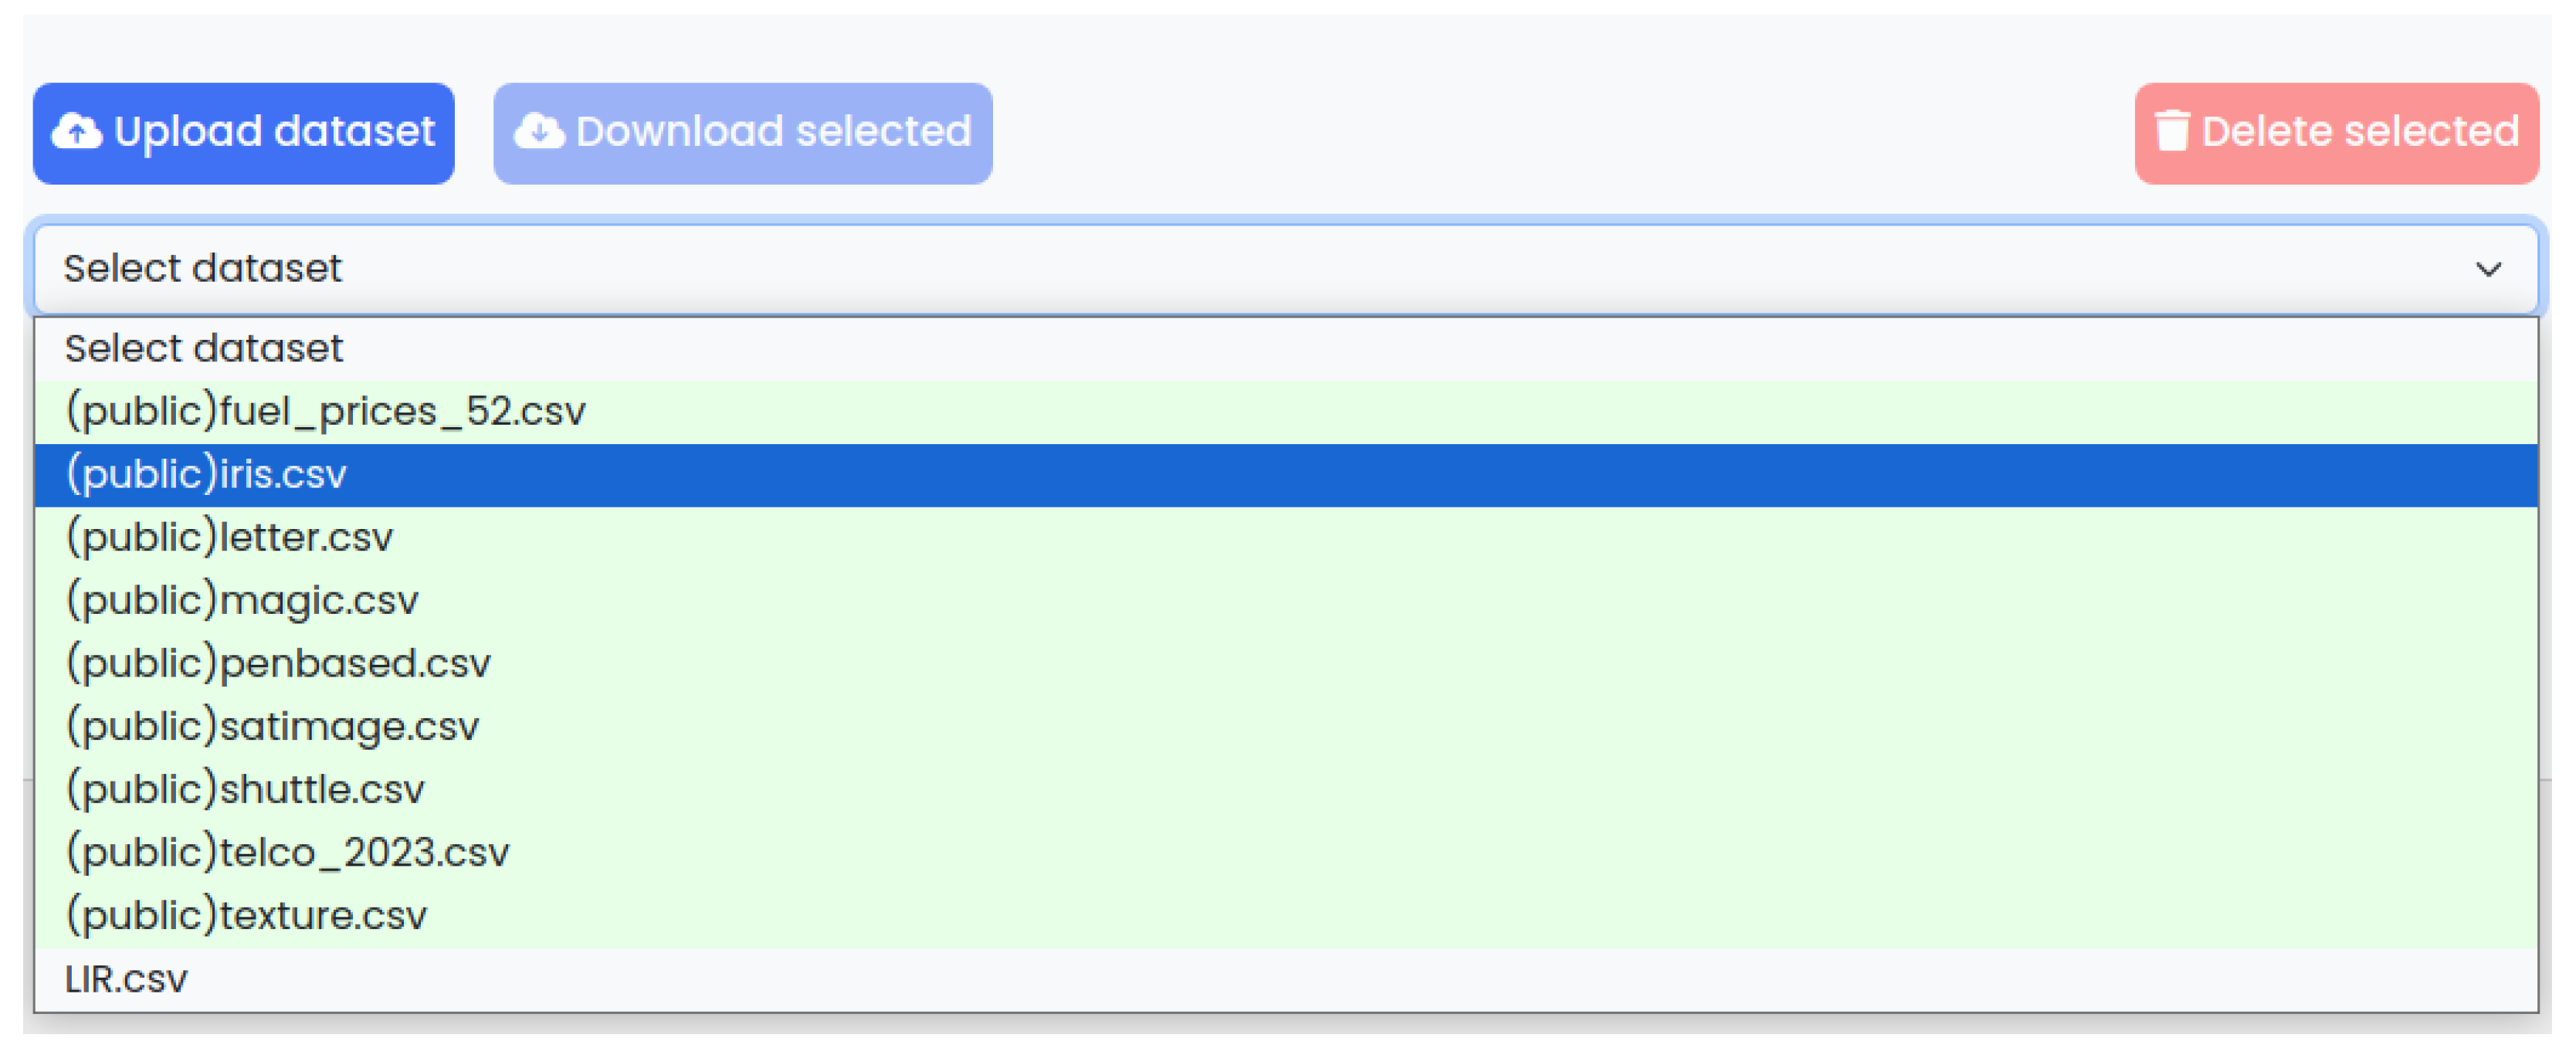
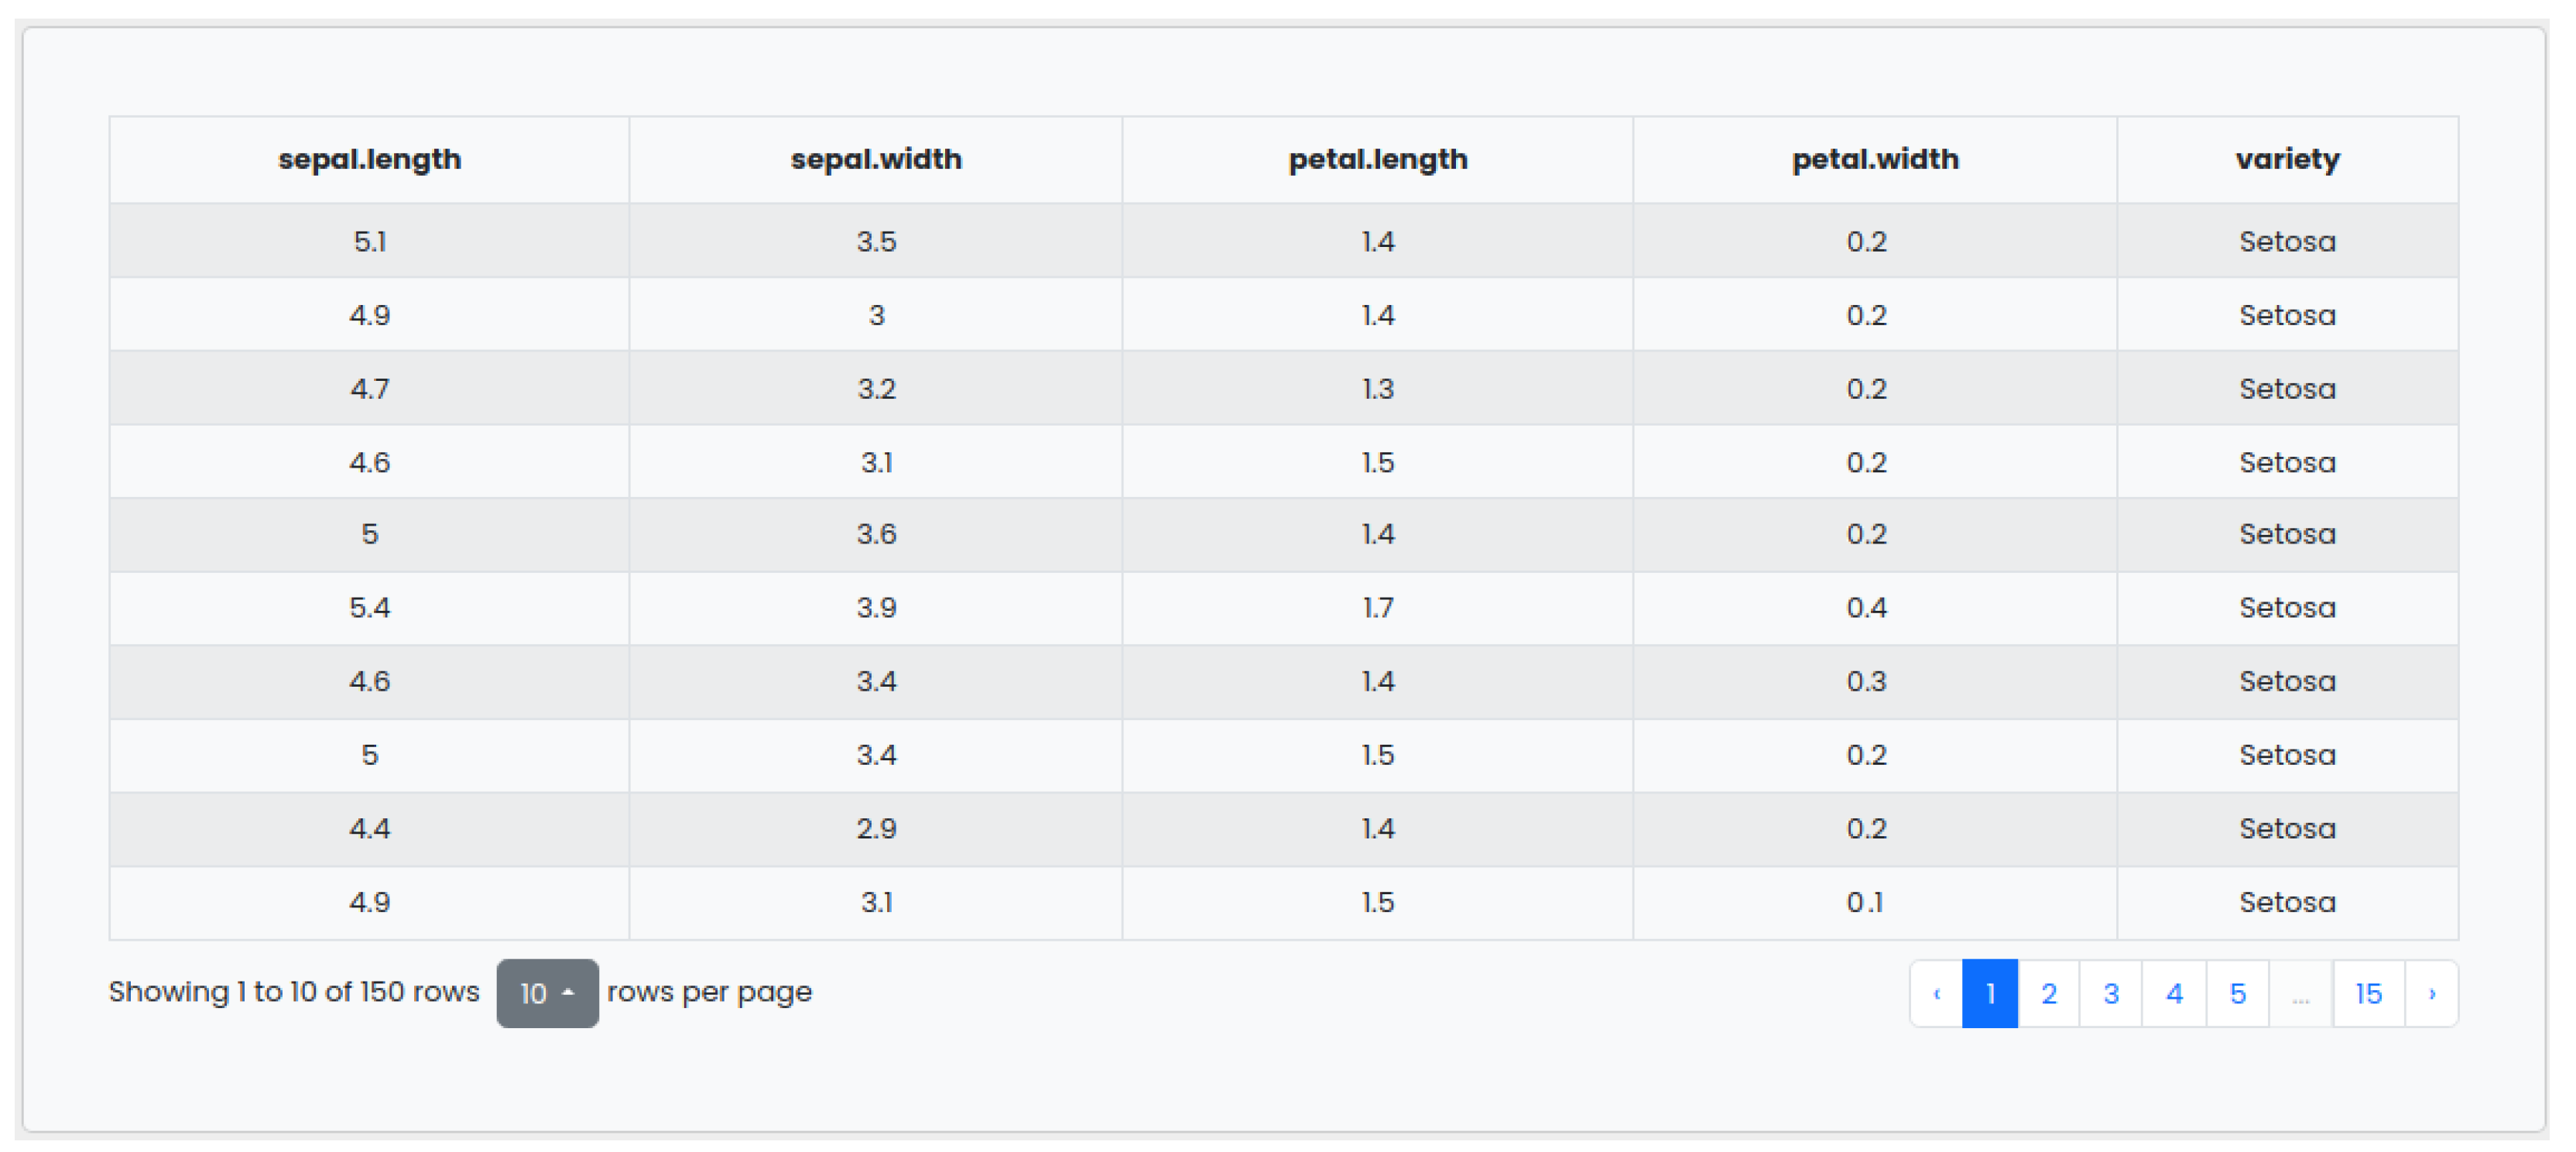
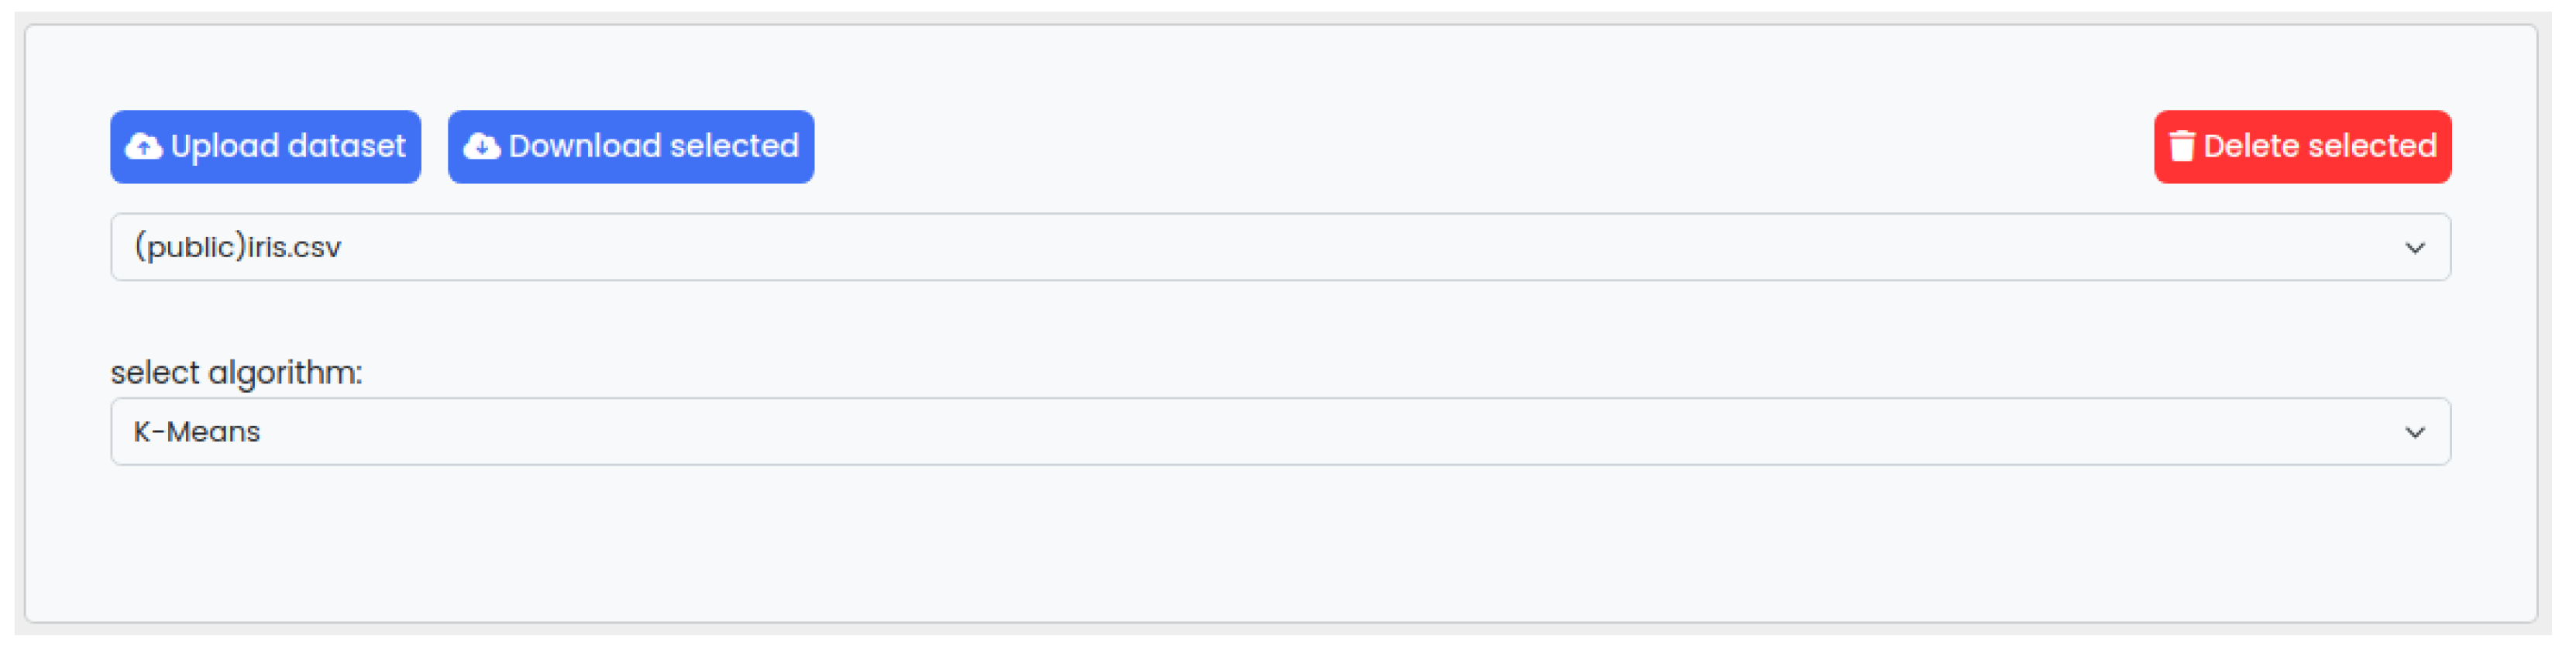
4.2. Web Interface
4.3. Web Service
JSON response:
{"personal_datasets":["LIR.csv"],
 "public_datasets":["fuel_prices_52.csv","iris.csv",
                    "letter.csv","magic.csv","penbased.csv",
                    "satimage.csv","shuttle.csv",
                    "telco_2023.csv","texture.csv"
                    ]
}
JSON request:
{"dataset":"data.csv",
 "dataset-type":"personal",
 "clusters":"10",
 "columns":["Age","Salary"],
 "algotithm":"auto",
 "apikey":"0a8366a07c0d8fccx48bab2e657f12d0"
}
JSON response:
{"metric":["41.2","12.1","6.9","5.5","4.6","4.7","3.8","3.2","3.3","2.7"],
"suggested-k":"3"
}
JSON request:
{ "dataset": "iris.csv", "dataset-type": "public",
  "clusters": "3",
  "columns": ["sepal.length", "sepal.width", "petal.length", "petal.width"],
  "algorithm":"k-means"
  "apikey": "905a7d7f02b2512fcf3e02b1f6ec52ab"
}
JSON response:
{  "items": [
    {"sepal.length": "5.1", "sepal.width": "3.5",
     "petal.length": "1.4", "petal.width": "0.2",
     "cluster": "1"},
    {"sepal.length": "4.9", "sepal.width": "3.0",
     "petal.length": "1.4", "petal.width": "0.2",
     "cluster": "2"},
    // ... (remaining instances)
  ]
}
5. System Evaluation
5.1. CPU Time Measurements
5.2. Usability Testing
- I think that I would like to use this website frequently;
- I found the website unnecessarily complex;
- I thought the website was easy to use;
- I think that I would need the support of a technical person to be able to use this website;
- I found the various functions in this website were well integrated;
- I thought there was too much inconsistency in this website;
- I would imagine that most people would learn to use this website very quickly;
- I found the website very cumbersome to use;
- I felt very confident using the website;
- I needed to learn a lot of things before I could get going with this website.
6. Conclusions and Future Work
Author Contributions
Funding
Data Availability Statement
Conflicts of Interest
References
- Aggarwal, C.C.; Reddy, C.K. Data Clustering: Algorithms and Applications, 1st ed.; Chapman & Hall/CRC: Boca Raton, FL, USA, 2013. [Google Scholar]
- MacQueen, J.B. Some methods for classification and analysis of multivariate observations. In Proceedings of the Fifth Berkeley Symposium on Mathematical Statistics and Probability, Berkeley, CA, USA, 21 June–18 July 1965 and 27 December 1965–7 January 1966; University of California Press: Berkeley, CA, USA, 1967; Voulme 1, pp. 281–297. [Google Scholar]
- Huang, Z. Clustering Large Data Sets with Mixed Numeric and Categorical Values. In Proceedings of the First Pacific Asia Knowledge Discovery and Data Mining Conference, Singapore, 23–24 February 1997; pp. 21–34. [Google Scholar]
- Huang, Z. Extensions to the k-Means Algorithm for Clustering Large Data Sets with Categorical Values. Data Min. Knowl. Discov. 1998, 2, 283–304. [Google Scholar] [CrossRef]
- Kodinariya, T.M.; Makwana, P.R. A review on the Elbow method in clustering. Int. J. Comput. Appl. 2013, 1, 97–100. [Google Scholar]
- Frank, E.; Hall, M.A.; Holmes, G.; Kirkby, R.; Pfahringer, B.; Witten, I.H. Weka: A machine learning workbench for data mining. In Data Mining and Knowledge Discovery Handbook: A Complete Guide for Practitioners and Researchers; Maimon, O., Rokach, L., Eds.; Springer: Berlin/Heidelberg, Germany, 2005; pp. 1305–1314. [Google Scholar]
- Demšar, J.; Curk, T.; Erjavec, A.; Gorup, Č.; Hočevar, T.; Milutinovič, M.; Možina, M.; Polajnar, M.; Toplak, M.; Starič, A.; et al. Orange: Data Mining Toolbox in Python. J. Mach. Learn. Res. 2013, 14, 2349–2353. [Google Scholar]
- Pedregosa, F.; Varoquaux, G.; Gramfort, A.; Michel, V.; Thirion, B.; Grisel, O.; Blondel, M.; Prettenhofer, P.; Weiss, R.; Dubourg, V.; et al. Scikit-learn: Machine Learning in Python. J. Mach. Learn. Res. 2011, 12, 2825–2830. [Google Scholar]
- Szepannek, G. clustMixType: User-Friendly Clustering of Mixed-Type Data in R. R J. 2018, 10, 200–208. [Google Scholar] [CrossRef]
- Gratsos, K.; Ougiaroglou, S.; Margaris, D. A Web Tool for K-means Clustering. In Proceedings of the Novel and Intelligent Digital Systems: Proceedings of the 3rd International Conference (NiDS 2023); Kabassi, K., Mylonas, P., Caro, J., Eds.; Springer: Cham, Switzerland, 2023; pp. 91–101. [Google Scholar]
- Hall, M.; Frank, E.; Holmes, G.; Pfahringer, B.; Reutemann, P.; Witten, I.H. Weka—A machine learning workbench for data mining. In Data Mining and Knowledge Discovery Handbook; Springer: Boston, MA, USA, 2009; pp. 1269–1277. [Google Scholar]
- He, X.; Zhao, K.; Chu, X. AutoML: A survey of the state-of-the-art. Knowl.-Based Syst. 2021, 212, 106622. [Google Scholar] [CrossRef]
- Feurer, M.; Klein, A.; Eggensperger, K.; Springenberg, J.; Blum, M.; Hutter, F. Efficient and Robust Automated Machine Learning. In Advances in Neural Information Processing Systems; MIT Press: Cambridge, MA, USA, 2015; pp. 2755–2763. [Google Scholar]
- LeDell, E.; Poirier, S. H2O AutoML: Scalable Automatic Machine Learning. In Proceedings of the 7th ICML Workshop on Automated Machine Learning (AutoML), Vienna, Austria, 12–18 July 2020. [Google Scholar]
- Amazon Web Services, Amazon SageMaker. 2023. Available online: https://aws.amazon.com/sagemaker/ (accessed on 2 October 2023).
- Maechler, M.; Rousseeuw, P.; Struyf, A.; Hubert, M.; Hornik, K. Cluster: Cluster Analysis Basics and Extensions; R Package Version 2.1.4; R Foundation for Statistical Computing: Vienna, Austria, 2022. [Google Scholar]
- Brock, G.; Pihur, V.; Datta, S.; Datta, S. clValid: An R package for cluster validation. J. Stat. Softw. 2008, 25, 1–22. [Google Scholar] [CrossRef]
- Lin, H.; Liu, H.; Wu, J.; Li, H.; Günnemann, S. Algorithm xxxx: KCC: A MATLAB Package for K-means-based Consensus Clustering. ACM Trans. Math. Softw. 2023. [Google Scholar] [CrossRef]
- Berthold, M.R.; Cebron, N.; Dill, F.; Gabriel, T.R.; Kötter, T.; Meinl, T.; Ohl, P.; Thiel, K.; Wiswedel, B. KNIME: The Konstanz Information Miner. Stud. Classif. Data Anal. Knowl. Organ. 2008, 1, 319–326. [Google Scholar]
- Chaouch, C.; Sahbudin, M.A.B.; Scarpa, M.; Serrano, S. Audio fingerprint database structure using k-modes clustering. J. Adv. Res. Dyn. Control Syst. 2020, 12, 1545–1554. [Google Scholar] [CrossRef]
- Chadha, A.; Kumar, S. Extension of K-modes algorithm for generating clusters automatically. Int. J. Inf. Technol. Comput. Sci. (IJITCS) 2016, 8, 51–57. [Google Scholar] [CrossRef]
- Jiang, F.; Liu, G.; Du, J.; Sui, Y. Initialization of K-modes clustering using outlier detection techniques. Inf. Sci. 2016, 332, 167–183. [Google Scholar] [CrossRef]
- Kacem, M.A.B.H.; N’cir, C.E.B.; Essoussi, N. MapReduce-based k-prototypes clustering method for big data. In Proceedings of the 2015 IEEE International Conference on Data Science and Advanced Analytics (DSAA), Paris, France, 19–22 October 2015; pp. 1–7. [Google Scholar]
- Jia, Z.; Song, L. Weighted k-prototypes clustering algorithm based on the hybrid dissimilarity coefficient. Math. Probl. Eng. 2020, 2020, 5143797. [Google Scholar] [CrossRef]
- Kuo, T.; Wang, K.J. A hybrid k-prototypes clustering approach with improved sine-cosine algorithm for mixed-data classification. Comput. Ind. Eng. 2022, 169, 108164. [Google Scholar] [CrossRef]
- Sangam, R.S.; Om, H. An equi-biased k-prototypes algorithm for clustering mixed-type data. Sādhanā 2018, 43, 37. [Google Scholar] [CrossRef]
- Jang, H.J.; Kim, B.; Kim, J.; Jung, S.Y. An efficient grid-based k-prototypes algorithm for sustainable decision-making on spatial objects. Sustainability 2018, 10, 2614. [Google Scholar] [CrossRef]
- Malliaridis, K.; Ougiaroglou, S.; Dervos, D.A. WebApriori: A Web Application for Association Rules Mining. In Proceedings of the Intelligent Tutoring Systems, Proceedings of the 16th International Conference, ITS 2020, Athens, Greece, 8–12 June 2020; Kumar, V., Troussas, C., Eds.; Springer: Cham, Switzerland, 2020; pp. 371–377. [Google Scholar]
- Sengupta, J.S.; Auchter, R.F. A k-medians clustering algorithm. Appl. Stat. 1990, 39, 67–79. [Google Scholar] [CrossRef]
- Arthur, D.; Vassilvitskii, S. K-Means++: The Advantages of Careful Seeding. In Proceedings of the Eighteenth Annual ACM-SIAM Symposium on Discrete Algorithms, SODA ’07, New Orleans, LA, USA, 7–9 January 2007; pp. 1027–1035. [Google Scholar]
- Cao, F.; Liang, J.; Bai, L. A data clustering algorithm for mixed data. Pattern Recognit. 2009, 42, 1855–1864. [Google Scholar]
- de Vos, N.J. Kmodes Categorical Clustering Library. 2015–2021. Available online: https://github.com/nicodv/kmodes (accessed on 3 September 2023).
- McKinney, W. Data Structures for Statistical Computing in Python. In Proceedings of the 9th Python in Science Conference, Austin, TX, USA, 28 June–3 July 2010; van der Walt, S., Millman, J., Eds.; pp. 56–61. [Google Scholar] [CrossRef]
- Satopaa, V.; Albrecht, J.; Irwin, D.; Raghavan, B. Finding a “Kneedle” in a Haystack: Detecting Knee Points in System Behavior. In Proceedings of the 2011 31st International Conference on Distributed Computing Systems Workshops, Minneapolis, MN, USA, 20–24 June 2011; pp. 166–171. [Google Scholar]
- Alcalá-Fdez, J.; Fernández, A.; Luengo, J.; Derrac, J.; García, S.; Sánchez, L.; Herrera, F. KEEL data-mining software tool: Data set repository, integration of algorithms and experimental analysis framework. J. Mult.-Valued Log. Soft Comput. 2011, 17, 255–287. [Google Scholar]
- Brooke, J. SUS: A “quick and dirty” usability scale. Usability Eval. Ind. 1996, 189, 4–7. [Google Scholar]
- Ester, M.; Kriegel, H.P.; Sander, J.; Xu, X. A Density-Based Algorithm for Discovering Clusters in Large Spatial Databases with Noise. In Proceedings of the Second International Conference on Knowledge Discovery and Data Mining, KDD’96, Portland, OR, USA, 2–4 August 1996; AAAI Press: Washington, DC, USA, 1996; pp. 226–231. [Google Scholar]
- Zepeda-Mendoza, M.L.; Resendis-Antonio, O. Hierarchical Agglomerative Clustering. In Encyclopedia of Systems Biology; Springer: New York, NY, USA, 2013; pp. 886–887. [Google Scholar] [CrossRef]


| No. | HTTP Method | Endpoint |
|---|---|---|
| 1 | GET | /api/get-datasets.php?apikey={apikey} |
| 2 | GET | /api/read-dataset.php?apikey={apikey}&dataset={dataset} |
| 3 | POST | /api/elbow.php |
| 4 | POST | /api/clusters.php |
| 5 | POST | /api/parallel-cords.php |
| 6 | POST | /api/upload-dataset.php |
| 7 | DELETE | /api/delete-dataset.php |
| 8 | POST | /api/register.php |
| 9 | POST | /api/login.php |
| 10 | POST | /api/edit-profile |
| 11 | POST | /api/delete-user.php |
| Dataset | Size (kb) | Number of Rows | Number of Numerical Columns | Number of Categorical Columns | Algorithm | Time for Elbow (k = 20) | Suggested k | Time for Clustering |
|---|---|---|---|---|---|---|---|---|
| penbased | 538 | 10,992 | 16 | 0 | k-means | 1.06 s | 6 | 0.24 s |
| letter | 716 | 20,000 | 16 | 0 | k-means | 2.49 s | 7 | 0.35 s |
| magic | 1462 | 19,020 | 10 | 0 | k-means | 1.67 s | 5 | 0.23 s |
| texture | 1495 | 5500 | 40 | 0 | k-means | 1.02 s | 4 | 0.45 s |
| shuttle | 1559 | 57,999 | 9 | 0 | k-means | 3.08 s | 5 | 0.31 s |
| poker | 24,563 | 1,025,009 | 10 | 0 | k-means | 72 s | 6 | 23.25 s |
| car | 53 | 1728 | 0 | 7 | k-modes | 36.5 s | 5 | 1.5 s |
| bank | 450 | 4521 | 0 | 10 | k-modes | 55.6 s | 4 | 8.95 s |
| nursery | 1020 | 12,960 | 0 | 9 | k-modes | 25.2 s | 6 | 14.8 s |
| marketing Data | 222 | 2240 | 7 | 3 | k-prototypes | 188.9 s | 6 | 18.5 s |
| germanCC | 80 | 1000 | 7 | 13 | k-prototypes | 320.6 s | 6 | 11.4 s |
| abalone | 192 | 4174 | 7 | 1 | k-prototypes | 116.5 s | 3 | 18.8 s |
| Question | 1 | 2 | 3 | 4 | 5 |
|---|---|---|---|---|---|
| 1. | 0 | 2 | 4 | 17 | 14 |
| 2. | 23 | 11 | 2 | 0 | 1 |
| 3. | 0 | 0 | 1 | 7 | 29 |
| 4. | 23 | 7 | 3 | 4 | 0 |
| 5. | 0 | 0 | 4 | 11 | 22 |
| 6. | 27 | 7 | 2 | 1 | 0 |
| 7. | 2 | 0 | 4 | 9 | 22 |
| 8. | 16 | 9 | 9 | 2 | 1 |
| 9. | 0 | 0 | 1 | 14 | 22 |
| 10. | 11 | 10 | 11 | 4 | 1 |
Disclaimer/Publisher’s Note: The statements, opinions and data contained in all publications are solely those of the individual author(s) and contributor(s) and not of MDPI and/or the editor(s). MDPI and/or the editor(s) disclaim responsibility for any injury to people or property resulting from any ideas, methods, instructions or products referred to in the content. |
© 2023 by the authors. Licensee MDPI, Basel, Switzerland. This article is an open access article distributed under the terms and conditions of the Creative Commons Attribution (CC BY) license (https://creativecommons.org/licenses/by/4.0/).
Share and Cite
Gratsos , K.; Ougiaroglou , S.; Margaris , D. kClusterHub: An AutoML-Driven Tool for Effortless Partition-Based Clustering over Varied Data Types. Future Internet 2023, 15, 341. https://doi.org/10.3390/fi15100341
Gratsos K, Ougiaroglou S, Margaris D. kClusterHub: An AutoML-Driven Tool for Effortless Partition-Based Clustering over Varied Data Types. Future Internet. 2023; 15(10):341. https://doi.org/10.3390/fi15100341
Chicago/Turabian StyleGratsos , Konstantinos, Stefanos Ougiaroglou , and Dionisis Margaris . 2023. "kClusterHub: An AutoML-Driven Tool for Effortless Partition-Based Clustering over Varied Data Types" Future Internet 15, no. 10: 341. https://doi.org/10.3390/fi15100341
APA StyleGratsos , K., Ougiaroglou , S., & Margaris , D. (2023). kClusterHub: An AutoML-Driven Tool for Effortless Partition-Based Clustering over Varied Data Types. Future Internet, 15(10), 341. https://doi.org/10.3390/fi15100341