Article

Hybrid Sensing Platform for IoT-Based Precision Agriculture

School of Science, Computing and Engineering Technologies, Swinburne University of Technology, Melbourne, VIC 3122, Australia
*
Author to whom correspondence should be addressed.
Future Internet 2022, 14(8), 233; https://doi.org/10.3390/fi14080233
Submission received: 29 June 2022 / Revised: 24 July 2022 / Accepted: 25 July 2022 / Published: 28 July 2022
(This article belongs to the Special Issue Big Data Analytics for the Industrial Internet of Things)

Abstract

:
Precision agriculture (PA) is the field that deals with the fine-tuned management of crops to increase crop yield, augment profitability, and conserve the environment. Existing Internet of Things (IoT) solutions for PA are typically divided in terms of their use of either aerial sensing using unmanned aerial vehicles (UAVs) or ground-based sensing approaches. Ground-based sensing provides high data accuracy, but it involves large grids of ground-based sensors with high operational costs and complexity. On the other hand, while the cost of aerial sensing is much lower than ground-based sensing alternatives, the data collected via aerial sensing are less accurate and cover a smaller period than ground-based sensing data. Despite the contrasting virtues and limitations of these two sensing approaches, there are currently no hybrid sensing IoT solutions that combine aerial and ground-based sensing to ensure high data accuracy at a low cost. In this paper, we propose a Hybrid Sensing Platform (HSP) for PA—an IoT platform that combines a small number of ground-based sensors with aerial sensors to improve aerial data accuracy and at the same time reduce ground-based sensing costs.

1. Introduction

Precision agriculture (PA) enables data-driven farming practices that increase crop yield, augment profitability, and conserve the environment [1]. However, the data-driven approach of PA also presents significant challenges for farmers that hinder its adoption. The most important PA challenge is the cost and effort required to collect, relate, and analyse data regarding crop, soil, and environment.
In the last decade, technological advancements and the emergence of the Internet of Things (IoT) [2,3] have revolutionised data collection and created opportunities to address some of the PA challenges. Sensing approaches in IoT-based PA for crop management can be characterised as aerial or ground-based. These two approaches have contrasting virtues and limitations that impact their use for data collection.
As described in 
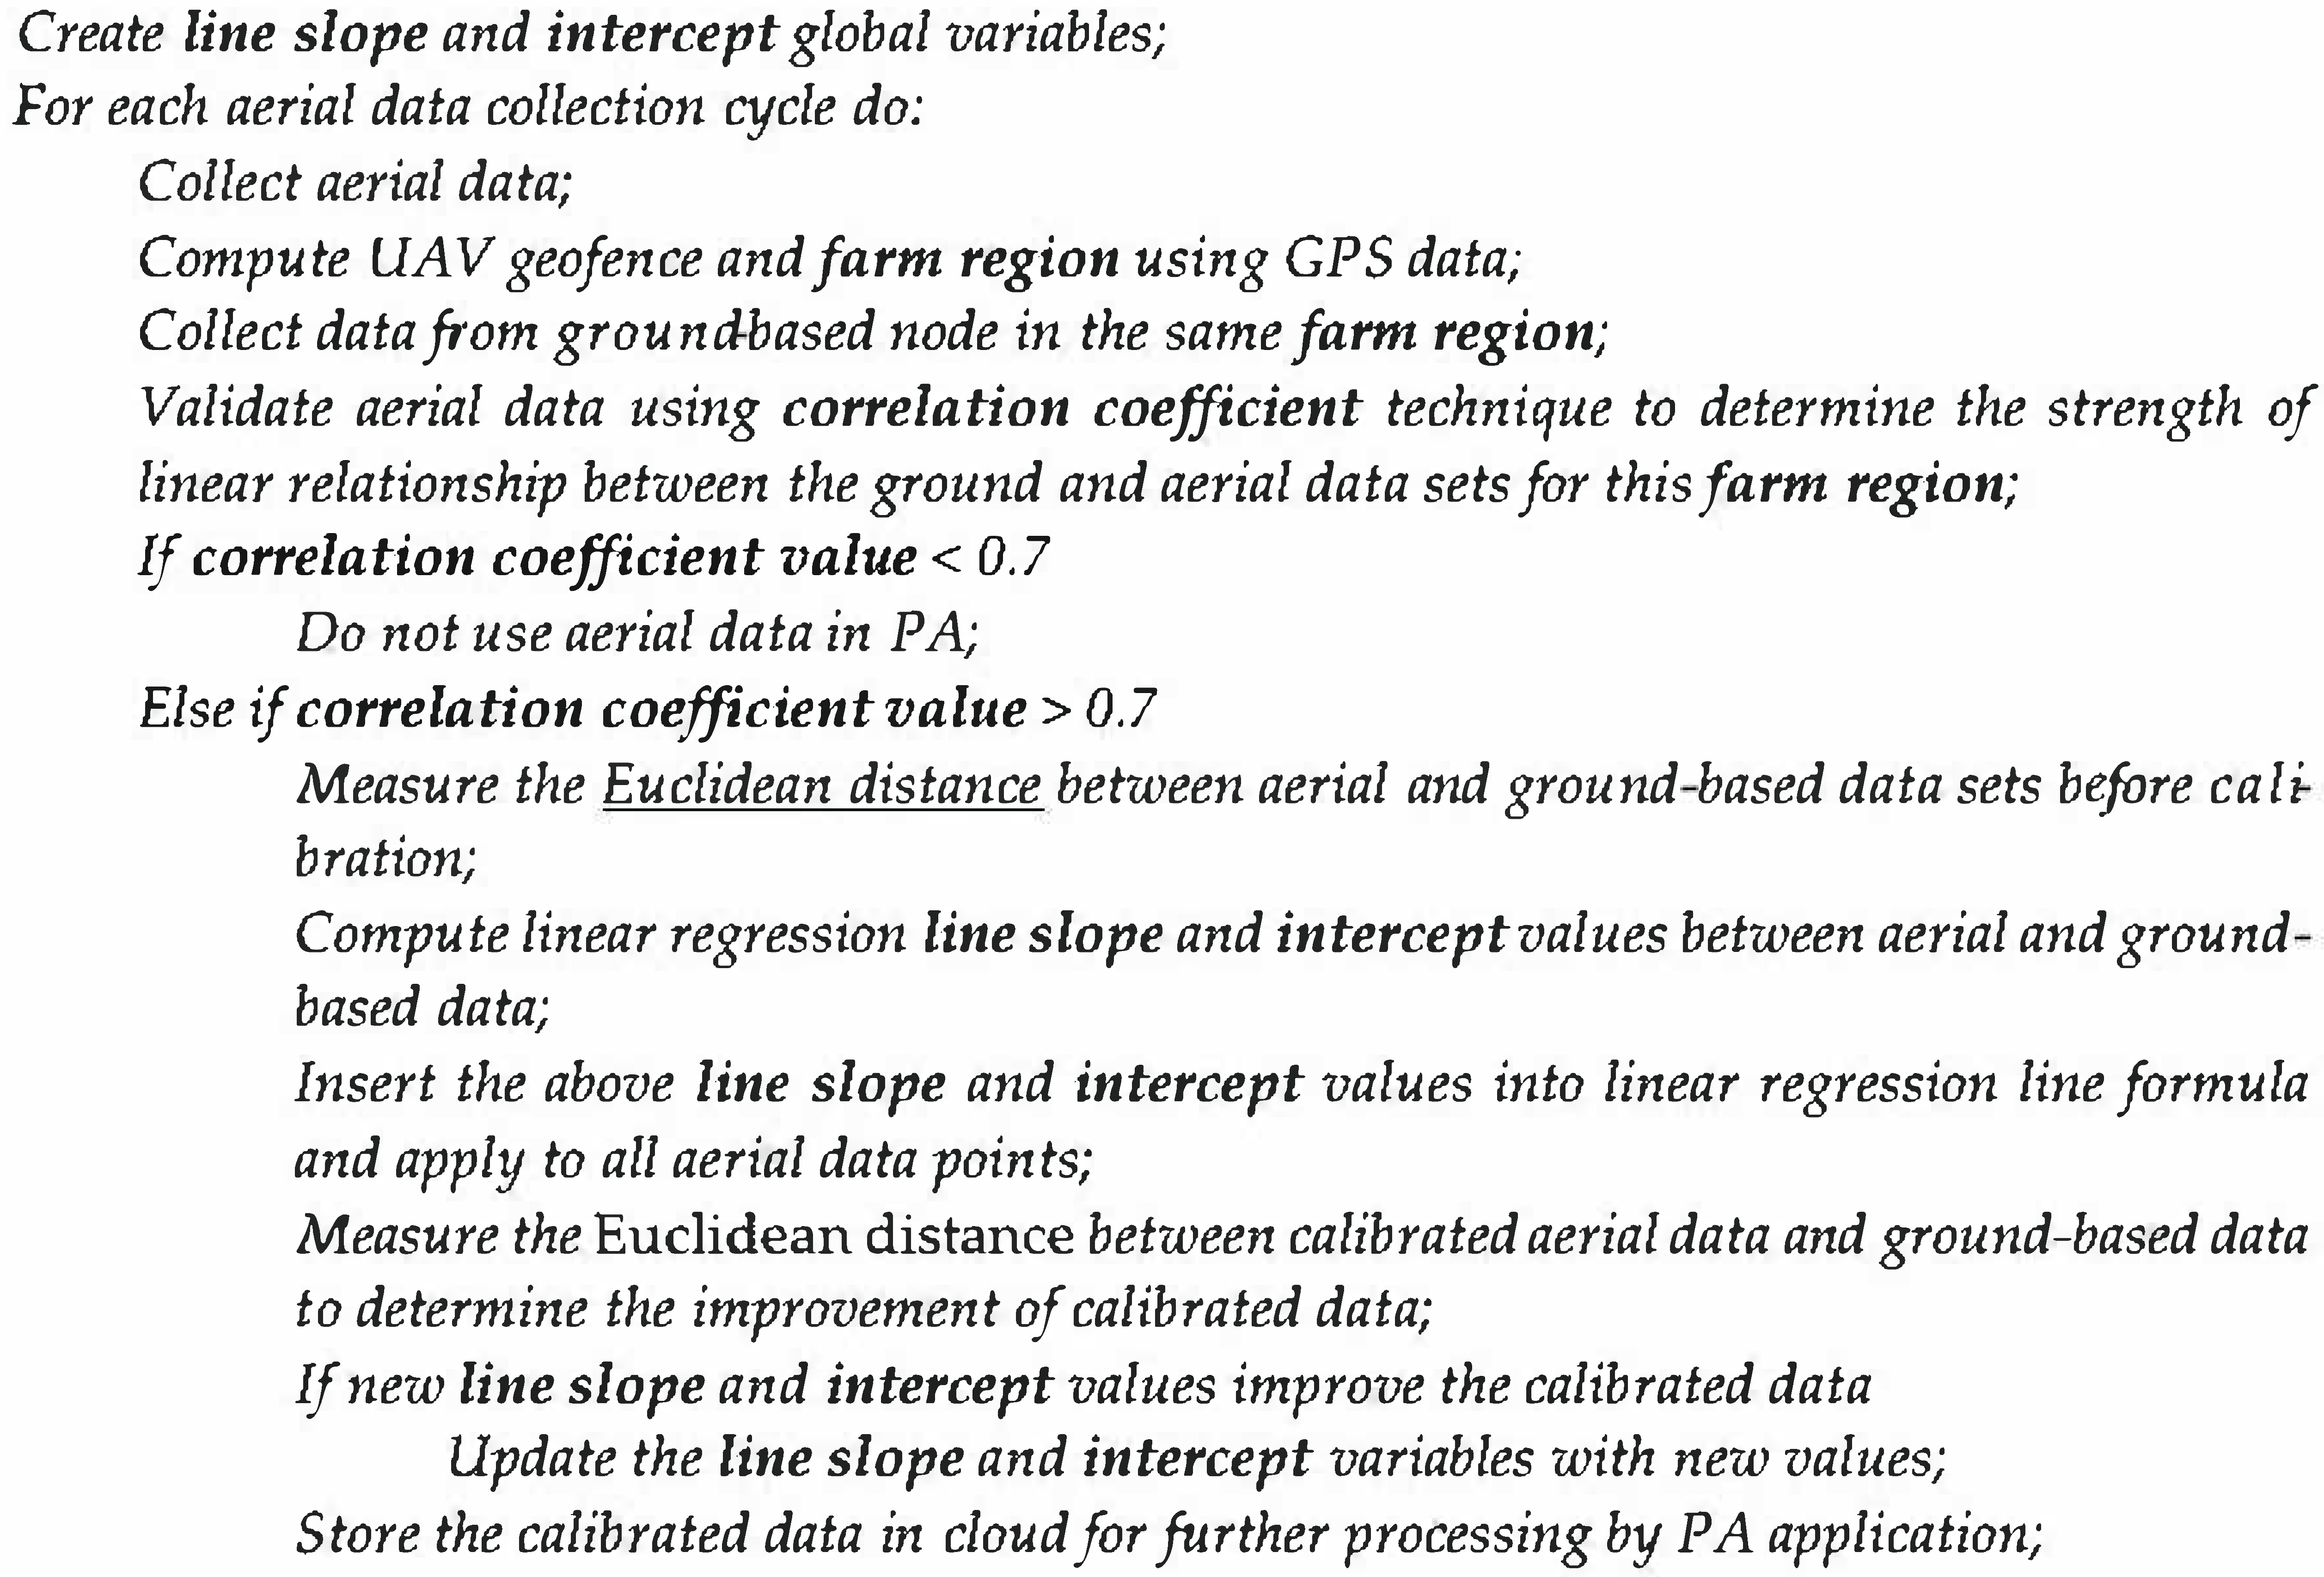
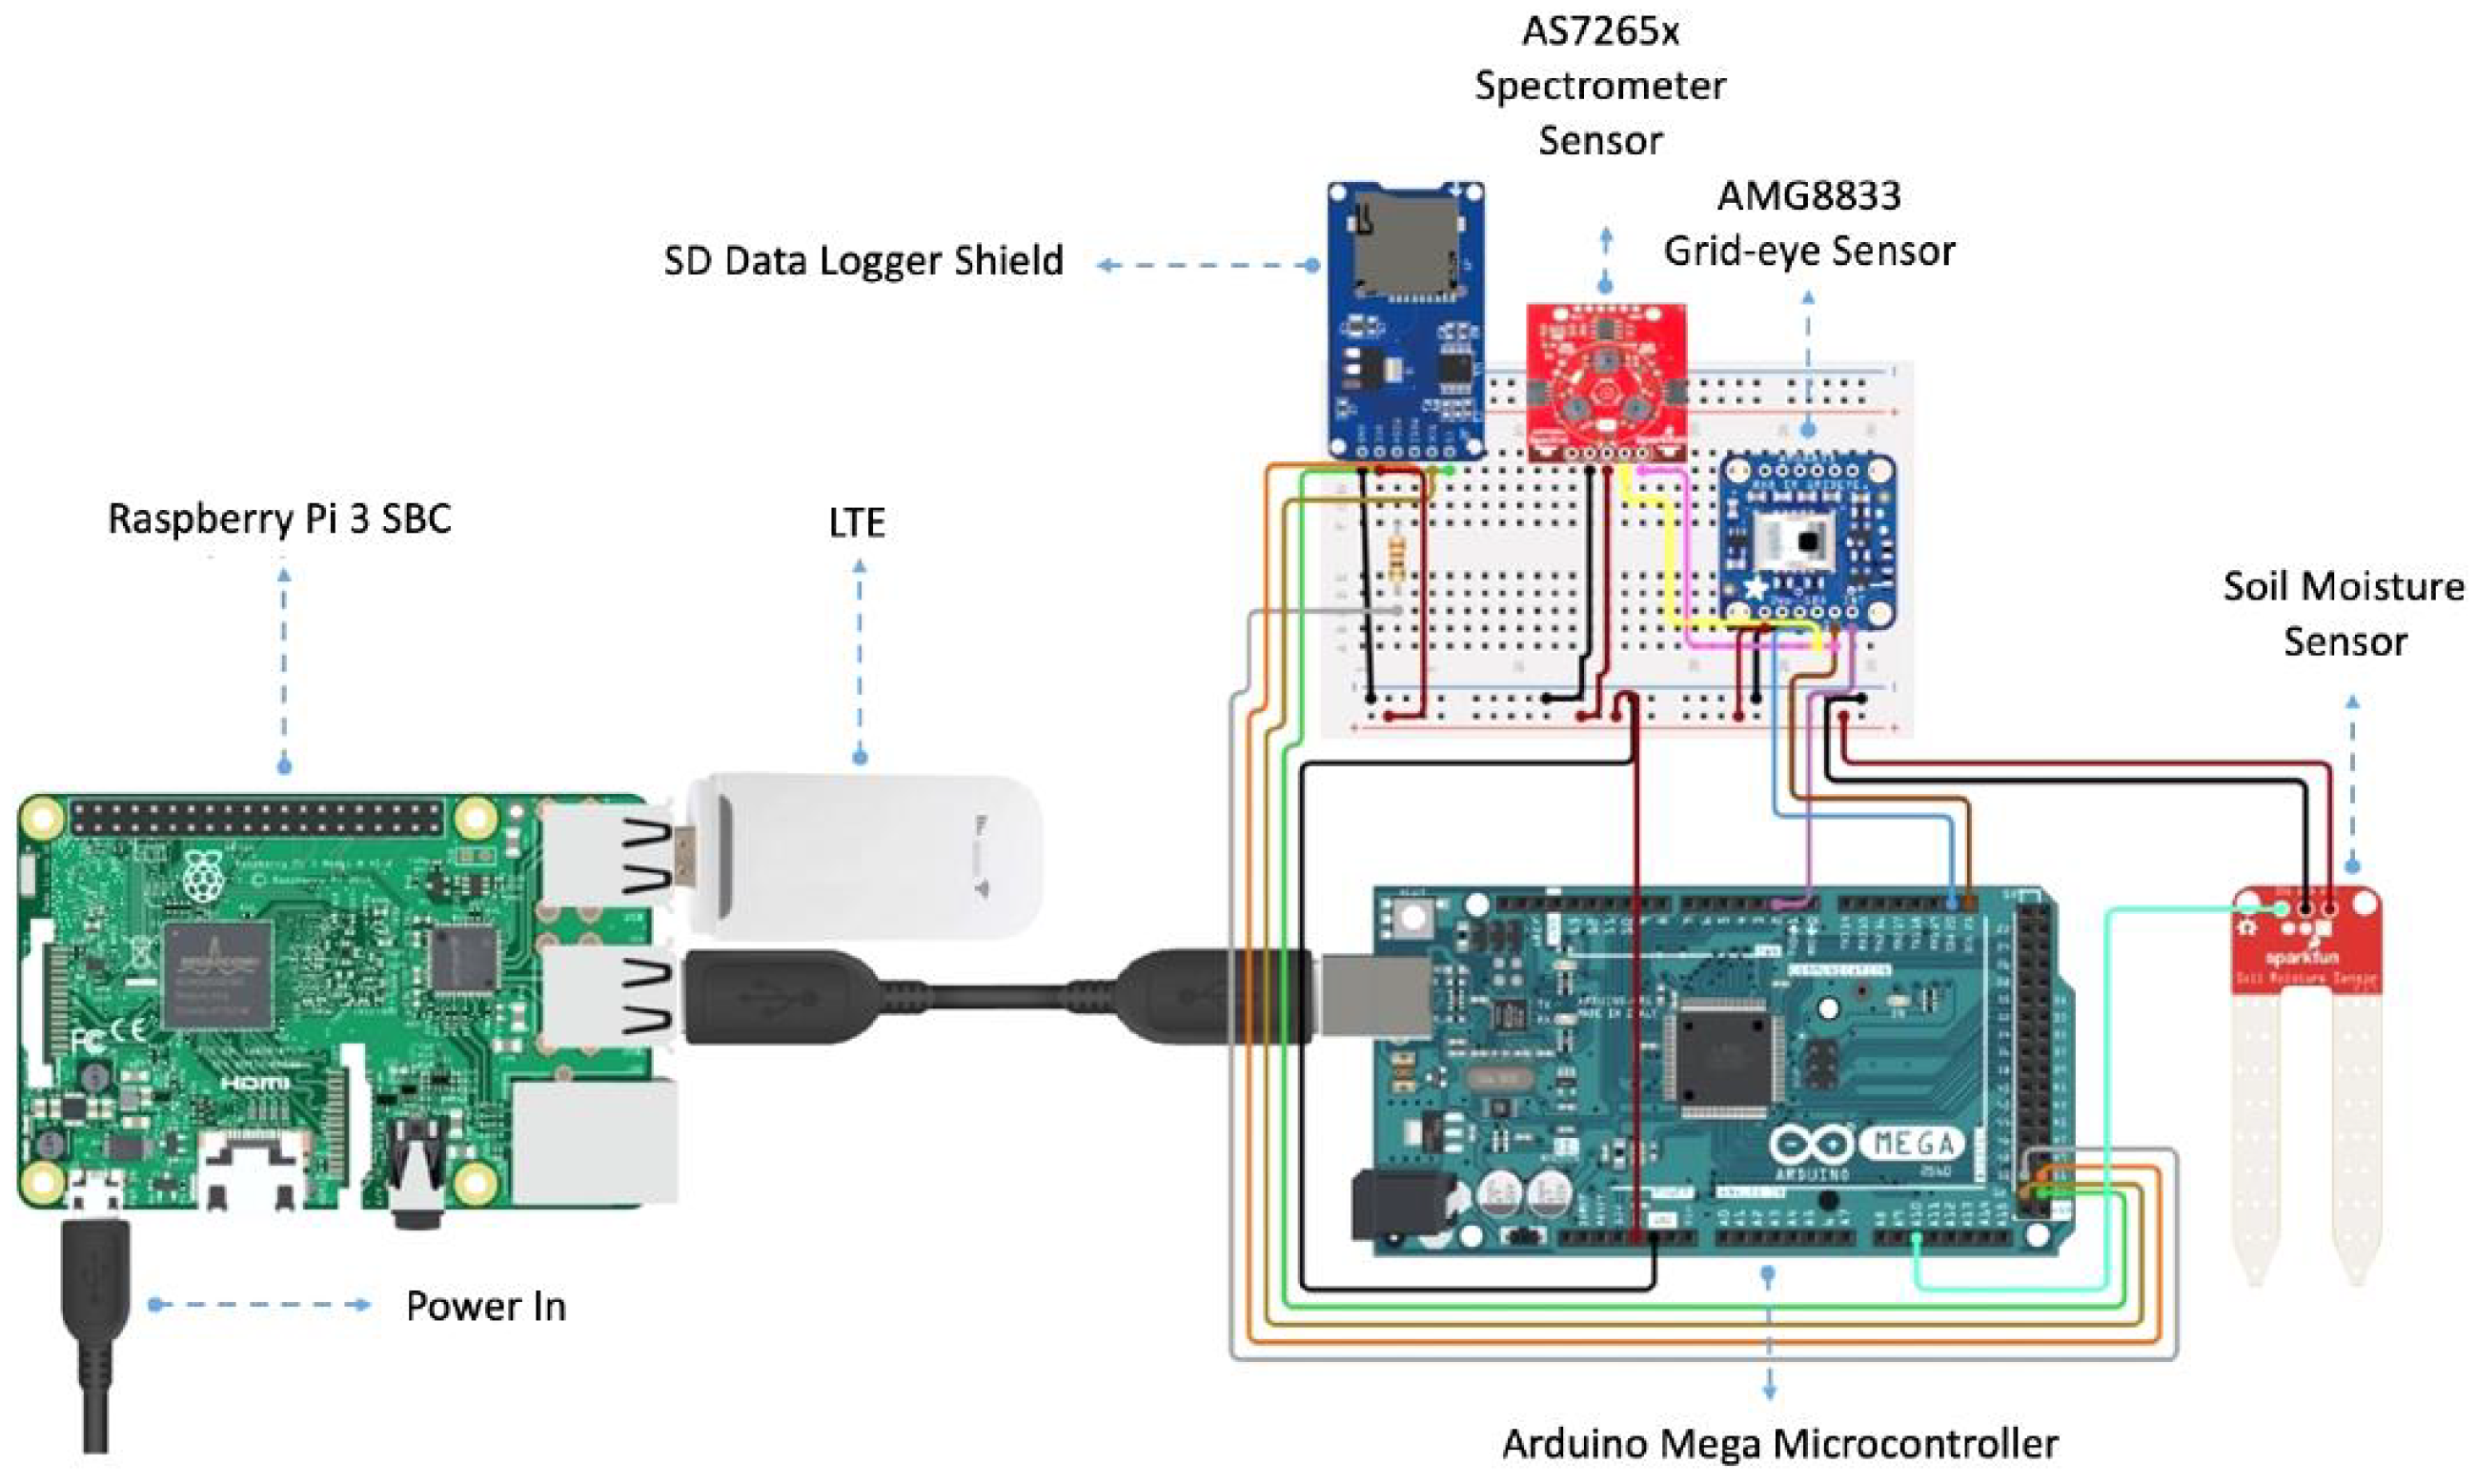
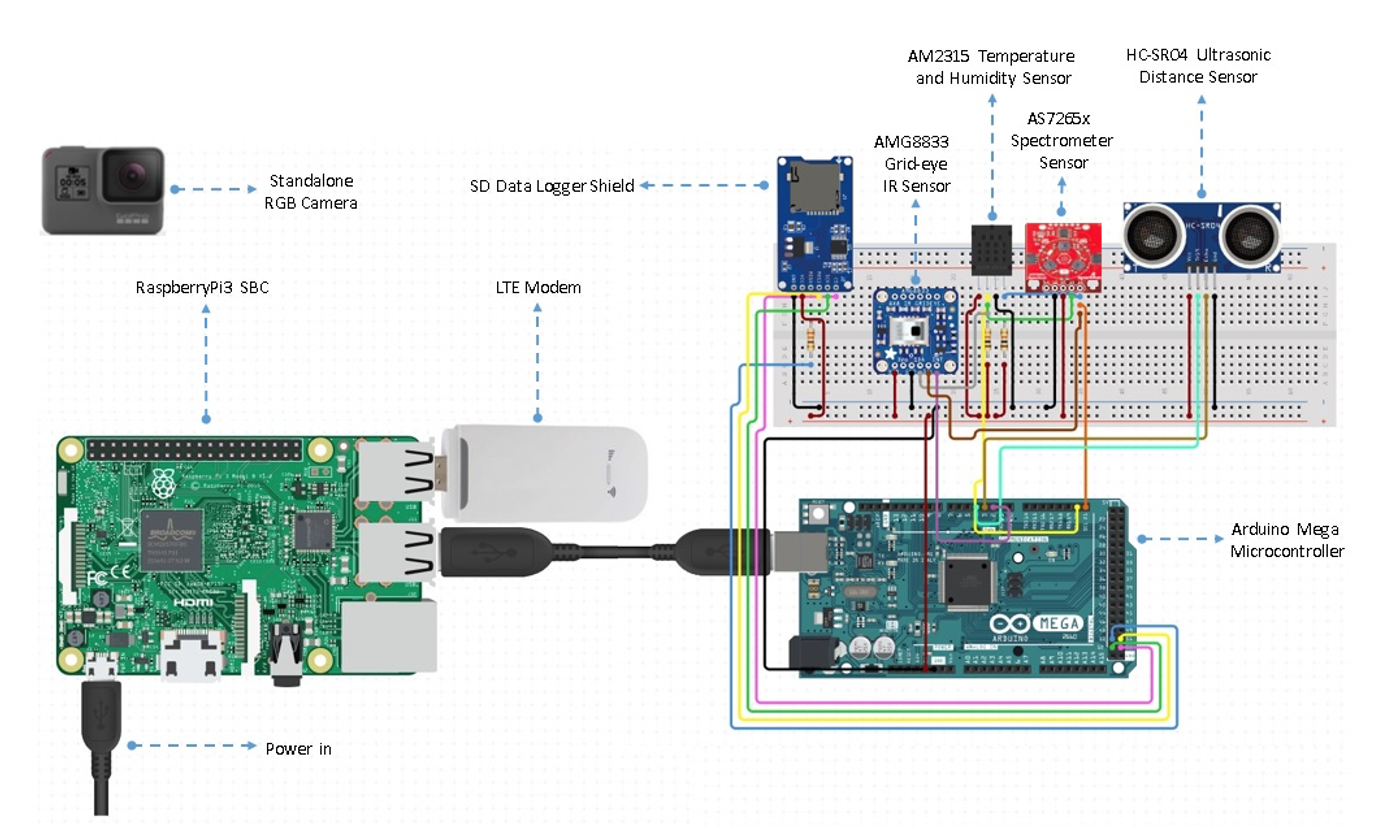
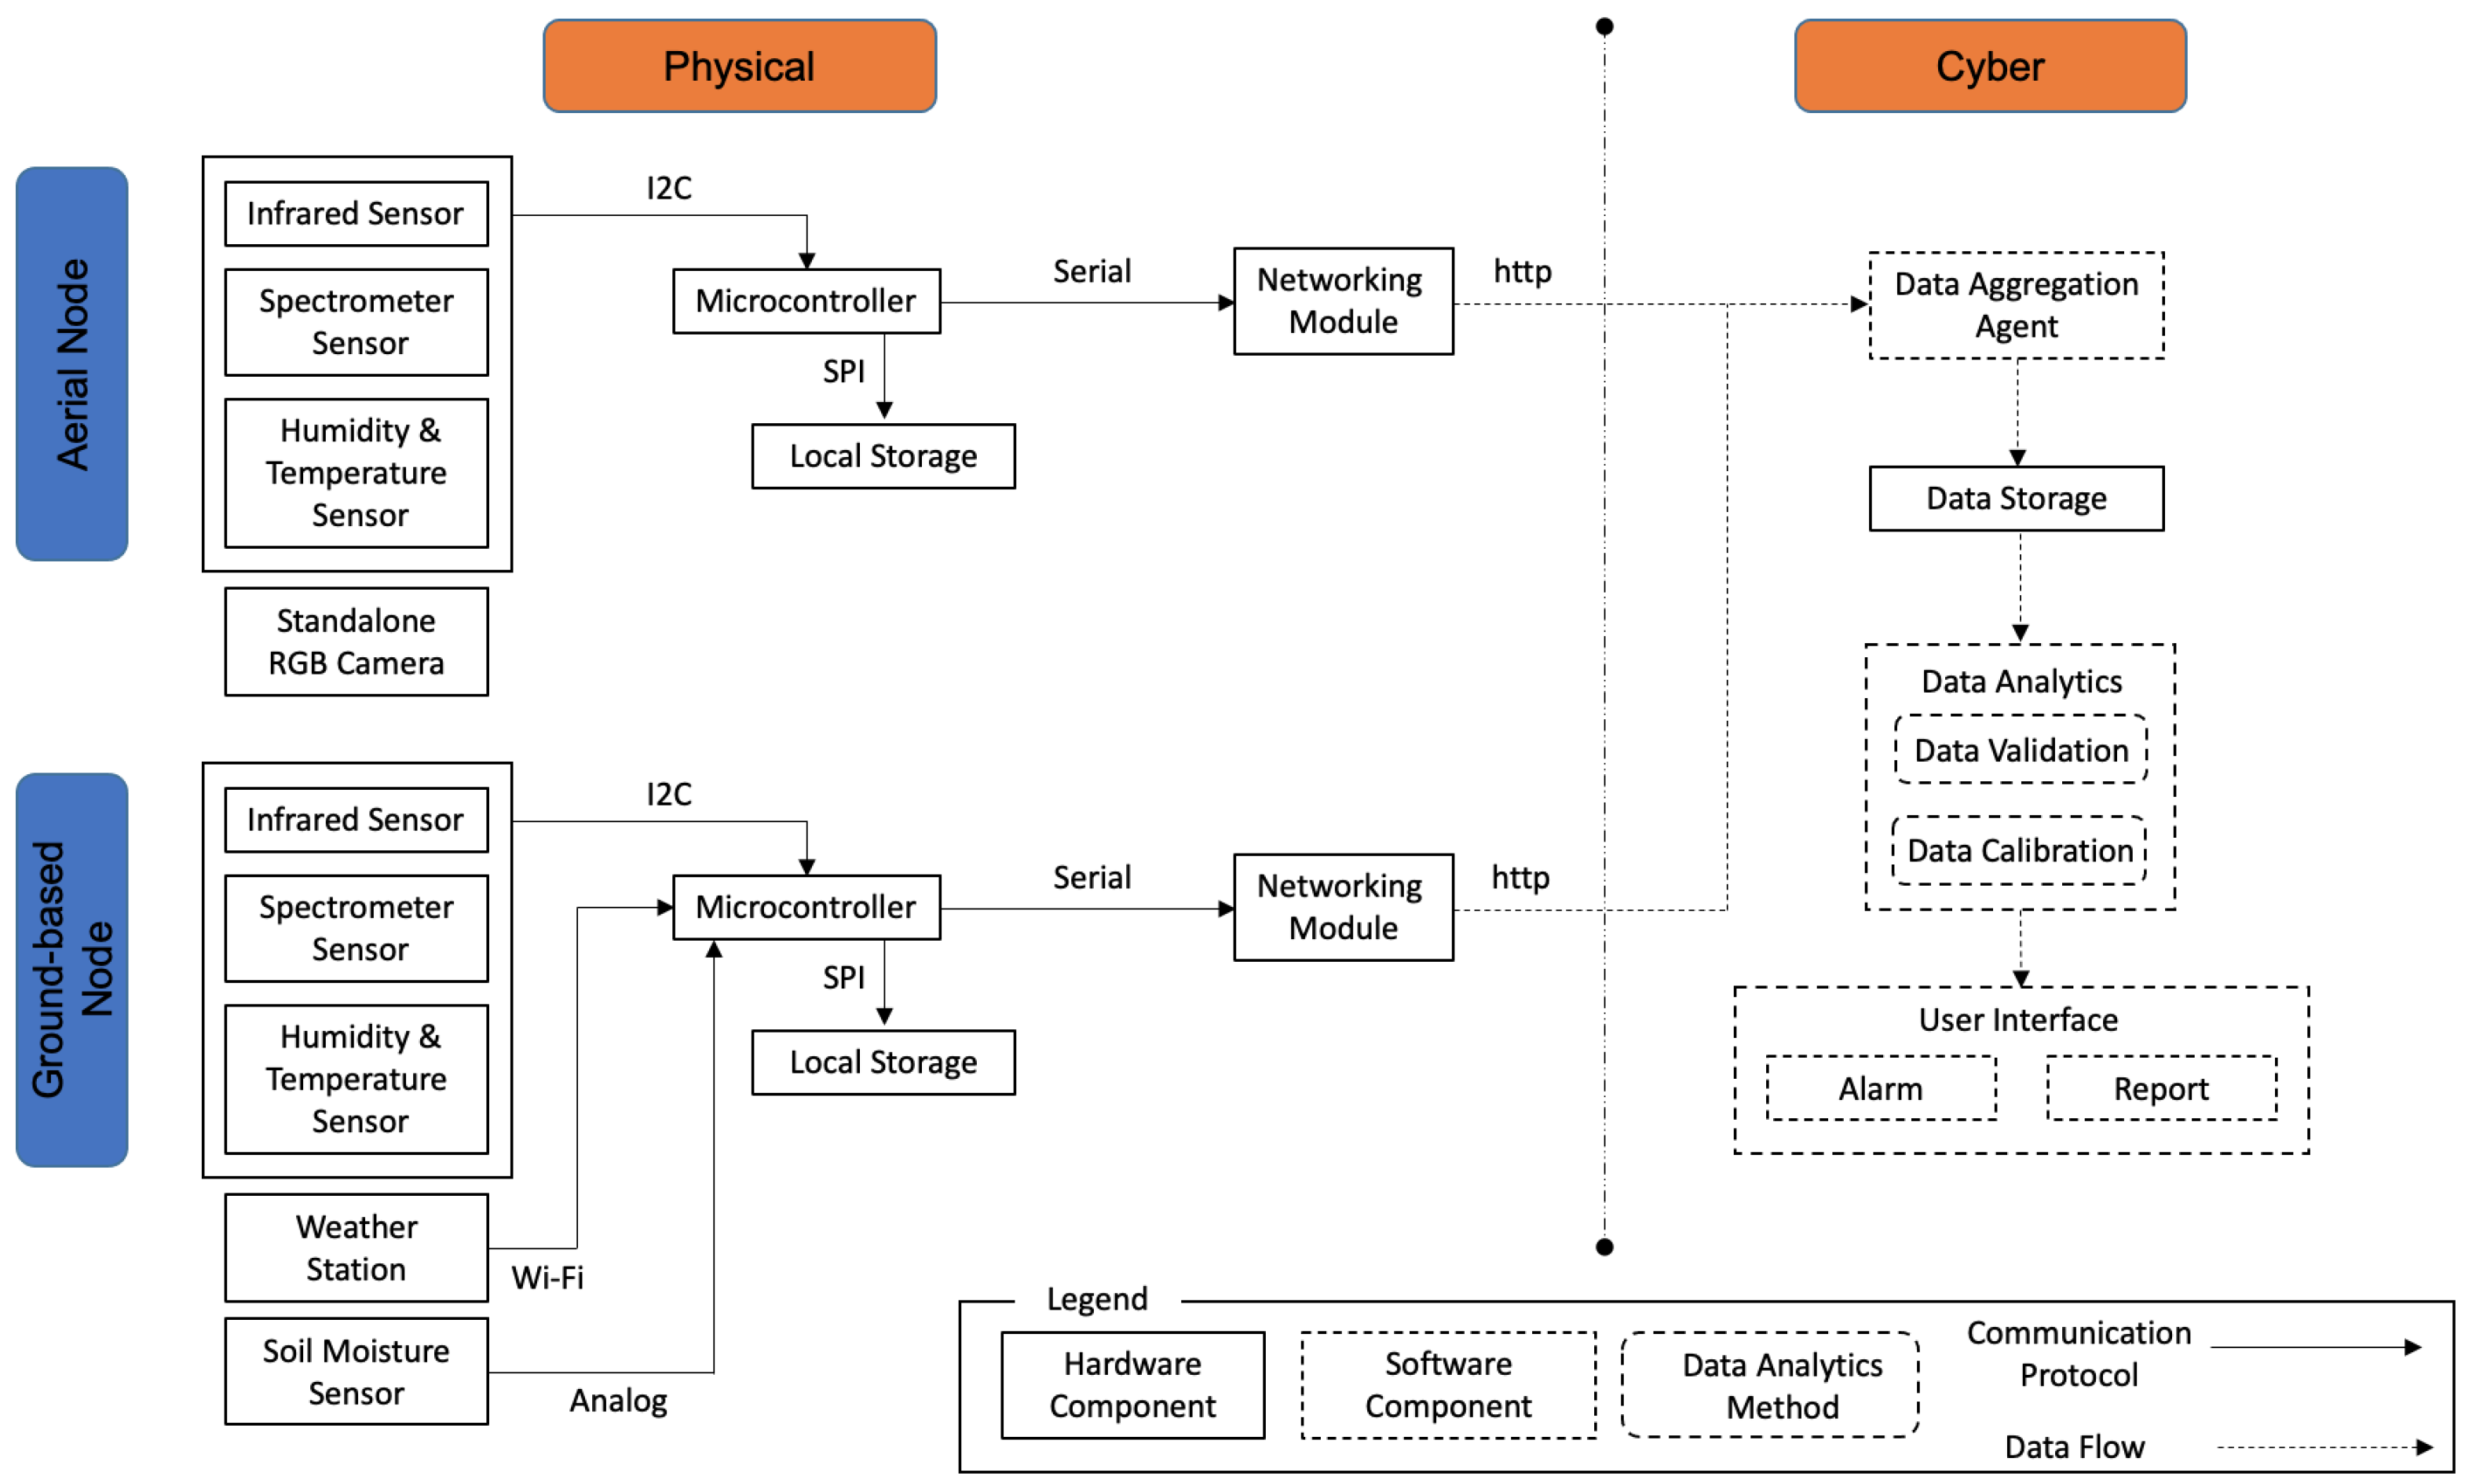
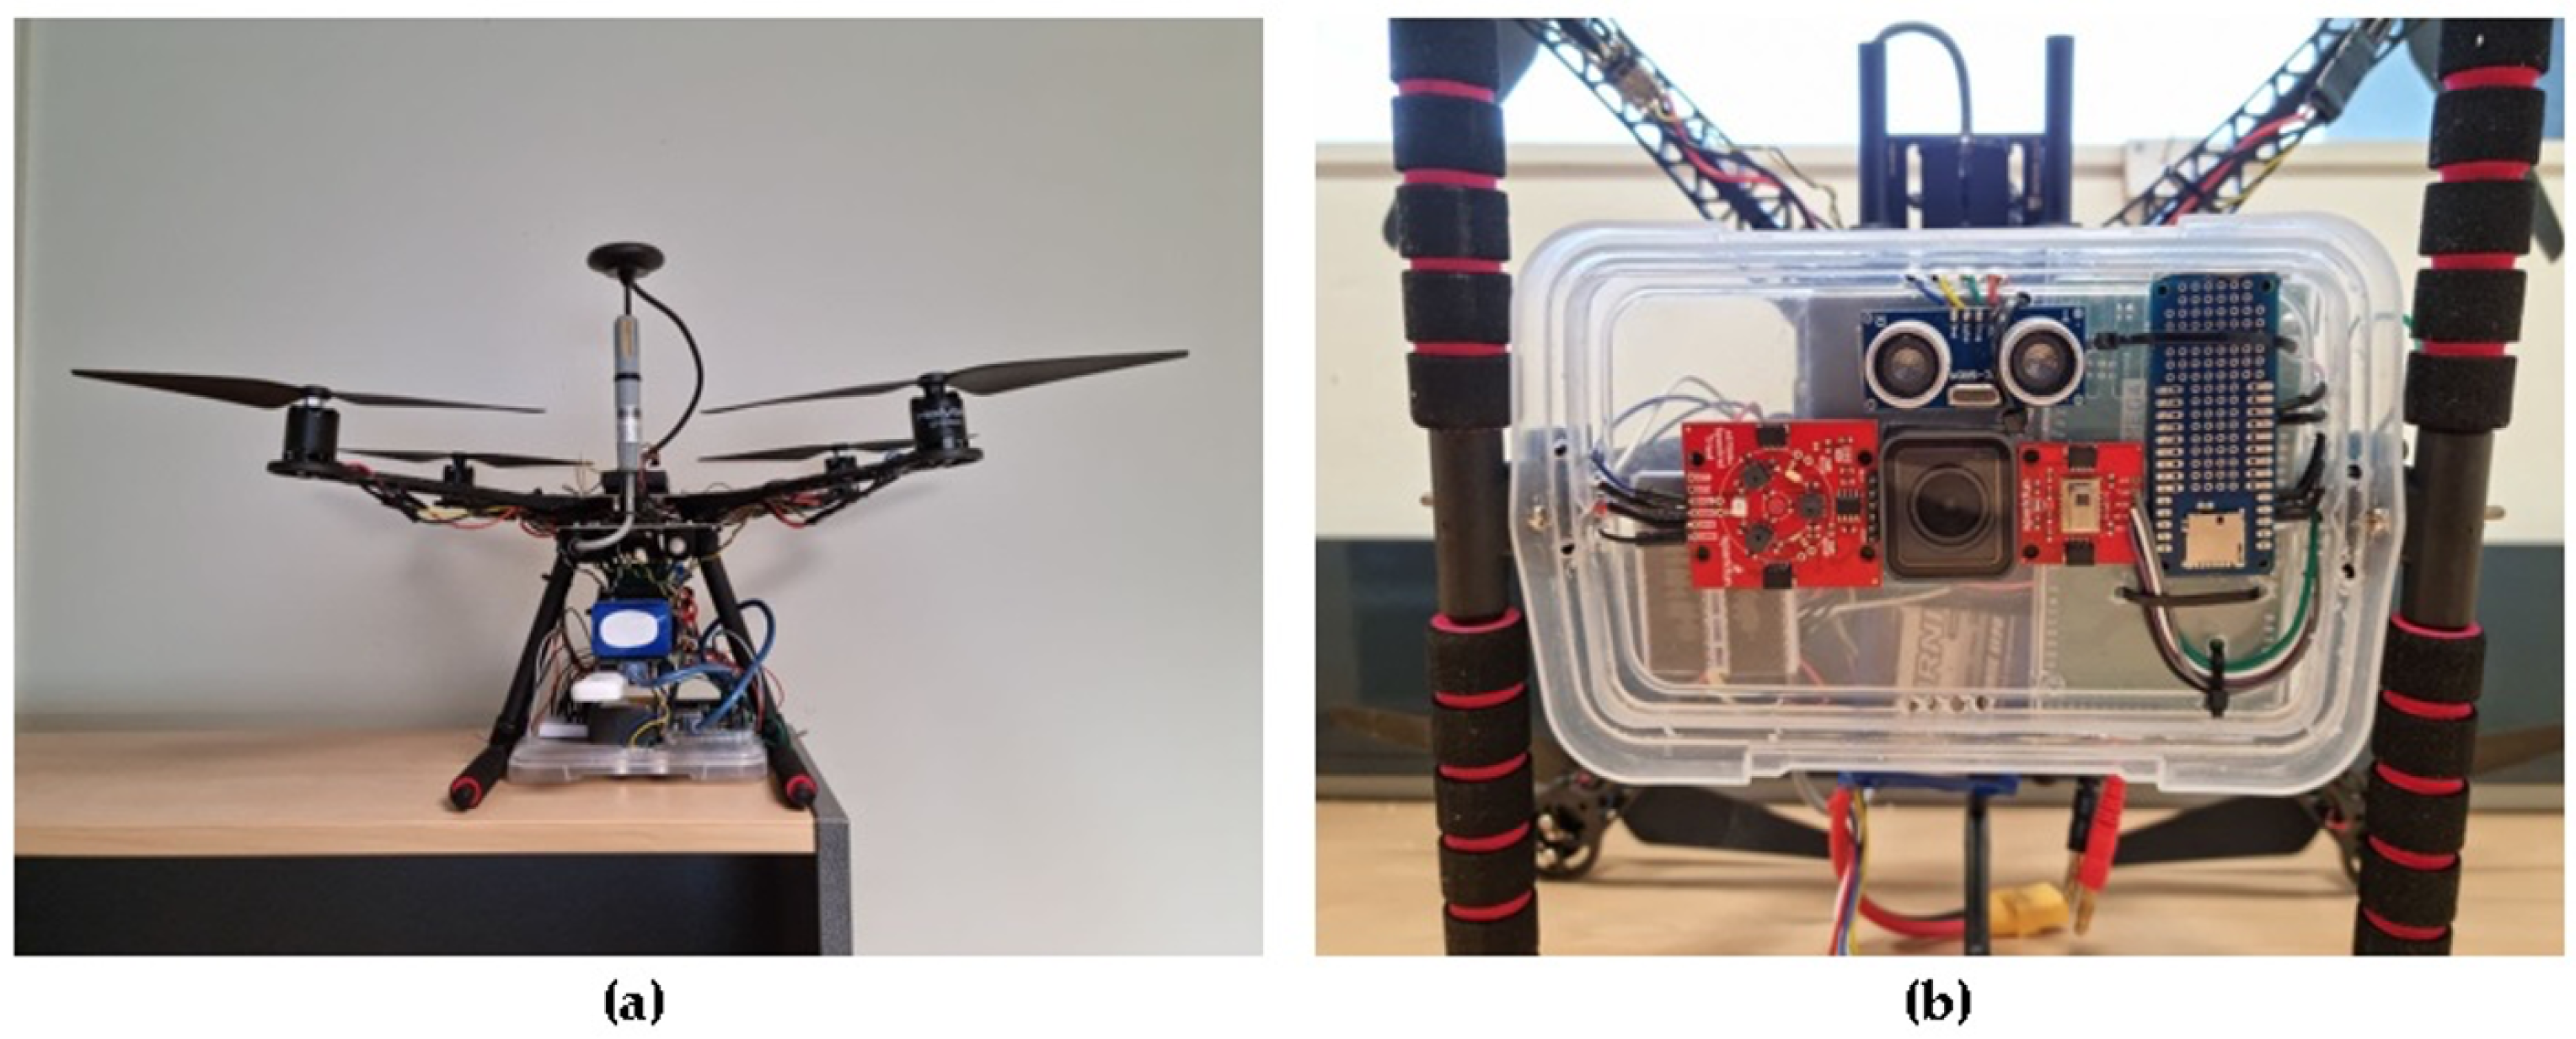
Table 1, aerial and ground-based sensing have certain limitations but they also have certain advantages, which can compensate for each other’s limitations. The ground-based sensing approach can provide constant high-quality data while the aerial sensing approach can provide high coverage using a single set of sensors. Integration of aerial and ground-based sensing into a hybrid system and using data validation and calibration to improve the data quality and also to reduce the overall cost of the sensing process are existing gaps that have not been addressed before. This provides an opportunity to investigate the potential benefits of a Hybrid Sensing Platform (HSP) to improve the efficiency and effectiveness of the sensing process. Such HSP implementation and performance analysis is the aim of this paper. This paper’s contributions include the following: (1) the hybrid sensing concept, approach, and aims and its comparison to existing ground-based and aerial-sensing approaches; (2) the design and implementation of a complete HSP for PA, including UAV, ground and aerial sensors, and cloud components; (3) aerial sensing data validation and calibration techniques that use the data observations of a small number of ground-based sensors to automatically validate, calibrate, and improve the accuracy of aerial data; and (4) investigation of HSP and aerial data calibration benefits through field experiments.
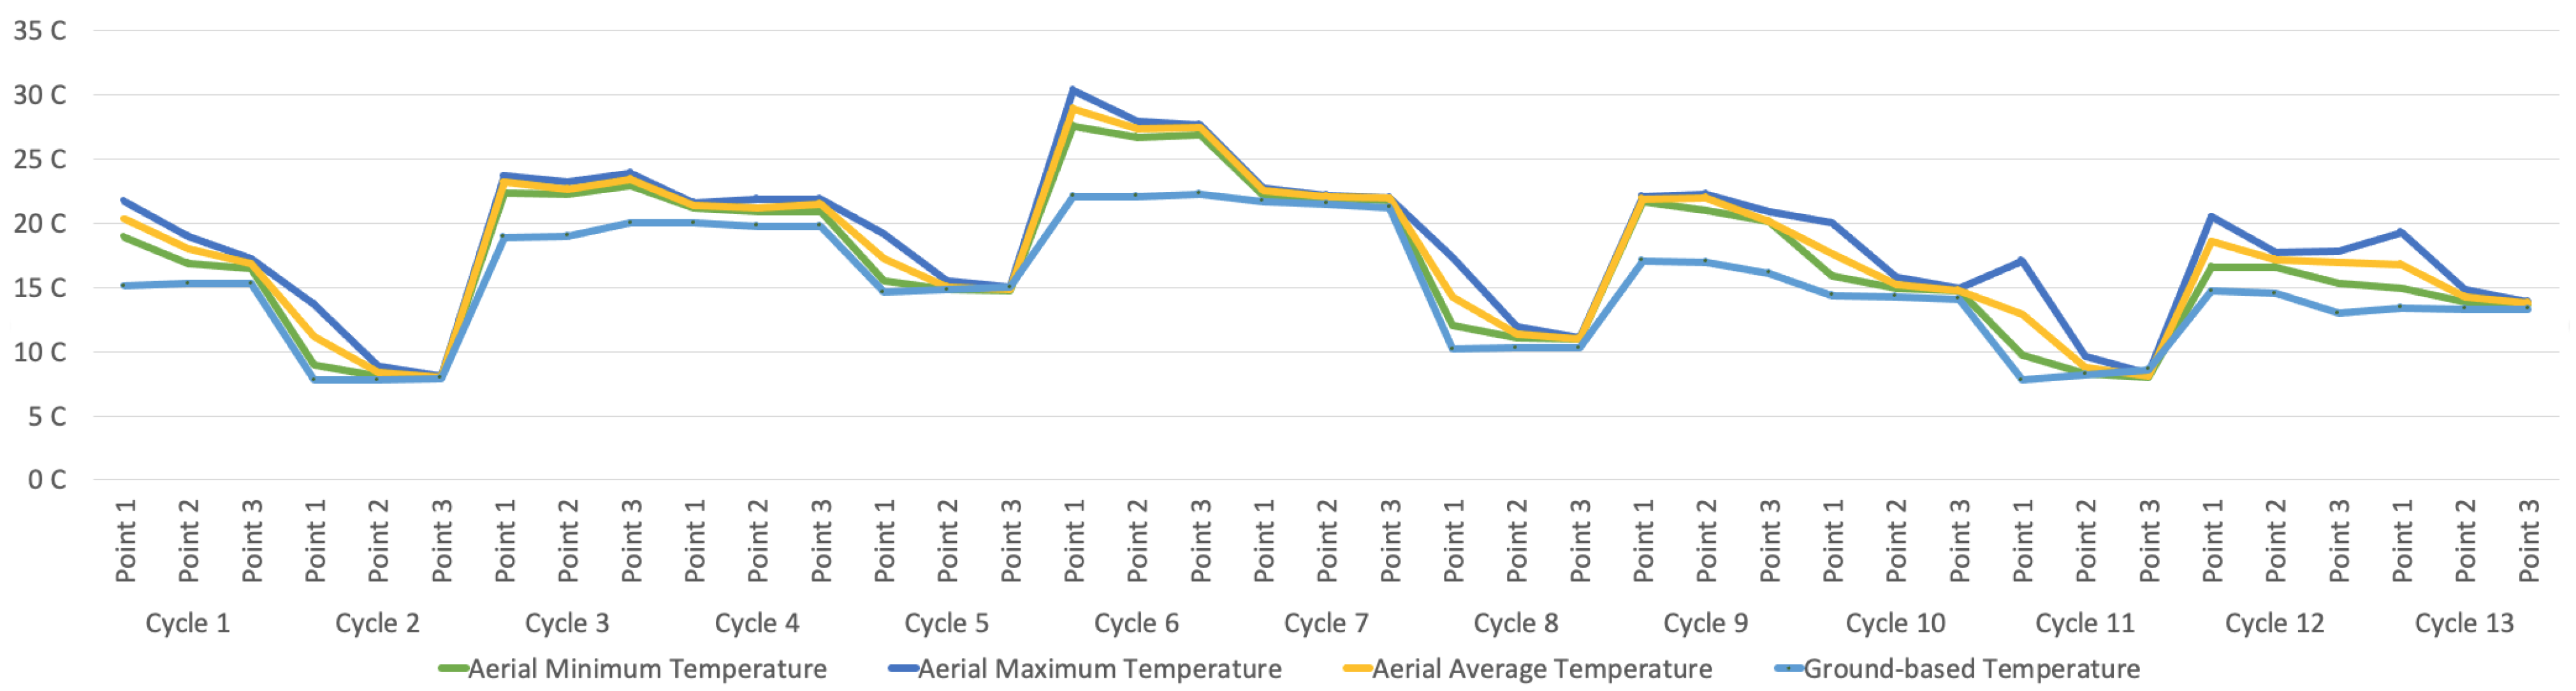
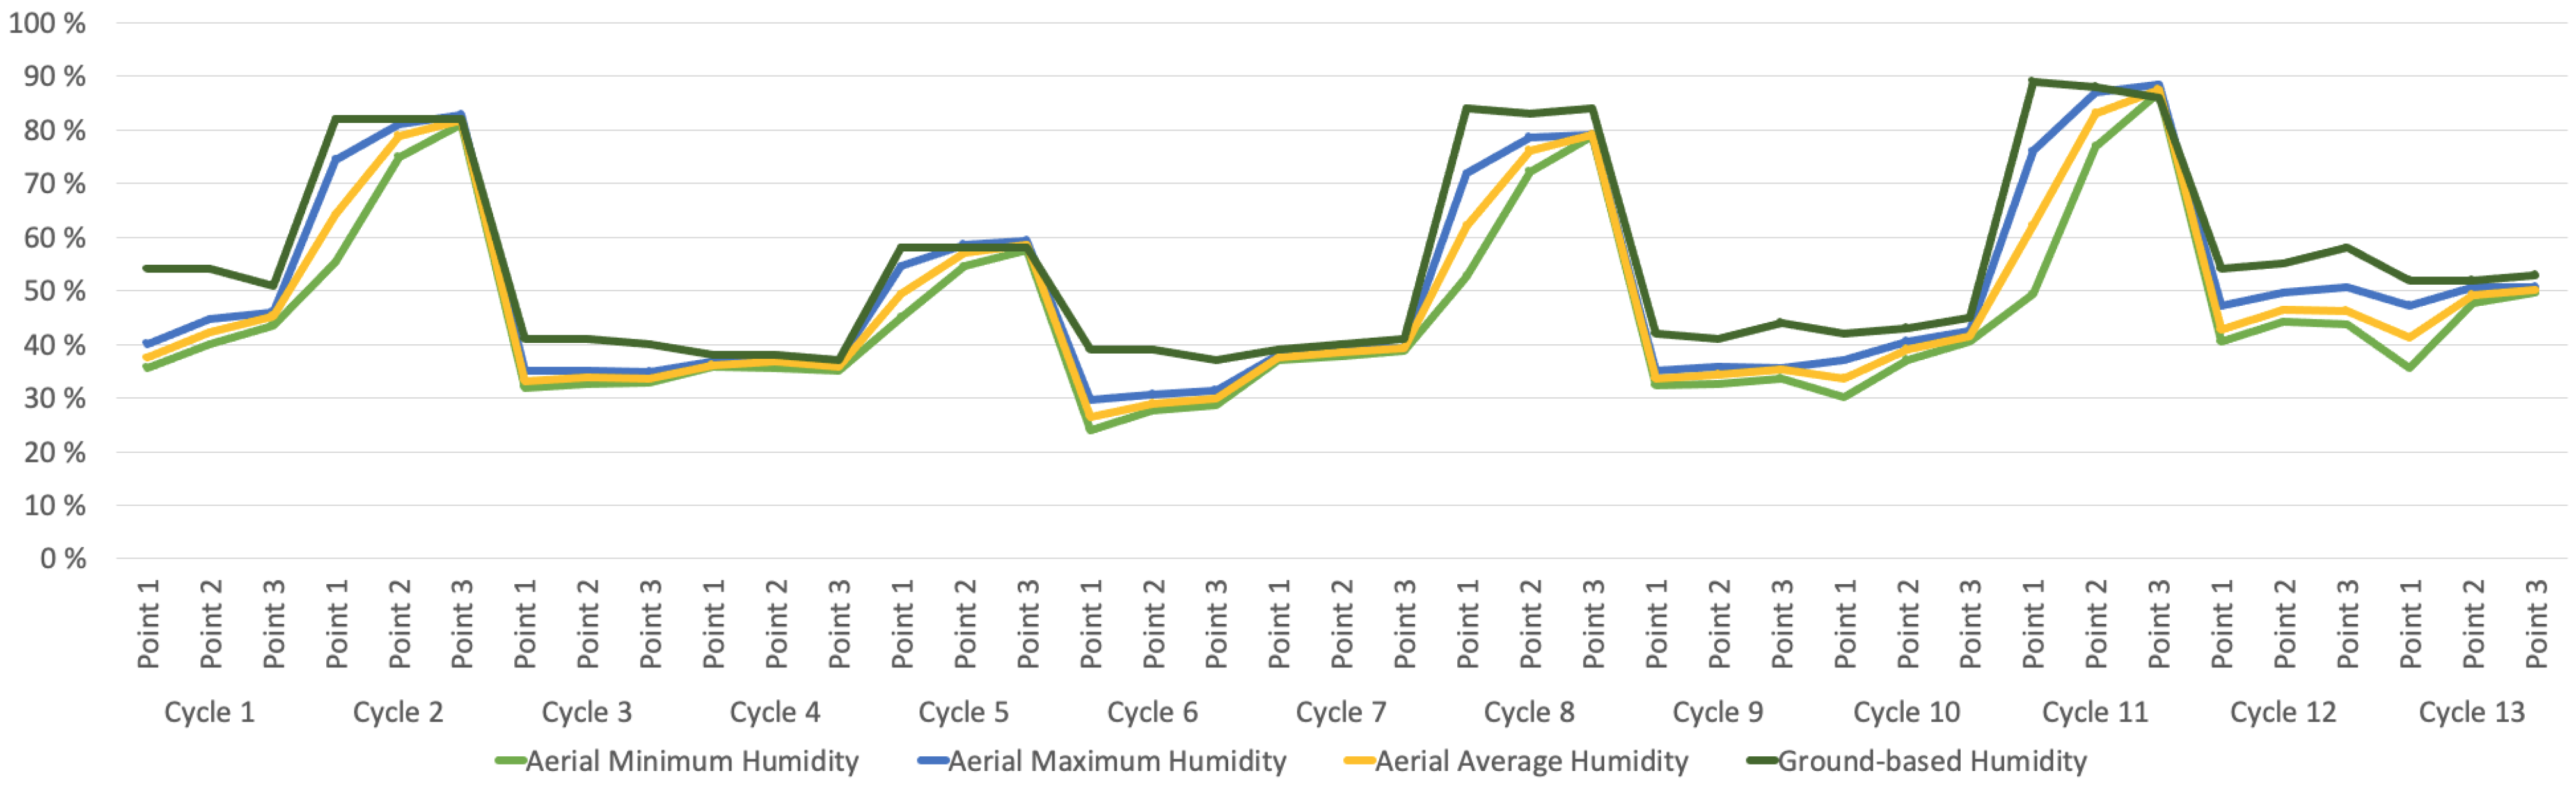
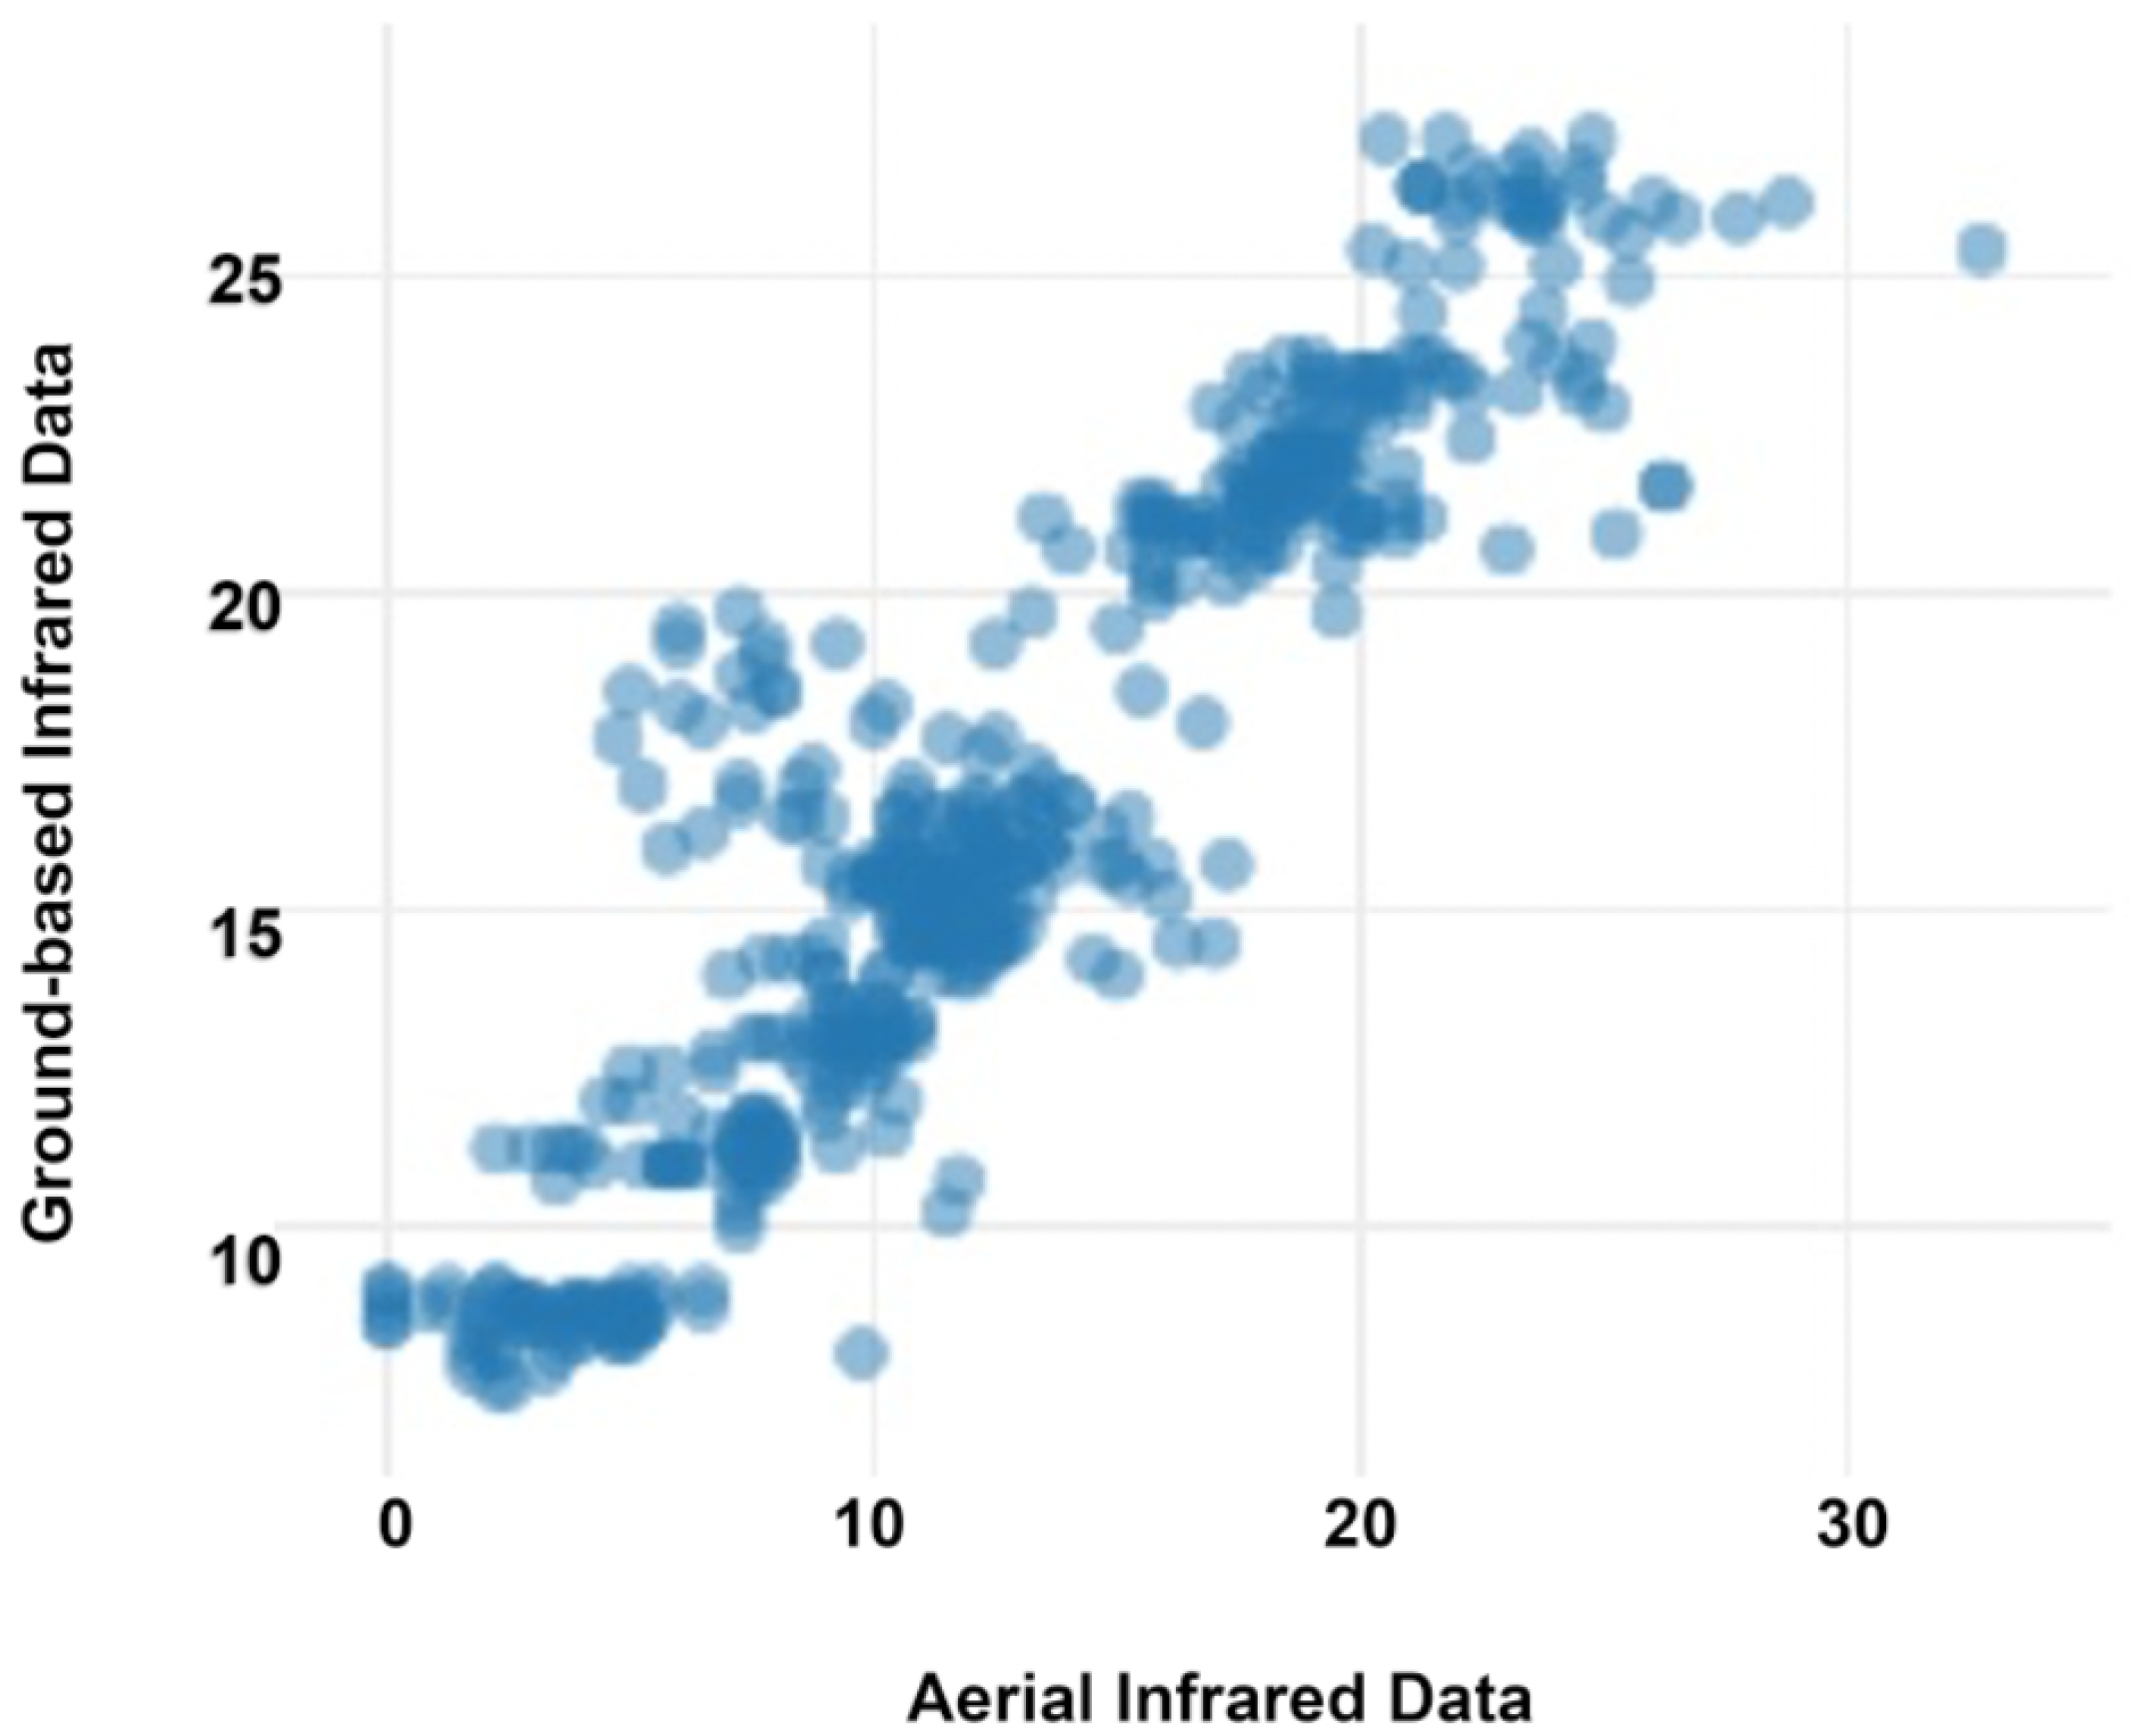
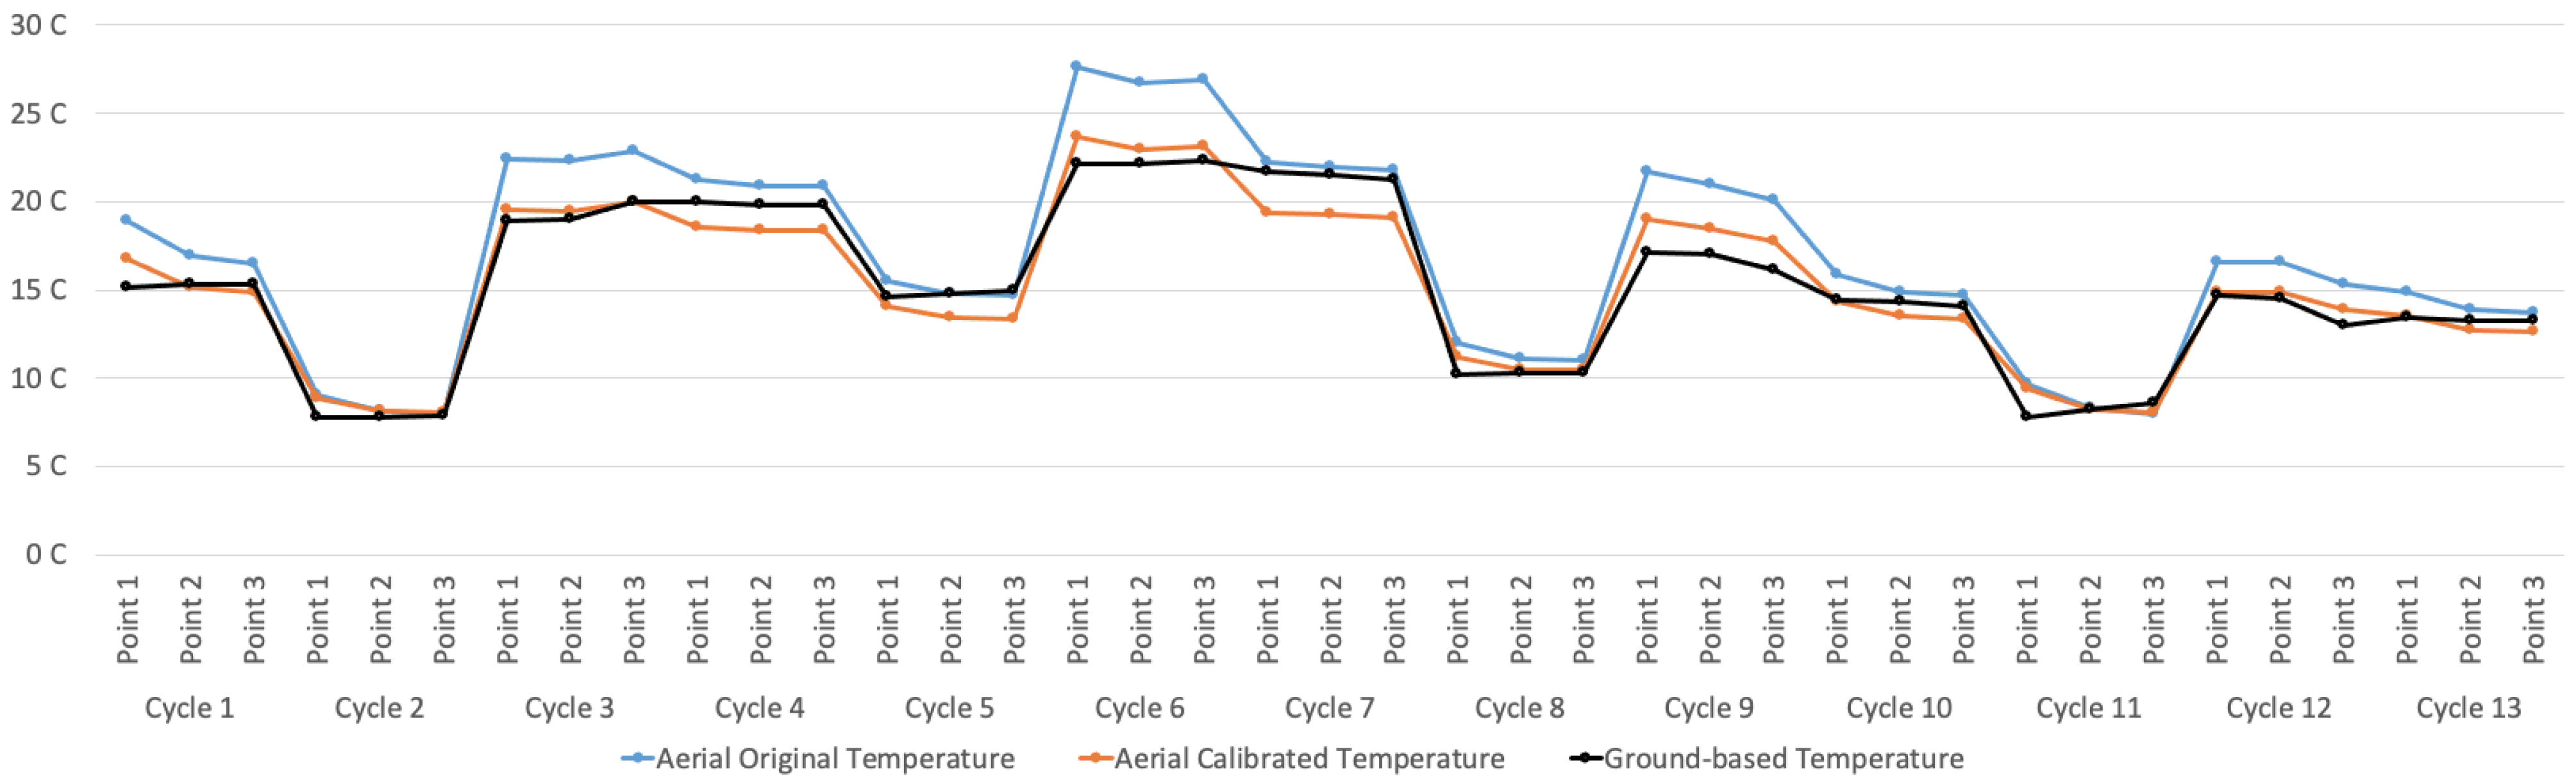
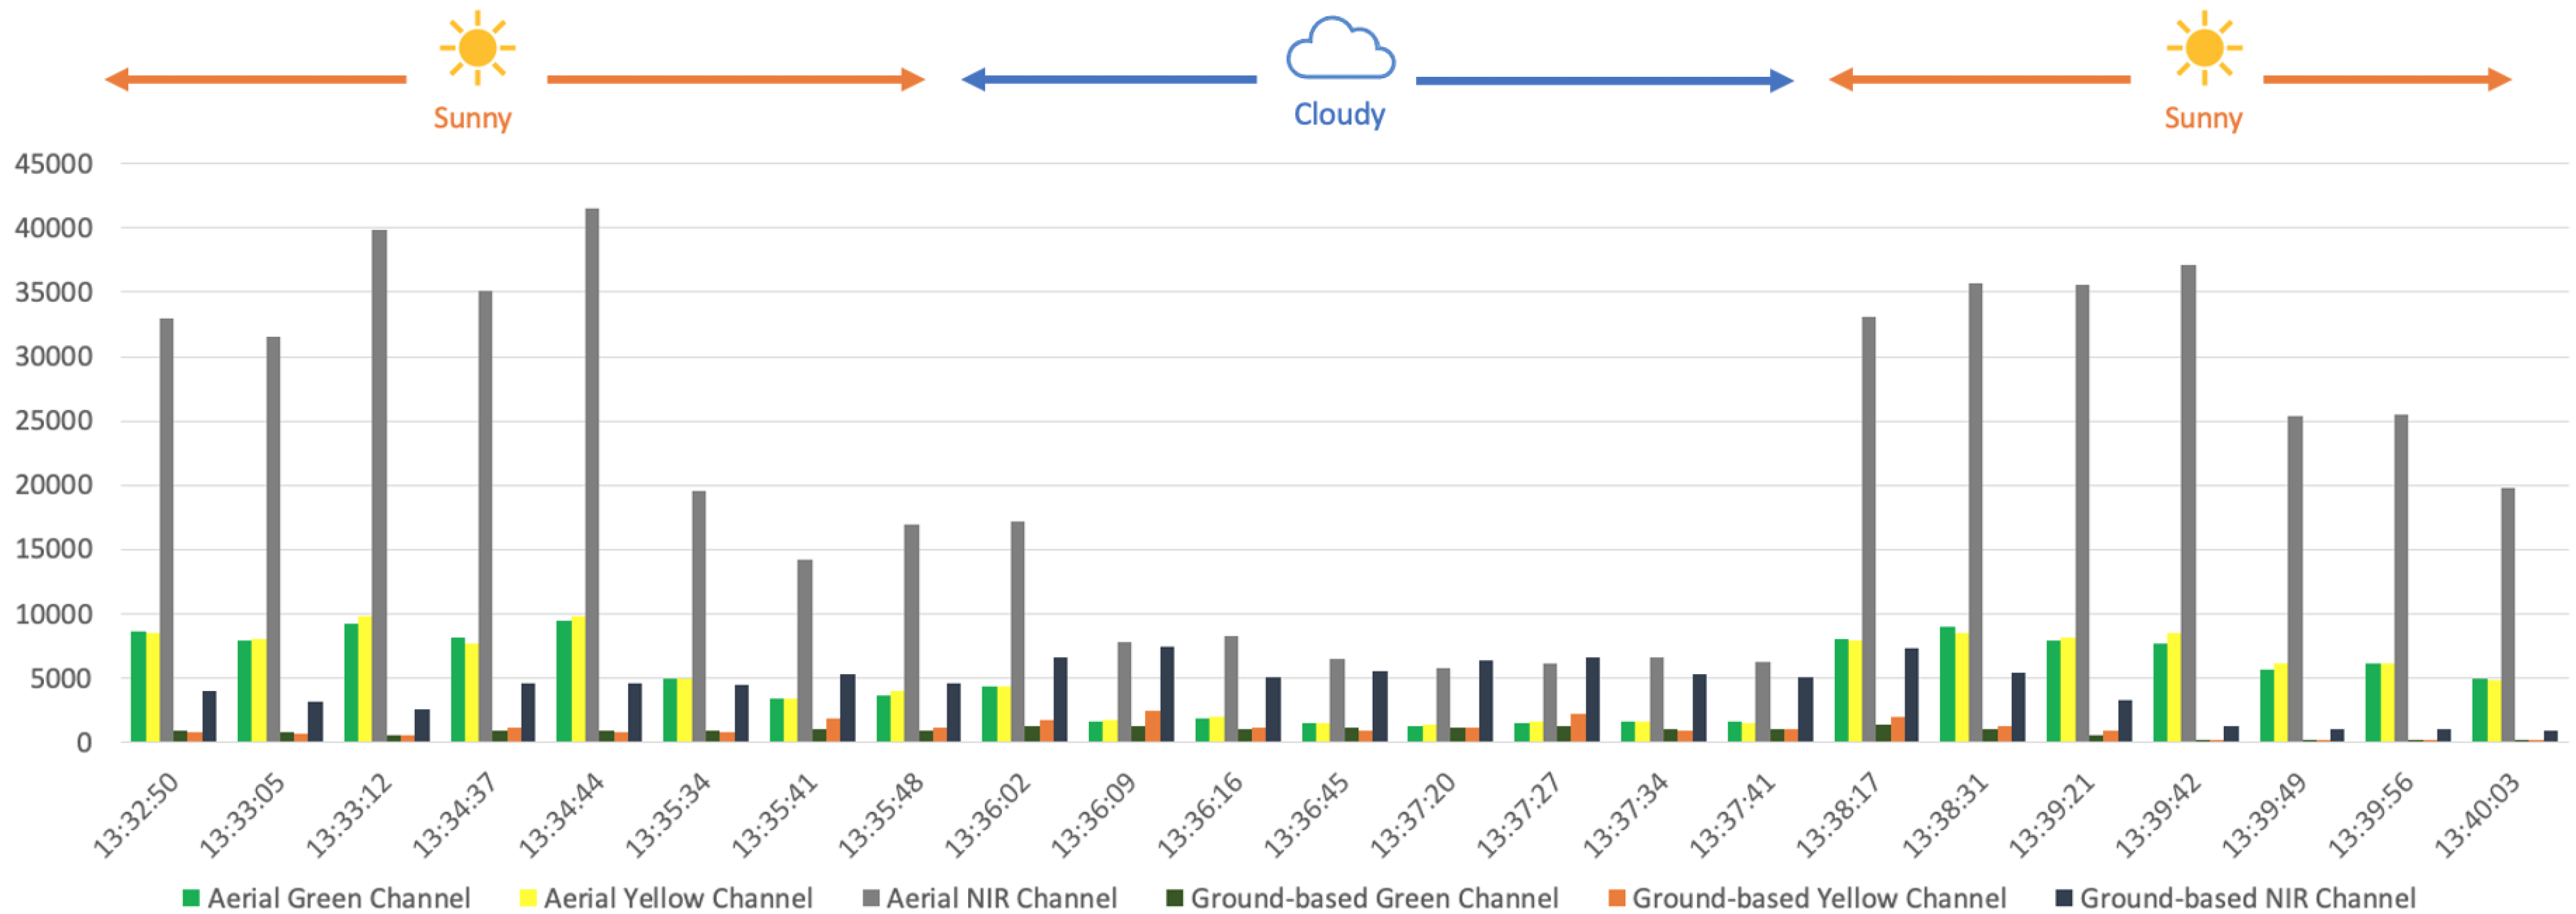
The results of field experiments using the proposed IoT-based HSP show that the statistical and machine learning models used in this research remarkably improve the aerial data accuracy. The improvement rate in aerial data accuracy compared with ground truth is 34% for humidity data, 51% for temperature data, 66% for infrared data, and 90% for spectrometer data. This indicates that IoT-based HSP have potential to transform the data collection process in PA by improving the data accuracy and at the same time reducing the costs for the procurement, deployment, and maintenance of sensing nodes.
The rest of this paper is organised as follows: Section 2 presents the related work in IoT-based sensing for PA. Section 3 presents the materials and methods for IoT-based HSP. Section 4 discusses the results of HSP field experiments. Section 5 discusses the findings of this research. Section 6 concludes the paper and describes the potential future research directions.

2. Related Work in IoT-Based Sensing for PA

PA has been pervasively used to improve farm management processes from both animal [4,5] and crop [1] perspectives. From the animal farming perspective, PA enables us to capture and analyse data regarding animals’ behaviour and to find correlations between animals’ behaviour, living environment, and farm productivity [4]. From the crop perspective, which is the main focus of this research, PA enables accurate data collection regarding crop, soil, and weather to improve the farm yield while minimising the use of required resources. In the past decade, the emergence of IoT has revolutionised the data collection process in the PA context.
IoT-based PA enables us to reduce human interaction with the farm management process while at the same time increasing the accuracy of data collection and data analysis [6]. Integration of IoT in the PA context has been the focal point of multiple studies. Some researchers focus on the IoT architecture required to implement an IoT-driven PA system [6,7,8,9,10,11]. They proposed four [6,7,8,11], five [10], and six [9] layer IoT architectures. From their work, it can be perceived that there are four main layers in an IoT-based PA architecture, which are device, network, cloud, and application, where some of these works break down some layers into sublayers to further discuss the purpose of each layer [9,10].
Practical implementation of IoT-based PA has been also discussed in several related works. Some of these works focus on an IoT-enabled ground-based sensing approach to improve the animal farm management process. Cappai et al. [5] investigated the efficiency of using Radio Frequency Identification (RFID) tags in comparison with traditional approaches for monitoring milk production throughout lactation in sheep flocks. Such data-driven analysis of animals’ behaviour can result in improvements in animal farm productivity while at the same time reducing the required resources. Another application of wireless sensing networks in animal farming is the capability to develop smart traceability systems, which can be remarkably beneficial for brand and origin protection in animal farming products [12]. The ground-based sensing approach has been also used pervasively for the crop management process.
Heble et al. [13] developed an IoT-enabled ground-based sensing solution for the real-time visualisation of soil moisture and temperature that was used to apply timely variable-rate irrigation. Jayaraman et al. [14] designed an IoT-based platform called SmartFarmNet, which can automate the collection of environmental, soil, fertilisation, and irrigation data from ground-based sensors. SmartFarmNet automatically correlates such data and filters out invalid data from the perspective of assessing crop performance. It also computes crop performance forecasts and provides personalised crop recommendations for any farm. Zervopoulos [15] focused on time correlation between sensors, as environmental factors can cause drift in sensors’ clocks and this can reduce data accuracy. This paper proposed a sink node’s clock as a reference to automatically synchronise IoT devices across the farm. Popovic et al. [16] collected soil, crop, and weather data and used an IoT platform to analyse, visualise, and correlate data that can trigger an irrigation system. Keswani et al. [17] proposed an IoT-based irrigation system that reduces the use of fresh water while maintaining constant soil moisture across an entire farm. They deployed ground-based sensors to collect soil moisture, environmental temperature and humidity, carbon dioxide level, and daylight intensity, and also used external weather forecast data (including sunrise time and ultraviolet index) to predict the soil moisture in the next hour. Hong et al. [18] used Bluetooth as a communication technology for both end nodes’ micro-controllers, as well as a host station to collect soil moisture and activate an irrigation system for growing Romaine lettuce. Kim et al. [19] used an in-field sensing station to measure soil moisture and temperature and also air temperature. They send this data to a base station, where meteorological information is also collected from a weather station. Such a combination of real-time in-field data and predictive data of future weather conditions provides remarkable information for an efficient and effective irrigation approach. Ding et al. [20] used a pheromone trap, which uses certain chemical substances to lure pests. After pests are trapped inside the pheromone trap, RGB images are captured. Images are then processed using a Convolutional Neural Network (ConvNet) to detect pests and identify their species. Mahlein [21] used optical sensors to analyse plant health status. She argues that the interaction of leaf tissue with light depends on structural and leaf chemical properties. As a result, when disease emerges in crop, the pathogen results in a change in leaf structure and chemicals, and this phenomenon results in light spectrum reflectance compared to a healthy crop. Such sensors can be mounted on UAVs to analyse the plant health status [22] of an entire farm, which is discussed via the field experiment results in Section 4.
UAVs play a major role in PA and have different applications, including communication, data transfer, actuation, and sensing [22,23,24]. As a platform for aerial sensing, UAVs provide the best balance between image/data quality, coverage, and operating cost compared to helicopters and airplanes [25]. Popescu et al. [26] collected complementary data from UAV and ground-based sensors and used an IoT platform to perform data fusion and data analysis. They argued that an efficient UAV trajectory along with IoT data fusion can improve farm management accuracy. Cambra et al. [27] proposed an IoT-based PA management system called PLATEM PA, which uses a mesh network of sensors and actuators. PLATEM collects data from UAV and also ground-based sensors to improve fertilisation and irrigation. Saha et al. [28] focused on IoT-based aerial sensing, where they used a multi-rotor UAV to provide real-time hyperspectral images from a farm. Such an IoT-based aerial sensing approach enables real-time monitoring of the plant health status of an entire farm using only one sensor node deployed on the UAV. Tan et al. [29] proposed an IoT solution that uses ground-based soil sensors, complementary UAV-based aerial sensors, and external data from the U.S. Department of Agriculture’s soil database to improve farm irrigation and fertilisation. Pathak et al. [30] analysed crop health status variations using aerial and ground-based sensing. However, they did not investigate the integration of these two sensing approaches to improve the aerial data quality. Other researchers have also investigated aerial and ground-based sensing but the ground and aerial data in these works were not related [7,27,31]. Furthermore, they did not investigate or discuss any aspect or potential benefits of integrating these approaches. Combining aerial and ground-based sensing has only been investigated to a limited extent in [26,30].
In summary, most related works propose or investigate either the ground-based [10,13,32,33] or aerial [25,34,35] sensing approach. However, no related work has investigated or proposed a hybrid sensing approach for improving the accuracy of aerial data while reducing the cost of and effort involved in ground-based sensing. Some related research proposed the use of UAVs together with ground sensors, but the UAV serves a communication role (e.g., it is a data mule) [23,32] or performs actuations [10]. Some publications discuss both aerial and ground-based sensing; however, the aerial and ground data are not integrated for data quality improvement [7,8,27]. Among the related works, only two publications have investigated the integration of UAV and ground-based sensing approaches [26,30]. However, the focus of these two publications is more on data processing and data analysis algorithms. Therefore, it can be noticed that the integration of aerial and ground-based sensing approaches into a HSP to improve the data quality and reduce the data collection cost is an existing gap in the literature. In this paper, we address these gaps and we focus on how a HSP can improve the data quality and address some of the existing limitations of aerial and ground-based sensing approaches.

3. Materials and Methods

In this section, the materials and methods that are used to implement, deploy, and test the HSP are discussed in detail. From a material perspective, the HSP is composed of three main components, including an aerial node mounted on a UAV, ground-based nodes deployed on the ground to collect data on plant and environmental conditions, and a cloud node to collect the ground-based and aerial data. From a methods perspective, the HSP employs statistical and supervised machine learning models for data analysis to improve the data quality, for a more efficient and effective farm management process. Figure 1 shows the system architecture of the HSP.

3.1. Hybrid Sensing Platform for IoT-Based Precision Agriculture

As discussed before, the HSP is composed of aerial and ground-based nodes. Aerial nodes are mounted on quadcopter UAVs that are used to periodically collect crop and related environmental data. The environmental data in this research refer to temperature, humidity, wind speed, wind gust, rainfall, and solar radiation. Ground-based nodes include a weather station to monitor related environmental conditions and also sensors for observing specific plants on the ground, which we refer to as target plants. The design and implementation of the ground-based nodes are discussed in Section 3.1.1, aerial nodes are presented in Section 3.1.2, and the cloud node is described in Section 3.1.3.

3.1.1. Ground-Based Node

The ground-based node comprises two main components that, respectively, collect plant data observations and environmental conditions. The plant observation component includes a SparkFun variable resistor soil moisture sensor, an AMG8833 grid-eye infrared (IR) sensor that is used to detect the target plant temperature, and an AS7265x spectrometer sensor that monitors the light spectrum reflectance from the target plant. The spectrometer sensor provides 18 channels that detect light from 410 nm to 940 nm wavelengths. The plant observation component is powered with a 10,000 mAh power bank, and its data are (1) recorded on a SD card as backup via an Arduino Mega microcontroller, (2) transferred to a Raspberry Pi 3 (i.e., a single board computer used as an edge server via its serial communication port), and (3) sent to the IoT platform at the cloud node via a Long-Term Evolution (LTE) module connected to the Raspberry Pi. Figure 2 shows the design of the plant observation component.
The second component of the ground-based node is an Ecowitt WH2910 weather station. The weather station records ambient data including humidity, temperature, wind speed, wind gust, wind direction, solar radiation, and rainfall. The weather station data are transferred to the cloud using WiFi communication. Both components of the ground-based node are waterproof to prevent any environmental condition’s impact on the data collection process.

3.1.2. Aerial Node

The HSP’s aerial node is mounted on a quadcopter UAV. A quadcopter UAV is selected for the HSP because of its ability to hover and quickly change altitude while holding its position. The aerial node hosts five sensors. These include the AMG8833 grid-eye IR and AS7265x spectrometer sensors that are similar to the corresponding sensors deployed in the ground-based nodes, enabling direct data comparison between the aerial and ground-based data observations from these sensors. In addition, the aerial node includes an AM2315 temperature and humidity sensor, an ultrasonic distance sensor to measure the UAV distance from the ground, and an RGB camera to record aerial images for image processing purposes. Figure 3 shows the quadcopter UAV and the sensors deployed underneath the UAV.
The aerial data are collected from the sensors using the Arduino Mega microcontroller and recorded on an SD card. The data are then transferred to the Raspberry Pi using serial communication via a Universal Serial Bus (USB) standard. An LTE module is used to provide an Internet connection for the Raspberry Pi and transfer the data to the IoT platform. Figure 4 shows the aerial node design.

3.1.3. Cloud Node

As discussed in Section 1, a novel contribution of this paper is the integration of aerial and ground-based data via an HSP that automates the data collection and data analysis and improves the aerial data quality. The sensor data observations of the aerial and ground-based nodes are transferred to the cloud node using a http protocol. The cloud node employs an existing IoT platform to collect all sensor data via http. The HSP currently uses the ThingSpeak IoT platform, but any other IoT platform (e.g., Cumulocity, ThingWorx, Azure IoT, MindSphere, AWS, etc.) can be used instead [36]. The ThingSpeak IoT platform provides a data analysis capability using MATLAB, which is used in the HSP for the analysis and calibration of the acquired data.

3.2. Data Analysis for Improving the Quality of Aerial Sensor Observations

A major objective of the HSP is to improve the data quality of the aerial node using ground-based sensor observation data as ground truth. Data quality can be defined as the degree to which data are accurate, complete, and reliable. There are several variables that can impact the observation data quality of aerial sensors, which we refer to as observation context variables [37]. Table 2 shows the two main observation contexts and the corresponding data quality variables that we considered in the design of the HSP.
In this research, we do not consider how each individual characteristic of the UAV (e.g., the speed of its rotors, its altitude, and its distance from a plant of interest) impacts the aerial data that are collected from its onboard sensors. As different UAV characteristics, such as vibration, rotor cyclone, and acceleration, vary in different UAV models, we only consider the impact of the combined UAV characteristics as a whole on the aerial data when comparing the aerial data with ground-based data, which are not impacted by UAV characteristics. Such an approach enables the HSP to be used with different types of UAVs. While the observation variables in Table 2 can impact the quality of aerial data, the hybrid sensing approach uses ground-based data to determine the potential impact of such variables on the aerial data quality and calibrate the aerial data to reduce or eliminate the impact of the variables in Table 2.

3.2.1. Techniques for Improving the Quality of Aerial Sensor Observations

The HSP provides the following novel capabilities:
  • Techniques for validation of aerial data based on the analysis of related ground-based data, which allows the HSP to determine which aerial sensor observation data should be excluded from consideration (due to lack of sufficient data quality) or calibrated. Data validation is the process of determining the degree to which remote/aerial sensor observations provide an accurate representation of the real world from the perspective of the intended PA application.
  • Techniques for calibration of aerial data based on related ground-based data (which we refer to as ground truth) to improve aerial data quality. Data calibration refers to the process of preforming accuracy and uncertainty calculation based on observation context variables and applying corrections on the aerial data to reduce their distance from the ground truth.
In the following section, we discuss the data validation and calibration techniques employed in the HSP.

3.2.2. Data Analytic Models for Validation and Calibration

The HSP uses statistical models and supervised machine learning techniques to validate and calibrate aerial data based on ground-based data. In this paper, we consider the following three techniques.
Pearson correlation (Equation (1)) is used to determine the strength of the linear relationship between two data sets. In our research, these data sets are ground-based and aerial data.
r = Σ ( x i x ¯ ) ( y i y ¯ ) Σ ( x i x ¯ ) 2 Σ ( y i y ¯ ) 2
Pearson correlation analysis provides correlation coefficient values between −1 and +1. In Equation (1), r stands for the correlation coefficient, x i equals the values of the x-variable in a sample, x ¯ equals the mean of the values of the x-variable, y i equals the values of the y-variable in a sample, and y ¯ equals the mean of the values of the y-variable. The correlation coefficient values that are closer to 1 indicate a stronger linear relationship between two data sets. We use Pearson correlation to analyse the validity of aerial data by determining the strength of the aerial data’s linear relationship with ground-based data.
Linear regression (Equation (2)) is a supervised machine learning model that can be used to both validate and calibrate the aerial data based on ground-based data. From a validation perspective, the linear regression R2 value, known as the coefficient of determination, provides a goodness-of-fit measure, which indicates the strength of the relationship between two data sets, which are known as the predictor data set and target data set. The R2 value is between 0 and 1 and the values which are closer to 1 indicate stronger goodness-of-fit. This can be used to validate the aerial data in comparison with ground-based data. In addition, a linear regression line equation can be used to calibrate the aerial data.
y = b x + a
This equation enables us to predict the target data (ground-based data) based on a predictor variable (aerial data). In the linear regression equation above, y is the value that we try to predict, which is the ground-based value; b is the slope of the regression line; x is the independent variable used for prediction, which is the aerial value; and a represents the ground-based intercept. After obtaining the values of b and a in each experiment, the data points of the aerial data set are put into the equation to calibrate the aerial data by reducing their distance from the ground-based data.
Euclidean distance (Equation (3)) is used to determine the distance between aerial and ground-based data before and after calibration.
d ( p , q ) = i = 1 n ( q i p i ) 2
In Equation (3), p and q are two points in Euclidean n-space, q i and p i are Euclidean vectors, and n represents the n-space. The proposed validation and calibration techniques take UAV characteristic variables (discussed in Table 2) into account by validating and calibrating the aerial data based on ground-based data, which are not impacted by such UAV characteristics. Field experiments of the HSP using the discussed techniques for the validation and calibration of aerial data based on ground truth are presented in Section 4. The HSP aerial data validation and calibration process is presented next in Section 3.2.3.

3.2.3. Aerial Data Validation and Calibration Process

The HSP aerial data validation and calibration process consists of several steps and involves data observations from both aerial and ground-based sensors, i.e., humidity and temperature, infrared, and spectrometer data. Each farm under observation by the HSP is divided into multiple farm regions that include a single ground node and are used to grow the same crop. More elaborate farm regions can be also supported to take into account soil quality, irrigation, fertilisation, etc., but specialising regions further is outside the scope of this paper, as such extensions can be easily supported by modest extensions to the core contributions of this paper. The aerial data collection is performed in three cycles a day. Cycles are defined as the period where the UAV is used to collect aerial data. The HSP validation and calibration process pseudo-code is presented in Algorithm 1.
Algorithm 1 HSP validation and calibration process.
Futureinternet 14 00233 i001
The proposed algorithm is continuously applied on each aerial data collection cycle to determine the most optimum line slope and intercept values to be used for aerial data calibration. As more data are collected using the HSP, the size of the available data sets to be analysed using the data analytic software increases and therefore the most optimum line slope and intercept values can be determined.

3.3. Field Experiment

As has been discussed in Section 1, the aim of this research is to implement and analyse the performance of the HSP to determine the potential benefits of such a system to improve the data quality and reduce the cost of the data collection process in PA. In order to evaluate the HSP’s performance, a field experiment has been conducted, which focuses on aerial data validation and calibration to improve the aerial data quality. To conduct field experiments regarding aerial data validation and calibration, we collected data from a lemongrass farm during the spring season. However, the HSP can be used to analyse the health status of different plants and farms of various sizes. Therefore, the plant type and farm size are not important for presenting and evaluating the contribution of this paper. The data collection was performed for four consecutive days using aerial and ground-based nodes. Although larger data sets will result in better training data for the validation and calibration process, the approach and techniques for data collection and data analysis will be the same. The ground-based data were obtained continuously for the entire experimental duration. The ground-based optical sensors were pointing directly to the target plant. A two-pad variable resistor soil moisture sensor was also installed next to the target plant at 5 cm depth to analyse the soil moisture in different conditions based on soil conductivity between the two pads. The weather station was also used to collect environmental data including temperature, humidity, solar radiation, wind speed, wind gust, and rainfall. The aerial data were collected in three cycles per day (morning, afternoon, evening). Each aerial cycle data collection was captured during a 10 min flight. The UAV was flown at different altitudes and over the entire field of the experiment. In addition, the aerial data were captured in different weather conditions, including sunny, cloudy, and windy conditions, to analyse the impact of such environmental conditions on the data. In total, 6 experiments were conducted for validation and calibration purposes. The results of these experiments are discussed in Section 4.

4. Results

The results of HSP field experiments are divided into data validation and data calibration sections. The data validation section focuses on the experiments regarding the aerial data validation analysis in comparison with ground-based data. The data calibration section focuses on the experiments executed to calibrate the aerial data to improve its accuracy. In total, six experiments were conducted in this research and their results are presented in Section 4.1 and Section 4.2.

4.1. Data Validation

In this research, data validation is performed to determine the validity of aerial data based on ground-based data. The data compared between aerial and ground-based nodes are from sensors of the same type. Three experiments were performed to validate the aerial data, which are discussed in the following section.

4.1.1. Aerial Temperature and Humidity Data Validation Using Ground-Based Data—Experiment 1

In this research, the Ecowitt WH2910 weather station was used in ground-based node. With the assumption that the data obtained from the weather station are accurate, its data are considered as ground truth. In this experiment, the aerial temperature and humidity sensor data are compared with the ground-based data to analyse the impact of UAV movement on such data. Each cycle of aerial data collection was 10 min, and in each cycle, three temperature and humidity data were collected from the weather station. Therefore, each aerial cycle’s data are divided into three sections, and from each section, the aerial minimum, maximum, and average value are calculated and compared with ground-based data. The average value is calculated by adding the minimum and maximum values and then dividing this by two ((maximum + minimum)/2). In the following section, the temperature and humidity of all aerial data collection cycles are analysed in comparison with the weather station data.
As the data visualisation in Figure 5 shows, although the temperature data of the aerial node reflect the same pattern as the ground-based data, there are differences between the values at any specific point. The first observation is that the aerial node always gives a higher temperature value compared with the ground-based data, except at two instances in cycle 5 point 3 and cycle 11 point 3, where the difference is very small. In addition, data visualisation shows that aerial minimum temperature data are always closer to the ground-based data compared with aerial maximum and average temperature data. In order to obtain an accurate correlation between the aerial minimum, average, and maximum temperature compared with ground-based data, the correlation coefficient between each data set is calculated, which is shown in Table 3.
As Table 3 shows, the correlation coefficient between the aerial minimum temperature and ground-based temperature is 0.97 and is higher than the aerial average and aerial maximum temperature. This indicates that the aerial minimum temperature has the strongest linear relationship compared with the ground-based temperature and therefore has higher validity to be selected as aerial temperature data.
Another data analytics model that we used to determine the validity of the aerial data was a linear regression supervised machine learning model. Linear regression enables us to analyse how aerial data can be used to predict the ground-based data and therefore reflects the validity of aerial data. Table 3 also shows aerial temperature linear regression R2 values with the ground-based temperature. Similar to the correlation coefficient, the aerial minimum temperature data have also a higher R2 value than the aerial maximum and average temperature. The R2 value, which is 0.93, indicates a strong linear relationship. This shows that the aerial minimum temperature provides more valid data compared with aerial average and maximum temperature data.
The same analysis process was performed on aerial and ground-based humidity observations to analyse the validity of the aerial node humidity data. Figure 6 shows the humidity data analysis.
Comparison between aerial and ground-based humidity data shows that, contrary to temperature, where aerial data were always higher than the ground-based data, in humidity, the aerial data are always lower than the ground-based data, except at two instances in cycle 5 point 3 and cycle 11 point 3, where the difference is very small. In the humidity data, the aerial maximum reading is always closer to the ground-based humidity. Table 4 shows the correlation coefficient and linear regression of aerial and ground-based humidity data.
Table 4 shows that the aerial maximum humidity has the highest correlation coefficient value with 0.98, which means that it has the strongest linear relationship with ground-based humidity. Therefore, aerial maximum humidity has higher validity to be selected as aerial humidity data. Similar to temperature, the linear regression analysis was also conducted on the humidity data.
As Table 4 shows, the aerial maximum humidity has the highest R2 value, which is 0.95. This value indicates a strong linear relationship and shows that aerial maximum humidity has higher validity to be selected as aerial humidity data compared with aerial average and minimum humidity data.
The data validation performed on aerial minimum, average, and maximum temperature and humidity data shows that all of these data have relatively strong linear relationships with the ground-based data. However, aerial minimum temperature and aerial maximum humidity have stronger correlation coefficient and linear regression values compared with other data sets. Therefore, aerial minimum temperature and aerial maximum humidity are selected to be used in the data calibration process, which is discussed in Section 4.2.

4.1.2. Aerial Infrared Data Validation Using Ground-Based Data—Experiment 2

Two main variables that can impact the aerial sensors’ data quality are UAV movement and vibration. Since similar infrared sensors are deployed on both the aerial and ground-based nodes to obtain the plant temperature and there is no vibration on the ground-based node, therefore, the ground-based infrared data can be used as ground truth to analyse the data fluctuation between the aerial and ground-based nodes. During this experiment, the ground-based sensor was reading data from a single plant and the aerial sensor was reading data from different areas of the experimental field. However, due to the fact that the density of plants was high in the experimental field and the entire field was covered with plants of a similar type, it can be assumed that the UAV has been constantly reading data from similar types of plant in similar environmental conditions compared with the target plant. The only points at which the UAV has captured invalid data are during take-off and landing, where the UAV is on the ground. These data points are removed from the data set. In this experiment, the infrared data of all 13 aerial data collection cycles are compared with ground-based data of the same time span. The total number of data points is 1080 for each aerial and ground-based data set, which are used in the correlation and linear regression analysis.
As is shown in Figure 7, the aerial infrared data show more fluctuations compared with ground-based infrared data. This indicates that the UAV movement and vibration can impact the data quality obtained from this sensor through aerial observation. In order to determine the validity of the data, the correlation coefficient between aerial and ground-based data was calculated, which is equal to 0.91.
Figure 8 shows the scatter plot between aerial and ground-based data points. As the correlation coefficient value and scatter plot show, there is a strong linear relationship between aerial and ground-based data. In order to analyse the possibility of using aerial data to predict ground-based data, the linear regression analysis is performed on both aerial and ground-based data sets.
Figure 9 shows the linear regression pattern where ground truth data are predicted based on aerial data. The R2 value is 0.83, which shows strong linear regression between the two data sets. This indicates that aerial infrared data are valid and there is a possibility for data calibration to improve the aerial data quality.

4.1.3. Aerial Spectrometer Data Validation Using Ground-Based Data—Experiment 3

In this experiment, the impact of UAV movement and vibration on aerial spectrometer data is analysed. The spectrometer sensor used in this research reads 18 channels of the spectrum, ranging from ultraviolet to infrared. In order to determine whether or not all aerial channels have the same pattern compared with their corresponding ground-based channel, correlation coefficient analysis between each channel is conducted.
Figure 10 shows that the correlation coefficients of all channels are relatively similar and the value is slightly lower in the G, H, and I channels. Therefore, since all channels show a similar linear relationship pattern, we focus on three E, H, and O channels to perform the data analysis. Channel E represents the green colour, which can be used to determine plant health; channel H represents the yellow colour, which can be used to identify plant disease and discolouration, and channel O represents near-infrared (NIR), which is used in PA to determine the plant stress level. Figure 11 and Figure 12 show the comparison and distances between aerial green, yellow, and NIR channel data with corresponding ground-based channel data during the 13 aerial data collection cycles.
As can be noticed from Figure 11 and Figure 12, the aerial spectrometer data have significant fluctuations compared with ground-based data, particularly during afternoon cycles. In order to determine the possibility of using the aerial channel to predict the ground truth data, linear regression analysis on the three channels is performed, which is shown in Table 5.
As the correlation coefficient and linear regression analysis show, the relationship between the aerial and ground-based spectrometer is not strong. This impacts the validity of aerial spectrometer data; however, since the environmental observation context variable might impact the spectrometer reading, data calibration might improve the validity of aerial spectrometer data. The calibration of such data is discussed in the next section.

4.2. Data Calibration

Data calibration in this research is based on the findings of the data validation. In the calibration process, a linear regression equation is used to improve the aerial data quality and reduce its distance from ground-based data. In the following sections, we discuss the calibration experiments to investigate the possibility of improving the aerial data quality. The three experiments performed in the data calibration process to improve aerial humidity and temperature data, infrared data, and spectrometer data are discussed in the following section.

4.2.1. Aerial Temperature and Humidity Data Calibration Using Ground-Based Data—Experiment 4

As discussed in experiment 1 of data validation, aerial minimum temperature and aerial maximum humidity readings have a correlation coefficient of 0.97 and 0.98, respectively, with ground-based data, which shows a very strong linear relationship. Therefore, we consider these two data sets for our calibration process. Although aerial minimum temperature and aerial maximum humidity have a strong linear relationship with ground-based data, temperature readings were always above the ground-based readings and aerial humidity readings were always below the ground-based readings. In this experiment, we use a linear regression equation to calibrate the aerial data to reduce their distance from ground-based data. In order to do so, first, we need to obtain the intercept (a) and slope of regression line (b) values. Executing linear regression analysis on aerial and ground-based data provides these values, which are represented in Table 6.
Based on the obtained data in Table 6, the linear regression equation was applied on both aerial temperature and humidity data points to obtain the calibrated data sets. Figure 13 and Figure 14 show the temperature and humidity data comparison with ground-based data before and after calibration.
As Figure 13 shows, the aerial calibrated temperature is closer to the ground-based temperature. The Euclidean distance between the aerial original temperature and ground-based temperature was 14.5, and after calibration, it is reduced to 7.06. This shows a 51% improvement in the aerial temperature data accuracy. This distance can be considered as the closest possible distance to be obtained using the linear regression model.
Similar to temperature, the humidity calibration data illustrated in Figure 14 also show an improvement in reducing the distance between aerial original humidity and ground-based humidity data. The Euclidean distance between these two data sets was 37.09 before calibration. After calibration, this distance is reduced to 24.27, which shows a 34% improvement in aerial humidity data accuracy.

4.2.2. Aerial Infrared Data Calibration Using Ground-Based Data—Experiment 5

In validation experiment 2, we found that aerial infrared readings have a relatively high correlation with ground truth, with a correlation coefficient value of 0.91 and linear regression R2 value of 0.83. The validation analysis was conducted on the entire data of aerial cycles and the corresponding ground truth data. However, in the calibration process, other variables, such as time, solar radiation, wind speed, and wind gust, and their impacts on collected data are also taken into consideration to improve the data quality. Such analysis helps to identify which of these variables impact the aerial data readings and how factoring out some of the data that are highly impacted by such variables can improve the aerial data quality. The first step in calibrating aerial infrared sensor readings is to analyse these sensor readings at different times of the day. As discussed before, the aerial data were captured three times a day at morning, afternoon, and evening. Therefore, comparing the cycles that were captured in the morning with the afternoon and evening cycles can determine which time of the day yielded the highest correlation between aerial and ground-based data and also which time provides better data for calibration using linear regression.
As Table 7 shows, the evening cycles provide more accurate data, followed by morning cycles. Morning and evening cycles’ correlation and linear regression values are slightly different; however, the afternoon cycles’ correlation and linear regression values are remarkably lower compared with morning and evening cycles. Although afternoon cycles show significantly different correlations between aerial and ground-based data compared with evening cycles, these two cycles have a relatively similar wind speed and wind gust average. This indicates that the wind speed in the existing threshold does not impact the infrared sensor readings deployed on the UAV. Regarding solar radiation, it can be seen that solar radiation in afternoon cycles is remarkably higher compared with morning and evening cycles. This can be a possible reason for the reduction in correlation between aerial and ground-based data. However, the solar radiation value in evening cycles is also higher than morning cycles but, contrary to afternoon cycles, evening cycles show higher accuracy compared with morning cycles. The reason for this can be due to the fact that, based on aerial video recorded during all afternoon cycles, the sunlight was directly shining on the plant canopy and therefore causing a significant temperature difference between the areas of the plant where the aerial sensor was pointing and the areas where the ground-based sensor was pointing. Therefore, based on the obtained data, the aerial infrared is more reliable during evening cycles. As a result, we consider the evening cycles for the data calibration process.
Based on the linear regression analysis on the evening data set, the intercept (a) value is 6.93 and the slope of regression line (b) is 0.76. The Euclidean distance between aerial and ground-based data before calibration is 84.05. This indicates a 66.1% improvement in aerial plant temperature data accuracy after calibration. Based on the obtained intercept and slope of regression line, the aerial data points were calibrated to reduce their distance from ground-based data. The aerial original plant temperature, aerial calibrated plant temperature, and ground-based plant temperature data are compared in Figure 15.
As Figure 15 shows, the aerial calibrated plant temperature is closer to the ground-based data. The Euclidean distance between the aerial calibrated plant temperature and ground-based temperature is 28.44, which is remarkably reduced compared with the aerial original plant temperature, which was 84.05. The obtained distance after calibration shows the minimum distance between aerial data and ground-based, which can be obtained using the linear regression model. The obtained line intercept and slope values can be automatically applied to future aerial data to obtain better data quality in comparison with ground truth.

4.2.3. Aerial Spectrometer Data Calibration Using Ground-Based Data—Experiment 6

In the previous experiment, the impact of environmental variables on the infrared optical sensor was discussed. In this experiment, the impact of the same variables on the aerial spectrometer sensor is analysed. As discussed in the validation section, in this research, we focus on three spectrometer channels, which are channel E, which represents the green colour; channel H, which represents the yellow colour, and channel O, which represents NIR. Table 8 shows these channels’ correlations in the morning, afternoon, and evening data collection cycles.
As the data in Table 8 show, the aerial spectrometer readings are significantly more accurate during morning cycles compared with afternoon and evening cycles. On the other hand, at afternoon cycles, the aerial spectrometer readings show an inverse correlation where the correlation coefficient value is negative. This shows that the solar radiation value remarkably impacts the aerial spectrometer readings. In order to analyse the impact of solar radiation and overcast on spectrometer readings, the data from cycle 9, which were taken in the afternoon and include both sunny and cloudy weather, are analysed. In this cycle, the aerial data were collected mainly from the target plant. After analyzing the aerial video in this cycle, it was noticed that there were 23 data points where the UAV was positioned directly on top of the target plant at close range. These data can be used to analyse the aerial and ground-based spectrometer readings when both aerial and ground-based sensors are reading the data from the target plant. One important issue regarding this cycle is that, from data point 10 to 16, the weather turned cloudy and there was no direct sunshine. This can be useful to analyse the impact of overcast and solar radiation on the spectrometer data.
As Figure 16 shows, during the points were there was overcast, the distances between aerial and ground-based spectrometer readings were significantly reduced. This shows that the high fluctuation in aerial spectrometer readings is due to direct sunshine and high solar radiation. The wind speed and wind gust in this cycle were 17.2 and 28.3 km/h, respectively. This shows that despite the relatively high wind speed and wind gust, the spectrometer data were remarkably improved during cloudy weather. Therefore, it can be concluded that the main reason for aerial spectrometer readings’ fluctuations is direct sunlight and high solar radiation. Table 8 shows that the aerial spectrometer readings improve during morning cycles, where there is less solar radiation. In order to compare the aerial data’s accuracy with ground-based data, the morning data collection cycles’ videos were analysed to identify the data points where the UAV collected data from the target plant from close range. In total, 37 data points were identified, which are presented in Figure 17.
As can be noticed from Figure 17, the distance between aerial and ground-based readings, particularly in the NIR channel, is high. We apply the linear regression equation on morning cycles to obtain the intercept (a) and slope of linear regression line (b) for the calibration of the aerial spectrometer channels, as described in Table 9.
Based on the obtained intercept and line slope values in Table 9, the calibration was performed on each aerial channel’s data.
As Figure 18 shows, the calibrated aerial data’s Euclidean distance from the ground-based data is remarkably reduced. For channel E (green), the distance between calibrated aerial data and ground-based data is reduced to 65, which shows a 92% improvement in data accuracy. For channel H (yellow), the distance is reduced to 69, which shows a 90% improvement in data accuracy, and for channel O (NIR), the distance is reduced to 323, which also shows a 90% improvement in data accuracy. Therefore, it can be concluded that calibration using linear regression proves to be efficient in improving aerial spectrometer data quality.

5. Discussion

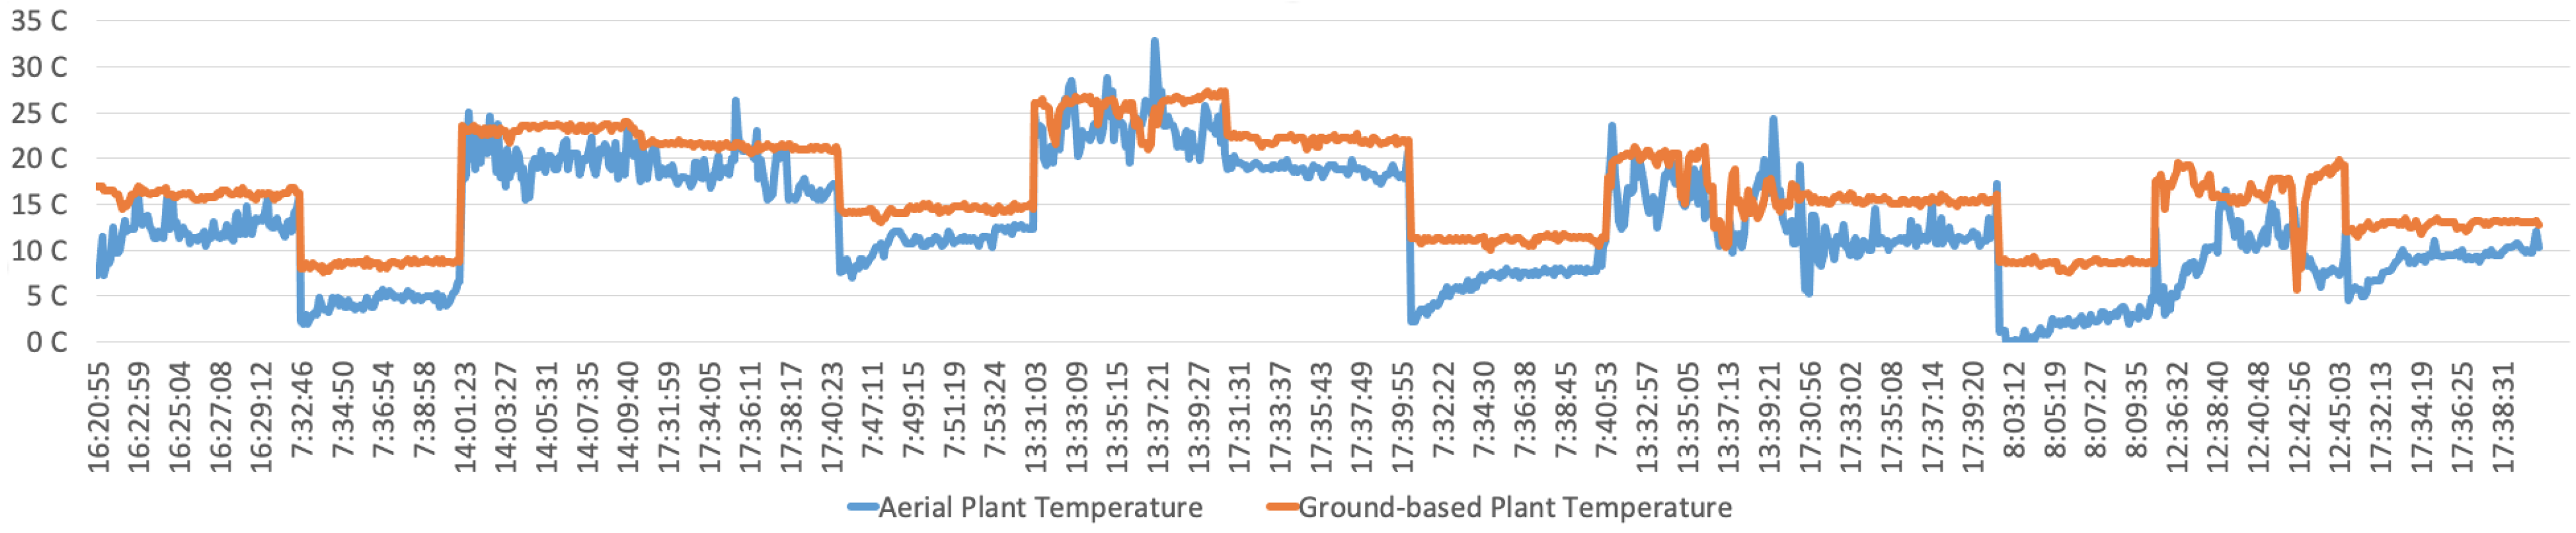
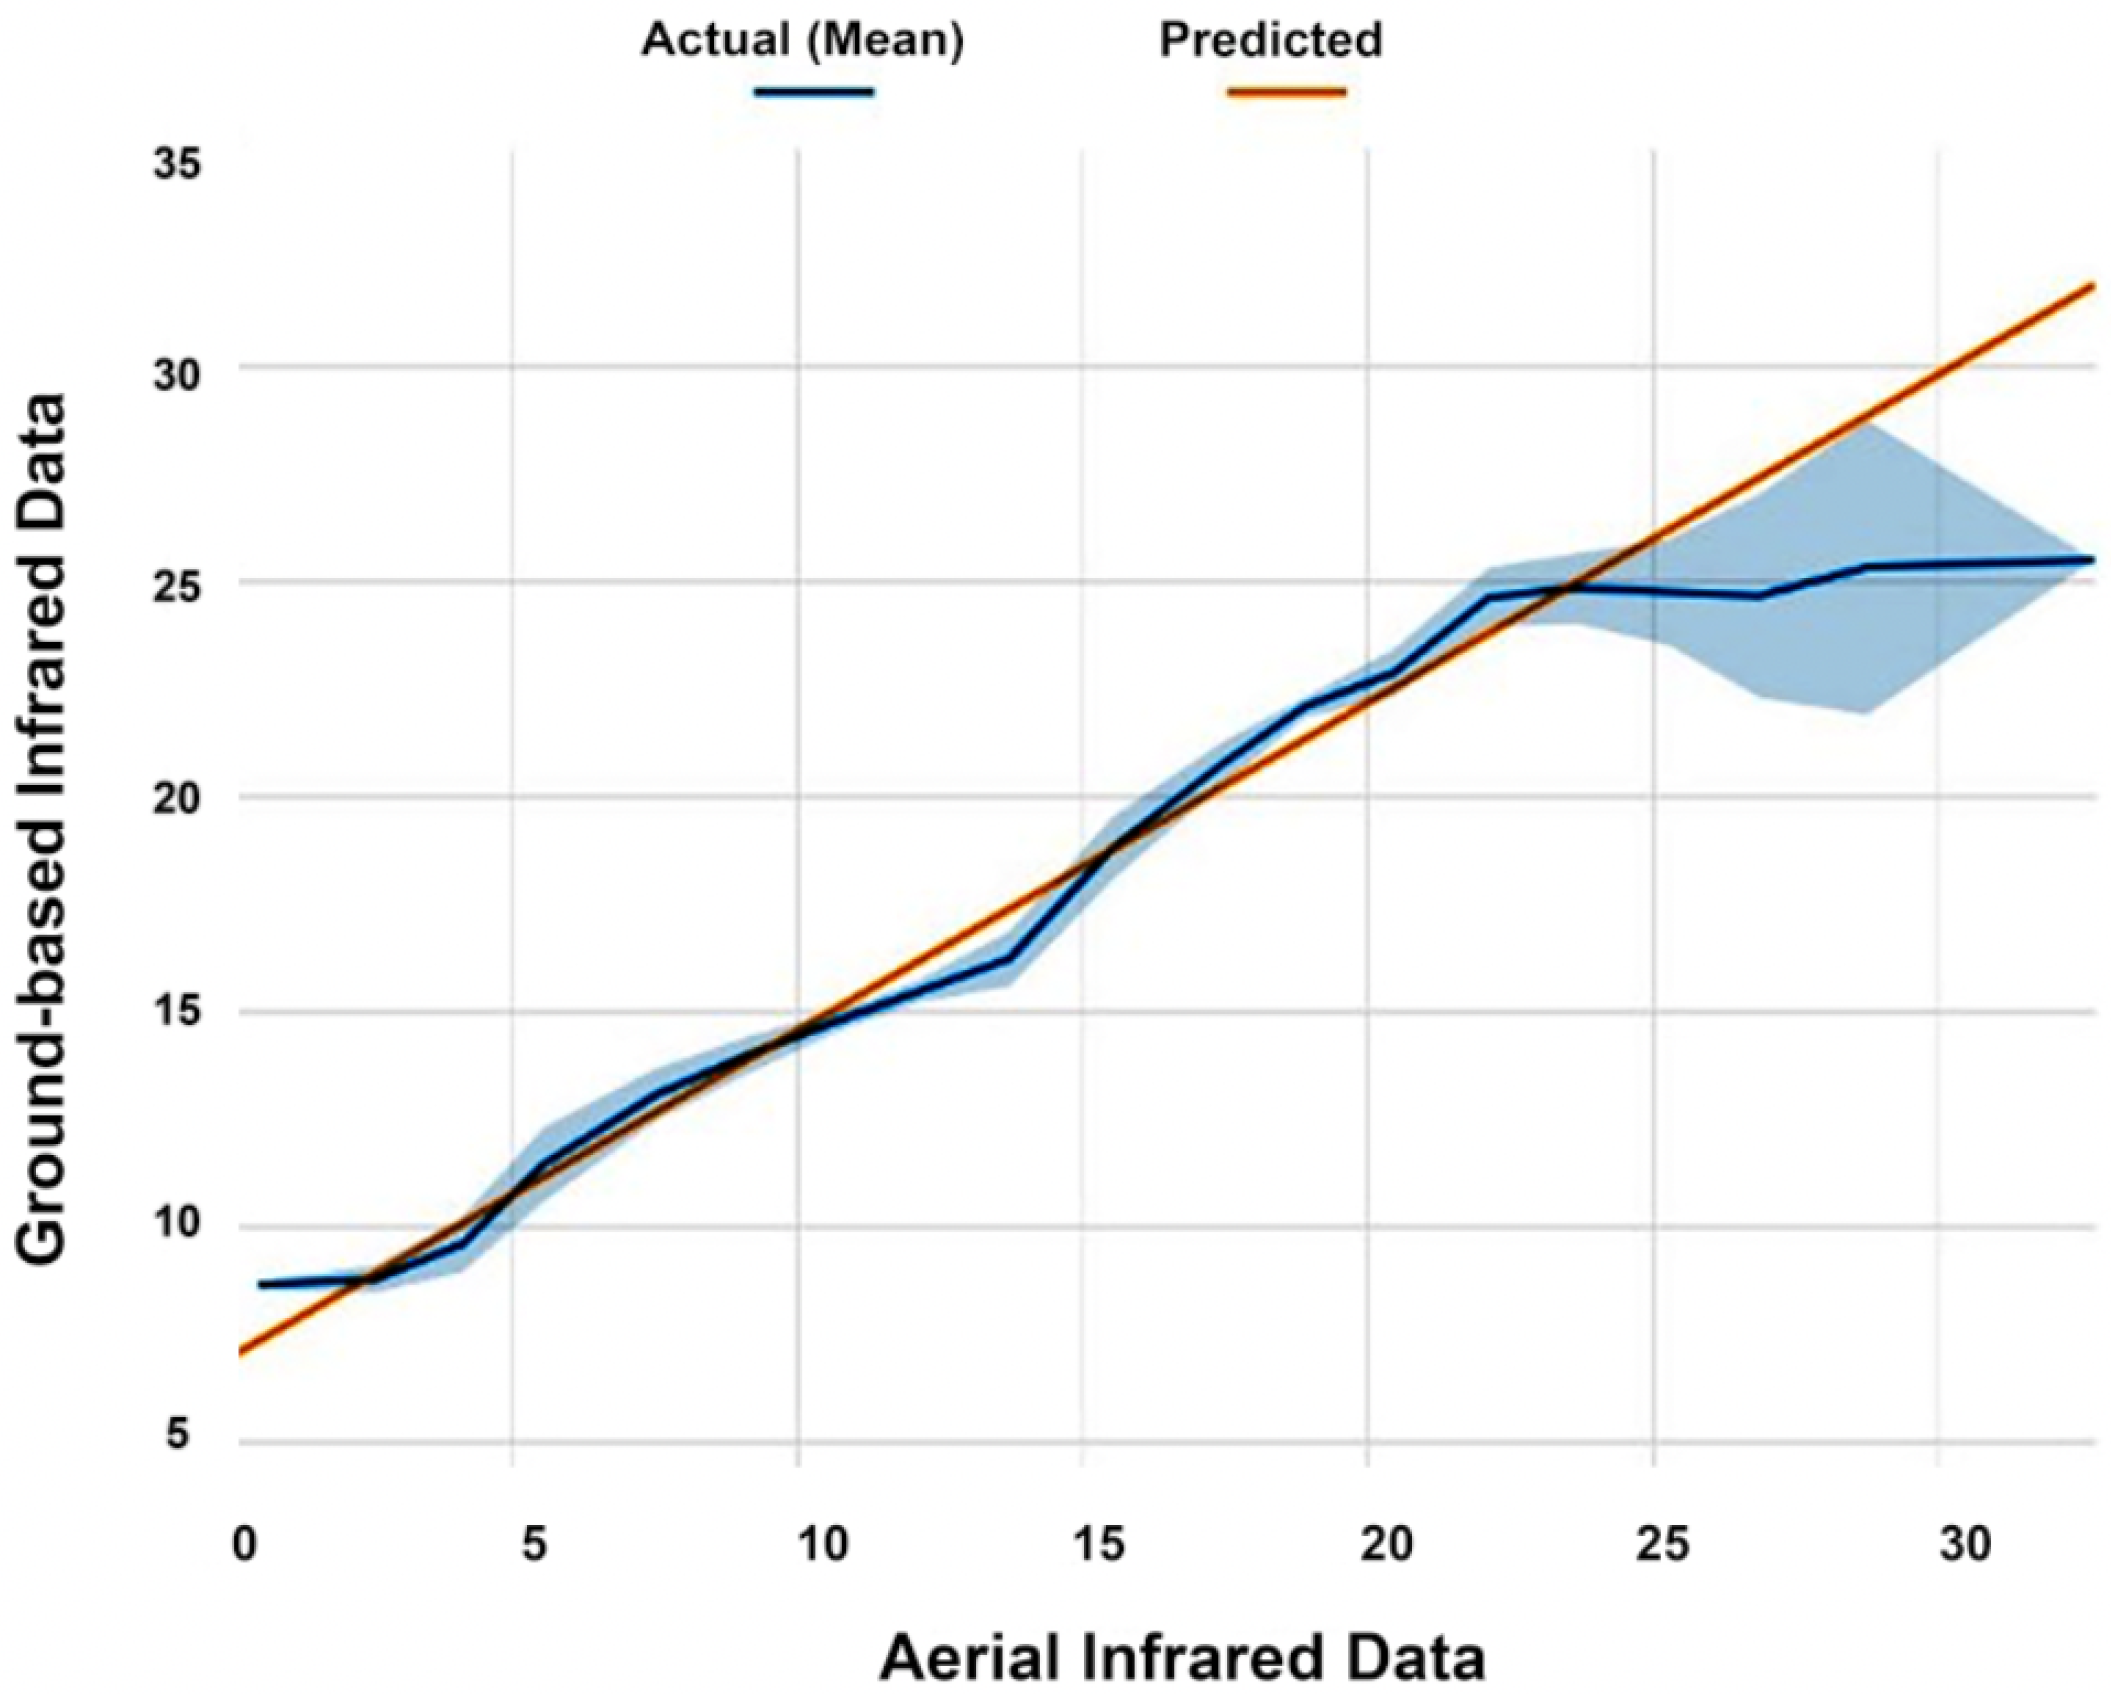
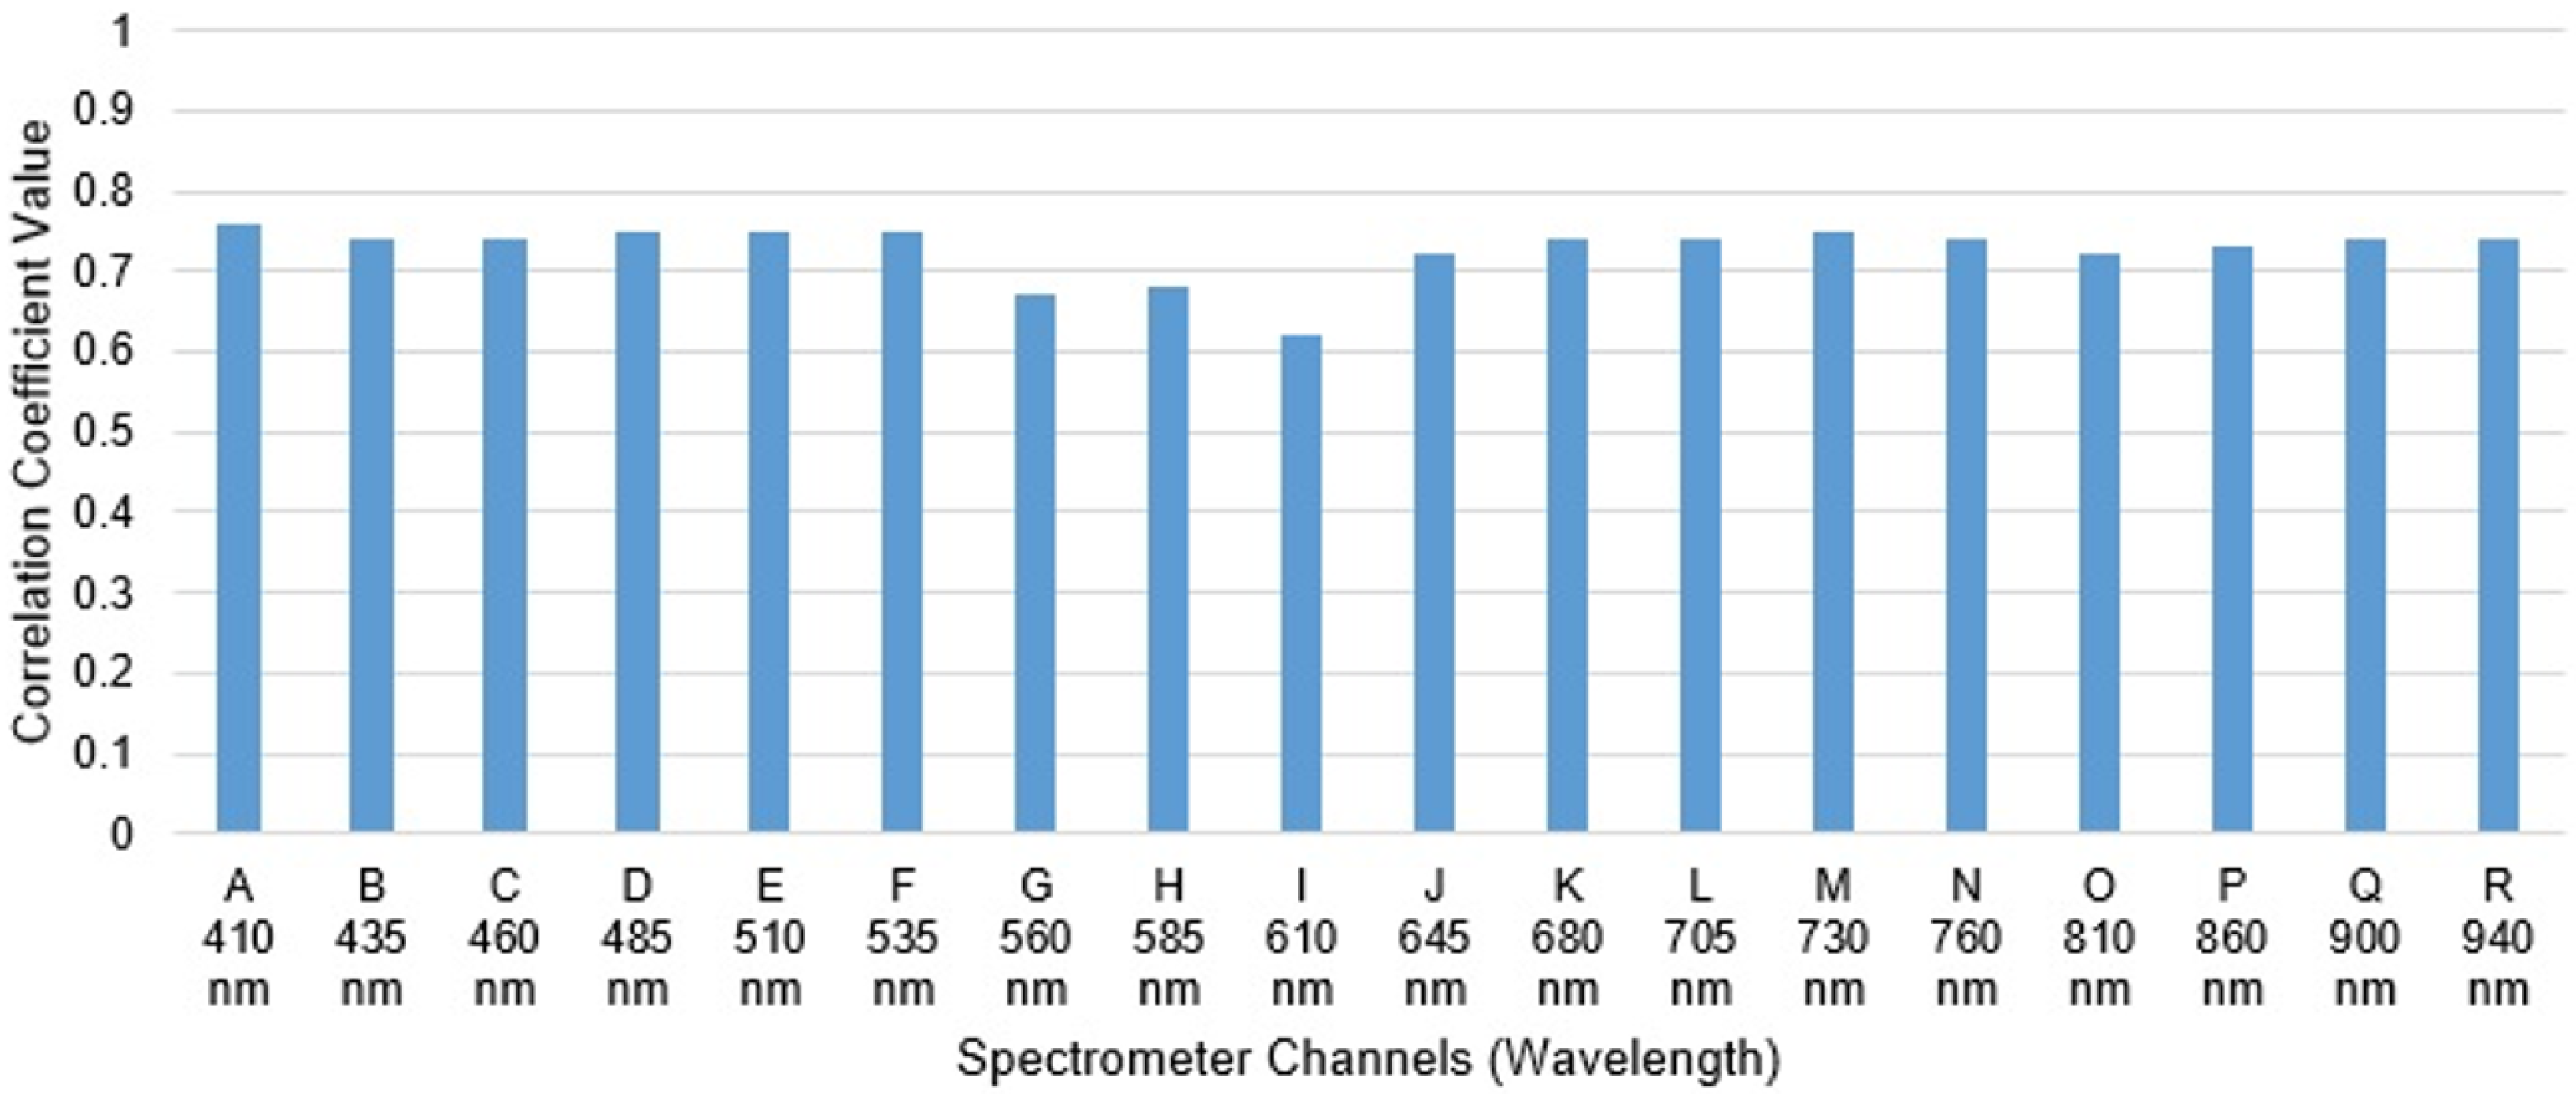
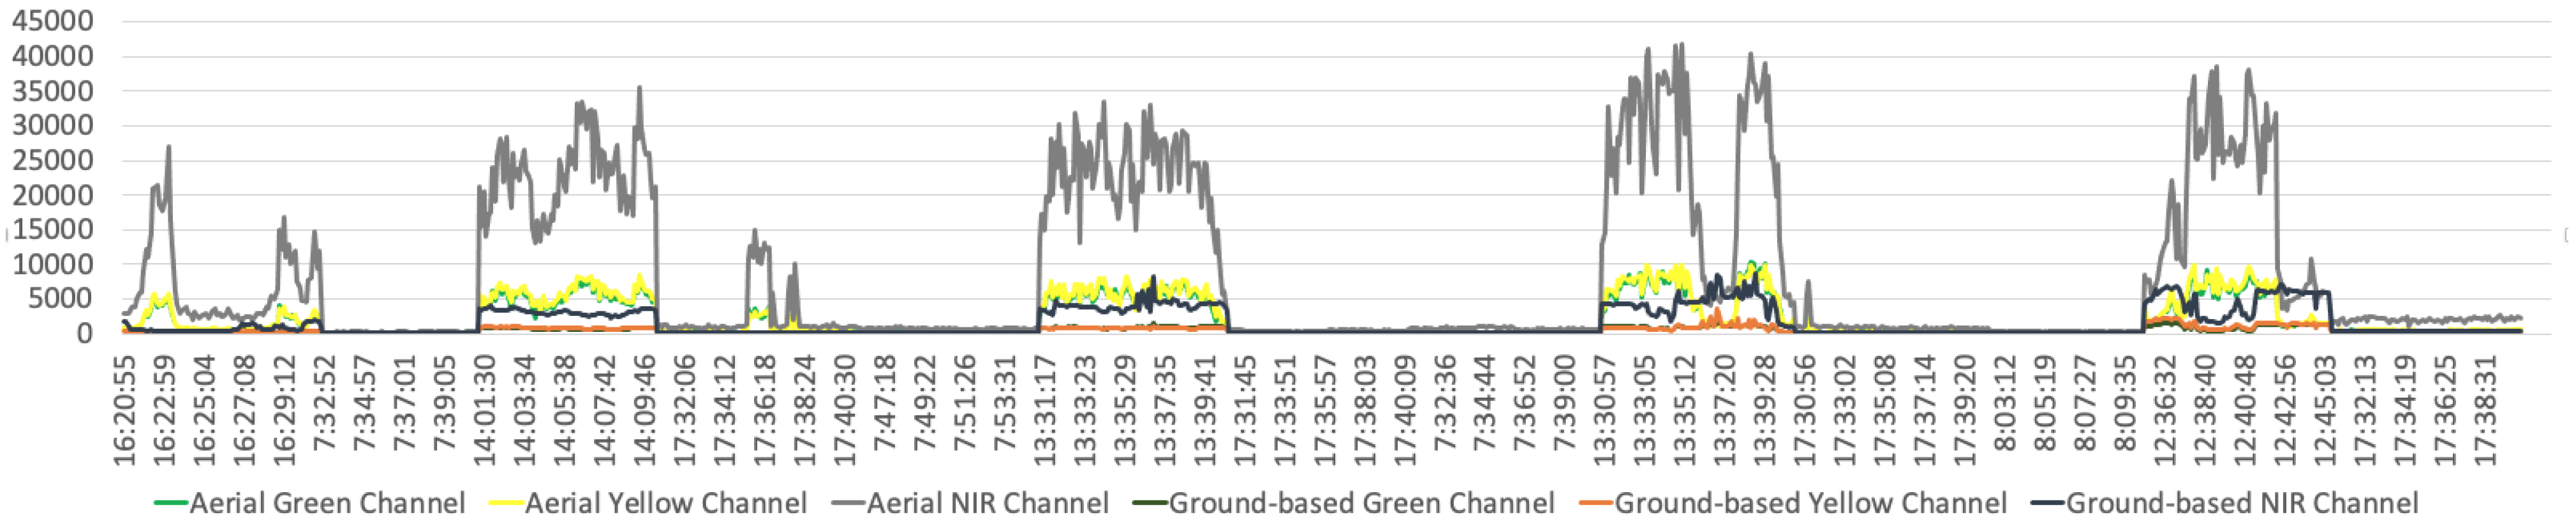
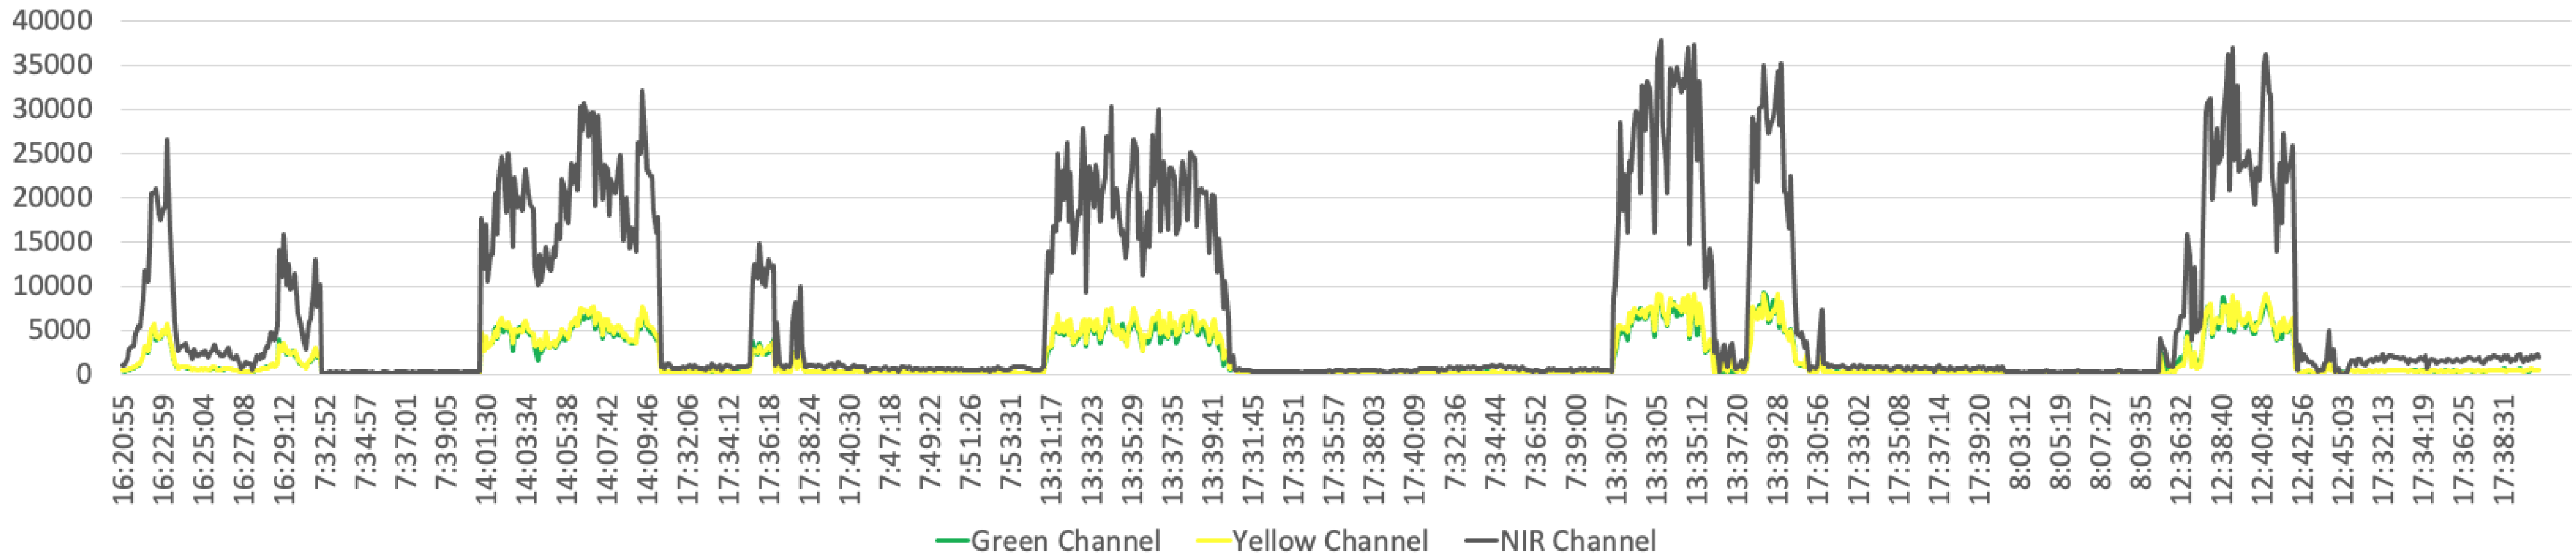
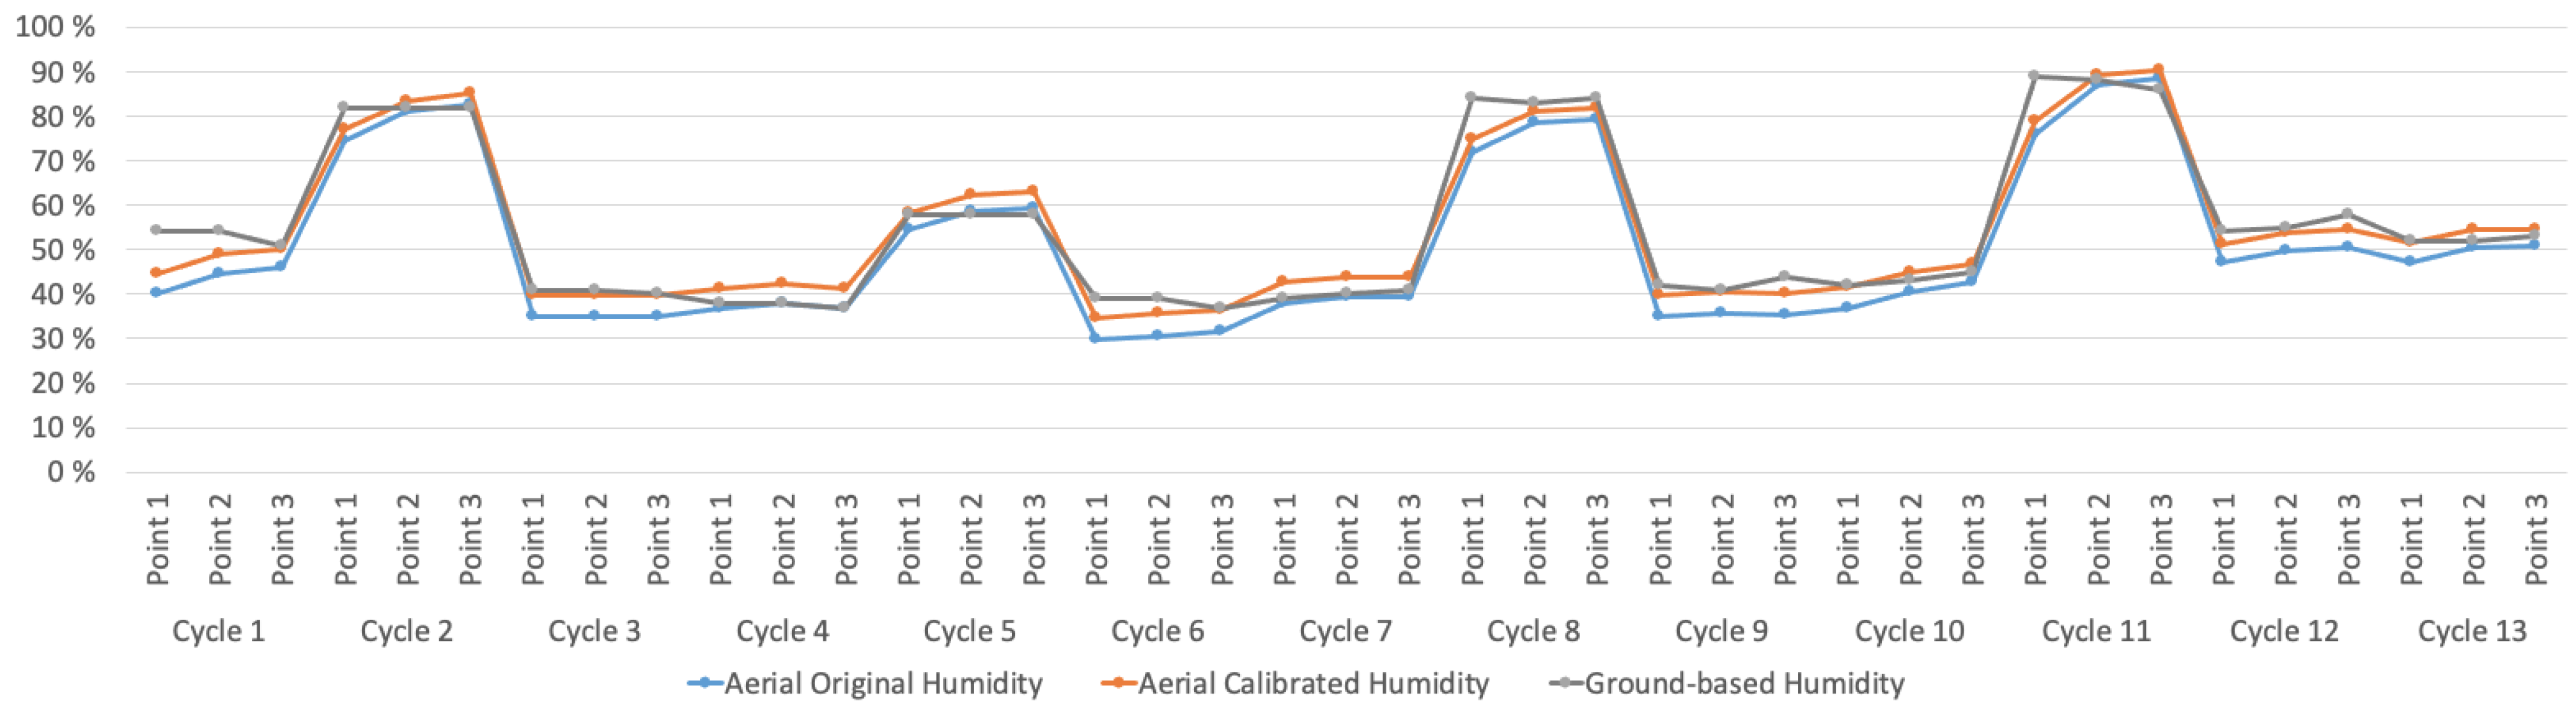
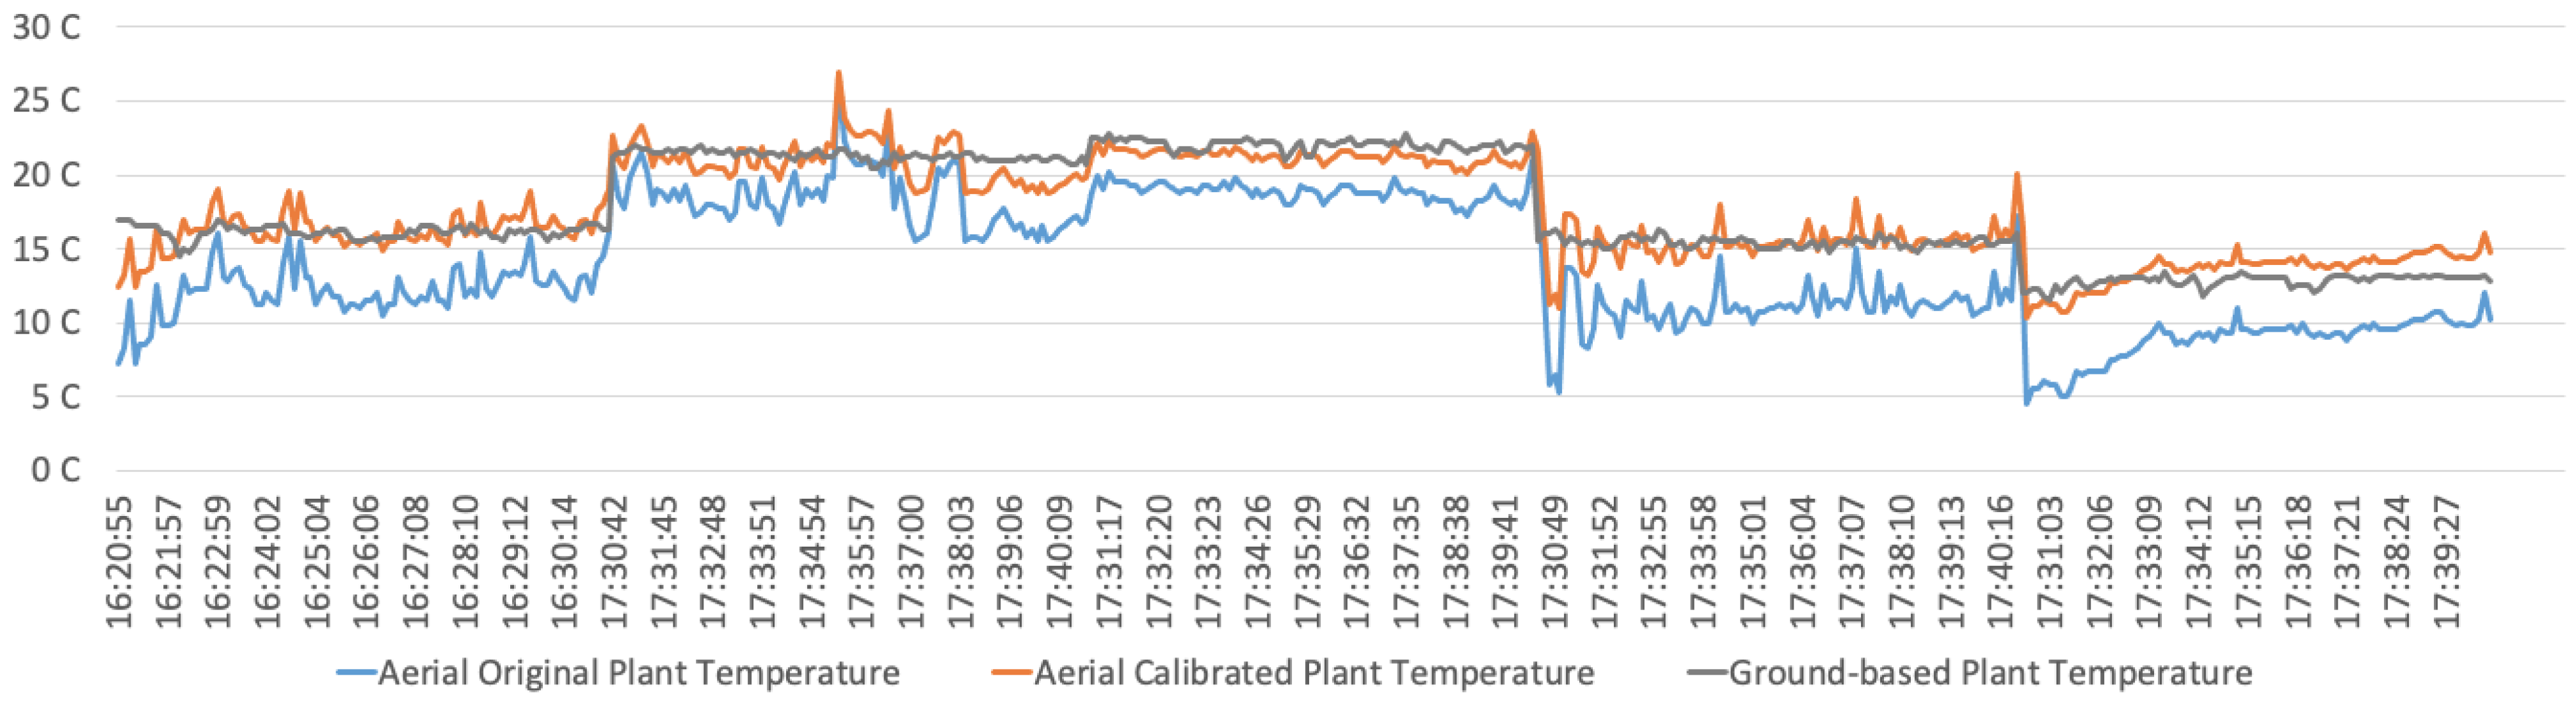
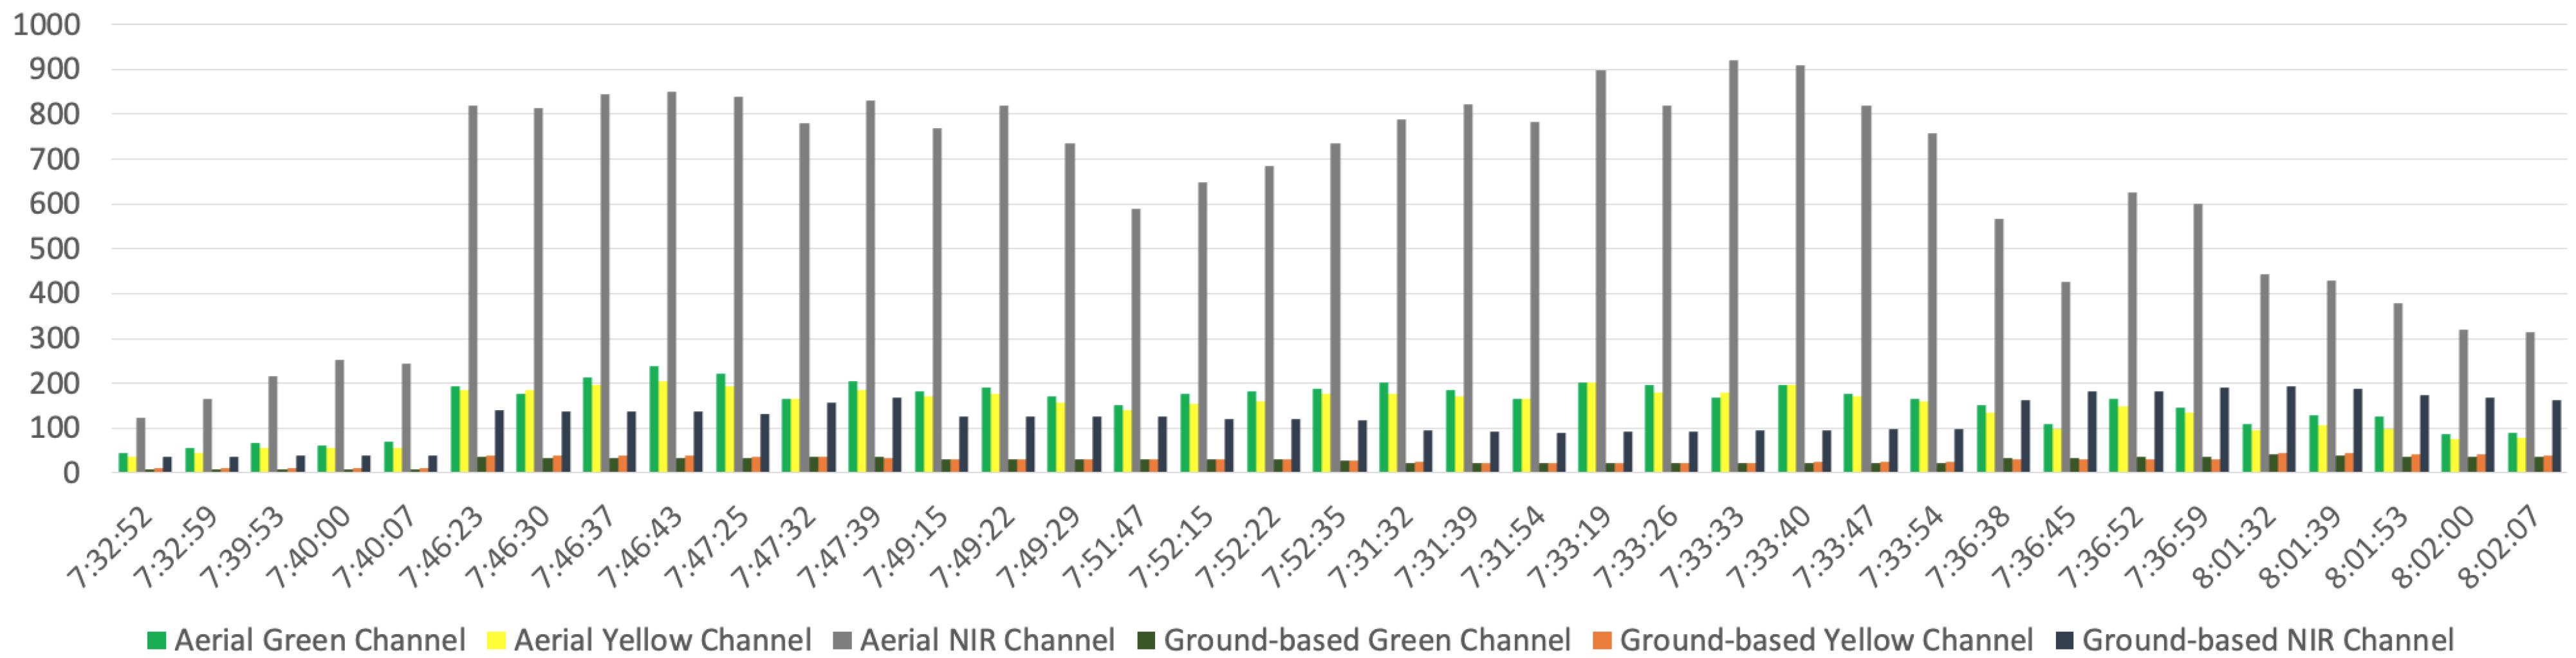
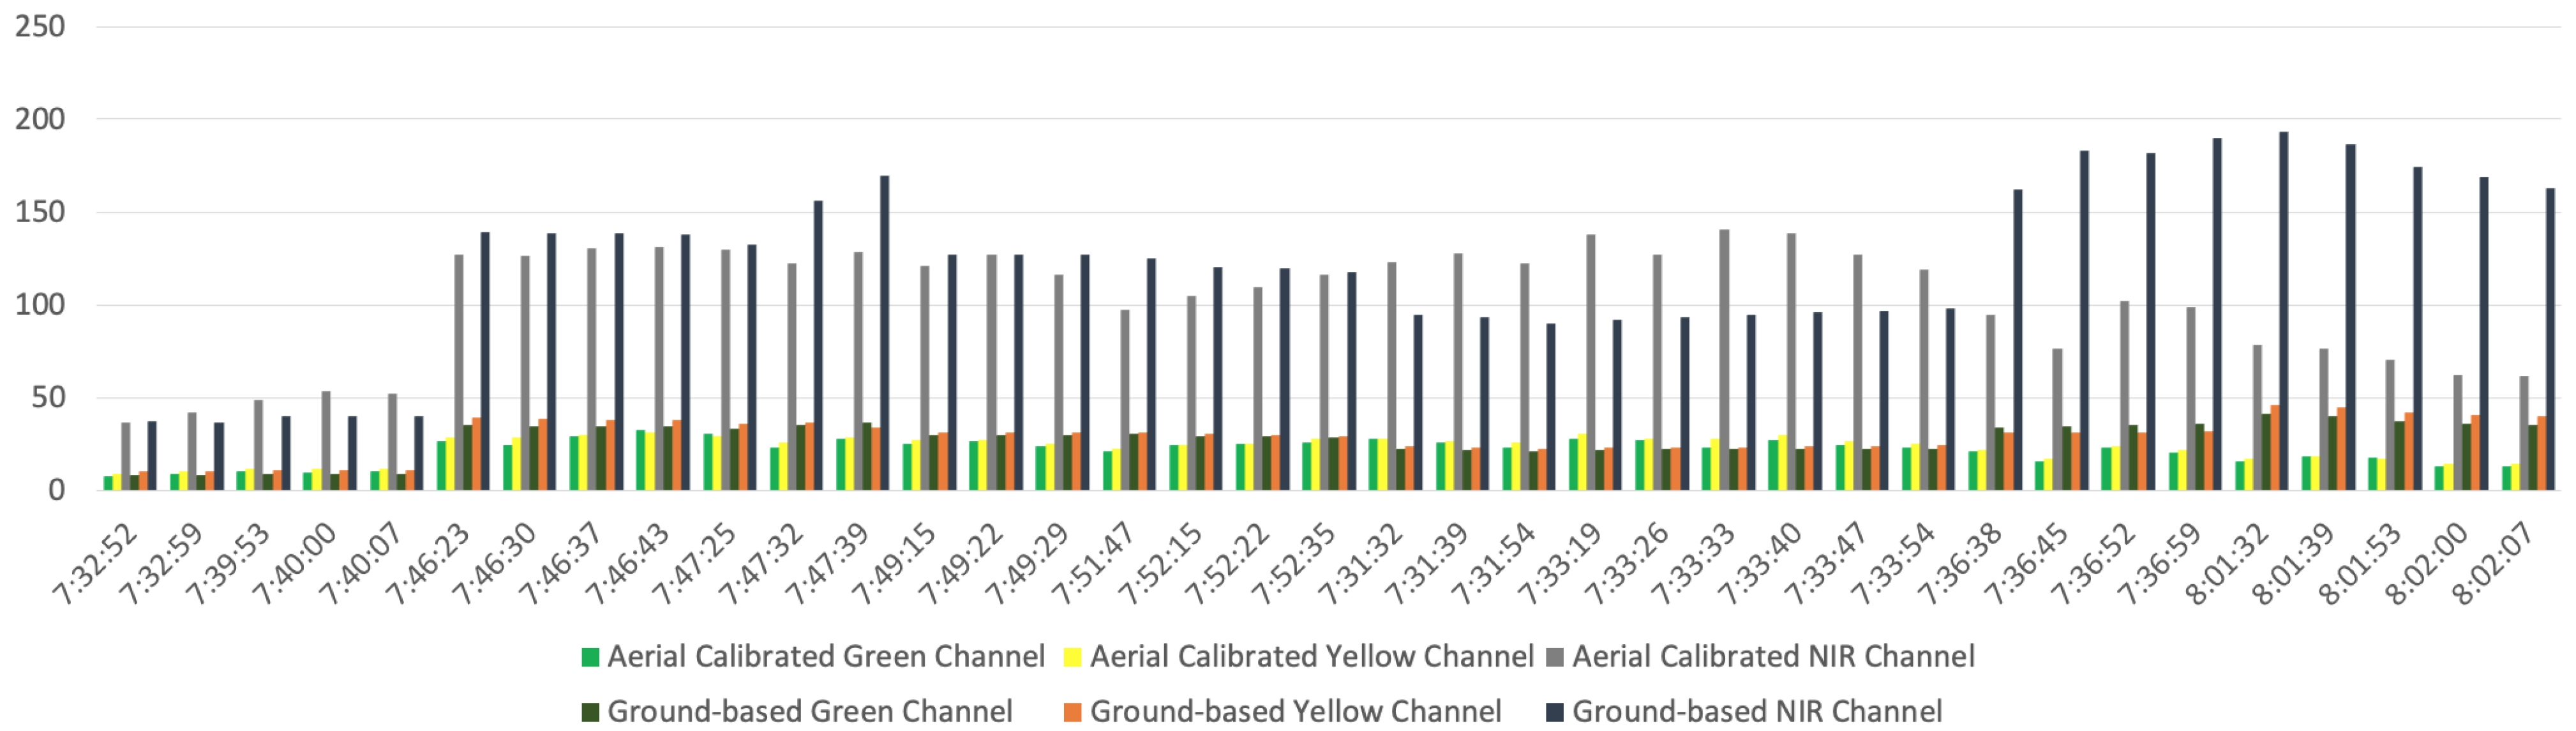
The HSP uses data observations of a small number of ground-based sensors to automatically validate, calibrate, and improve the accuracy of data observations collected by UAV-based sensors. Application of statistical data analysis and supervised machine learning shows that the correlation between aerial and ground-based data is strong in the case of humidity, temperature, and infrared plant temperature data, and it is also at a moderate level regarding spectrometer data. In addition, application of the linear regression line equation on aerial data resulted in reducing the Euclidean distance between aerial data and ground truth. Therefore, the derived formula can be used in future data collections to automatically improve the aerial data in comparison with ground-based data. The research findings show that using ground-based data as ground truth in several locations of a large-scale farm, and using the validated and calibrated aerial data, can potentially improve the data quality and farm management process. By using the HSP, the main limitation of the ground-based sensing approach, which requires a large number of sensing nodes, can be addressed. Instead, UAVs can be used to collect data from the entire farm and significantly reduce the number of ground-based sensors that are otherwise required. In addition, the UAV can only concentrate on the areas far from the ground-based nodes, requiring less time to collect data from the entire farm. Moreover, transferring the HSP data to an IoT platform enables real-time data collection and visualisation and also automated data analysis, which are very important for timely actuations in PA.
Although HSPs have potential benefits in improving data quality and farm management processes, there are several limitations in their implementation and adoption. One of the limitations is that the accuracy of the optical sensors deployed on the aerial node can be impacted by UAV vibration. The exact level of data quality degradation due to UAV vibration cannot be assessed using the existing system, because such measurement requires comparison between UAV data and accurate aerial data that are not impacted by vibration. Such data can be obtained using robotics technology or by installing a sensor stabiliser on the UAV, which can be a direction for future research, to analyse the impact of vibration on data quality degradation. Nevertheless, in order to reduce the impact of UAV vibration on data quality, there is a need for moving the UAV with low speed and also maintaining the position of the UAV at different points of interest across the field to collect valid data with a minimum level of vibration. In this research, we used the UAV’s “positioned flight mode” to automatically position the UAV at low altitude, with less than half a meter’s distance from the plant. Positioned flight mode also stabilises the UAV against wind force and therefore reduces the vibration impact. Another limitation in this research was that, due to the global COVID-19 pandemic, the data collection was limited to four days in a small field, although the techniques for data collection and data analysis on larger-scale fields with a longer data collection duration will be the same as discussed in this research, but additional data collection with a larger number of ground-based nodes might provide better data training for the validation and calibration process. The exact number of ground-based sensors in order to have trusted results depends on two factors, which are the farm scale and the duration of data collection. Determining the number of ground-based nodes requires additional investigation using supervised machine learning techniques to determine which number of ground-based nodes and which duration of data collection can provide better data training to avoid underfitting or overfitting in the training model. In addition, as more data collection is performed, supervised machine learning can be used to determine the expected prediction error rate and to understand the lowest obtainable prediction error level. Such investigation, however, is beyond the scope of the current research and can be performed in future work.
The implementation and deployment of HSPs poses multiple challenges. One of the challenges is that the UAV requires both hardware and software skills for its maintenance, which can hinder its operation by users who do not have the required technical knowledge. In this study, during data collection, the UAV’s electronic speed controller module of one of the motors was broken, which required the replacement of the module and recalibration of the UAV. In addition, at one instance, the UAV flight mode changed unexpectedly, which caused the UAV to become unstable and difficult to control and had to be corrected with a recalibration of the UAV controller channel. Moreover, after a certain flight time period, the UAV requires to be recalibrated to maintain control and low vibration. Another challenge is that the optical sensors used in this experiment require low altitude to provide valid data. Therefore, the UAV must be flown very close to the plants. This prevents the use of the UAV’s automatic mission planning that enables the UAV to fly automatically based on the given path and collect the data. Since the UAV must fly at low altitude and the height of the crop changes in different areas, there is a need to always fly the UAV manually. Although this challenge can be addressed by installing an object detection and collision prevention system on the UAV, such a system may not detect small branches, which can cause UAV to crash. In addition, object detection and collision prevention systems can remarkably increase the costs of UAVs and energy consumption, which subsequently reduces the flight time.

6. Conclusions and Future Research

This research investigated the potential benefits of integrating aerial and ground-based sensing approaches into a HSP. The field experiment results prove that the HSP can considerably improve the aerial data quality through the data validation and calibration process. The improvement in aerial data quality makes HSPs a potential solution to address some of the existing challenges of PA—in particular, the high cost and effort required in the ground-based sensing approach and low data quality of UAV-based sensors due to UAV movement and vibration. From a ground-based sensing perspective, a HSP enables us to reduce the number of required ground-based nodes by using an aerial node as a secondary source of data collection. A lower number of ground-based nodes results in a lower cost of procurement, deployment, and maintenance, which is one of the main deterrents of PA adoption. From an aerial sensing perspective, the UAV data quality can be constantly validated and calibrated using ground-based data as ground truth. Such a process ensures that UAV-based sensors constantly provide high-quality data. Therefore, it can be concluded that the integration of aerial and ground-based approaches into the HSP can improve the efficiency and effectiveness of the farm management process by reducing the cost and improving the data quality.
In our future research, we plan to take into account additional variables in sensor data calibration, including the soil composition, irrigation factors (such as irrigation frequency, volume, and ground slope), and fertilisers used. We also plan to devise machine learning-based algorithms for automatic sensor data calibration by using data sets collected from multiple farms, across regions, states, and countries. Such research will further improve the data quality, and lower the cost and effort required for PA, while at the same time improving decision making and automation processes. These advancements in IoT-based PA will help to increase food production and our ability to deal with drought and climate change.

Author Contributions

Conceptualisation, H.B., A.Y. and D.G.; Formal analysis, H.B.; Methodology, H.B.; Software, H.B. and A.Y.; Supervision, D.G. and A.Y.; Writing—original draft, H.B.; Writing—review and editing, D.G. and A.Y. All authors have read and agreed to the published version of the manuscript.

Funding

This research received no external funding.

Data Availability Statement

Not Applicable, the study does not report any data.

Conflicts of Interest

The authors declare no conflict of interest.

References

  1. Say, S.M.; Keskin, M.; Sehri, M.; Sekerli, Y.E. Adoption of precision agriculture technologies in developed and developing countries. Online J. Sci. Technol. 2018, 8, 7–15. [Google Scholar]
  2. Georgakopoulos, D.; Jayaraman, P.P. Internet of things: From internet scale sensing to smart services. Computing 2016, 98, 1041–1058. [Google Scholar] [CrossRef]
  3. Yavari, A. Internet of Things Data Contextualisation for Scalable Information Processing, Security, and Privacy. Ph.D. Thesis, RMIT University, Melbourne, Australia, 2019. [Google Scholar]
  4. Morrone, S.; Dimauro, C.; Gambella, F.; Cappai, M.G. Industry 4.0 and Precision Livestock Farming (PLF): An up to Date Overview across Animal Productions. Sensors 2022, 22, 4319. [Google Scholar] [CrossRef]
  5. Cappai, M.G.; Rubiu, N.G.; Nieddu, G.; Bitti, M.; Pinna, W. Analysis of fieldwork activities during milk production recording in dairy ewes by means of individual ear tag (ET) alone or plus RFID based electronic identification (EID). Comput. Electron. Agric. 2018, 144, 324–328. [Google Scholar] [CrossRef]
  6. Elijah, O.; Rahman, T.A.; Orikumhi, I.; Leow, C.Y.; Hindia, M.N. An overview of Internet of Things (IoT) and data analytics in agriculture: Benefits and challenges. IEEE Internet Things J. 2018, 5, 3758–3773. [Google Scholar] [CrossRef]
  7. Triantafyllou, A.; Tsouros, D.C.; Sarigiannidis, P.; Bibi, S. An architecture model for smart farming. In Proceedings of the 2019 15th International Conference on Distributed Computing in Sensor Systems (DCOSS), Santorini Island, Greece, 29–31 May 2019; pp. 385–392. [Google Scholar]
  8. Morais, R.; Silva, N.; Mendes, J.; Adão, T.; Pádua, L.; López-Riquelme, J.A.; Pavón-Pulido, N.; Sousa, J.J.; Peres, E. Mysense: A comprehensive data management environment to improve precision agriculture practices. Comput. Electron. Agric. 2019, 162, 882–894. [Google Scholar] [CrossRef]
  9. Köksal, Ö.; Tekinerdogan, B. Architecture design approach for IoT-based farm management information systems. Precis. Agric. 2019, 20, 926–958. [Google Scholar] [CrossRef]
  10. Mahbub, M. A smart farming concept based on smart embedded electronics, internet of things and wireless sensor network. Internet Things 2020, 9, 100161. [Google Scholar] [CrossRef]
  11. Ray, P.P. Internet of things for smart agriculture: Technologies, practices and future direction. J. Ambient. Intell. Smart Environ. 2017, 9, 395–420. [Google Scholar] [CrossRef]
  12. Cappai, M.G.; Rubiu, N.G.; Pinna, W. Economic assessment of a smart traceability system (RFID+ DNA) for origin and brand protection of the pork product labelled “suinetto di Sardegna”. Comput. Electron. Agric. 2018, 145, 248–252. [Google Scholar] [CrossRef]
  13. Heble, S.; Kumar, A.; Prasad, K.V.D.; Samirana, S.; Rajalakshmi, P.; Desai, U.B. A low power IoT network for smart agriculture. In Proceedings of the 2018 IEEE 4th World Forum on Internet of Things (WF-IoT), Singapore, 5–8 February 2018; pp. 609–614. [Google Scholar]
  14. Jayaraman, P.P.; Yavari, A.; Georgakopoulos, D.; Morshed, A.; Zaslavsky, A. Internet of things platform for smart farming: Experiences and lessons learnt. Sensors 2016, 16, 1884. [Google Scholar] [CrossRef]
  15. Zervopoulos, A.; Tsipis, A.; Alvanou, A.G.; Bezas, K.; Papamichail, A.; Vergis, S.; Stylidou, A.; Tsoumanis, G.; Komianos, V.; Koufoudakis, G.; et al. Wireless sensor network synchronization for precision agriculture applications. Agriculture 2020, 10, 89. [Google Scholar] [CrossRef]
  16. Popović, T.; Latinović, N.; Pešić, A.; Zečević, Ž.; Krstajić, B.; Djukanović, S. Architecting an IoT-enabled platform for precision agriculture and ecological monitoring: A case study. Comput. Electron. Agric. 2017, 140, 255–265. [Google Scholar] [CrossRef]
  17. Keswani, B.; Mohapatra, A.G.; Mohanty, A.; Khanna, A.; Rodrigues, J.J.; Gupta, D.; De Albuquerque, V.H.C. Adapting weather conditions based IoT enabled smart irrigation technique in precision agriculture mechanisms. Neural Comput. Appl. 2019, 31, 277–292. [Google Scholar] [CrossRef]
  18. Hong, G.Z.; Hsieh, C.L. Application of integrated control strategy and bluetooth for irrigating romaine lettuce in greenhouse. IFAC-PapersOnLine 2016, 49, 381–386. [Google Scholar] [CrossRef]
  19. Kim, Y.; Evans, R.G.; Iversen, W.M. Remote sensing and control of an irrigation system using a distributed wireless sensor network. IEEE Trans. Instrum. Meas. 2008, 57, 1379–1387. [Google Scholar]
  20. Ding, W.; Taylor, G. Automatic moth detection from trap images for pest management. Comput. Electron. Agric. 2016, 123, 17–28. [Google Scholar] [CrossRef]
  21. Mahlein, A.K. Plant disease detection by imaging sensors–parallels and specific demands for precision agriculture and plant phenotyping. Plant Dis. 2016, 100, 241–251. [Google Scholar] [CrossRef]
  22. Shafi, U.; Mumtaz, R.; García-Nieto, J.; Hassan, S.A.; Zaidi, S.A.R.; Iqbal, N. Precision agriculture techniques and practices: From considerations to applications. Sensors 2019, 19, 3796. [Google Scholar] [CrossRef]
  23. Uddin, M.A.; Mansour, A.; Le Jeune, D.; Aggoune, E.H.M. Agriculture internet of things: AG-IoT. In Proceedings of the 2017 27th International Telecommunication Networks and Applications Conference (ITNAC), Melbourne, Australia, 22–24 November 2017; pp. 1–6. [Google Scholar]
  24. Maddikunta, P.K.R.; Hakak, S.; Alazab, M.; Bhattacharya, S.; Gadekallu, T.R.; Khan, W.Z.; Pham, Q.V. Unmanned aerial vehicles in smart agriculture: Applications, requirements, and challenges. IEEE Sens. J. 2021, 21, 17608–17619. [Google Scholar] [CrossRef]
  25. Li, S.; Yuan, F.; Ata-UI-Karim, S.T.; Zheng, H.; Cheng, T.; Liu, X.; Tian, Y.; Zhu, Y.; Cao, W.; Cao, Q. Combining color indices and textures of UAV-based digital imagery for rice LAI estimation. Remote Sens. 2019, 11, 1763. [Google Scholar] [CrossRef]
  26. Popescu, D.; Stoican, F.; Stamatescu, G.; Ichim, L.; Dragana, C. Advanced UAV–WSN system for intelligent monitoring in precision agriculture. Sensors 2020, 20, 817. [Google Scholar] [CrossRef] [PubMed]
  27. Cambra, C.; Sendra, S.; Lloret, J.; Garcia, L. An IoT service-oriented system for agriculture monitoring. In Proceedings of the 2017 IEEE International Conference on Communications (ICC), Paris, France, 21–25 May 2017; pp. 1–6. [Google Scholar]
  28. Saha, A.K.; Saha, J.; Ray, R.; Sircar, S.; Dutta, S.; Chattopadhyay, S.P.; Saha, H.N. IOT-based drone for improvement of crop quality in agricultural field. In Proceedings of the 2018 IEEE 8th Annual Computing and Communication Workshop and Conference (CCWC), Las Vegas, NV, USA, 8–10 January 2018; pp. 612–615. [Google Scholar]
  29. Tan, L.; Hou, H.; Zhang, Q. An extensible software platform for cloud-based decision support and automation in precision agriculture. In Proceedings of the 2016 IEEE 17th International Conference on Information Reuse and Integration (IRI), Pittsburgh, PA, USA, 28–30 July 2016; pp. 218–225. [Google Scholar]
  30. Pathak, R.; Barzin, R.; Bora, G.C. Data-driven precision agricultural applications using field sensors and Unmanned Aerial Vehicle. Int. J. Precis. Agric. Aviat. 2018, 1, 19–23. [Google Scholar] [CrossRef]
  31. Joalland, S.; Screpanti, C.; Varella, H.V.; Reuther, M.; Schwind, M.; Lang, C.; Walter, A.; Liebisch, F. Aerial and ground based sensing of tolerance to beet cyst nematode in sugar beet. Remote Sens. 2018, 10, 787. [Google Scholar] [CrossRef]
  32. Idbella, M.; Iadaresta, M.; Gagliarde, G.; Mennella, A.; Mazzoleni, S.; Bonanomi, G. Agrilogger: A new wireless sensor for monitoring agrometeorological data in areas lacking communication networks. Sensors 2020, 20, 1589. [Google Scholar] [CrossRef]
  33. Deng, F.; Zuo, P.; Wen, K.; Wu, X. Novel soil environment monitoring system based on RFID sensor and LoRa. Comput. Electron. Agric. 2020, 169, 105169. [Google Scholar] [CrossRef]
  34. Ivushkin, K.; Bartholomeus, H.; Bregt, A.K.; Pulatov, A.; Franceschini, M.H.; Kramer, H.; van Loo, E.N.; Roman, V.J.; Finkers, R. UAV based soil salinity assessment of cropland. Geoderma 2019, 338, 502–512. [Google Scholar] [CrossRef]
  35. Pérez-Ortiz, M.; Peña, J.; Gutiérrez, P.A.; Torres-Sánchez, J.; Hervás-Martínez, C.; López-Granados, F. A semi-supervised system for weed mapping in sunflower crops using unmanned aerial vehicles and a crop row detection method. Appl. Soft Comput. 2015, 37, 533–544. [Google Scholar] [CrossRef]
  36. Ucuz, D.; Muhammed, A.S. Comparison of the IoT platform vendors, microsoft Azure, Amazon web services, and Google cloud, from users’ perspectives. In Proceedings of the 2020 8th International Symposium on Digital Forensics and Security (ISDFS), Beirut, Lebanon, 1–2 June 2020; pp. 1–4. [Google Scholar]
  37. Yavari, A.; Jayaraman, P.P.; Georgakopoulos, D.; Nepal, S. ConTaaS: An Approach to Internet-Scale Contextualisation for Developing Efficient Internet of Things Applications. In Proceedings of the Hawaii International Conference on System Sciences 2017 (HICSS-50), Hilton Waikoloa Village, HI, USA, 4–7 January 2017. [Google Scholar]
Figure 1. Architecture of HSP for IoT-based precision agriculture.
Futureinternet 14 00233 g001
Figure 2. Plant observation component design.
Futureinternet 14 00233 g002
Figure 3. Aerial node components: (a) quadcopter UAV, (b) sensing component including RGB, infrared, spectrometer, and ultrasonic proximity sensors.
Futureinternet 14 00233 g003
Figure 4. Aerial node design.
Futureinternet 14 00233 g004
Figure 5. Aerial minimum, average, and maximum temperature compared with ground-based temperature.
Futureinternet 14 00233 g005
Figure 6. Aerial minimum, average, and maximum humidity compared with ground-based humidity.
Futureinternet 14 00233 g006
Figure 7. Aerial infrared data compared with ground-based infrared data.
Futureinternet 14 00233 g007
Figure 8. Scatter plot of aerial infrared data and ground-based infrared data.
Futureinternet 14 00233 g008
Figure 9. Linear regression pattern between aerial infrared data and ground-based infrared data.
Futureinternet 14 00233 g009
Figure 10. Aerial spectrometer channels’ correlation coefficients with corresponding ground-based channels.
Futureinternet 14 00233 g010
Figure 11. Aerial green, yellow, and NIR channel data compared with corresponding ground-based channel data.
Futureinternet 14 00233 g011
Figure 12. Aerial green, yellow, and NIR channel data distance from corresponding ground-based channel data.
Futureinternet 14 00233 g012
Figure 13. Original and calibrated aerial temperature data compared with ground-based data.
Futureinternet 14 00233 g013
Figure 14. Original and calibrated aerial humidity data compared with ground-based data.
Futureinternet 14 00233 g014
Figure 15. Original and calibrated aerial infrared data compared with ground-based data.
Futureinternet 14 00233 g015
Figure 16. Comparison of aerial and ground-based spectrometer green, yellow, and NIR channel data from target plant.
Futureinternet 14 00233 g016
Figure 17. Comparison of aerial and ground-based spectrometer green, yellow, and NIR channel data from target plant during morning cycles before calibration.
Futureinternet 14 00233 g017
Figure 18. Comparison of aerial and ground-based spectrometer green, yellow, and NIR channel data from target plant during morning cycles after calibration.
Futureinternet 14 00233 g018
Table 1. Comparison of IoT-based precision agriculture sensing approaches.
Sensing ApproachAdvantagesDisadvantages
Aerial
  • High coverage due to mobility
  • Low cost due to lower number of sensing nodes required
  • Limited flight time
  • Non-continuous data collection
  • Lower data quality due to UAV movement and vibration
Ground-based
  • High data accuracy due to sensor proximity to plants
  • Continuous data collection
  • High cost of procurement, deployment and maintenance
  • Low coverage due to immobility
  • Prone to environmental damages
Table 2. Observation contexts and related variables.
Observation ContextObservation Context Variables
UAV CharacteristicsVibration, Altitude, Acceleration, UAV Cyclone
Environmental CharacteristicsOvercast, Rain, Wind Speed, Wind Gust, Solar Radiation
Table 3. Aerial temperature correlation coefficient and linear regression with ground-based temperature.
Aerial TemperatureCorrelation Coefficient with Ground-Based TemperatureLinear Regression with Ground-Based Temperature (Coefficient of Determination/R2)
Minimum0.970.93
Average0.940.88
Maximum0.880.78
Table 4. Aerial humidity correlation coefficient and linear regression with ground-based humidity.
Aerial HumidityCorrelation Coefficient with Ground-Based HumidityLinear Regression with Ground-Based Humidity (Coefficient of Determination/R2)
Minimum0.880.77
Average0.940.88
Maximum0.980.95
Table 5. Aerial green, yellow, and NIR channel linear regression with corresponding ground-based channel data.
Aerial Spectrometer Channel Data (Predictor Variable)Linear Regression with Corresponding Ground-based Spectrometer Channel Data (Coefficient of Determination/R2)
Channel E (Green)0.56
Channel H (Yellow)0.46
Channel O (NIR)0.52
Table 6. Aerial temperature and humidity intercept, line slope, and Euclidean distance before calibration.
Aerial and Ground-Based DataInterceptLine SlopeEuclidean Distance Before Calibration
Temperature1.630.8014.50
Humidity6.510.9537.09
Table 7. Aerial and ground-based infrared data comparison based on different time cycles and observation context variables.
CyclesSolar Radiation Average w/m2Wind Speed Average km/hWind Gust Average km/hAerial and Ground-Based Infrared Data CorrelationAerial and Ground-Based Infrared Data Linear Regression R2
All357.113.320.50.910.83
Morning74.39.114.10.890.79
Afternoon757.714.921.30.750.56
Evening252.115.224.70.920.85
Table 8. Aerial and ground-based spectrometer data comparison. based on different time cycles and observation context variables.
CyclesSolar Radiation Average w/m2Wind Speed Average km/hWind Gust Average km/hAerial Channels Correlation with Ground-Based ChannelsAerial Channels Linear Regression with Ground-Based Channels R2
All357.113.320.5E: 0.75, H: 0.68, O: 0.72E: 0.56, H: 0.46, O: 0.52
Morning74.39.114.1E: 0.75, H: 0.76, O: 0.74E: 0.56, H: 0.57, O: 0.55
Afternoon757.714.921.3E: −0.25, H: −0.35, O: −0.28E: 0.06, H: 0.12, O: 0.08
Evening252.115.224.7E: 0.37, H: 0.41, O: 0.38E: 0.13 H: 0.16, O: 0.14
Table 9. Aerial and ground-based spectrometer intercept, line slope, and Euclidean distance before calibration.
Aerial and Ground-Based DataInterceptLine SlopeEuclidean Distance before Calibration
Channel E (Green)1.460.13823
Channel H (Yellow)4.400.13746
Channel O (NIR)20.700.133407
Publisher’s Note: MDPI stays neutral with regard to jurisdictional claims in published maps and institutional affiliations.

