1. Introduction
As the economy continues to develop, both in urban and rural areas, the number of traffic participants increases significantly, resulting in traffic congestion. Therefore, traffic control and management strategies need to be developed to alleviate frequent and unusual traffic congestion [
1]. Frequent congestion refers to predictable situations where demand exceeds the capacity of the transportation system, such as during a daily rush hour. Extreme traffic congestion is often caused by unpredictable accidents such as traffic accidents, crowd gatherings, fires, and weather-related problems. It is very important to provide drivers and traffic managers with traffic situation information in real time and efficiently for severe congestion [
2]. Then, for city managers, it is of great significance to sense and deal with abnormal traffic incidents in the city in time to prevent the launch of serious incidents, and this can also improve the timely feedback and rescue efficiency of relevant departments for abnormal incidents [
3]. On the other hand, urban traffic anomaly detection is also important for improving people’s quality of life. For example, traffic congestion is now the biggest headache in most big cities [
4]. Serious traffic jams will bring a lot of economic losses and destroy people’s moods. If most traffic jams in a city can be detected at an early stage, by informing people of traffic conditions in advance, people can further avoid traffic jams from becoming serious by changing their travel plans or travel patterns [
5].
For a long time in the past, manual detection was the main method of urban road traffic incident detection to a certain extent, such as the use of surveillance video manual inspection, highway patrol cars, and telephone alarm methods to monitor traffic incidents. The manual inspection method is time-consuming and labor-intensive, the detection efficiency is low, the accuracy rate is not high, and road inspections generally take place on long roads, so the interval between patrols at the same location is long, and traffic incidents cannot be detected in time. With the development of automatic monitoring technology, many areas have deployed automatic detection technology for roadside surveillance equipment, and such technology has effectively improved the efficiency of event detection. However, the detection task is still limited by the installation density of roadside devices; it is impossible to install roadside devices in every place. Therefore, roadside surveillance devices always have blind spots, and it is difficult to detect and deal with traffic events occurring in the blind spots at the first instance.
In summary, existing traffic event detectors are difficult to use in all directions because the equipment cannot be moved. In addition, nowadays, more and more cameras of smart vehicles, as well as the driving recorders installed in traditional cars, can be our potential traffic event detectors. In this study, we propose to use the incoming image data from cameras installed on smart vehicles for edge-side event detection, an approach that can effectively increase the range and improve the granularity of urban traffic event sensing. This solves the problem of traditional traffic event detection devices often being installed on roadside devices, which are limited by the installation density of the devices and make it difficult to detect road events in all directions.
The rest of the paper is structured as follows.
Section 2 presents the related work;
Section 3 describes and explains the proposed method;
Section 4 will reveal and discuss the proposed model and results;
Section 5 analyzes and discusses the results; finally,
Section 6 summarizes the work of this paper.
2. Related Work
The existing automatic detection technology collects data through toroidal coils or ultrasonic detectors and then processes the data. The existing traffic incident detection methods are mainly divided into the following categories:
- 1.
Detection algorithm based on statistical theory.
In this kind of method, the sensor counts the number of passing vehicles per unit of time and indirectly calculates the algorithm of the traffic state [
6,
7,
8]. It has the advantages of low cost, all-weather, etc. The current road traffic congestion level can be identified by simply analyzing the collected data. For example, by applying mathematical algorithms to these measurements, unexpected traffic flow characteristics up and down suspicious locations can be identified and flagged as traffic incidents.
- 2.
Predict the state of traffic incidents through a time series model.
This type of approach uses time-series analysis to detect traffic anomalies using features such as real-time traffic, predicted normal traffic, and the difference between the two. Chaos, Solitons and Fractals [
9] use nonlinear time-series models to predict traffic states. Jiang S, Wang S, and Li Z [
10] analyzed traffic flow time series by clustering traffic time series with similar fluctuation patterns. Wang J and Li X [
11] proposed a technique that combines time series analysis and machine learning to improve the accuracy and efficiency of traffic incidents.
- 3.
Through social network algorithms.
With the rise of social networking tools, social networking species contain rich traffic condition information. Some scholars [
12,
13] have extracted information entries and positioning of traffic accidents, traffic congestion, and other information shared by twitter residents, and detected traffic conditions and traffic incidents.
- 4.
Video monitoring through the bayonet.
With the development of the road intelligent transportation system, many roadside monitoring devices have been built on urban roads and highways for traffic monitoring. Some scholars [
14,
15] have detected and tracked road traffic incidents through the video monitoring of roadside devices.The advantage of this method is that the roadside equipment has strong computing power and fast detection speed. The disadvantage is that the roadside equipment may be blocked by tree branches, and the detection accuracy is easily affected in bad weather conditions. In addition, limited by roadside equipment, it is impossible to realize accurate perception and intelligent control of traffic operation situations, and it cannot provide large-scale, real-time feedback on traffic accident conditions and temporary traffic emergencies.
In recent years, there has been continuous improvement of road infrastructure and the large-scale erection of urban monitoring systems. Many scholars use machine vision technology to detect road traffic incidents based on video information collected by roadside monitoring equipment [
16,
17,
18,
19,
20,
21]. However, machine vision methods have low performance and speed in real-time disease detection due to complex image preprocessing and feature extraction steps. Furthermore, an important disadvantage of such methods is that they are not suitable for real detection scenarios with complex backgrounds. With the increasing application of models represented by deep convolutional neural networks in the direction of computer vision, such as autonomous driving, face recognition, and object detection in industrial scenarios, traffic incident detection methods based on deep learning were also quickly applied. At present, the object detection methods based on deep learning are mainly divided into two categories according to the network structure. One is a one-stage detection method represented by YOLO [
22,
23,
24,
25,
26], and the other is represented by R-CNN [
27,
28,
29], a two-stage method. The single-stage method directly uses the network to extract recognition features to generate prediction boxes, and the advantage is that the detection speed is fast. The two-stage method first generates quasi-candidate boxes, and then further generates prediction boxes according to feature extraction. Liang, Haoxiang et al. [
30] proposed a fast detection algorithm for traffic accidents based on the spatiotemporal map of vehicle trajectories.
However, real-time early detection of traffic incidents is still challenging due to different vehicle types, large differences in vehicle color and size, complex urban scene backgrounds, different illumination in all-weather detection, and blocking of dense vehicles and pedestrians in the lane. Furthermore, weather changes in the real environment, as well as several other factors, make it difficult to detect with high accuracy [
31]. In addition, existing traffic incident detection models have a trade-off between accuracy and efficiency detection. Last but not least, the existing detection is based on fixed roadside monitoring equipment, and there is a blind spot in the detection of traffic incidents. When traffic anomalies are detected, the traffic incident has often occurred for a period, which is not conducive to rescue and traffic flow induction. Therefore, there is a large gap between existing models and real-time incident detection in field traffic based on mobile computing devices.
3. Data and Methods
3.1. Dataset Production
There is no applicable dataset for traffic event target detection, and the current open-source image samples are generally vehicle and pedestrian data sets such as KITTI data sets, which make it difficult to meet the needs of traffic incident detection. Therefore, the data set is established by acquiring pictures by supplementing the network picture crawler, road shooting, KITTI data set [
32,
33], and KMU Fire & Smoke Database [
34,
35,
36,
37,
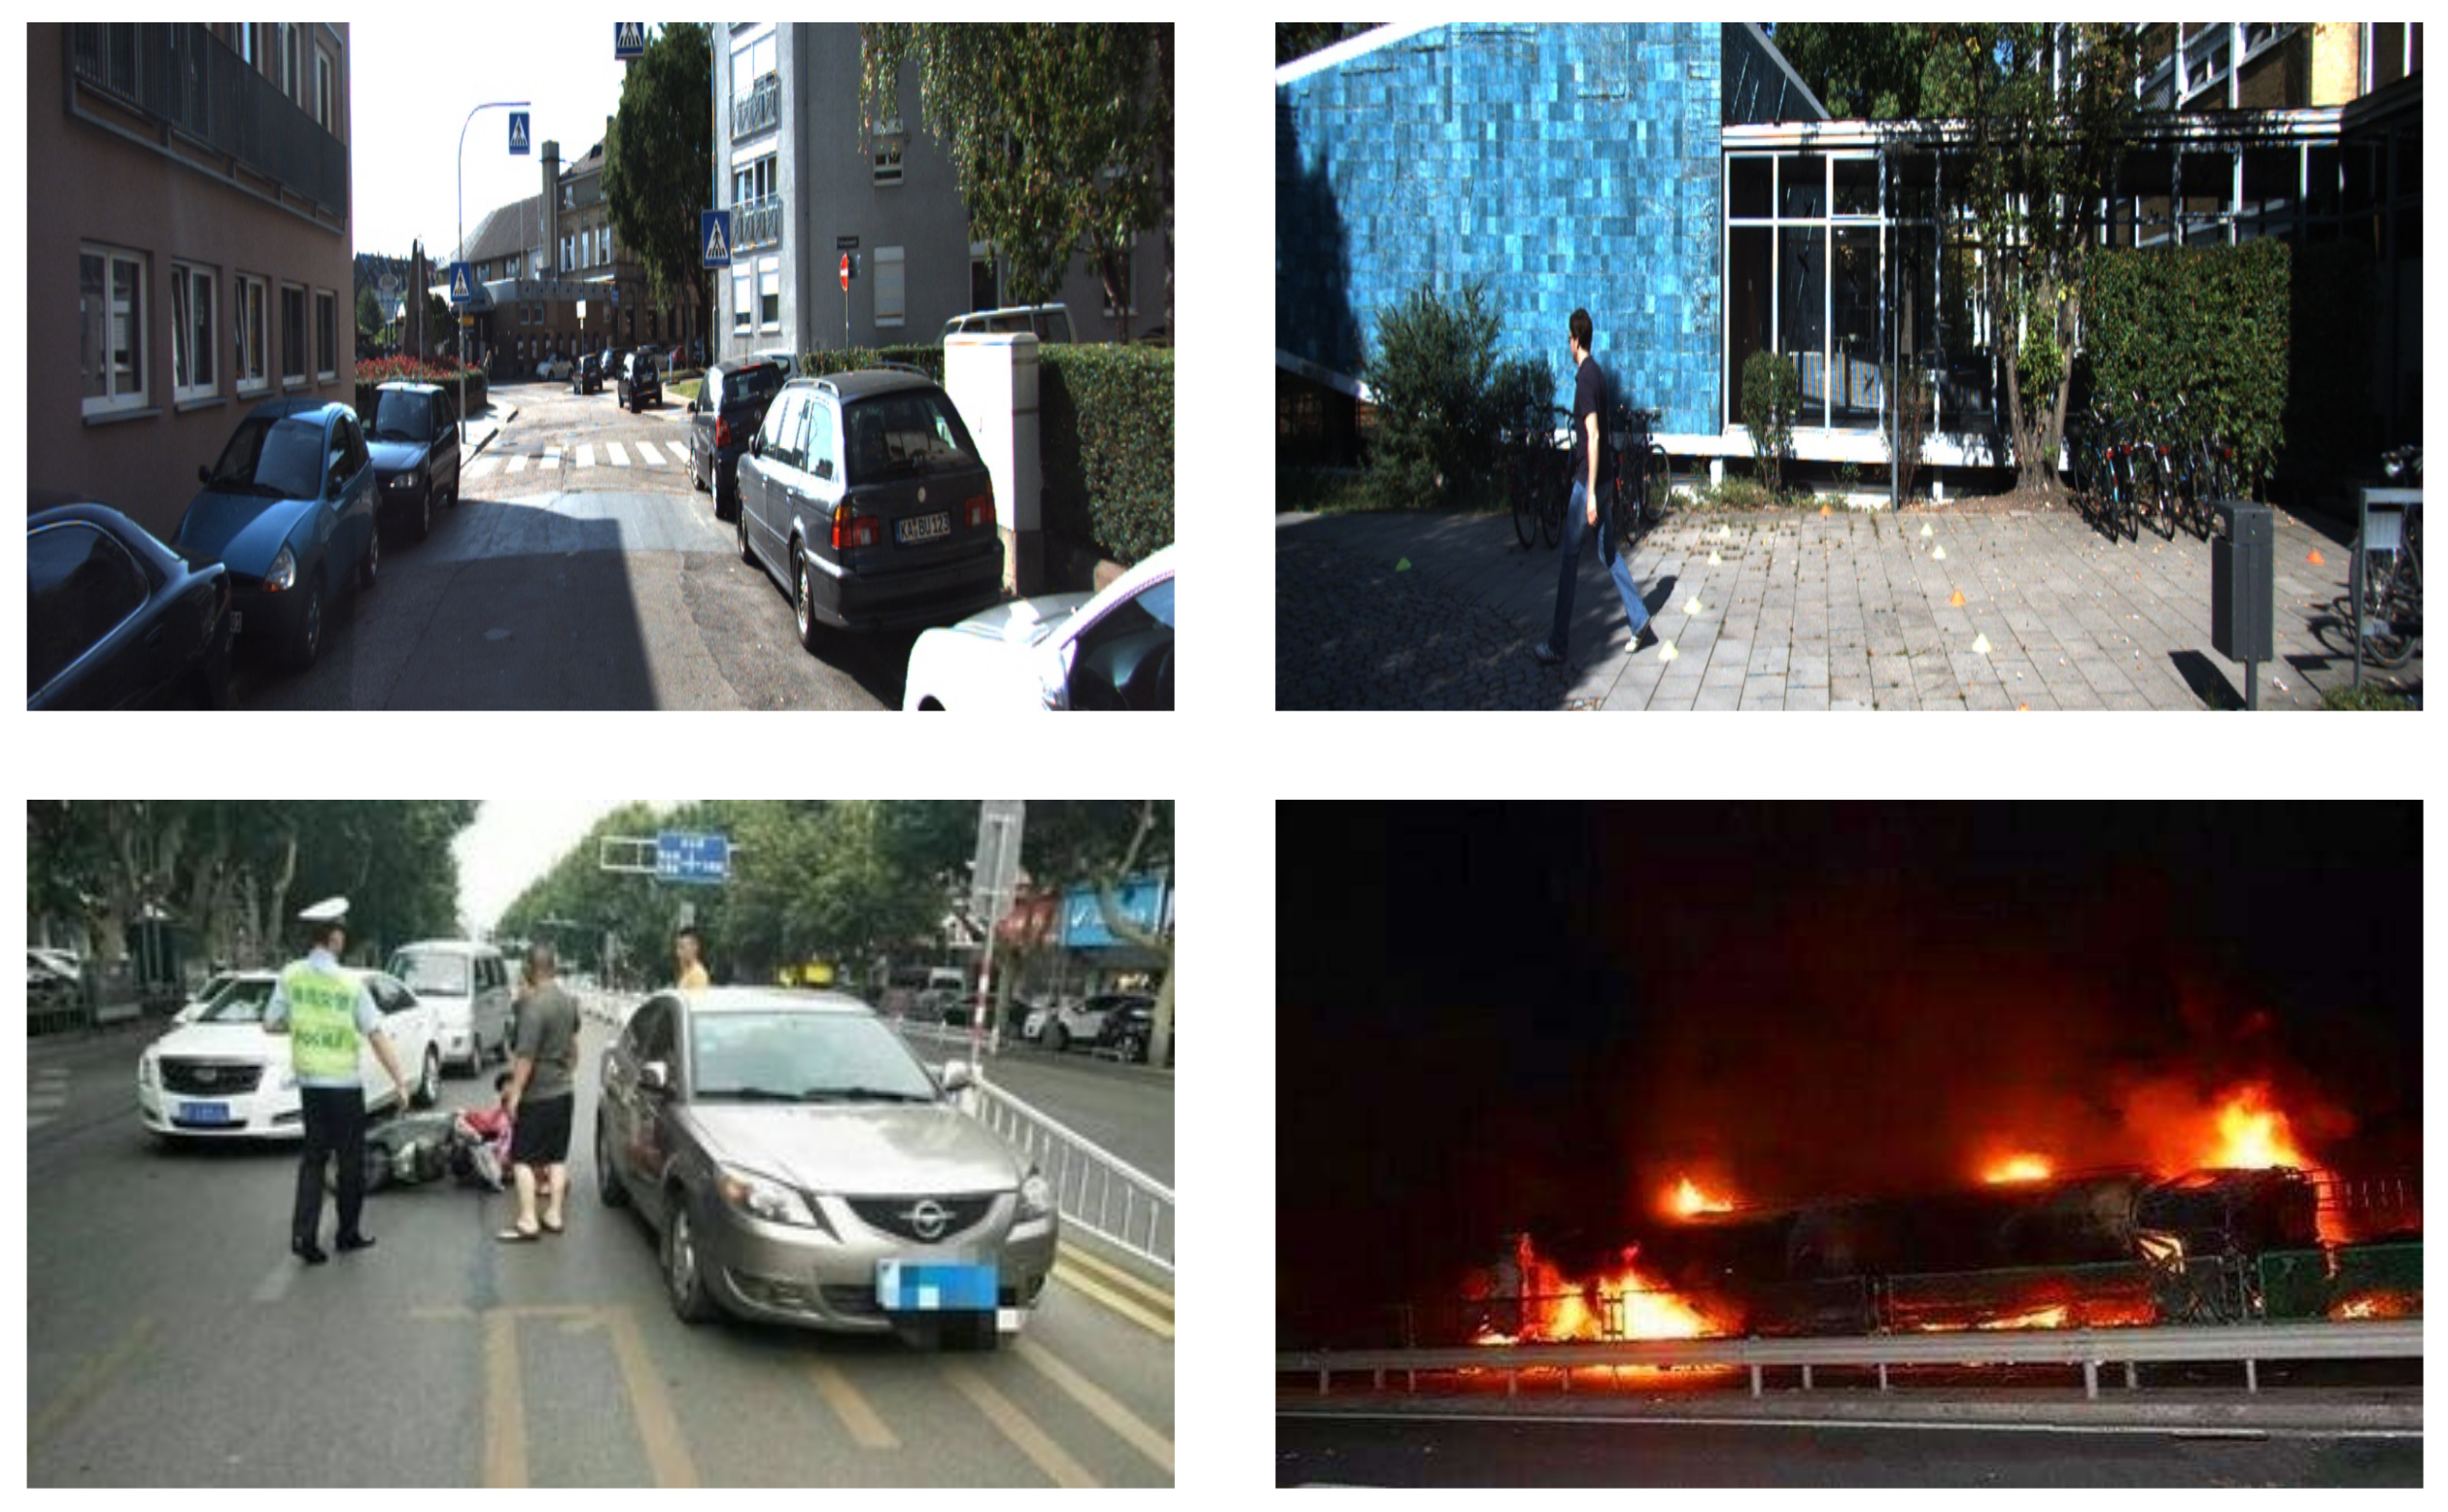
38] data set. The KITTI dataset provides real-world picture data taken in urban, rural, and highway environments, with up to 15 cars and 30 pedestrians in each image with varying degrees of occlusion and truncation. The KMU Fire & Smoke Database dataset contains four categories of data such as indoor and outdoor (short-range) flames, indoor and outdoor (short-range smoke), wildfire smoke, and smoke or flaming moving objects. In addition, we use search engines in different countries to crawl traffic accident pictures and select some pictures from the above datasets to form our dataset. Sorting and screening invalid pictures and pictures that are difficult to label, a total of 8890 valid pictures were screened. After labeling with the labeling software, it counts the labeled image labels. The following
Figure 1 shows an example of different categories of objects in the dataset.
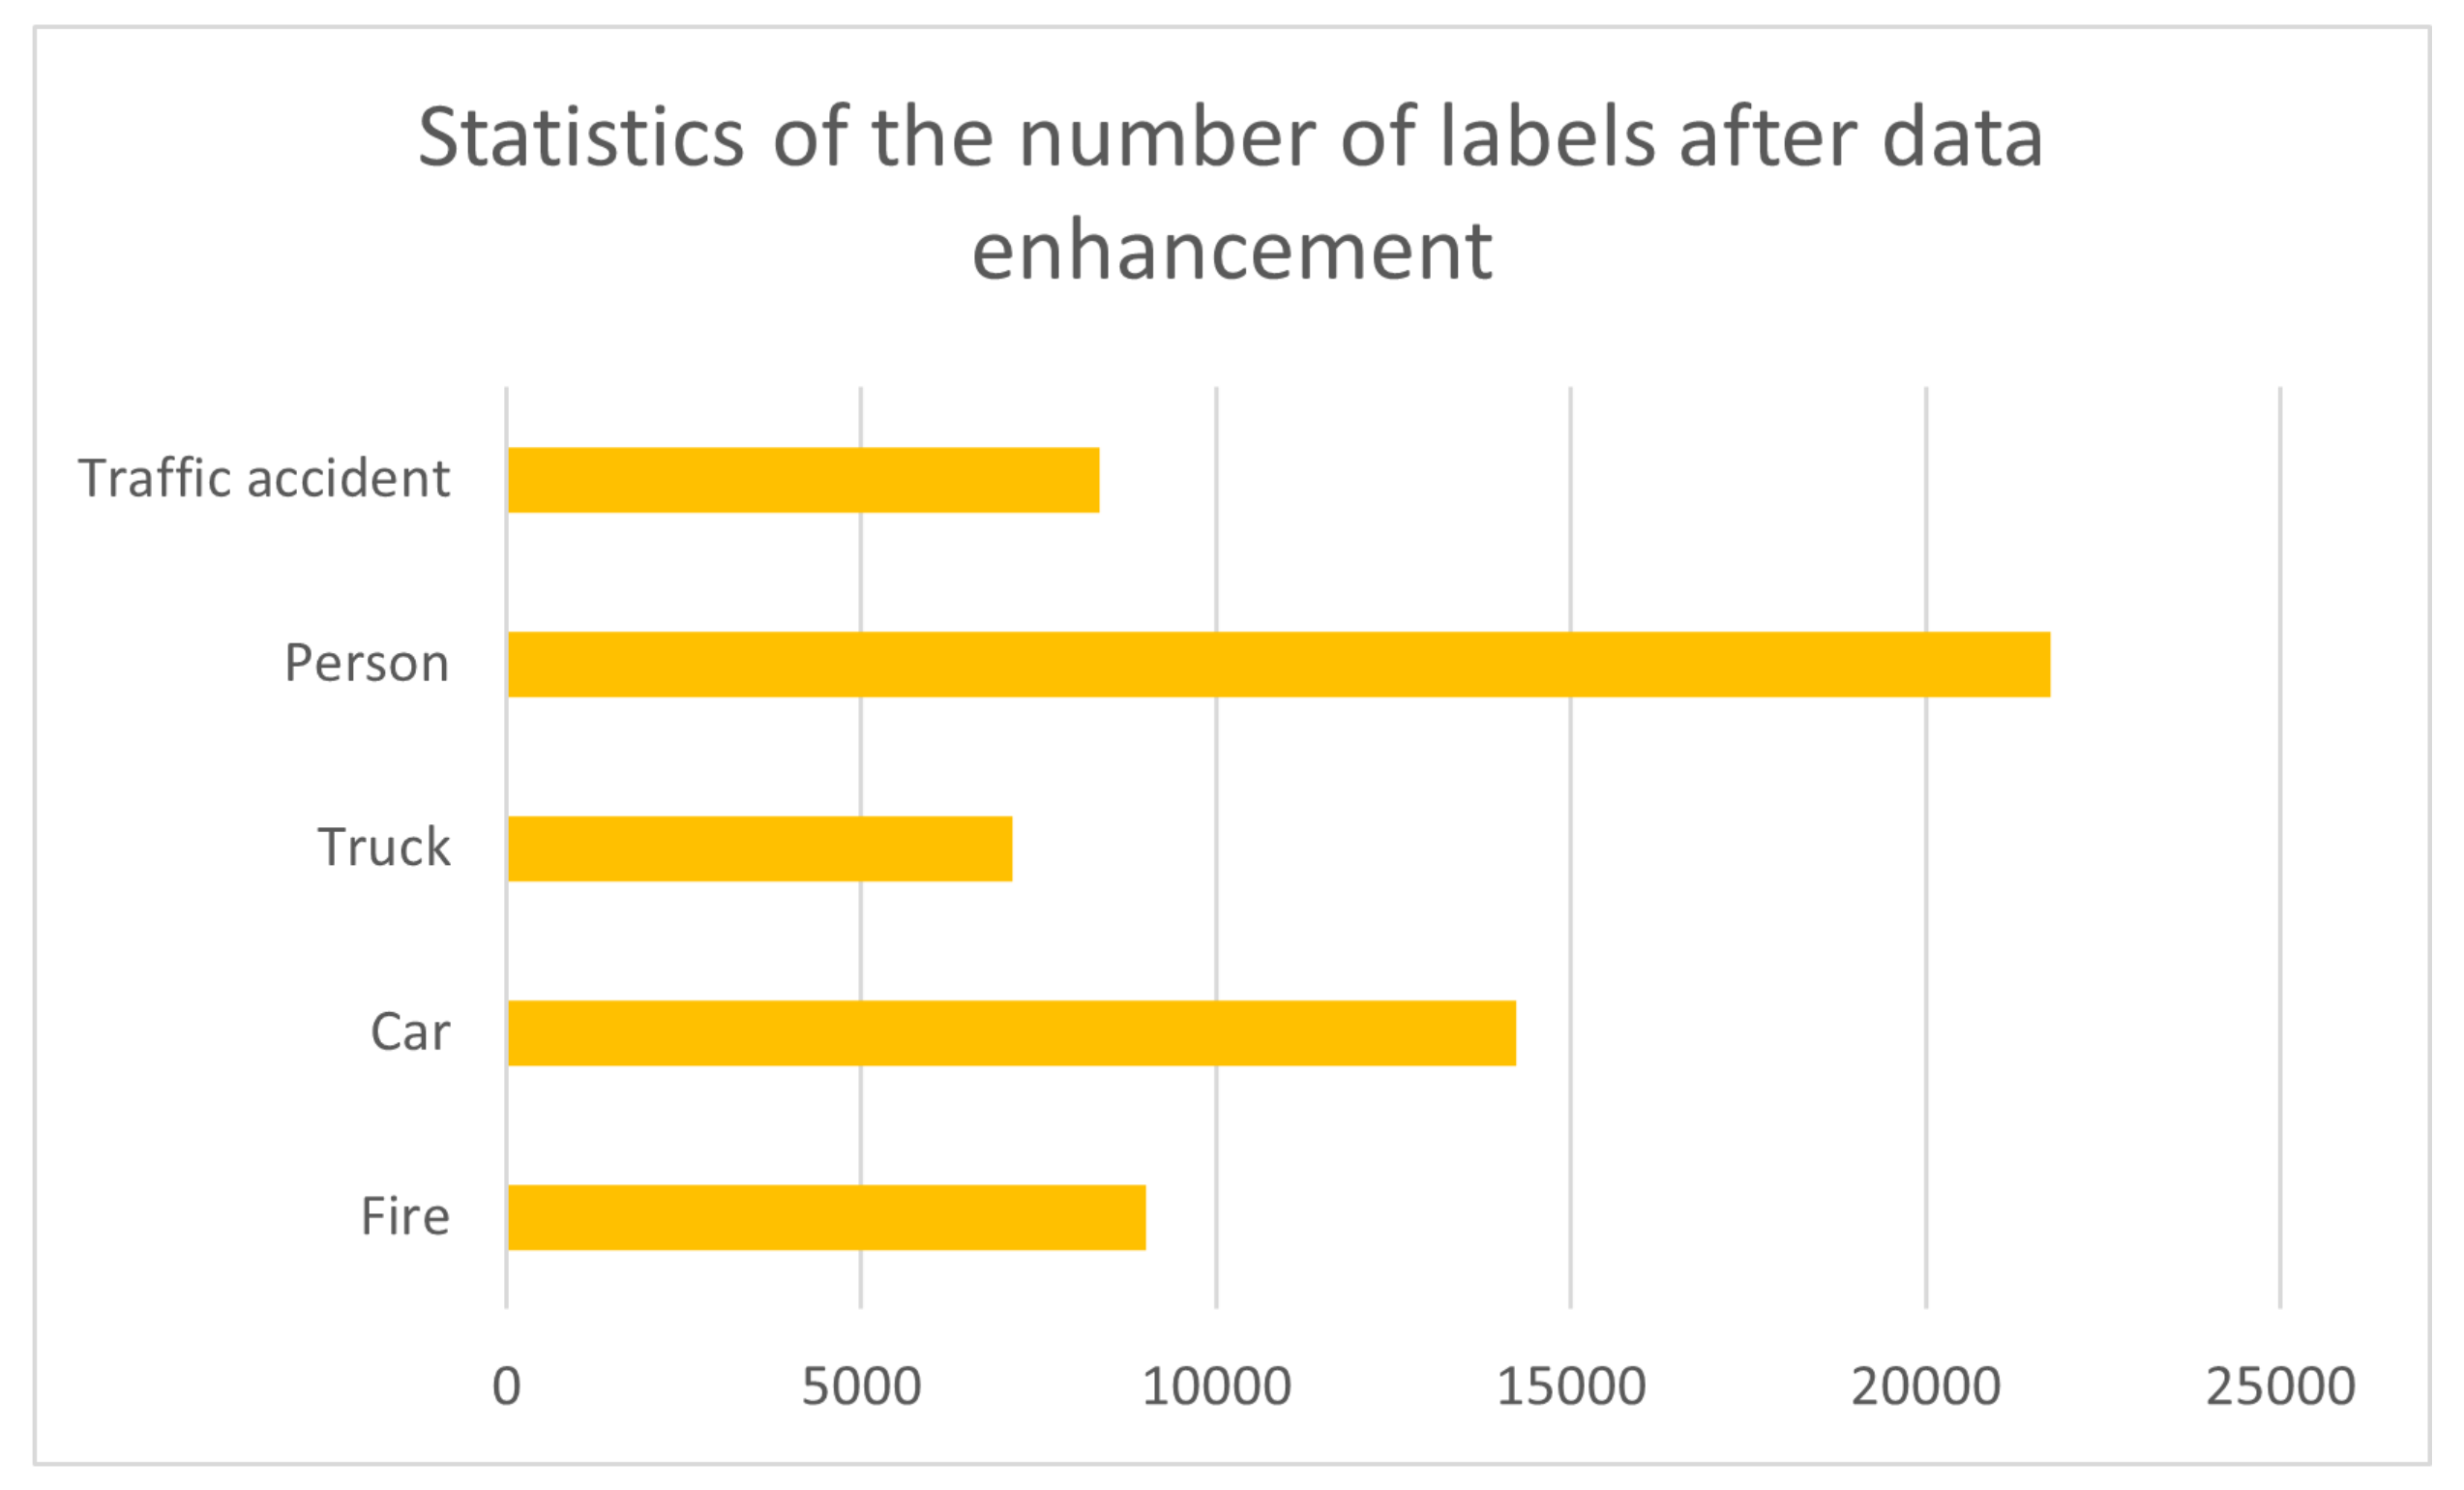
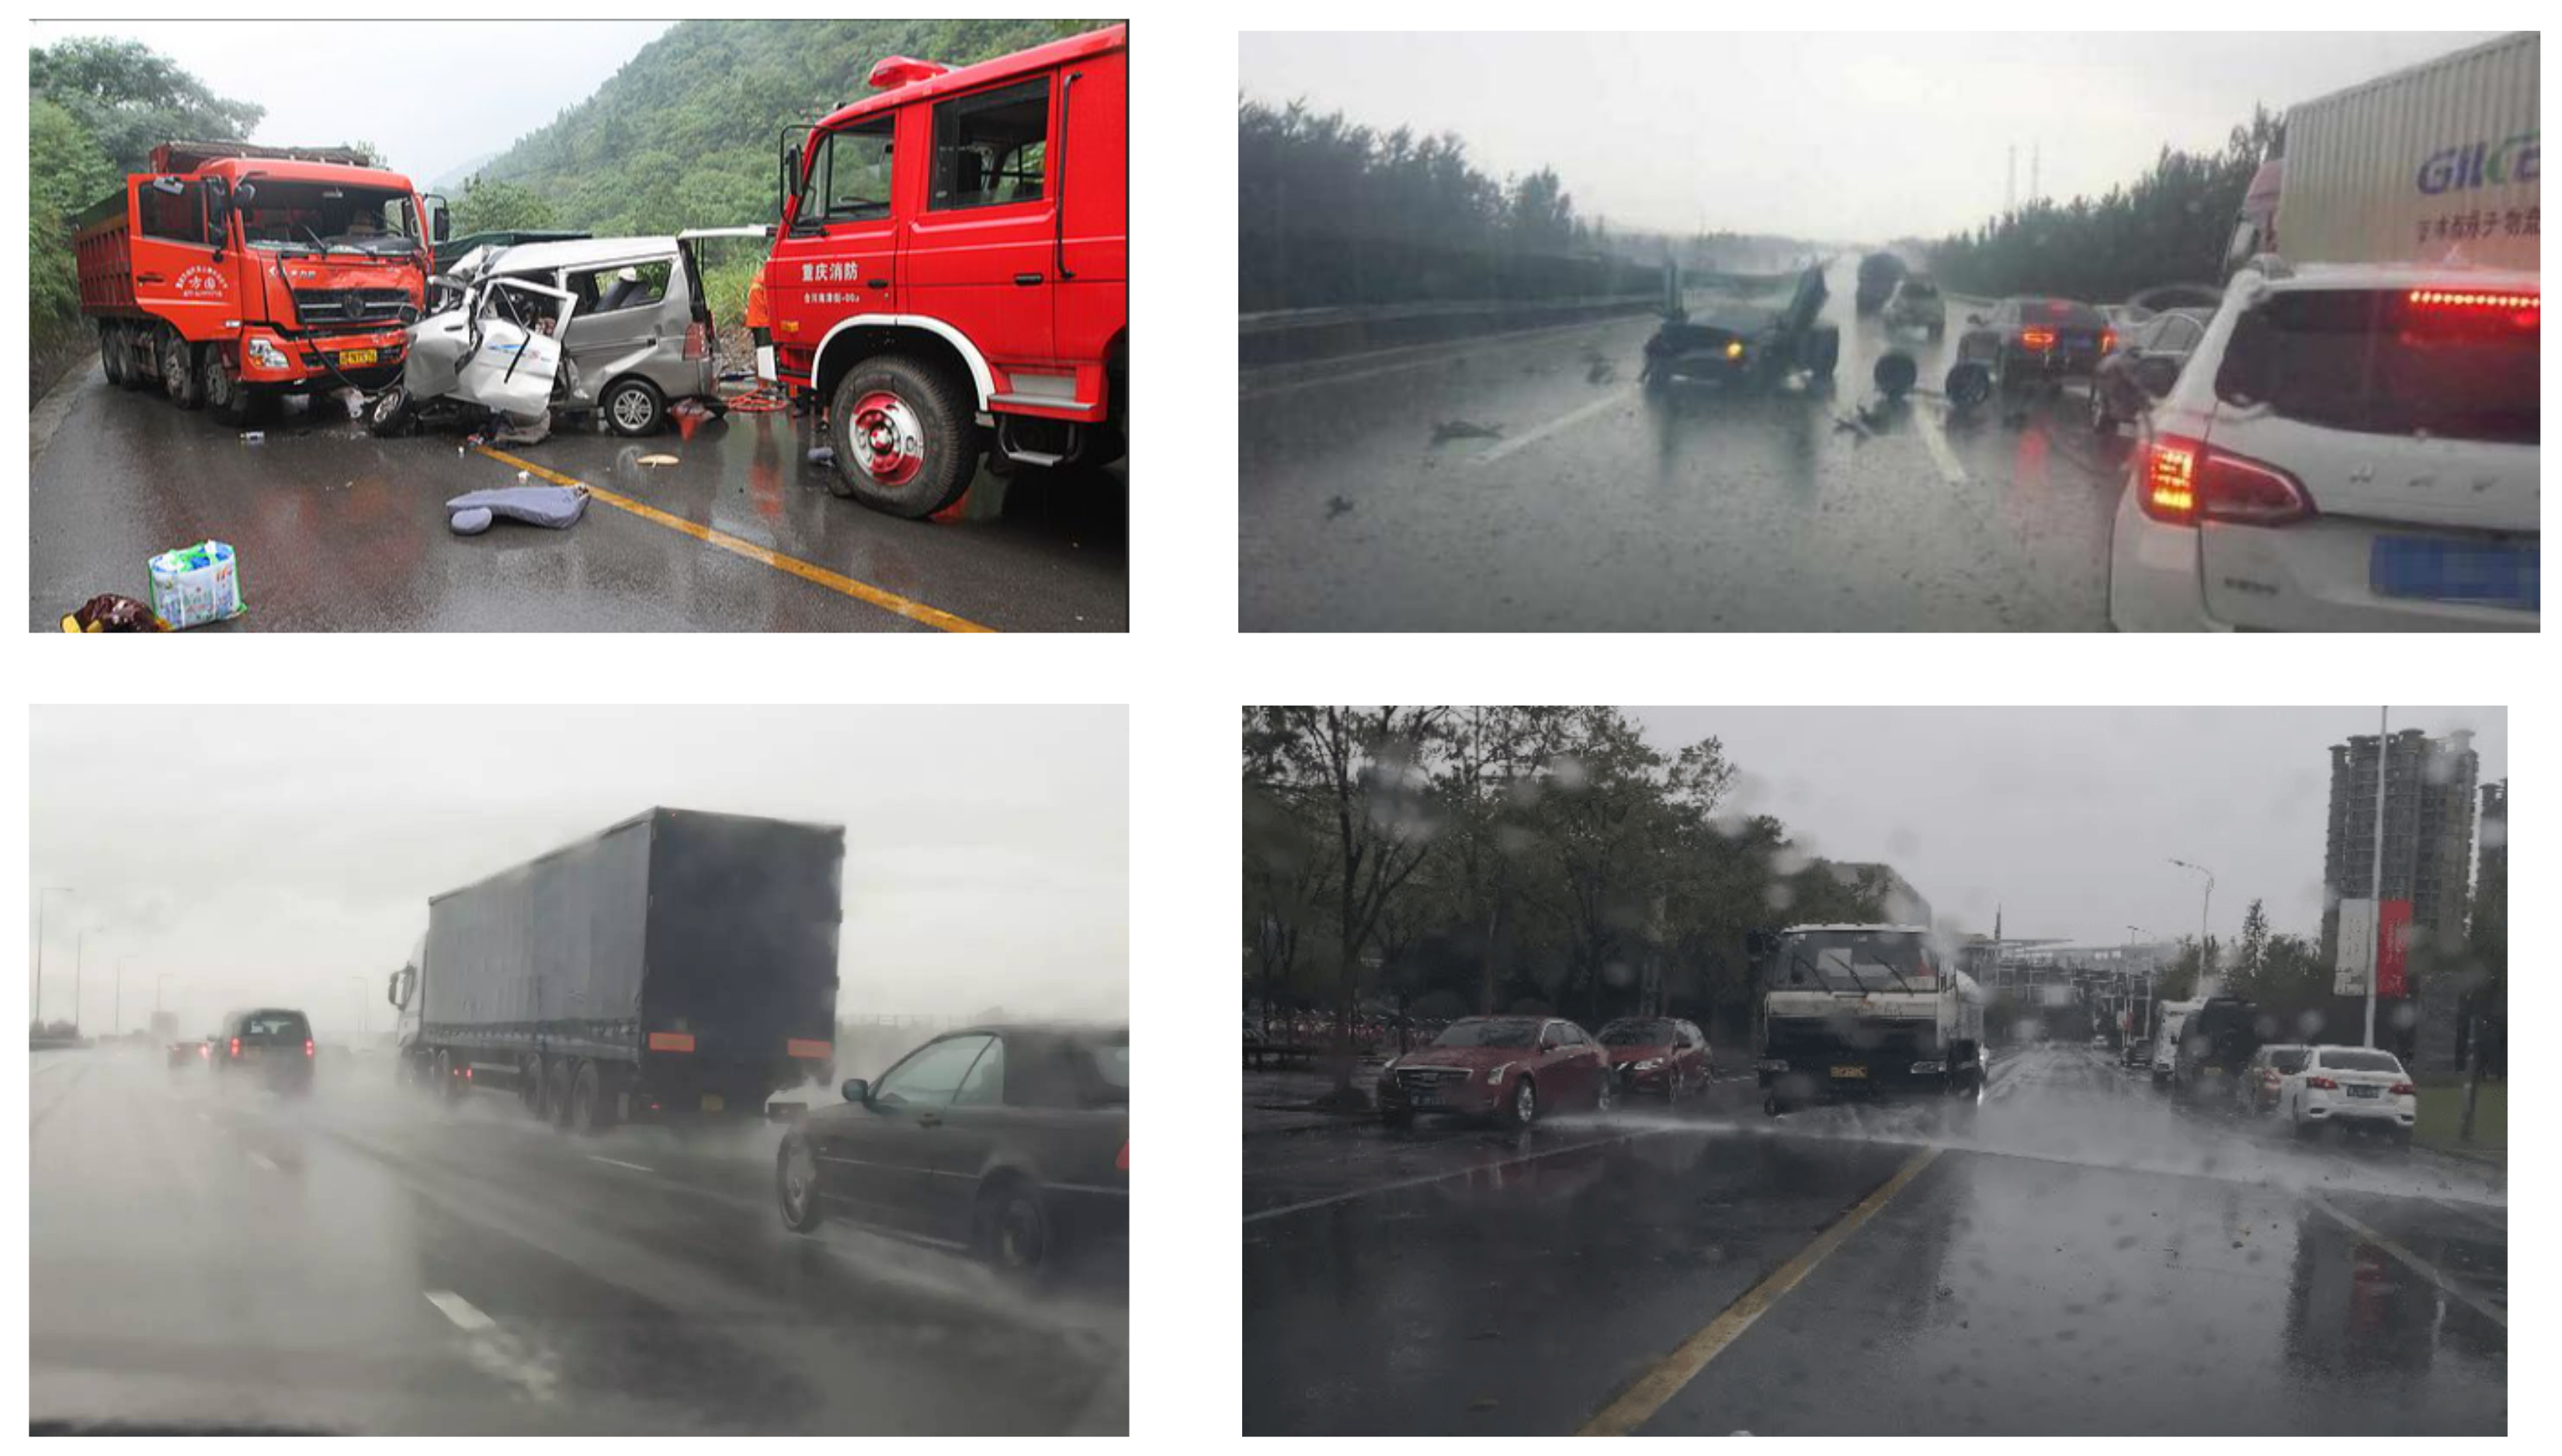
In order to achieve better practical detection of convolutional neural networks, a data augmentation method is used to make the network label categories more balanced. Based on the distribution of the different types of existing labels, we target categories with a low number of labels (e.g., trucks, traffic accidents) and add images containing such labels. In the process of adding samples, we selectively added images in rain and fog scenes, as shown in
Figure 2. The statistics of each type of label after enhancement are shown in
Figure 3.
3.2. Neural Networks
In the current work, Since our application scenario is at the edge of the vehicle with limited computing power, we need to choose a more lightweight model. YOLOv5s model has the advantages of high detection accuracy, small number of parameters and fast detection speed among the lightweight models. We utilize an improved model based on the initialized YOLOv5s algorithm for traffic incident detection. Using the Pytorch framework, Glenn Jocher has suggested the high-precision, single-stage YOLOv5 object identification model. It transforms the object identification job into a regression problem by generating the bounding box coordinates and associated probabilities for each class. The images are fed into the network and the samples are enhanced using a mosaic technique to make the model training better. Then, the focus operation is performed to slice the image to reduce the loss of information. A CSPNet [
39] structure is added to the backbone network to connect convolution layers at different stages to reduce information loss. Downsampling is carried out using the GhostNet [
40] module, reducing the number of parameters. The network’s ability to extract effective features is enhanced by adding a fused attention mechanism module at the end of the neck. In the feature detection stage, multiple feature maps are extracted, and the path aggregation network is utilized to shorten the information path by utilizing the shallow layer’s localization information to facilitate the extraction of feature information at different scales and enhance the detection efficiency.
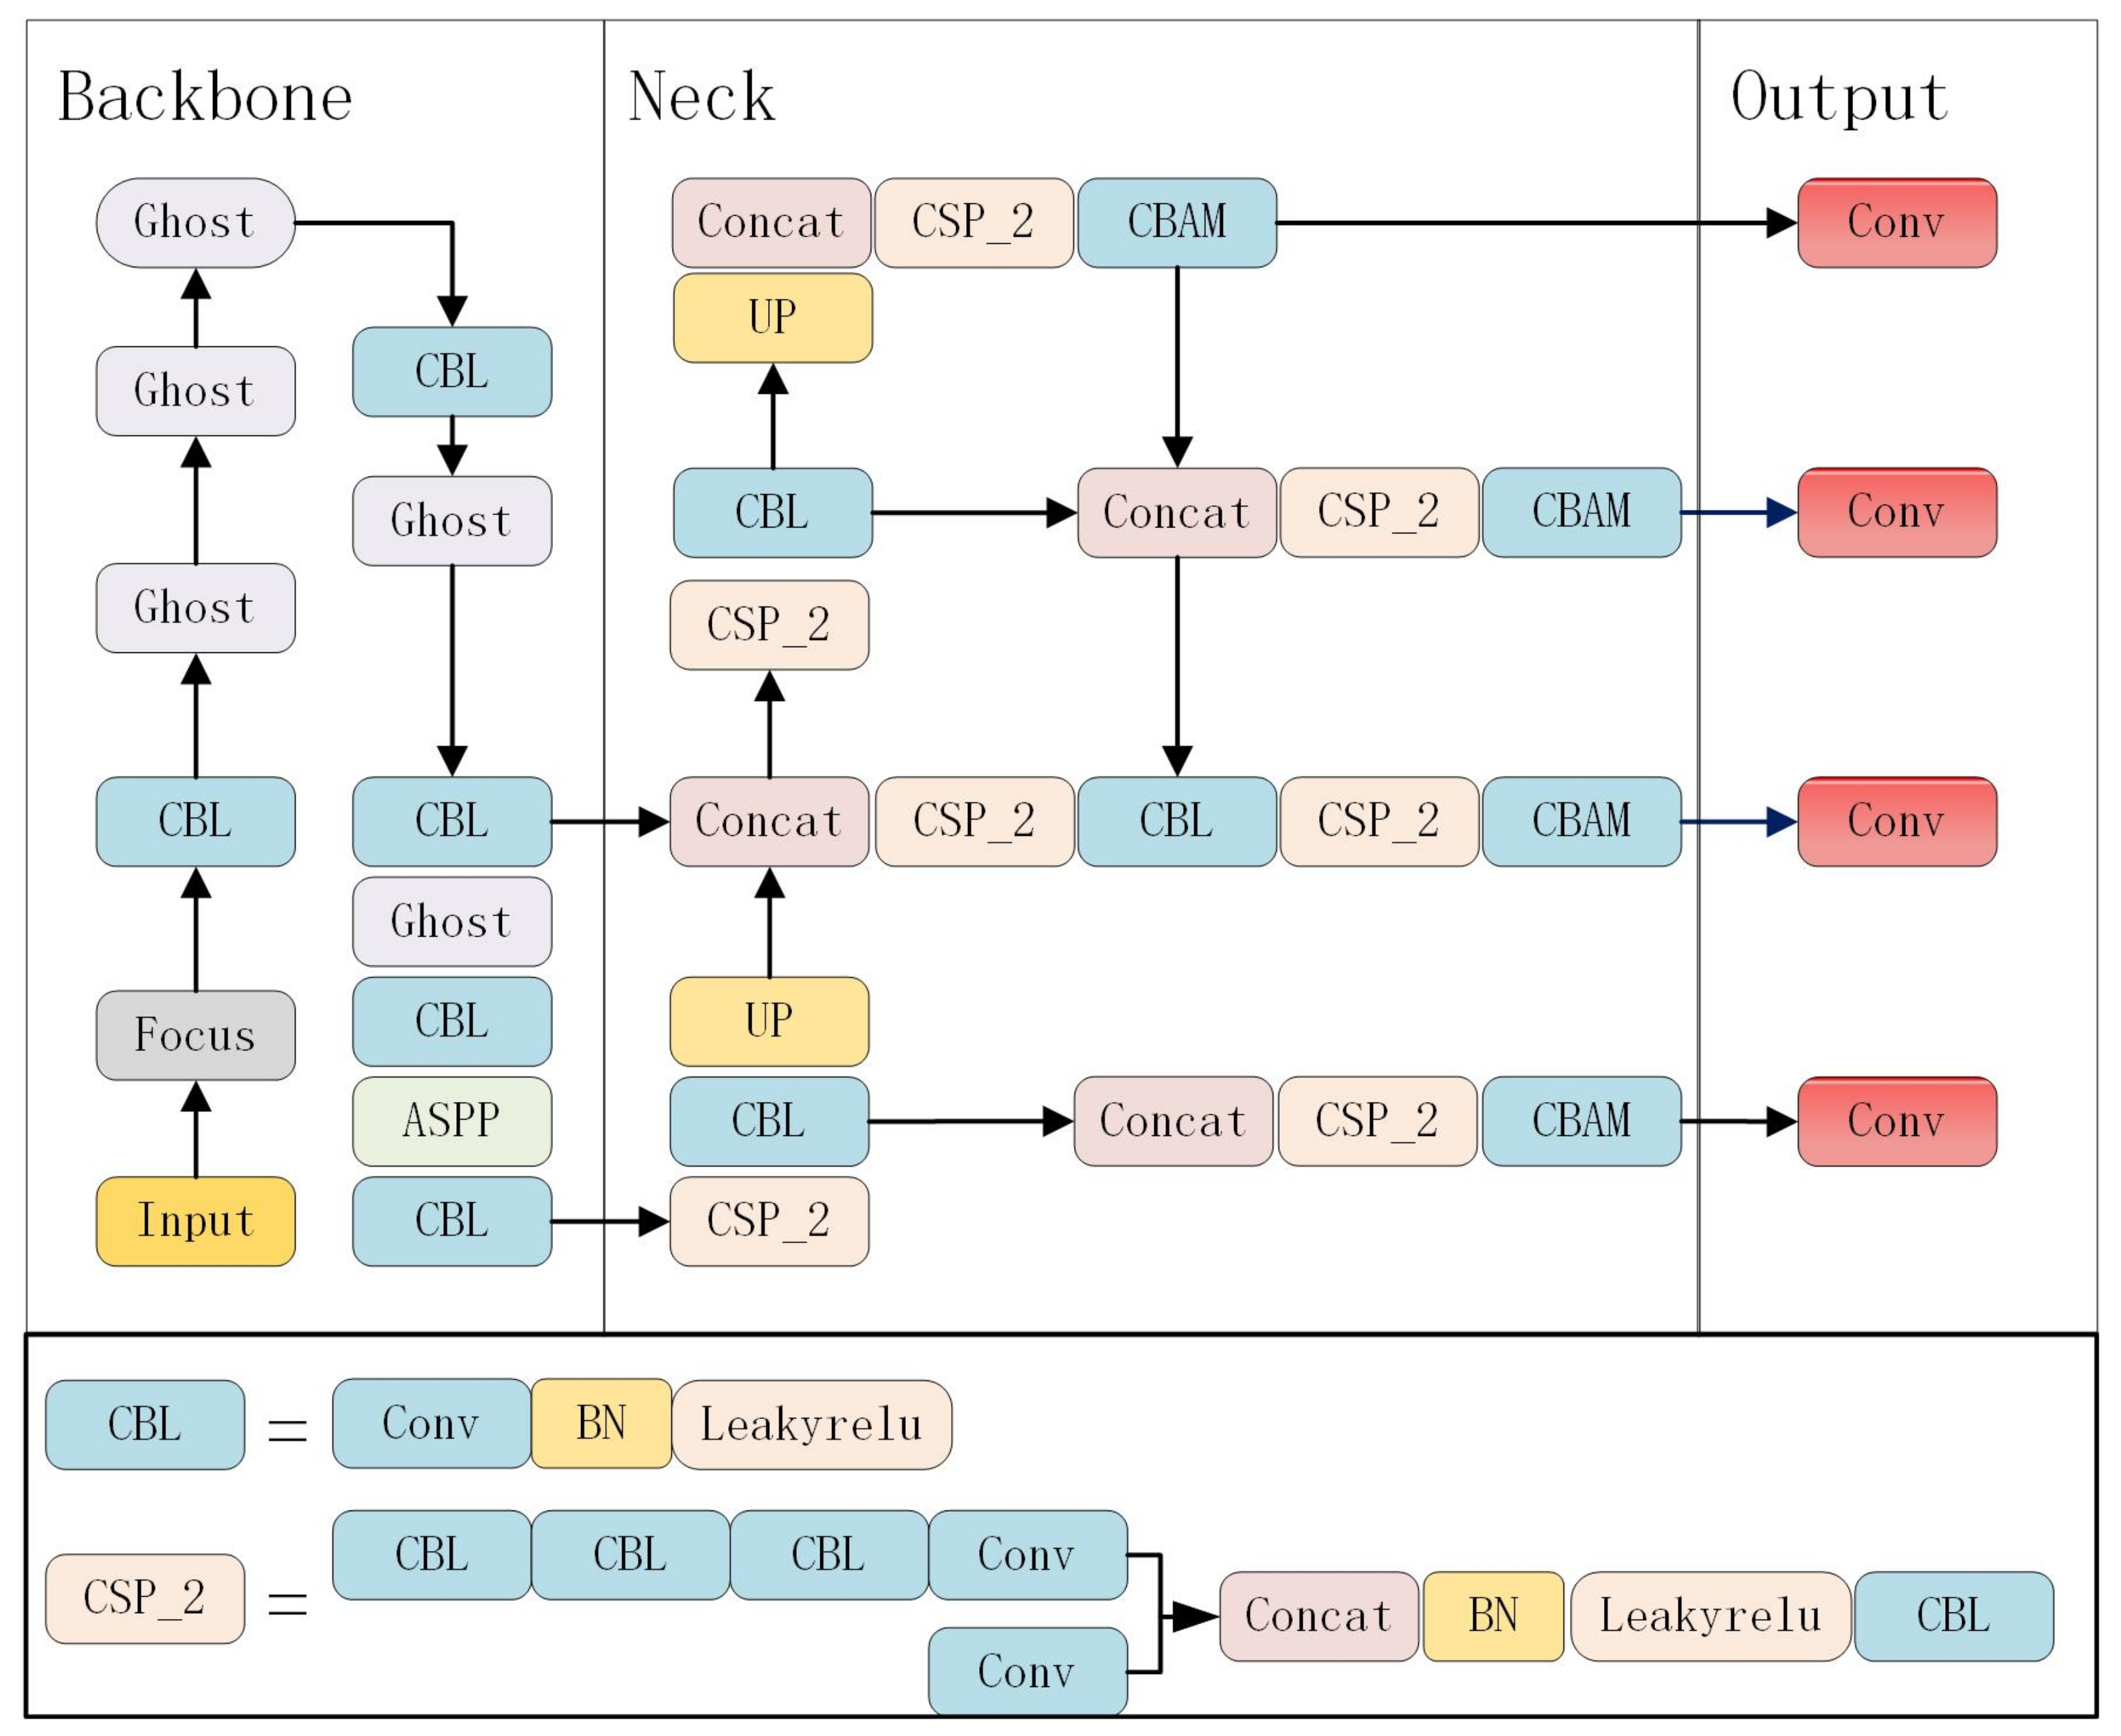
Realistic scenarios often include dense arrangements of vehicles and pedestrians, multi-scale targets, irregular geometry of traffic accidents, and complex backgrounds, among others. This greatly hinders the accuracy of detection, leading to missed reports and false target predictions. The goal of this study is to address the above challenges by proposing an improved and optimized YOLOv5s algorithm based on the characteristics and complexity of the traffic event dataset to improve the efficiency and accuracy of traffic event detection in complex situations and to achieve real-time detection speed. As shown in the
Figure 4, the model network design is divided into three parts: the backbone for feature extraction, the neck for extracting the semantic representation of the features, and the head for prediction.
3.2.1. Atrous Convolutional Pyramid Pooling
Atrous convolution is evolved from ordinary convolution, and the essence is to add blank blocks to the convolution part, also known as dilated convolution. The use of this network not only expands the feature receptive field but also preserves the invariance of the image content [
41]. The atrous convolutional network adds an important hyperparameter, that is, the hole rate. This parameter indicates the number of intervals between the corresponding pixel gray values on the feature map when the convolution kernel performs the convolution operation. When different hole rates are taken, The receptive field changes to capture multi-scale information [
42]. Initially, atrous convolution was presented as a solution to the problem of picture segmentation. The pooling process is utilized in the FCN network to increase the receptive field of the feature and continually compress the image’s feature information. Finally, the upsampling operation is used to restore the image content. However, this will lead to a large loss of feature information. If the information loss is reduced only by removing the pooling layer, the receptive field’s size will be lowered as well, so the atrous convolutional network emerges as the time requires. This provides a larger receptive field with the same amount of calculation [
43].
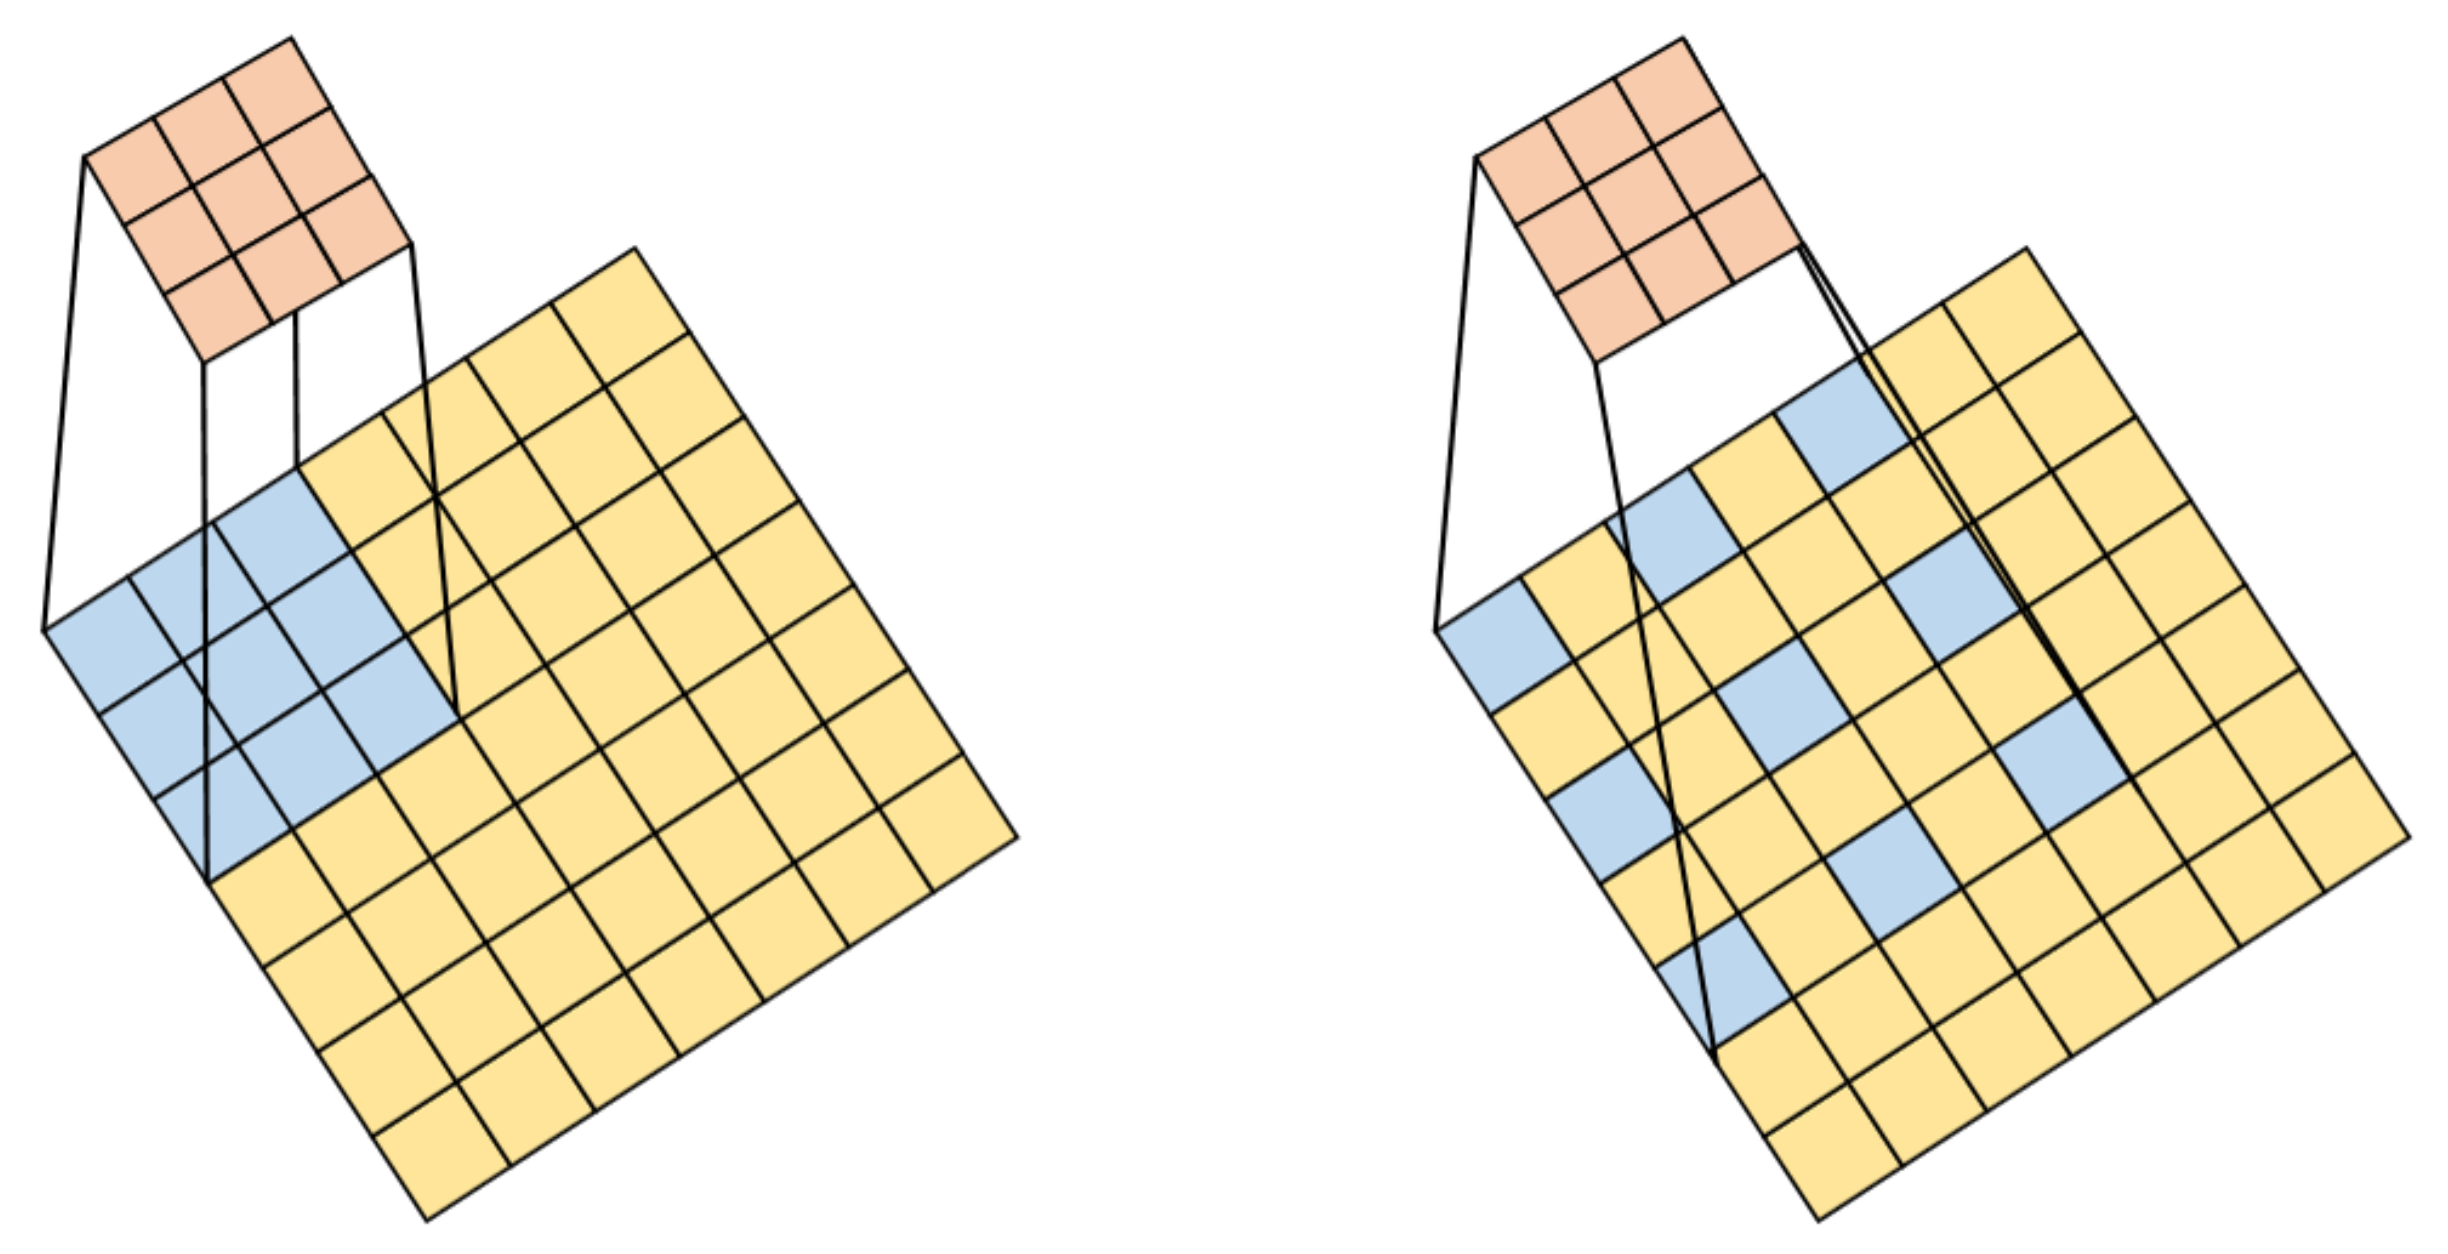
As shown in the
Figure 5, it is a schematic diagram of the comparison between standard convolution and atrous convolution. The left picture is a 3 × 3 standard convolution, and the right picture has a hole rate of 2 and 3 atrous convolutions. The following is the definition of the conventional two-dimensional convolution operation:
where
y[
m,
n] is the convolution layer’s output,
is the filter,
M and
N are the dimensions of the image. The two-dimensional atrous convolution operation is defined as follows:
In the formula, r represents the void ratio.
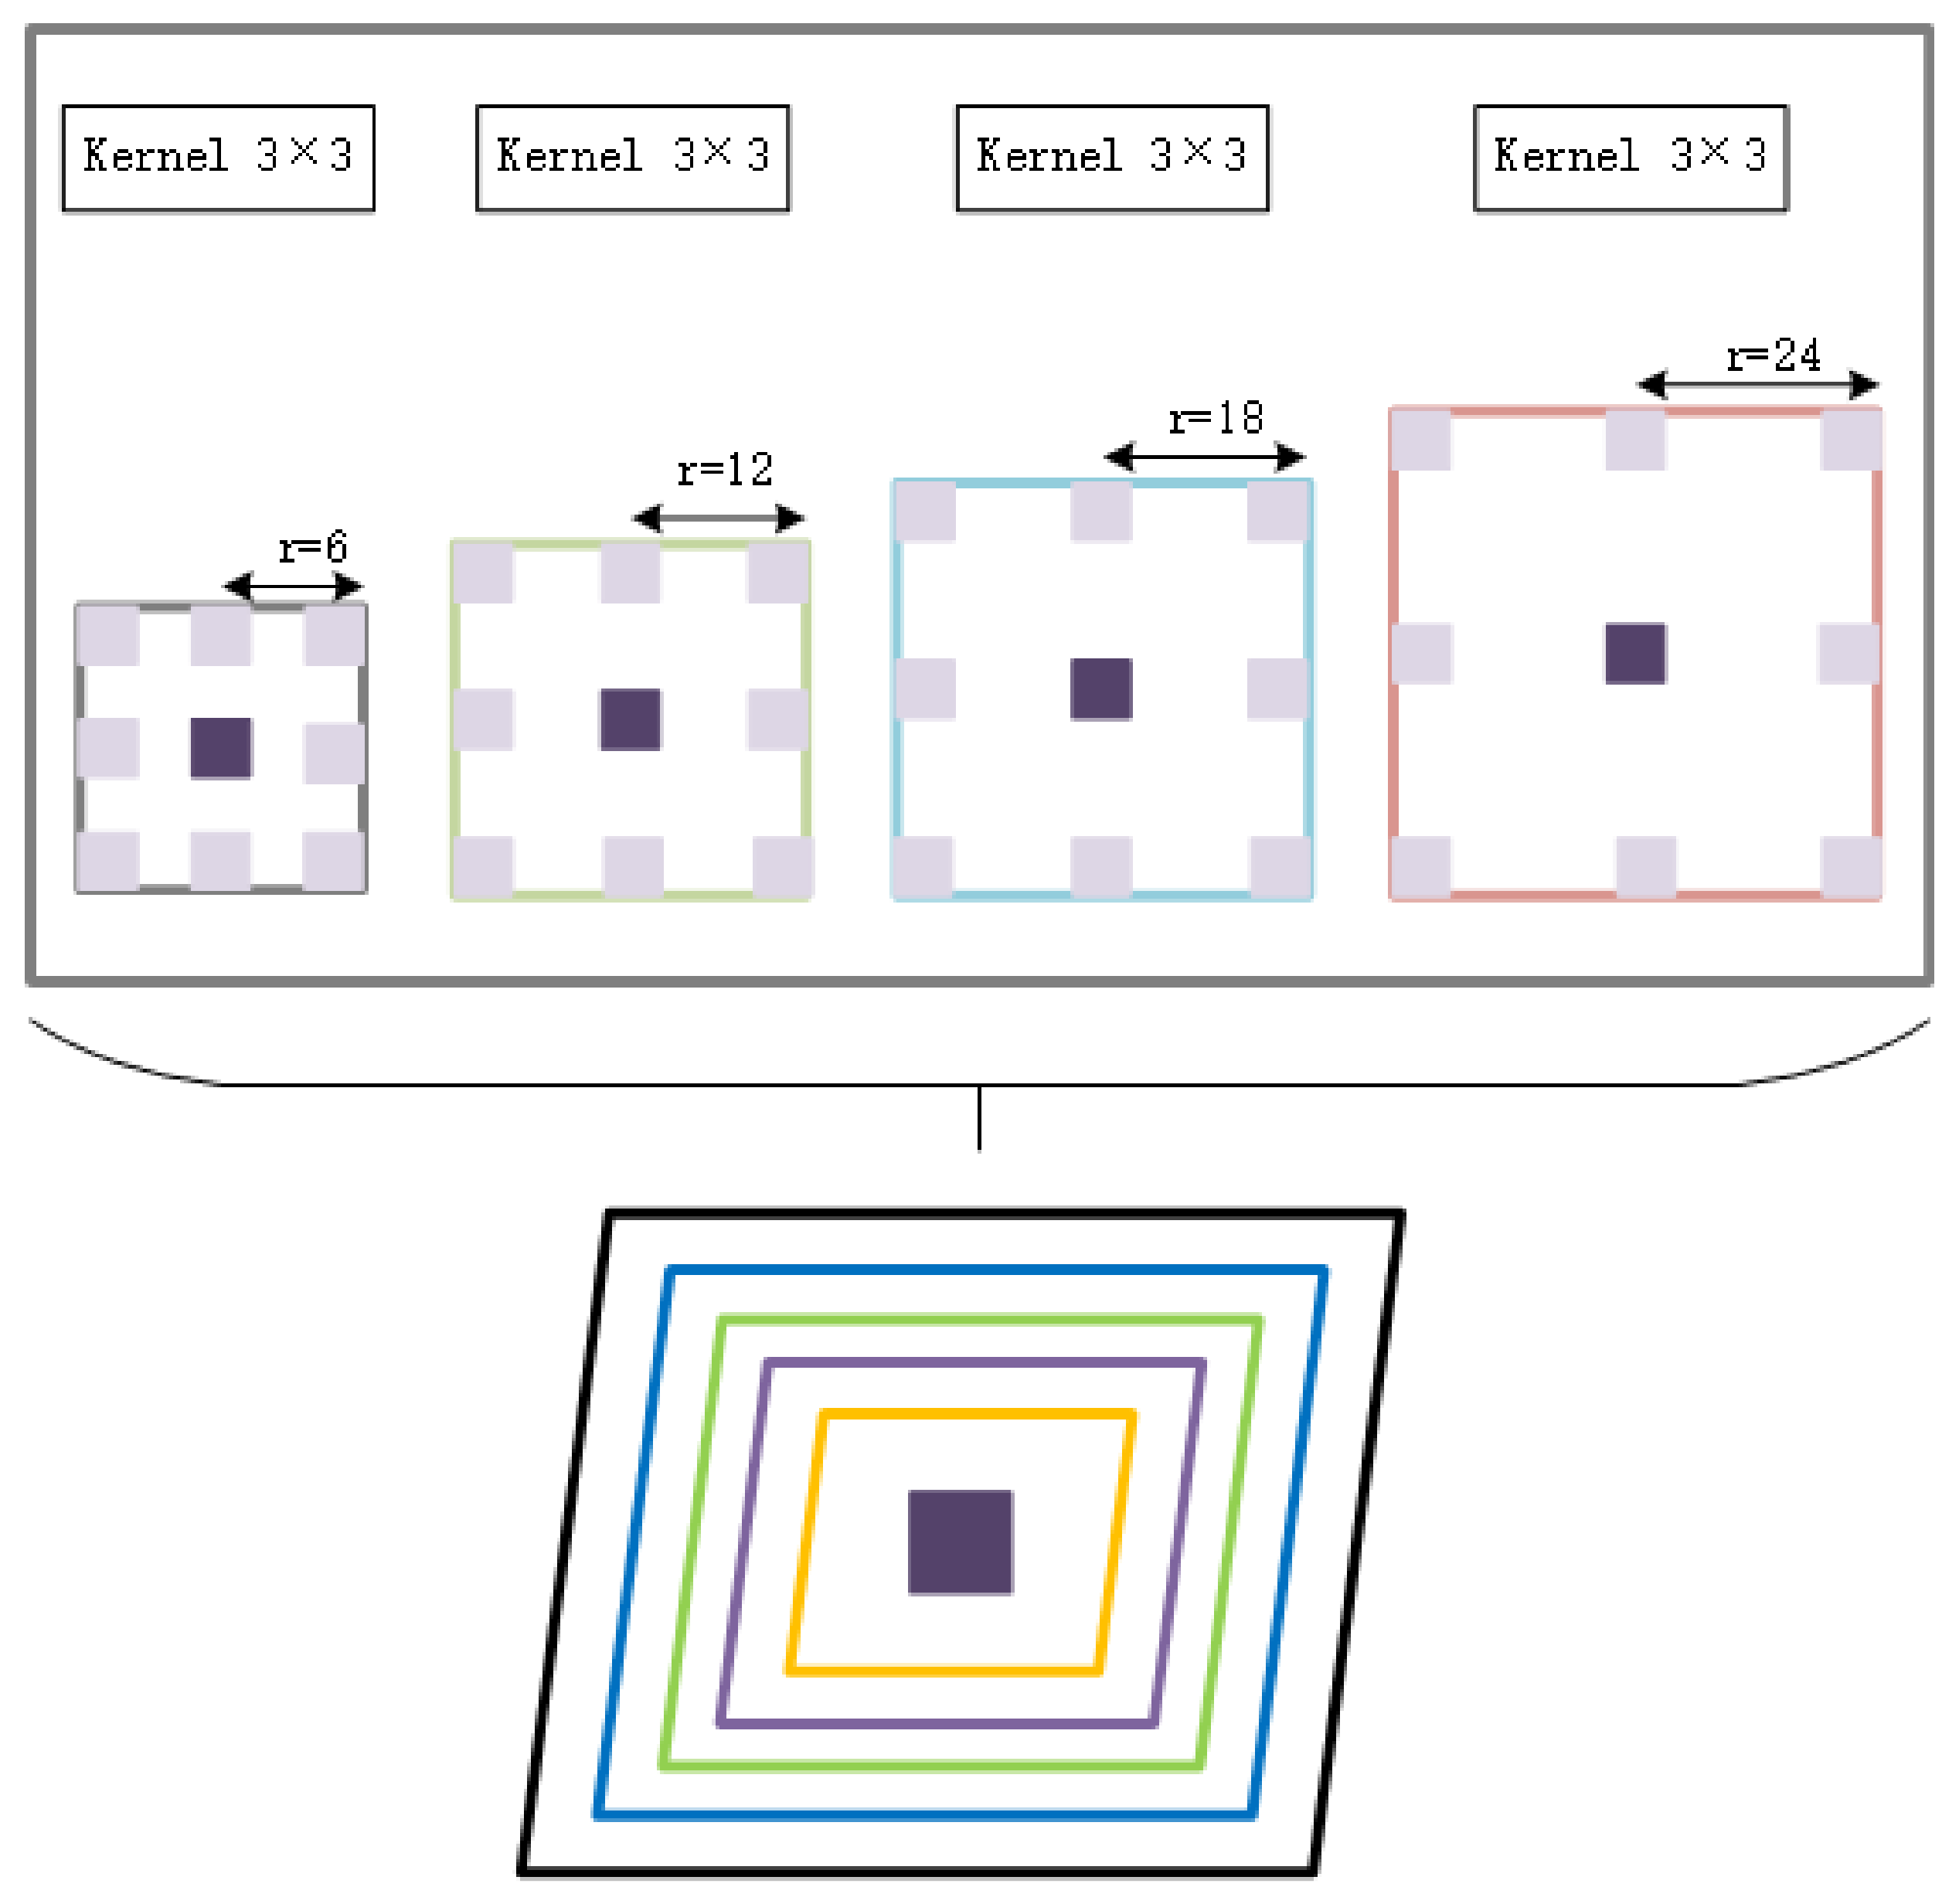
Atrous spatial pyramid pooling is an important feature extraction method in the field of image segmentation. This method sets four different hole rates and uses atrous convolution to extract features from different receptive fields [
44]. It is ASPP, as illustrated in the
Figure 6. This is a schematic diagram of the concept, where r is the atrous convolution’s hole rate, which is 6, 12, 18, and 24, sequentially, and the feature maps created by the four branches are eventually fused. This method can obtain different features of each area of the image according to the scale view. As a result, the atrous spatial pyramid pooling approach is used in this work, and the atrous space pyramid is incorporated into the feature extraction stage to obtain richer feature information in the original picture, thereby avoiding the impact of unequal object distribution on image processing.
3.2.2. Mechanism for Fusing Attention
The Mechanism of Attention [
45,
46,
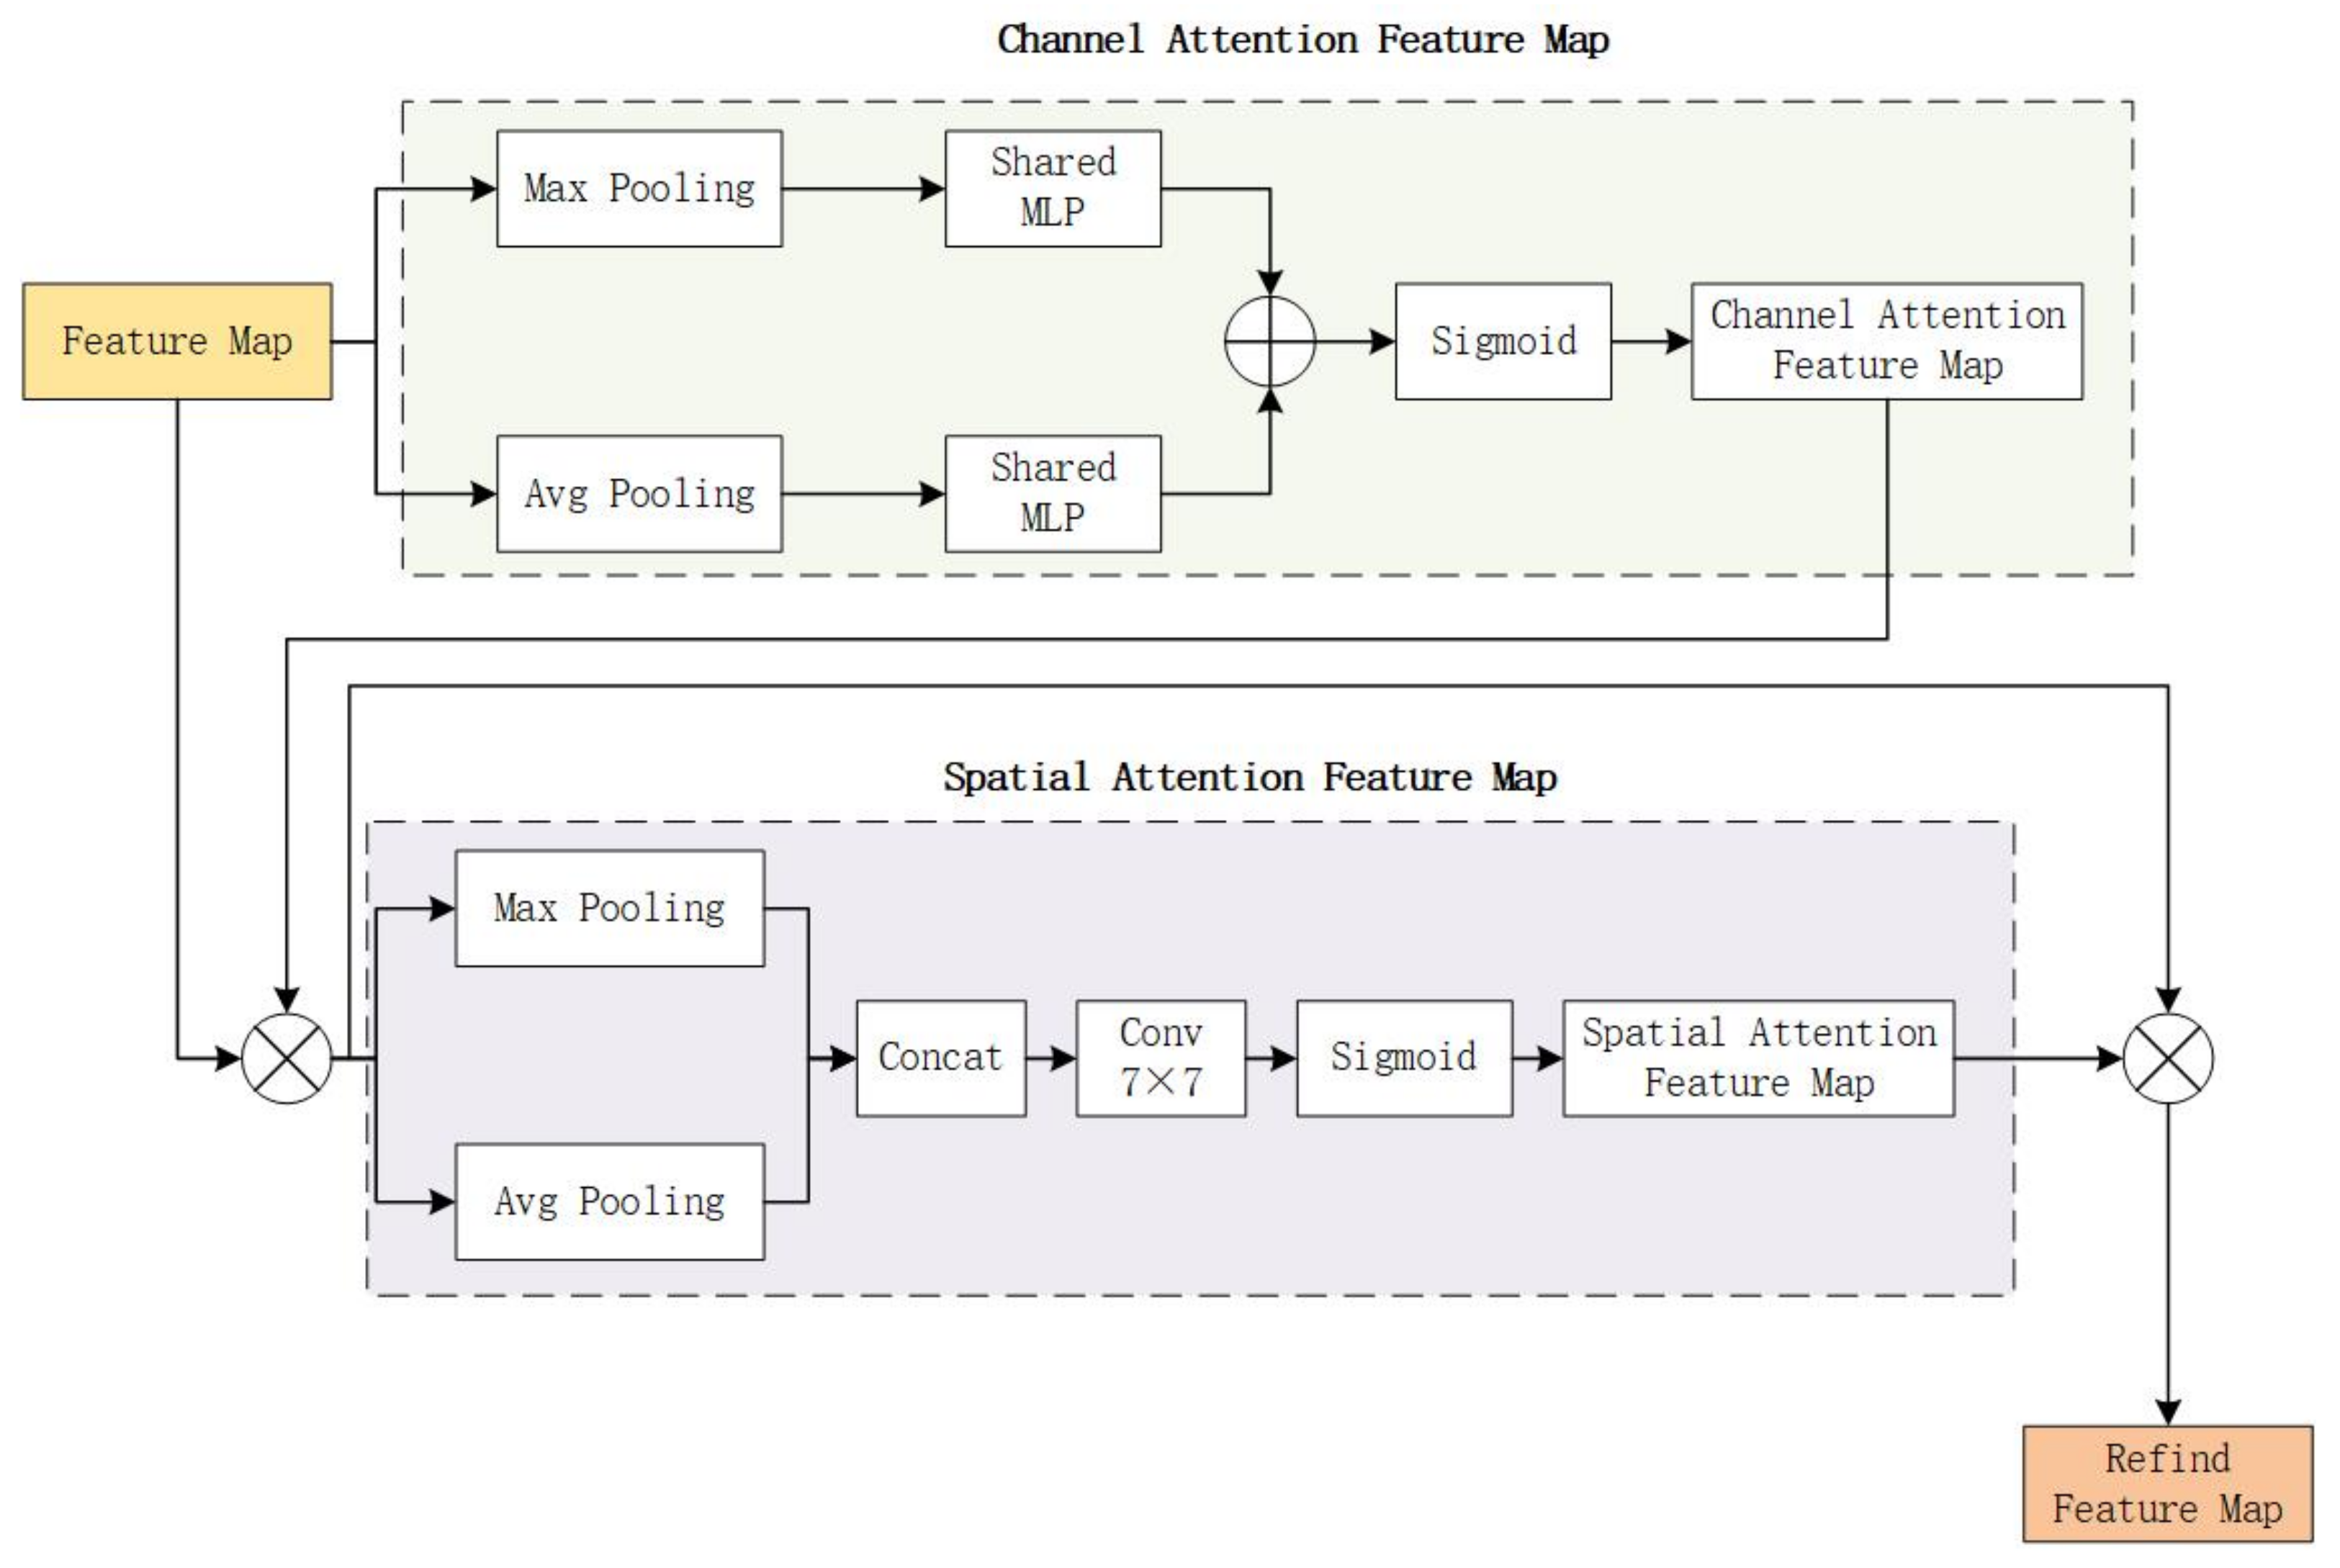
47] is a deep learning data processing approach that is widely employed in a variety of deep learning tasks, including natural language processing, picture recognition, and audio recognition. The principle of the attention mechanism comes from the mechanism of the human brain processing information through the visual function. When the human brain receives information, it does not process all of it, but only processes the information that the brain considers important, and filters the information that the brain considers unnecessary. This can improve the efficiency of information processing. Similarly, when processing information, the attention mechanism will selectively focus on a part of the information and ignore other unimportant information. The attention mechanism can not only judge and decide which part of the information needs to be paid attention to, but also can allocate limited information processing resources to the part to be paid attention to. Convolutional Block Attention Module (CBAM) is a pluggable module that enhances the performance of the network model and generates relevant features in the two dimensions of space and channel by weighing the features in the spatial and channel directions. Its structure is shown in
Figure 7. It applies channel and spatial attention modules consecutively to learn characteristics in the channel and spatial dimensions, respectively. In addition, information through emphasis or suppression also contributes to the flow of information within the network.
The CBAM attention mechanism is introduced into the neck of the YOLOv5s model in this work. For feedforward convolutional neural networks, this is a simple but effective attention module. Given an intermediate feature map, our module successively infers the attention map along two independent dimensions (channel and space), and then multiplies the attention map by the input feature map for adaptive feature decoration.
The CBAM attention mechanism module is illustrated in the diagram above. The two aspects of CBAM’s attention mechanism are spatial attention and channel attention. As can be seen from the above figure, the channel attention is in the front, and the spatial attention is in the back. After the feature map is input, it first enters the channel attention. In the spatial dimension, the channel attention module compresses the feature map. Then it acts on a one-dimensional vector. Not only mean pooling but also max-pooling are taken into account when compressing in the spatial dimension. To collect the spatial information of feature maps, feed them to a shared network, compress the spatial dimension of the input feature maps, and sum and merge element-wise to produce channel attention maps, average pooling and max pooling can be utilized. As far as a picture is concerned, channel attention focuses on what content within the picture is important. When performing gradient back propagation computations, average pooling has feedback for every pixel on the feature map, whereas max-pooling only receives gradient feedback at the most responsive area of the feature map. The following is a description of the channel attention mechanism:
where
is denotes the sigmoid function,
,
and
both inputs share the weights of the
MLP network.
Unlike channel attention, the spatial attention network module generates the spatial attention map primarily based on the spatial relationship between picture feature elements. The spatial attention focuses on “where” is the feature information part, and the features of which positions are more meaningful or important. This is a good complement to focusing attention. To extract and aggregate the feature space information, the spatial attention calculation first performs average pooling and maximum pooling operations on the output feature map of the previous module, resulting in the average pooling feature map and the maximum pooling feature map having the same dimensions. Then, the new feature map formed by the serial splicing of the two feature maps is subjected to convolution operation. Finally, the Sigmoid function is used to obtain the feature map of the spatial attention mechanism, as seen in the formula below:
The formula: is the Sigmoid function. The convolution procedure is represented by , and the filter’s convolution kernel size is 7 × 7.
The convolutional attention mechanism model is a new method to improve the representation ability of CNN networks. To obtain a tiny overhead while preserving the overhead, this module combines attention-focused feature optimization with two distinct modules, channel and space. There is a considerable performance improvement. The SE (Squeeze-and-Excitation) compression excitation model delivers better channel attention when both max-pooled features and average-pooled features are used. At the same time, spatial attention is used to further improve performance, learn where to emphasize features or suppress unnecessary features, and effectively refine intermediate features. Furthermore, CBAM is applicable to a wide range of jobs and may be simply integrated into any CNN architecture, allowing the network to learn to focus on key information and enhance network performance. If it is introduced into the image compression model, it will effectively emphasize or compress the intermediate features, improve the overall performance of the model, and save computing power.
3.2.3. Improved PANet
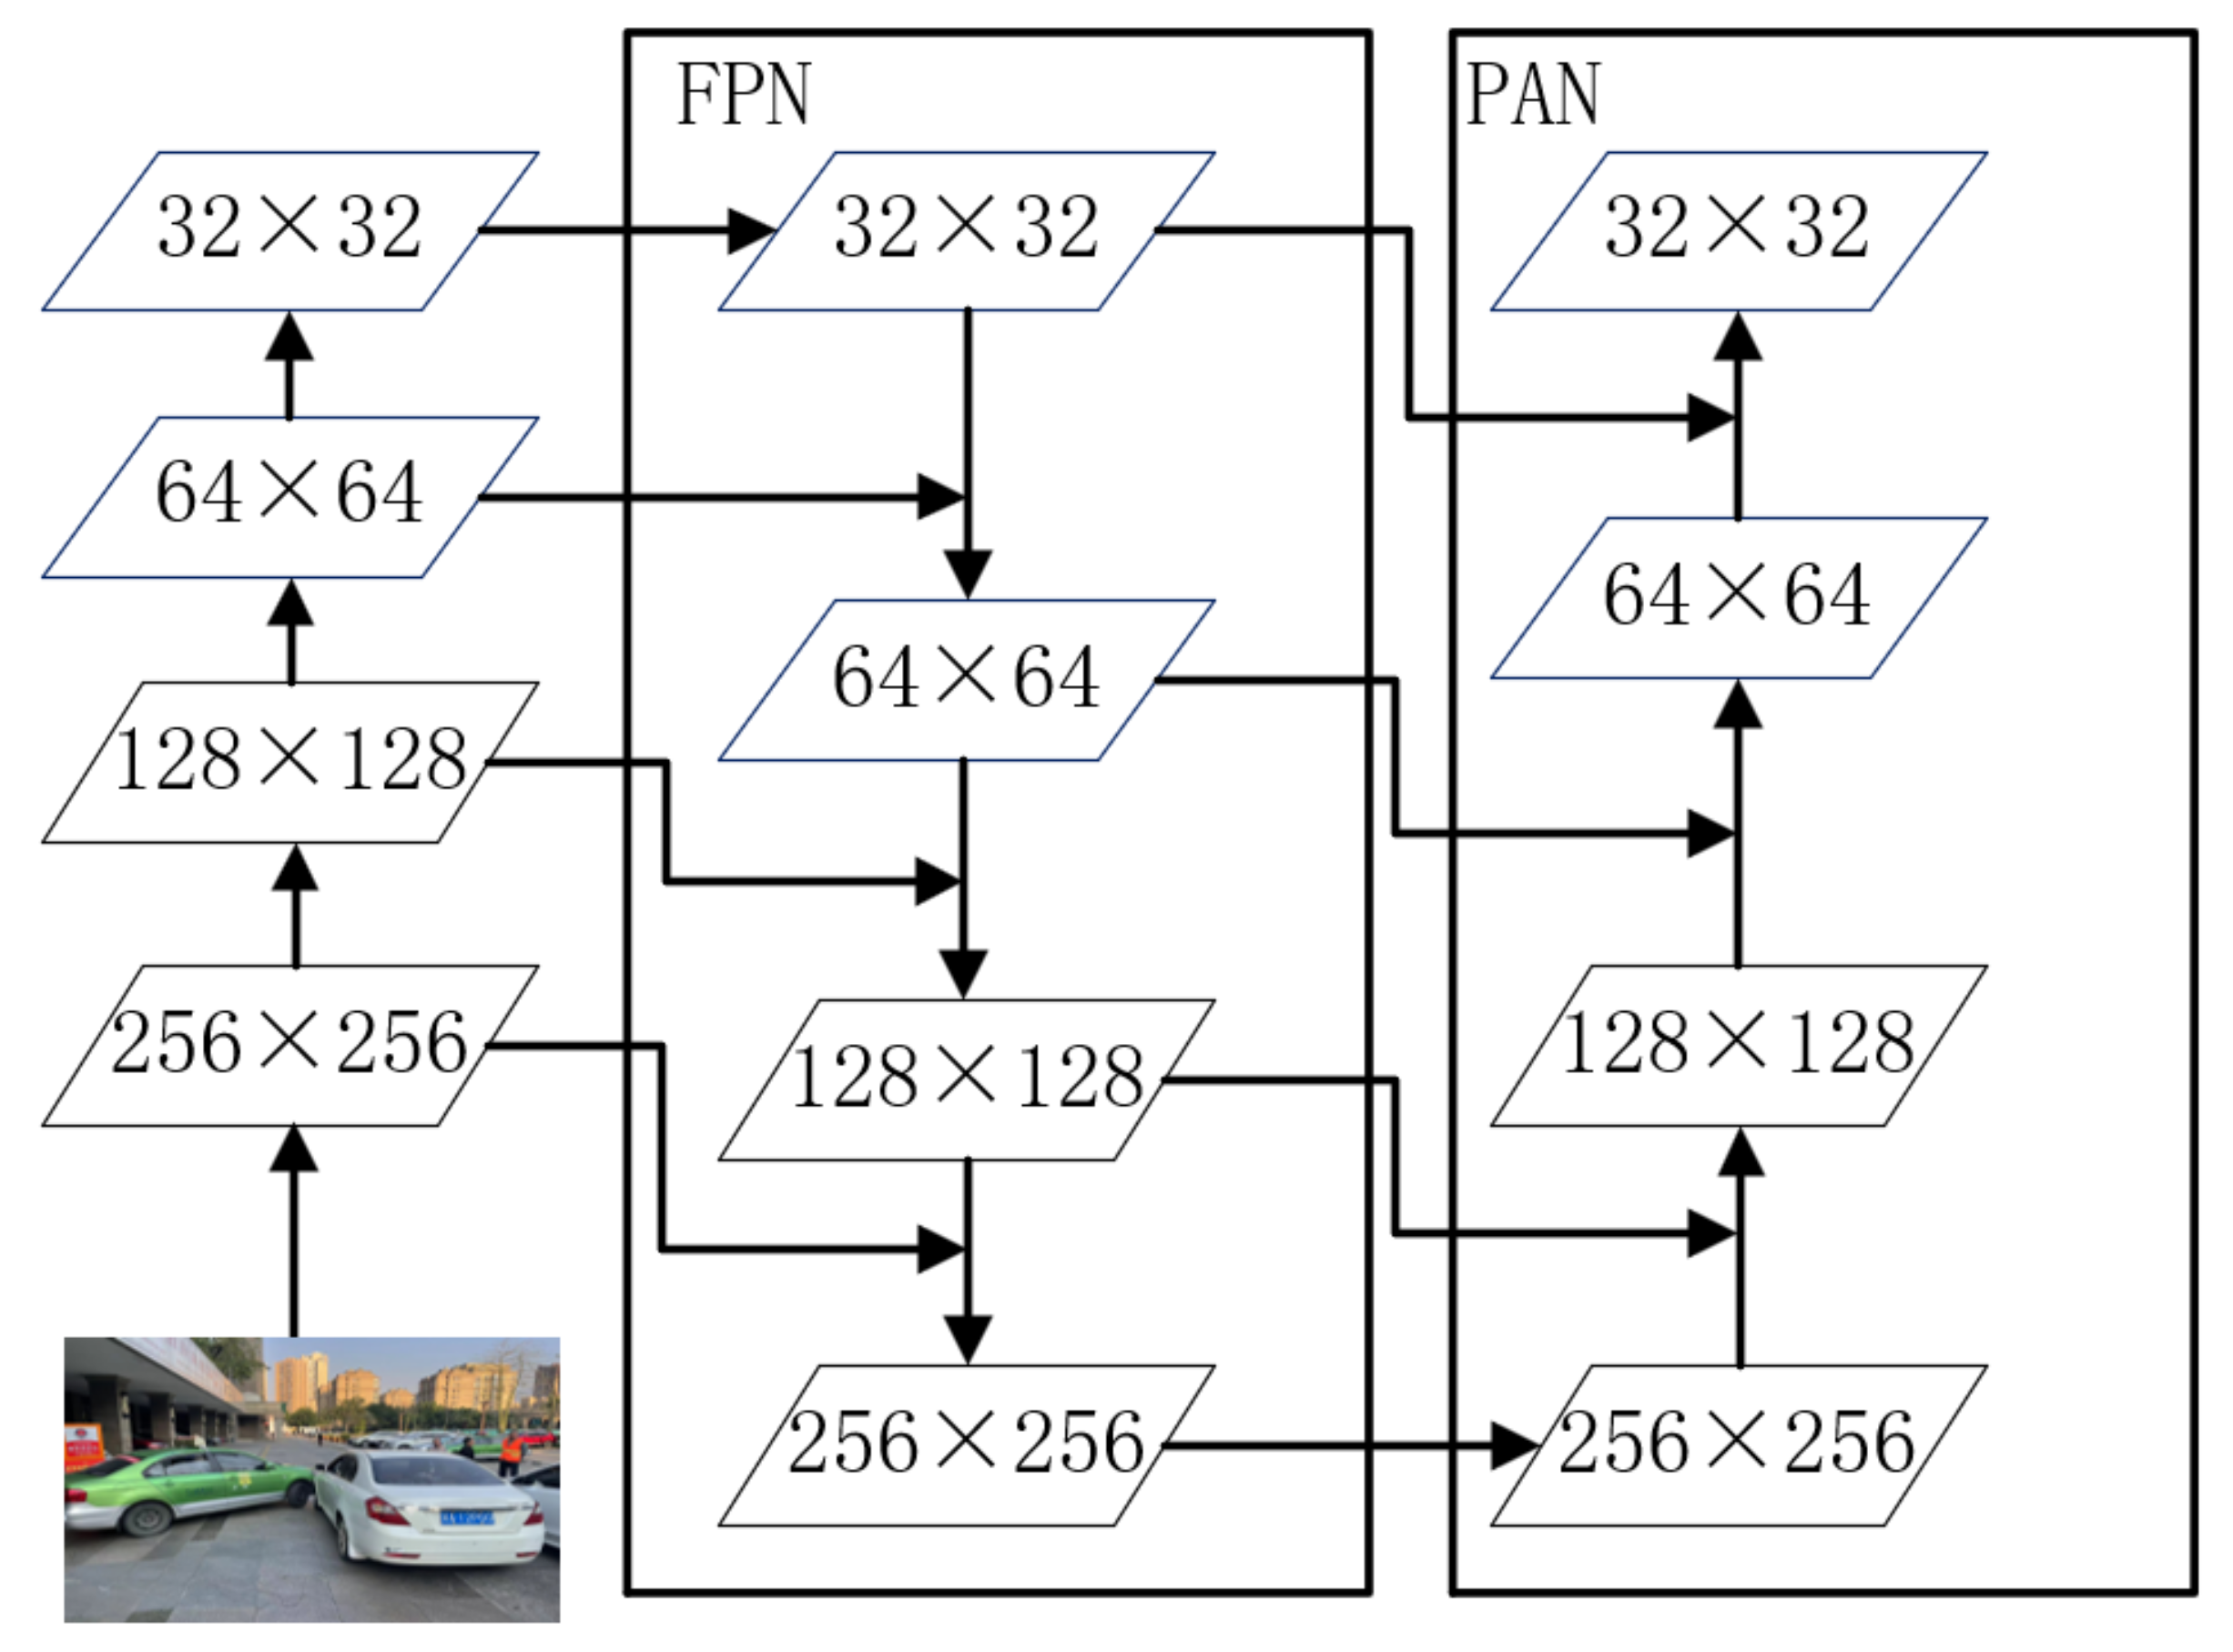
The improved PAN module is used in the neck, as shown in the
Figure 8. PAN (path aggregation network) [
48] uses a path that starts at the bottom and works its way up the enhancement method to enhance the full hierarchy of features with precise localization information at lower levels, reducing the distance between low-level and high-level features. This module outputs the features of different layers and aggregates the outputs in the bottom-up detection process. Through the bottom-up path, the underlying feature information is more easily propagated upward, and the feature fusion capability of the network is enhanced.
In traffic incident detection, there is a small difference in the characteristics of different vehicles and pedestrians. In order to obtain better detection accuracy, compared with the original PAN structure, we improved to add a detection scale, which requires detection of feature details. Feature extraction is performed from 1/2, 1/4, 1/8, and 1/16 scales, respectively, so that the network can obtain different receptive fields and can capture information to obtain higher-level abstract features. The PAN structure is used for concatenation, and the feature fusion of path aggregation is performed on the multi-scale features.
4. Experiment and Result Analysis
4.1. Experimental Environment
At present, there are many open-source deep learning frameworks for deep learning technology research, and TensorFlow, Caffe, PyTorch, and other learning frameworks for object detection network research. By comparison, it is found that when training large-scale CNNs, the PyTorch learning framework is not only easy to operate in parallel, but can also be combined with different hardware to accelerate training. At the same time, it provides many different application program interfaces which are convenient for users to directly call, which not only improves the work efficiency of coding but also retains the flexibility of the code. In addition, the entire process and results of model training can be visually monitored through the web application TensorBoard. Therefore, this paper adopts the learning framework to build the network structure of the model and chooses the Python language to implement program coding. In addition, in terms of the hardware environment. The model is mostly trained and tested on a 1060 GPU server. The detailed experimental platform configuration is shown in
Table 1.
4.2. Evaluation Indicators
Some essential statistical indicators of the matrix are commonly utilized in the object identification model based on deep learning, such as the intersection ratio (
IoU), precision (
P), recall (
R),
F-1 score, precision (
AP), and mean accuracy (
mAP).
The higher the precision value, the stronger the model’s ability to identify negative data sets, and the higher the recall value, the stronger the model’s ability to detect positive data sets. To obtain the precise degree of test accuracy, define the
F score as:
The
F score is a comprehensive evaluation indicator that incorporates the average of accuracy and recall to ensure consistency in the model’s accuracy and memory. The model is more robust if the
F score is higher.
AP is defined as the area under the pr curve, which can be written as:
The bigger the area under the PR curve, the more accurate the object class prediction is, and
mAP is the average of all APs, which may be written as:
4.3. Structure and Analysis
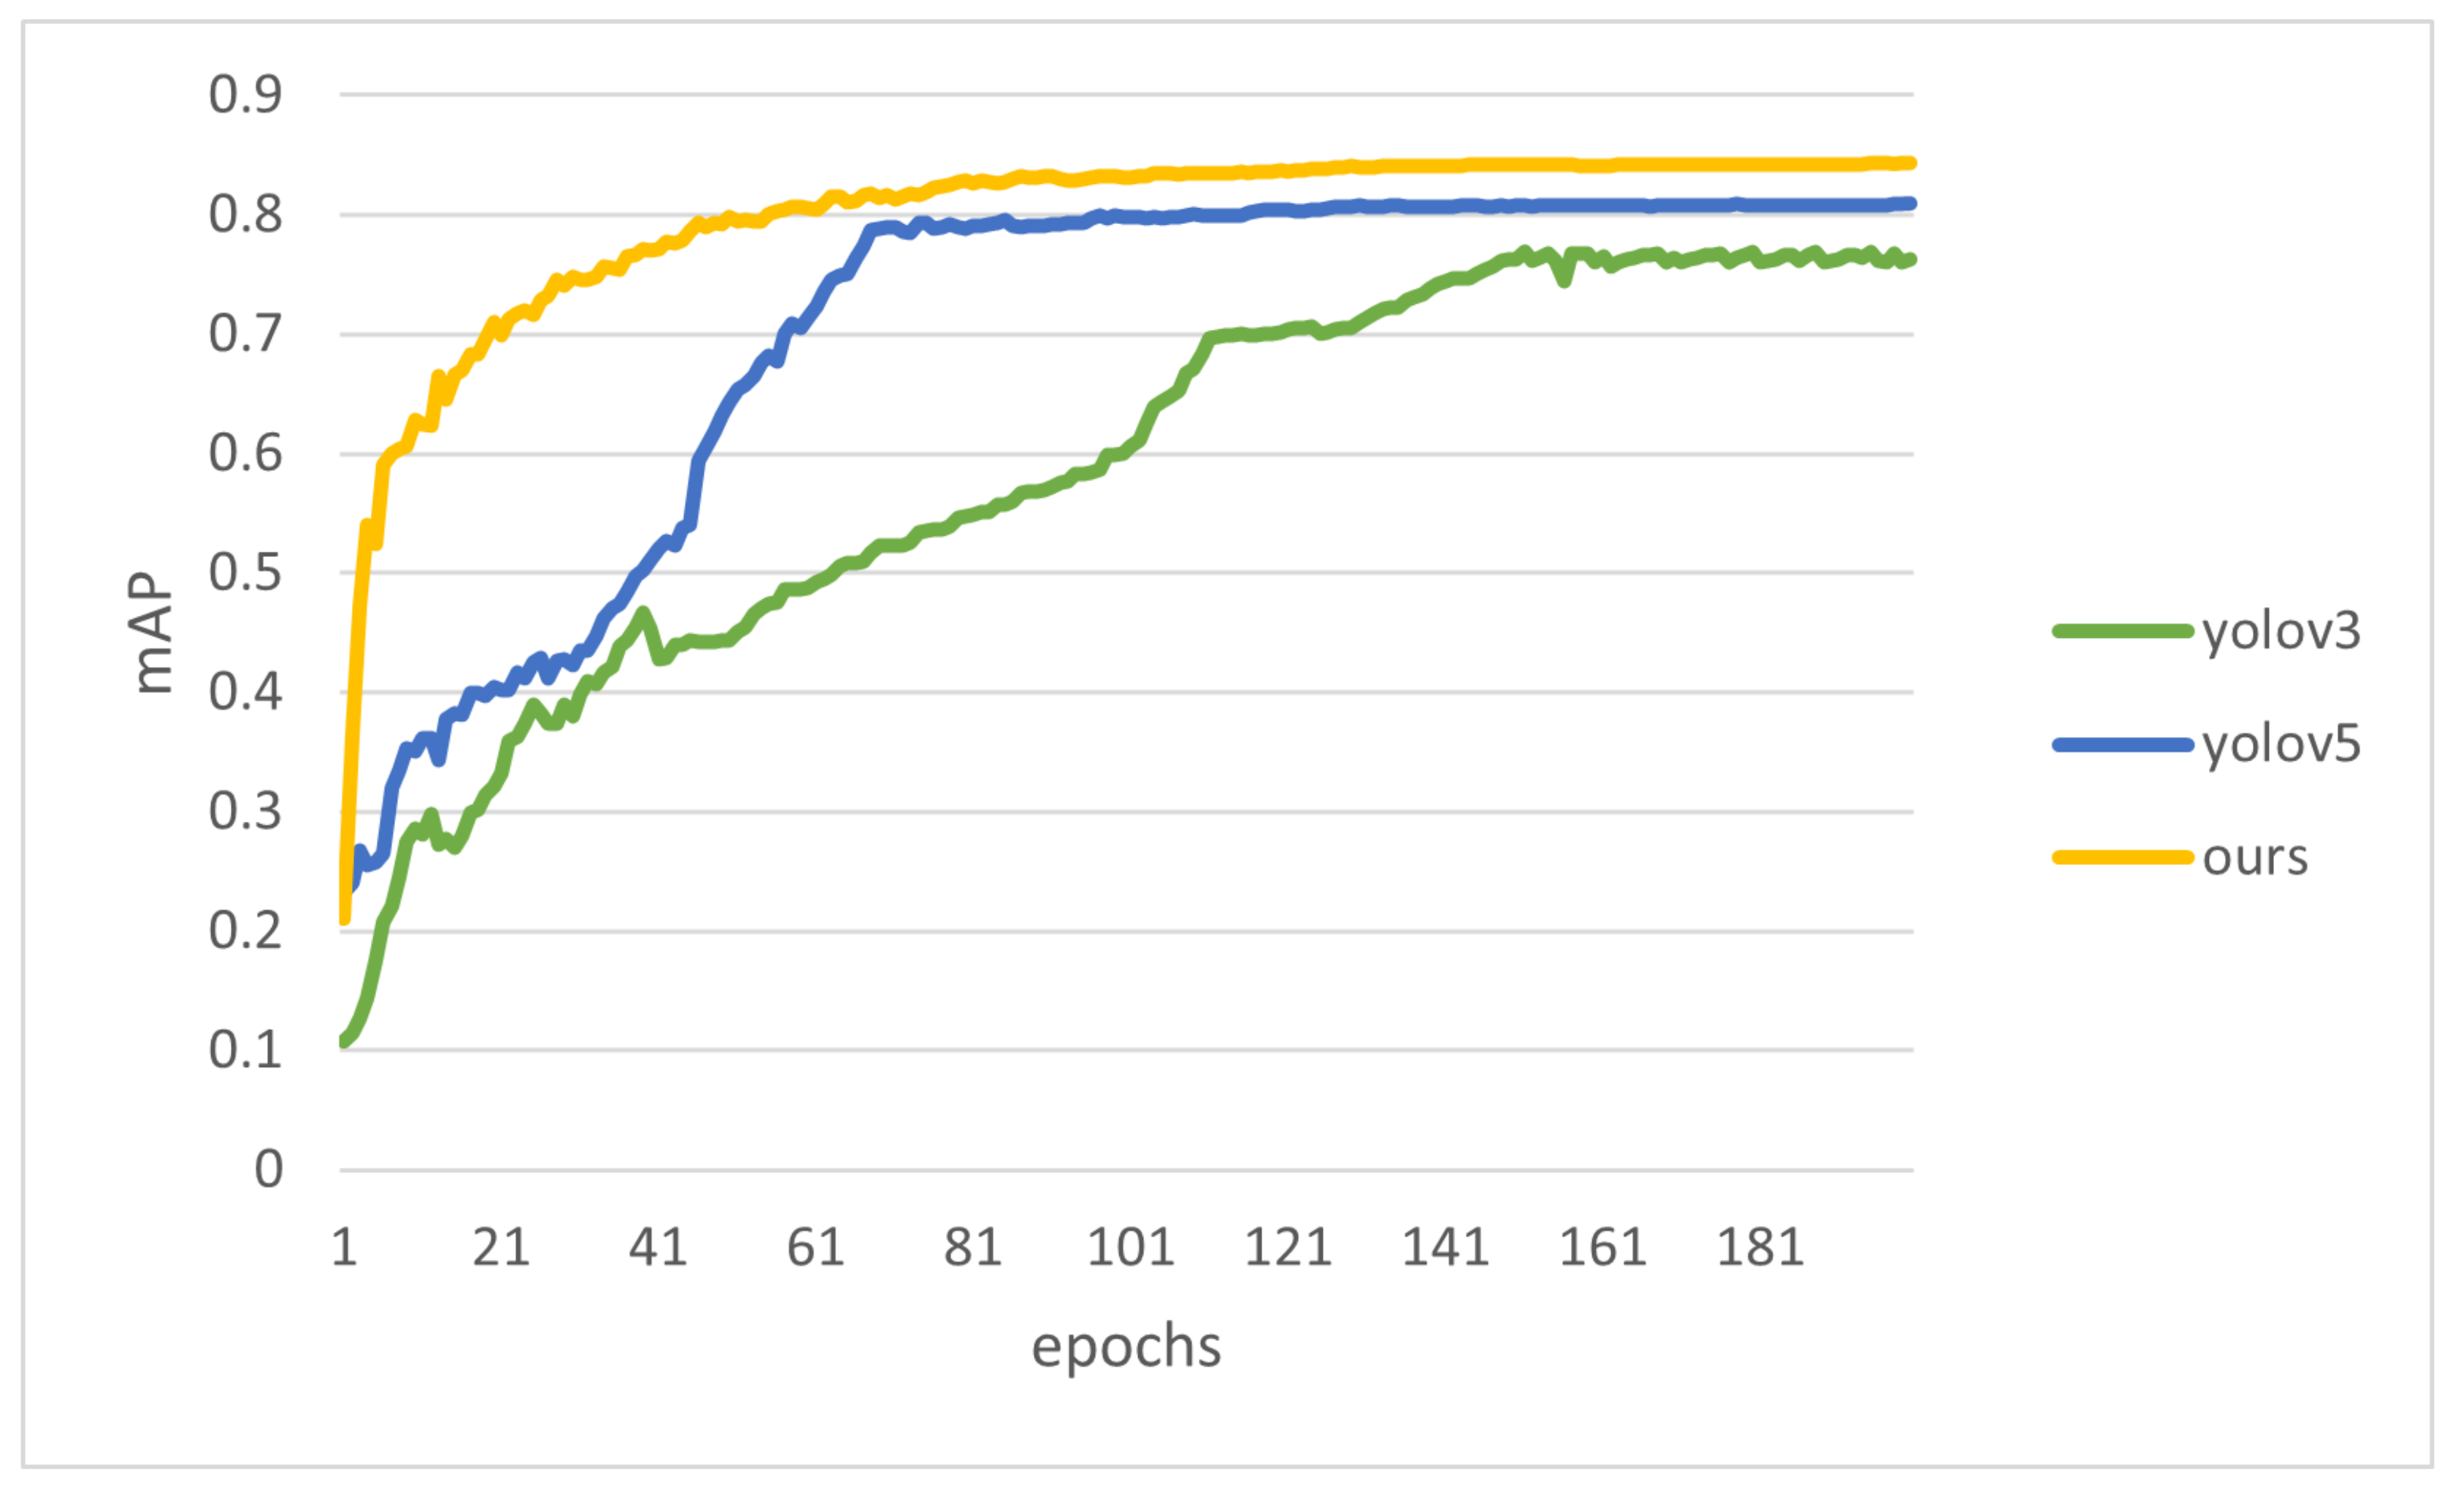
So as to appraise the capability of the neural network, randomly split the dataset into an 8:2 ratio; the former part is used as training data, and the latter part is used as test data. The test data are separate to the training data and do not participate in the training procedure, so the results of training can be detected objectively. In our experiments, the number of training iterations is set to 200, the initial learning rate is set to 0.01, and four images are fed to the network at a time using the Adam (adaptive moment estimation) optimizer with an input image size of 512 × 512. Compare our improved model with the original model. The performance of our method and baseline model (YOLOv5s) on our produced traffic incident dataset is shown in the table below. The results show that our model has been shown to perform better than the original model, and the final model improves the mAP value by about 3.3% over YOLOv5s on this dataset. Compared with YOLOv3, the mAP value is increased by about 8.2%. The
Figure 9 shows the test set scores displayed according to mAP values.
As can be seen from
Table 2, our model has the highest F1 score as well as mAP score, which means that our model has the highest detection accuracy among the models participating in the comparison; in addition, although the number of parameters of the improved model has increased, it still retains a fast detection speed, which is the fastest among the models participating in the comparison. We selected images from actual complex scenes in daylight conditions and a night environment to test our improved model, YOLOv5s model, and YOLOv3 model, respectively. The testing results are shown in
Figure 10 and
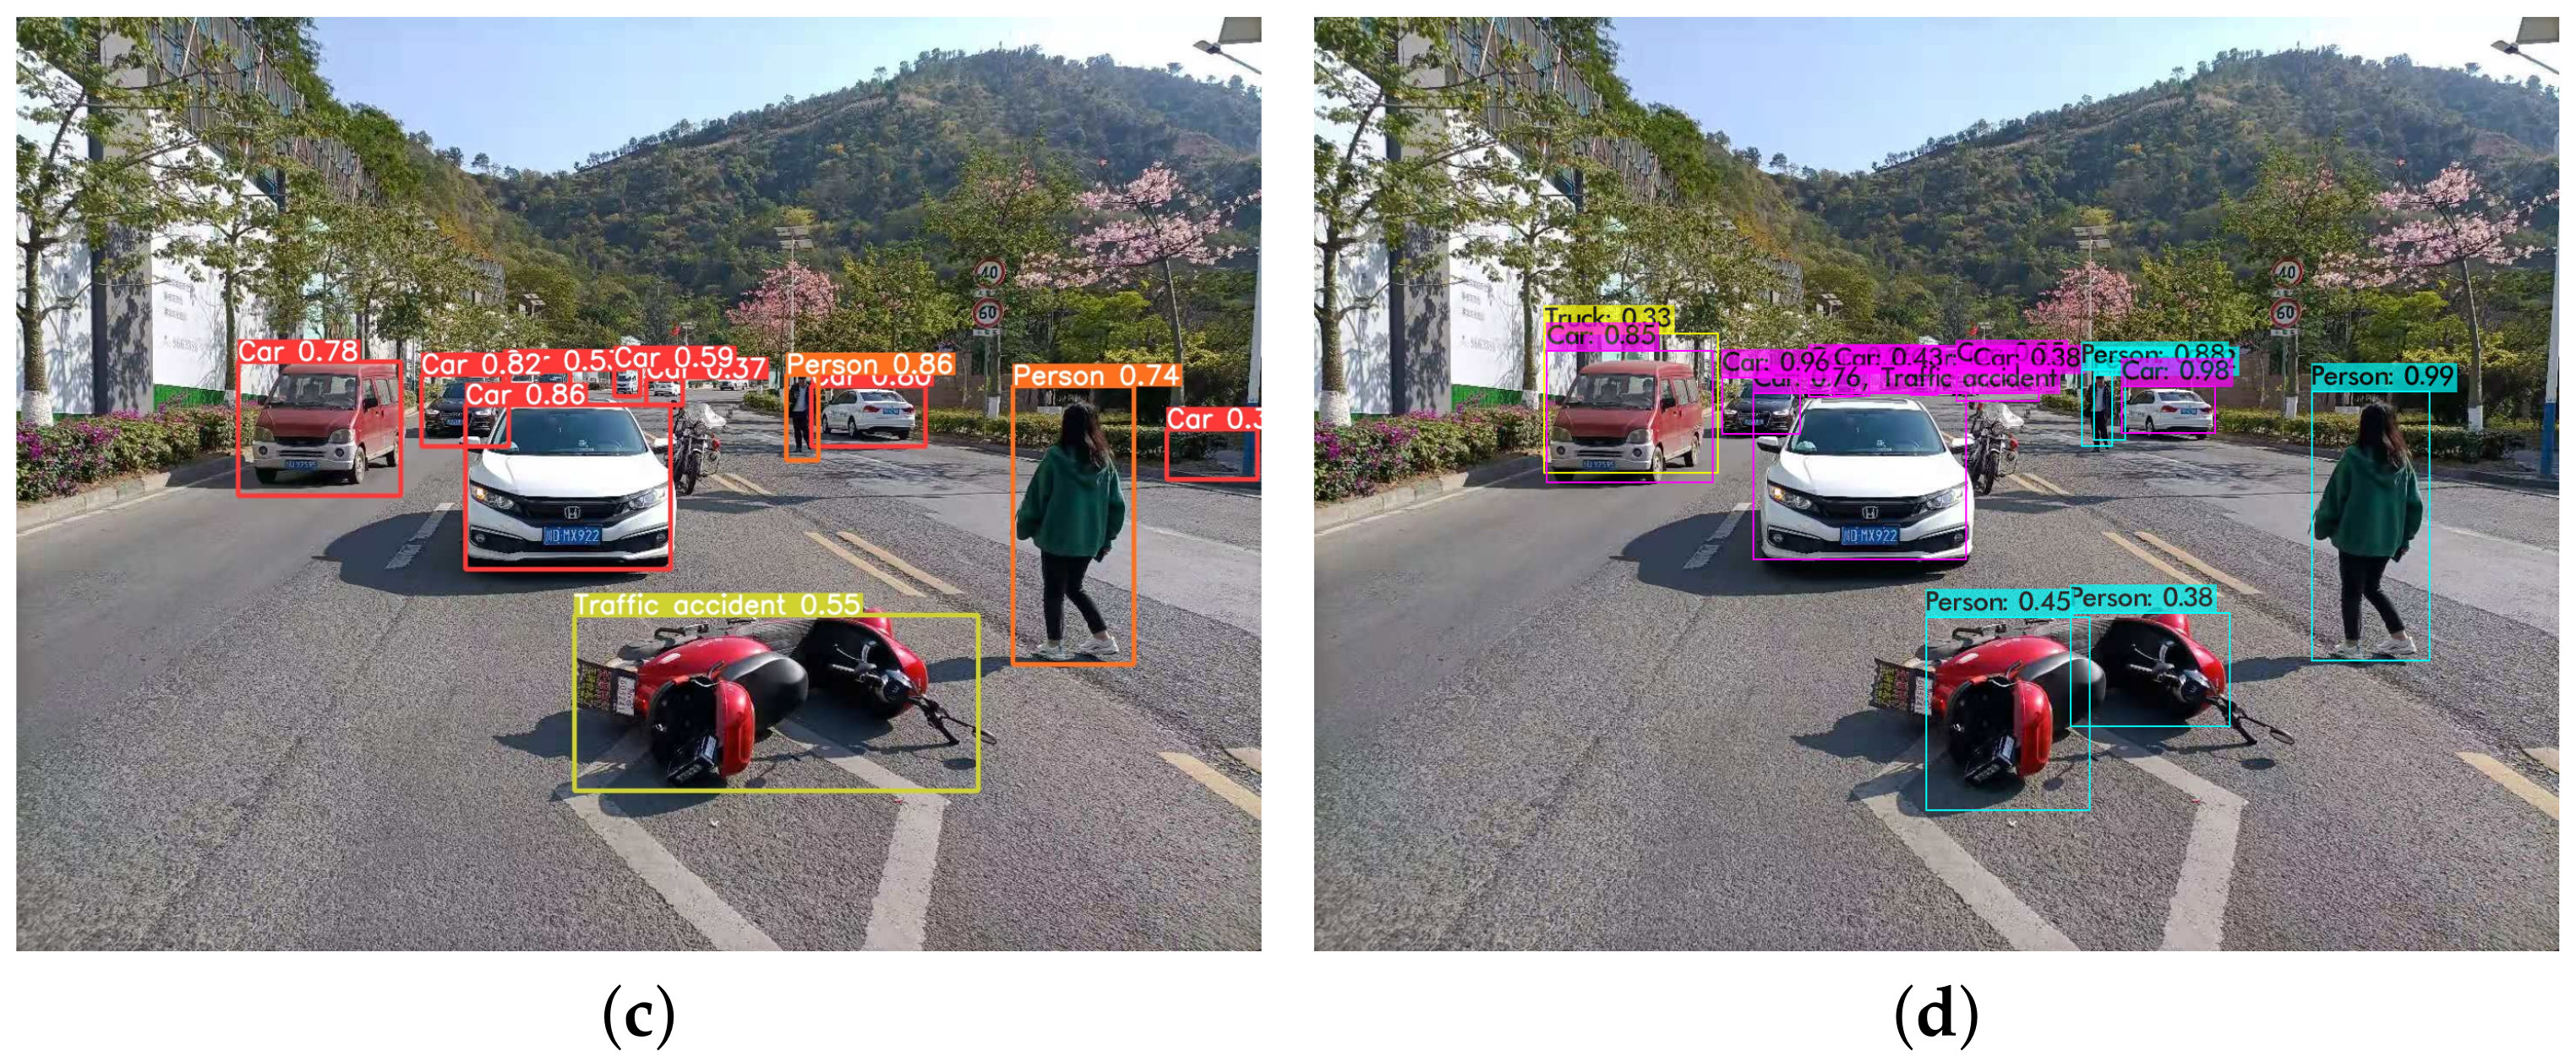
Figure 11. It can be found in
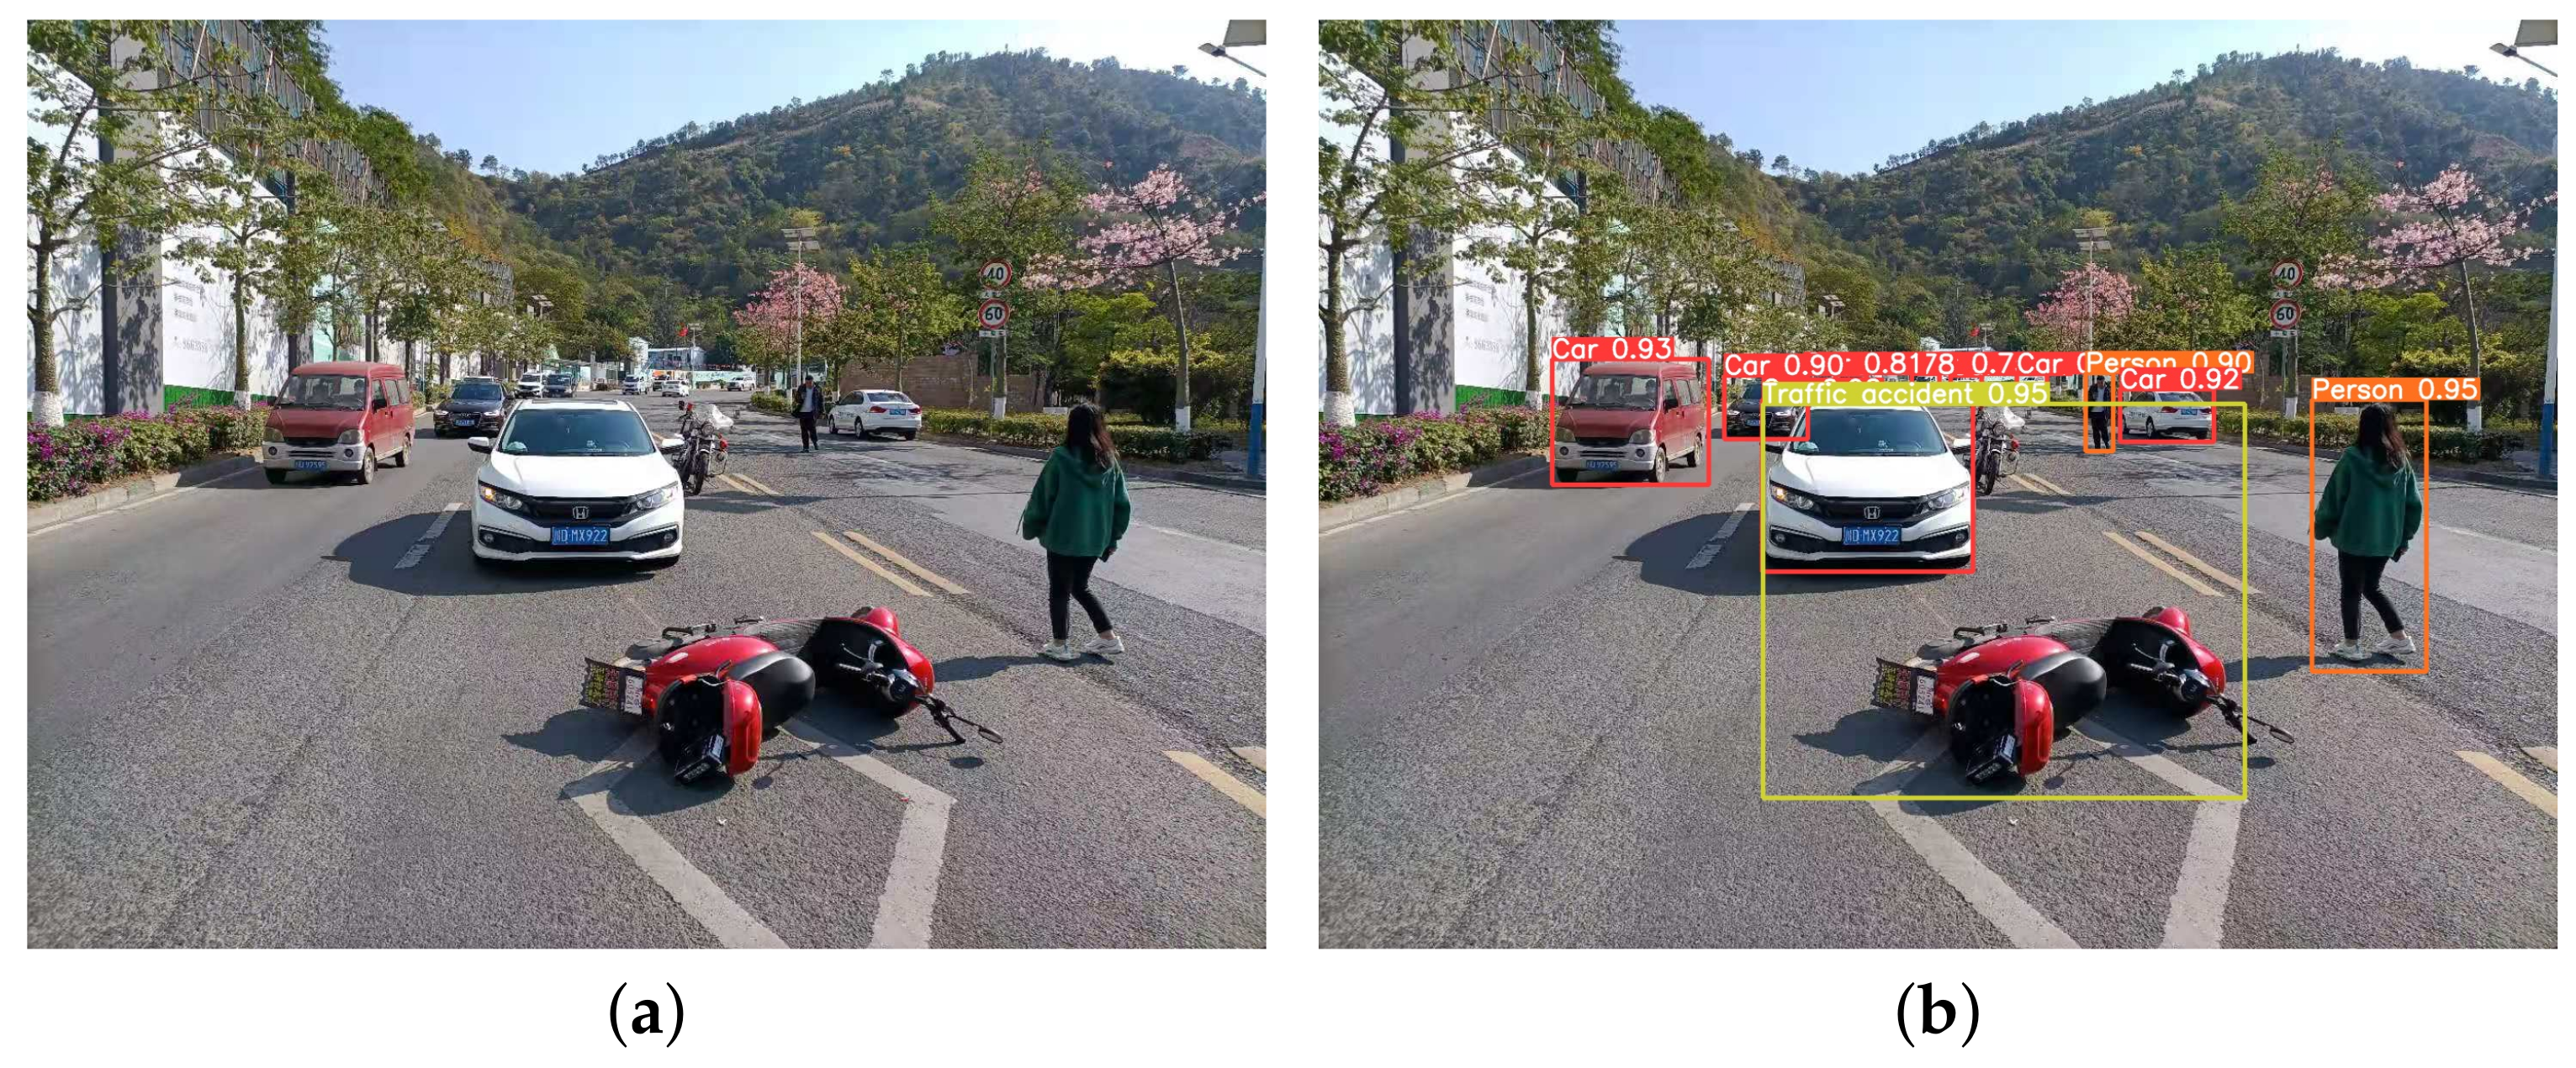
Figure 10 that all three models perform well under daylight conditions, and our improved model completes detection without any missed or false detections, while YOLOv5s has one false detection and YOLOv3 has three false detections. In
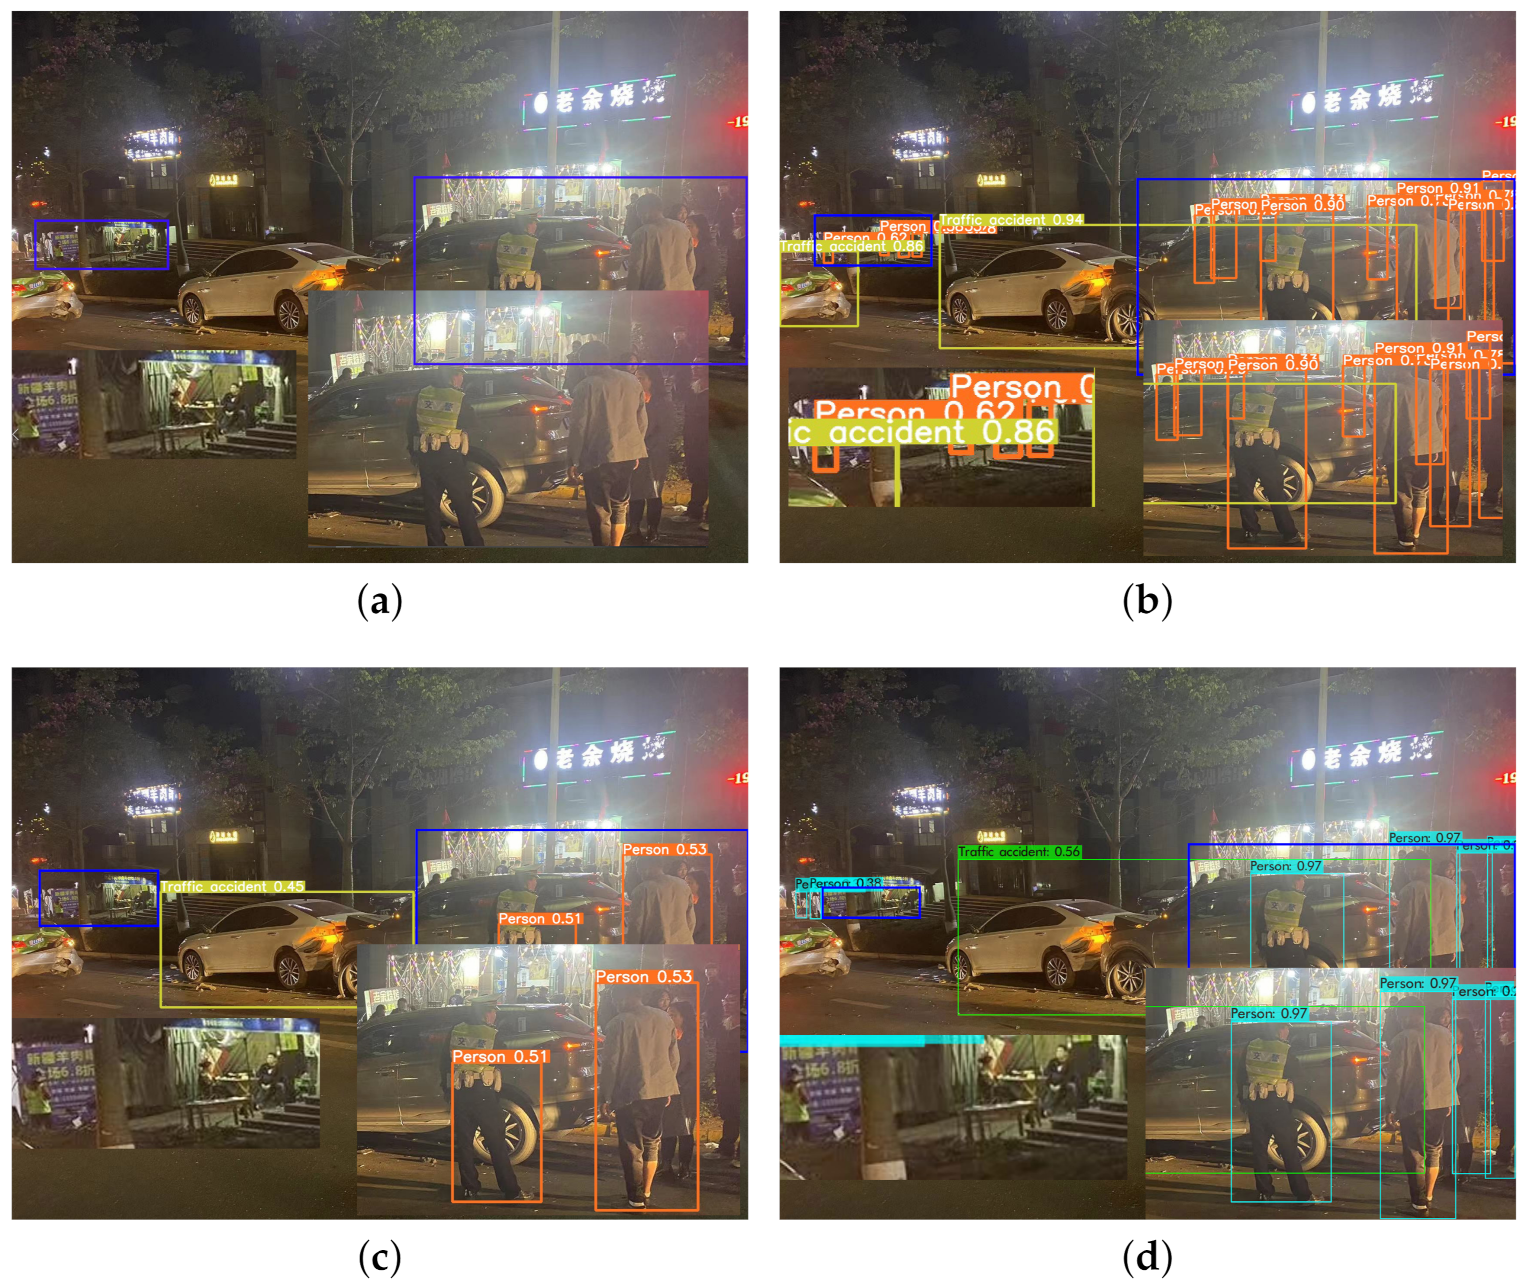
Figure 11, it can be found that our improved model detects all traffic accidents and pedestrians; YOLOv5s model is less effective in detecting small targets, and more pedestrians in the corners are not detected; YOLOv3 has some false detection cases, and incorrectly identifies signs as people.
In
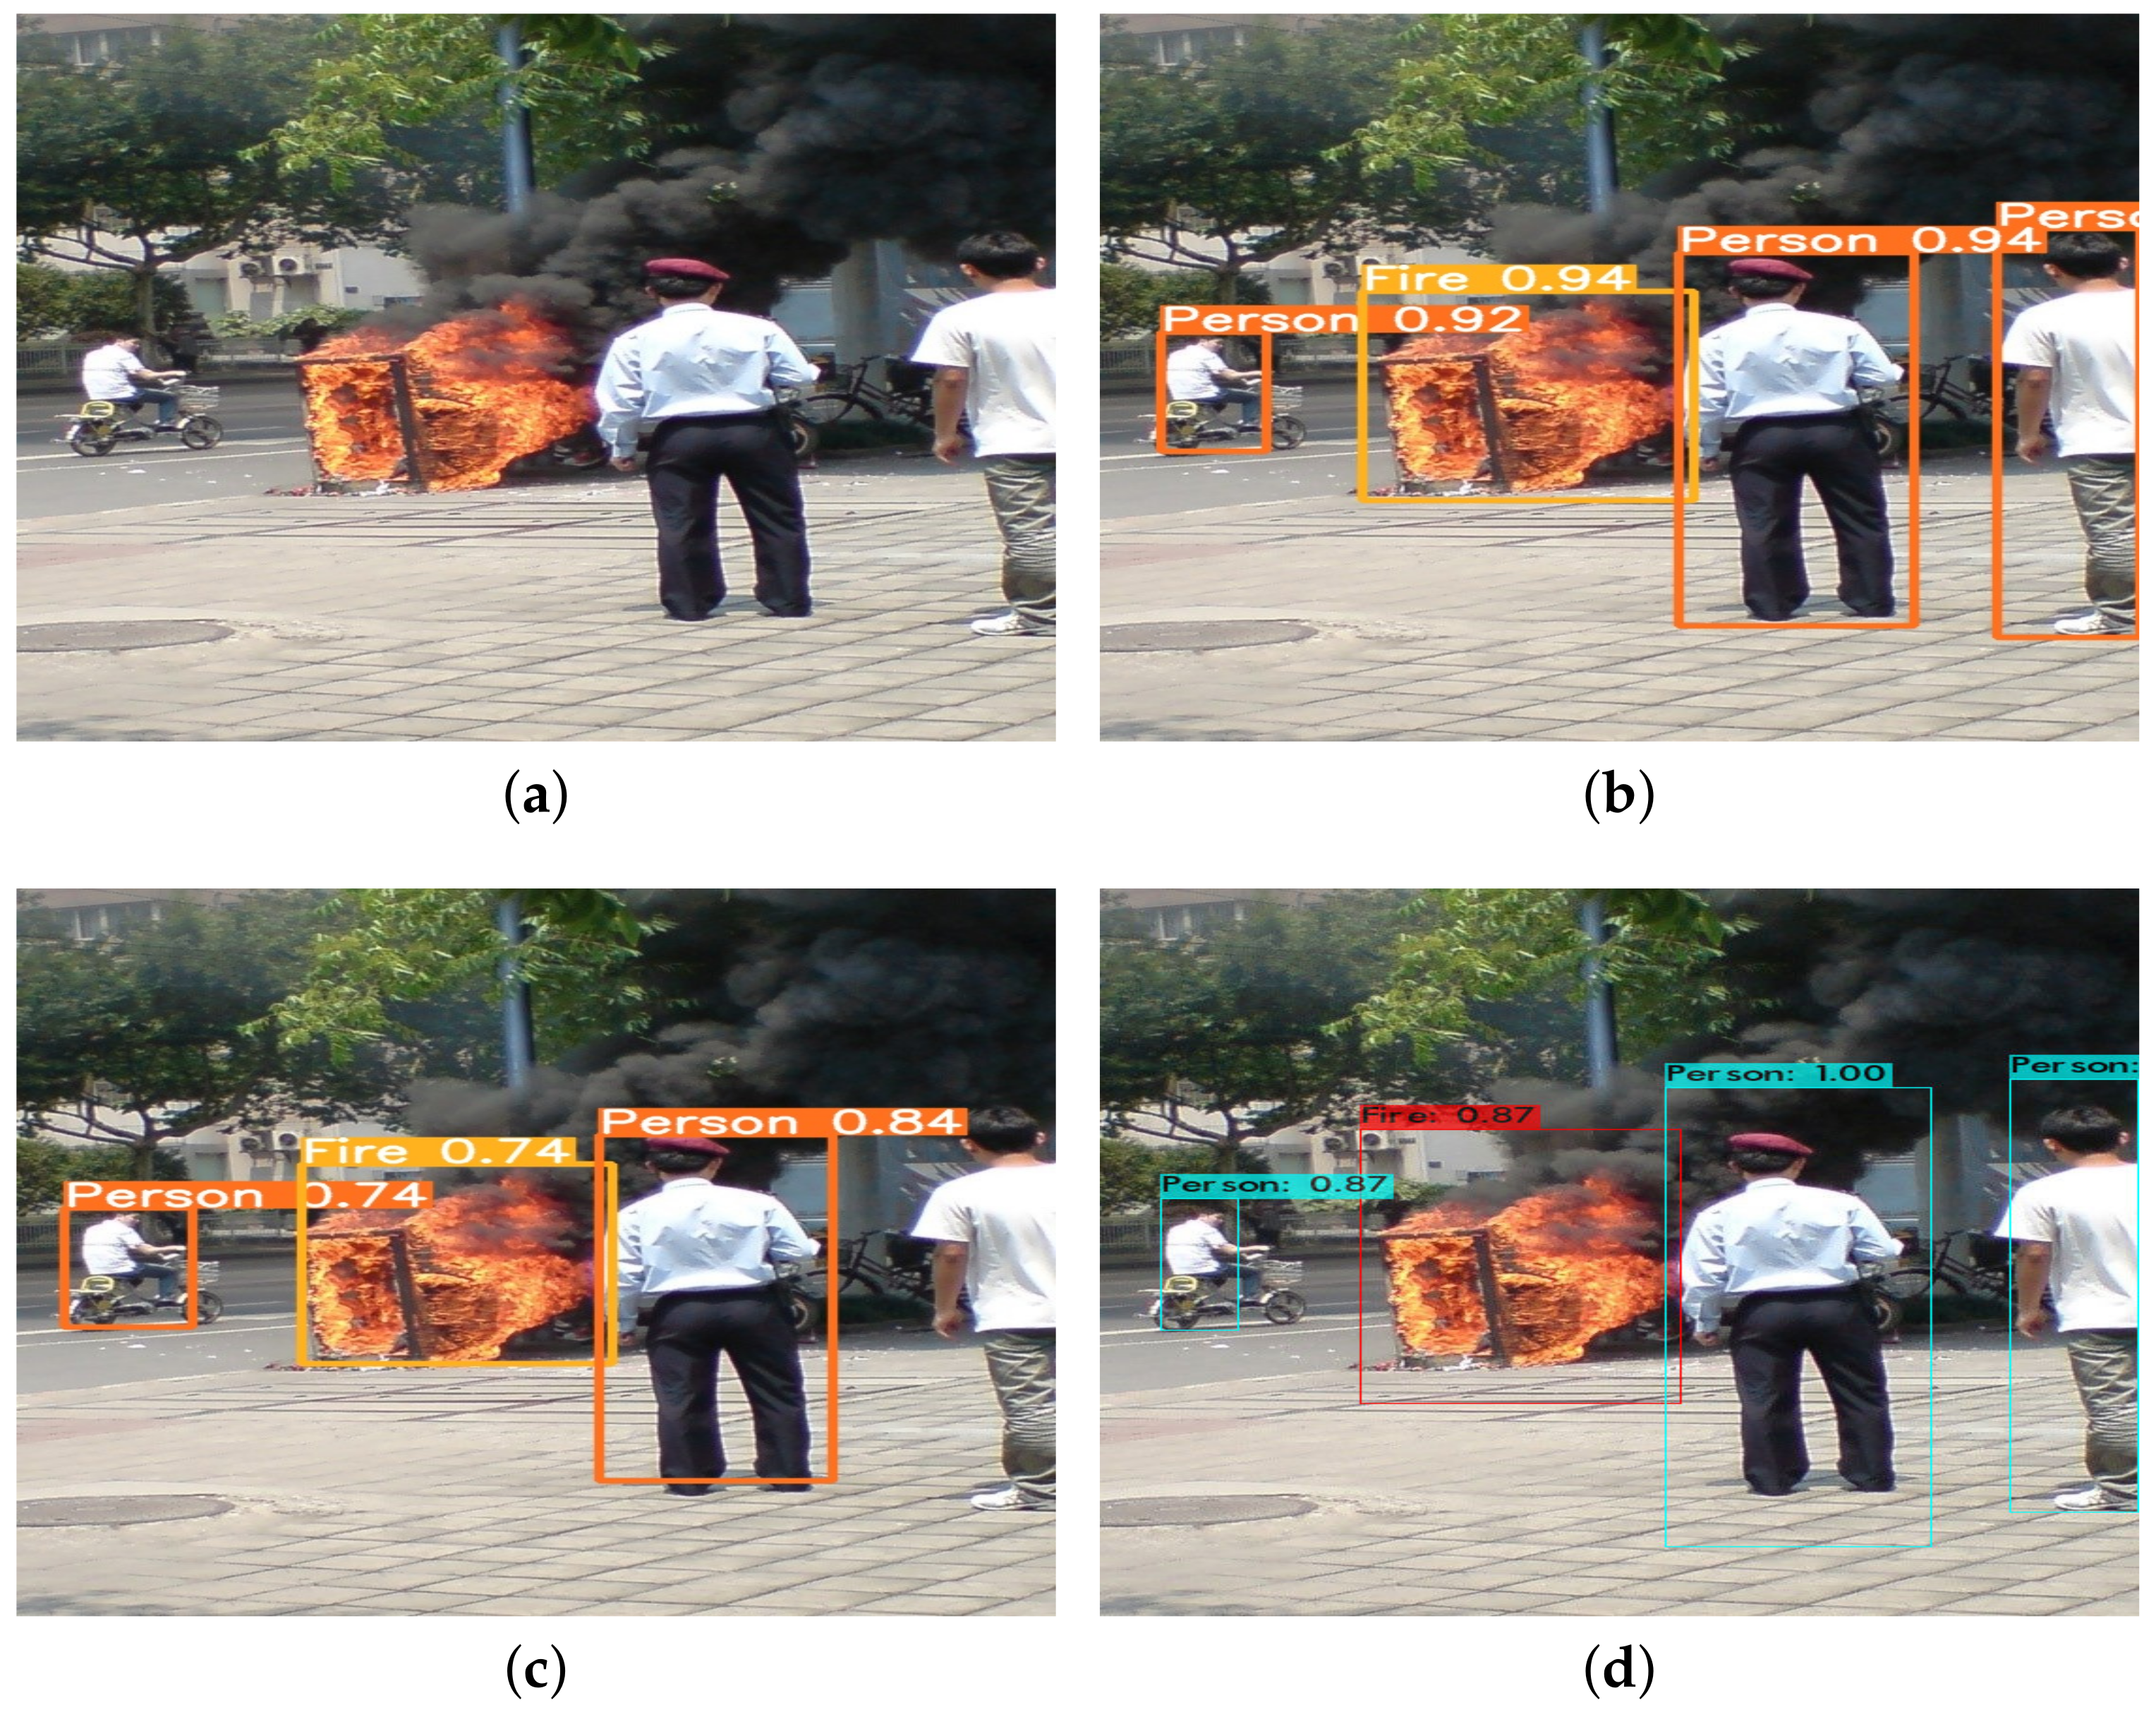
Figure 12, we tried to detect fires on the roadside with our model, and it can be seen from the figure that our model can detect and precisely locate all of them; YOLOv5s does not detect the person on the right side of the picture, and YOLOv3 detects the frame positioning too broadly.
The real-time detection of traffic incidents based on the mobile edge requires not only a high accuracy of the model but also a model that is lightweight enough to be deployed on the edge. The model we propose adds some modules and computational costs to YOLOv5, but based on this, we propose an improved YOLOv5s model. The detection results reveal that the detection model can detect multi-scale traffic incidents with good classification accuracy. Overall, it has higher object detection accuracy than previous models and can successfully avoid the problems of false detection and missed detection. The model can be used for traffic incident detection in complex real-life environments.
5. Discussion
Our experiments show that our improved model has good classification and localization accuracy. In the lightweight network model, the model has better performance in detecting small targets and targets in complex scenes, compared to YOLOv5s and YOLOv3 models. We believe that by replacing the SPP layer in YOLOv5 with the ASPP layer, the method can obtain richer feature information in the original image and enhance the network’s ability to acquire multi-scale context. Furthermore, the module of the fusion space and inter-layer attention mechanism is introduced at the neck end of the neural network. Its addition enables the neural network to focus more on key information and makes feature extraction more focused on finding effective features among image features that are significantly correlated with the current output, thus improving the accuracy of model detection. Finally, we added a small-scale detection layer to the neck of the network for higher-level abstract features. The addition of this detection head effectively improves the detection of small targets. Although our improvements to the model add more than 20,000 parameters to our model, its computation is reduced due to the nature of pyramidal pooling in the null space; the addition of the fused attention mechanism module instead of the original CSP module also partially reduces the computation and allows our improved model to have shorter detection times. We believe that this research can be widely applied to smart vehicles in the future, which can complement the existing roadside devices to perceive insufficient road traffic conditions. It should be noted that the future deployment of this research needs to take into account the occupancy of the network by real-time uploads from the same location, and further work is needed in terms of information data protection.
6. Conclusions
In summary, this study develops a real-time traffic event detector based on the improved YOLOv5 algorithm, and we propose to deploy the improved lightweight model on the vehicle side to compensate for the detection blindness of roadside detection devices due to pavement density. This research not only brings convenience to city managers, but also brings safety and travel convenience to citizens. Experiments show that our method is able to detect crowd gathering, vehicle gathering, traffic accidents, fires and other events in real time. Our improved YOLOv5s model has the highest F-1 and mAP scores compared with other classic models, reaching 84% and 84.2%, and the parameter amount is also in a lower range. Therefore, our proposed detection model has better traffic incident detection ability and higher adaptability in various environments.
Author Contributions
Conceptualization, Z.X.; methodology, Z.X.; software, Z.X.; validation, Z.X.; formal analysis, Z.X.; investigation, Z.X. and W.R.; resources, J.G.; data curation, Z.X. and J.W.; writing—original draft preparation Z.X. and H.Y.; writing—review and editing, H.Y. and J.G.; visualization, Z.X. and J.W.; project administration, J.G.; funding acquisition, H.Y. and J.G. All authors have read and agreed to the published version of the manuscript.
Funding
This research was funded partially by the Doctor’s Research Start-Up Fund of Hubei University of Automotive Technology (Grant NO. BK201604), partially by the Cross Research Fund of Medicine and Engineering “Star Program” of Shanghai Jiao Tong University (Grant NO. 21X010301687), partially by the 2020 Youth Research Innovation Program of School of Biomedical Engineering, Shanghai Jiao Tong University (Grant NO. WF108108203/052), and partially by the 2020 Initiation Plan for New Young Teachers of Shanghai Jiao Tong University (Grant NO. 21X010500701).
Data Availability Statement
The data are not publicly available due to these data are also part of ongoing research.
Conflicts of Interest
The authors declare no conflict of interest.
References
- El Hatri, C.; Boumhidi, J. Fuzzy deep learning based urban traffic incident detection. Cogn. Syst. Res. 2018, 50, 206–213. [Google Scholar] [CrossRef]
- Traore, B.B.; Kamsu-Foguem, B.; Tangara, F. Deep convolution neural network for image recognition. Ecol. Informat. 2018, 48, 257–268. [Google Scholar] [CrossRef]
- Zhu, Q. Research on road traffic situation awareness system based on image big data. IEEE Intell. Syst. 2019, 35, 18–26. [Google Scholar] [CrossRef]
- Zhang, T.; Sun, L.; Yao, L.; Rong, J. Impact analysis of land use on traffic congestion using real-time traffic and POI. J. Adv. Transp. 2017, 2017, 7164790. [Google Scholar] [CrossRef]
- de Luca, S.; Di Pace, R.; Memoli, S.; Pariota, L. Sustainable traffic management in an urban area: An integrated framework for real-time traffic control and route guidance design. Sustainability 2020, 12, 726. [Google Scholar] [CrossRef]
- Petty, K.F.; Ostland, M.; Kwon, J.; Rice, J.; Bickel, P.J. A new methodology for evaluating incident detection algorithms. Transp. Res. Part C Emerg. Technol. 2002, 10, 189–204. [Google Scholar] [CrossRef]
- Hawas, Y.E. A fuzzy-based system for incident detection in urban street networks. Transp. Res. Part C Emerg. Technol. 2007, 15, 69–95. [Google Scholar] [CrossRef]
- Kinoshita, A.; Takasu, A.; Adachi, J. Real-time traffic incident detection using a probabilistic topic model. Inf. Syst. 2015, 54, 169–188. [Google Scholar] [CrossRef]
- Shang, P.; Li, X.; Kamae, S. Chaotic analysis of traffic time series. Chaos Solitons Fractals 2005, 25, 121–128. [Google Scholar] [CrossRef]
- Jiang, S.; Wang, S.; Li, Z.; Guo, W.; Pei, X. Fluctuation similarity modeling for traffic flow time series: A clustering approach. In Proceedings of the 2015 IEEE 18th International Conference on Intelligent Transportation Systems, Canaria, Spain, 15–18 September 2015; pp. 848–853. [Google Scholar]
- Wang, J.; Li, X.; Liao, S.S.; Hua, Z. A hybrid approach for automatic incident detection. IEEE Trans. Intell. Transp. Syst. 2013, 14, 1176–1185. [Google Scholar] [CrossRef]
- Atefeh, F.; Khreich, W. A survey of techniques for event detection in twitter. Comput. Intell. 2015, 31, 132–164. [Google Scholar] [CrossRef]
- Dabiri, S.; Heaslip, K. Developing a Twitter-based traffic event detection model using deep learning architectures. Expert Syst. Appl. 2019, 118, 425–439. [Google Scholar] [CrossRef]
- Chakraborty, P.; Sharma, A.; Hegde, C. Freeway traffic incident detection from cameras: A semi-supervised learning approach. In Proceedings of the 2018 21st International Conference on Intelligent Transportation Systems (ITSC), Maui, HI, USA, 4–7 November 2018; pp. 1840–1845. [Google Scholar]
- Bao, L.; Wang, Q.; Qu, W.; Mo, X. Research on Highway Traffic Event Detection Method Based on Image Processing. In Proceedings of the IOP Conference Series: Earth and Environmental Science, Surakarta, Indonesia, 24–25 August 2021; Volume 791, p. 012193. [Google Scholar]
- Sivaraman, S.; Trivedi, M.M. Looking at vehicles on the road: A survey of vision-based vehicle detection, tracking, and behavior analysis. IEEE Trans. Intell. Transp. Syst. 2013, 14, 1773–1795. [Google Scholar] [CrossRef]
- Misnan, M.F.; Arshad, N.H.M.; Shauri, R.L.A.; Abd Razak, N.; Thamrin, N.M.; Mahmud, S.F. Real-time vision based sensor implementation on unmanned aerial vehicle for features detection technique of low altitude mapping. In Proceedings of the 2013 IEEE Conference on Systems, Process & Control (ICSPC), Kuala Lumpur, Malaysia, 13–15 December 2013; pp. 289–294. [Google Scholar]
- Kim, G.; Cho, J.S. Vision-based vehicle detection and inter-vehicle distance estimation. In Proceedings of the 2012 12th International Conference on Control, Automation and Systems, Jeju Island, Korea, 17–21 October 2012; pp. 625–629. [Google Scholar]
- Li, X.; Guo, X. Vision-based method for forward vehicle detection and tracking. In Proceedings of the 2013 International Conference on Mechanical and Automation Engineering, Jiujang, China, 21–23 July 2013; pp. 128–131. [Google Scholar]
- Sivaraman, S.; Trivedi, M.M. A review of recent developments in vision-based vehicle detection. In Proceedings of the 2013 IEEE Intelligent Vehicles Symposium (IV), Gold Coast City, Australia, 23–26 June 2013; pp. 310–315. [Google Scholar]
- Cheon, M.; Lee, W.; Yoon, C.; Park, M. Vision-based vehicle detection system with consideration of the detecting location. IEEE Trans. Intell. Transp. Syst. 2012, 13, 1243–1252. [Google Scholar] [CrossRef]
- Redmon, J.; Divvala, S.; Girshick, R.; Farhadi, A. You only look once: Unified, real-time object detection. In Proceedings of the IEEE Conference on Computer Vision and Pattern Recognition, Las Vegas, NV, USA, 27–30 June 2016; pp. 779–788. [Google Scholar]
- Redmon, J.; Farhadi, A. YOLO9000: Better, faster, stronger. In Proceedings of the IEEE Conference on Computer Vision and Pattern Recognition, Honolulu, HI, USA, 21–26 July 2017; pp. 7263–7271. [Google Scholar]
- Redmon, J.; Farhadi, A. Yolov3: An incremental improvement. arXiv 2018, arXiv:1804.02767. [Google Scholar]
- Bochkovskiy, A.; Wang, C.Y.; Liao, H.Y.M. Yolov4: Optimal speed and accuracy of object detection. arXiv 2020, arXiv:2004.10934. [Google Scholar]
- Ge, Z.; Liu, S.; Wang, F.; Li, Z.; Sun, J. Yolox: Exceeding yolo series in 2021. arXiv 2021, arXiv:2107.08430. [Google Scholar]
- Girshick, R.; Donahue, J.; Darrell, T.; Malik, J. Rich feature hierarchies for accurate object detection and semantic segmentation. In Proceedings of the IEEE Conference on Computer Vision and Pattern Recognition, Columbus, OH, USA, 23–28 June 2014; pp. 580–587. [Google Scholar]
- Girshick, R. Fast r-cnn. In Proceedings of the IEEE International Conference on Computer Vision, Santiago, Chile, 7–13 December 2015; pp. 1440–1448. [Google Scholar]
- Ren, S.; He, K.; Girshick, R.; Sun, J. Faster r-cnn: Towards real-time object detection with region proposal networks. arXiv 2015, arXiv:1506.01497. [Google Scholar] [CrossRef]
- Liang, H.; Song, H.; Yun, X.; Sun, S.; Wang, Y.; Zhang, Z. Traffic incident detection based on a global trajectory spatiotemporal map. Complex Intell. Syst. 2022, 8, 1389–1408. [Google Scholar] [CrossRef]
- Yao, Y.; Xu, M.; Wang, Y.; Crandall, D.J.; Atkins, E.M. Unsupervised traffic accident detection in first-person videos. In Proceedings of the 2019 IEEE/RSJ International Conference on Intelligent Robots and Systems (IROS), Macau, China, 3–8 November 2019; pp. 273–280. [Google Scholar]
- Geiger, A.; Lenz, P.; Urtasun, R. Are we ready for autonomous driving? The kitti vision benchmark suite. In Proceedings of the 2012 IEEE Conference on Computer Vision and Pattern Recognition, Providence, RI, USA, 16–21 June 2012; pp. 3354–3361. [Google Scholar]
- Geiger, A.; Lenz, P.; Stiller, C.; Urtasun, R. Vision meets robotics: The kitti dataset. Int. J. Robot. Res. 2013, 32, 1231–1237. [Google Scholar] [CrossRef]
- Ko, B.C.; Ham, S.J.; Nam, J.Y. Modeling and formalization of fuzzy finite automata for detection of irregular fire flames. IEEE Trans. Circuits Syst. Video Technol. 2011, 21, 1903–1912. [Google Scholar] [CrossRef]
- Park, J.; Ko, B.; Nam, J.Y.; Kwak, S. Wildfire smoke detection using spatiotemporal bag-of-features of smoke. In Proceedings of the 2013 IEEE Workshop on Applications of Computer Vision (WACV), Clearwater Beach, FL, USA, 15–17 January 2013; pp. 200–205. [Google Scholar]
- Ko, B.C.; Hwang, H.J.; Nam, J.Y. Nonparametric membership functions and fuzzy logic for vision sensor-based flame detection. Opt. Eng. 2010, 49, 127202. [Google Scholar] [CrossRef]
- Ko, B.; Cheong, K.H.; Nam, J.Y. Early fire detection algorithm based on irregular patterns of flames and hierarchical Bayesian Networks. Fire Saf. J. 2010, 45, 262–270. [Google Scholar] [CrossRef]
- Ko, B.C.; Cheong, K.H.; Nam, J.Y. Fire detection based on vision sensor and support vector machines. Fire Saf. J. 2009, 44, 322–329. [Google Scholar] [CrossRef]
- Wang, C.Y.; Liao, H.Y.M.; Wu, Y.H.; Chen, P.Y.; Hsieh, J.W.; Yeh, I.H. CSPNet: A new backbone that can enhance learning capability of CNN. In Proceedings of the IEEE/CVF Conference on Computer Vision and Pattern Recognition, Seattle, WA, USA, 14–19 June 2020; pp. 390–391. [Google Scholar]
- Han, K.; Wang, Y.; Tian, Q.; Guo, J.; Xu, C.; Xu, C. Ghostnet: More features from cheap operations. In Proceedings of the IEEE/CVF Conference on Computer Vision and Pattern Recognition, Seattle, WA, USA, 14–19 June 2020; pp. 1580–1589. [Google Scholar]
- Yu, F.; Koltun, V.; Funkhouser, T. Dilated residual networks. In Proceedings of the IEEE Conference on Computer Vision and Pattern Recognition, Honolulu, HI, USA, 21–26 July 2017; pp. 472–480. [Google Scholar]
- Ziegler, T.; Fritsche, M.; Kuhn, L.; Donhauser, K. Efficient smoothing of dilated convolutions for image segmentation. arXiv 2019, arXiv:1903.07992. [Google Scholar]
- Yu, F.; Koltun, V. Multi-scale context aggregation by dilated convolutions. arXiv 2015, arXiv:1511.07122. [Google Scholar]
- Chen, L.C.; Papandreou, G.; Schroff, F.; Adam, H. Rethinking atrous convolution for semantic image segmentation. arXiv 2017, arXiv:1706.05587. [Google Scholar]
- Wang, F.; Jiang, M.; Qian, C.; Yang, S.; Li, C.; Zhang, H.; Wang, X.; Tang, X. Residual attention network for image classification. In Proceedings of the IEEE Conference on Computer Vision and Pattern Recognition, Honolulu, HI, USA, 21–26 July 2017; pp. 3156–3164. [Google Scholar]
- Hu, J.; Shen, L.; Sun, G. Squeeze-and-excitation networks. In Proceedings of the IEEE Conference on Computer Vision and Pattern Recognition, Salt Lake City, UT, USA, 18–22 June 2018; pp. 7132–7141. [Google Scholar]
- Woo, S.; Park, J.; Lee, J.Y.; Kweon, I.S. Cbam: Convolutional block attention module. In Proceedings of the European Conference on Computer Vision (ECCV), Munich, Germany, 8–14 September 2018; pp. 3–19. [Google Scholar]
- Liu, S.; Qi, L.; Qin, H.; Shi, J.; Jia, J. Path aggregation network for instance segmentation. In Proceedings of the IEEE Conference on Computer Vision and Pattern Recognition, Salt Lake City, UT, USA, 18–22 June 2018; pp. 8759–8768. [Google Scholar]
Figure 1.
The figure shows examples of data sets of cars, pedestrians, traffic accidents and fires.
Figure 1.
The figure shows examples of data sets of cars, pedestrians, traffic accidents and fires.
Figure 2.
Example of a rainy weather image added by sample enhancement.
Figure 2.
Example of a rainy weather image added by sample enhancement.
Figure 3.
After directional data enhancement, the number of labels of different categories.
Figure 3.
After directional data enhancement, the number of labels of different categories.
Figure 4.
The structure diagram of the improved YOLOv5s model with ASPP (Atrous Convolutional pyramidal pooling) added to the backbone network, CBAM (fused attention mechanism) introduced at the neck end, and a detection scale added at the prediction end.
Figure 4.
The structure diagram of the improved YOLOv5s model with ASPP (Atrous Convolutional pyramidal pooling) added to the backbone network, CBAM (fused attention mechanism) introduced at the neck end, and a detection scale added at the prediction end.
Figure 5.
Atrous convolution structure.
Figure 5.
Atrous convolution structure.
Figure 6.
Atrous spatial pyramid structure.
Figure 6.
Atrous spatial pyramid structure.
Figure 7.
Fusion attention mechanism structure.
Figure 7.
Fusion attention mechanism structure.
Figure 8.
Improved PANet network structure.
Figure 8.
Improved PANet network structure.
Figure 9.
Relationship between mAP curve and period of different models.
Figure 9.
Relationship between mAP curve and period of different models.
Figure 10.
The effect of complex environment detection under daylight. Where (a) shows the original figure; (b) shows our proposed improved YOLOv5s network detection effect; (c) shows YOLOv5s detection effect; (d) shows YOLOv3 detection effect.
Figure 10.
The effect of complex environment detection under daylight. Where (a) shows the original figure; (b) shows our proposed improved YOLOv5s network detection effect; (c) shows YOLOv5s detection effect; (d) shows YOLOv3 detection effect.
Figure 11.
The detection effect of complex environment at night. Where (a) shows the original figure; (b) shows our proposed improved YOLOv5s network detection effect; (c) shows YOLOv5s detection effect; (d) shows YOLOv3 detection effect.
Figure 11.
The detection effect of complex environment at night. Where (a) shows the original figure; (b) shows our proposed improved YOLOv5s network detection effect; (c) shows YOLOv5s detection effect; (d) shows YOLOv3 detection effect.
Figure 12.
Example of fire detection effect. Among them, (a) shows the original figure; (b) shows the effect of our proposed improved YOLOv5s network detection; (c) shows the detection effect of YOLOv5s; (d) shows the detection effect of YOLOv3.
Figure 12.
Example of fire detection effect. Among them, (a) shows the original figure; (b) shows the effect of our proposed improved YOLOv5s network detection; (c) shows the detection effect of YOLOv5s; (d) shows the detection effect of YOLOv3.
Table 1.
Local computing resources and CNN environments.
Table 1.
Local computing resources and CNN environments.
| Testing Environment | Configuration Parameter |
|---|
| OS | Ubuntu18.04 |
| CPU | i7-7700 |
| GPU | GTX1060 |
| RAM | 8 GB DDR4 |
| GPU acceleration env | CUDA 11.6 |
| Comp. Vision lib | OpenCV 4.5.1 |
| Framework | PyTorch 1.9.0 |
Table 2.
Comparison of mAP, F1 score, detection speed and parameter quantity of different models.
Table 2.
Comparison of mAP, F1 score, detection speed and parameter quantity of different models.
| Detection Model | F1-Score | mAP | Detection Time (ms) | Parameters |
|---|
| YOLOv3 | 0.75 | 0.760 | 32.6 | 61,545,274 |
| YOLOV5s | 0.76 | 0.809 | 24.2 | 7,042,336 |
| Ours | 0.84 | 0.842 | 19.6 | 7,064,698 |
| Publisher’s Note: MDPI stays neutral with regard to jurisdictional claims in published maps and institutional affiliations. |
© 2022 by the authors. Licensee MDPI, Basel, Switzerland. This article is an open access article distributed under the terms and conditions of the Creative Commons Attribution (CC BY) license (https://creativecommons.org/licenses/by/4.0/).


