
Toward Semi-Supervised Graphical Object Detection in Document Images

 ,
,  ,
, 
 ,
, 
Abstract
1. Introduction
2. Related Work
2.1. Rule-Based Methods
2.2. Learning-Based Methods
2.3. Deep Learning Methods
2.4. Semi-Supervised Approaches
3. Proposed Framework
3.1. Limitations
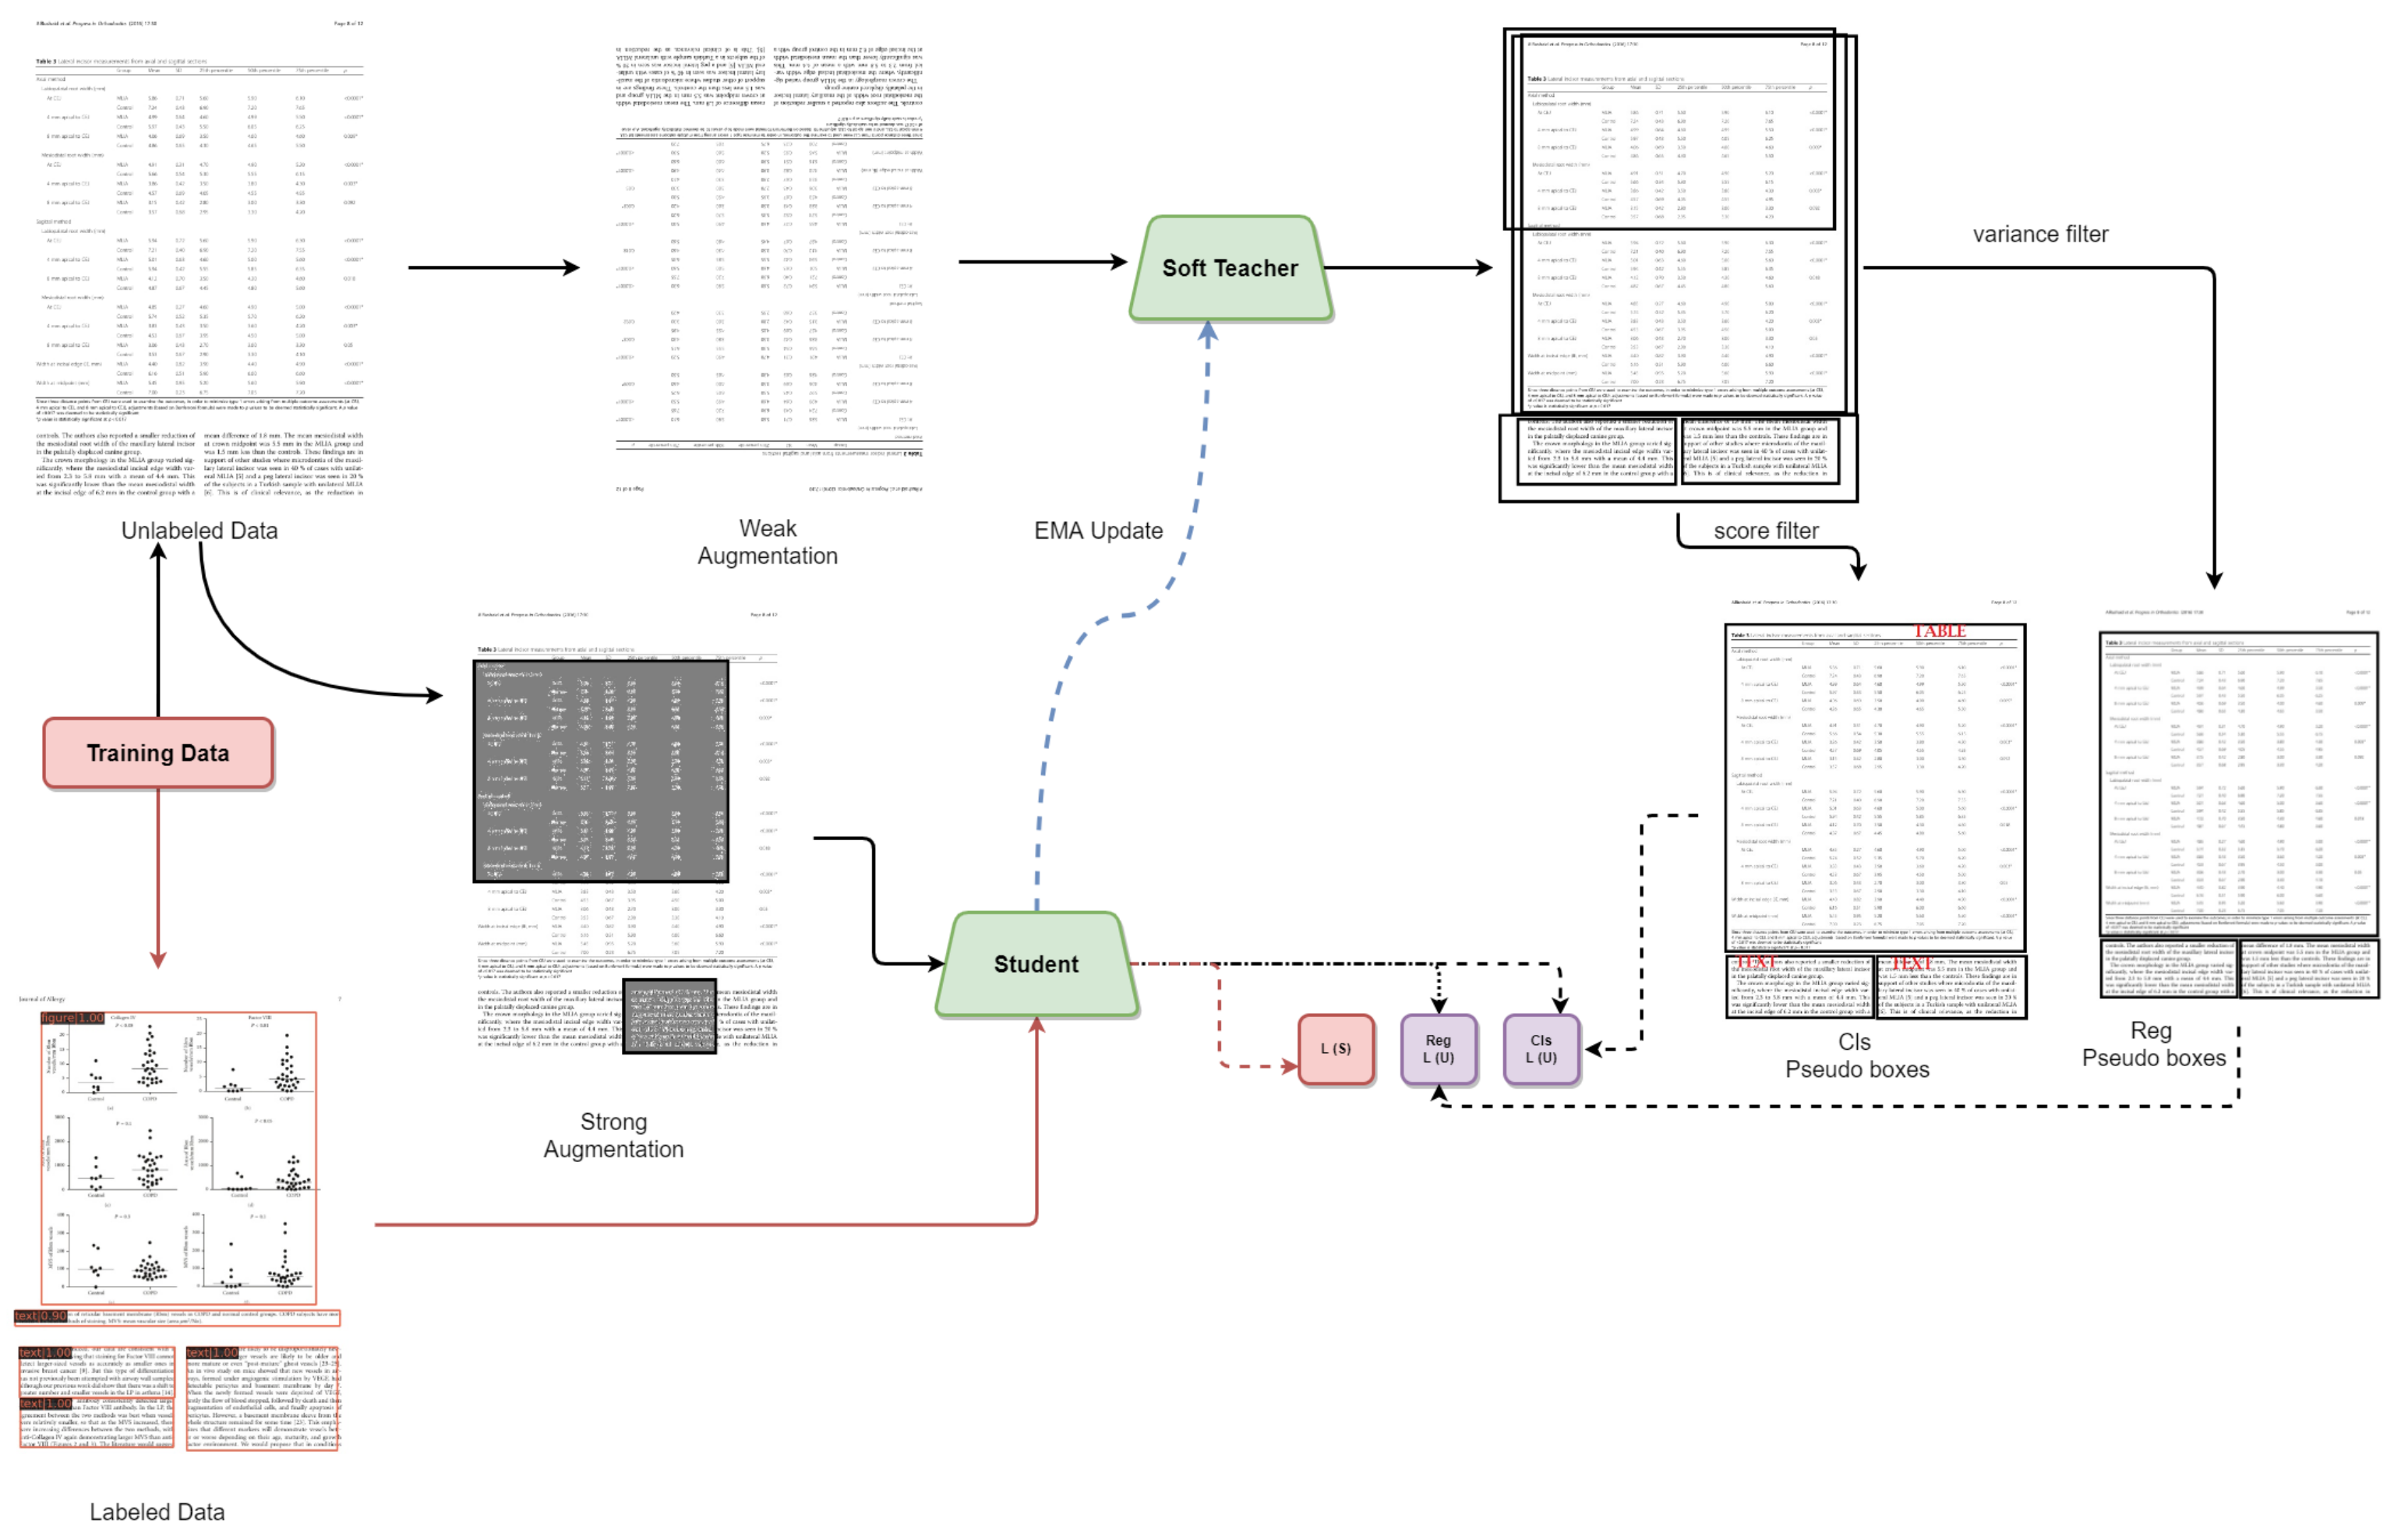
3.2. Soft Teacher
3.3. Box Jittering
4. Experiments
4.1. Datasets
4.1.1. Publaynet
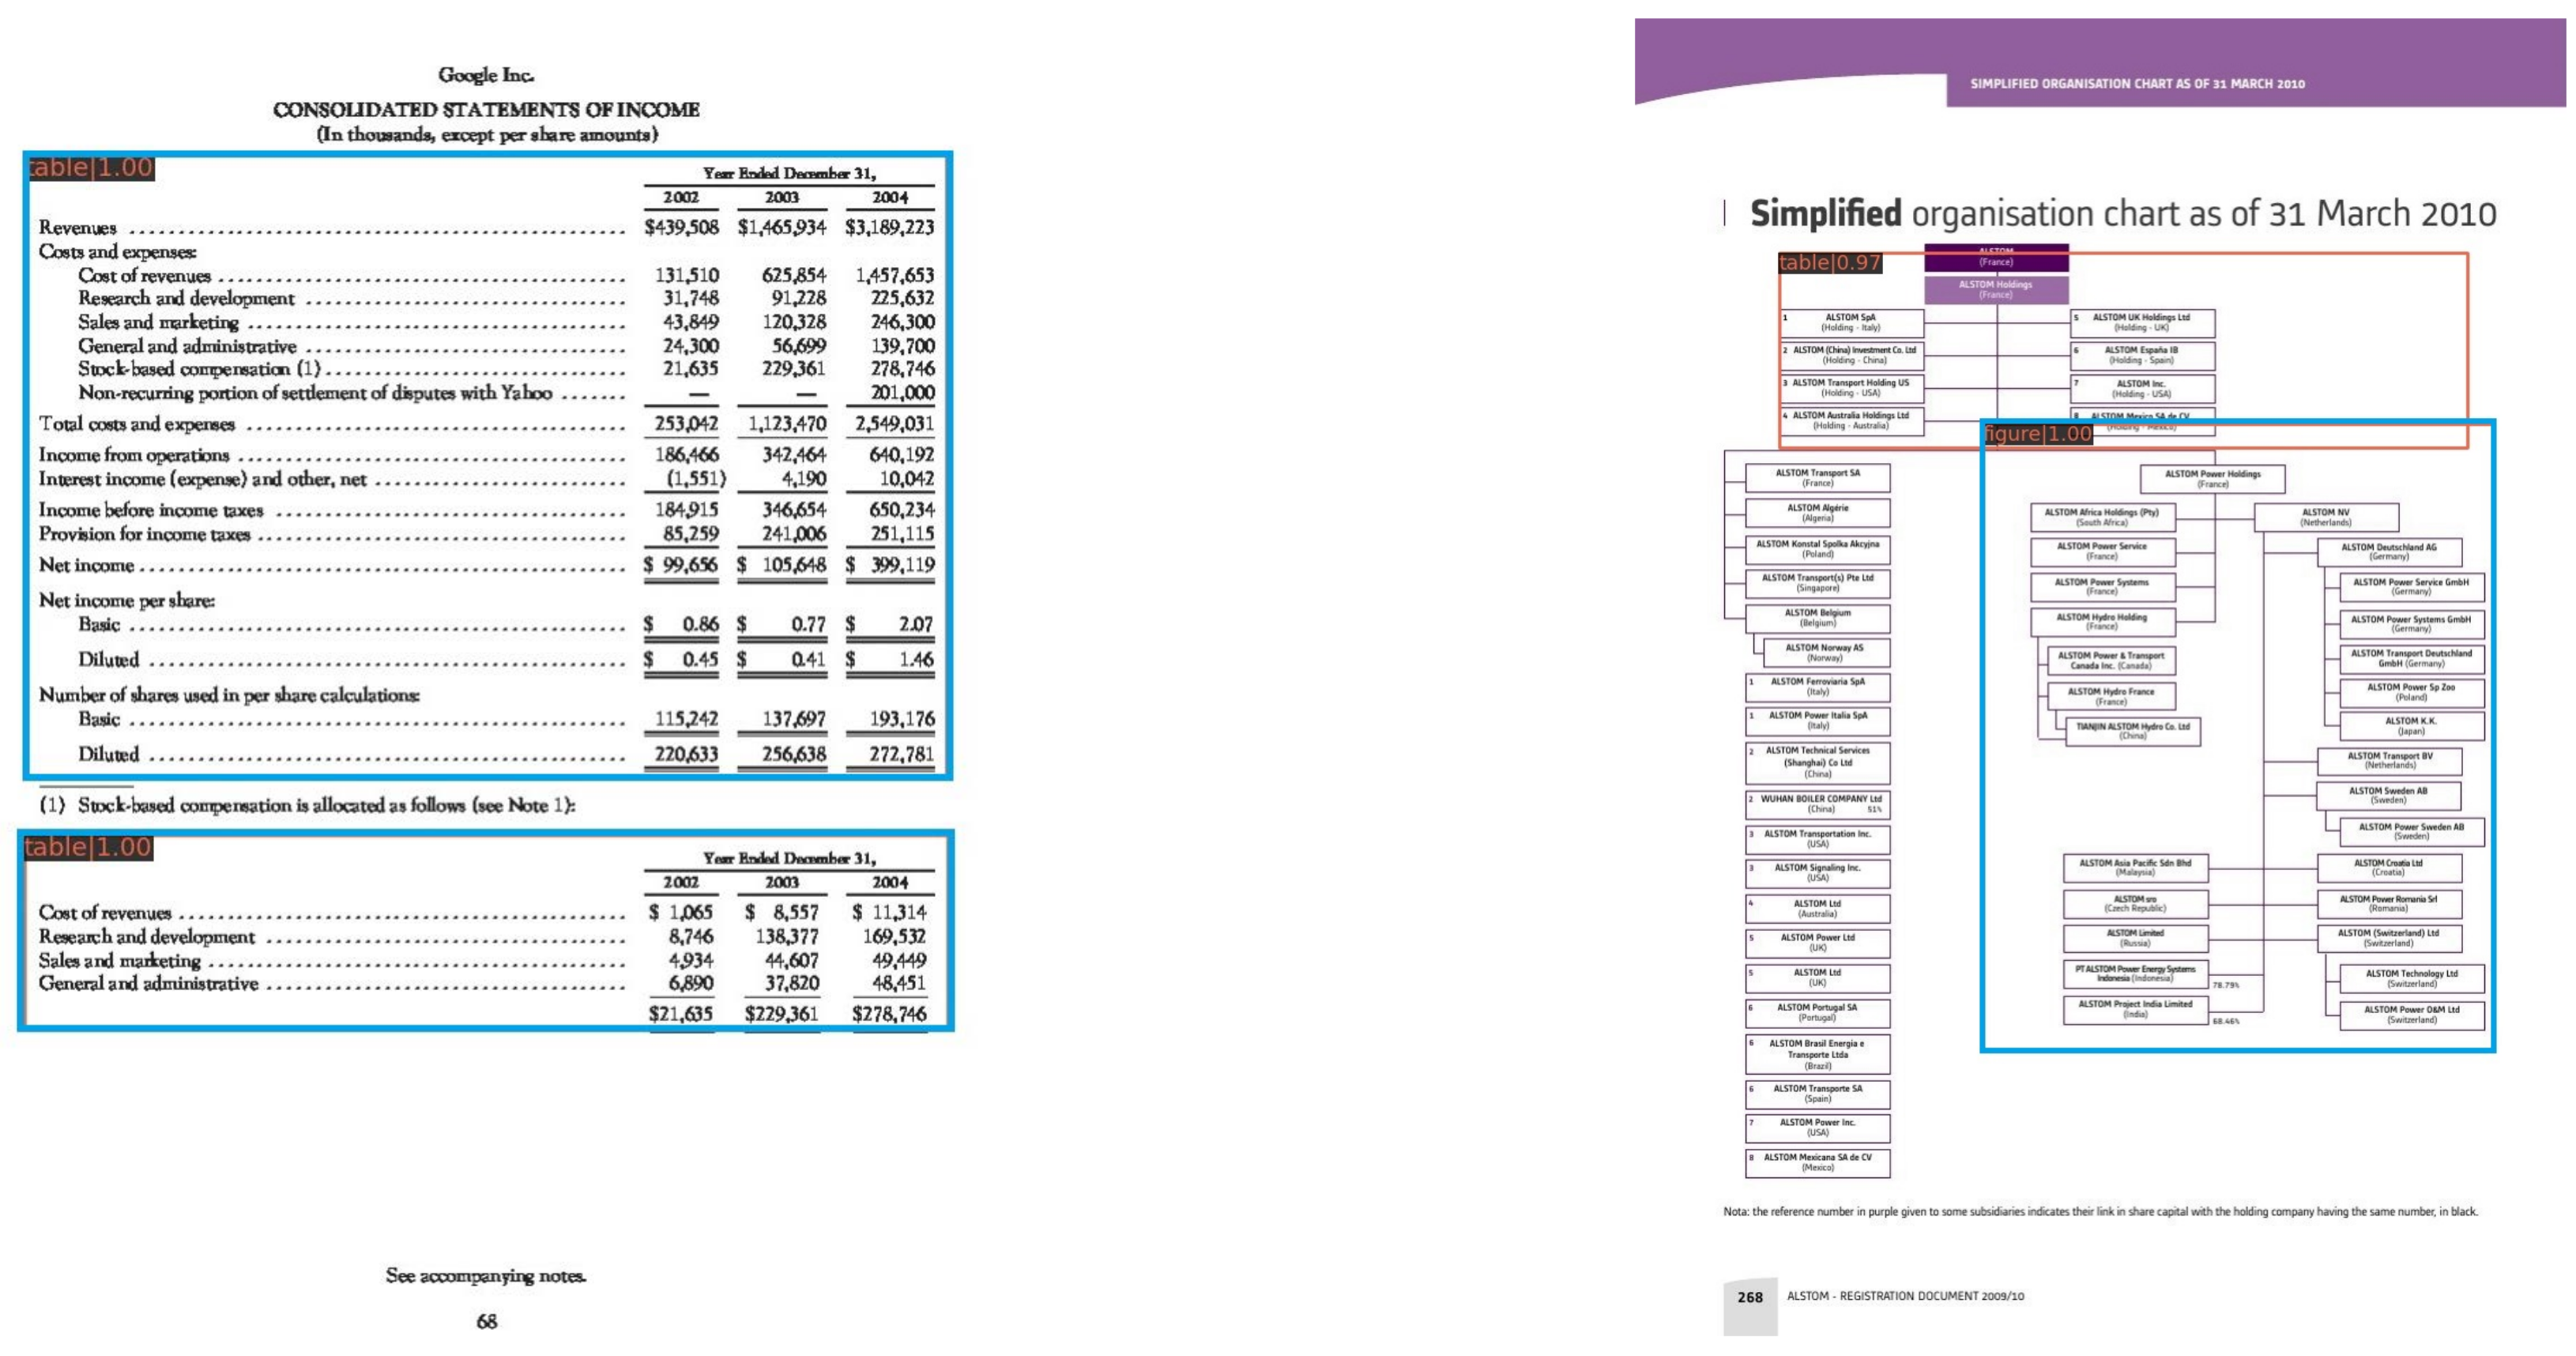
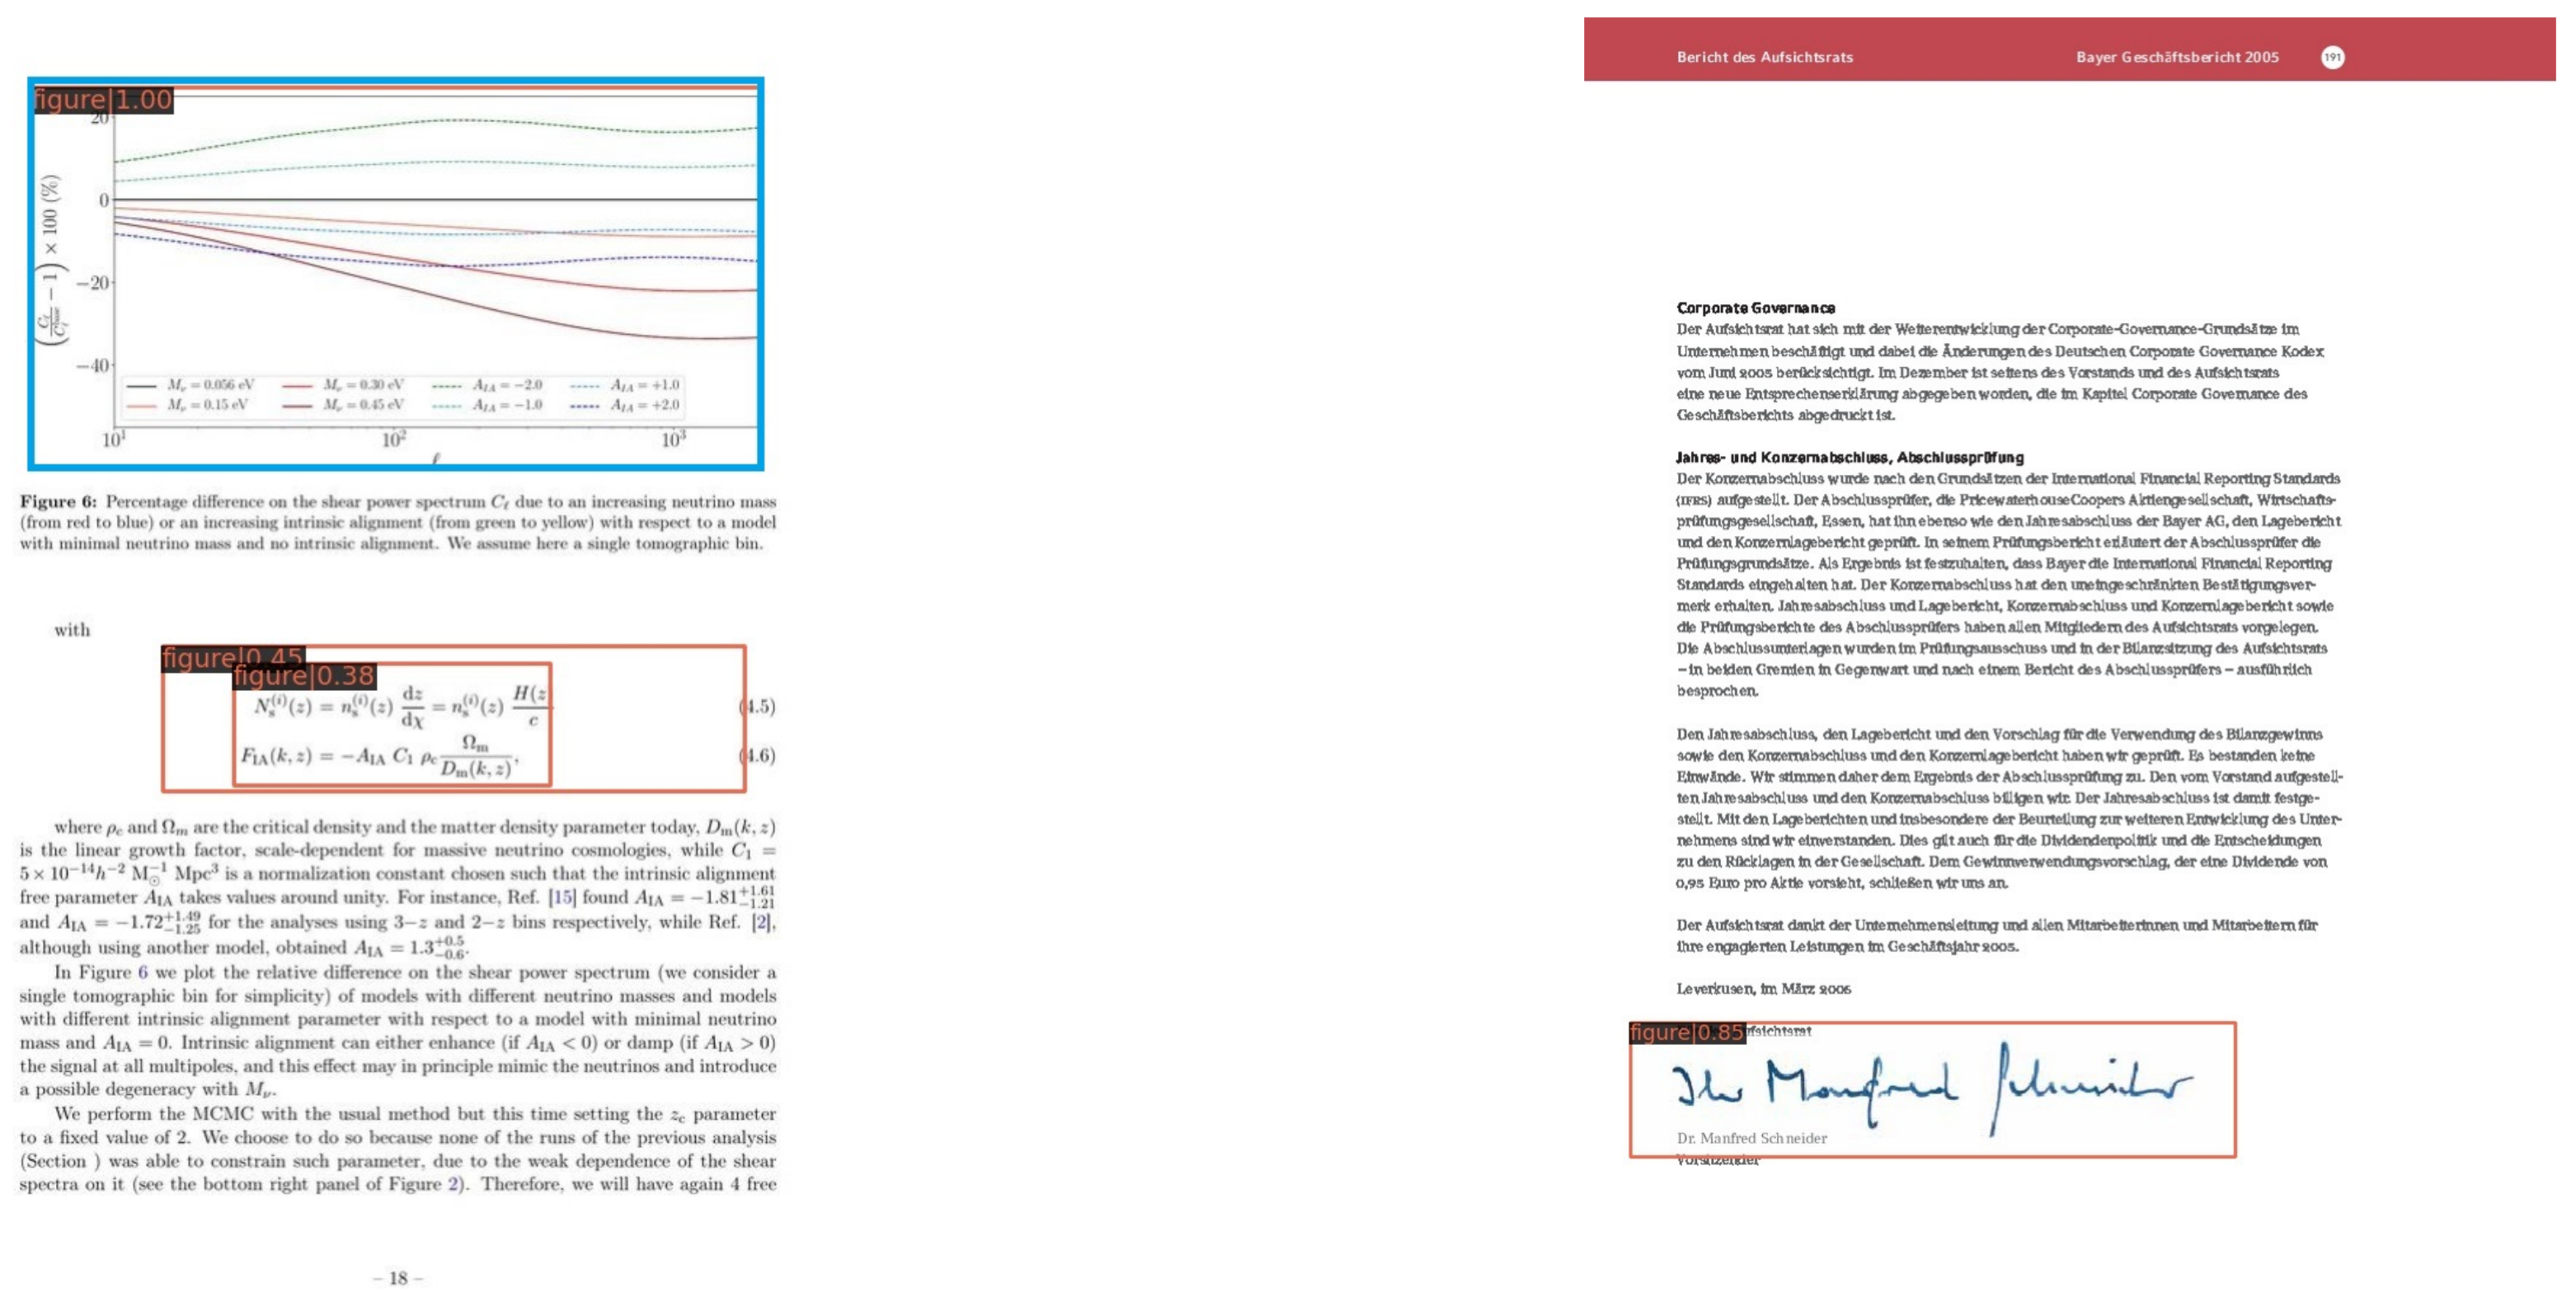
4.1.2. IIIT-AR-13K
4.1.3. Docbank
4.2. Evaluation Protocol
4.2.1. Precision
4.2.2. Recall
4.2.3. F1-Score
4.2.4. Intersection over Union (IoU)
4.2.5. Average Precision (Ap)
4.2.6. Mean Average Precision (Map)
4.3. Implementation Details
4.4. Results and Discussion
4.4.1. Publaynet
4.4.2. IIIT-AR-13K
4.4.3. Cross-Validation
5. Conclusions and Future Work
Author Contributions
Funding
Institutional Review Board Statement
Informed Consent Statement
Data Availability Statement
Conflicts of Interest
References
- Orosz, T.; Vági, R.; Csányi, G.M.; Nagy, D.; Üveges, I.; Vadász, J.P.; Megyeri, A. Evaluating Human versus Machine Learning Performance in a LegalTech Problem. Appl. Sci. 2021, 12, 297. [Google Scholar] [CrossRef]
- Fang, J.; Gao, L.; Bai, K.; Qiu, R.; Tao, X.; Tang, Z. A Table Detection Method for Multipage PDF Documents via Visual Seperators and Tabular Structures. In Proceedings of the 2011 International Conference on Document Analysis and Recognition, ICDAR 2011, Beijing, China, 18–21 September 2011; IEEE Computer Society: Piscataway, NJ, USA, 2011; pp. 779–783. [Google Scholar] [CrossRef]
- Chen, J.; Lopresti, D.P. Table Detection in Noisy Off-line Handwritten Documents. In Proceedings of the 2011 International Conference on Document Analysis and Recognition, ICDAR 2011, Beijing, China, 18–21 September 2011; IEEE Computer Society: Piscataway, NJ, USA, 2011; pp. 399–403. [Google Scholar] [CrossRef]
- Hashmi, K.A.; Ponnappa, R.B.; Bukhari, S.S.; Jenckel, M.; Dengel, A. Feedback learning: Automating the process of correcting and completing the extracted information. In Proceedings of the 2019 International Conference on Document Analysis and Recognition Workshops (ICDARW), Sydney, Australia, 22–25 September 2019; IEEE: Piscataway, NJ, USA, 2019; Volume 5, pp. 116–121. [Google Scholar]
- Saha, R.; Mondal, A.; Jawahar, C.V. Graphical Object Detection in Document Images. In Proceedings of the 2019 International Conference on Document Analysis and Recognition, ICDAR 2019, Sydney, Australia, 20–25 September 2019; IEEE: Piscataway, NJ, USA, 2019; pp. 51–58. [Google Scholar] [CrossRef]
- Girshick, R.B. Fast R-CNN. In Proceedings of the 2015 IEEE International Conference on Computer Vision, ICCV 2015, Santiago, Chile, 7–13 December 2015; IEEE Computer Society: Piscataway, NJ, USA, 2015; pp. 1440–1448. [Google Scholar]
- Ren, S.; He, K.; Girshick, R.B.; Sun, J. Faster R-CNN: Towards Real-Time Object Detection with Region Proposal Networks. IEEE Trans. Pattern Anal. Mach. Intell. 2017, 39, 1137–1149. [Google Scholar] [CrossRef] [PubMed]
- Redmon, J.; Farhadi, A. YOLO9000: Better, Faster, Stronger. arXiv 2016, arXiv:1612.08242. [Google Scholar]
- He, K.; Gkioxari, G.; Dollár, P.; Girshick, R.B. Mask R-CNN. In Proceedings of the IEEE International Conference on Computer Vision, Honolulu, HI, USA, 21–26 July 2017. [Google Scholar]
- Xu, M.; Zhang, Z.; Hu, H.; Wang, J.; Wang, L.; Wei, F.; Bai, X.; Liu, Z. End-to-End Semi-Supervised Object Detection with Soft Teacher. In Proceedings of the IEEE/CVF International Conference on Computer Vision, Montreal, QC, Canada, 11–17 October 2021. [Google Scholar]
- Wang, K.; Yan, X.; Zhang, D.; Zhang, L.; Lin, L. Towards Human-Machine Cooperation: Self-supervised Sample Mining for Object Detection. In Proceedings of the IEEE Conference on Computer Vision and Pattern Recognition, Salt Lake City, UT, USA, 18–23 June 2018. [Google Scholar]
- Tang, P.; Ramaiah, C.; Xu, R.; Xiong, C. Proposal Learning for Semi-Supervised Object Detection. In Proceedings of the IEEE/CVF Winter Conference on Applications of Computer Vision, Montreal, QC, Canada, 11–17 October 2021. [Google Scholar]
- Rhee, P.; Erdenee, E.; Kyun, S.D.; Ahmed, M.U.; Jin, S. Active and semi-supervised learning for object detection with imperfect data. Cogn. Syst. Res. 2017, 45, 109–123. [Google Scholar] [CrossRef]
- Xie, Q.; Dai, Z.; Hovy, E.H.; Luong, T.; Le, Q. Unsupervised Data Augmentation for Consistency Training. In Proceedings of the Neural Information Processing Systems 33: Annual Conference on Neural Information Processing Systems 2020, NeurIPS 2020, Virtual, 6–12 December 2020; Available online: https://proceedings.neurips.cc/paper/2020/file/44feb0096faa8326192570788b38c1d1-Paper.pdf (accessed on 28 April 2022).
- Shafait, F.; Smith, R. Table detection in heterogeneous documents. In Proceedings of the The Ninth IAPR International Workshop on Document Analysis Systems, DAS 2010, Boston, MA, USA, 9–11 June 2010; Doermann, D.S., Govindaraju, V., Lopresti, D.P., Natarajan, P., Eds.; ACM: New York, NY, USA, 2010; pp. 65–72. [Google Scholar] [CrossRef]
- Kasar, T.; Barlas, P.; Adam, S.; Chatelain, C.; Paquet, T. Learning to Detect Tables in Scanned Document Images Using Line Information. In Proceedings of the 12th International Conference on Document Analysis and Recognition, ICDAR 2013, Washington, DC, USA, 25–28 August 2013; IEEE Computer Society: Piscataway, NJ, USA, 2013; pp. 1185–1189. [Google Scholar] [CrossRef]
- Cesarini, F.; Marinai, S.; Sarti, L.; Soda, G. Trainable Table Location in Document Images. In Proceedings of the 16th International Conference on Pattern Recognition, ICPR 2002, Quebec, QC, Canada, 11–15 August 2002; IEEE Computer Society: Piscataway, NJ, USA, 2002; pp. 236–240. [Google Scholar] [CrossRef]
- e Silva, A.C. Learning Rich Hidden Markov Models in Document Analysis: Table Location. In Proceedings of the 10th International Conference on Document Analysis and Recognition, ICDAR 2009, Barcelona, Spain, 26–29 July 2009; IEEE Computer Society: Piscataway, NJ, USA, 2009; pp. 843–847. [Google Scholar] [CrossRef]
- Kieninger, T.; Dengel, A. The T-Recs Table Recognition and Analysis System. In Proceedings of the Document Analysis Systems: Theory and Practice, Third IAPR Workshop, DAS’98, Nagano, Japan, 4–6 November 1998; Lee, S., Nakano, Y., Eds.; Springer: Berlin/Heidelberg, Germany, 1998; Volume 1655, pp. 255–269. [Google Scholar] [CrossRef]
- Hao, L.; Gao, L.; Yi, X.; Tang, Z. A Table Detection Method for PDF Documents Based on Convolutional Neural Networks. In Proceedings of the 12th IAPR Workshop on Document Analysis Systems, DAS 2016, Santorini, Greece, 11–14 April 2016; IEEE Computer Society: Piscataway, NJ, USA, 2016; pp. 287–292. [Google Scholar] [CrossRef]
- Schreiber, S.; Agne, S.; Wolf, I.; Dengel, A.; Ahmed, S. DeepDeSRT: Deep Learning for Detection and Structure Recognition of Tables in Document Images. In Proceedings of the 14th IAPR International Conference on Document Analysis and Recognition, ICDAR 2017, Kyoto, Japan, 9–15 November 2017; IEEE: Piscataway, NJ, USA, 2017; pp. 1162–1167. [Google Scholar] [CrossRef]
- Hashmi, K.A.; Pagani, A.; Liwicki, M.; Stricker, D.; Afzal, M.Z. CasTabDetectoRS: Cascade Network for Table Detection in Document Images with Recursive Feature Pyramid and Switchable Atrous Convolution. J. Imaging 2021, 7, 214. [Google Scholar] [CrossRef] [PubMed]
- Moll, M.A.; Baird, H.S. Segmentation-based retrieval of document images from diverse collections. In Proceedings of the Document Recognition and Retrieval XV, part of the IS&T-SPIE Electronic Imaging Symposium, San Jose, CA, USA, 29–31 January 2008; Yanikoglu, B.A., Berkner, K., Eds.; SPIE: Bellingham, WA, USA, 2008; Volume 6815, p. 68150L. [Google Scholar] [CrossRef]
- Nayef, N.; Ogier, J. Text zone classification using unsupervised feature learning. In Proceedings of the 13th International Conference on Document Analysis and Recognition, ICDAR 2015, Nancy, France, 23–26 August 2015; IEEE Computer Society: Piscataway, NJ, USA, 2015; pp. 776–780. [Google Scholar] [CrossRef]
- Tombre, K.; Tabbone, S.; Pélissier, L.; Lamiroy, B.; Dosch, P. Text/Graphics Separation Revisited. In Proceedings of the Document Analysis Systems V, 5th International Workshop, DAS 2002, Princeton, NJ, USA, 19–21 August 2002; Lopresti, D.P., Hu, J., Kashi, R.S., Eds.; Springer: Berlin/Heidelberg, Germany, 2002; Volume 2423, pp. 200–211. [Google Scholar] [CrossRef]
- Zhong, X.; Tang, J.; Jimeno-Yepes, A. PubLayNet: Largest dataset ever for document layout analysis. In Proceedings of the 2019 International Conference on Document Analysis and Recognition (ICDAR), Sydney, NSW, Australia, 20–25 September 2019. [Google Scholar]
- Zach, C.; Sánchez, A.P.; Pham, M. A dynamic programming approach for fast and robust object pose recognition from range images. In Proceedings of the IEEE Conference on Computer Vision and Pattern Recognition, CVPR 2015, Boston, MA, USA, 7–12 June 2015; IEEE Computer Society: Piscataway, NJ, USA, 2015; pp. 196–203. [Google Scholar] [CrossRef]
- Bhatt, J.; Hashmi, K.A.A.; Afzal, M.Z.; Stricker, D. A Survey of Graphical Page Object Detection with Deep Neural Networks. Appl. Sci. 2021, 11, 5344. [Google Scholar] [CrossRef]
- Hashmi, K.A.; Liwicki, M.; Stricker, D.; Afzal, M.A.; Afzal, M.A.; Afzal, M.Z. Current Status and Performance Analysis of Table Recognition in Document Images with Deep Neural Networks. IEEE Access 2021, 9, 87663–87685. [Google Scholar] [CrossRef]
- Nazir, D.; Hashmi, K.A.; Pagani, A.; Liwicki, M.; Stricker, D.; Afzal, M.Z. HybridTabNet: Towards better table detection in scanned document images. Appl. Sci. 2021, 11, 8396. [Google Scholar] [CrossRef]
- Baur, C.; Albarqouni, S.; Navab, N. Semi-supervised Deep Learning for Fully Convolutional Networks. In Proceedings of the Medical Image Computing and Computer Assisted Intervention - MICCAI 2017-20th International Conference, Quebec, QC, Canada, 11–13 September 1 2017; Descoteaux, M., Maier-Hein, L., Franz, A.M., Jannin, P., Collins, D.L., Duchesne, S., Eds.; Springer: Berlin/Heidelberg, Germany, 2017; Volume 10435, pp. 311–319. [Google Scholar] [CrossRef]
- Nie, D.; Gao, Y.; Wang, L.; Shen, D. ASDNet: Attention Based Semi-supervised Deep Networks for Medical Image Segmentation. In Proceedings of the Medical Image Computing and Computer Assisted Intervention - MICCAI 2018-21st International Conference, Granada, Spain, 16–20 September 2018; Frangi, A.F., Schnabel, J.A., Davatzikos, C., Alberola-López, C., Fichtinger, G., Eds.; Springer: Berlin/Heidelberg, Germany, 2018; Volume 11073, pp. 370–378. [Google Scholar] [CrossRef]
- Roß, T.; Zimmerer, D.; Vemuri, A.S.; Isensee, F.; Bodenstedt, S.; Both, F.; Kessler, P.; Wagner, M.; Müller, B.; Kenngott, H.; et al. Exploiting the potential of unlabeled endoscopic video data with self-supervised learning. Int. J. Comput. Assist. Radiol. Surg. 2018, 13, 925–933. [Google Scholar] [CrossRef] [PubMed]
- Iscen, A.; Tolias, G.; Avrithis, Y.; Chum, O. Label Propagation for Deep Semi-supervised Learning. In Proceedings of the IEEE/CVF Conference on Computer Vision and Pattern Recognition, Long Beach, CA, USA, 16–20 June 2019. [Google Scholar]
- Gan, Y.; Zhu, H.; Guo, W.; Xu, G.; Zou, G. Deep semi-supervised learning with contrastive learning and partial label propagation for image data. Knowl. Based Syst. 2022, 245, 108602. [Google Scholar] [CrossRef]
- Kiran, B.R.; Thomas, D.M.; Parakkal, R. An overview of deep learning based methods for unsupervised and semi-supervised anomaly detection in videos. J. Imaging 2018, 4, 36. [Google Scholar] [CrossRef]
- Papandreou, G.; Chen, L.; Murphy, K.P.; Yuille, A.L. Weakly-and Semi-Supervised Learning of a Deep Convolutional Network for Semantic Image Segmentation. In Proceedings of the 2015 IEEE International Conference on Computer Vision, ICCV 2015, Santiago, Chile, 7–13 December 2015; IEEE Computer Society: Piscataway, NJ, USA, 2015; pp. 1742–1750. [Google Scholar] [CrossRef]
- Olsson, V.; Tranheden, W.; Pinto, J.; Svensson, L. ClassMix: Segmentation-Based Data Augmentation for Semi-Supervised Learning. In Proceedings of the IEEE/CVF Winter Conference on Applications of Computer Vision, Montreal, QC, Canada, 11–17 October 2021. [Google Scholar]
- Jeong, J.; Lee, S.; Kim, J.; Kwak, N. Consistency-based Semi-supervised Learning for Object detection. In Proceedings of the Neural Information Processing Systems 32: Annual Conference on Neural Information Processing Systems 2019, NeurIPS 2019, Vancouver, BC, Canada, 8–14 December 2019; Wallach, H.M., Larochelle, H., Beygelzimer, A., d’Alché-Buc, F., Fox, E.B., Garnett, R., Eds.; 2019; pp. 10758–10767. Available online: https://papers.nips.cc/paper/2019/hash/d0f4dae80c3d0277922f8371d5827292-Abstract.html (accessed on 28 April 2022).
- Miyato, T.; Maeda, S.; Koyama, M.; Ishii, S. Virtual Adversarial Training: A Regularization Method for Supervised and Semi-supervised Learning. IEEE Trans. Pattern Anal. Mach. Intell. 2018, 41, 1979–1993. [Google Scholar] [CrossRef] [PubMed]
- Sajjadi, M.; Javanmardi, M.; Tasdizen, T. Regularization With Stochastic Transformations and Perturbations for Deep Semi-Supervised Learning. 2016. Available online: https://proceedings.neurips.cc/paper/2016/file/30ef30b64204a3088a26bc2e6ecf7602-Paper.pdf (accessed on 28 April 2022).
- Grandvalet, Y.; Bengio, Y. Semi-supervised Learning by Entropy Minimization. In Proceedings of the Neural Information Processing Systems 17 Neural Information Processing Systems, NIPS 2004, Vancouver, BC, Canada, 13–18 December 2004; pp. 529–536. [Google Scholar]
- Berthelot, D.; Carlini, N.; Goodfellow, I.J.; Papernot, N.; Oliver, A.; Raffel, C. MixMatch: A Holistic Approach to Semi-Supervised Learning. 2019. Available online: https://proceedings.neurips.cc/paper/2019/file/1cd138d0499a68f4bb72bee04bbec2d7-Paper.pdf (accessed on 28 April 2022).
- Jeong, J.; Verma, V.; Hyun, M.; Kannala, J.; Kwak, N. Interpolation-based semi-supervised learning for object detection. In Proceedings of the IEEE/CVF Conference on Computer Vision and Pattern Recognition, Seattle, WA, USA, 13–19 June 2020. [Google Scholar]
- Radosavovic, I.; Dollár, P.; Girshick, R.B.; Gkioxari, G.; He, K. Data Distillation: Towards Omni-Supervised Learning. In Proceedings of the IEEE Conference on Computer Vision and Pattern Recognition, Honolulu, Hawaii, USA, 21–26 July 2017. [Google Scholar]
- Yang, Q.; Wei, X.; Wang, B.; Hua, X.; Zhang, L. Interactive Self-Training With Mean Teachers for Semi-Supervised Object Detection. In Proceedings of the IEEE Conference on Computer Vision and Pattern Recognition, CVPR 2021, Virtual, 19–25 June 2021; IEEE: Piscataway, NJ, USA, 2021; pp. 5941–5950. [Google Scholar]
- Tang, Y.; Chen, W.; Luo, Y.; Zhang, Y. Humble Teachers Teach Better Students for Semi-Supervised Object Detection. In Proceedings of the IEEE/CVF Conference on Computer Vision and Pattern Recognition, Nashville, TN, USA, 20–25 June 2021. [Google Scholar]
- Lin, T.; Maire, M.; Belongie, S.J.; Bourdev, L.D.; Girshick, R.B.; Hays, J.; Perona, P.; Ramanan, D.; Dollár, P.; Zitnick, C.L. Microsoft COCO: Common Objects in Context. In Proceedings of the European Conference on Computer Vision, Zurich, Switzerland, 6—12 September 2014. [Google Scholar]
- Sohn, K.; Berthelot, D.; Li, C.; Zhang, Z.; Carlini, N.; Cubuk, E.D.; Kurakin, A.; Zhang, H.; Raffel, C. FixMatch: Simplifying Semi-Supervised Learning with Consistency and Confidence. Adv. Neural Inf. Process. Syst. 2020, 33, 596–608. [Google Scholar]
- Mondal, A.; Lipps, P.; Jawahar, C.V. IIIT-AR-13K: A New Dataset for Graphical Object Detection in Documents. In Proceedings of the International Workshop on Document Analysis Systems, Wuhan, China, 26–29 July 2020. [Google Scholar]
- Li, M.; Xu, Y.; Cui, L.; Huang, S.; Wei, F.; Li, Z.; Zhou, M. DocBank: A Benchmark Dataset for Document Layout Analysis. arXiv 2020, arXiv:2006.01038. [Google Scholar]
- Sohn, K.; Zhang, Z.; Li, C.; Zhang, H.; Lee, C.; Pfister, T. A Simple Semi-Supervised Learning Framework for Object Detection. arXiv 2020, arXiv:2005.04757. [Google Scholar]
- Powers, D.M.W. Evaluation: From precision, recall and F-measure to ROC, informedness, markedness and correlation. arXiv 2020, arXiv:2010.16061. [Google Scholar]
- Lin, T.; Dollár, P.; Girshick, R.B.; He, K.; Hariharan, B.; Belongie, S.J. Feature Pyramid Networks for Object Detection. In Proceedings of the 2017 IEEE Conference on Computer Vision and Pattern Recognition, CVPR 2017, Honolulu, HI, USA, 21–26 July 2017; IEEE Computer Society: Piscataway, NJ, USA, 2017; pp. 936–944. [Google Scholar] [CrossRef]
- He, K.; Zhang, X.; Ren, S.; Sun, J. Deep Residual Learning for Image Recognition. In Proceedings of the IEEE Conference on Computer Vision and Pattern Recognition, Boston, MA, USA, 7–12 June 2015. [Google Scholar]
- Liu, Z.; Lin, Y.; Cao, Y.; Hu, H.; Wei, Y.; Zhang, Z.; Lin, S.; Guo, B. Swin Transformer: Hierarchical Vision Transformer using Shifted Windows. In Proceedings of the IEEE/CVF International Conference on Computer Vision, Montreal, QC, Canada, 11–17 October 2021. [Google Scholar]
- Nguyen, P.; Ngo, L.; Truong, T.; Nguyen, T.T.; Vo, N.D.; Nguyen, K. Page Object Detection with YOLOF. In Proceedings of the 2021 8th NAFOSTED Conference on Information and Computer Science (NICS), Hanoi, Vietnam, 21–22 December 2021; pp. 205–210. [Google Scholar] [CrossRef]


| PubLayNet | Number of Images | Number of Annotations |
|---|---|---|
| Table | 86,460 | 102,514 |
| Figure | 91,968 | 109,292 |
| Text | 334,548 | 2,343,356 |
| Title | 255,731 | 627,125 |
| List | 53,049 | 80,759 |
| Total | 335,703 | 3,263,046 |
| IIIT-AR-13K | Number of Images | Number of Annotations |
|---|---|---|
| Table | 6903 | 11,163 |
| Figure | 1293 | 2004 |
| Natural Image | 1258 | 1987 |
| Logo | 165 | 379 |
| Signature | 208 | 420 |
| Total | 9333 | 15,953 |
| Dataset | Table | Figure | Total |
|---|---|---|---|
| sub-PubLayNet | 86,460 | 91,968 | 102,514 |
| sub-IIIT-AR-13K | 6903 | 1293 | 7837 |
| sub-DocBank | 19,528 | 89,612 | 103,285 |
| Dataset | Tables | Figures | Total |
|---|---|---|---|
| sub-PubLayNet | 102,514 | 109,292 | 211,806 |
| sub-IIIT-AR-13K | 2222 | 481 | 2703 |
| sub-DocBank | 25,991 | 128,312 | 154,303 |
| Technique | Detector + Backbone | 1% | 5% | 10% | FPS |
|---|---|---|---|---|---|
| Supervised | Faster R-CNN + ResNet50 | 82.5 | 83.3 | 83.4 | 12.3 |
| Ours | Faster R-CNN + ResNet50 | 84.9 | 87.2 | 87.3 | 16.7 |
| Faster R-CNN + ResNet101 | 87.4 | 88.2 | 88.9 | 15.8 | |
| Swin-T | 88.3 | 89.1 | 88.6 | 14.9 |
| Technique | Detector | AP@0.50 | AP@0.75 | mAP | FPS |
|---|---|---|---|---|---|
| Zhong et al. [26] | Supervised + Faster R-CNN | 93.7 | 91.1 | 90.2 | - |
| Ours | Faster R-CNN (10% labeled data) | 96.4 | 93.8 | 90.0 | 15.8 |
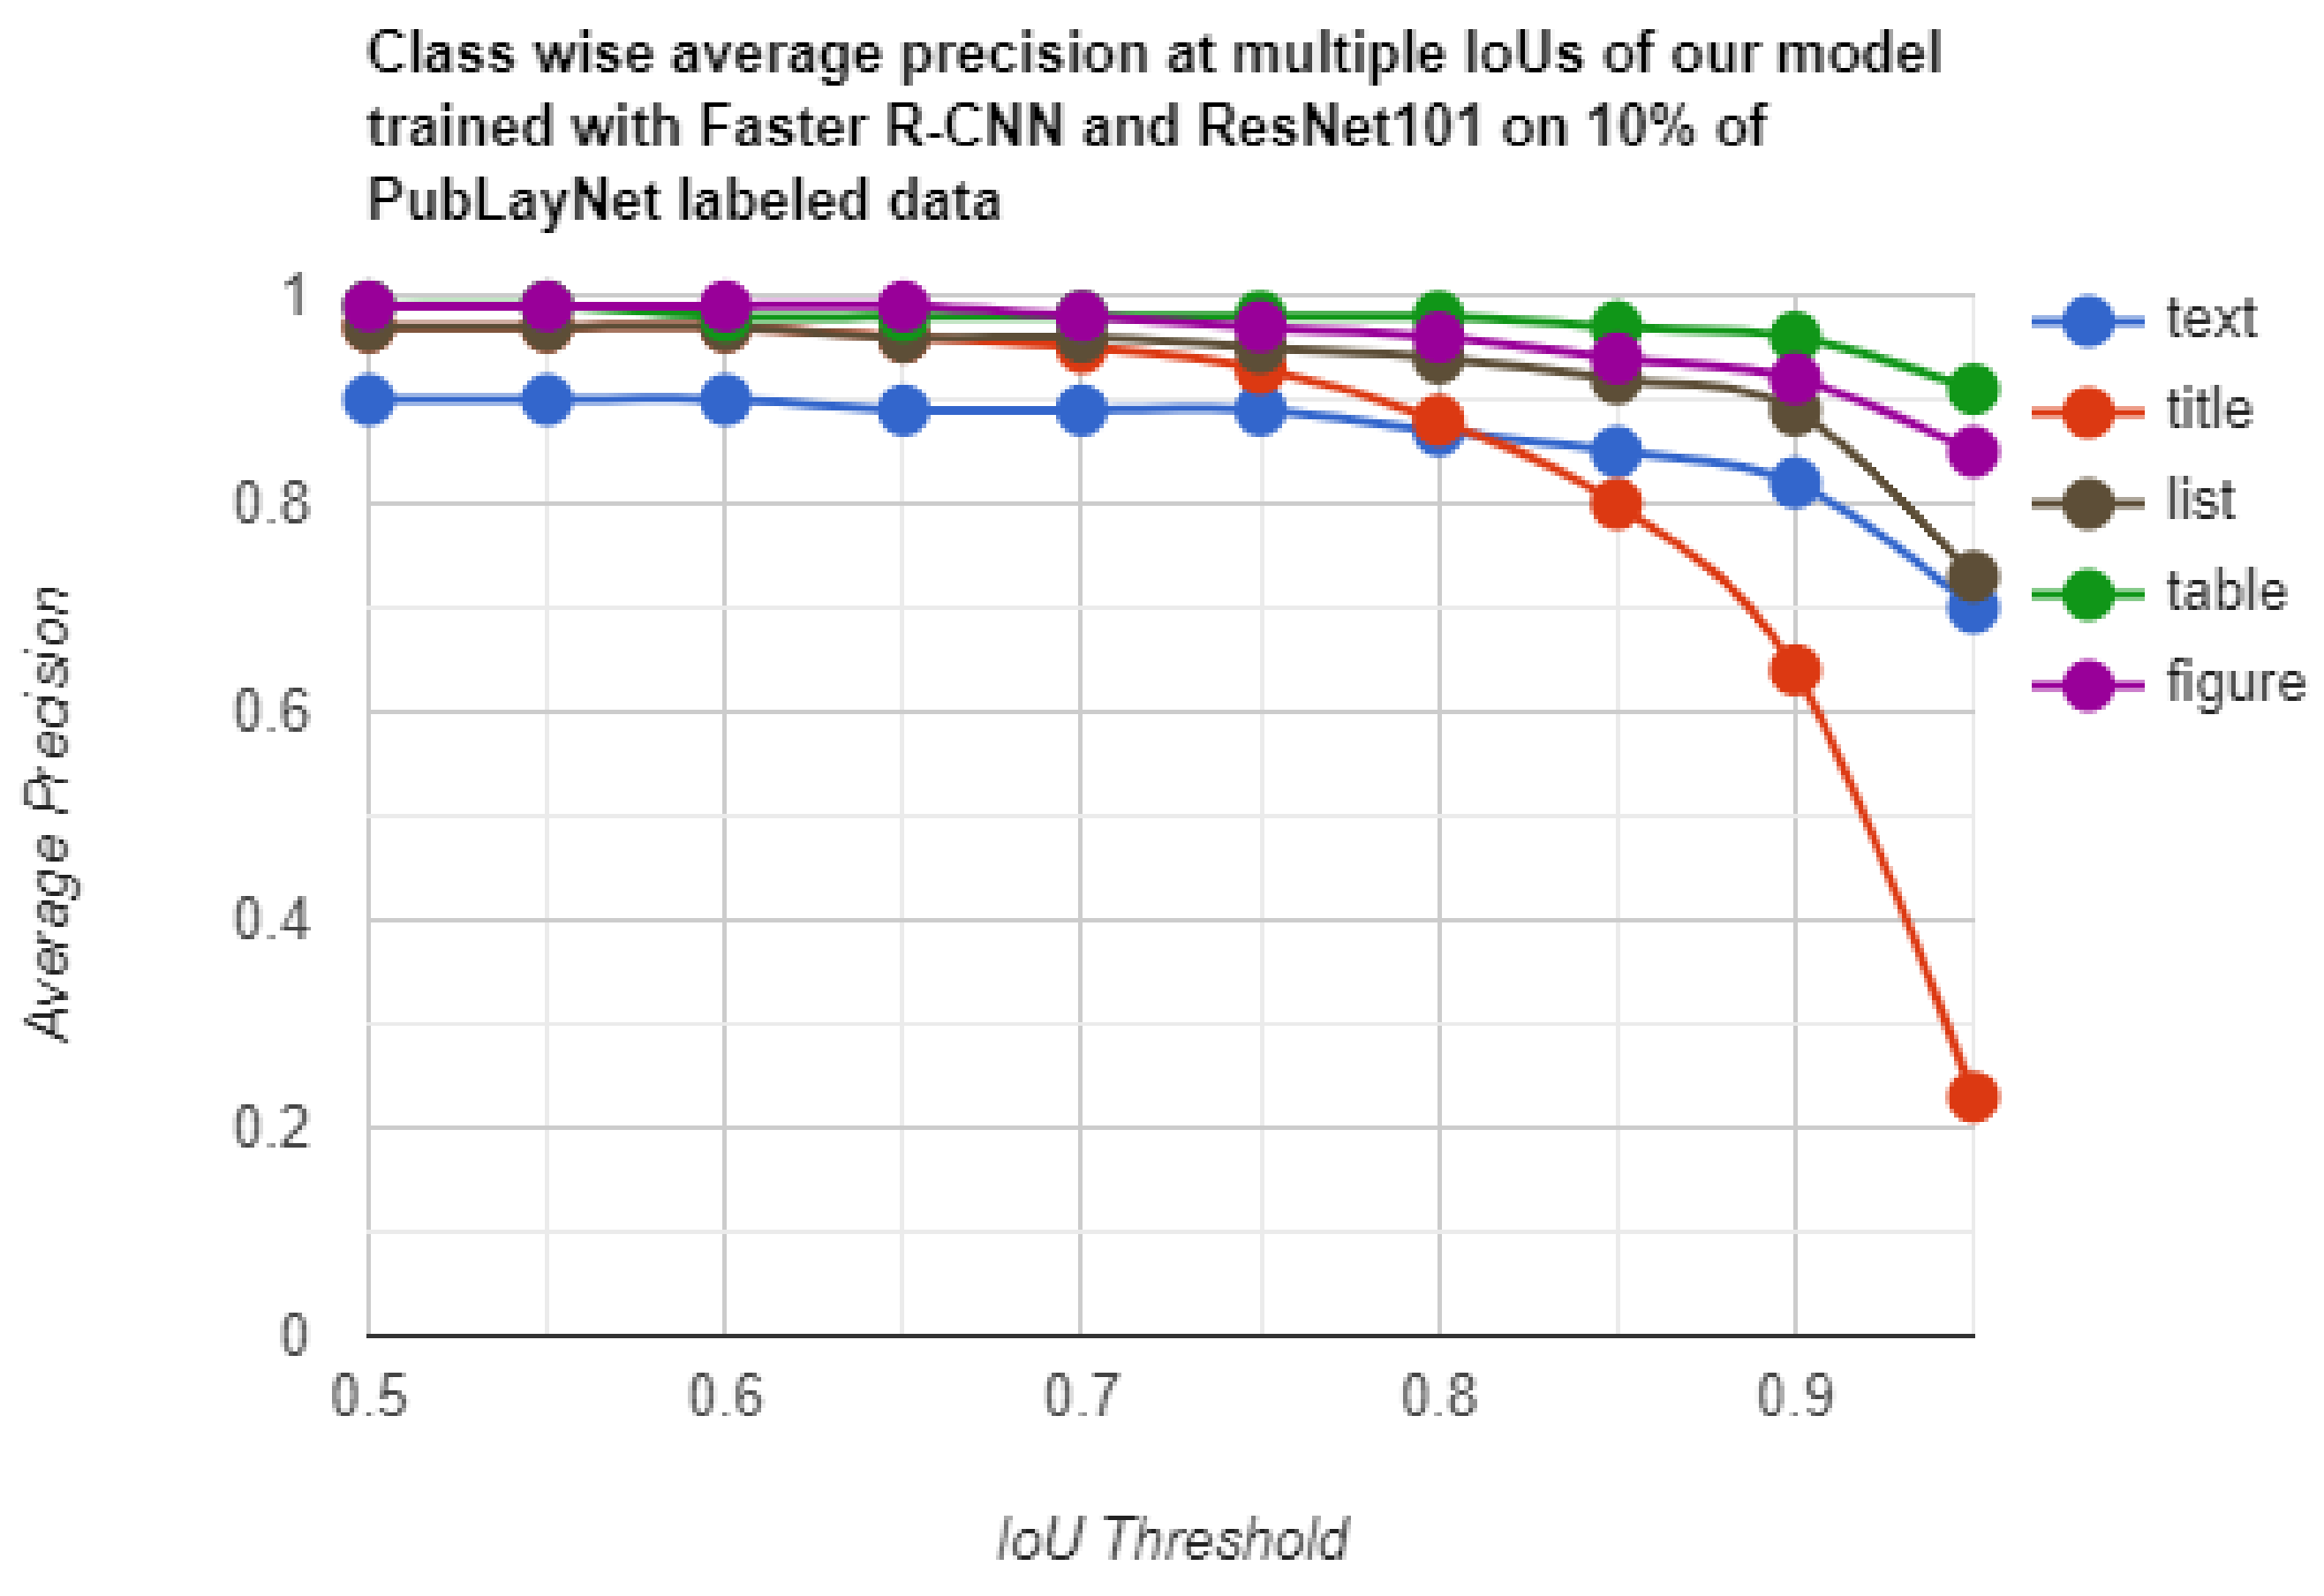
| Technique | Detector | Table | Figure | Text | Title | List |
|---|---|---|---|---|---|---|
| Zhong et al. [26] | Supervised + Faster R-CNN | 90.2 | 93.7 | 91.0 | 82.6 | 88.3 |
| Ours | Faster R-CNN (10% labeled data) | 96.6 | 94.9 | 85.5 | 81.4 | 91.5 |
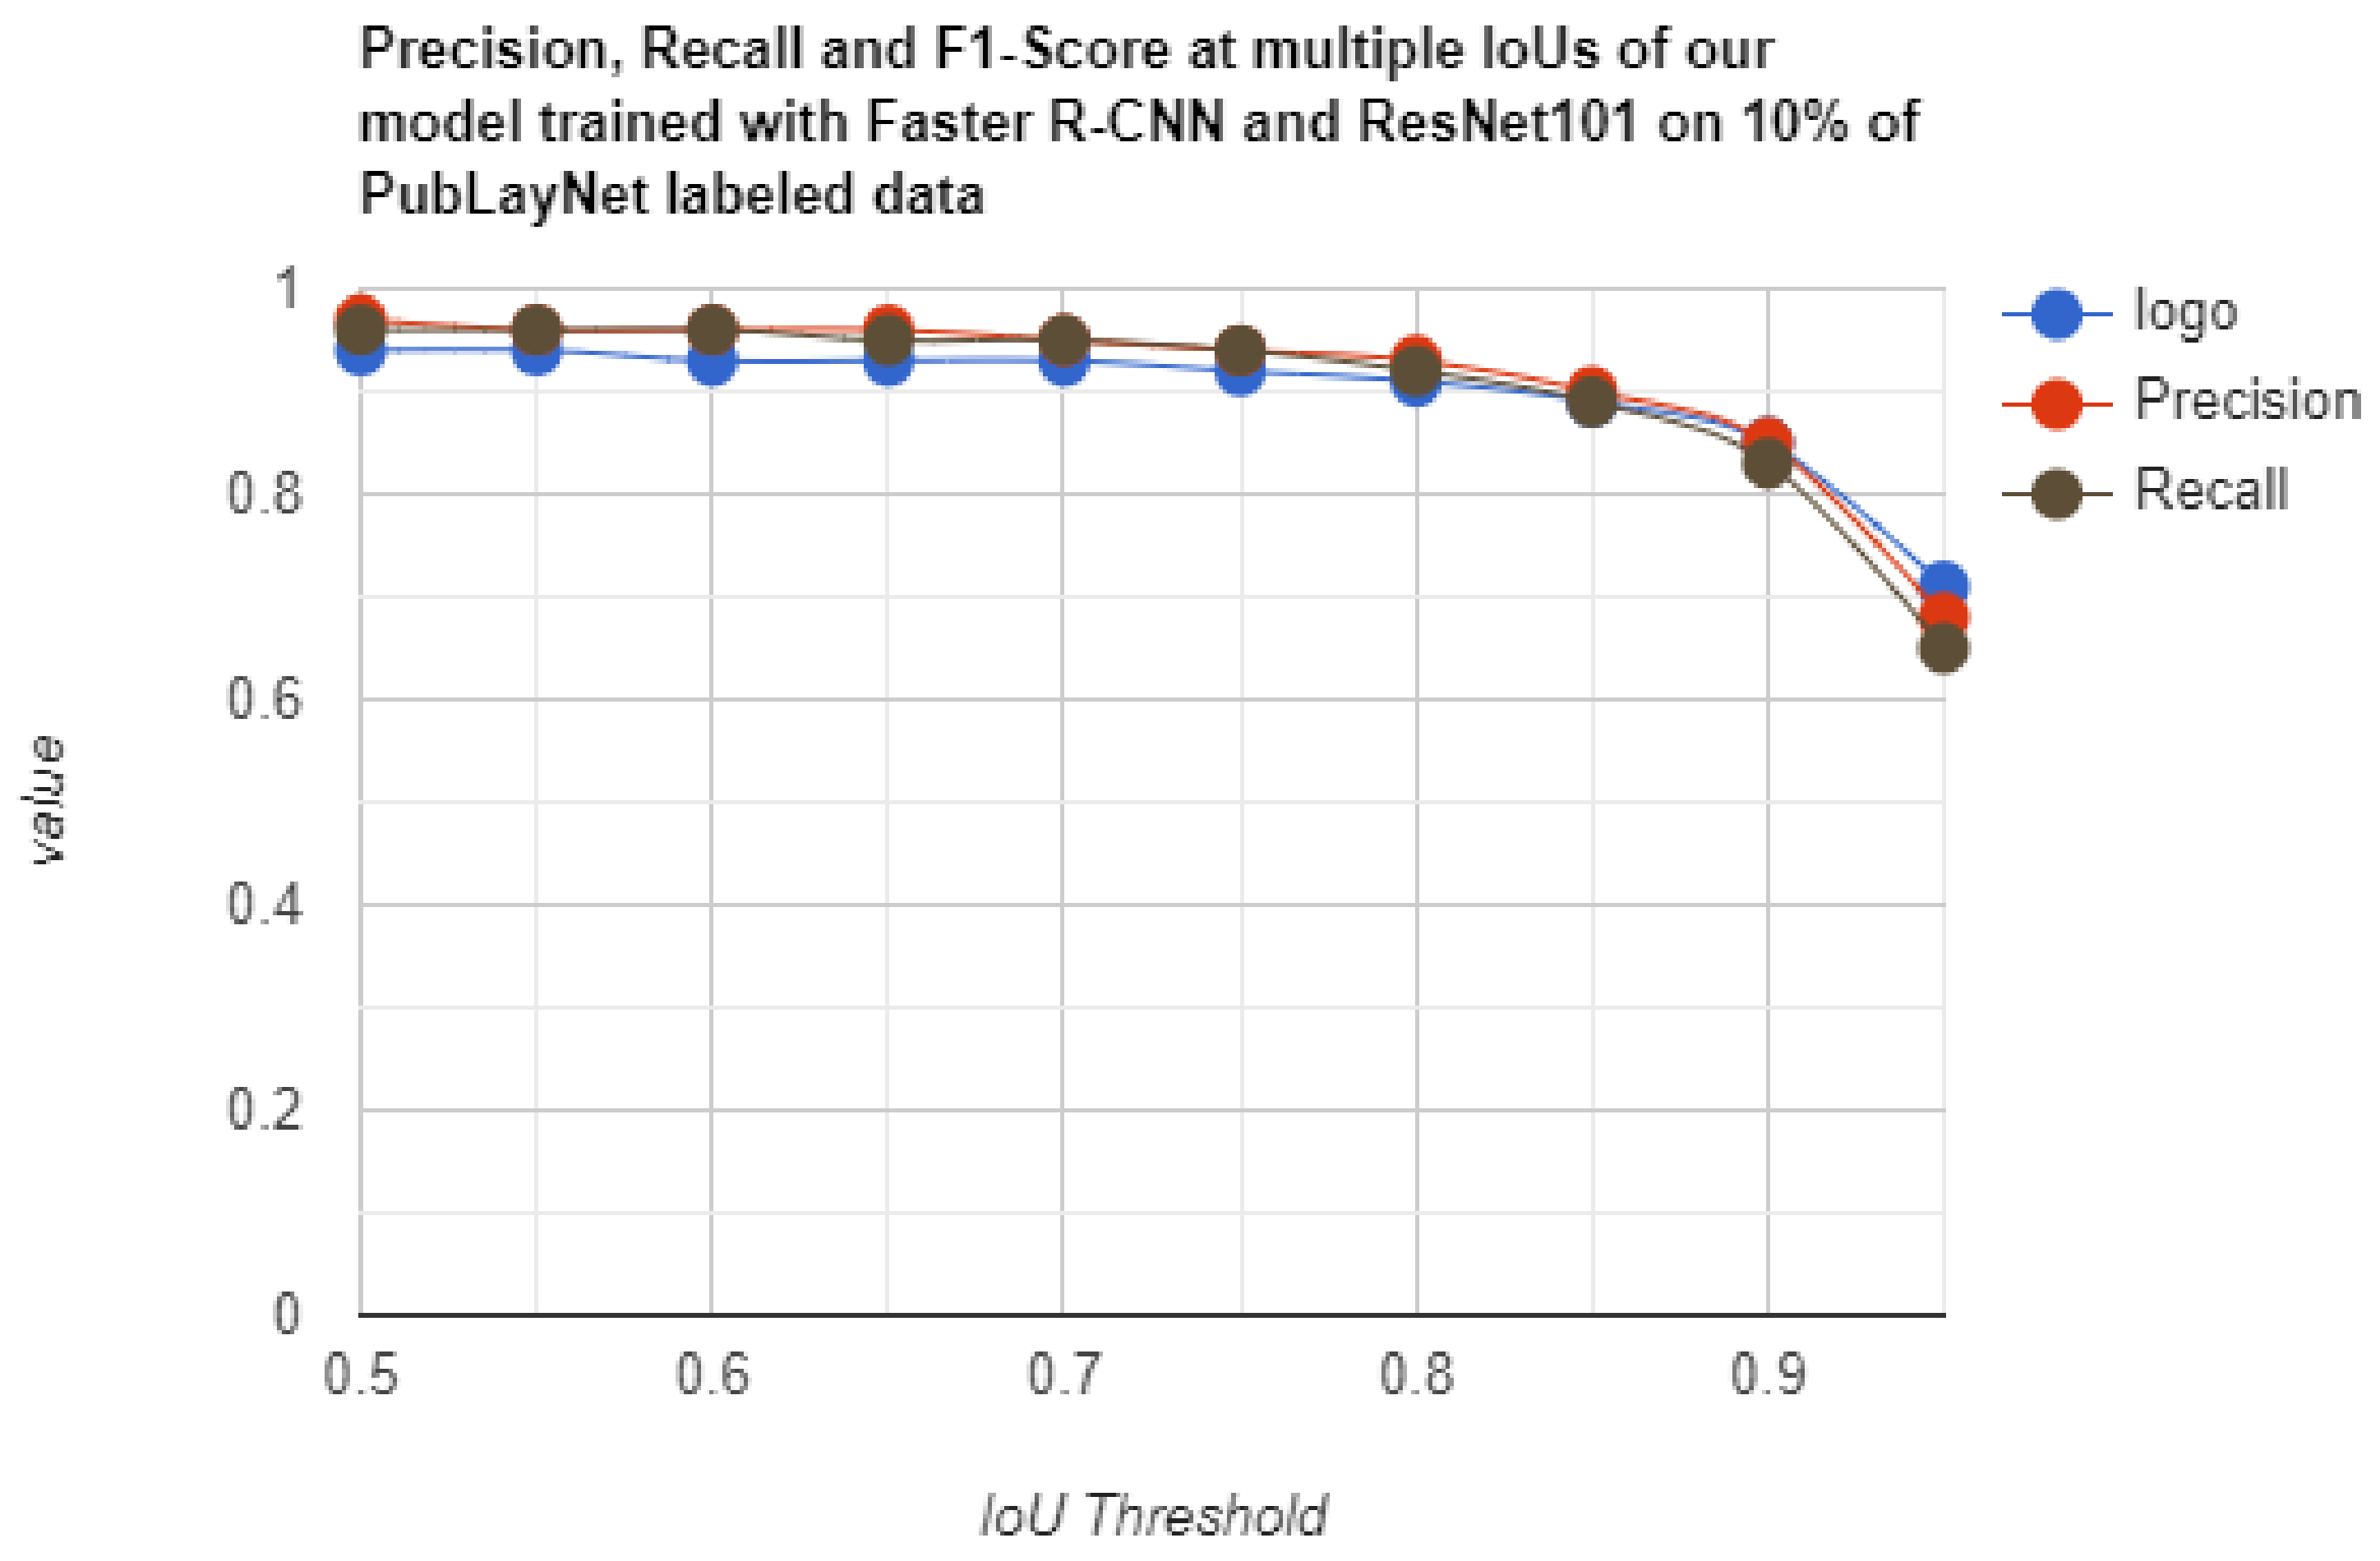
| Method | IoU | Precision | Recall | F1-Score |
|---|---|---|---|---|
| Semi-Supervised Soft Teacher Faster R-CNN + ResNet101 10% labeled | 0.50 | 0.97 | 0.96 | 0.94 |
| 0.60 | 0.96 | 0.96 | 0.93 | |
| 0.70 | 0.95 | 0.95 | 0.93 | |
| 0.80 | 0.93 | 0.92 | 0.91 | |
| 0.90 | 0.85 | 0.85 | 0.83 |
| Technique | Detector + Baseline | 1% | 5% | 10% | FPS |
|---|---|---|---|---|---|
| Supervised | Faster R-CNN + ResNet50 | 35.8 | 49.7 | 57.4 | 12.3 |
| Ours | Faster R-CNN + ResNet50 | 42.2 | 51.8 | 63.3 | 16.8 |
| Technique | Detector | AP@0.50 | AP@0.75 | mAP | FPS |
|---|---|---|---|---|---|
| Nguyen et al. [57] | Supervised + YOLO F | 81.2 | 64.9 | 58.8 | - |
| Ours | Faster R-CNN (10% labeled data) | 87.8 | 67.0 | 63.3 | 16.8 |
| Technique | Detector | Table | Figure | Natural Image | Logo | Signature |
|---|---|---|---|---|---|---|
| Nguyen et al. [57] | YOLO F | 88.3 | 63.7 | 73.0 | 18.3 | 50.6 |
| Ours | Faster R-CNN (10% labeled) | 87.1 | 60.7 | 82.5 | 28.2 | 58.0 |
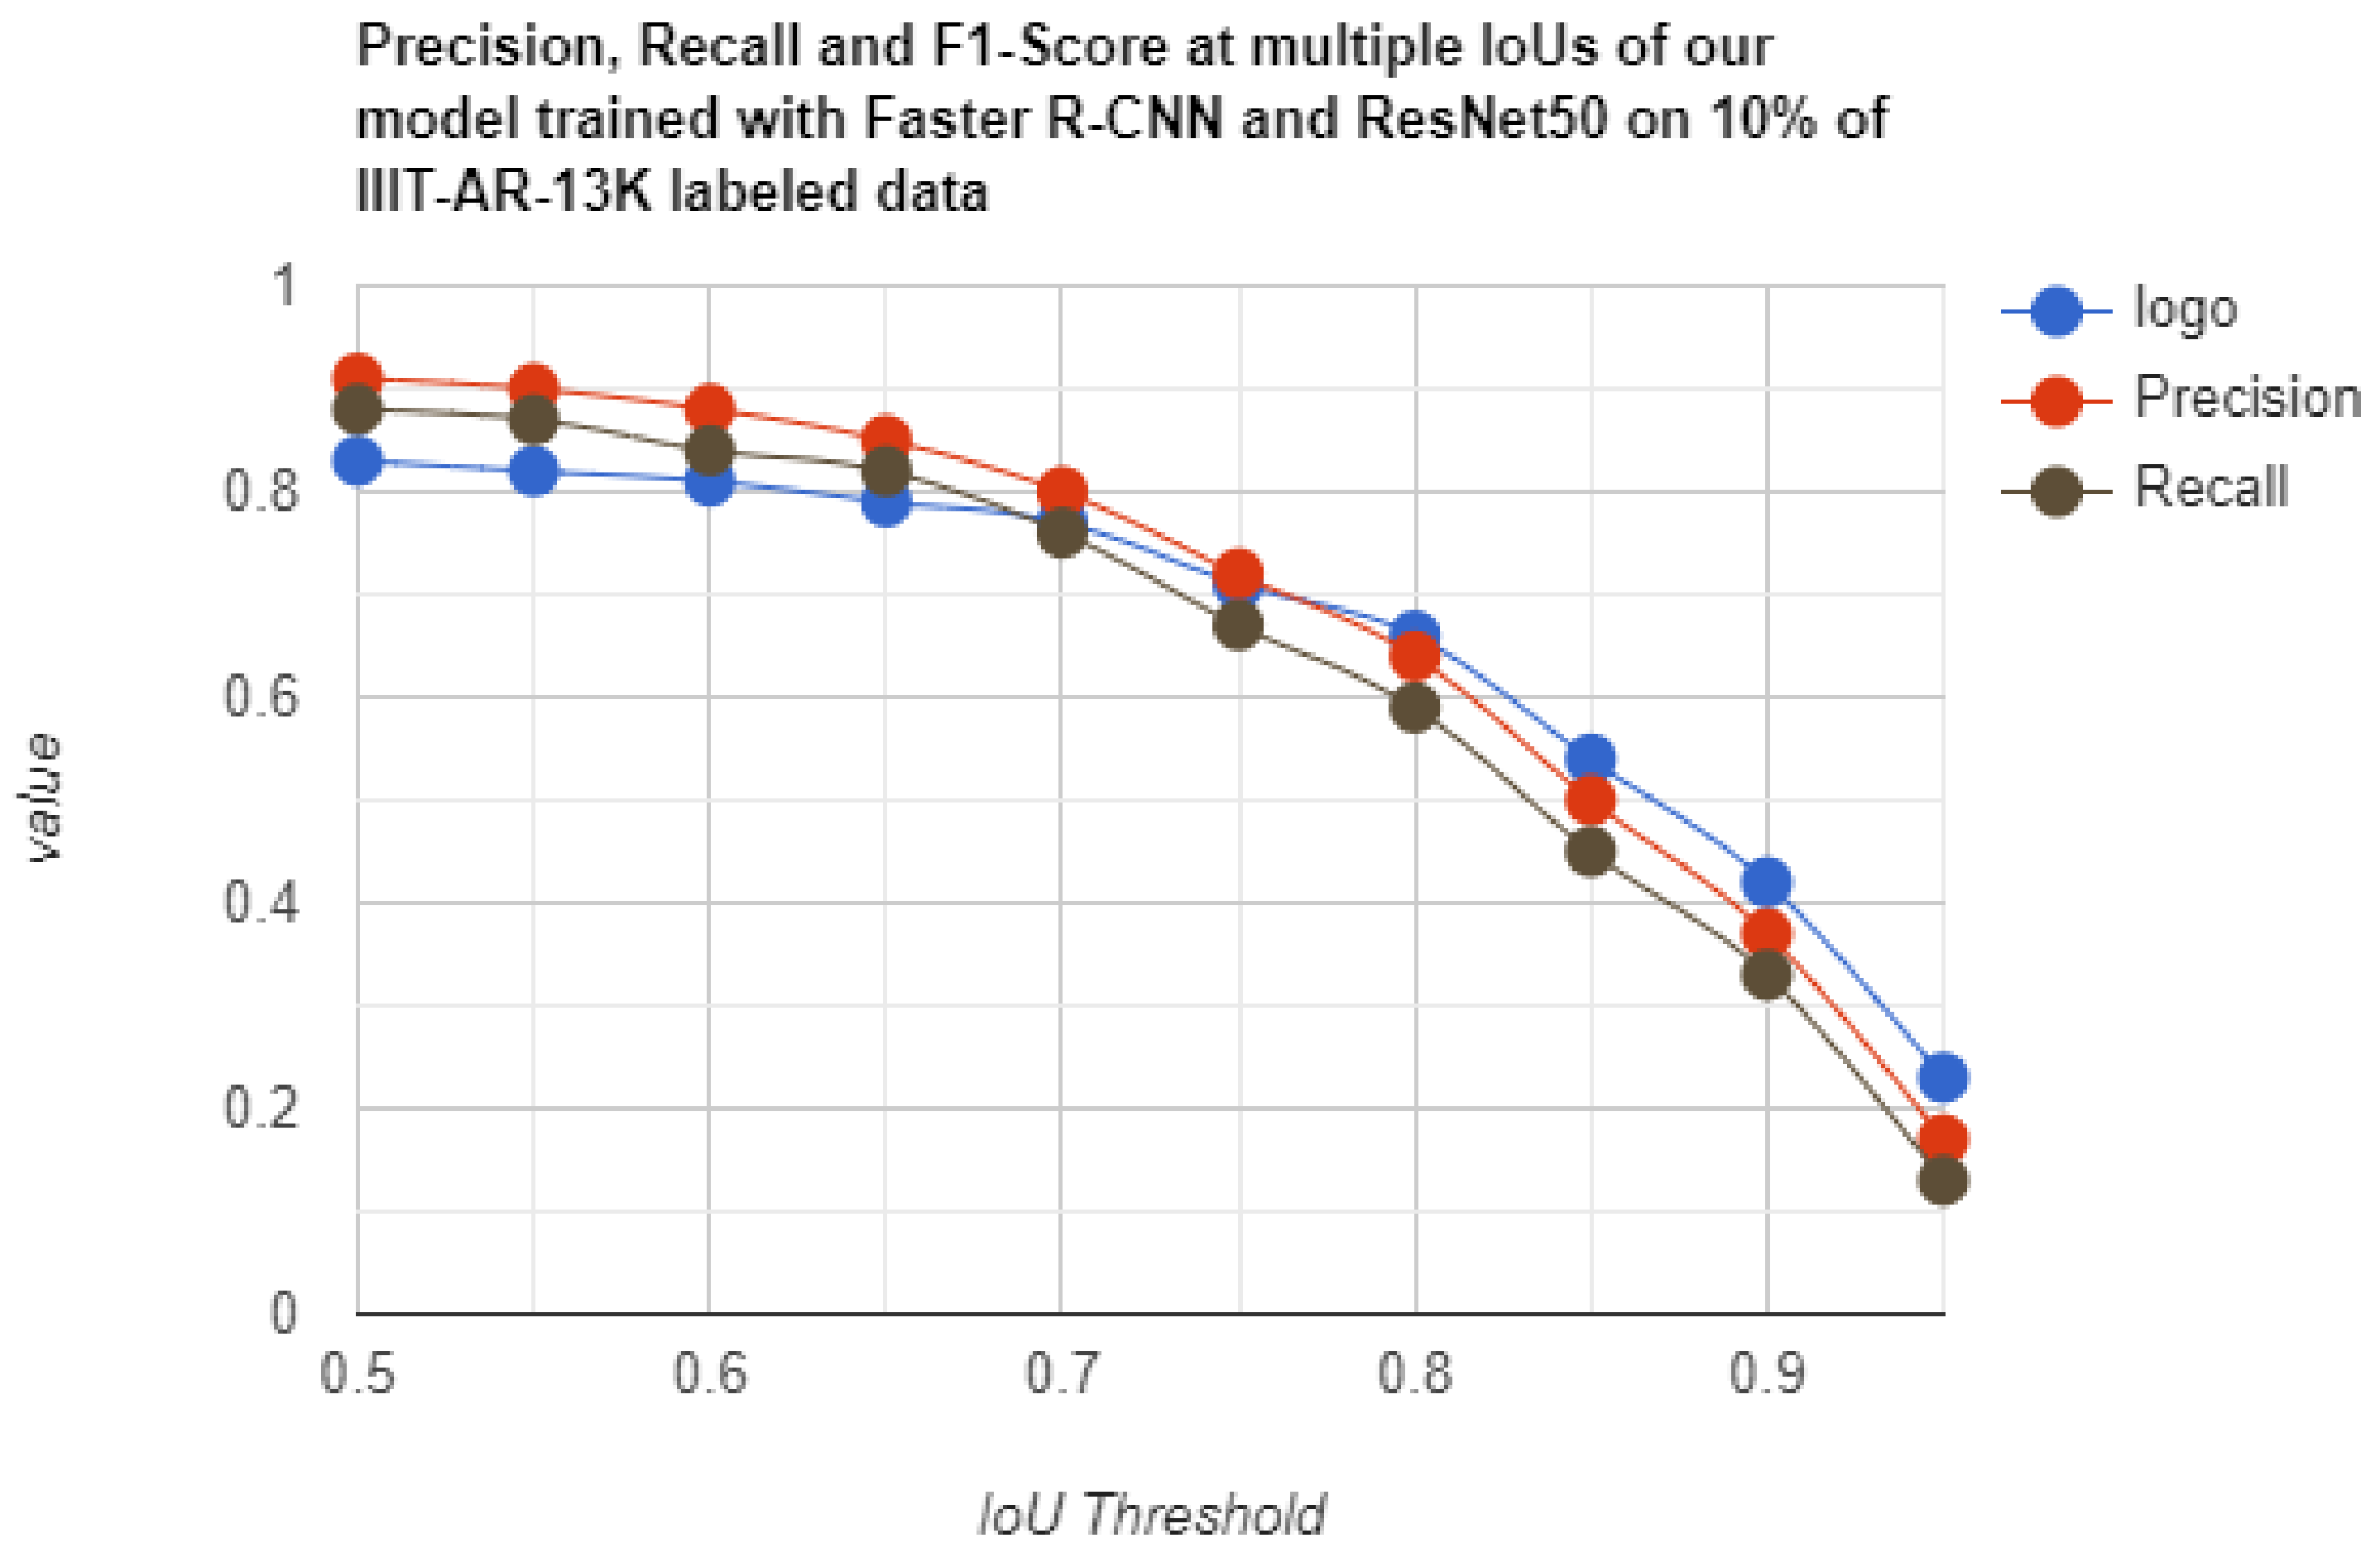
| Method | IoU | Precision | Recall | F1-Score |
|---|---|---|---|---|
| Semi-Supervised Soft Teacher Faster R-CNN + ResNet50 10% labeled | 0.50 | 0.91 | 0.88 | 0.83 |
| 0.60 | 0.88 | 0.84 | 0.81 | |
| 0.70 | 0.80 | 0.76 | 0.77 | |
| 0.80 | 0.64 | 0.59 | 0.66 | |
| 0.90 | 0.37 | 0.33 | 0.42 |
| Sub-PubLayNet | Sub-IIIT-AR-13K | Sub-DocBank | ||||||||
|---|---|---|---|---|---|---|---|---|---|---|
| Methods | Labeled Data | Table | Figure | mAP | Table | Figure | mAP | Table | Figure | mAP |
| ST_FRCNN_R50 | 5% | 95.9 | 92.1 | 94.0 | 59.7 | 23.0 | 41.4 | 72.7 | 49.0 | 60.8 |
| 10% | 95.9 | 92.2 | 94.0 | 60.2 | 24.2 | 42.2 | 72.3 | 49.4 | 60.8 | |
| ST_FRCNN_R101 | 5% | 96.0 | 94.2 | 94.5 | 61.1 | 22.6 | 41.9 | 71.1 | 48.0 | 59.6 |
| 10% | 96.1 | 92.9 | 95.1 | 57.3 | 16.6 | 37.0 | 66.2 | 48.0 | 57.1 | |
| Sub-DocBank | Sub-PubLayNet | Sub-IIIT-AR-13K | ||||||||
|---|---|---|---|---|---|---|---|---|---|---|
| Methods | Labeled Data | Table | Figure | mAP | Table | Figure | mAP | Table | Figure | mAP |
| ST_FRCNN_R50 | 5% | 82.4 | 64.5 | 73.4 | 88.5 | 71.2 | 79.8 | 52.3 | 14.3 | 33.3 |
| 10% | 82.5 | 65.3 | 73.9 | 89.0 | 72.0 | 80.5 | 60.6 | 28.0 | 40.3 | |
| ST_FRCNN_R101 | 5% | 80.7 | 65.3 | 73.0 | 84.9 | 65.1 | 75.0 | 55.5 | 18.2 | 36.9 |
| 10% | 80.4 | 68.5 | 74.4 | 87.1 | 65.0 | 76.0 | 55.4 | 17.9 | 36.7 | |
| Sub-IIIT-AR-13K | Sub-PubLayNet | Sub-DocBank | ||||||||
|---|---|---|---|---|---|---|---|---|---|---|
| Methods | Labeled Data | Table | Figure | mAP | Table | Figure | mAP | Table | Figure | mAP |
| ST_FRCNN_R50 | 5% | 86.3 | 51.5 | 68.9 | 73.1 | 25.8 | 49.4 | 33.6 | 20.5 | 27.0 |
| 10% | 88.0 | 54.8 | 71.4 | 75.7 | 31.0 | 53.3 | 54.3 | 29.0 | 41.7 | |
| ST_FRCNN_R101 | 5% | 87.3 | 45.8 | 66.5 | 75.4 | 31.3 | 53.4 | 60.4 | 31.3 | 45.8 |
| 10% | 85.5 | 48.3 | 67.4 | 78.3 | 21.2 | 49.7 | 56.0 | 23.0 | 39.5 | |
Publisher’s Note: MDPI stays neutral with regard to jurisdictional claims in published maps and institutional affiliations. |
© 2022 by the authors. Licensee MDPI, Basel, Switzerland. This article is an open access article distributed under the terms and conditions of the Creative Commons Attribution (CC BY) license (https://creativecommons.org/licenses/by/4.0/).
Share and Cite
Kallempudi, G.; Hashmi, K.A.; Pagani, A.; Liwicki, M.; Stricker, D.; Afzal, M.Z. Toward Semi-Supervised Graphical Object Detection in Document Images. Future Internet 2022, 14, 176. https://doi.org/10.3390/fi14060176
Kallempudi G, Hashmi KA, Pagani A, Liwicki M, Stricker D, Afzal MZ. Toward Semi-Supervised Graphical Object Detection in Document Images. Future Internet. 2022; 14(6):176. https://doi.org/10.3390/fi14060176
Chicago/Turabian StyleKallempudi, Goutham, Khurram Azeem Hashmi, Alain Pagani, Marcus Liwicki, Didier Stricker, and Muhammad Zeshan Afzal. 2022. "Toward Semi-Supervised Graphical Object Detection in Document Images" Future Internet 14, no. 6: 176. https://doi.org/10.3390/fi14060176
APA StyleKallempudi, G., Hashmi, K. A., Pagani, A., Liwicki, M., Stricker, D., & Afzal, M. Z. (2022). Toward Semi-Supervised Graphical Object Detection in Document Images. Future Internet, 14(6), 176. https://doi.org/10.3390/fi14060176