Article

QoE Models for Adaptive Streaming: A Comprehensive Evaluation

1
Department of Information and Communication Engineering, Tohoku Institute of Technology, Sendai 982-8577, Japan
2
College of Engineering and Computer Science, VinUniversity, Gia Lam District, Hanoi 100000, Vietnam
3
Department of Computer Science and Engineering, The University of Aizu, Aizuwakamatsu 965-8580, Japan
*
Author to whom correspondence should be addressed.
Future Internet 2022, 14(5), 151; https://doi.org/10.3390/fi14050151
Submission received: 16 April 2022 / Revised: 8 May 2022 / Accepted: 9 May 2022 / Published: 13 May 2022

Abstract

:
Adaptive streaming has become a key technology for various multimedia services, such as online learning, mobile streaming, Internet TV, etc. However, because of throughput fluctuations, video quality may be dramatically varying during a streaming session. In addition, stalling events may occur when segments do not reach the user device before their playback deadlines. It is well-known that quality variations and stalling events cause negative impacts on Quality of Experience (QoE). Therefore, a main challenge in adaptive streaming is how to evaluate the QoE of streaming sessions taking into account the influences of these factors. Thus far, many models have been proposed to tackle this issue. In addition, a lot of QoE databases have been publicly available. However, there have been no extensive evaluations of existing models using various databases. To fill this gap, in this study, we conduct an extensive evaluation of thirteen models on twelve databases with different characteristics of viewing devices, codecs, and session durations. Through experiment results, important findings are provided with regard to QoE prediction of streaming sessions. In addition, some suggestions on the effective employment of QoE models are presented. The findings and suggestions are expected to be useful for researchers and service providers to make QoE assessments and improvements of streaming solutions in adaptive streaming.

1. Introduction

Watching online videos has become one of the most popular user activities due to the fast development of multimedia services, such as online learning, mobile streaming, Internet TV, etc. According to [1], the average online video viewing hours have increased 68% globally in 2019. As of 2021, streaming video accounts for over 53% of all traffic on the Internet [2]. HTTP Adaptive Streaming (HAS) has become the standard solution for multimedia streaming over the Internet nowadays [3]. In HAS, a video is firstly encoded into multiple versions corresponding to different quality levels. Then, each version is divided into short chunks called segments. Every segment has the same playback duration commonly ranging from 2 s to 10 s. Segments with suitable versions are delivered to the user device according to the estimated throughput. Because of throughput fluctuations, the segments’ versions are often changing, resulting in quality variations during a streaming session. In addition, stalling events may occur when segments do not reach the user device before their playback deadlines. To reduce dramatic quality variations and sudden stalling events, a special stalling event, which is called an initial delay, is inserted before starting the video playback [4]. However, all these factors are well-known to cause negative impacts on the Quality of Experience (QoE) perceived by users [5]. Therefore, to provide the highest possible quality to users, it is imperative to assess the QoE of streaming sessions taking into account the joint impacts of the factors.
In the literature, many models have been proposed for predicting the QoE of HAS streaming sessions [6,7,8,9,10,11,12,13]. These models are different in the number of considered factors, modeling approach, etc. Moreover, they are usually evaluated over a small number of databases (mostly one or two), making it difficult to realize the true effectiveness of existing QoE models [6,7,8,9,11]. Recently, many QoE databases have been made available to the public with different settings of the impact factors, viewing devices, codecs such as H.264 [14] and HEVC [15], session durations, and session generation methods [16,17,18,19,20,21,22].
To the best of our knowledge, there have been no extensive evaluations of QoE models in the literature. Thus, it is challenging for service providers and practitioners to choose appropriate QoE model in practice. In addition, it is worth emphasizing that the evaluation of any QoE model should be carried out over different databases to truly reveal the model’s performance. In this paper, we present a comprehensive evaluation of thirteen existing QoE models (see Table 1) for HTTP Adaptive Streaming over up to twelve open databases. Through experiment results, various findings and suggestions are provided with regard to the performance of the models. In particular, we are able to obtain the following important observations.
  • All considered models yield better performance on H.264-encoded streaming sessions than HEVC-encoded ones. Surprisingly, even the models taking into account HEVC characteristics such as P.1203 and KSQI are not very effective for HEVC-encoded sessions.
  • To obtain the high and stable performance for different devices, it is recommended to use Mean Opinion Score (MOS) and Video Multi-method Assessment Fusion (VMAF) to calculate segment quality values.
  • Besides quality variations and stalling events, temporal relations between impairment events should be also considered in QoE models.
  • The use of multiple statistics as model inputs is indispensable to fully represent quality variations and stalling events in a streaming session. However, it is also found that complex models that contain more statistics do not always lead to better performance.
  • Among the considered models, the LSTM model [10] is the best one since it provides the highest and most stable performance across viewing devices and session durations. However, there is still room for improvements of the existing models, especially in the cases of various viewing devices and advanced video codecs.
The rest of this paper is organized as follows: an overview of existing QoE models is given in Section 2. The experiment settings of the evaluation are described in Section 3. The obtained results and discussions on the performances of individual models are presented in Section 4. Finally, Section 5 concludes the paper and gives an outlook on future work.

2. Overview of QoE Models

In the context of video streaming, the concept of Quality of Experience (QoE) is referred to as the extent users are annoyed or delighted with videos provided by applications or services [3,23,24]. In the literature, many QoE models have been proposed that use different inputs and modeling approaches to estimate the impacts of quality variations and stalling events. In this section, we present a brief overview of typical QoE models. For detailed classifications and discussions of QoE models, the readers are referred to other survey studies [3,25].
In general, a QoE model can be characterized by five aspects, namely (1) the key influence factors, (2) segment quality metrics, (3) model inputs, (4) modeling approaches, and (5) session durations. Table 1 presents a comparison of typical models according to these aspects. Here, the key influence factors are initial delay, quality variations, and stalling. In addition, the modeling approaches could be simple analytical functions or complex machine learning models like deep neural networks.
From Table 1, we can see that, with respect to the included influence factors, all these models take into account the impact of quality variations. The influence of initial delay and stalling events is also considered in most of the models, except Rehman’s, Guo’s, and Vriendt’s. For memory-related effects, they are included in the seven models of LSTM, ATLAS, P.1203, CQM, biQPS, SQI, and KSQI.
To represent segment quality, Rehman’s, Guo’s, Vriendt’s, LSTM, and CQM models employ the subjective quality metric of MOS while Liu’s, ATLAS, SQI, and KSQI models use objective quality metrics such as VQM, STRRED, and VMAF. On the other hand, for Singh’s, Yin’s, and biQPS models, each segment is attributed by one or several bitstream-level parameters such as quantization parameter (QP), resolution, and bitrate. It should be noted that the P.1203 model can be optionally fed by either MOS values or bitstream-level parameters.
Regarding model inputs, the LSTM and biQPS models are inputted by segment-basis parameters while the others employ various statistics on a session basis, i.e., calculated over the whole session such as the median and the minimum segment quality values. With regard to modeling approaches, simple analytical functions (e.g., a weighted sum, exponential and natural logarithm functions) are applied in seven models, namely Rehman’s, Guo’s, Vriendt’s, Liu’s, Yin’s, CQM, and SQI. Meanwhile, Singh’s, LSTM, ATLAS, and KSQI models utilize advanced machine learning methods (e.g., random neural network, LSTM, and regression models). Interestingly, the P.1203 and biQPS models employ both analytical functions and advanced machine learning in different modules of the models.
Finally, regarding session durations, five of the models (Rehman’s, Guo’s, Singh’s, SQI, and KSQI) are built using only short sessions (i.e., ≤30 s) while four models (Vriendt’s, Liu’s, LSTM, ATLAS) employ medium sessions (i.e., 1–2 min). Meanwhile, long sessions (i.e., >2 min) are considered in only three models, namely P.1203, CQM, and biQPS.

3. Evaluation Settings

3.1. Selected QoE Models

Our evaluation aims to investigate existing QoE models for HTTP Adaptive Streaming by focusing on the following objectives. First, we want to study how existing QoE models perform across databases with different characteristics of video codec and session duration. Second, we would like to examine the impact of various factors such as user viewing devices on performance of QoE models. Our third objective is to investigate the influence of different design choices (factors, inputs, modeling approaches) to the performance of a QoE model. To cover a wide variety of existing models, we select thirteen state-of-the-art models with various characteristics, namely Rehman’s [6], Guo’s [7], Vriendt’s [11], Singh’s [9], Liu’s [8], Yin’s [12], LSTM [10], ATLAS [26], P.1203 [13,29,30], CQM [22], biQPS [27], SQI [16], and KSQI [28]. These models are summarized in the above Table 1.

3.2. Databases

To evaluate the performances of QoE models, we will consider a large number of open databases proposed by different research groups. In this study, we will employ the following twelve databases: W-SQoE-I [16], W-SQoE-II [17], W-SQoE-III [18], W-SQoE-IV (full) [19], TRDB [31], VLDB [31], TR04 (full) [21], VL04 [21], TR06 (full) [21], VL13 [21], TRCQ [22] and VLCQ [22]. Among these databases, only W-SQoE-IV (full) has both H.264 and HEVC video formats while all the other databases have just H.264 video format. Most databases are tested by PC monitors, except that W-SQoE-IV (full), TR06 (full), and TR06 (full) are tested on both PC monitors and smartphones. In addition, TR06 (full), VL13, TRCQ, and VLCQ are the only databases that contain long sessions of 3 to 6 min. There are some other databases like LIVE-NFLX-II [20], LIVE-NFLX [32], LIVE-Stall [24], and LIVE-TVSQ [33]. However, they are not considered in our study because (1) they are quite simple in terms of influence factors and/or (2) the segment parameters such as bitstream-level parameters or MOS values are not fully provided.
In order to have a better understanding the performances of the models, the W-SQoE-IV (full), TR04 (full), and TR06 (full) databases are divided into sub-databases; each corresponds to a pair of a viewing device and a codec as shown in Table 2. In addition because subjective segment quality values are not available for some databases (i.e., W-SQoE-III, W-SQoE-IV (full), TR04 (full), VL04, TR06 (full), and VL13), we use the P.1203 model to estimate these values from the corresponding bitstream-level parameters. This helps to evaluate the models using as many databases as possible.

3.3. Evaluation Procedure and Performance Metrics

With respect to the model implementation, similar to [18,34], we re-implement Rehman’s, Guo’s, Vriendt’s, Singh’s, Liu’s, and Yin’s models based on the corresponding publications since their implementations are not publicly available [6,7,8,9,11,12]. For the LSTM, ATLAS, CQM, biQPS, SQI, and KSQI models, we employ the implementations publicized by the respective authors. Regarding the P.1203 model, an implementation of the standard that is free to use for research purposes is used [30,35]. Note that, although the P.1203 model has four input modes, of which mode#3 provides the highest performance, it is not applicable to some databases (namely W-SQoE-I, W-SQoE-II, W-SQoE-III, and W-SQoE-IV (full)) due to the lack of input data. Therefore, for these databases, the P.1203 model is tested with mode#0 while mode#3 is employed for the others.
The impact of initial delay could be separately modeled by a function of its duration which is then simply integrated into QoE models as an additive component [36,37]. Hence, in the same way, the models of Rehman’s, Guo’s, and Vriendt’s that do not originally consider the impact of initial delay are tested in two cases of (1) original (denoted ori) and (2) modified (denoted mod) by adding the impact of initial delay. It is expected that this addition will help obtain more understanding of the performance of the models and the impact of factors as well. Particularly, since most existing models use logarithm functions to model the impact of initial delay [4,36], such a function that is proposed in [4] with a very high prediction performance is added into Rehman’s, Guo’s, and Vriendt’s models as follows:
Q o E p r e d = Q + I I D ,
and
I I D = 0.862 l o g ( d + 6.718 ) ,
where Q and Q o E p r e d are respectively the predicted QoE values before and after modifying, and I I D denotes the impact of the initial delay with the duration of d seconds.
Because each model was developed using one or several specific training databases, these databases will be excluded from the performance evaluation of that model. In other words, the performances are calculated on only test databases. In particular, Table 3 describes the training and test databases for each model. In addition, it should be noted that, because of the lack of input data (e.g., objective quality values of segments), Liu’s, ATLAS, SQI, and KSQI models are not evaluated over some databases such as TR04f, TR04p, and VL04 databases as indicated by NA (i.e., not applicable) in Table 3.
In addition, given a combination of a model and a database, a first order linear regression is applied for subjective and predicted quality values following Recommendation ITU-T P.1401 [38]. The aim is to compensate for possible variances of different databases related to subjective experiments.
Regarding the rating scale, besides the 5-point scale from 1 to 5, some models (i.e., Liu’s, ATLAS, SQI, and KSQI) and databases (i.e., W-SQoE-I, W-SQoE-II, W-SQoE-III, and W-SQoE-IV (full)) use the 100-point scale from 0 to 100. To obtain the consistency in our evaluation, all the quality values in the 100-point scale are converted to the 5-point scale by (3) following Recommendations ITU-T P.1203.1 and ITU-T G.1071 [29,39]:
Q 5 = min ( Q m a x , max ( Q m i n , Q m i n + ( Q m a x Q m i n ) × Q 100 / 100 + Q 100 × ( Q 100 60 ) × ( 100 Q 100 ) × 0.000007 ) )
where Q m a x = 4.9 , Q m i n = 1.05 , Q 5 and Q 100 respectively denote the quality values in the 5-point scale and the 100-point scale.
To measure the performances of the models, we employ three metrics of Pearson Correlation Coefficient (PCC), Spearman rank-order correlation coefficient (SROCC), and Root-Mean-Squared Error (RMSE). In particular, the PCC, the SROCC, and the RMSE are respectively used to measure the linear relationship, the rank correlation, and the difference between the predicted quality values of a model and the corresponding subjective quality values in a database. Note that a higher PCC value, a higher SROCC value, and a lower RMSE value mean better prediction performance.

4. Evaluation Results and Discussion

In this section, we will first analyze the performance of the models across all the selected databases. Then, the performance comparisons are conducted for individual database settings of codecs, viewing devices, and session durations. Based on the obtained results, some suggestions on how to effectively use the models in different scenarios will be provided.

4.1. Performance Variation across Databases

Figure 1 shows the performance of all the models corresponding to different databases, where the red line indicates the average performance of each model. With respect to the performance variations, it is clear that, for most of the models, their performances vary significantly across databases. For Rehman’s (ori) model, the PCC value can be as high as 0.93 in case of the W-SQoE-I database but can also be as low as 0.29 in case of the VL13 database. More drastically, variations in PCC can be observed with Singh’s, Yin’s, and biQPS models. On the other hand, the performances of the LSTM, SQI, and KSQI models are relatively stable with PCC values in [0.63, 0.96]. From Figure 1b,c, the performances in terms of RMSE and SROCC also show the similar trend to that of PCC.
In terms of the average performance, the models of Rehman’s (both ori and mod), Singh’s, and Yin’s have the lowest average performance (i.e., PCC ≤ 0.57, SROCC ≤ 0.56, and RMSE ≥ 0.67). Meanwhile, the highest average performance is obtained by the LSTM model (i.e., PCC = 0.88, SROCC = 0.87, and RMSE = 0.38). For more details, Table 4 shows the performances of all models per database in terms of PCC. It can be seen that the highest performances are achieved by one of the eight models LSTM, Guo’s, Vriendt’s, P.1203, SQI, KSQI, biQPS, and CQM. In particular, the LSTM model is very effective, offering the highest performance on six databases. In contrast, none of the Rehman’s (both ori and mod), Singh’s, Liu’s, Yin’s, or ATLAS models deliver the highest PCC value on any database.

4.2. Performance across Video Codecs

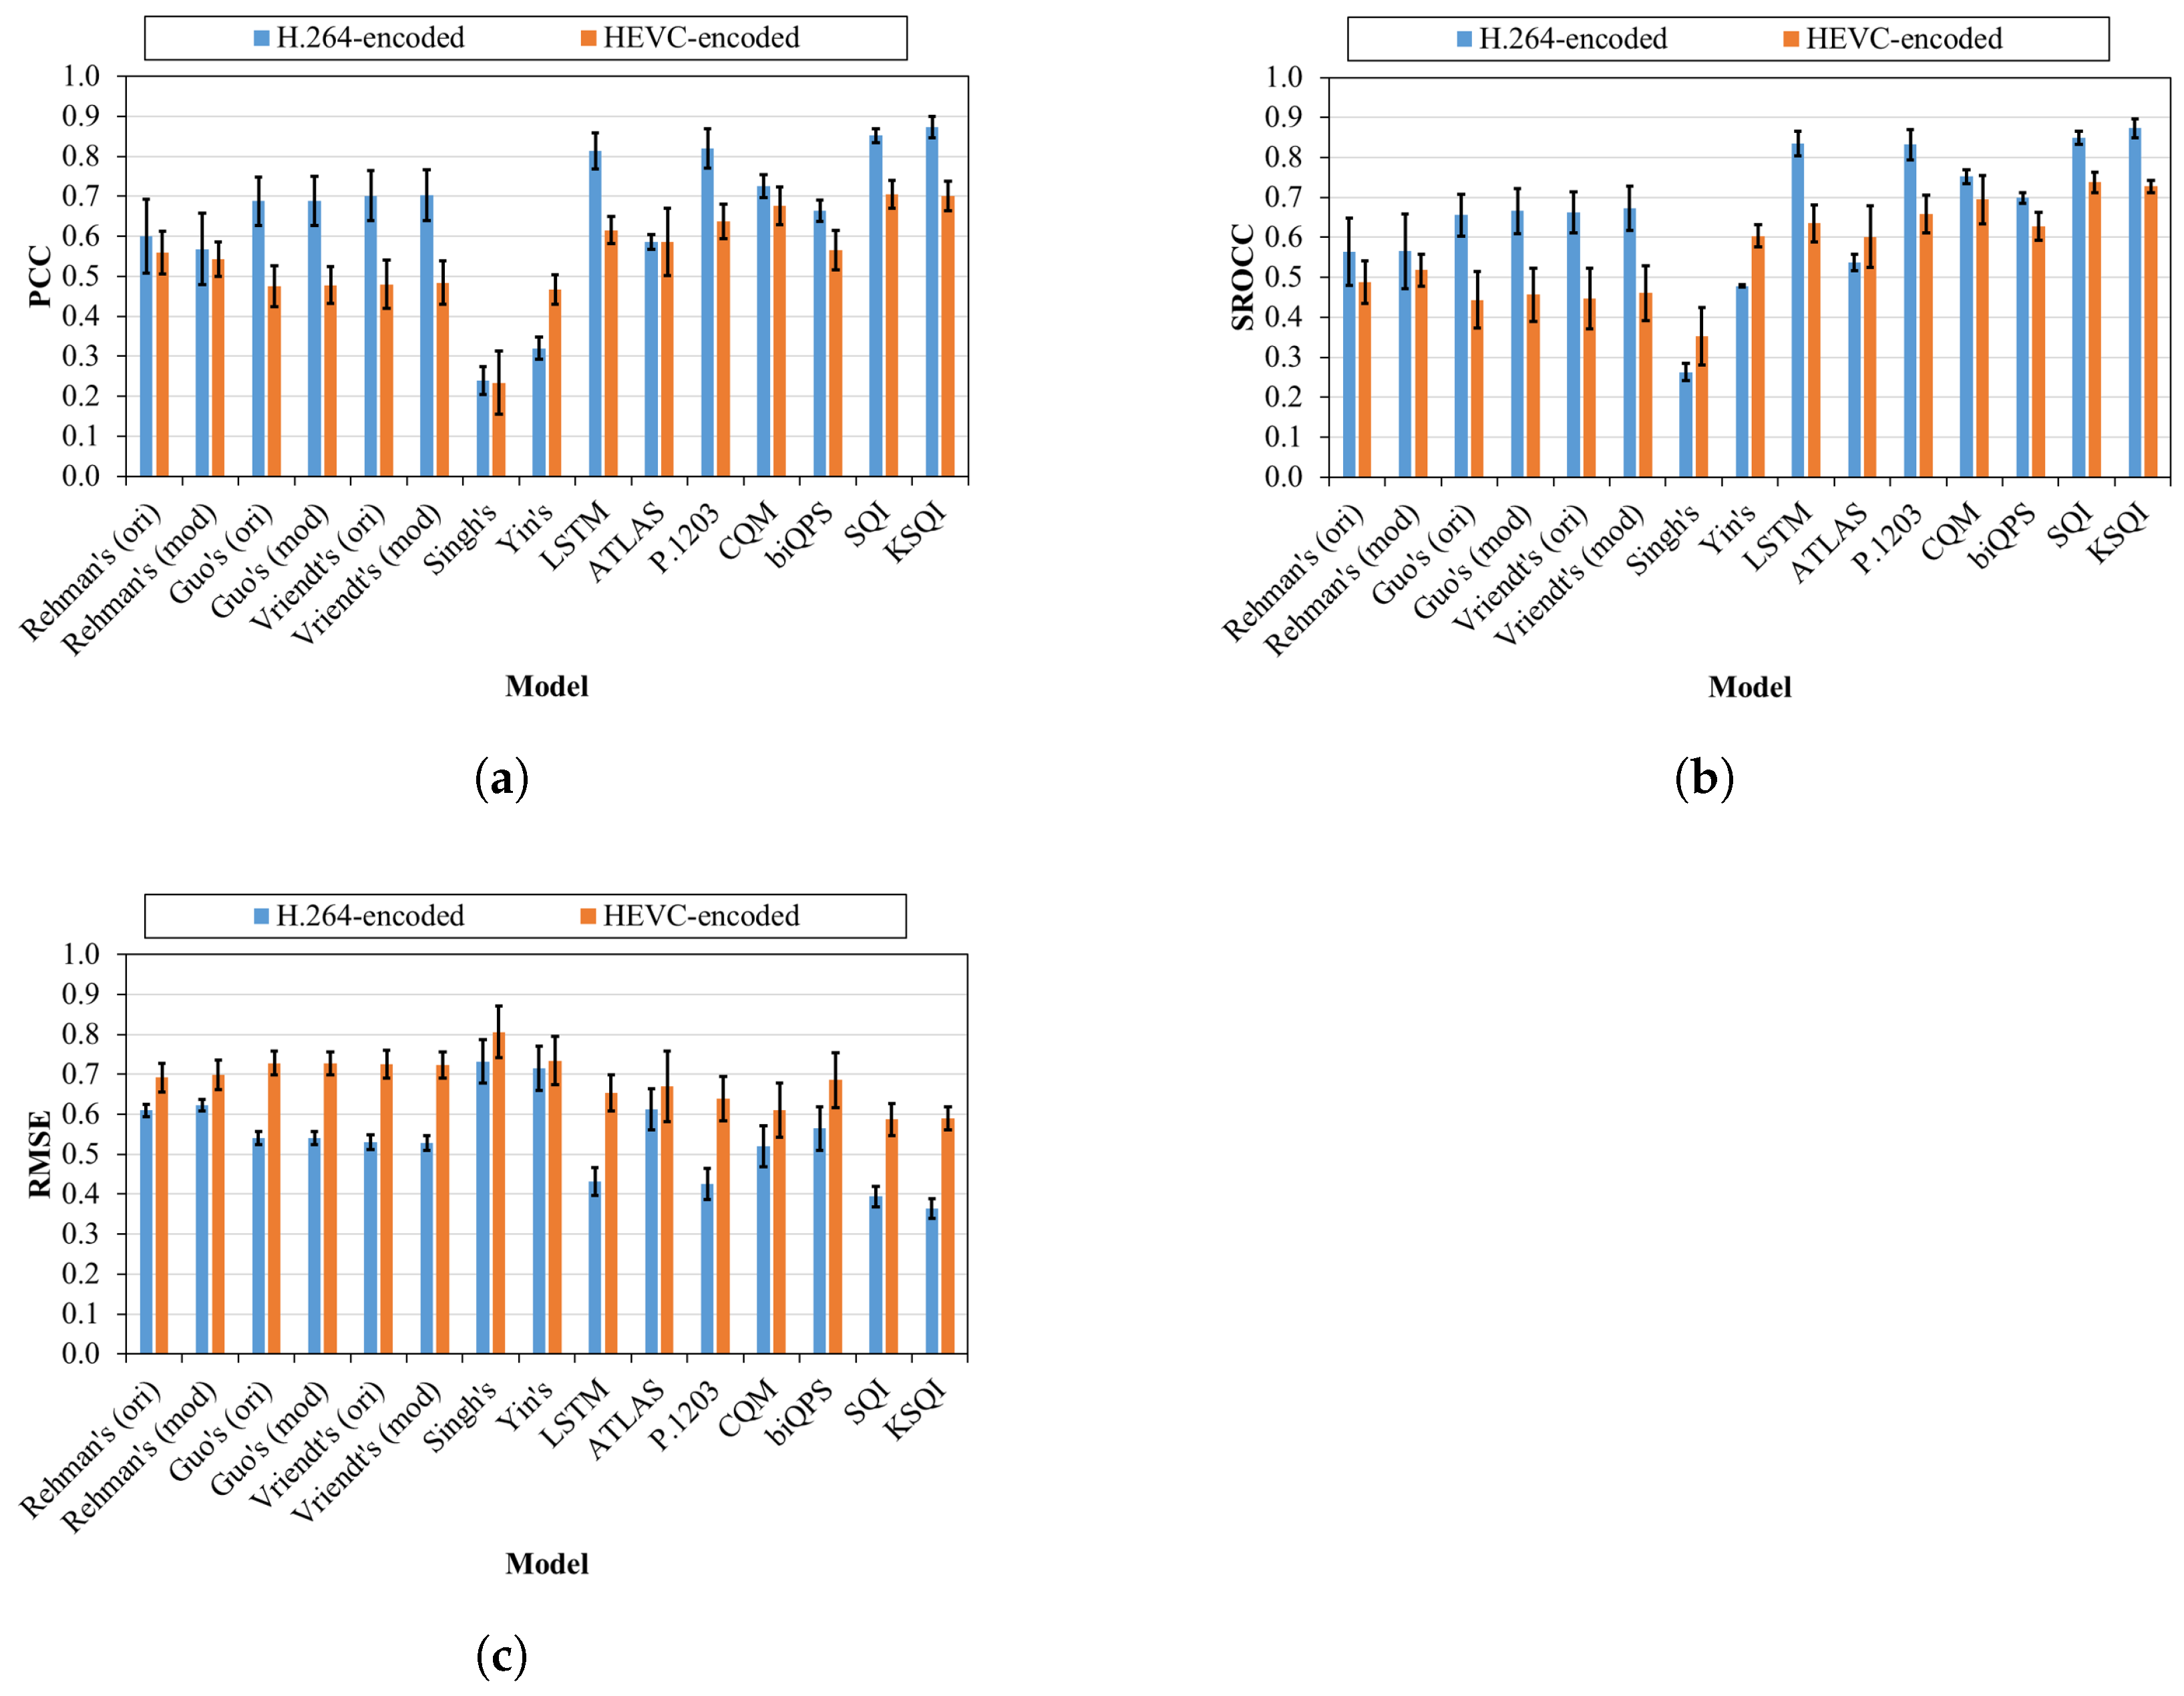
In this subsection, a performance evaluation of the models is done separately for H.264 and HEVC. For this, we divide the W-SQoE-IV (full) database into two sets. The first set (denoted H.264-encoded) consists of three H.264-encoded sub-databases of W-SQoE-IV_pH264, W-SQoE-IV_fH264, and W-SQoE-IV_uH264. The second set (denoted HEVC-encoded) is comprised of three HEVC-encoded sub-databases of W-SQoE-IV_pHEVC, W-SQoE-IV_fHEVC, and W-SQoE-IV_uHEVC. As the two sets are from the same database of W-SQoE-IV (full), they share the same settings except the codec. This helps eliminate the possible bias in the evaluation process.
Figure 2 illustrates the average performance of individual models on the two database sets. The error bars show the standard deviation values. The trend is that the models generally yield better performance on the H.264-encoded set. In particular, the KSQI model, which achieves the highest performance for both of the sets, has quite high performance for the H.264-encoded set (i.e., PCC = 0.87, SROCC = 0.87, and RMSE = 0.36) but much lower performance for the HEVC-encoded set (i.e., PCC = 0.70, SROCC = 0.73, and RMSE = 0.59). This result shows that all the considered models, even the ones taking into account HEVC characteristics such as P.1203 and KSQI, are not very effective for HEVC-encoded sessions. This could be because these models are trained first with H.264-encoded videos and then additionally extended to support HEVC-encoded videos. As the performances on HEVC-encoded sessions are low, hereafter only the databases using H.264 will be discussed in the rest of the paper. This helps maintain a reliable analysis as well as reduce the complexity of the evaluation.

4.3. Performance across Viewing Devices

To investigate the performance of the QoE models across different viewing devices, we consider three separate device combinations corresponding to three database sets. Particularly, the first set (denoted DBS1) includes three sub-databases of W-SQoE-IV_pH264, W-SQoE-IV_fH264, and W-SQoE-IV_uH264, which corresponds to three devices of smart phones, full high definition (FHD) monitor, and ultra high definition (UHD) TV, respectively. With the focus on smart phone and PC, the second set (denoted DBS2) contains two databases of TR04p and TR04f. Similarly, the third set (denoted DBS3) is composed of TR06p and TR06f databases. It is worth noting that the difference between the databases in a given set is the viewing device only. This allows us to reliably compare the performance of the same model across different devices.
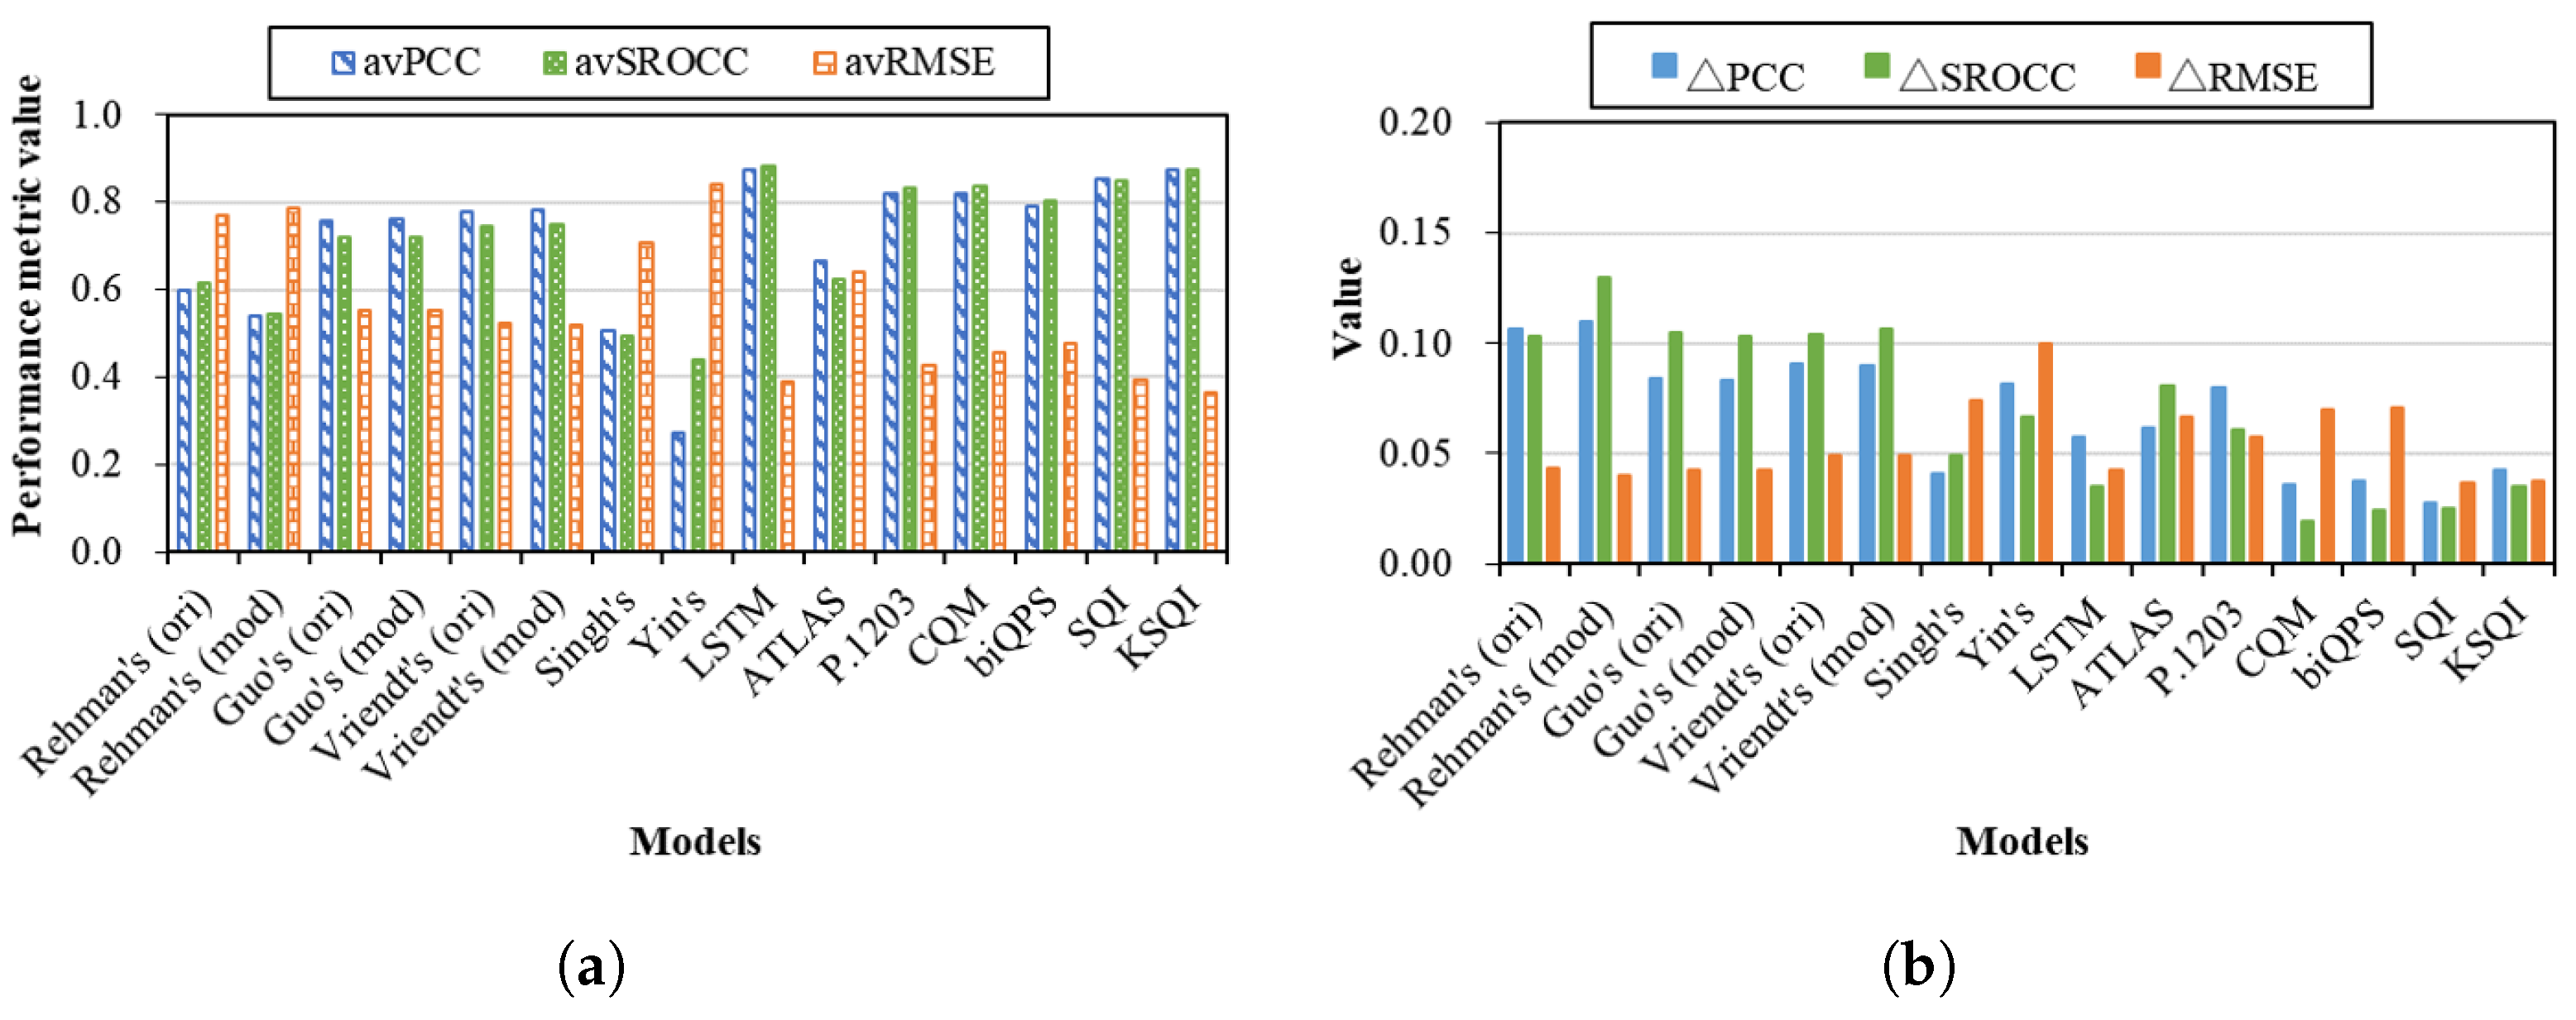
To analyze the impact of viewing devices on the performances of the models, we use two metrics of average performance (denoted a v ) and mean difference (denoted Δ ). The use of a v and Δ is to respectively measure the main tendency and the variation of performances across viewing devices. The formulas of these metrics are given by (4) and (5). In particular, given a model, the first metric is measured as the average performance computed over all the seven databases in the three sets. For the second metric, the performance differences are firstly calculated between all the database pairs in the same set. Then, the mean of all the differences is considered as the mean difference value:
a v = i = 1 N j = 1 K i M i , j i = 1 N K i ,
Δ = i = 1 N j = 1 K i 1 l = j + 1 K i M i , j M i , l i = 1 N K i 2 ,
where N = 3 is the number of sets, K i is the number of databases in set i, and M i , j is the performance metric value corresponding to database j in set i.
Figure 3 shows the results of individual QoE models. It can be seen that, among the models, the Yin’s model has the lowest average performance with avPCC = 0.27, avSROCC = 0.44, and avRMSE = 0.84. Meanwhile, the Rehman’s model is found to have the strongest performance variation. Specifically, its mean differences of Δ PCC, Δ SROCC, and Δ RMSE are respectively 0.11, 0.10, and 0.04 in the ori case, and 0.11, 0.13, and 0.04 in the mod case. By contrast, the performance of the LSTM, SQI, and KSQI models is not only high (i.e., high a v ) but also quite consistent (i.e., low Δ ). Particularly, the avPCC, avSROCC, and avRMSE values are 0.87, 0.88, and 0.39 for the LSTM model, 0.85, 0.85, and 0.39 for the SQI model, and 0.87, 0.87, and 0.36 for the KSQI model. In addition, the Δ PCC, Δ SROCC, and Δ RMSE values are respectively 0.06, 0.03, and 0.04 for the LSTM model, 0.03, 0.03, and 0.04 for the SQI model, and 0.04, 0.03, and 0.04 for the KSQI model. The reason might be that these models use either MOS or VMAF as a segment quality metric. Both of the metrics inherently take into account the impact of a viewing device on the user perceived quality. Thus, the LSTM, SQI, and KSQI models still perform quite well across viewing devices. This implies that, to obtain the high and stable performance for different devices, segment quality metrics should be ones that consider the effect of viewing devices such as MOS and VMAF. In addition, it is suggested that the LSTM, SQI, and KSQI models can be employed in the QoE prediction for different viewing devices.

4.4. Performance across Session Durations

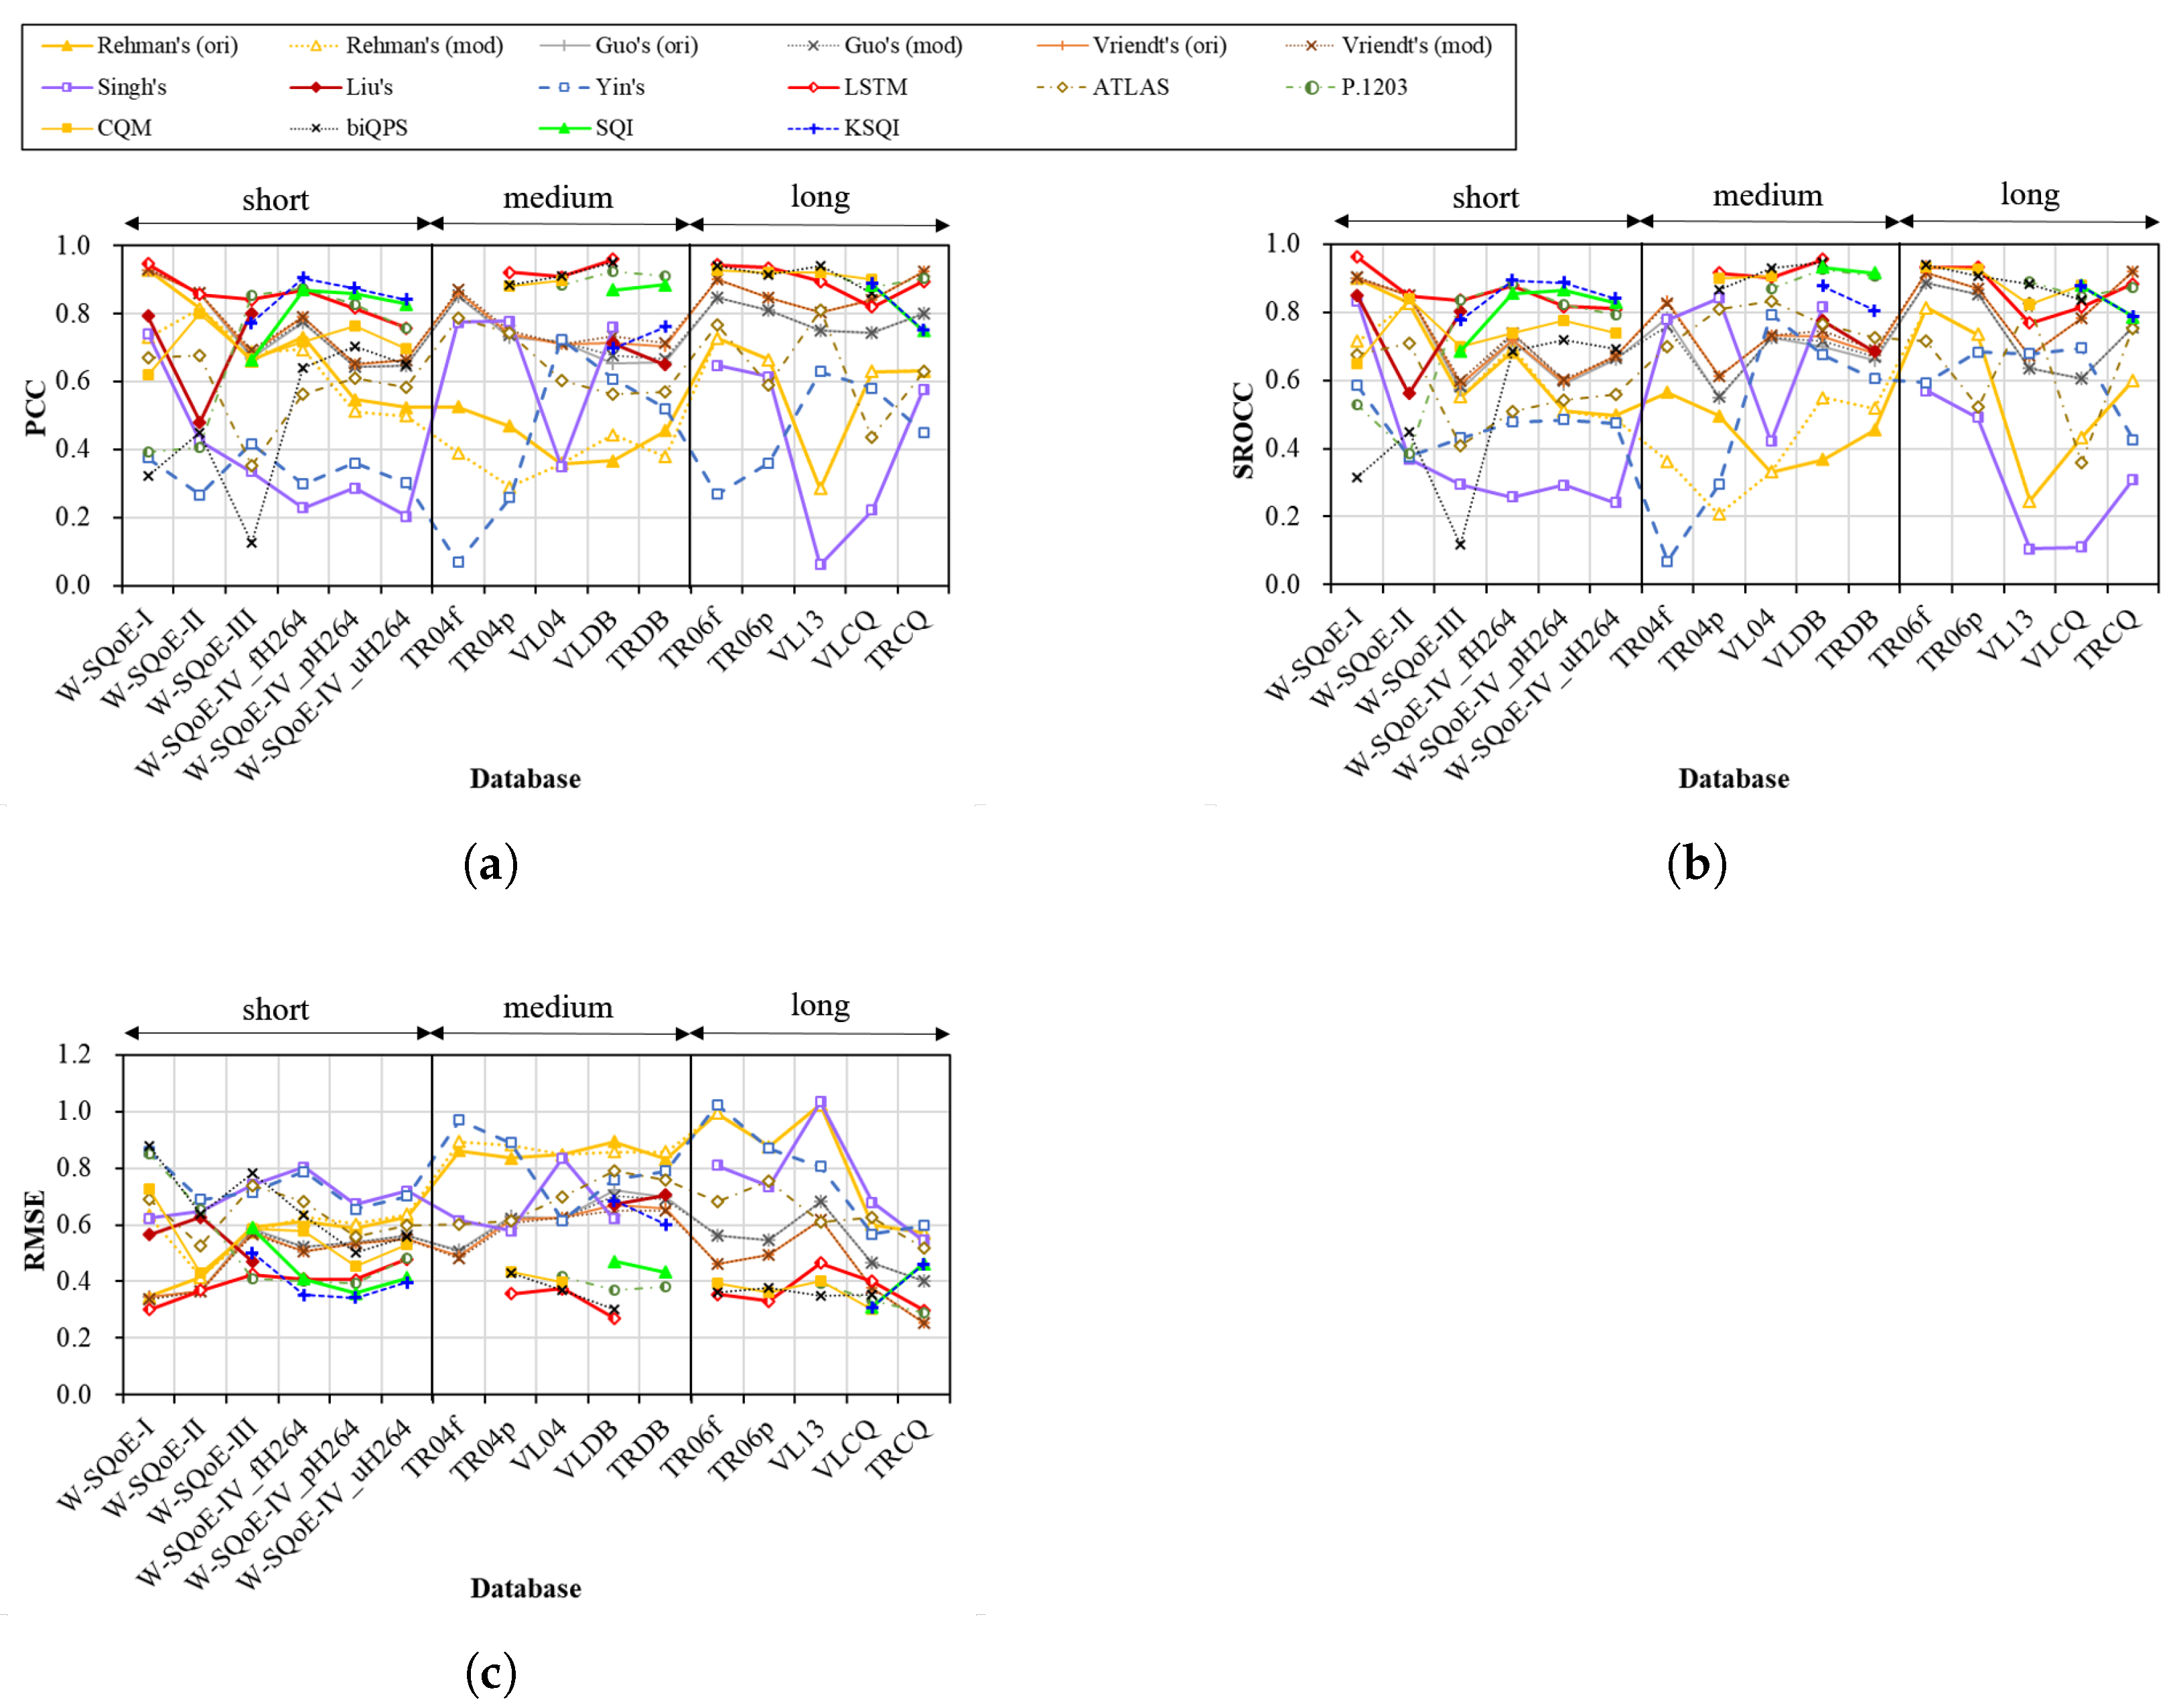
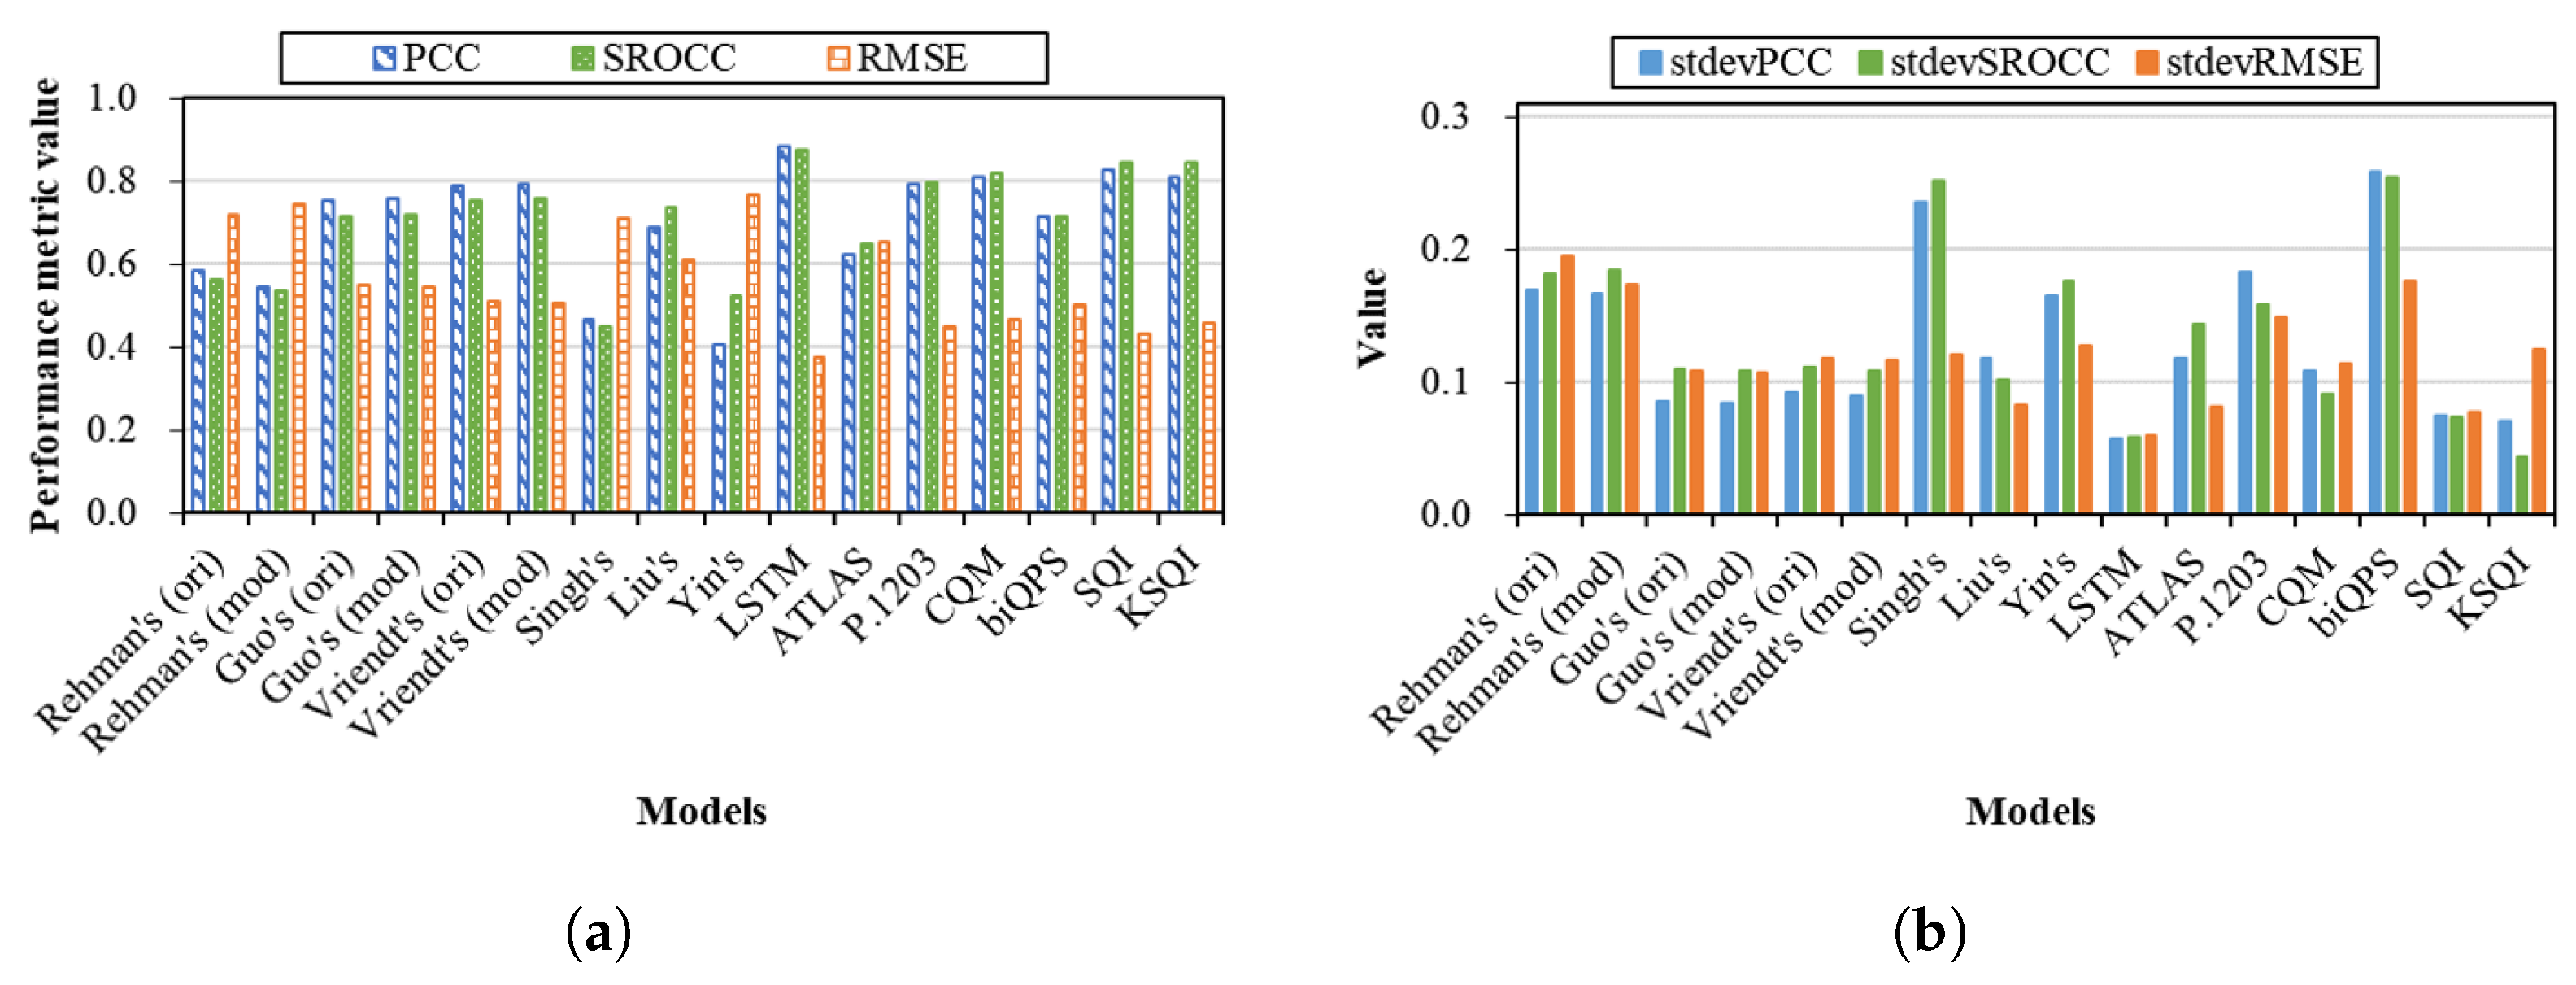
To study the impact of session durations on the performances of the models, the obtained results over all the databases with respect to different session durations are plotted in Figure 4. Note that the first six databases in the horizontal axis (i.e., W-SQoE-I, W-SQoE-II, W-SQoE-III, W-SQoE-IV_fH264, W-SQoE-IV_pH264, and W-SQoE-IV_uH264) contain only short sessions with the lengths of from 8 to 28 s. For the next five databases (i.e., TR04f, TR04p, VL04, VLDB, and TRDB), they consist of medium sessions of about 1-minute in length. With the last five databases (i.e., TR06f, TR06p, VL13, TRCQ, and VLCQ), long sessions (i.e., ≥3 min) are included. To facilitate the performance comparison between the models, Figure 5 shows the average and standard deviation (stdev) of the performances of each model over all the databases.
From these figures, we divide the models into four groups. The first group consists of Rehman’s (both ori and mod), Singh’s, and Yin’s models that have rather low average performances (i.e., PCC ≤ 0.58, SROCC ≤ 0.56, and RMSE ≥ 0.71). For the models in the second and third groups, their average performances are acceptable (i.e., 0.62 ≤ PCC ≤ 0.81, 0.65 ≤ SROCC ≤ 0.82, and 0.45 ≥ RMSE ≥ 0.65). In the second group, the included models are Liu’s, ATLAS, P.1203, CQM, and biQPS that have drastically variable performances (i.e., stdevPCC ≥ 0.11, stdevSROCC ≥ 0.09, and stdevRMSE ≥ 0.08). The third group is composed of Guo’s and Vriendt’s models with both the ori and mod cases. In general, their performances are stable with stdevPCC ≤ 0.09, stdevSROCC ≤ 0.11, and stdevRMSE ≤ 0.12. For the fourth group, it contains three models of LSTM, SQI, and KSQI that have quite high average performances (i.e., PCC ≥ 0.81, SROCC ≥ 0.84, and RMSE ≤ 0.46). In the following, the models in each group will be discussed in detail.

4.4.1. First Model Group

Figure 6 compares the QoE models in the first group. It can be seen that the performances of these models are generally low and considerably variable. In particular, the ranges of the PCC, SROCC, and RMSE values are respectively [0.29, 0.93], [0.25, 0.90], and [0.35, 1.02] for Rehman’s (ori) model, [0.29, 0.81], [0.21, 0.83], and [0.42, 1.02] for Rehman’s (mod) model, [0.06, 0.78], [0.11, 0.84], and [0.55, 1.03] for Singh’s model, and [0.07, 0.72], [0.07, 0.79], and [0.57, 1.02] for the Yin’s model.
With respect to the Rehman’s (ori) model, this model yields high performance on the W-SQoE-I (PCC = 0.93) and W-SQoE-II (PCC = 0.81) databases, which contain short sessions (8-s and 10-s). By contrast, its performance is generally low on the other databases with longer session durations (PCC ≤ 0.73, SROCC ≤ 0.81, RMSE ≥ 0.57). It can be explained that this model is originally developed using short sessions (i.e., 5–15 s), and so not effective for longer sessions. In particular, it performs poorly on the databases including stalling events such as VL04, VLDB, and VL13 (i.e., PCC ≤ 0.44, SROCC ≤ 0.55, RMSE ≥ 0.85). This is due to the fact that the model does consider the impact of stalling events. This result suggests that the model built based on short sessions such as Rehman’s may not be effective for medium and long sessions. In addition, the impact of stalling events is crucial to be considered in QoE models.
From Figure 6, it can be seen that the performance of Singh’s model on the W-SQoE-I, TR04f, TR04p, and VLDB databases is acceptable and significantly higher than those of the other databases. In particular, its PCC and SROCC values are in the range from 0.74 to 0.84 while its RMSE values are from 0.58 to 0.62. This result can be explained as follows. The Singh’s model mainly focuses on quantifying the impact of stalling events by means of various inputs such as the total number of stalling vents and the maximum of stalling durations. Meanwhile, only one input of QP average is used to model the impact of quality variations. However, this input is obviously not able to distinguish quality switches with different amplitudes [40]. Meanwhile, it is well-known that abrupt switches commonly cause more negative influence than smooth ones [40]. Thus, as a consequence, this model performs well on the four above databases that contain a major number of sessions with stalling events. Meanwhile, for the W-SQoE-II, VLCQ, and TRCQ databases that contain only quality variations, the Singh’s model results in very low performance (i.e., PCC ≤ 0.65, SROCC ≤ 0.57, and RMSE ≥ 0.55). This shows that the use of only QP average is not sufficient to model the impact of quality variations.
In comparison to the Singh’s model, the Yin’s model is noticeably the worst on databases containing sessions with frequent stalling events such as W-SQoE-I, TR04f, TR04p, and VLDB. This is probably because the Yin’s model simply uses the total stalling durations to quantify the impact of stalling events. Meanwhile, for the VL04, VL13, and VLCQ databases, the performance of the Yin’s model is substantially higher. Note that, in the three databases, most or all of the sessions do not include stalling events. This implies that the use of the bitrate average and the average of switching amplitudes as in the Yin’s model is more effective than the QP average in representing the quality variations. Still, the performance of the Yin’s model is not very high. In particular, the PCC and SROCC values are less than 0.80 and the RMSE values are higher than 0.57. These results suggest that the use of the sum of stalling durations only is not able to fully represent stalling events appearing in streaming sessions. In addition, although the bitrate average and the average of switching amplitudes are generally better than the QP average, they are still not effective enough to model the impact of quality variations.

4.4.2. Second Model Group

Figure 7 shows the results of the models in the second group. Along with the sum of stalling durations, the total number of stalling events are additionally fed in Liu’s and ATLAS models. Hence, from Figure 6 and Figure 7, it can be seen that their performance is significantly higher than or similar to that of Yin’s model for the W-SQoE-I, TR04f, TR04p, and VLDB databases. Compared to the Liu’s model, the ATLAS model produces better results but is still not very high for the W-SQoE-II database that comprises sessions with only quality variations (i.e., PCC = 0.68, SROCC = 0.71, and RMSE = 0.53). This can be because this model relies on the frequency of quality switches to characterize the quality variations, which cannot account for the degrees of the quality switches (i.e., switching amplitude).
In spite of using the same inputs to represent the impacts of stalling events, the Liu’s model brings out significantly higher performances than the ATLAS model for the databases including sessions with stalling events (i.e., W-SQoE-I, W-SQoE-III, VLDB, and TRDB). This may be caused by the difference between the modeling approaches used in the two models. Interestingly, the Liu’s model that has higher performance utilizes the simple linear function, whereas the ATLAS model uses the more sophisticated one of Support Vector Regression. However, in general, both the approaches are not very effective in quantifying the impact of stalling events (i.e., PCC ≤ 0.81, SROCC ≤ 0.85, and RMSE ≥ 0.47). Hence, both Liu’s and ATLAS models are not very effective to predict the QoE of streaming sessions. In addition, the use of more complicated modeling approaches does not always result in higher performance.
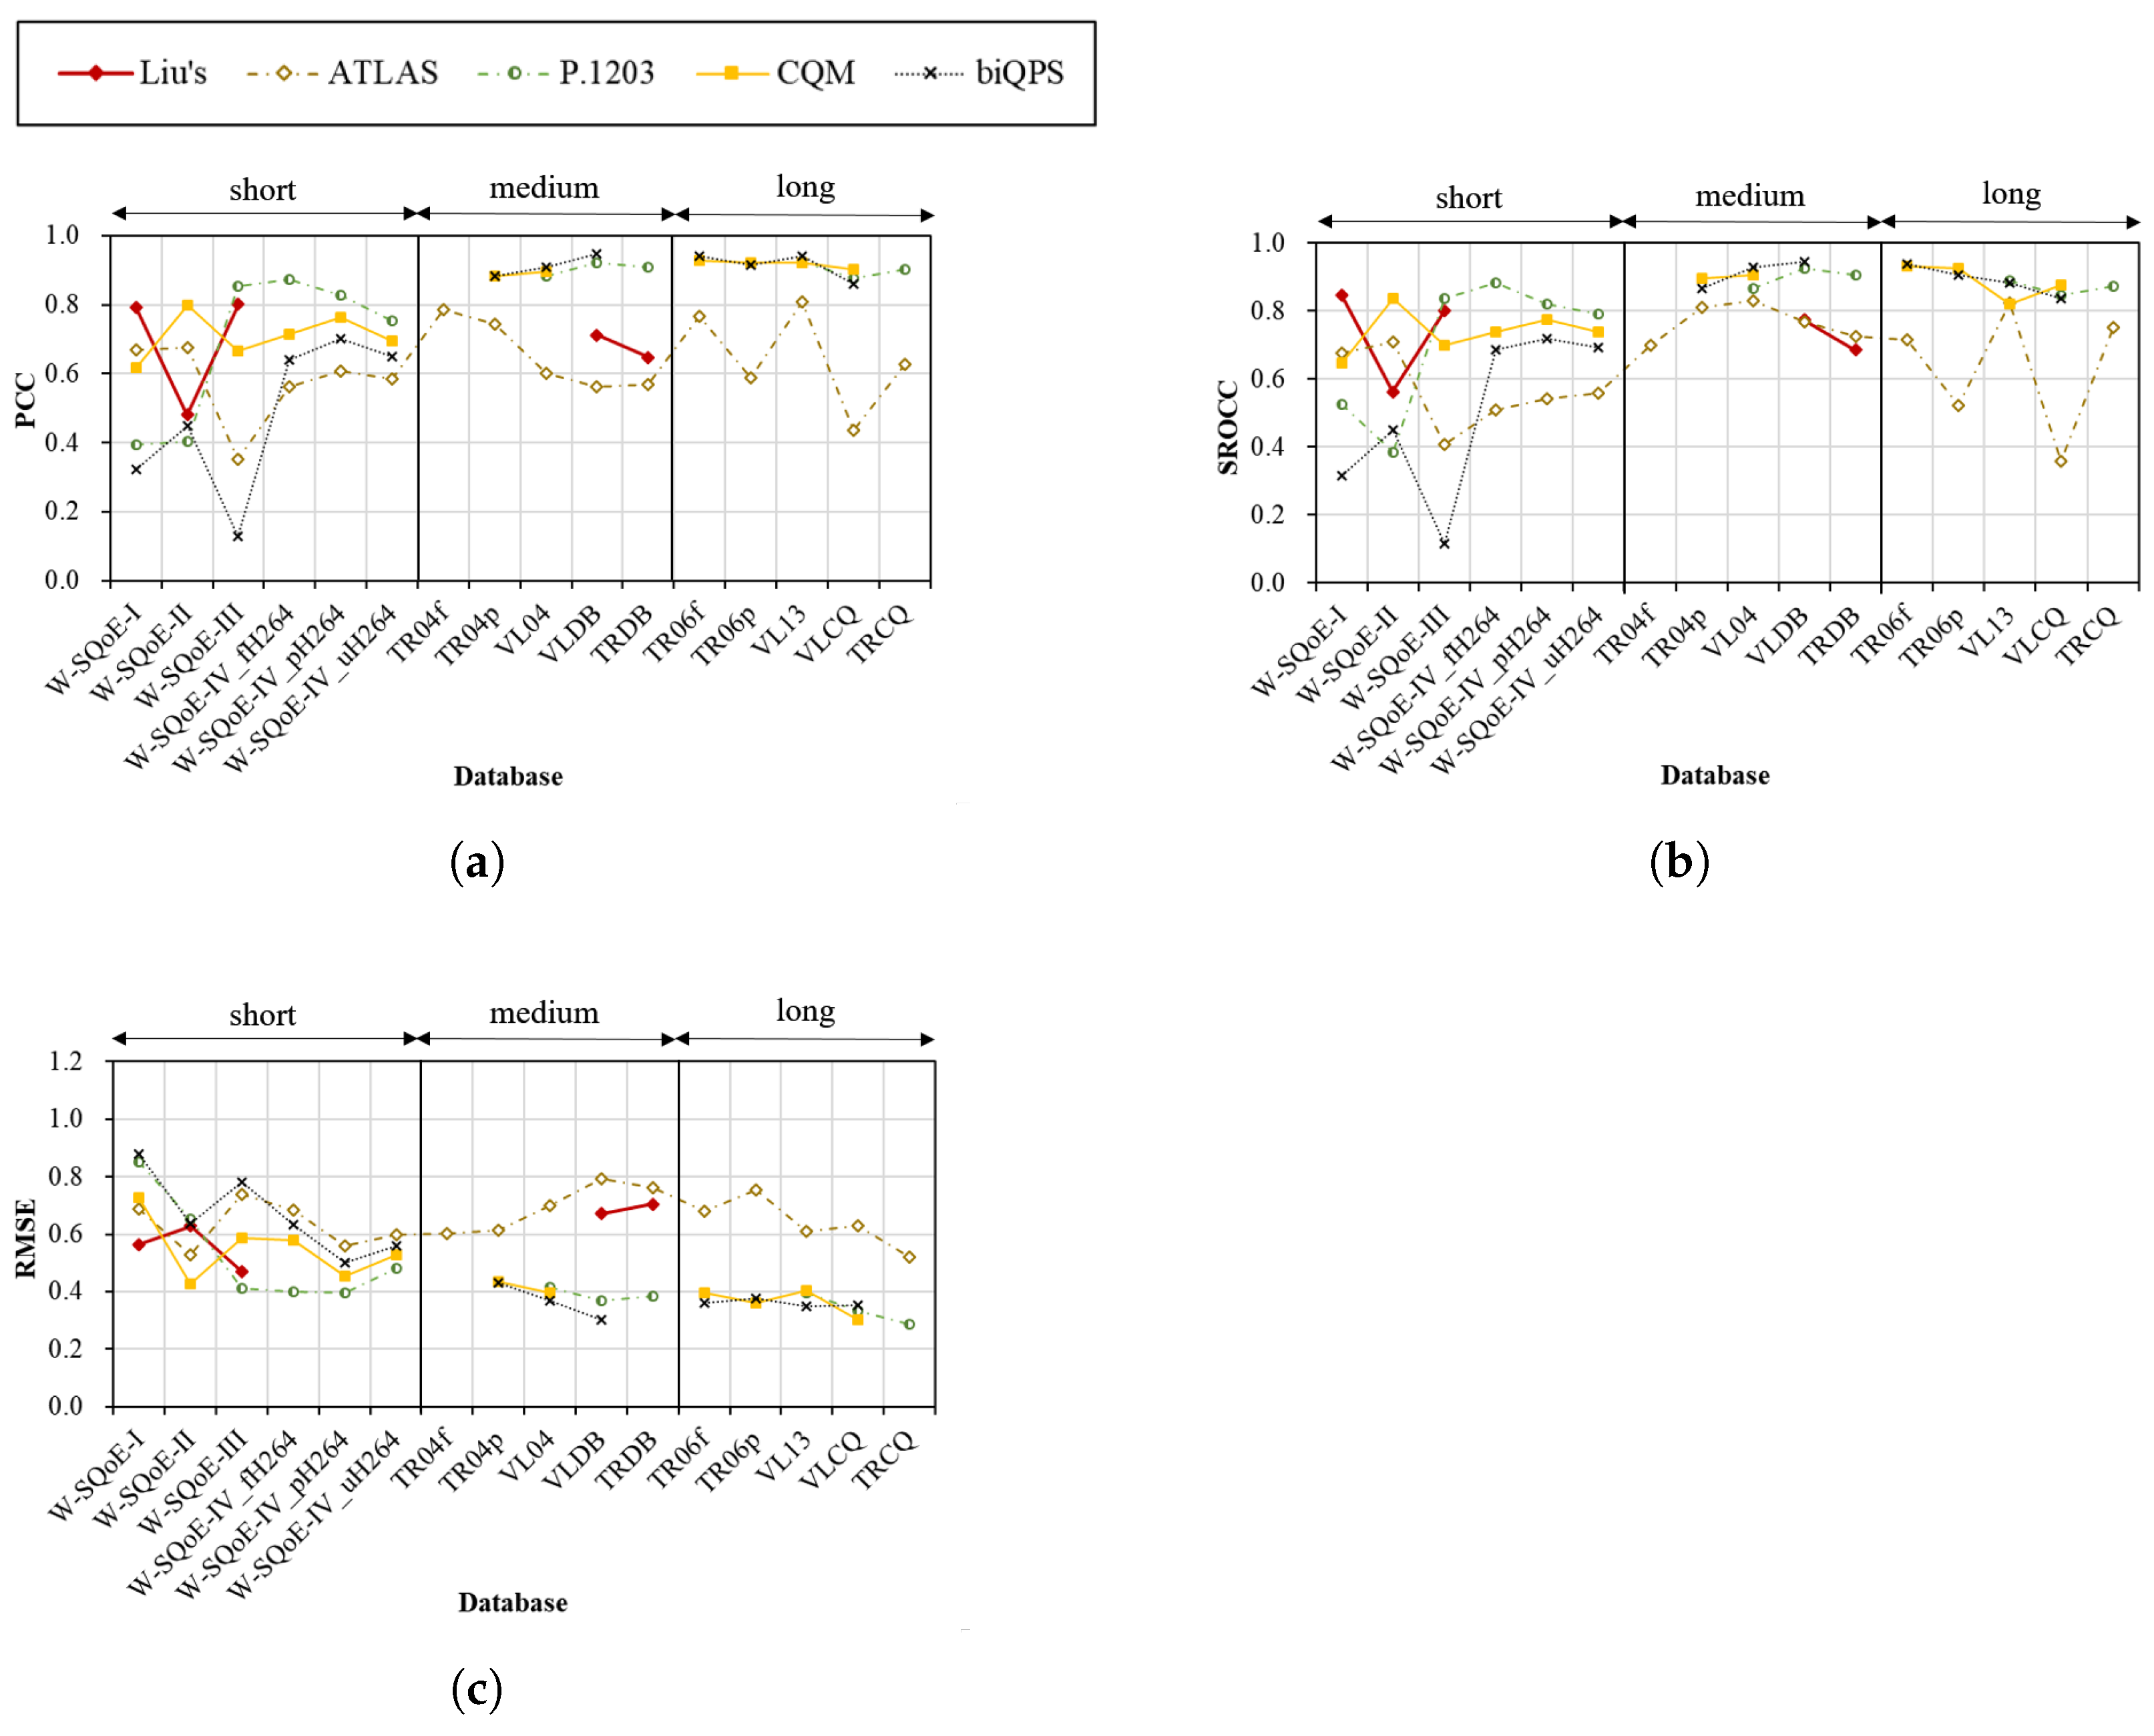
For the P.1203, CQM, and biQPS models, their performances are very high for the databases with medium and long sessions, namely TR04p, VL04, VLDB, TRDB, TR06f, TR06p, VL13, VLCQ, and TRCQ. In particular, their PCC and SROCC values are in the range from 0.82 to 0.95, and their RMSE values are between 0.29 and 0.43. The plausible explanation is that they are originally devoted to such session durations (i.e., 60 s–300 s for the P.1203 model and 60 s–360 s for the CQM and biQPS models). For short sessions of 13 and 28 s (i.e., in W-SQoE-III, W-SQoE-IV_fH264, W-SQoE-IV_pH264, and W-SQoE-IV_uH264), the P.1203 model generally performs quite well (i.e., PCC ≥ 0.76, SROCC ≥ 0.79, and RMSE ≤ 0.48). However, for shorter sessions of 8 and 10 s (i.e., in the W-SQoE-I and W-SQoE-II databases), its performance is drastically reduced (i.e., PCC ≤ 0.40, SROCC ≤ 0.53, and RMSE ≥ 0.65). In a similar behavior, the performance of the biQPS model is acceptable for 28-second long sessions in W-SQoE-IV_fH264, W-SQoE-IV_pH264, and W-SQoE-IV_uH264 (i.e., PCC ≥ 0.64, SROCC ≥ 0.69, and RMSE ≤ 0.63). However, its performance is unsatisfactory for shorter sessions (i.e., PCC ≤ 0.45, SROCC ≤ 0.45, and RMSE ≥ 0.64). Meanwhile, the performance of the CQM model is acceptable for all the databases including short sessions. However, these results are still not very high. Specifically, its PCC, SROCC, and RMSE values range respectively in [0.62, 0.80], [0.65, 0.84], and [0.73, 0.43]. This result implies that the P.1203, CQM, and biQPS models should be employed for only medium and long sessions with the lengths from 60 to 360 s.

4.4.3. Third Model Group

Figure 8 shows the performance of the QoE models in the third group. Although Guo’s and Vriendt’s models are very simple, considering only the impact of quality variations, their performances in both the ori and mod cases are generally stable and acceptable for all the databases including those containing sessions with stalling events (i.e., PCC ≥ 0.64, SROCC ≥ 0.55, and RMSE ≤ 0.72). They even provide quite high performances for many databases such as the W-SQoE-I, W-SQoE-II, TR04f, TR06f, and TR06p databases (i.e., PCC ≥ 0.81, SROCC ≥ 0.76, and RMSE ≤ 0.56).
Although Liu’s and ATLAS models additionally take into account the impacts of stalling events, their performances are not significantly higher and even, in some cases, lower than the simple models of Guo’s and Vriendt’s. This can be explained by the fact that stalling events commonly appear after segment quality decreases. Therefore, to a certain extent, modeling the impact of quality variations can somewhat reflect the impact of stalling events. In addition, it is suggested that the impact of quality variations is a key component in QoE models. In addition, it is once again confirmed that complex models that contain more inputs and take into account more influence factors do not always have better performances.
Within the same case of ori or mod, it can be seen that difference in performance of these two models depends on session durations. In particular, the difference is small for short and medium sessions. In such cases, the maximum difference is 0.06 for PCC, 0.07 for SROCC, and 0.05 for RMSE. Meanwhile, in case of long sessions, the longer the duration is, the bigger the difference becomes. For the TRCQ database, the difference is up to 0.13 for PCC, 0.16 for SROCC, and 0.15 for RMSE. In addition, the Vriendt’s model tends to perform better than the Guo’s model. This result implies that, to represent the impact of quality variations, the statistics used in the Vriendt’s model (i.e., average and stdev of segment quality values, number of quality switches) are more effective than the ones employed in the Guo’s model (i.e., median and minimum segment quality values), especially for long sessions.
From Figure 8, it can also be seen that the addition of the impact of initial delay to Guo’s and Vriendt’s models does not bring significant improvements as the difference between the two cases ori and mod is trivial for all the databases. In particular, the maximum gains of the mod case in terms of PCC, SROCC, and RMSE are respectively 0.02, 0.02, and 0.02 for both Guo’s and Vriendt’s models. A possible reason is that the initial delay in these databases is commonly short (e.g.,1 s, 2 s, or 5 s) and could be tolerant [3]. Therefore, for short initial delay, its impact is marginal.

4.4.4. Fourth Model Group

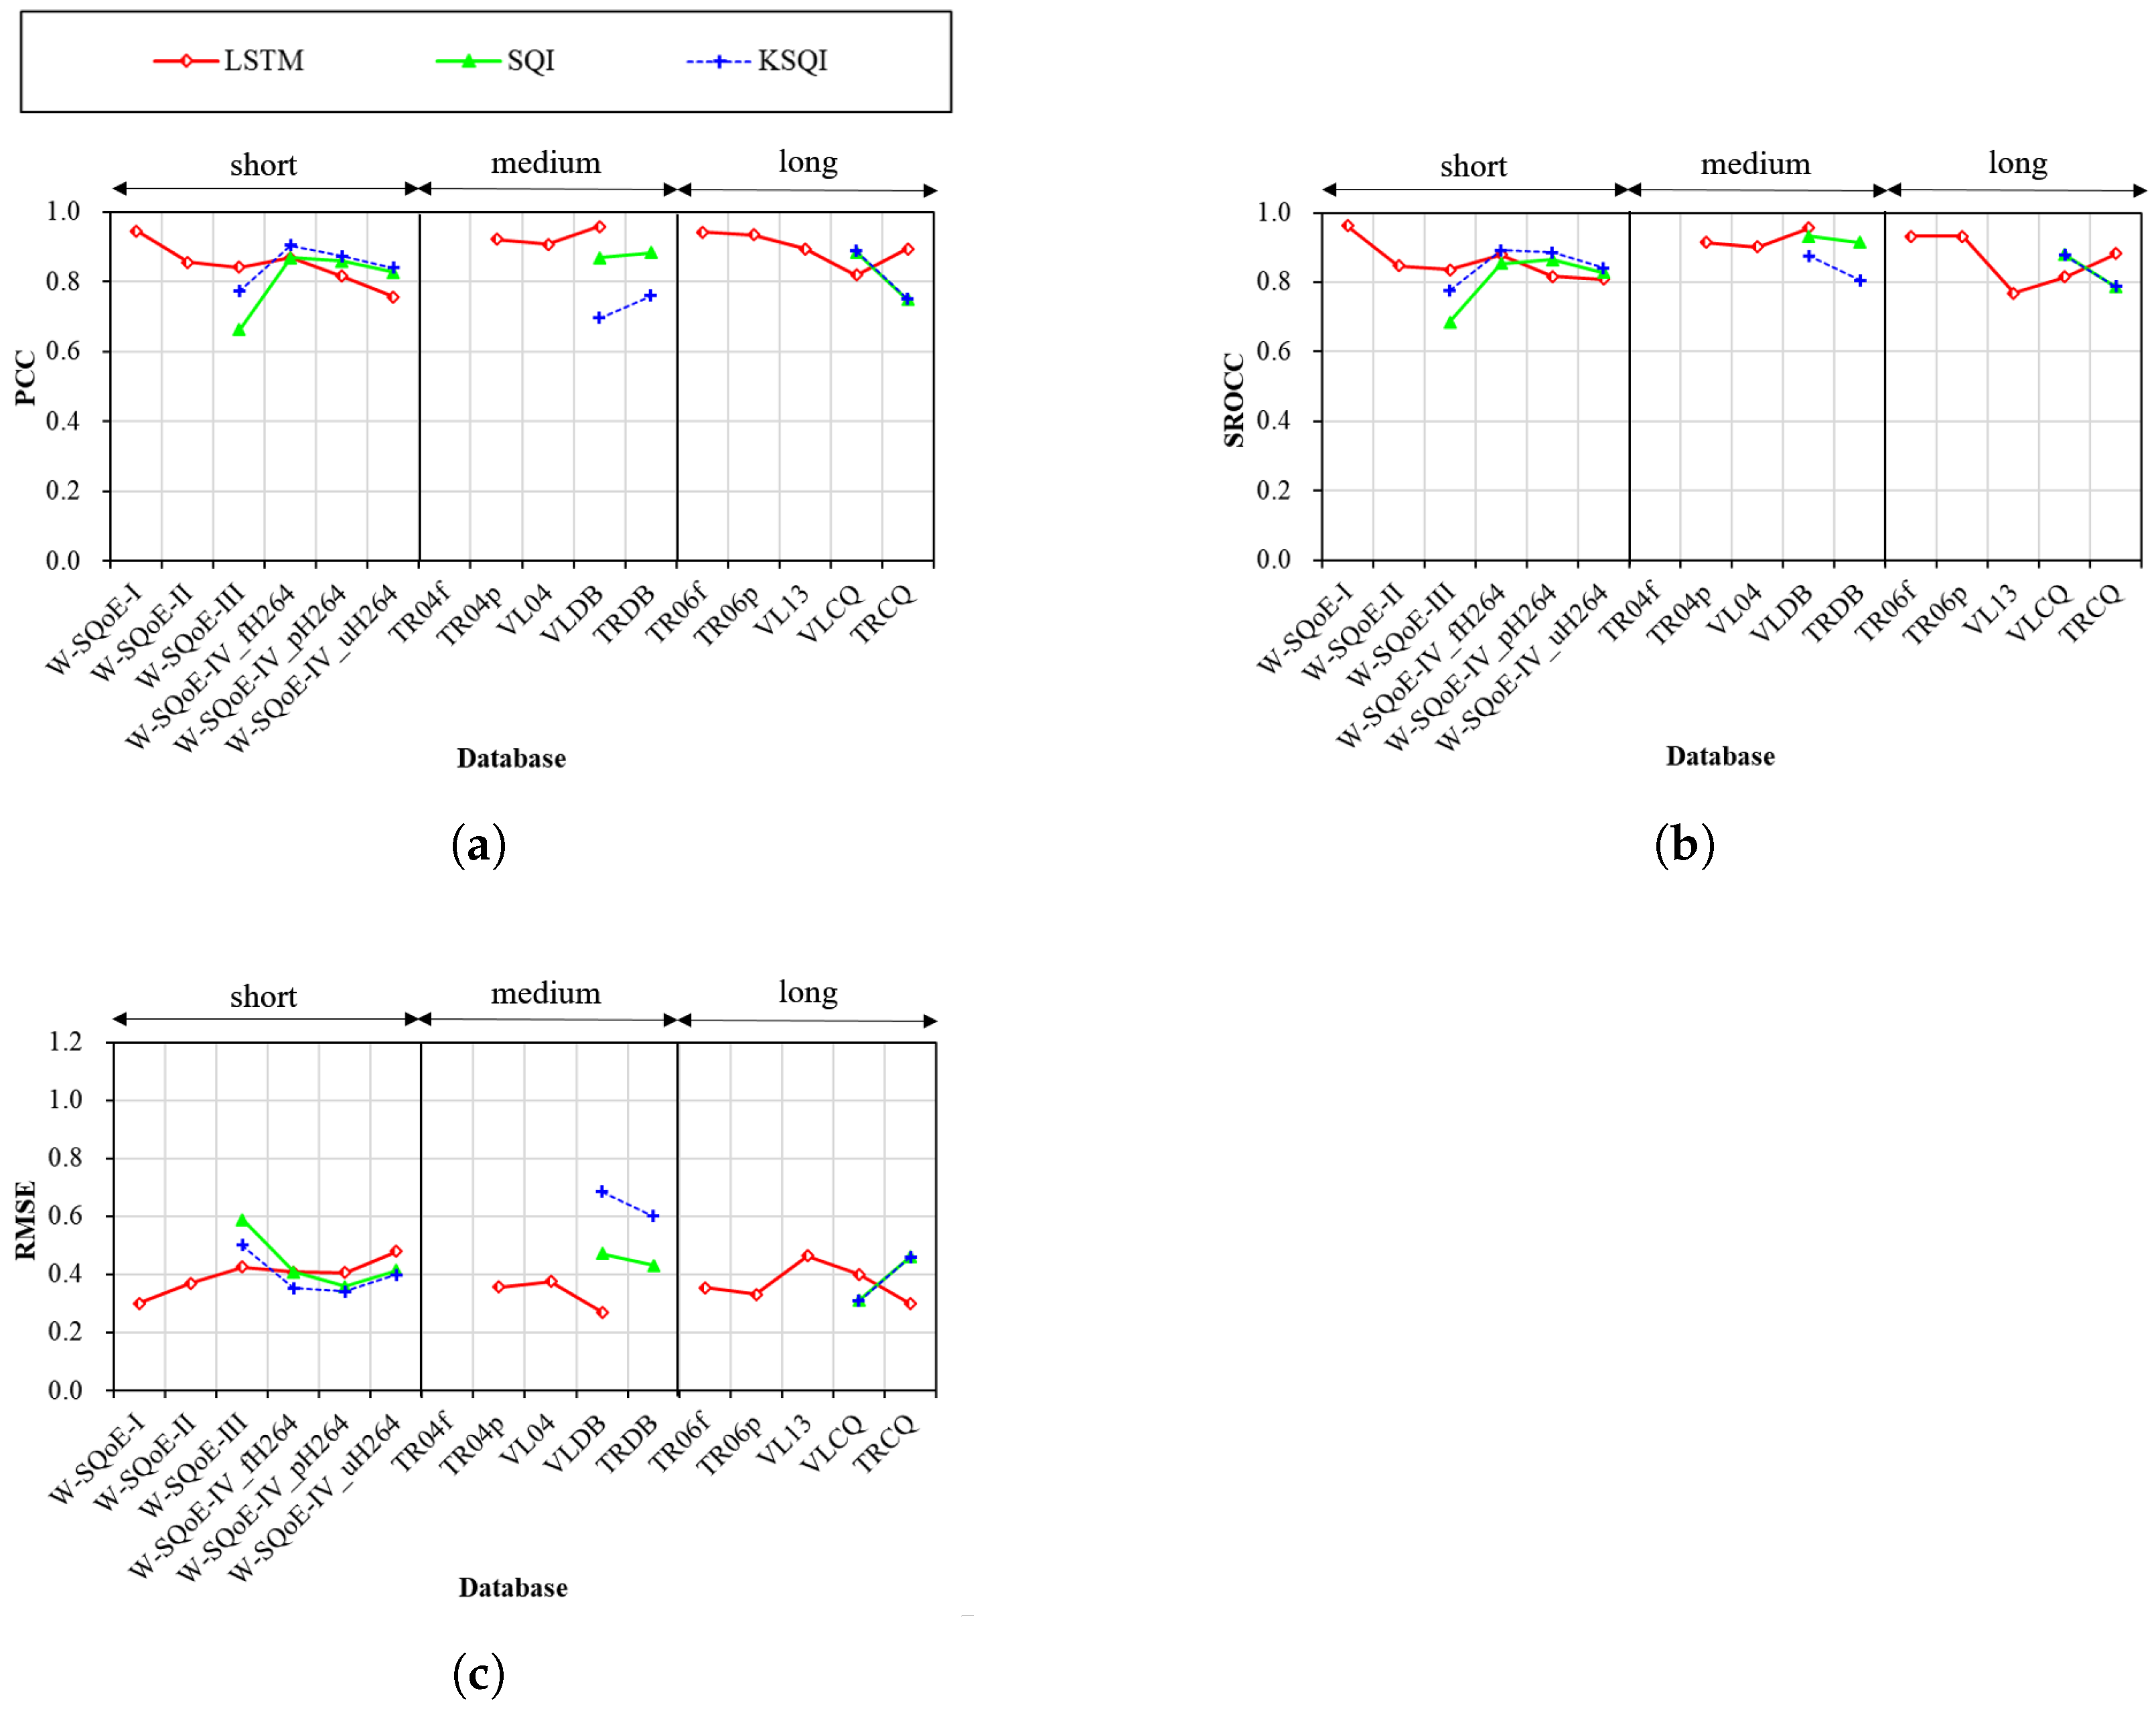
Figure 9 compares the performance of the QoE models in the fourth group. We can see that these models perform generally well across the databases. In particular, the average PCC, SROCC, and RMSE values are respectively 0.88, 0.88, and 0.37 for the LSTM model, 0.83, 0.84, and 0.43 for the SQI model, and 0.81, 0.84, and 0.46 for the KSQI model. In particular, the performance of the LSTM model is generally the highest and most stable. In particular, the PCC, SROCC, and RMSE range respectively in [0.76, 0.96], [0.77, 0.96], and [0.27, 0.48] for the LSTM model, in [0.66, 0.88], [0.69, 0.93], and [0.31, 0.59] for the SQI model, in [0.70, 0.90], [0.78, 0.89], and [0.31, 0.69] for the KSQI model.
Except for the W-SQoE-IV_uH264 database, the lowest PCC and SROCC values are 0.82 and 0.77 while the highest RMSE value is 0.46. For the W-SQoE-IV_uH264 database using UHD TV, the obtained results are not very high but still acceptable (i.e., PCC = 0.76, SROCC = 0.81, and RMSE = 0.48). This result implies that, among the considered models, the LSTM model is the best one to predict the QoE of streaming sessions with various viewing devices and different session durations. In addition, it is suggested that the use of segment-basis parameters and an LSTM network is quite effective for reflecting the impacts of quality variations, stalling events, and memory-related effects. In addition, it is essential to consider temporal relations between impairment events in QoE models. However, there is still room for improvements of the LSTM model and the others as well, especially in the case of UHD TV.
For the SQI and KSQI models, their performances are acceptable, but not very high for most of the databases. In particular, the lowest performance in terms of PCC, SROCC, and RMSE is 0.66, 0.69, and 0.59 for the SQI model, and 0.70, 0.78, and 0.69 for the KSQI model. This can be because these models are built based on some assumptions that are not completely valid for diverse session durations and for various patterns of quality variations and stalling events in the databases. For example, it is assumed that the influence of each impairment event is independent and additive. This means that temporal relations between events are not taken into account. In both the models, the impact of each stalling event only depends on its duration and the previous segment quality. While the SQI model does not consider the impact of quality switches, the KSQI model assumes that the impact of each quality switch is dependent on its switching amplitude and the current segment quality.

4.5. Concluding Remarks

In the above, our evaluation is divided into different cases, where models are evaluated in terms of codecs, viewing devices, and session durations. Based on different characteristics of models, a service provider may select an appropriate model. For example, for e-learning, a QoE model that supports PC screens and long sessions should be used, whereas a model that is good for smartphone screens and short sessions can be used for mobile streaming of short-form videos.
Based on the above results and discussions, the following important remarks regarding the considered QoE models can be made.
  • In general, the performances of the models vary significantly across databases. Among them, the three models of LSTM, SQI, and KSQI are found to be the most stable ones.
  • Regarding encoding codecs, all the considered models result in better performance on H.264-encoded streaming sessions than HEVC-encoded ones. Surprisingly, even the models taking into account HEVC characteristics such as P.1203 and KSQI have the similar behavior.
  • With respect to viewing devices, the use of MOS and VMAF as segment quality metrics is quite effective to help the model perform more consistently. It is suggested that the LSTM, SQI, and KSQI models can be employed for QoE prediction with different viewing devices.
  • The models that are developed using short sessions such as the Rehman’s model may result in low and drastically variable performances for medium and long sessions.
  • The ability to effectively quantify the impacts of (1) quality variations and (2) stalling events significantly affects the performance of QoE models. Hence, these two factors should be equally considered in order to build an effective model. In addition, it is found that the impact of stalling events can be partially covered by the impact of quality variations as seen in the case of the Vriendt’s model. In addition, it is essential to consider temporal relations between impairment events in QoE models.
  • Only one single statistic such as the QP average is insufficient to fully represent quality variations in a streaming session. Combination of several statistics such as the average of segment quality values, the switch frequency, and especially the degrees of quality switches (i.e., switch amplitudes) is found to be indispensable to effectively quantify the impact of quality variations.
  • Similarly, the total stalling duration alone, which is employed in most models, is not able to characterize the factor of stalling. Other statistics such as the number of stalling events and the maximum stalling duration should be additionally considered.
  • Developing complex models (i.e., more inputs and complicated modeling approaches) does not always result in better performance as found in the case of Yin’s and ATLAS models.
  • Among the considered models, the LSTM model is the best one to predict the QoE of streaming sessions with different viewing devices and session durations. To evaluate the QoE of medium and long sessions (i.e., ≥1 min), the three models of P.1203, CQM, and biQPS are also comparable.
  • There is still room for improvements of the existing models, especially in the cases of various viewing devices (e.g., ultra high definition TV) and advanced video codecs (e.g., HEVC).

5. Conclusions

In this paper, we have investigated the performances of thirteen existing QoE models over twelve open databases for QoE prediction in HTTP Adaptive Streaming. Based on the results of the evaluations, various findings were provided with important insights into the behavior/performance of the considered QoE models. In particular, it was found that the LSTM model is most efficient, followed by the SQI and KSQI models. Interestingly, simple models such as Guo’s and Vriendt’s are also found to be stable and acceptable for most databases. For the three models of P.1203, CQM, and biQPS, they are quite effective for long sessions. It is expected that the findings presented in this paper are useful for researchers and service providers to assess the QoE of streaming services and evaluate delivery solutions in HAS. However, there are some open issues to be tackled in the future. First, the support for the popular HEVC coding format should be very much improved. Second, investigations with more databases of various viewing devices and session durations will be conducted to better understand and enhance the existing models. The impact of quality scores (e.g., different MOS scales) on database developments and QoE model performances should also be studied in more detail. In addition, emerging content types such as 360-degree videos and volumetric videos will be a new and hot direction to be considered.

Author Contributions

Conceptualization, D.N., N.P.N., T.C.T.; methodology, D.N., N.P.N., T.C.T.; software, D.N.; validation, D.N., T.C.T.; formal analysis, D.N., T.C.T.; investigation, D.N., N.P.N., T.C.T.; resources, D.N., T.C.T.; data curation, D.N., N.P.N., T.C.T.; writing—original draft preparation, D.N., N.P.N., T.C.T.; writing—review and editing, D.N., N.P.N., T.C.T.; visualization, D.N., N.P.N., T.C.T.; supervision, T.C.T.; project administration, T.C.T.; funding acquisition, T.C.T. All authors have read and agreed to the published version of the manuscript.

Funding

This research was supported by JSPS KAKENHI Grant No. 22K12299 and the competitive fund of the University of Aizu.

Data Availability Statement

Not applicable.

Acknowledgments

The authors thank Huyen Tran for her kind helps in this study.

Conflicts of Interest

The authors declare no conflict of interest.

References

  1. Conviva. Conviva State of Streaming. 2019. Available online: https://www.conviva.com/state-of-streaming/ (accessed on 15 January 2020).
  2. Sandvine. The Global Internet Phenomena Report. 2022. Available online: https://www.sandvine.com/phenomena (accessed on 12 April 2022).
  3. Seufert, M.; Egger, S.; Slanina, M.; Zinner, T.; Hoßfeld, T.; Tran-Gia, P. A survey on quality of experience of HTTP adaptive streaming. IEEE Commun. Surv. Tutor. 2015, 17, 469–492. [Google Scholar] [CrossRef]
  4. Hoßfeld, T.; Egger, S.; Schatz, R.; Fiedler, M.; Masuch, K.; Lorentzen, C. Initial delay vs. interruptions: Between the devil and the deep blue sea. In Proceedings of the 4th International Workshop on Quality of Multimedia Experience, Melbourne, VIC, Australia, 5–7 July 2012; pp. 1–6. [Google Scholar]
  5. Tavakoli, S.; Egger, S.; Seufert, M.; Schatz, R.; Brunnström, K.; García, N. Perceptual quality of HTTP adaptive streaming strategies: Cross-experimental analysis of multi-laboratory and crowdsourced subjective studies. IEEE J. Sel. Areas Commun. 2016, 34, 2141–2153. [Google Scholar] [CrossRef] [Green Version]
  6. Rehman, A.; Wang, Z. Perceptual experience of time-varying video quality. In Proceedings of the 5th International Workshop on Quality of Multimedia Experience (QoMEX), Klagenfurt am Wörthersee, Austria, 3–5 July 2013; pp. 218–223. [Google Scholar]
  7. Guo, Z.; Wang, Y.; Zhu, X. Assessing the visual effect of non-periodic temporal variation of quantization stepsize in compressed video. In Proceedings of the IEEE International Conference on Image Processing (ICIP), Quebec City, QC, Canada, 27–30 September 2015; pp. 3121–3125. [Google Scholar]
  8. Liu, Y.; Dey, S.; Ulupinar, F.; Luby, M.; Mao, Y. Deriving and validating user experience model for DASH video streaming. IEEE Trans. Broadcast. 2015, 61, 651–665. [Google Scholar] [CrossRef]
  9. Singh, K.D.; Hadjadj-Aoul, Y.; Rubino, G. Quality of experience estimation for adaptive HTTP/TCP video streaming using H. 264/AVC. In Proceedings of the IEEE Consumer Communications and Networking Conference (CCNC), Las Vegas, NV, USA, 14–17 January 2012; pp. 127–131. [Google Scholar]
  10. Tran, H.T.T.; Nguyen, D.V.; Ngoc, N.P.; Thang, T.C. Overall Quality Prediction for HTTP Adaptive Streaming using LSTM Network. IEEE Trans. Circuits Syst. Video Technol. 2021, 31, 3212–3226. [Google Scholar] [CrossRef]
  11. Vriendt, J.D.; Vleeschauwer, D.D.; Robinson, D. Model for estimating QoE of video delivered using HTTP adaptive streaming. In Proceedings of the IFIP/IEEE International Symposium on Integrated Network Management (IM 2013), Ghent, Belgium, 27–31 May 2013; pp. 1288–1293. [Google Scholar]
  12. Yin, X.; Jindal, A.; Sekar, V.; Sinopoli, B. A control-theoretic approach for dynamic adaptive video streaming over HTTP. Acm Sigcomm Comput. Commun. Rev. 2015, 45, 325–338. [Google Scholar] [CrossRef]
  13. Recommendation ITU-T P.1203.3; Parametric bitstream-based quality assessment of progressive download and adaptive audiovisual streaming services over reliable transport-Quality integration module. International Telecommunication Union: Geneva, Switzerland, 2017.
  14. Wiegand, T.; Sullivan, G.J.; Bjontegaard, G.; Luthra, A. Overview of the H. 264/AVC video coding standard. IEEE Trans. Circuits Syst. Video Technol. 2003, 13, 560–576. [Google Scholar] [CrossRef] [Green Version]
  15. Sullivan, G.J.; Ohm, J.R.; Han, W.J.; Wiegand, T. Overview of the high efficiency video coding (HEVC) standard. IEEE Trans. Circuits Syst. Video Technol. 2012, 22, 1649–1668. [Google Scholar] [CrossRef]
  16. Duanmu, Z.; Zeng, K.; Ma, K.; Rehman, A.; Wang, Z. A Quality-of-Experience Index for Streaming Video. IEEE J. Sel. Top. Signal Process. 2017, 11, 154–166. [Google Scholar] [CrossRef]
  17. Duanmu, Z.; Ma, K.; Wang, Z. Quality-of-Experience for Adaptive Streaming Videos: An Expectation Confirmation Theory Motivated Approach. IEEE Trans. Image Process. 2018, 27, 6135–6146. [Google Scholar] [CrossRef] [PubMed]
  18. Duanmu, Z.; Rehman, A.; Wang, Z. A Quality-of-Experience Database for Adaptive Video Streaming. IEEE Trans. Broadcast. 2018, 64, 474–487. [Google Scholar] [CrossRef]
  19. Duanmu, Z.; Liu, W.; Li, Z.; Chen, D.; Wang, Z.; Wang, Y.; Gao, W. Assessing the Quality-of-Experience of Adaptive Bitrate Video Streaming. arXiv 2020, arXiv:2008.08804. [Google Scholar]
  20. Bampis, C.G.; Li, Z.; Katsavounidis, I.; Huang, T.; Ekanadham, C.; Bovik, A.C. Towards Perceptually Optimized End-to-end Adaptive Video Streaming. arXiv 2018, arXiv:1808.03898. [Google Scholar]
  21. Robitza, W.; Göring, S.; Raake, A.; Lindegren, D.; Heikkilä, G.; Gustafsson, J.; List, P.; Feiten, B.; Wüstenhagen, U.; Garcia, M.N.; et al. HTTP Adaptive Streaming QoE Estimation with ITU-T Rec. P.1203—Open Databases and Software. In Proceedings of the 9th ACM Multimedia Systems Conference, Amsterdam, The Netherlands, 12–15 June 2018; pp. 466–471. [Google Scholar] [CrossRef]
  22. Tran, H.T.T.; Nguyen, D.V.; Nguyen, D.D.; Ngoc, N.P.; Thang, T.C. Cumulative Quality Modeling for HTTP Adaptive Streaming. In ACM Transactions on Multimedia Computing Communications and Applications; ACM: New York City, NY, USA, 2020; Volume 17, pp. 1–24. [Google Scholar]
  23. Le Callet, P.; Möller, S.; Perkis, A. (Eds.) Qualinet White Paper on Definitions of Quality of Experience; Version 1.2; Technical Report: Lausanne, Switzerland, 2013. [Google Scholar]
  24. Ghadiyaram, D.; Pan, J.; Bovik, A.C. A Subjective and Objective Study of Stalling Events in Mobile Streaming Videos. IEEE Trans. Circuits Syst. Video Technol. 2019, 29, 183–197. [Google Scholar] [CrossRef]
  25. Kougioumtzidis, G.; Poulkov, V.; Zaharis, Z.D.; Lazaridis, P.I. A Survey on Multimedia Services QoE Assessment and Machine Learning-Based Prediction. IEEE Access 2022, 10, 19507–19538. [Google Scholar] [CrossRef]
  26. Bampis, C.G.; Bovik, A.C. Feature-based prediction of streaming video QoE: Distortions, stalling and memory. Signal Process. Image Commun. 2018, 68, 218–228. [Google Scholar] [CrossRef]
  27. Tran, H.T.T.; Nguyen, D.V.; Thang, T.C. Open Software for Bitstream-based Quality Prediction in Adaptive Video Streaming. In Proceedings of the ACM Multimedia Systems Conference (MMSys’20), Istanbul, Turkey, 8–11 June 2020; pp. 225–230. [Google Scholar]
  28. Duanmu, Z.; Liu, W.; Chen, D.; Li, Z.; Wang, Z.; Wang, Y.; Gao, W. A Knowledge-Driven Quality-of-Experience Model for Adaptive Streaming Videos. arXiv 2019, arXiv:1911.07944. [Google Scholar]
  29. Recommendation ITU-T P.1203.1; Parametric Bitstream-Based Quality Assessment of Progressive Dowload and Adaptive Audiovisual Streaming Services over Reliable Transport-Video Quality Estimation Module. International Telecommunication Union: Geneva, Switzerland, 2017.
  30. Raake, A.; Garcia, M.N.; Robitza, W.; List, P.; Göring, S.; Feiten, B. A bitstream-based, scalable video-quality model for HTTP adaptive streaming: ITU-T P.1203.1. In Proceedings of the Ninth International Conference on Quality of Multimedia Experience (QoMEX), Erfurt, Germany, 31 May–2 June 2017; pp. 1–6. [Google Scholar]
  31. Tran, H.T.T.; Nguyen, D.V.; Nguyen, D.D.; Ngoc, N.P.; Thang, T.C. An LSTM-based Approach for Overall Quality. In Proceedings of the IEEE Conference on Computer Communications Conference (INFOCOM 2019), Paris, France, 29 April–2 May 2019; pp. 702–707. [Google Scholar]
  32. Bampis, C.G.; Li, Z.; Moorthy, A.K.; Katsavounidis, I.; Aaron, A.; Bovik, A.C. Study of Temporal Effects on Subjective Video Quality of Experience. IEEE Trans. Image Process. 2017, 26, 5217–5231. [Google Scholar] [CrossRef] [PubMed]
  33. Chen, C.; Choi, L.K.; De Veciana, G.; Caramanis, C.; Heath, R.W.; Bovik, A.C. Modeling the time-Varying subjective quality of HTTP video streams with rate adaptations. IEEE Trans. Image Process. 2014, 23, 2206–2221. [Google Scholar] [CrossRef] [PubMed] [Green Version]
  34. Duanmu, Z.; Ma, K.; Wang, Z. Quality-of-Experience of Adaptive Video Streaming: Exploring the Space of Adaptations. In Proceedings of the 25th ACM international conference on Multimedia, Mountain View, CA, USA, 23–27 October 2017; pp. 1752–1760. [Google Scholar]
  35. Recommendation ITU-T P.1203. ITU-T Rec. P.1203 Standalone Implementation. 2018. Available online: https://github.com/itu-p1203 (accessed on 1 July 2018).
  36. Tran, H.T.T.; Ngoc, N.P.; Pham, A.T.; Thang, T.C. A Multi-Factor QoE Model for Adaptive Streaming over Mobile Networks. In Proceedings of the IEEE Globecom Workshops (GC Wkshps), Washington, DC, USA, 4–8 December 2016; pp. 1–6. [Google Scholar]
  37. Rodríguez, D.Z.; Rosa, R.L.; Alfaia, E.C.; Abrahão, J.I.; Bressan, G. Video quality metric for streaming service using DASH standard. IEEE Trans. Broadcast. 2016, 62, 628–639. [Google Scholar] [CrossRef]
  38. Recommendation ITU-T P.1401; Methods, Metrics and Procedures for Statistical Evaluation, Qualification and Comparison of Objective Quality Prediction Models. International Telecommunication Union: Geneva, Switzerland, 2012.
  39. Recommendation ITU-T G.1071; Opinion Model for Network Planning of Video and Audio Streaming Applications. International Telecommunication Union: Geneva, Switzerland, 2015.
  40. Tran, H.T.T.; Ngoc, N.P.; Jung, Y.J.; Pham, A.T.; Thang, T.C. A Histogram-Based Quality Model for HTTP Adaptive Streaming. Ieice Trans. Fundam. Electron. Commun. Comput. Sci. 2017, 100, 555–564. [Google Scholar] [CrossRef]
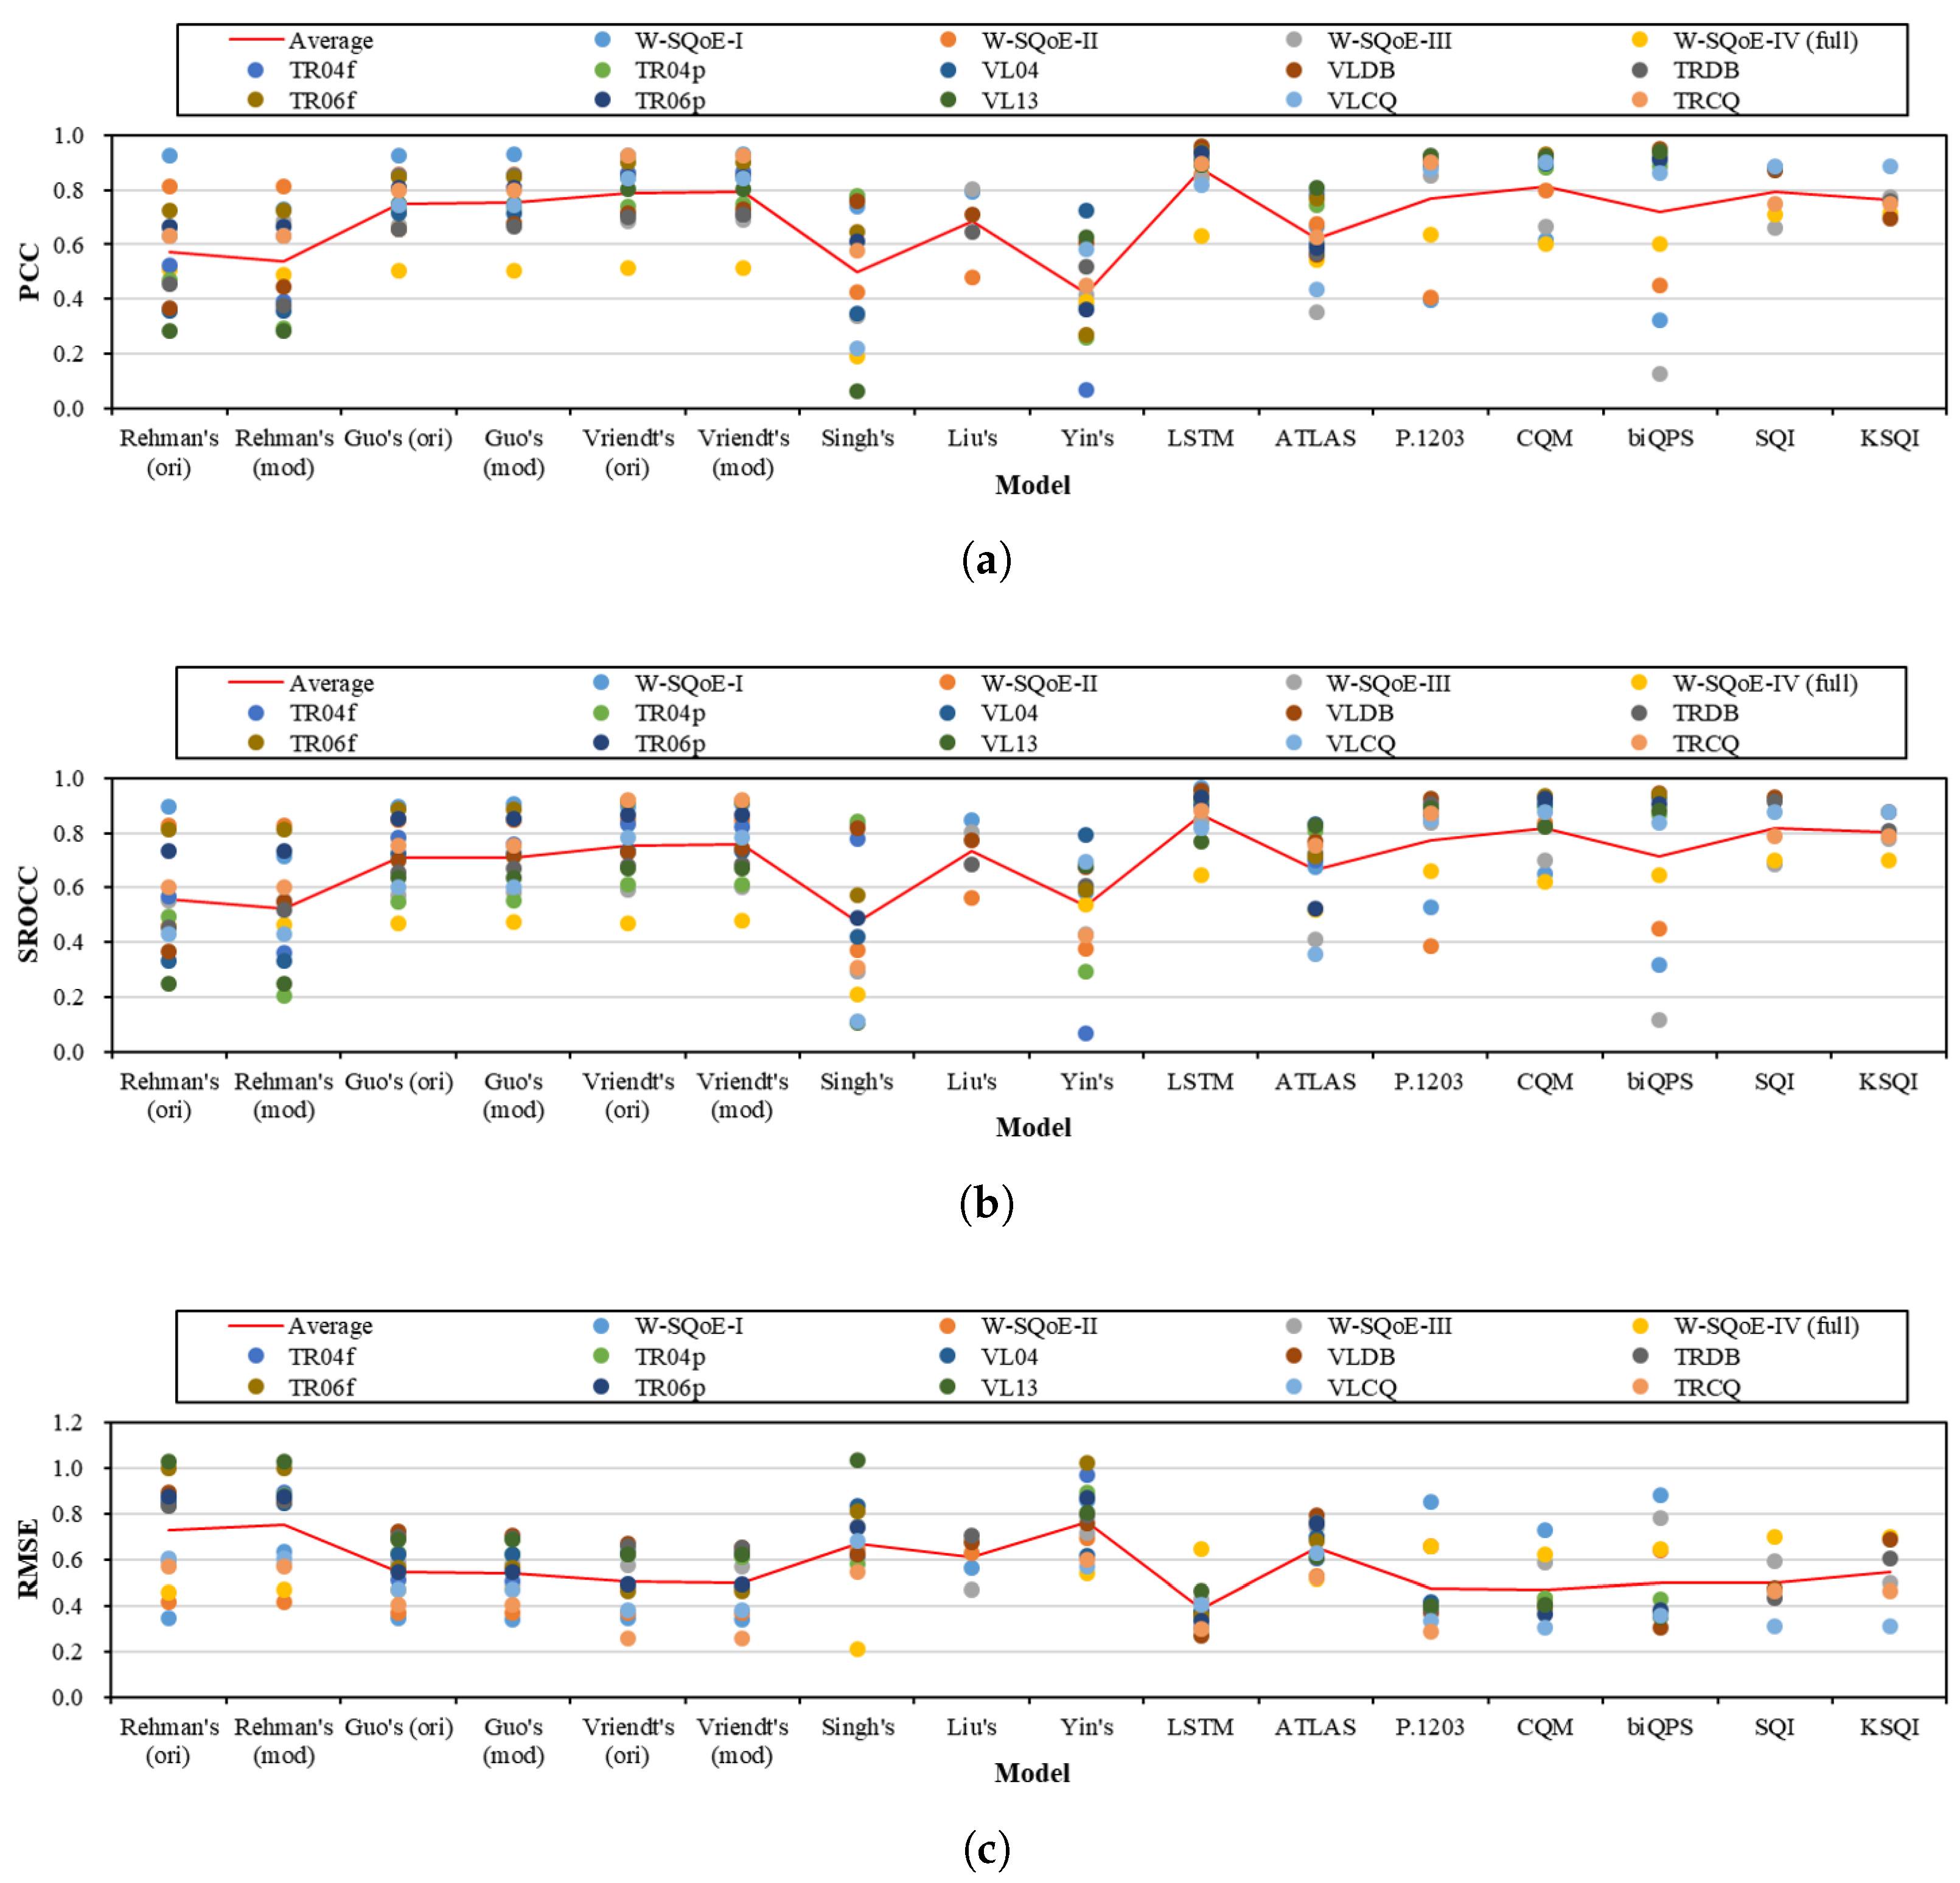
Figure 1. Performances of individual QoE models across different databases. (a) PCC; (b) SROCC; (c) RMSE.
Futureinternet 14 00151 g001
Figure 2. Average performances of individual QoE models over H.264-encoded set and HEVC-encoded set. (a) PCC; (b) SROCC; (c) RMSE.
Futureinternet 14 00151 g002
Figure 3. Average performance and mean difference of the models using the DBS1, DBS2, and DBS3 sets. (a) average performance; (b) mean difference.
Futureinternet 14 00151 g003
Figure 4. Performance of all the models with respect to different session durations. (a) PCC; (b) SROCC; (c) RMSE.
Futureinternet 14 00151 g004
Figure 5. Average and standard deviation performance of the models over all the databases. (a) average performance; (b) standard deviation performance.
Futureinternet 14 00151 g005
Figure 6. Performance of Rehman’s, Singh’s, and Yin’s models in the first group over the test databases. (a) PCC; (b) SROCC; (c) RMSE.
Futureinternet 14 00151 g006
Figure 7. Performance of Liu’s, ATLAS, P.1203, CQM, and biQPS models in the second group over the test databases. (a) PCC; (b) SROCC; (c) RMSE.
Futureinternet 14 00151 g007
Figure 8. Performance of Guo’s and Vriendt’s models in the third group over the test databases. (a) PCC; (b) SROCC; (c) RMSE.
Futureinternet 14 00151 g008
Figure 9. Performance of the LSTM, SQI, and KSQI models in the fourth group over the test databases. (a) PCC; (b) SROCC; (c) RMSE.
Futureinternet 14 00151 g009
Table 1. Summary of existing models.
ModelsModeling
Approaches
Segment Quality ParametersSession Duration
(Seconds)
Inputs Used to Represent the Impacts of Factors
Impact of
Initial Delay
Impact of Quality VariationsImpact of Stalling EventsMemory-Related Effects
Rehman’s [6]Analytical
functions
Subjective quality
metric (i.e., MOS)
5–15 First segment quality
Sum of the impacts of the previous
quality switches which is modeled by a
piece-wise linear function of the
switching amplitudes
Guo’s  [7]Analytical
functions
Subjective quality
metric (i.e., MOS)
10Median segment quality value
Minimum segment quality value
Vriendt’s  [11]Analytical
functions
Subjective quality
metric (i.e., MOS)
120Average and standard deviation of
segment quality values
Number of segment quality switches
Singh’s  [9]Random
neural
network
Bitstream-level
parameter (i.e., QP)
16Initial delay is
considered as a
stalling event
Average of QP values over all macro-
blocks in all frames of the whole
session
Total number of stalling events
Average of stalling durations
Maximum of stalling durations
Liu’s  [8]Analytical
functions
Objective quality
metric (i.e., VQM)
60Linear function
of initial delay
duration
Weighted sum of segment quality
values
Average of the square of switching
amplitudes
Total number of stalling events
Sum of stalling durations
Yin’s  [12]Analytical
functions
Bitstream-level
parameter
(i.e., bitrate)
N/ALinear function
of initial delay
duration
Average of segment quality values
Average of switching amplitudes
Sum of stalling durations
LSTM  [10]Long-Short
Term
Memory
(LSTM)
Subjective quality
metric (i.e., MOS)
60–76 Initial delay is
considered as a
stalling event
Segment-basis parametersLSTM network with stalling
durations
Segment-basis parameters
and stalling durations
ATLAS  [26]Support Vector
Regression
(SVR)
Objective quality
metric (e.g., STRRED
or VMAF)
10 and 72Initial delay is
considered as a
stalling event
Average of frame quality values
Time per video duration over which a
segment quality decrease took place
Total number of stalling events
Sum of stalling durations
Time since the last stalling
event or segment quality
decrease
P.1203  [13]Analytical
functions
and
Random
forest
Subjective quality
metric (i.e., MOS)
or Bitstream-level
parameters (i.e.,
frame types, sizes,
and QPs of frames,
bitrates, resolutions,
and frame-rates of
segments)
60–300 Initial delay is
considered as a
stalling event
Number of segment quality switches
Number of segment quality direction
changes
Longest quality switching duration
First and fifth percentile of segment
quality values
Difference between the maximum
and minimum segment quality
values
Average of segment quality values
in each interval)
Total number of stalling events

Average interval between events
Frequency of stalling events
Ratio of stalling duration
Weighted sum of segment
quality values
Weighted sum of stalling
durations
Time since the last stalling
event
CQM  [22]Analytical
functions
Subjective quality
metric (i.e., MOS)
60–360 Logarithm
function of
initial delay
duration
Histogram of segment quality values
Histogram of switching amplitudes
Average window quality value
Histogram of stalling durationsLast window quality value
Minimum window quality
value
Maximum window quality
value
biQPS  [27]Long-Short
Term Memory
(LSTM)
and Analytical
functions
Bitstream-level
parameters
(i.e., QPs, bitrates,
resolutions, frame-
rates of segments)
60–360 Initial delay is
considered as a
stalling event
LSTM network with segment-basis
parameters
Average window quality value
LSTM network with stalling
durations
LSTM network with
segment-basis parameters
and stalling durations
Last window quality value
Minimum window quality
value
Maximum window quality
value
SQI  [16]Analytical
functions
Objective quality
metric (i.e., VMAF)
10 Initial delay is
considered as a
stalling event
Sum of segment quality values per
session duration
A piece-wise function inputted
by stalling durations
Using the Hermann
Ebbinghaus forgetting
curve to estimate the
impact of each stalling
event
A moving average fashion
of the previous cumulative
quality and the instantaneous
quality
KSQI  [28]Operator
Splitting
Quadratic
Program
solver
Objective quality
metric (i.e., VMAF)
8, 10, 13,
and 28
Initial delay is
considered as a
stalling event
Impact of each quality switch depends
on the instantaneous segment quality
and the switching amplitude
Impact of each stalling event
depends on the previous segment
quality and the stalling duration
A moving average fashion
of the previous cumulative
quality and the
instantaneous quality
Table 2. Settings of sub-databases.
Original DatabaseSub-DatabaseViewing DeviceCodec
W-SQoE-IV (full)W-SQoE-IV_pH264SmartphoneH.264
W-SQoE-IV_pHEVCSmartphoneHEVC
W-SQoE-IV_fH264FHDH.264
W-SQoE-IV_fHEVCFHDHEVC
W-SQoE-IV_uH264UHDH.264
W-SQoE-IV_uHEVCUHDHEVC
TR04 (full)TR04pSmartphoneH.264
TR04fFHDH.264
TR06 (full)TR06pSmartphoneH.264
TR04fFHDH.264
Table 3. Evaluation setting of the databases corresponding to each model. NA: Not applicable.
ModelDatabase
W-SQoE-IW-SQoE-IIW-SQoE-IIIW-SQoE-IV (full)TRDBVLDBTR04fTR04pVL04TR06fTR06pVL13TRCQVLCQ
Rehman’s [6]TestTestTestTestTestTestTestTestTestTestTestTestTestTest
Guo’s [7]TestTestTestTestTestTestTestTestTestTestTestTestTestTest
Vriendt’s [11]TestTestTestTestTestTestTestTestTestTestTestTestTestTest
Singh’s [9]TestTestTestTestTrainTestTestTestTestTestTestTestTestTest
Liu’s [8]TestTestTestTestTestTestNANANANANANANANA
Yin’s [12]TestTestTestTestTestTestTestTestTestTestTestTestTestTest
LSTM [10]TestTestTestTestTrainTestTrainTestTestTestTestTestTestTest
ATLAS [26]TestTestTestTestTestTestNANANANANANATestTest
P.1203 [13]TestTestTestTestTestTestTrainTrainTestTrainTrainTestTestTest
CQM [22]TestTestTestTestTrainTrainTestTestTestTestTestTestTrainTest
biQPS [27]TestTestTestTestTrainTestTrainTestTestTestTestTestTrainTest
SQI [16]TrainTrainTestTestTestTestNANANANANANATestTest
KSQI [28]TrainTrainTestTestTestTestNANANANANANATestTest
Table 4. Performance in terms of PCC of all models per database. The bold-underlined numbers show the model having the highest performance.
DatabaseRehman’s
(ori)
Rehman’s
(mod)
Guo’s
(ori)
Guo’s
(mod)
Vriendt’s
(ori)
Vriendt’s
(mod)
Singh’sLiu’sYin’sLSTMATLASP.1203CQMbiQPSSQIKSQI
W-SQoE-I0.930.730.930.930.930.930.740.790.380.950.670.390.620.32N/AN/A
W-SQoE-II0.810.810.860.860.860.860.430.480.270.860.680.400.800.45N/AN/A
W-SQoE-III0.660.690.670.680.680.690.340.800.420.840.350.850.670.130.660.77
W-SQoE-IV (full)0.510.490.500.510.510.520.19N/A0.390.630.540.640.600.600.710.71
TR04f0.520.390.850.850.860.870.77N/A0.07N/A0.79N/AN/AN/AN/AN/A
TR04p0.470.290.730.740.740.750.78N/A0.260.920.74N/A0.880.88N/AN/A
VL040.360.360.720.720.710.710.35N/A0.720.910.600.880.900.91N/AN/A
VLDB0.370.440.650.680.710.730.760.710.610.960.560.92N/A0.950.870.70
TRDB0.460.380.660.670.700.71N/A0.650.52N/A0.570.91N/AN/A0.880.76
TR06f0.730.730.850.850.900.900.65N/A0.270.940.77N/A0.930.94N/AN/A
TR06p0.660.660.810.810.850.850.61N/A0.360.930.59N/A0.920.91N/AN/A
VL130.290.290.750.750.800.800.06N/A0.630.890.810.920.920.94N/AN/A
VLCQ0.630.630.740.740.840.840.22N/A0.580.820.440.880.900.860.890.89
TRCQ0.630.630.800.800.920.920.58N/A0.450.890.630.90N/AN/A0.750.75
Publisher’s Note: MDPI stays neutral with regard to jurisdictional claims in published maps and institutional affiliations.