
Modeling User Acceptance of In-Vehicle Applications for Safer Road Environment


 ,
,
Abstract
:1. Introduction
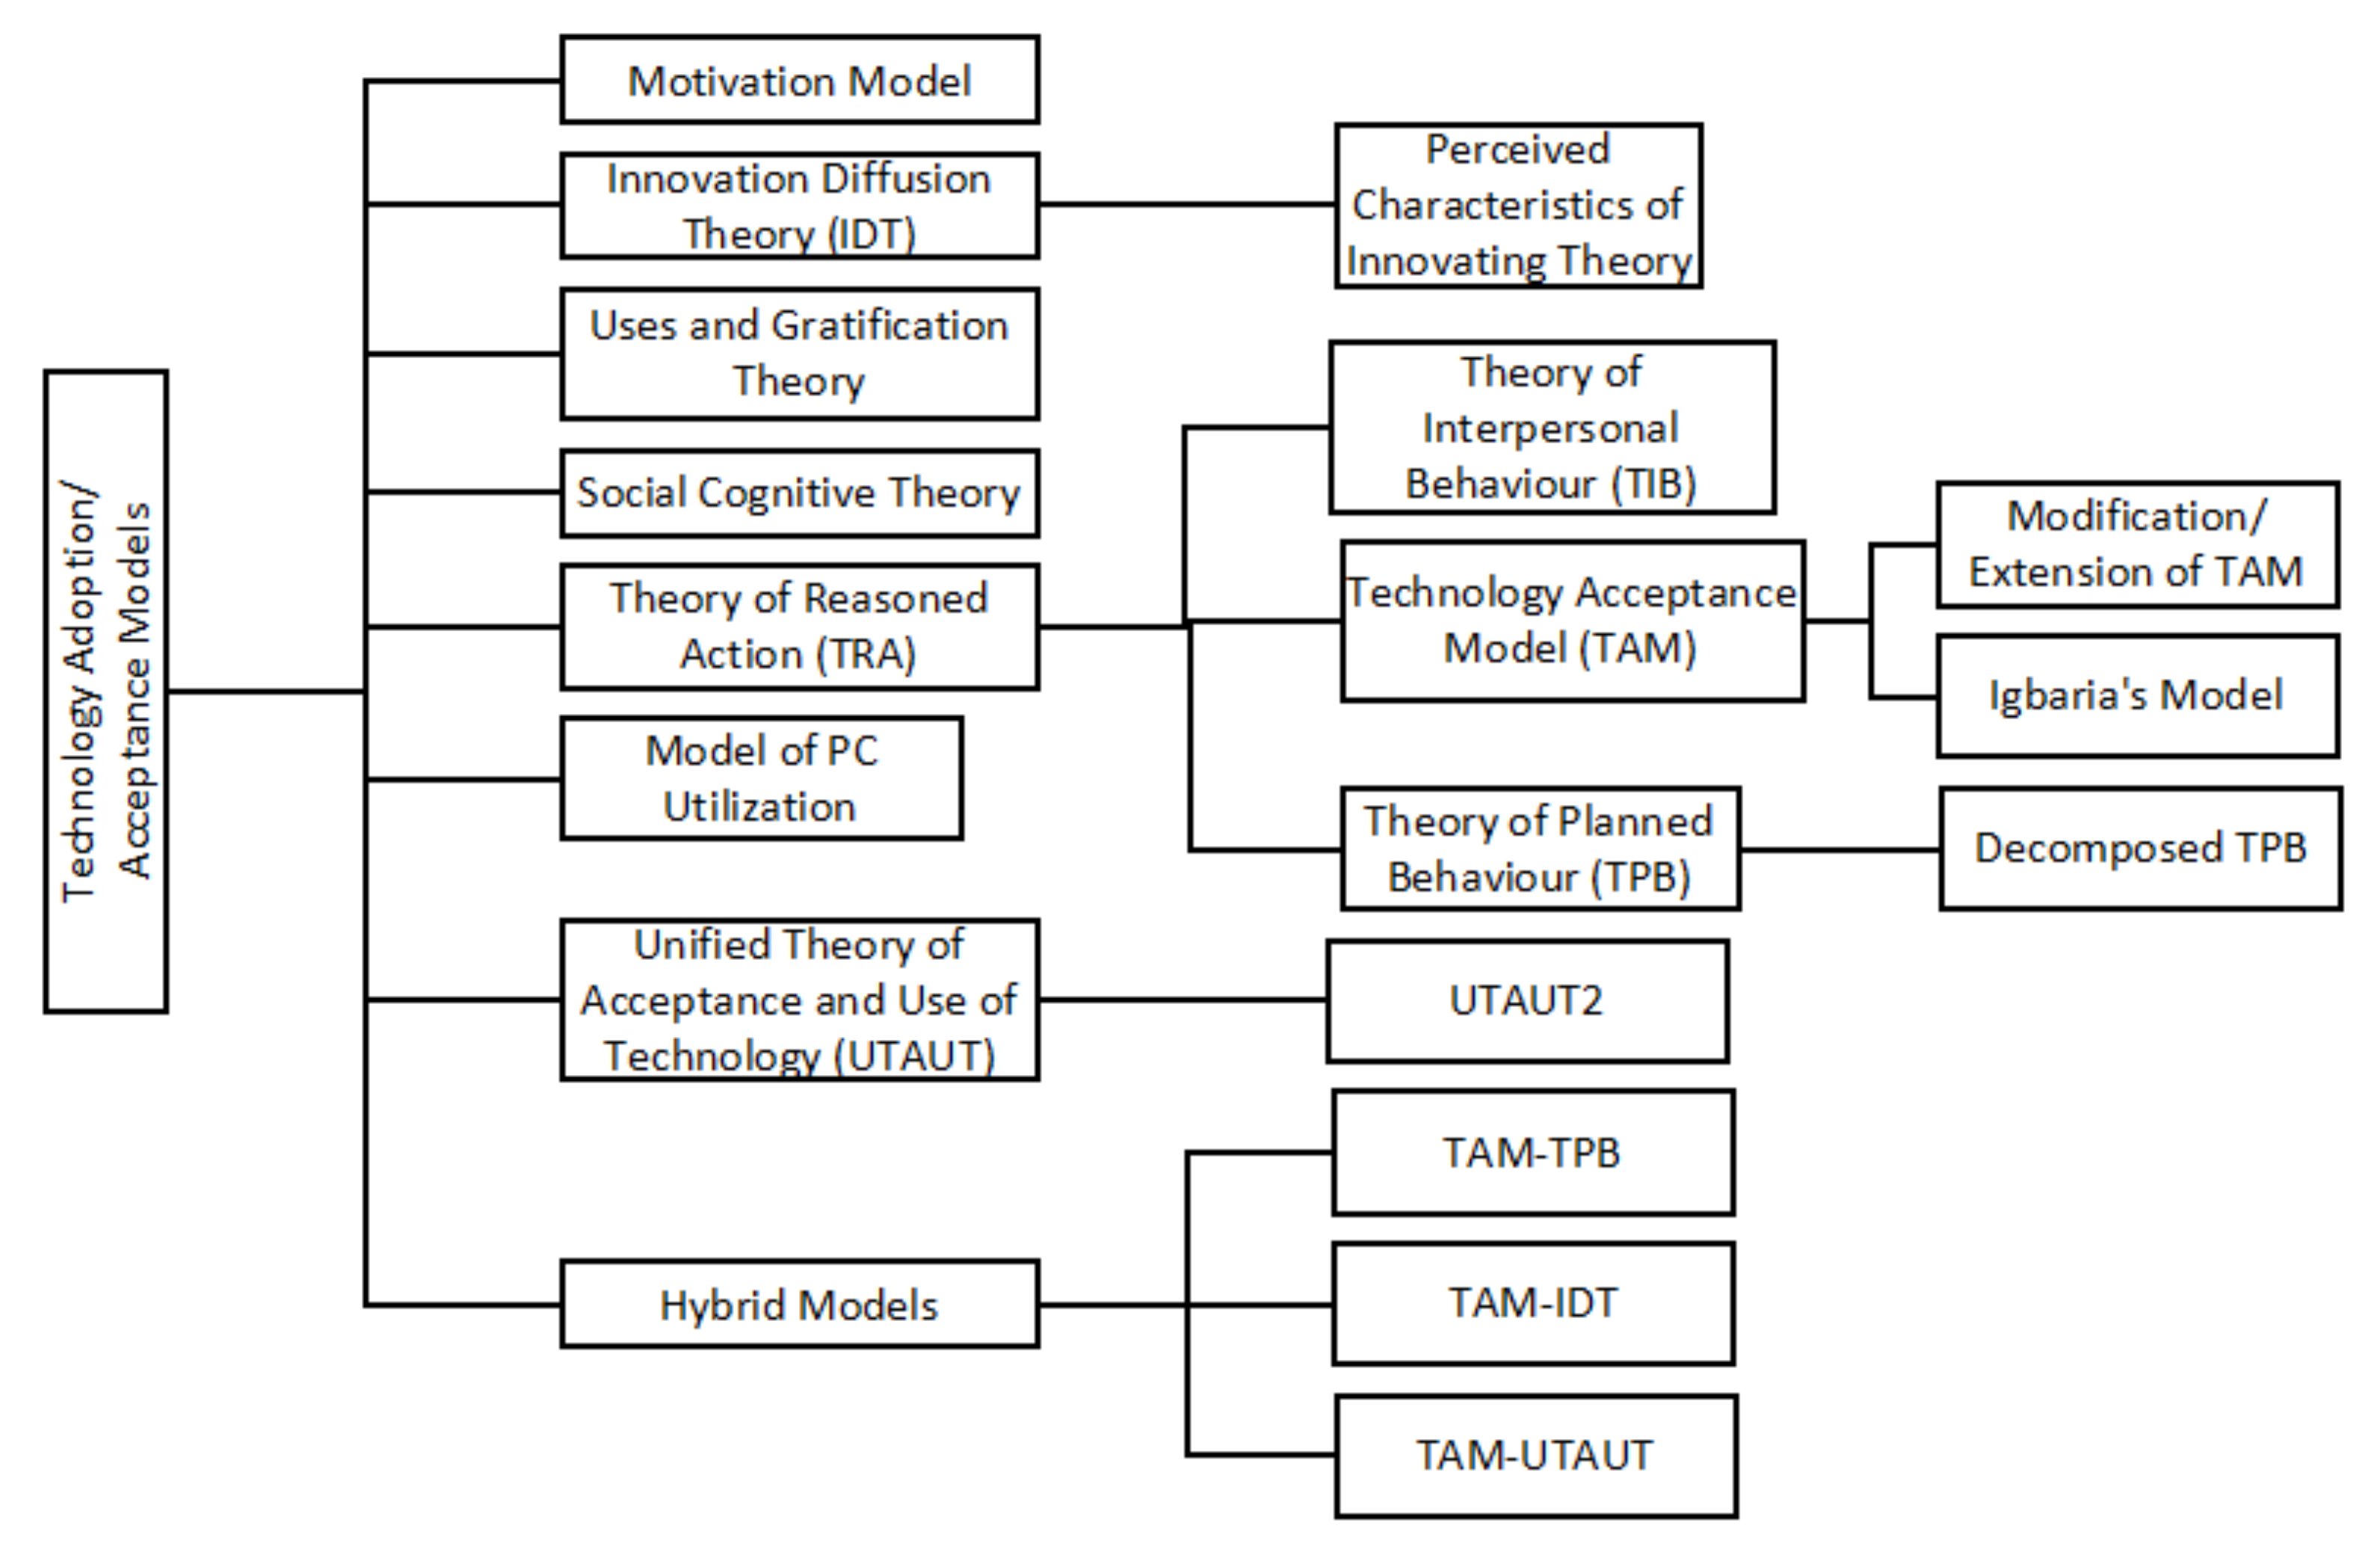
2. Related Works
2.1. Motivational Models
2.2. Innovation Diffusion Theory (IDT)
2.3. Uses and Gratification Theory (U&G)
2.4. Social Cognitive Theory (SCT)
2.5. Theory of Reasoned Action (TRA)
2.6. Model of PC Utilization (MPCU)
2.7. Unified Theory of Acceptance and Use of Technology (UTAUT)
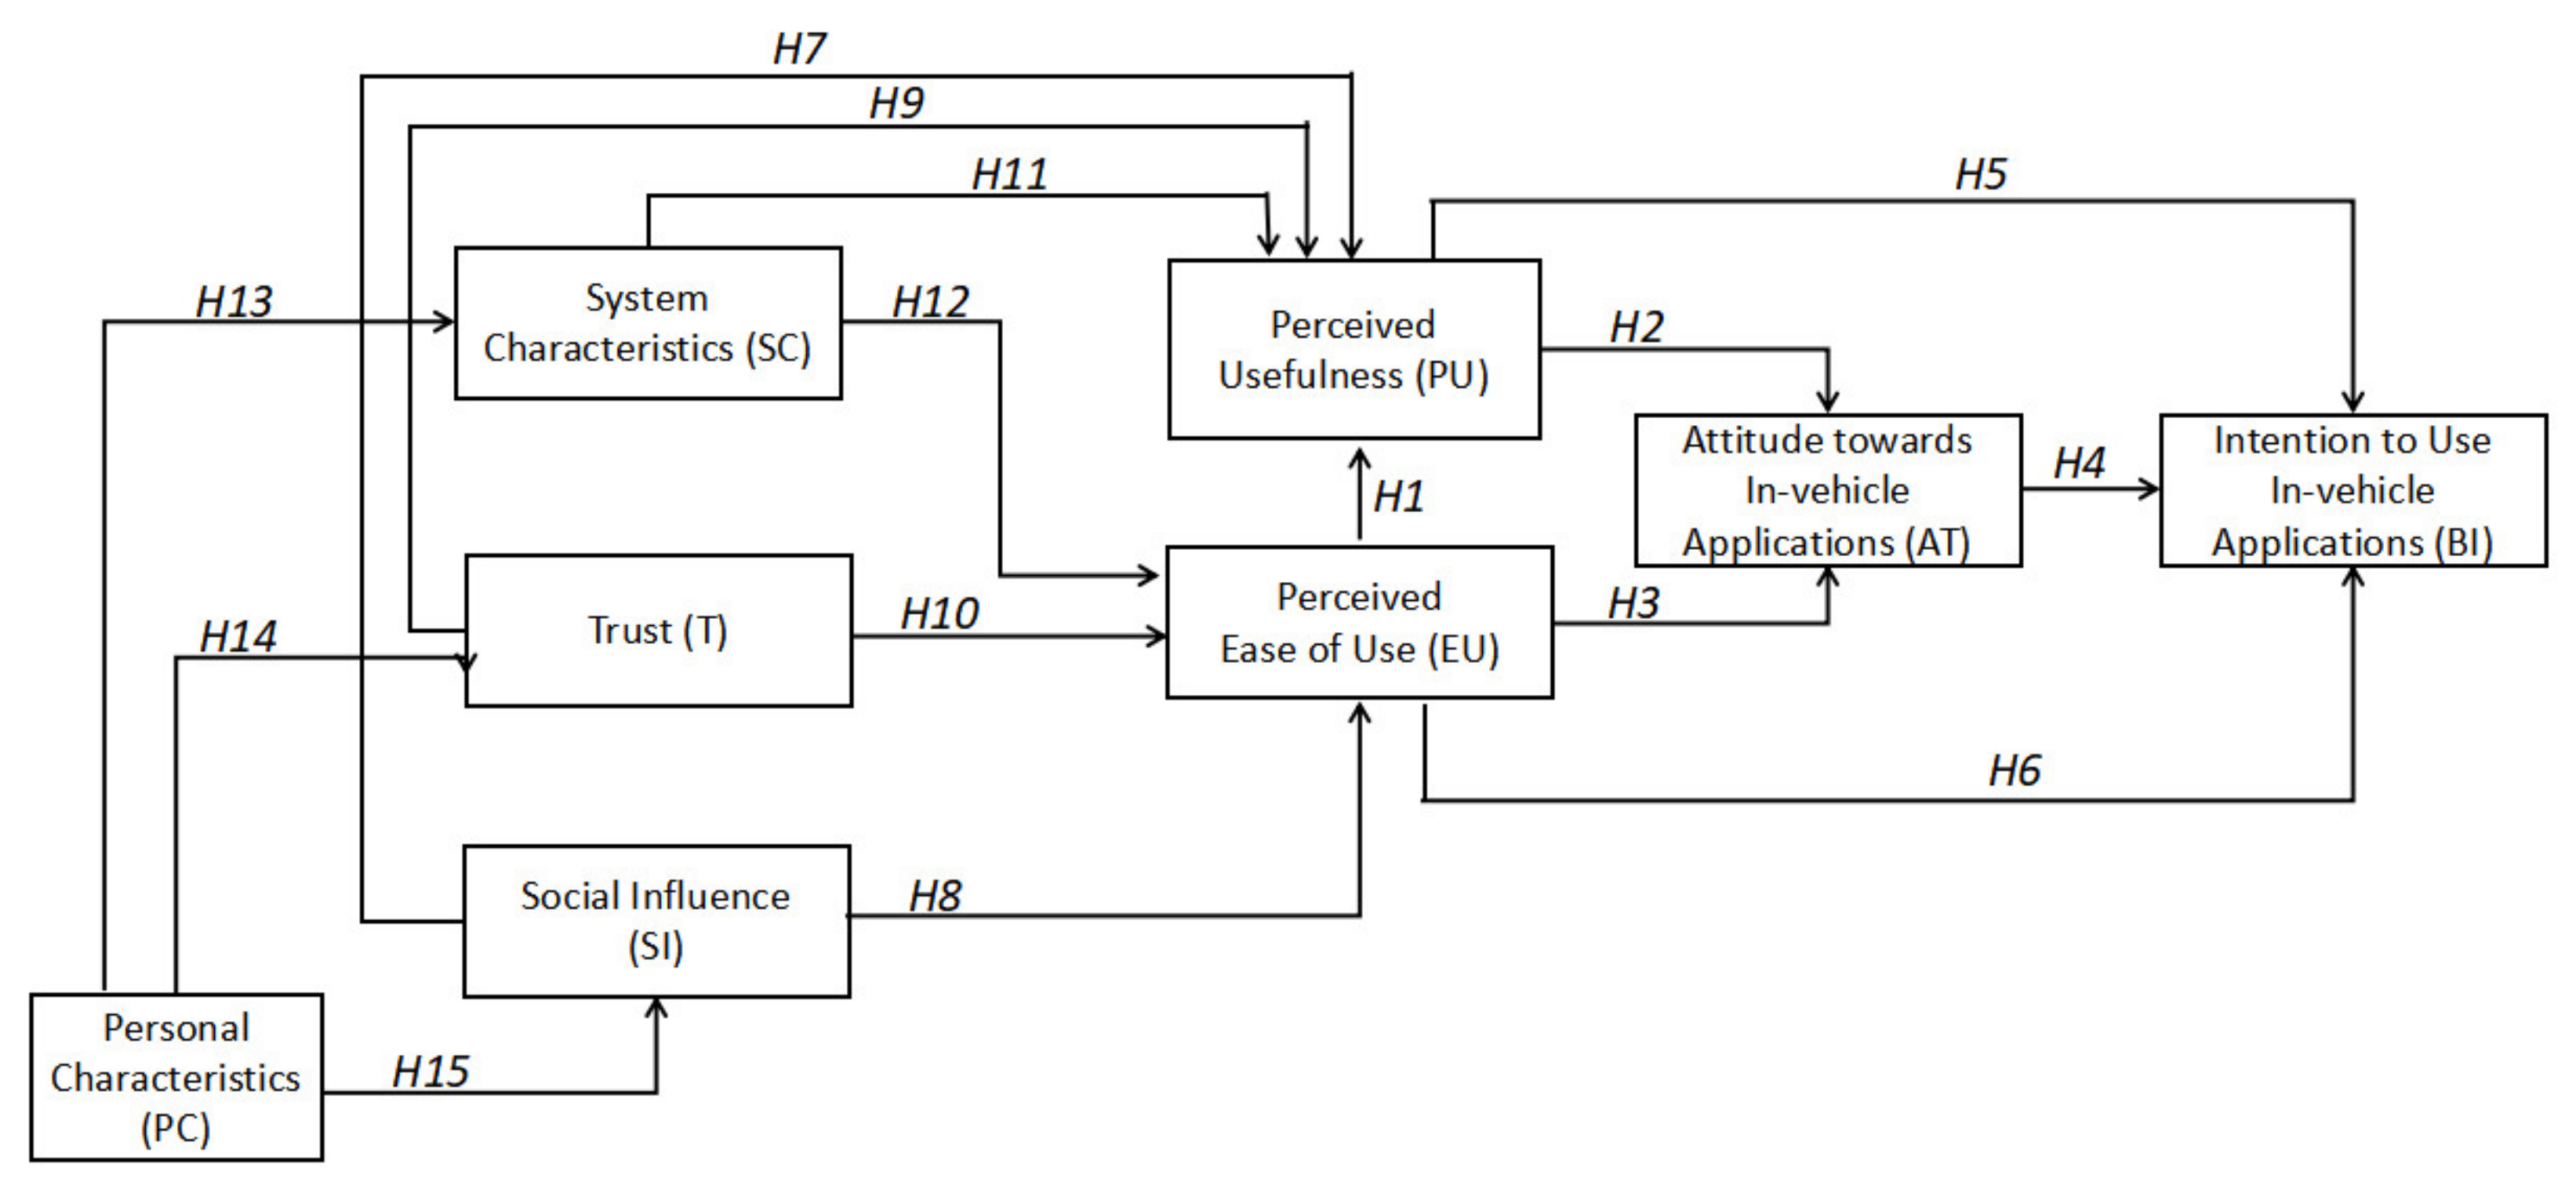
3. Research Model and Hypotheses Development
4. Questionnaire Design and Data Collection
5. Data Analysis and Results
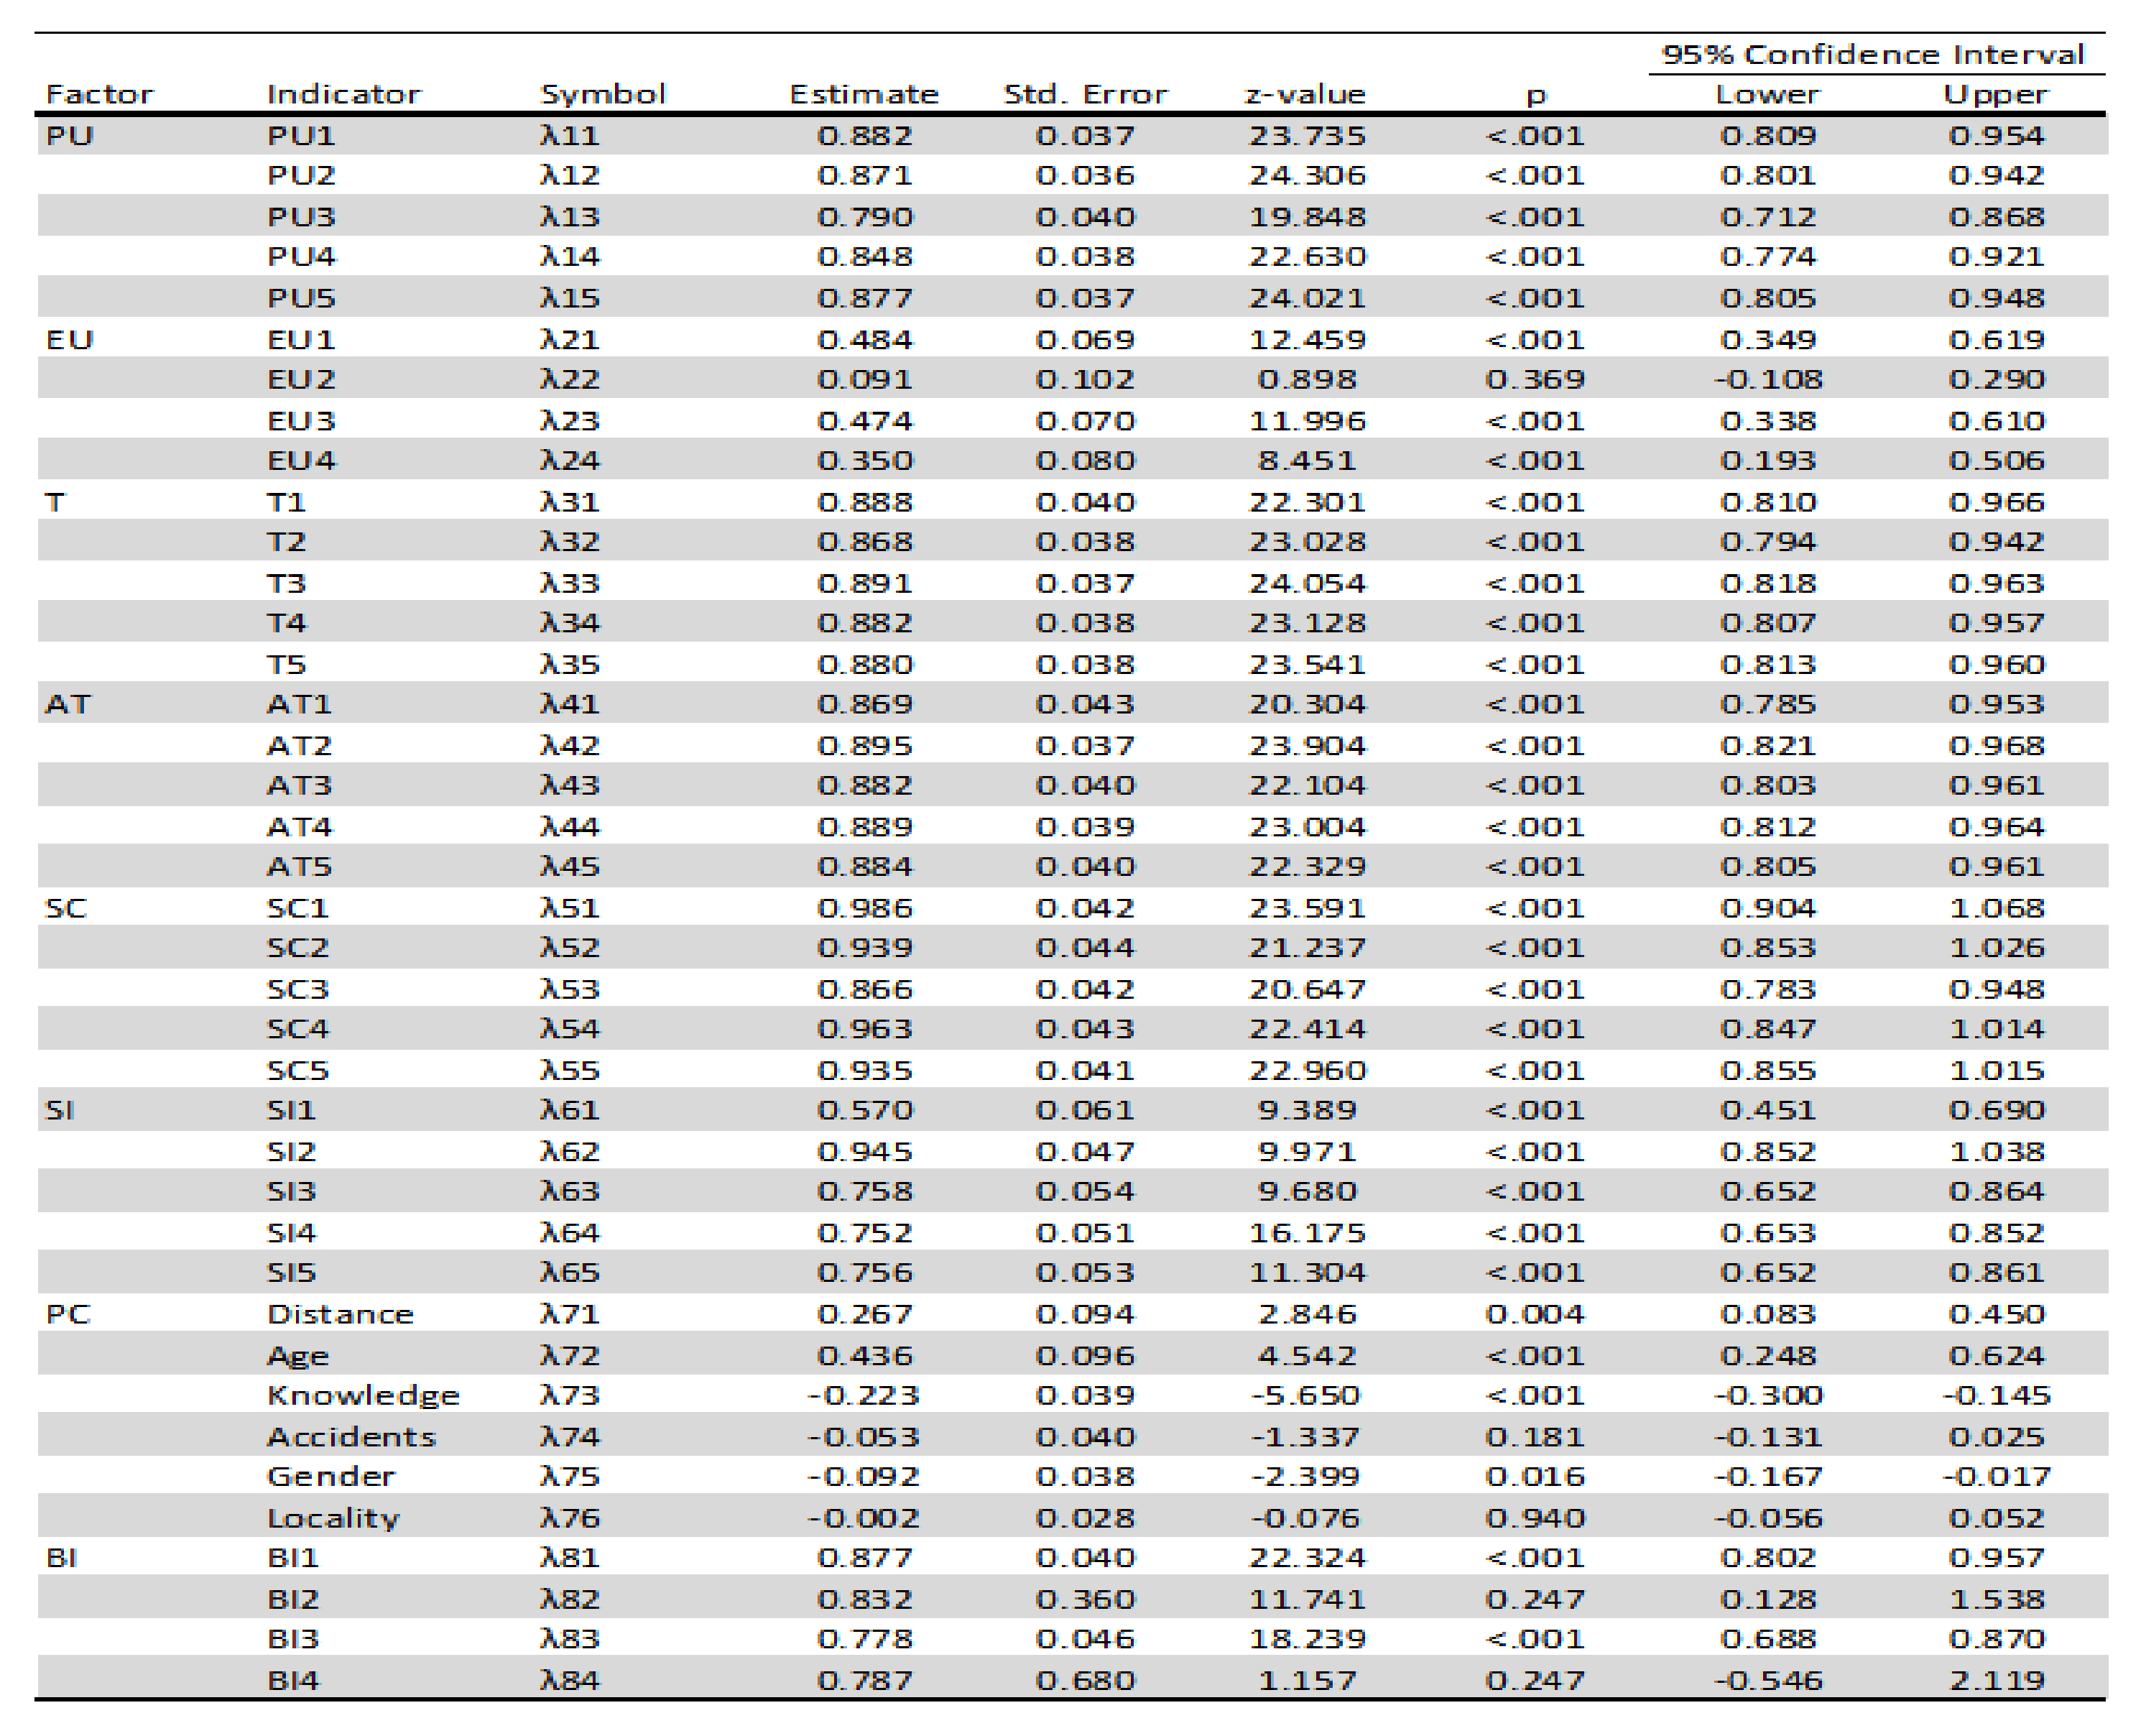
5.1. Construct Items
5.2. Correlation Analysis
5.3. Multicollinearity
5.4. Causal Relationship
5.5. Mediating Effect Analysis
5.6. Linear and Non-Linear Relationship
6. Discussions
7. Conclusions
Author Contributions
Funding
Institutional Review Board Statement
Informed Consent Statement
Data Availability Statement
Acknowledgments
Conflicts of Interest
Abbreviations
| 360 cam | 360-Degree-Parking Assist |
| ACC | Adaptive Cruise Controls |
| AEB | Autonomous Emergency Braking |
| A-Hold | Auto Hold/Brake Hold |
| A-Park | Auto Parking |
| AT | Attitude |
| BI | Intention to use the technology |
| BSM | Blind-spot monitor |
| C-TAM-TPB | Combination form of TAM and TPB |
| EU | Perceived Ease of Use |
| FCW | Forward Collision Warning |
| HDC | Hill Descent Control |
| HAS | Hill-Start Assist |
| HUD | Head-up Display |
| IDT | Innovation Diffusion Theory |
| LDW | Lane Departure Alert/Warning |
| LKAS | Lane-Keep Assist |
| MM | Motivational Model |
| MPCU | Model of PC Utilization |
| PED | Pedal Misapplication Control |
| PU | Perceived Usefulness |
| RCTA | Rear Cross Traffic Alert |
| SC | System Characteristics |
| SCT | Social Cognitive Theory |
| SI | Social Influence |
| T | Trust |
| TAM | Technology Acceptance Model |
| TIB | Theory of Interpersonal Behavior |
| TJA | Low-Speed Follow/Traffic Jam Assist |
| TPB | Theory of Planned Behavior |
| TRA | Theory of Reasoned Action |
| U&G | User and Gratification Theory |
| UTAUT | Unified Theory of Acceptance and Use of Technology |
| VIF | Variance Inflating Factor |
References
- Haboucha, C.J.; Ishaq, R.; Shiftan, Y. User Preferences Regarding Autonomous Vehicles. Transp. Res. Part C Emerg. Technol. 2017, 78, 37–49. [Google Scholar] [CrossRef]
- Large, D.R.; Burnett, G.; Mohd-Hasni, Y. Capturing Cultural Differences between Uk and Malaysian Drivers to Inform the Design of In-Vehicle Navigation Systems. Int. J. Automot. Eng. 2017, 8, 112–119. [Google Scholar] [CrossRef] [Green Version]
- Adnan, N.; Md Nordin, S.; bin Bahruddin, M.A.; Ali, M. How Trust Can Drive Forward the User Acceptance to the Technology? In-Vehicle Technology for Autonomous Vehicle. Transp. Res. Part A Policy Pract. 2018, 118, 819–836. [Google Scholar] [CrossRef]
- Jun, J.; Park, H.; Cho, I. Study on Initial Adoption of Advanced Driver Assistance System: Integrated Model of PMT and UTAUT 2. Total Qual. Manag. Bus. Excell. 2019, 30, S83–S97. [Google Scholar] [CrossRef]
- Md Isa, M.H.; Deros, B.M.; Kassim, K.A.A. A Review of Empirical Studies on User Acceptance of Driver Assistance Systems. GATR Glob. J. Bus. Soc. Sci. Rev. 2015, 3, 39–46. [Google Scholar] [CrossRef]
- Moody, J.; Bailey, N.; Zhao, J. Public Perceptions of Autonomous Vehicle Safety: An International Comparison. Saf. Sci. 2020, 121, 634–650. [Google Scholar] [CrossRef]
- Kassim, K.A.A.; Nasruddin, M.A.; Mohd Jawi, Z. Assessing the Public Opinion on Autonomous Vehicles in Malaysia. Journal of the Society of Automotive Engineers Malaysia; 2019; Volume 3. Available online: http://jsaem.saemalaysia.org.my/index.php/jsaem/article/view/81 (accessed on 29 March 2022).
- Abu Kassim, K.A.; Mohd Jawi, Z.; Nasruddin, M.A. Is Malaysia Ready to Adopt Autonomous Vehicles? J. Soc. Automot. Eng. Malays. 2019, 3, 84–88. [Google Scholar]
- Sahari, M. Malaysia’s Perspective on Automated, Autonomous and Connected Vehicles. Asia-Pacific Economic Cooperation 30th Automotive Dialogue. 2019. Available online: https://mddb.apec.org/Documents/2019/AD/AD1/19_ad1_020.pdf (accessed on 29 March 2022).
- Hung, N.J.; Yazdanifard, R. The Study of Vehicle Safety Aspects Influencing Malaysian Urban Consumer Car Purchasing Behaviour. Int. J. Manag. Account. Econ. 2015, 2, 913–924. [Google Scholar]
- Ministry of Works Malaysia. Malaysian ITS Blueprint 2019–2023; Ministry of Works Malaysia: Kuala Lumpur, Malaysia, 2013; Volume 53.
- Rahimi, B.; Nadri, H.; Afshar, H.L.; Timpka, T. A Systematic Review of the Technology Acceptance Model in Health Informatics. Appl. Clin. Inform. 2018, 9, 604–634. [Google Scholar] [CrossRef] [Green Version]
- Taherdoost, H. A Review of Technology Acceptance and Adoption Models and Theories. In Proceedings of the Procedia Manufacturing; Elsevier B.V.: Amsterdam, The Netherlands, 2018; Volume 22, pp. 960–967. [Google Scholar]
- Momani, A.M. The Unified Theory of Acceptance and Use of Technology: A New Approach in Technology Acceptance. Int. J. Sociotechnol. Knowl. Dev. 2020, 12, 79–98. [Google Scholar] [CrossRef]
- Seter, H.; Hansen, L.; Arnesen, P. Comparing User Acceptance of Integrated and Retrofit Driver Assistance Systems—A Real-Traffic Study. Transp. Res. Part F Traffic Psychol. Behav. 2021, 79, 139–156. [Google Scholar] [CrossRef]
- Yuen, K.F.; Cai, L.; Qi, G.; Wang, X. Factors Influencing Autonomous Vehicle Adoption: An Application of the Technology Acceptance Model and Innovation Diffusion Theory. Technol. Anal. Strateg. Manag. 2021, 33, 505–519. [Google Scholar] [CrossRef]
- Venkatesh, V.; Smith, R.H.; Morris, M.G.; Davis, G.B.; Davis, F.D.; Walton, S.M. User Acceptance of Information Technology: Toward a Unified View. User Accept. IT MIS Q. 2003, 27, 425–478. [Google Scholar] [CrossRef] [Green Version]
- Lele, S.; Maheshkar, S. A Review of Technology Adoption Models and Research Synthesis of Pre and Post Adoption Behavior in Online Shopping. IOSR J. Bus. Manag. (IOSR-JBM) 2017, 19, 37–48. [Google Scholar] [CrossRef]
- Rahman, M.M.; Strawderman, L.; Carruth, D.W. Effect of Driving Contexts on Driver Acceptance of Advanced Driver Assistance Systems. Proc. Hum. Factors Ergon. Soc. 2017, 61, 1944–1948. [Google Scholar]
- Rahman, M.M.; Lesch, M.F.; Horrey, W.J.; Strawderman, L. Assessing the Utility of TAM, TPB, and UTAUT for Advanced Driver Assistance Systems. Accid. Anal. Prev. 2017, 108, 361–373. [Google Scholar] [CrossRef] [PubMed]
- Voinea, G.D.; Postelnicu, C.C.; Duguleana, M.; Mogan, G.L.; Socianu, R. Driving Performance and Technology Acceptance Evaluation in Real Traffic of a Smartphone-Based Driver Assistance System. Int. J. Environ. Res. Public Health 2020, 17, 7098. [Google Scholar] [CrossRef]
- Larue, G.S.; Wullems, C. Driving Simulator Evaluation of the Failure of an Audio In-Vehicle Warning for Railway Level Crossings. Urban Rail Transit 2015, 1, 10. [Google Scholar] [CrossRef] [Green Version]
- Jayaraman, K.; Leow, N.X.C.; Asirvatham, D.; Chan, H.R. Conceptualization of an Urban Travel Behavior Model to Mitigate Air Pollution for Sustainable Environmental Development in Malaysia. Manag. Environ. Qual. Int. J. 2020, 31, 785–799. [Google Scholar] [CrossRef]
- Madigan, R.; Louw, T.; Wilbrink, M.; Schieben, A.; Merat, N. What Influences the Decision to Use Automated Public Transport? Using UTAUT to Understand Public Acceptance of Automated Road Transport Systems. Transp. Res. Part F Traffic Psychol. Behav. 2017, 50, 55–64. [Google Scholar] [CrossRef]
- Adell, E.; Várhelyi, A.; dalla Fontana, M. The Effects of a Driver Assistance System for Safe Speed and Safe Distance—A Real-Life Field Study. Transp. Res. Part C Emerg. Technol. 2011, 19, 145–155. [Google Scholar] [CrossRef]
- Kervick, A.A.; Hogan, M.J.; O’Hora, D.; Sarma, K.M. Testing a Structural Model of Young Driver Willingness to Uptake Smartphone Driver Support Systems. Accid. Anal. Prev. 2015, 83, 171–181. [Google Scholar] [CrossRef] [PubMed]
- Yeong, D.J.; Velasco-hernandez, G.; Barry, J.; Walsh, J. Sensor and Sensor Fusion Technology in Autonomous Vehicles: A Review. Sensors 2021, 21, 2140. [Google Scholar] [CrossRef] [PubMed]
- Viktorova, L.; Sucha, M. Drivers’ Acceptance of Advanced Driver Assistance Systems—What to Consider? Int. J. Traffic Transp. Eng. 2018, 8, 320–333. [Google Scholar] [CrossRef]
- Penttinen, M.; Luoma, J. Acceptance and Use of ADAS. In Proceedings of the TRA2020, the 8th Transport Research Arena, Helsinki, Finland, 27–30 April 2020; pp. 1–10. [Google Scholar]
- Nastjuk, I.; Herrenkind, B.; Marrone, M.; Brendel, A.B.; Kolbe, L.M. What Drives the Acceptance of Autonomous Driving? An Investigation of Acceptance Factors from an End-User’s Perspective. Technol. Forecast. Soc. Chang. 2020, 161, 120319. [Google Scholar] [CrossRef]
- Bansal, P.; Kockelman, K.M. Forecasting Americans’ Long-Term Adoption of Connected and Autonomous Vehicle Technologies. Transp. Res. Part A Policy Pract. 2017, 95, 49–63. [Google Scholar] [CrossRef]
- Lijarcio, I.; Useche, S.A.; Llamazares, J.; Montoro, L. Availability, Demand, Perceived Constraints and Disuse of ADAS Technologies in Spain: Findings from a National Study. IEEE Access 2019, 7, 129862–129873. [Google Scholar] [CrossRef]
- Muslim, H.; Itoh, M. Effects of Human Understanding of Automation Abilities on Driver Performance and Acceptance of Lane Change Collision Avoidance Systems. IEEE Trans. Intell. Transp. Syst. 2019, 20, 2014–2024. [Google Scholar] [CrossRef]
- Reagan, I.J.; Cicchino, J.B.; Kidd, D.G. Driver Acceptance of Partial Automation after a Brief Exposure. Transp. Res. Part F Traffic Psychol. Behav. 2020, 68, 1–14. [Google Scholar] [CrossRef]
- Moon, C.; Lee, Y.; Jeong, C.-H.; Choi, S. Investigation of objective parameters for acceptance evaluation of automatic lane change system. Int. J. Automot. Technol. 2018, 19, 179–190. [Google Scholar] [CrossRef]
- Mantouka, E.; Orfanou, F.; Margreiter, M.; Vlahogianni, E.; Sanchez-Medina, J.; Wei, Z. Smart Parking Assistance Services and User Acceptance: A European Model. In Proceedings of the International Conference on Vehicle Technology and Intelligent Transport Systems (VEHITS), Heraklion, Crete, Greece, 3–5 May 2019; pp. 1–7. [Google Scholar]
- Weiss, E.; Fisher Thiel, M.; Sultana, N.; Hannan, C.; Seacrist, T. Advanced Driver Assistance Systems for Teen Drivers: Teen and Parent Impressions, Perceived Need, and Intervention Preferences. Traffic Inj. Prev. 2018, 19, S120–S124. [Google Scholar] [CrossRef] [PubMed]
- Hoyos, C.; Lester, B.D.; Crump, C.; Cades, D.M.; Young, D. Consumer Perceptions, Understanding, and Expectations of Advanced Driver Assistance Systems (ADAS) and Vehicle Automation. Proc. Hum. Factors Ergon. Soc. 2018, 3, 1888–1892. [Google Scholar] [CrossRef]
- Zaki, A.; Suzianti, A. Romadhani Ardi Assessing Driver Acceptance of Jakarta Community towards FCW and LDW. In Proceedings of the ICITE 2019: The 4th IEEE International Conference on Intelligent Transportation Engineering, Singapore, 5–7 September 2019; pp. 109–114. [Google Scholar]
- DeGuzman, C.A.; Donmez, B. Knowledge of and Trust in Advanced Driver Assistance Systems. Accid. Anal. Prev. 2021, 156, 106121. [Google Scholar] [CrossRef]
- Braun, H.; Gärtner, M.; Trösterer, S.; Akkermans, L.E.M.; Seinen, M.; Meschtscherjakov, A.; Tscheligi, M. Advanced Driver Assistance Systems for Aging Drivers. In Proceedings of the 11th International ACM Conference on Automotive User Interfaces and Interactive Vehicular Applications, AutomotiveUI 2019, Utrecht, The Netherlands, 21–25 September 2019; Association for Computing Machinery, Inc.: New York, NY, USA, 2019; pp. 123–133. [Google Scholar]
- Rahman, M.M.; Strawderman, L.; Lesch, M.F.; Horrey, W.J.; Babski-Reeves, K.; Garrison, T. Modelling Driver Acceptance of Driver Support Systems. Accid. Anal. Prev. 2018, 121, 134–147. [Google Scholar] [CrossRef] [PubMed]
- Chan, W.M.; Wai, J.L.C. 5G Connected Autonomous Vehicle Acceptance: The Mediating Effect of Trust in the Technology Acceptance Model. Asian J. Bus. Res. 2021, 11, 40–60. [Google Scholar] [CrossRef]
- Zaiontz, C. Real Statistics Using Excel; 2020. Available online: www.real-statistics.com (accessed on 29 March 2022).
- Motamedi, S.; Masrahi, A.; Bopp, T.; Wang, J.H. Different Level Automation Technology Acceptance: Older Adult Driver Opinion. Transp. Res. Part F Traffic Psychol. Behav. 2021, 80, 1–13. [Google Scholar] [CrossRef]


| Features | Description |
|---|---|
| Lane Departure Alert/ Warning (LDW) | Vibrates the steering wheel or emits a warning sound when the car strays off its lane. |
| Lane-Keep Assist (LKAS) | Applies gentle steering correction when the car is veering off its lane. |
| 360-Degree-Parking Assist (360 cam) | Provides a “bird’s eye” view of the car’s surroundings. |
| Rear Cross Traffic Alert (RCTA) | Used when reversing out into the busy street to alert the driver of the approaching vehicle’s direction. |
| Forward Collision Warning (FCW) | Gives a warning buzzer if a frontal collision is imminent. No braking actions. |
| Autonomous Emergency Braking (AEB) | Applies maximum braking pressure if driver does not respond after warning. Range, speed and detection ability vary. |
| Adaptive Cruise Controls (ACC) | Maintains a preset highway cruising speed. Brakes and accelerates automatically to maintain a preset safe distance. Some models allow limited (less than 30 s) hands-free driving |
| Low-Speed Follow/ Traffic Jam Assist (TJA) | Assists in stop–go driving. Follows the vehicle ahead, automatically braking/accelerating. Driver maintains control of steering wheel. |
| Auto Parking (A-Park) | Automatic steering for parking. Driver maintains control of gear selector (drive or reverse), braking and accelerating. Depending on the model, it may work on both parallel and perpendicular parking. |
| Head-up Display (HUD) | Projects core driving-related information to driver’s view or windscreen. |
| Blind Spot Monitor (BSM) | Lights up warning on the side mirrors when a vehicle is in the blind spot. |
| Auto Hold/Brake Hold (A-Hold) | For use in traffic jam/red light. Maintains brake pressure even when driver takes the foot off the brake pedal. Automatically releases when a driver accelerates. |
| Hill-Start Assist (HSA) | Maintains brake pressure to prevent the vehicle from rolling backward as the driver prepares to drive uphill. |
| Hill Descent Control (HDC) | Typically used for 4 × 4 vehicles. Maintains safe speed when driving downhill on muddy terrain. |
| Pedal Misapplication Control (PED) | Prevents accidental reversing/acceleration in the wrong direction, i.e., driver wrongly selected drive instead of reverse. |
| Auto High Beam (A-BEAM) | Forward-oriented lights that turn brighter and dimmer automatically, depending on the other vehicles and available light on the road. |
| MODEL | LDW | LKAS | 360 cam | RCTA | FCW | AEB | ACC | BSM | HUD | A-HOLD | HSA | HDC | PED | A-BEAM | TJA | A-PARK |
|---|---|---|---|---|---|---|---|---|---|---|---|---|---|---|---|---|
| Perodua MyVi | - | - | - | - | / | / v | - | - | - | - | / | - | / | - | - | - |
| Toyota Rush | - | - | / | / | / | / vp | - | / | - | - | - | - | / | - | - | - |
| Perodua Aruz | - | - | - | - | / | / vp | - | - | - | - | / | - | / | - | / | / |
| Hyundai Ioniq | / | / | - | / | / | / vp | / | / | - | / | / | - | - | - | - | / |
| Proton X70 | / | - | / | - | / | / v | / | / | - | / | / | / | - | / | / | - |
| Honda CR-V | / | / | - | - | / | / vpc | / ** | / # | - | / | / | - | - | - | - | / |
| Mazda CX-5 | / | / | / | / * | / | / | - | / | / | / | / | - | - | / % | - | - |
| Nissan X-Trail | / | - | / | / | - | - | - | - | - | / | / | / | - | - | / | / |
| Toyota Hilux | - | / | - | - | - | / | - | - | - | / | - | - | / | - | ||
| Mitsubishi Triton | / | - | - | / | / | / | - | / | - | - | / | / | / | / | - | - |
| Ford Ranger | / | / | - | - | / | / vp | / | - | - | - | / | / | - | - | / | - |
| Honda Accord | / | / | - | - | / | / vpc | / | / # | - | / | / | - | - | - | - | - |
| Mazda 3 | / | / | / | / * | / | / | / | / | / | / | / | - | - | / % | - | - |
| Mazda 6 | / | / | / | / * | / | / | - | / | / | / | / | - | - | / % | - | / |
| Toyota Camry | / | / | - | / | / | / | / | / | / | / | / | - | - | / | - | / |
| Level | SAE | NHTSA | BASt | In-Vehicle Applications |
|---|---|---|---|---|
| 0 | No Automation | No Automation | Driver Only | Collision warning, navigation system, lane departure warning, lighting and visibility system. |
| 1 | Driver Assistance | Function-specific Automation | Driver Assistance | Night-view assist, blind-spot assist, parking sensors, driver drowsiness detection, adaptive cruise control or lane-keep technology. |
| 2 | Partial Automation | Combined Function Automation | Partial Automation | Adaptive cruise control, active lane-keep assist or automatic emergency braking. |
| 3 | Conditional Automation | Limited Self-Driving Automation | A vehicle that can manage itself on a freeway journey, excluding on- and off-ramps and city driving, but driver must be alert. | |
| 4 | High Automation | Full Self-Driving Automation | High Automation | A vehicle that can complete an entire journey without driver intervention may be confined to a certain geographical area (i.e., geofenced) or could be prohibited from operating beyond a certain speed. |
| 5 | Full Automation | Full Automation |
| Context/Focus | Type of Study | Main Findings |
|---|---|---|
| Smartphone-based navigation application with a collision warning system [21] | Real-traffic experiment | Driver’s acceptance is attributed to user attitude and perceived usefulness. |
| Lane-change collision avoidance system using a haptic feedback force [33] | Driving simulator | Driver’s acceptance is influenced by corresponding system design with expectations. |
| Low emission zone and school zone alert system [15] | Real-traffic experiment and questionnaire via email | Experienced drivers have higher satisfaction level and positivity regarding system usefulness. |
| Adaptive cruise control and lane centering [34] | Controlled road experiment and post-drive survey | Driver acceptance is influenced by system functionalities. |
| Collision/Risk Alerts (CR); Collision Mitigation (CM); Automatic Driving Tasks (AT); Lighting and Visibility (LV); and Miscellaneous Driving Aids (MA) [32] | Structured live survey | Female drivers are more positive toward collision avoidance features. Features promoting safety are underutilized by drivers. |
| Automatic lane-change system [35] | Experimental design with 1823 lane-change events | Driver acceptance of the system was evaluated using performance index. |
| Parking assistance systems [36] | Survey | Driver acceptance is influenced by the system reliability. |
| Trust in technology, effect on driving skills and behavior and technology preferences among teens [37] | Standard focus group methodology and purposive sampling methods | Driver acceptance is influenced by trust and reliability of the vehicle technology. |
| ACC, FCW, LDW, blind-spot monitoring, driver drowsiness detection system, traffic sign recognition system, automatic high beam [29] | Survey | Driver acceptance is influenced by perceived safety benefit of the systems. |
| Forward collision warning and mitigation (FCWM) [38] | Online survey | Driver acceptance is influenced by knowledge regarding system automation level. |
| Forward collision warning and lane departure warning [39] | Questionnaire | Driver acceptance is influenced by attitude, perceived usefulness and subjective norms. |
| Fatigue monitoring system or an adaptive cruise control system combined with a lane-keeping system [19] | Driving simulator and online survey | Driver acceptance can be modeled using TAM and TPB. |
| Adaptive cruise control (ACC) and lane=keeping assistance (LKA) [40] | Survey | Driver owners have different understanding of ACC and LKA systems and tend to over-estimate the system capabilities. There is no relationship between trust and frequent usage of the systems. |
| Night-view assist, blind-spot assist, parking sensors, driver drowsiness detection, emergency-brake assist, cruise control and emergency stop system [41] | Online survey | Driver acceptance is influenced by system usefulness, reassurance and trust as well as system level of autonomy. |
| Vehicle system related to driving convenience and safety [4] | Online survey | Driver acceptance is positively influenced by factors related to driver convenience and trust. |
| Research Questions | Hypothesis |
|---|---|
| Q1: What relationship exists between the PU and EU variables of the research model? | H1: User-perceived ease of use (EU) of in-vehicle applications positively affects perceived usefulness (PU) of the applications. |
| Q2: What influences exist between PU and EU with the mediating variable (AT) in the research model? | H2: User-perceived usefulness (PU) of in-vehicle applications positively affects their attitude toward the applications (AT). H3: User-perceived ease of use (EU) of in-vehicle applications positively affects their attitude toward the applications (AT). |
| Q3: How does user attitude (AT) impact the user intention to use the in-vehicle applications (BI)? | H4: User attitude (AT) toward the in-vehicle applications positively affects their intention to use the application (BI). |
| Q4: What influences exist between PU and EU with the target variable (BI) in the research model? | H5: User-perceived usefulness (PU) of in-vehicle applications positively affects their intention to use the applications (BI). H6: User-perceived ease of use (EU) of in-vehicle applications positively affects their intention to use the applications (BI). |
| Q5: What is the impact of social influence (SI) on user-perceived usefulness (PU) and perceived ease of use (EU) of the in-vehicle applications? | H7: Social influence (SI) positively influences drivers’ perceived usefulness (PU) of the applications. H8: Social influence (SI) positively influences drivers’ perceived ease of use (EU) of the applications. |
| Q6: How does trust (T) influence perceived usefulness (PU) and perceived ease of use (EU) of the in-vehicle applications among users? | H9: Trust (T) positively influences drivers’ perceived usefulness (PU) of the applications. H10: Trust (T) positively influences drivers’ perceived ease of use (EU) of the applications. |
| Q7: How do system characteristics (SCs) influence perceived usefulness (PU) and perceived ease of use (EU) of the in-vehicle applications among users? | H11: System characteristics (SCs) positively influence users’ perceived usefulness (PU) of the in-vehicle applications. H12: System characteristics (SCs) positively influence users’ perceived ease of use (EU) of the in-vehicle applications. |
| Q8: How do personal characteristics (PCs) influence trust (T), social influence (SI) and system characteristics (SCs) of the in-vehicle applications among users? | H13: Personal characteristics (PCs) positively influence system characteristics (SCs) of the in-vehicle applications. H14: Personal characteristics (PCs) positively influence trust (T) toward the in-vehicle applications. H15: Personal characteristics (PCs) positively influence social influence (SI) toward the in-vehicle applications. |
| Construct | Items |
|---|---|
| Perceived Usefulness (PU) | In-vehicle application features make driving more convenient. In-vehicle application features would enable me to reach my destination quickly and safely. In-vehicle application features would enable me to reach my destination cost-efficiently. Using in-vehicle application features means extensive internet connectivity is required. Using in-vehicle application features in my vehicle is meaningless if other vehicles are not equipped with in-vehicle application features as well. |
| Perceived Ease of Use (EU) | I do not need special training to learn how to use in-vehicle application features. I require in-vehicle application features instruction manual to be able to use the features perfectly. It is easy to become skilful in using in-vehicle application features. In-vehicle application features are easy and simple to understand. |
| Attitude (AT) | I think using in-vehicle application features would be a good idea. I think in-vehicle application features would make my driving experience more interesting and fun. When I drive a vehicle with in-vehicle application features, I feel satisfied. Overall, available in-vehicle application features in my vehicle meet my expectations. I will recommend in-vehicle application features to others. |
| Intention to Use (BI) | I am willing to use in-vehicle application features in the future. I am willing to use in-vehicle application features frequently and consistently if given the opportunity. If the vehicle with in-vehicle application features becomes available to me, I plan to obtain and use it. I will use in-vehicle application features if required. |
| Trust (T) | I believe in-vehicle application features are verified professionally. I believe the in-vehicle application features are reliable. I believe in-vehicle application features will perform better as an add-on to my vehicle. I believe my driving experience will be safer with in-vehicle application features. I am worried about using in-vehicle application features. |
| System Characteristics (SCs) | I am afraid that a mounted dashcam to display alerts from in-vehicle application features will distract my driving. Using in-vehicle application features do not really bother me to drive. I will only use in-vehicle application features with audio when I drive. In-vehicle application features with visuals on the vehicle dashboard will not affect my driving. I prefer in-vehicle application features integrated into a mounted car dashcam. |
| Social Influence (SI) | I would be proud to show the vehicle with in-vehicle application features to people who are close to me. I would feel more inclined to use in-vehicle application features if it was widely used by others. I would prefer to have someone else as a passenger when I drive a car with in-vehicle application features. Other people will encourage me when I use in-vehicle application features. Other people will think I am wasting money when I purchase a vehicle with in-vehicle application features. |
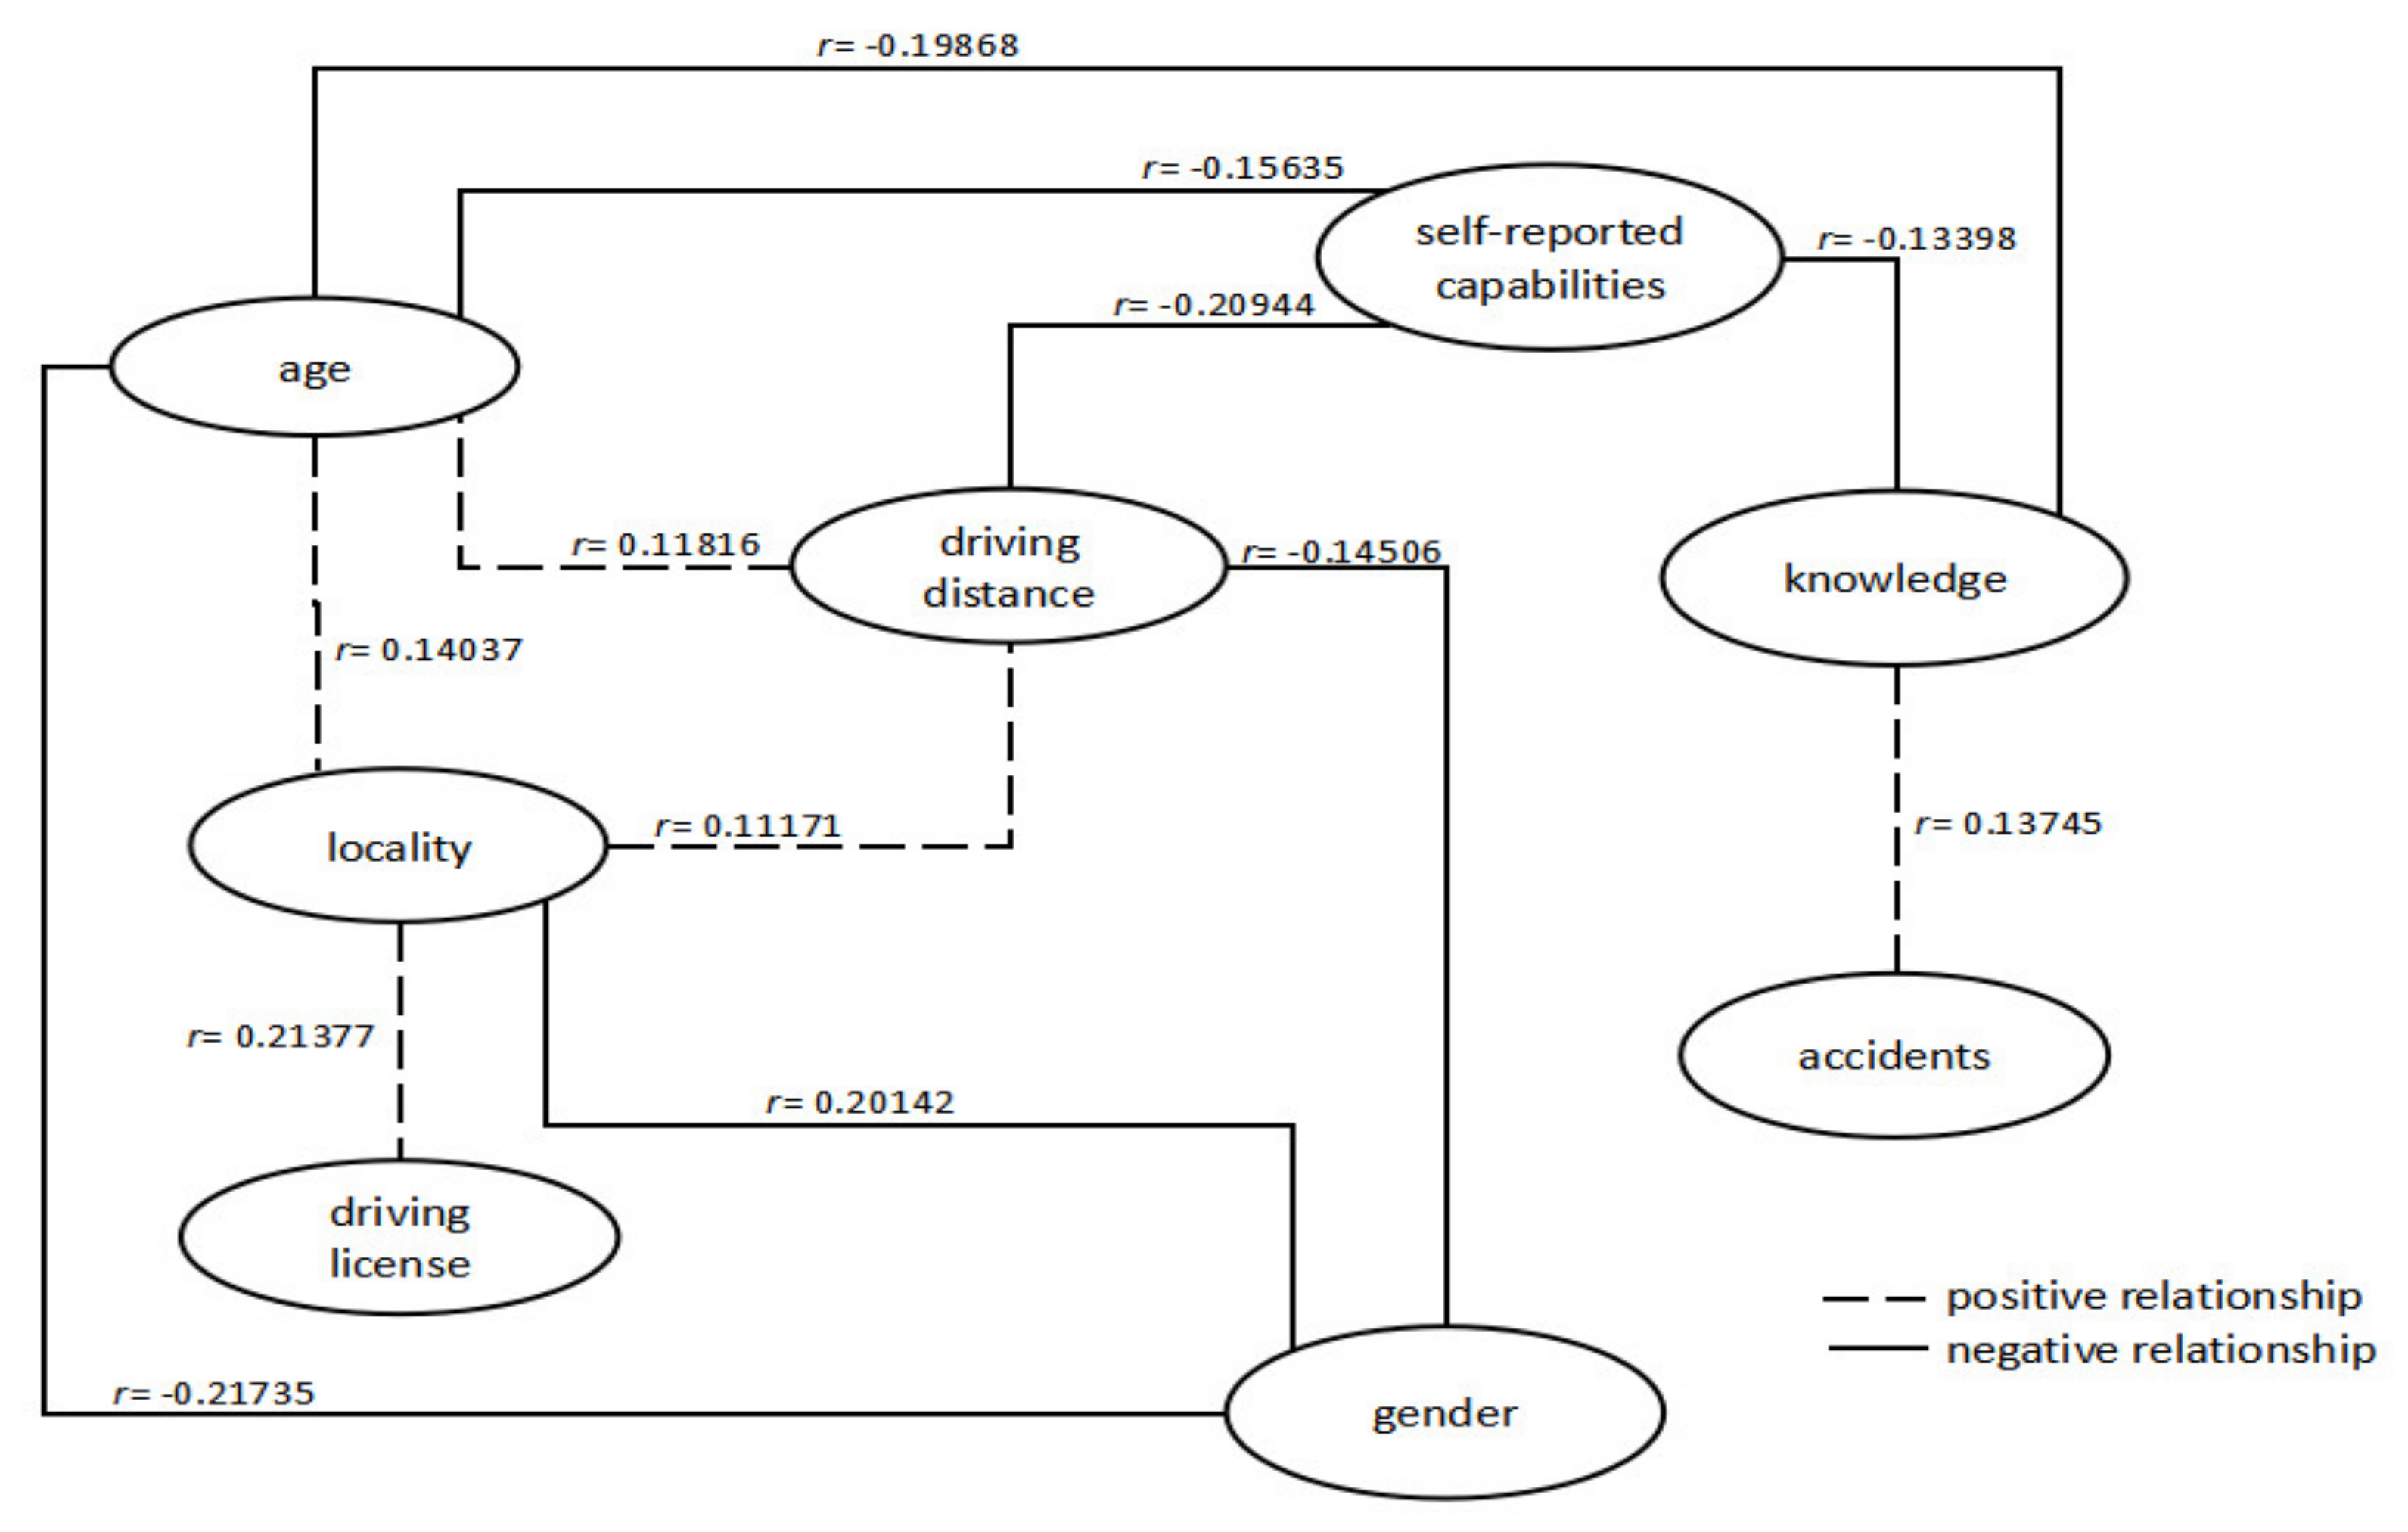
| Personal Characteristics (PCs) | Response Category (n) |
|---|---|
| Gender | Male (113); Female (195) |
| Age | 18–25 years old (152), 26–34 years old (38), 35–54 years old (82), 55–64 years old (25), above 64 years old (11) |
| Driver’s License | Yes (264), No (44) |
| Accident Experience | Yes (155), No (153) |
| Locality | Rural (53), Suburban (110), Urban (145) |
| Knowledge about in-vehicle applications | No (79), Yes (229) |
| Self-reported capabilities | Limited (141), Not Limited (167) |
| Driving distance per week | less 100 km (195), 100–200 km (62), 201–300 km (23), 301–400 km (3), more than 400 km (25) |
| Variables | T | SC | SI | PU | EU | AT | BI |
|---|---|---|---|---|---|---|---|
| Cronbach’s α | 0.7100 | 0.8161 | 0.9733 | 0.8586 | 0.7522 | 0.7712 | 0.6294 |
| No. of Indicator | AVE | AVE/Indicator | |
|---|---|---|---|
| PU | 5 | 0.7295 | 0.8541 |
| EU | 4 | 0.5473 | 0.7398 |
| AT | 5 | 0.7809 | 0.8837 |
| T | 5 | 0.7778 | 0.8818 |
| SC | 5 | 0.8808 | 0.9385 |
| SI | 5 | 0.5859 | 0.7655 |
| PC | 6 | 0.5537 | 0.7441 |
| BI | 4 | 0.6717 | 0.8195 |
| PU | EU | AT | T | SC | SI | BI | |
|---|---|---|---|---|---|---|---|
| PU | 1 | ||||||
| EU | 0.584278 | 1 | |||||
| AT | 0.597966 | 0.400629 | 1 | ||||
| T | 0.739867 | 0.603682 | 0.549366 | 1 | |||
| SC | 0.720569 | 0.664573 | 0.579474 | 0.686981 | 1 | ||
| SI | 0.749924 | 0.474516 | 0.555729 | 0.84442 | 0.597722 | 1 | |
| BI | 0.507614 | 0.334304 | 0.896483 | 0.469818 | 0.416398 | 0.445437 | 1 |
| PC Variables | VIF | Exploratory Variables | VIF |
|---|---|---|---|
| Gender | 1.1208 | Trust | 4.2503 |
| Age | 1.1637 | System characteristics | 1.8976 |
| Driving license | 1.0660 | Social influence | 3.4920 |
| Accidents | 1.0405 | Perceived usefulness | 1.5183 |
| Locality | 1.1249 | Perceived ease of use | 1.5183 |
| Knowledge | 1.1070 | ||
| Self-reporting capabilities | 1.1239 | ||
| Driving distance per week (km) | 1.0926 |
| X→Y | Multiple R | Coefficient | Std. Error | t Stat | p-Value | Hypothesis |
|---|---|---|---|---|---|---|
| EU → PU | 0.58428 | 0.48622 | 0.03861 | 12.59397 | 1.38E-29 | H1 rejected |
| PU → AT | 0.59797 | 0.32618 | 0.04264 | 7.64880 | 2.65E-13 | H2 rejected |
| EU → AT | 0.40063 | 0.32618 | 0.04264 | 7.64880 | 2.65E-13 | H3 rejected |
| AT → BI | 0.89648 | 0.90591 | 0.02560 | 35.39342 | 3.40E-110 | H4 rejected |
| PU → BI | 0.50761 | 0.50186 | 0.04870 | 10.30616 | 1.41E-21 | H5 rejected |
| EU → BI | 0.33430 | 0.27504 | 0.04433 | 6.20492 | 1.78E-09 | H6 rejected |
| T → PU | 0.73987 | 0.75133 | 0.03906 | 19.23795 | 1.29E-54 | H9 rejected |
| SI → PU | 0.74992 | 0.62271 | 0.03140 | 19.83043 | 7.41E-57 | H7 rejected |
| SC → PU | 0.72057 | 0.69049 | 0.03798 | 18.17872 | 1.37E-50 | H11 rejected |
| T → EU | 0.60368 | 0.73669 | 0.05562 | 13.24611 | 5.74E-32 | H10 rejected |
| SI → EU | 0.47452 | 0.473489 | 0.05021 | 9.42990 | 1.06E-18 | H8 rejected |
| SC → EU | 0.66457 | 0.765272 | 0.04919 | 15.5580 | 1.29E-40 | H12 rejected |
| Model | Multiple R | Adjusted R2 | F | p-Value | Sig. |
|---|---|---|---|---|---|
| T, SC, SI → PU | 0.82550 | 0.678298 | 216.7664 | 3.52E-75 | Yes |
| T, SC, SI → EU | 0.69949 | 0.484246 | 97.08173 | 4.3E-44 | Yes |
| T, SC, SI → AT | 0.63593 | 0.398535 | 68.8067 | 5.52E-34 | Yes |
| T, SC, SI → BI | 0.494563 | 0.237138 | 32.81056 | 2.12E-18 | Yes |
| PU, EU → AT | 0.601292 | 0.357365 | 86.36036 | 1.91E-30 | Yes |
| PU, EU → BI | 0.509737 | 0.254979 | 53.53434 | 1.18E-20 | Yes |
| PU, EU, AT → BI | 0.897264 | 0.803159 | 418.5442 | 1.4E-107 | Yes |
| Coefficients | Std Error | t-Stat | p-Value | Correlation | Semi- Part | |
|---|---|---|---|---|---|---|
| PU → AT | 0.5850 | 0.0448 | 13.0504 | 3.00E-31 | 0.5980 | |
| AT → BI | 0.9059 | 0.0256 | 35.3934 | 3.38E-110 | 0.8965 | 0.7398 |
| PU → BI | 0.5019 | 0.0487 | 10.3062 | 1.41E-21 | 0.5076 | −0.0355 |
| PU | −0.0438 | 0.0312 | −1.4037 | 0.1614 | ||
| AT | 0.9327 | 0.0319 | 29.2529 | 1.20E-90 | ||
| EU → AT | 0.3262 | 0.0426 | 7.6488 | 2.65339E-13 | 0.4006 | |
| AT → BI | 0.9059 | 0.0256 | 35.3934 | 3.3791E-110 | 0.8965 | 0.8323 |
| EU → BI | 0.2750 | 0.0443 | 6.2049 | 1.77517E-09 | 0.3343 | −0.0271 |
| EU | −0.0438 | 0.0312 | −1.4037 | 0.1614 | ||
| AT | 0.9327 | 0.0319 | 29.2529 | 1.20E-90 |
| Coefficients | Std Error | t-Stat | p-Value | |
|---|---|---|---|---|
| PU → AT → BI | 0.5361 | 0.0438 | 12.2488 | 2.52E-28 |
| EU → AT → BI | 0.3592 | 0.0480 | 7.4791 | 8.03E-13 |
| SI → EU → AT | 0.190105 | 0.031894 | 5.960593 | 6.94E-09 |
| SC → EU → AT | 0.266247 | 0.038724 | 6.875561 | 3.49E-11 |
| T → EU → AT | 0.241852 | 0.036435 | 6.638004 | 1.45E-10 |
| SI → PU → AT | 0.448429 | 0.041098 | 10.91116 | 1.28E-23 |
| SC → PU → AT | 0.430876 | 0.040603 | 10.612 | 1.34E-22 |
| T → PU → AT | 0.241852 | 0.036435 | 6.638004 | 1.45E-10 |
| Correlation | Std Error (Linear) | Std. Error (Non-Linear) | |
|---|---|---|---|
| Locality → PU | −0.12525 | 0.05677 | 0.00184 |
| Gender → AT | 0.15946 | 0.08532 | 0.00286 |
| Age → AT | −0.1194 | 0.03490 | 0.00063 |
| Knowledge → AT | 0.18236 | 0.09378 | 0.00372 |
| Locality → T | −0.10759 | 0.05602 | 0.00198 |
| Knowledge → T | 0.14532 | 0.09498 | 0.00421 |
| Knowledge → SC | 0.12307 | 0.10096 | 0.00424 |
| Self-reported capabilities → SC | −0.11057 | 0.10396 | 0.00425 |
| Locality → SI | −0.14126 | 0.06822 | 0.00234 |
| Knowledge → SI | 0.14740 | 0.11612 | 0.00490 |
| Gender → BI | 0.14236 | 0.08645 | 0.00301 |
| Age → BI | −0.13941 | 0.03518 | 0.00066 |
| Knowledge → BI | 0.18607 | 0.09470 | 0.00389 |
| p-Value | Regression Model | X (Not Significant p-Value) | |
|---|---|---|---|
| Gender, age, knowledge → BI | 0.00027 | Significant | age (0.17926) |
| Gender, age, knowledge → AT | 0.00024 | Significant | age (0.36185) |
| Locality, knowledge → SI | 0.00226 | Significant | Significant |
| Self-reported capabilities, knowledge → SC | 0.02361 | Significant | knowledge (0.05479) self-reported capabilities (0.09237) |
| Locality, knowledge → T | 0.00845 | Significant | locality (0.08158) |
| Research Question | Findings |
|---|---|
| Q1: What relationship exists between the independent variables (PU, EU) of the research model? | A user who perceives that the in-vehicle application is easy to be used will also perceive that the in-vehicle application is useful in their driving experience. |
| Q2: What influences exist between independent variables (PU, EU) and the mediating variable (AT) in the research model? | The higher a user perceives that the in-vehicle application is easy to be used and useful for their driving experience, the more favorable the user attitude toward in-vehicle application. |
| Q3: How does driver’s attitude (AT) impact the driver’s intention to use the in-vehicle applications (BI)? | The more positive the attitude of a user toward in-vehicle application, the higher the usage intention of the application. |
| Q4: What influences exist between independent variables (PU, EU) and the target variable (BI) in the research model? | The higher a user perceives that the in-vehicle application is easy to be used and useful for their driving experience, the higher the usage intention of the application. |
| Q5: What is the impact of social influence (SI) on drivers’ perceived usefulness (PU) and perceived ease of use (EU) of the in-vehicle applications? | The more positive social influence received by a user, the more inclined the user is to perceive that the in-vehicle application is useful and easy to be used. |
| Q6: How does trust (T) influence perceived usefulness (PU) and perceived ease of use (EU) of the in-vehicle applications among users? | A user who believes that in-vehicle application is safe and provides driving advantages will perceive that the application is useful and easy to be used. |
| Q7: How do system characteristics (SCs) influence perceived usefulness (PU) and perceived ease of use (EU) of the in-vehicle applications among users? | The higher the perceived relative advantage of in-vehicle applications, the greater the perceived usefulness and ease of use of in-vehicle applications. |
| Q8: How do personal characteristics (PCs) influence trust (T), social influence (SI) and system characteristics (SCs) of the in-vehicle applications among users? | A user who has been involved in road accidents has greater intention to use in-vehicle application. A user who has limited self-reported capabilities has greater intention to use in-vehicle applications. A user residing in urban or sub-urban area has greater impact on social influence and trust which will influence their intention to use in-vehicle application. There is no sufficient evidence to conclude that age is a factor which positively influences any of the other factors. |
Publisher’s Note: MDPI stays neutral with regard to jurisdictional claims in published maps and institutional affiliations. |
© 2022 by the authors. Licensee MDPI, Basel, Switzerland. This article is an open access article distributed under the terms and conditions of the Creative Commons Attribution (CC BY) license (https://creativecommons.org/licenses/by/4.0/).
Share and Cite
Razak, S.F.A.; Yogarayan, S.; Abdullah, M.F.A.; Azman, A. Modeling User Acceptance of In-Vehicle Applications for Safer Road Environment. Future Internet 2022, 14, 148. https://doi.org/10.3390/fi14050148
Razak SFA, Yogarayan S, Abdullah MFA, Azman A. Modeling User Acceptance of In-Vehicle Applications for Safer Road Environment. Future Internet. 2022; 14(5):148. https://doi.org/10.3390/fi14050148
Chicago/Turabian StyleRazak, Siti Fatimah Abdul, Sumendra Yogarayan, Mohd Fikri Azli Abdullah, and Afizan Azman. 2022. "Modeling User Acceptance of In-Vehicle Applications for Safer Road Environment" Future Internet 14, no. 5: 148. https://doi.org/10.3390/fi14050148
APA StyleRazak, S. F. A., Yogarayan, S., Abdullah, M. F. A., & Azman, A. (2022). Modeling User Acceptance of In-Vehicle Applications for Safer Road Environment. Future Internet, 14(5), 148. https://doi.org/10.3390/fi14050148