
Controlling the Trade-Off between Resource Efficiency and User Satisfaction in NDNs Based on Naïve Bayes Data Classification and Lagrange Method

 ,
,  ,
, 
 ,
,
Abstract
:1. Introduction
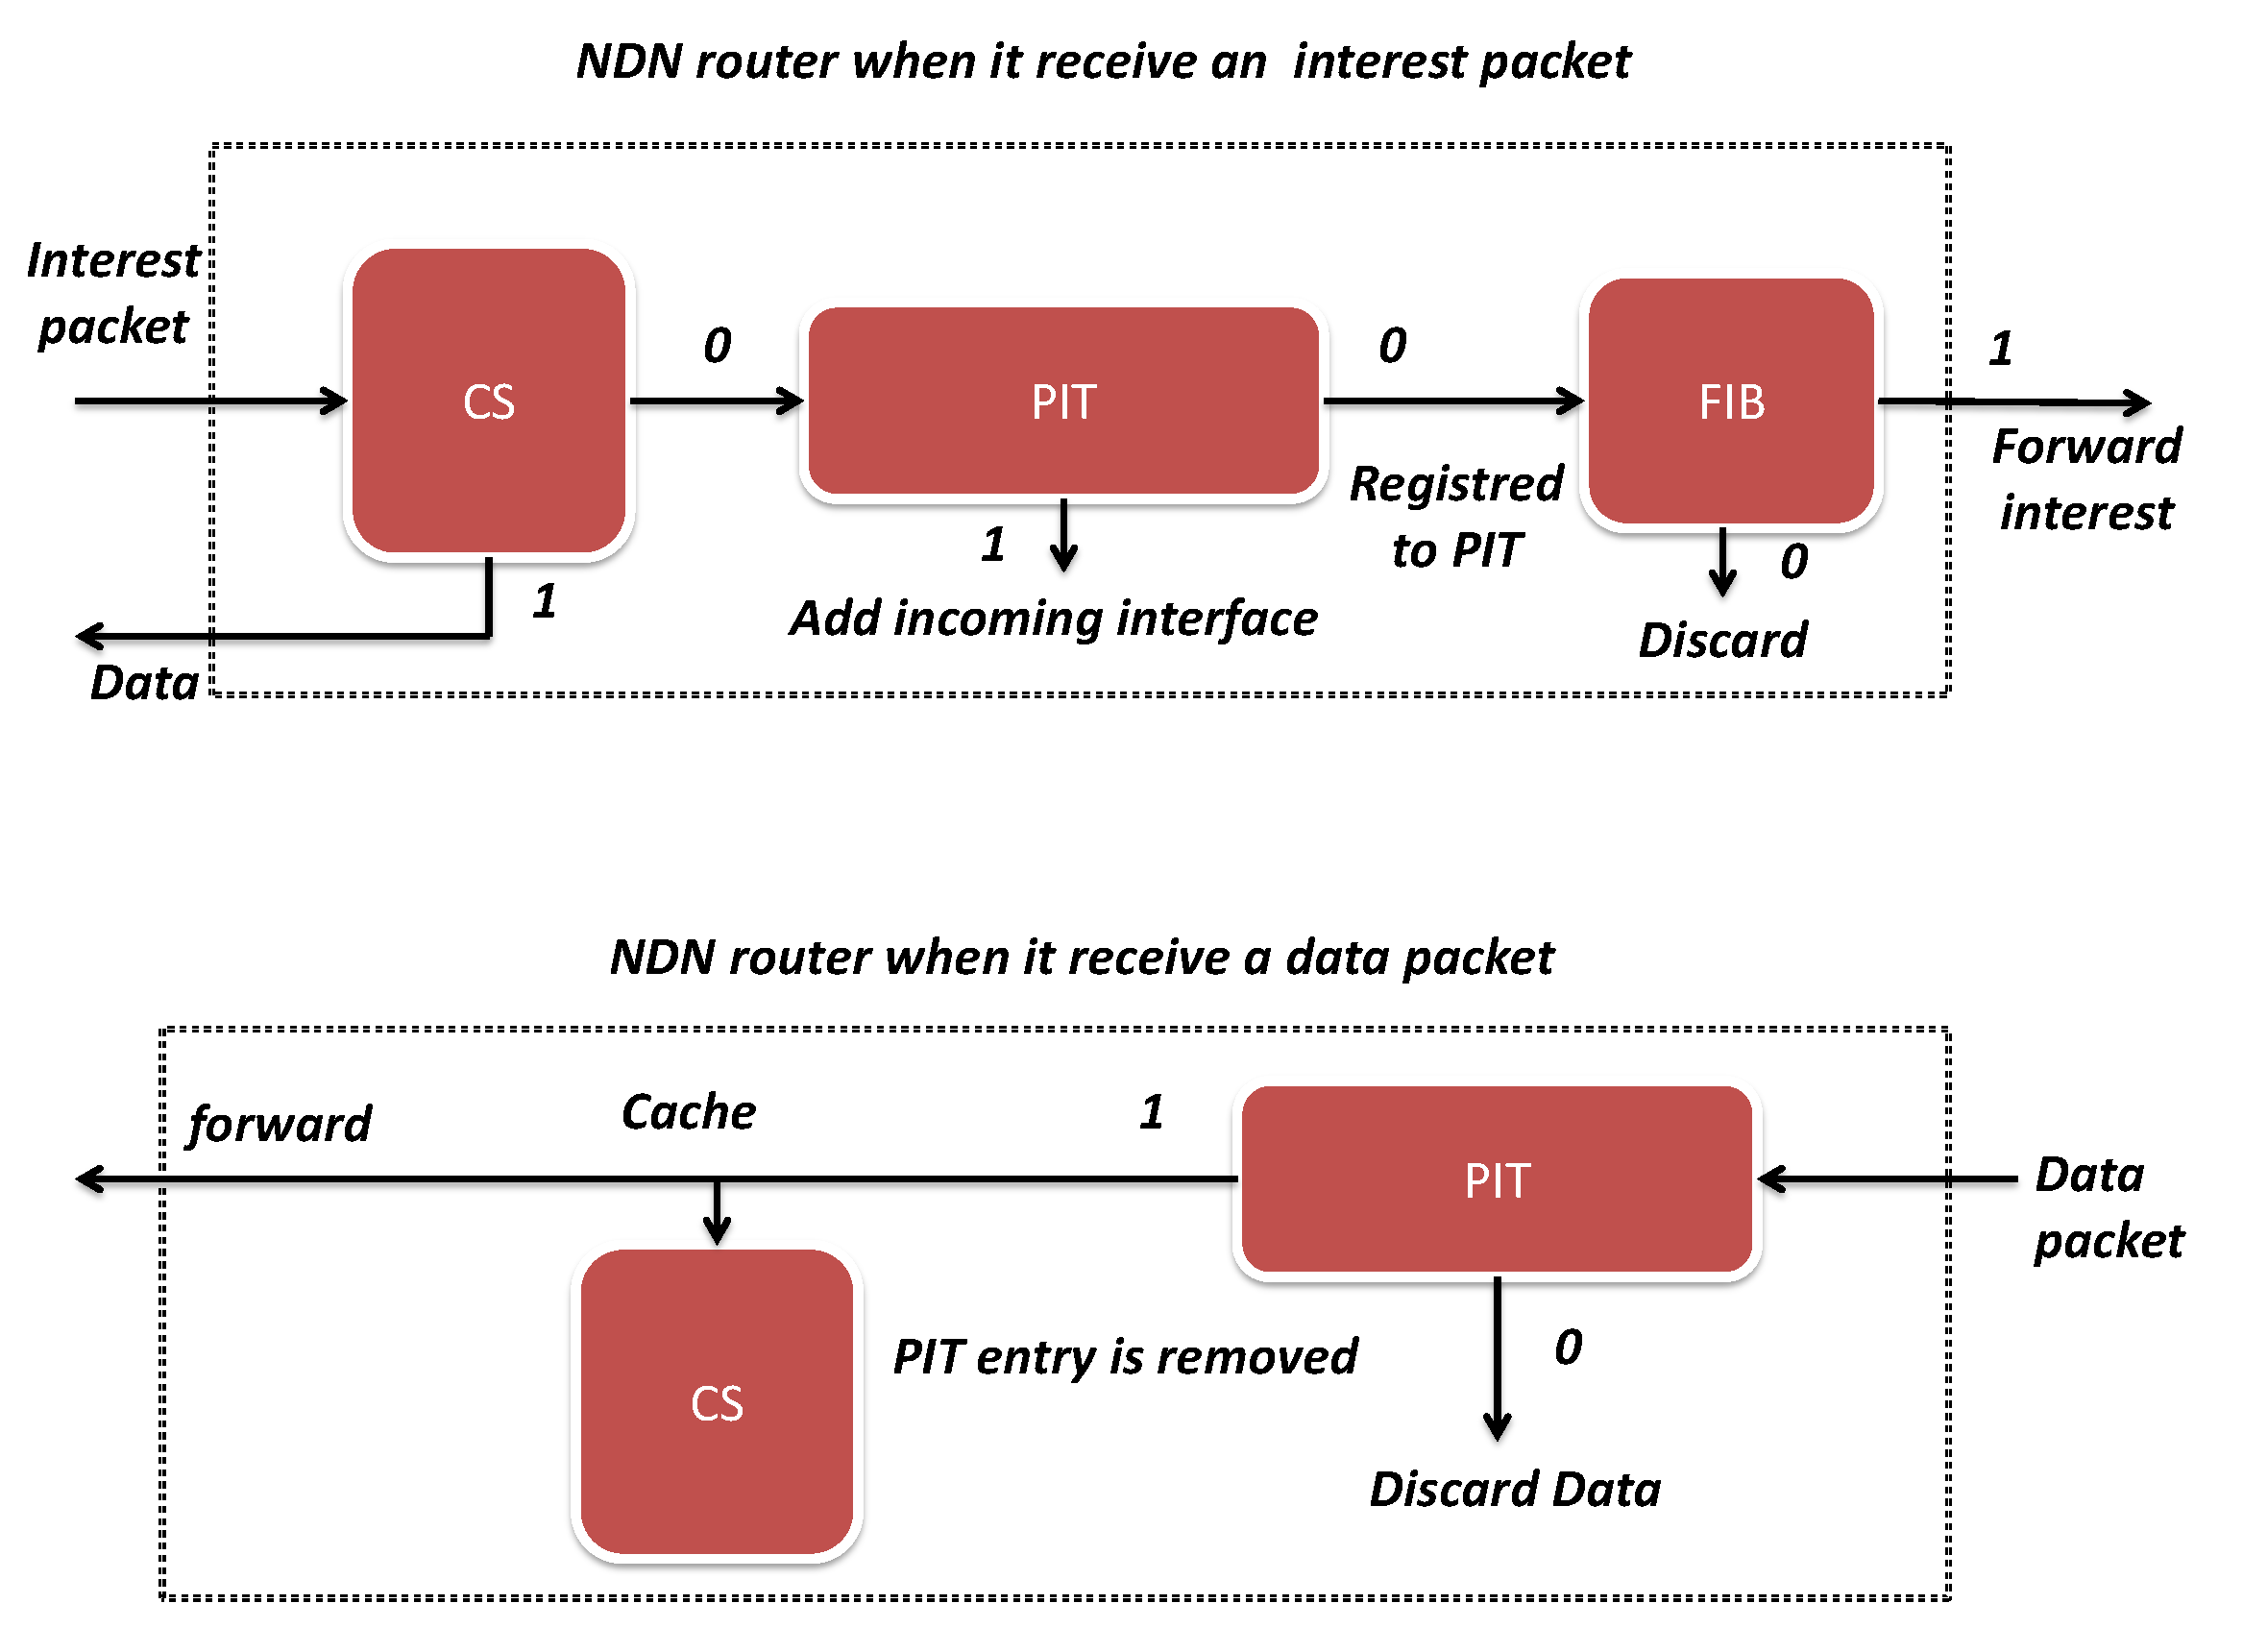
2. NDN Background
3. Related Work
4. RADC: Resource Allocation Based Data Classification
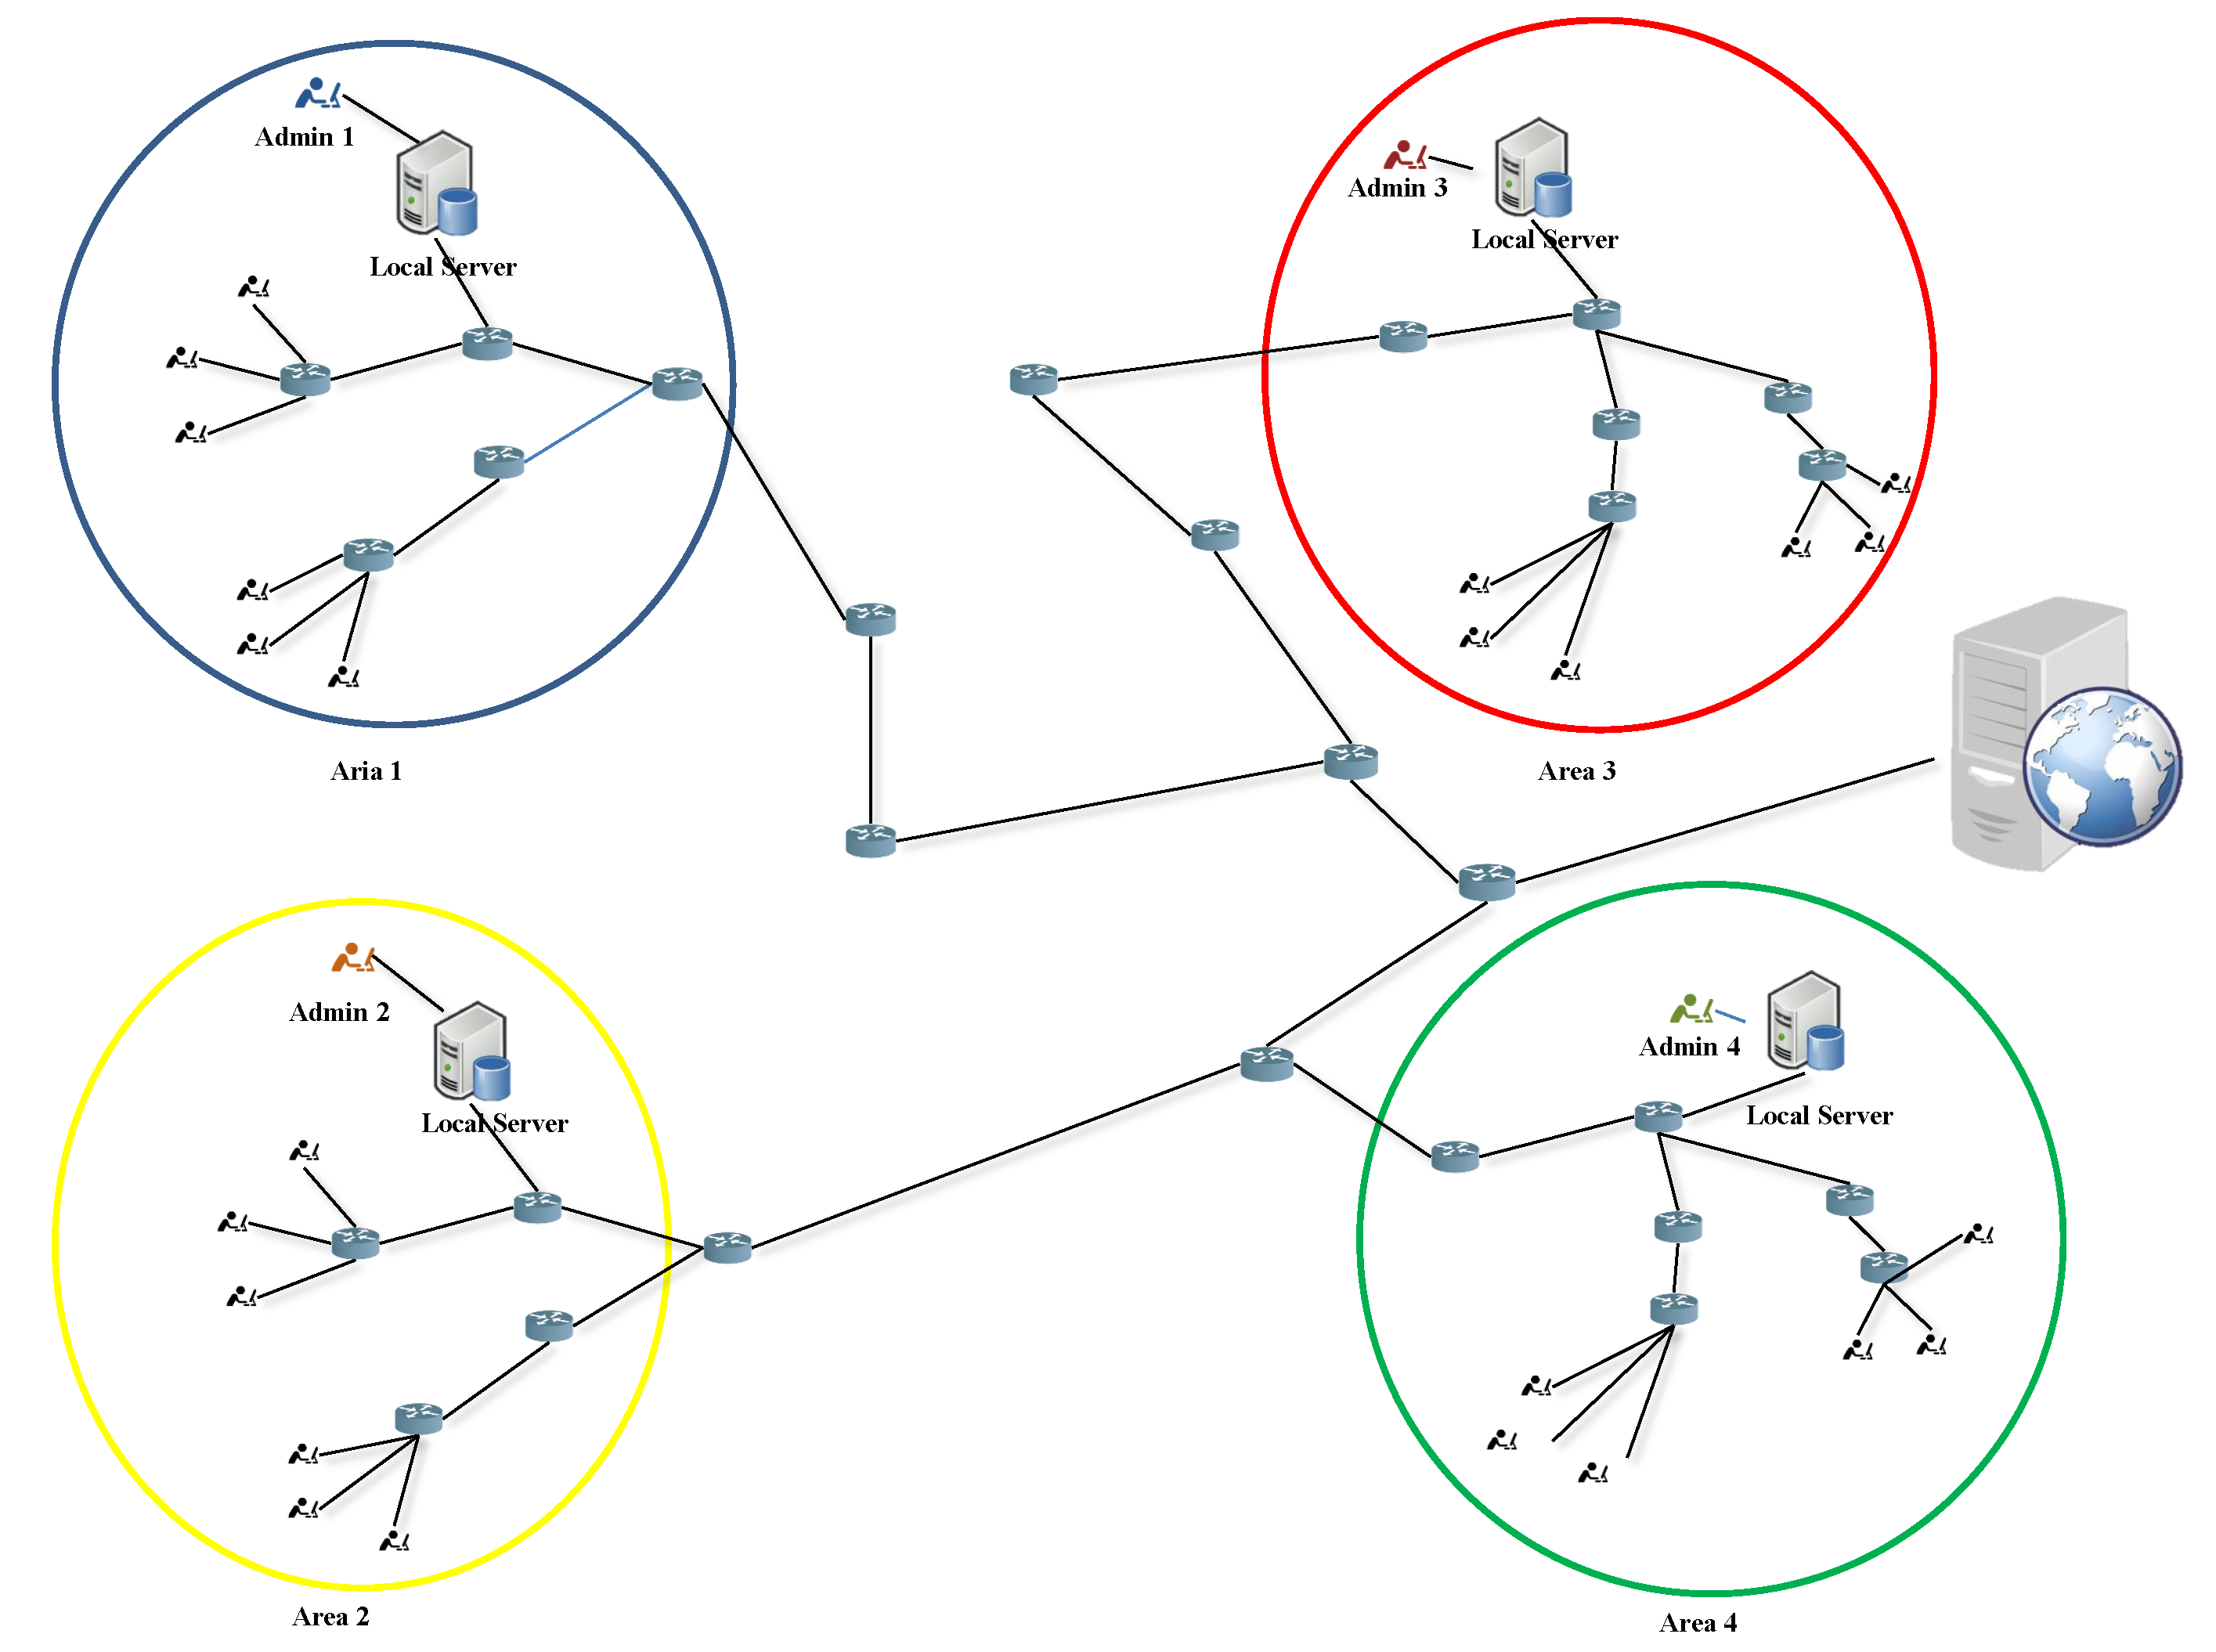
4.1. System Model
4.2. Content Classification
4.2.1. The High-Level Description of the Naïve Bayes Classifier
4.2.2. Multinomial Naïve Bayes Classifier
4.3. Resource Allocation
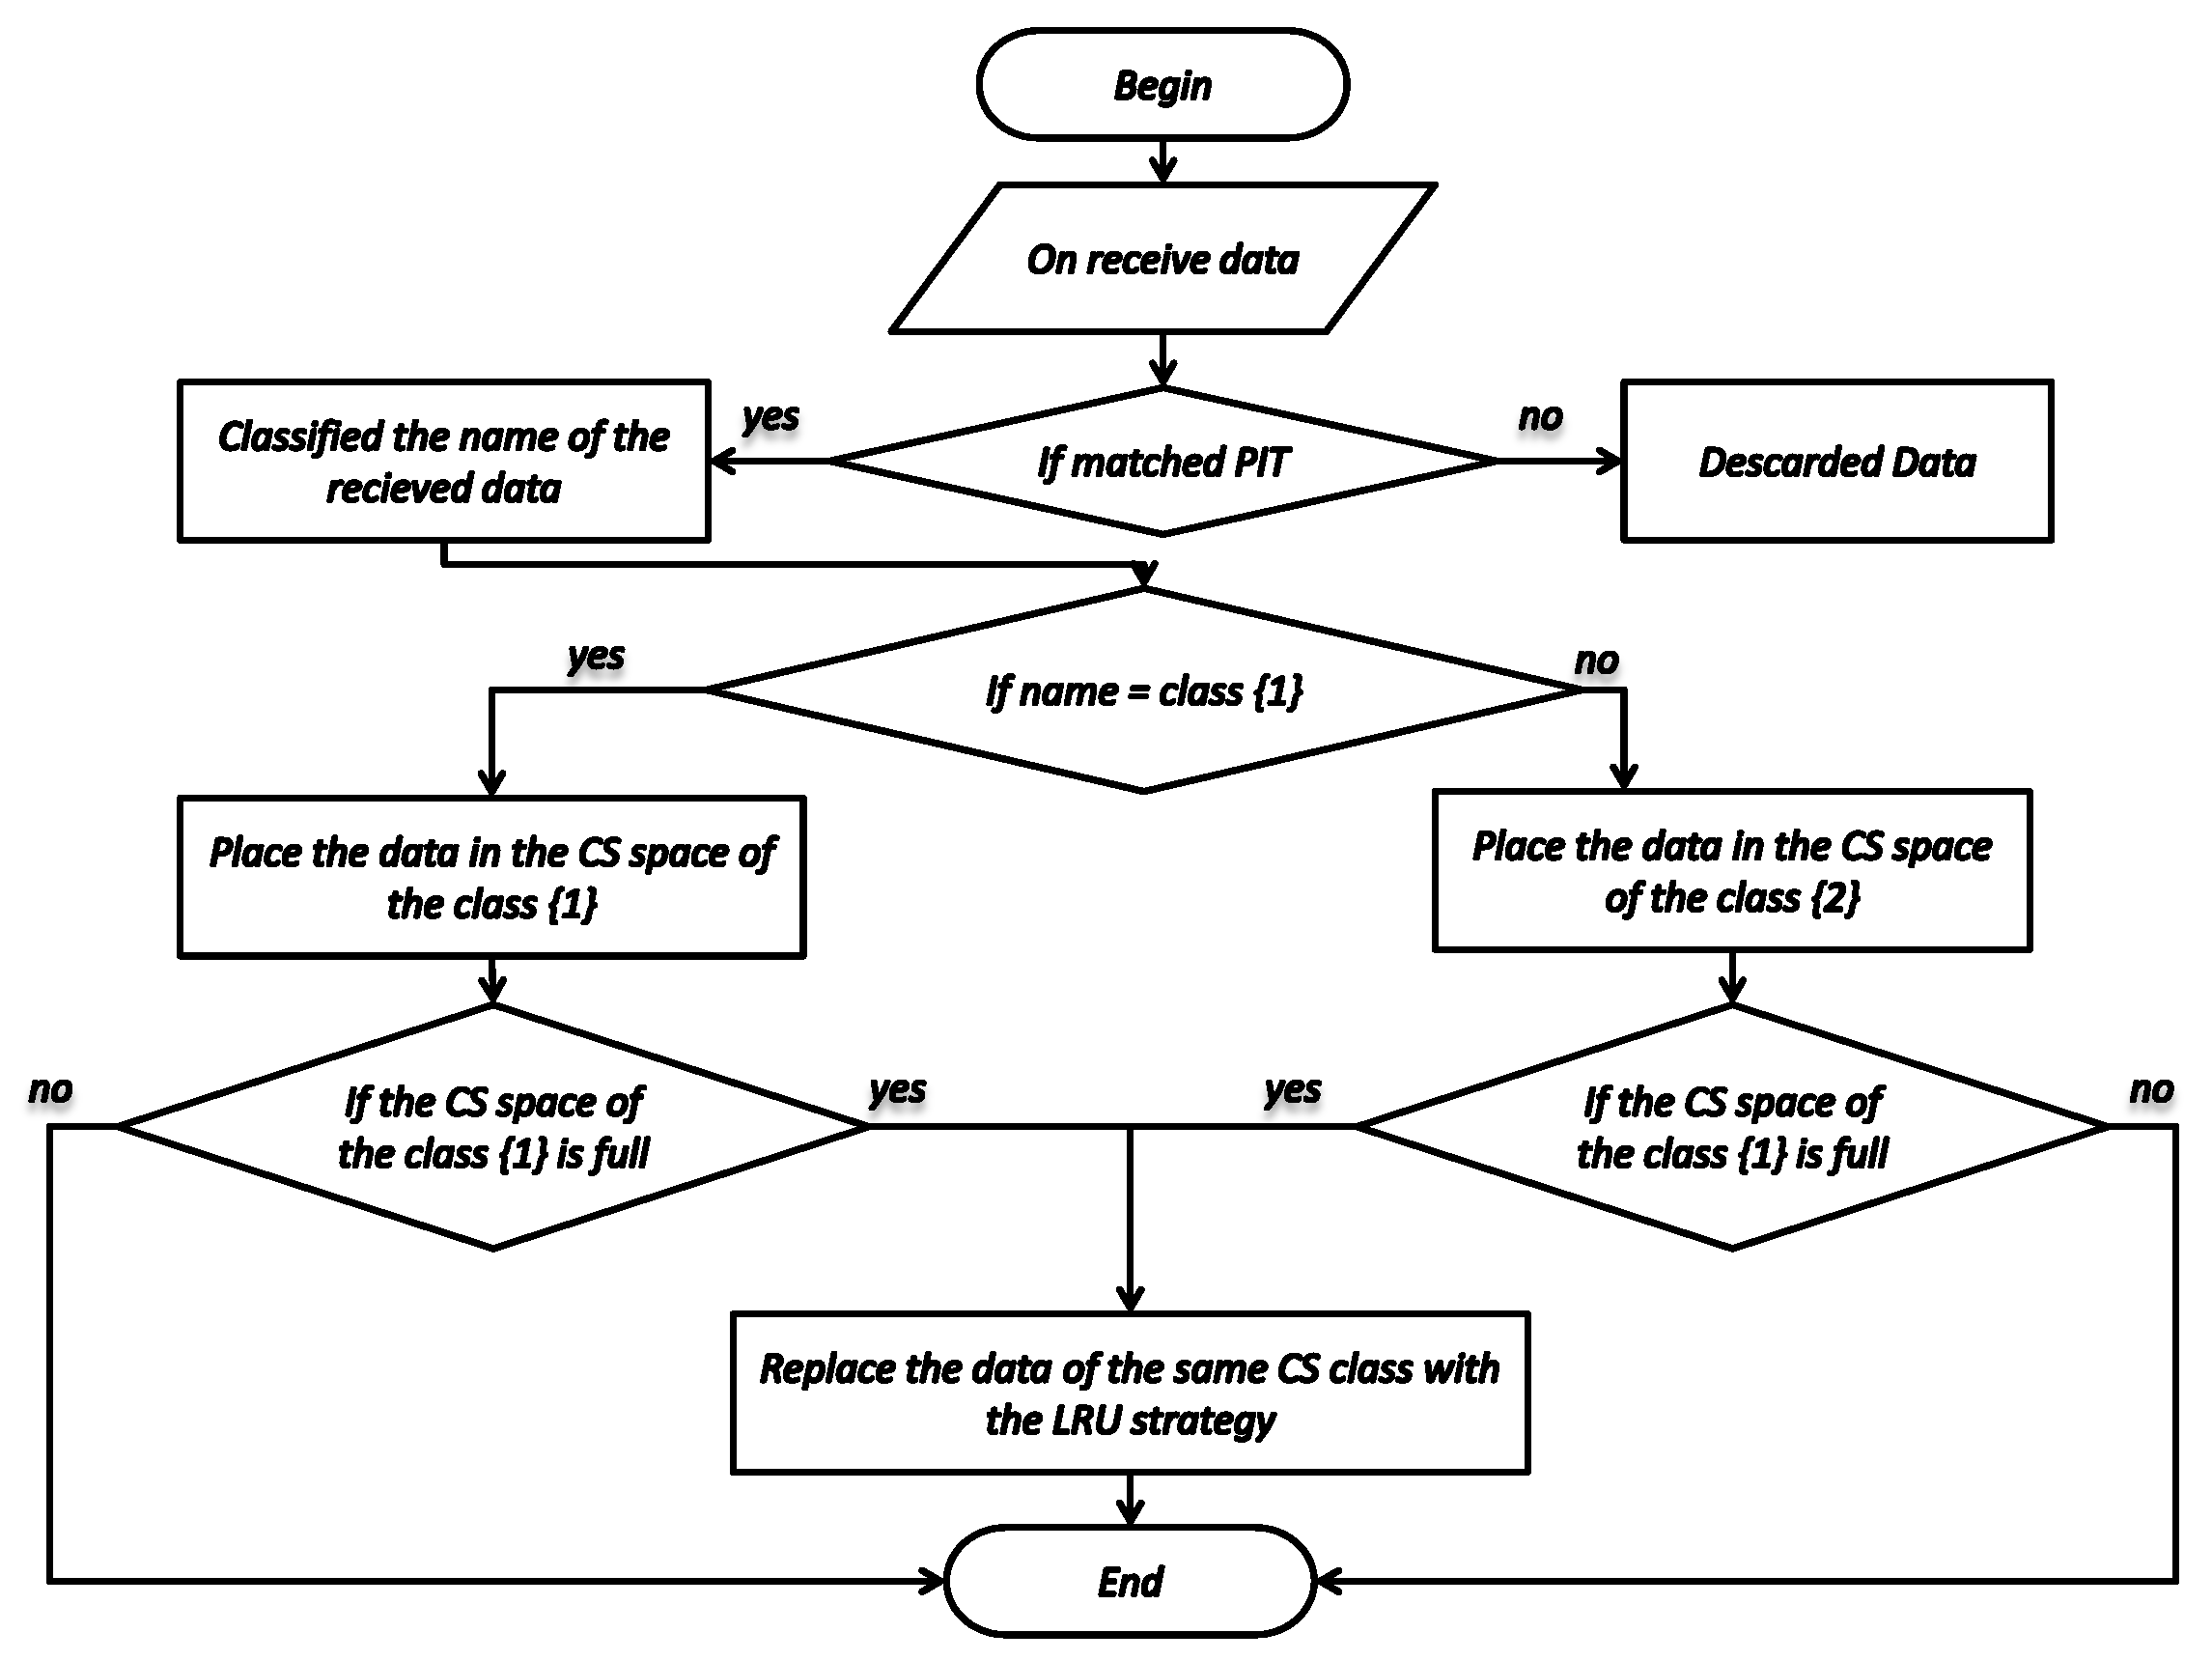
4.4. Placement and Replacement of Data
5. Performance Results of RACD Strategy
5.1. Simulation Environment
5.2. Performance Results
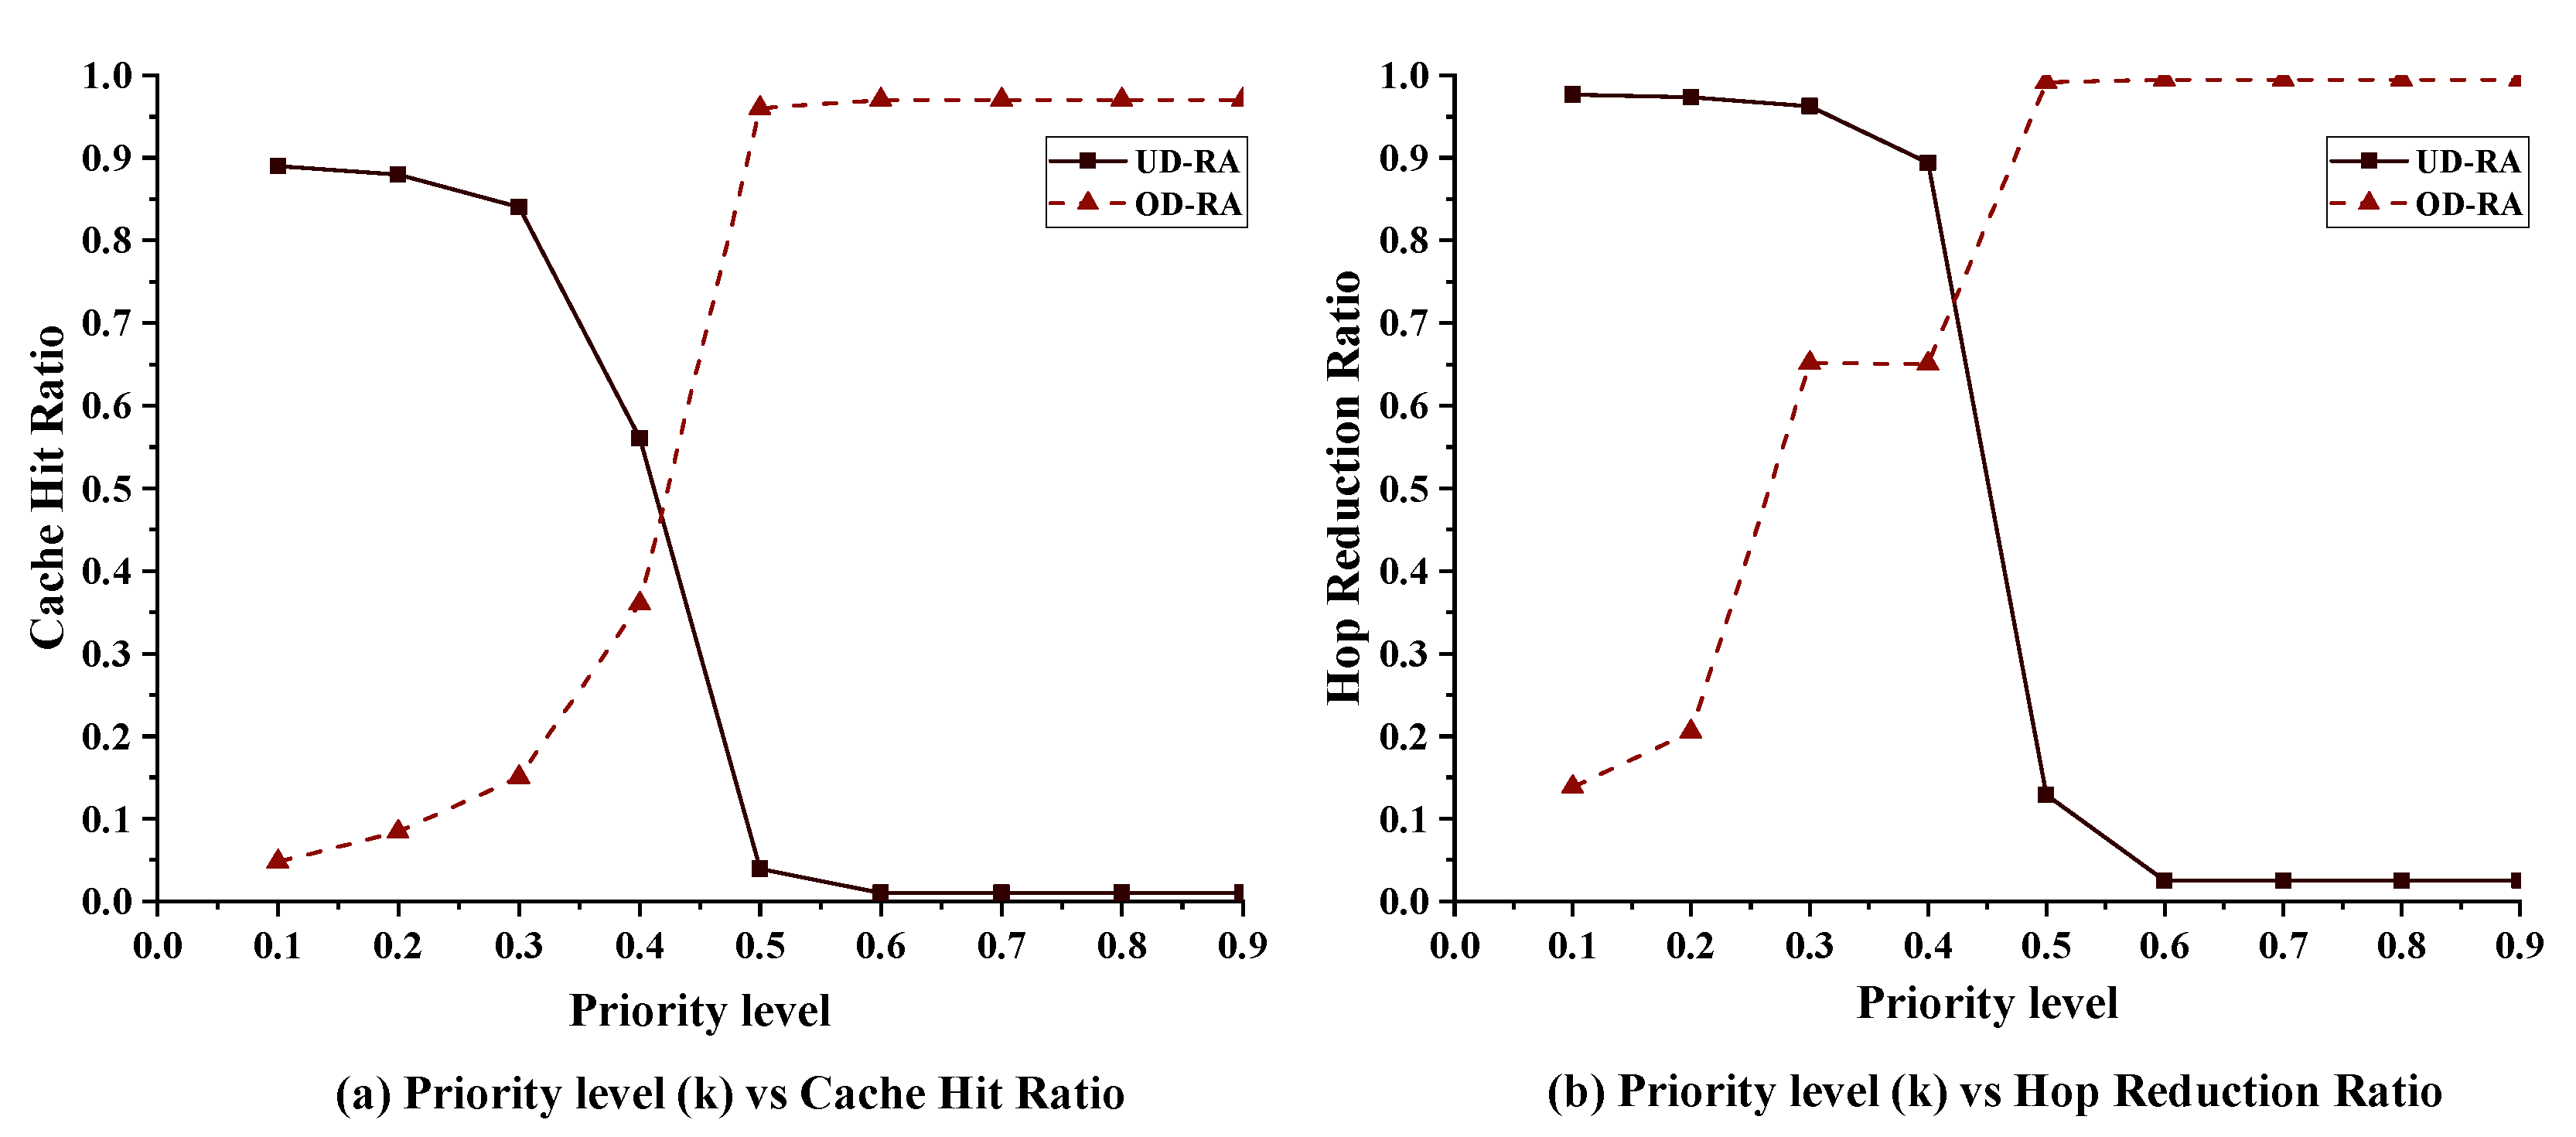
5.2.1. The Impact of the Priority Level on Performance
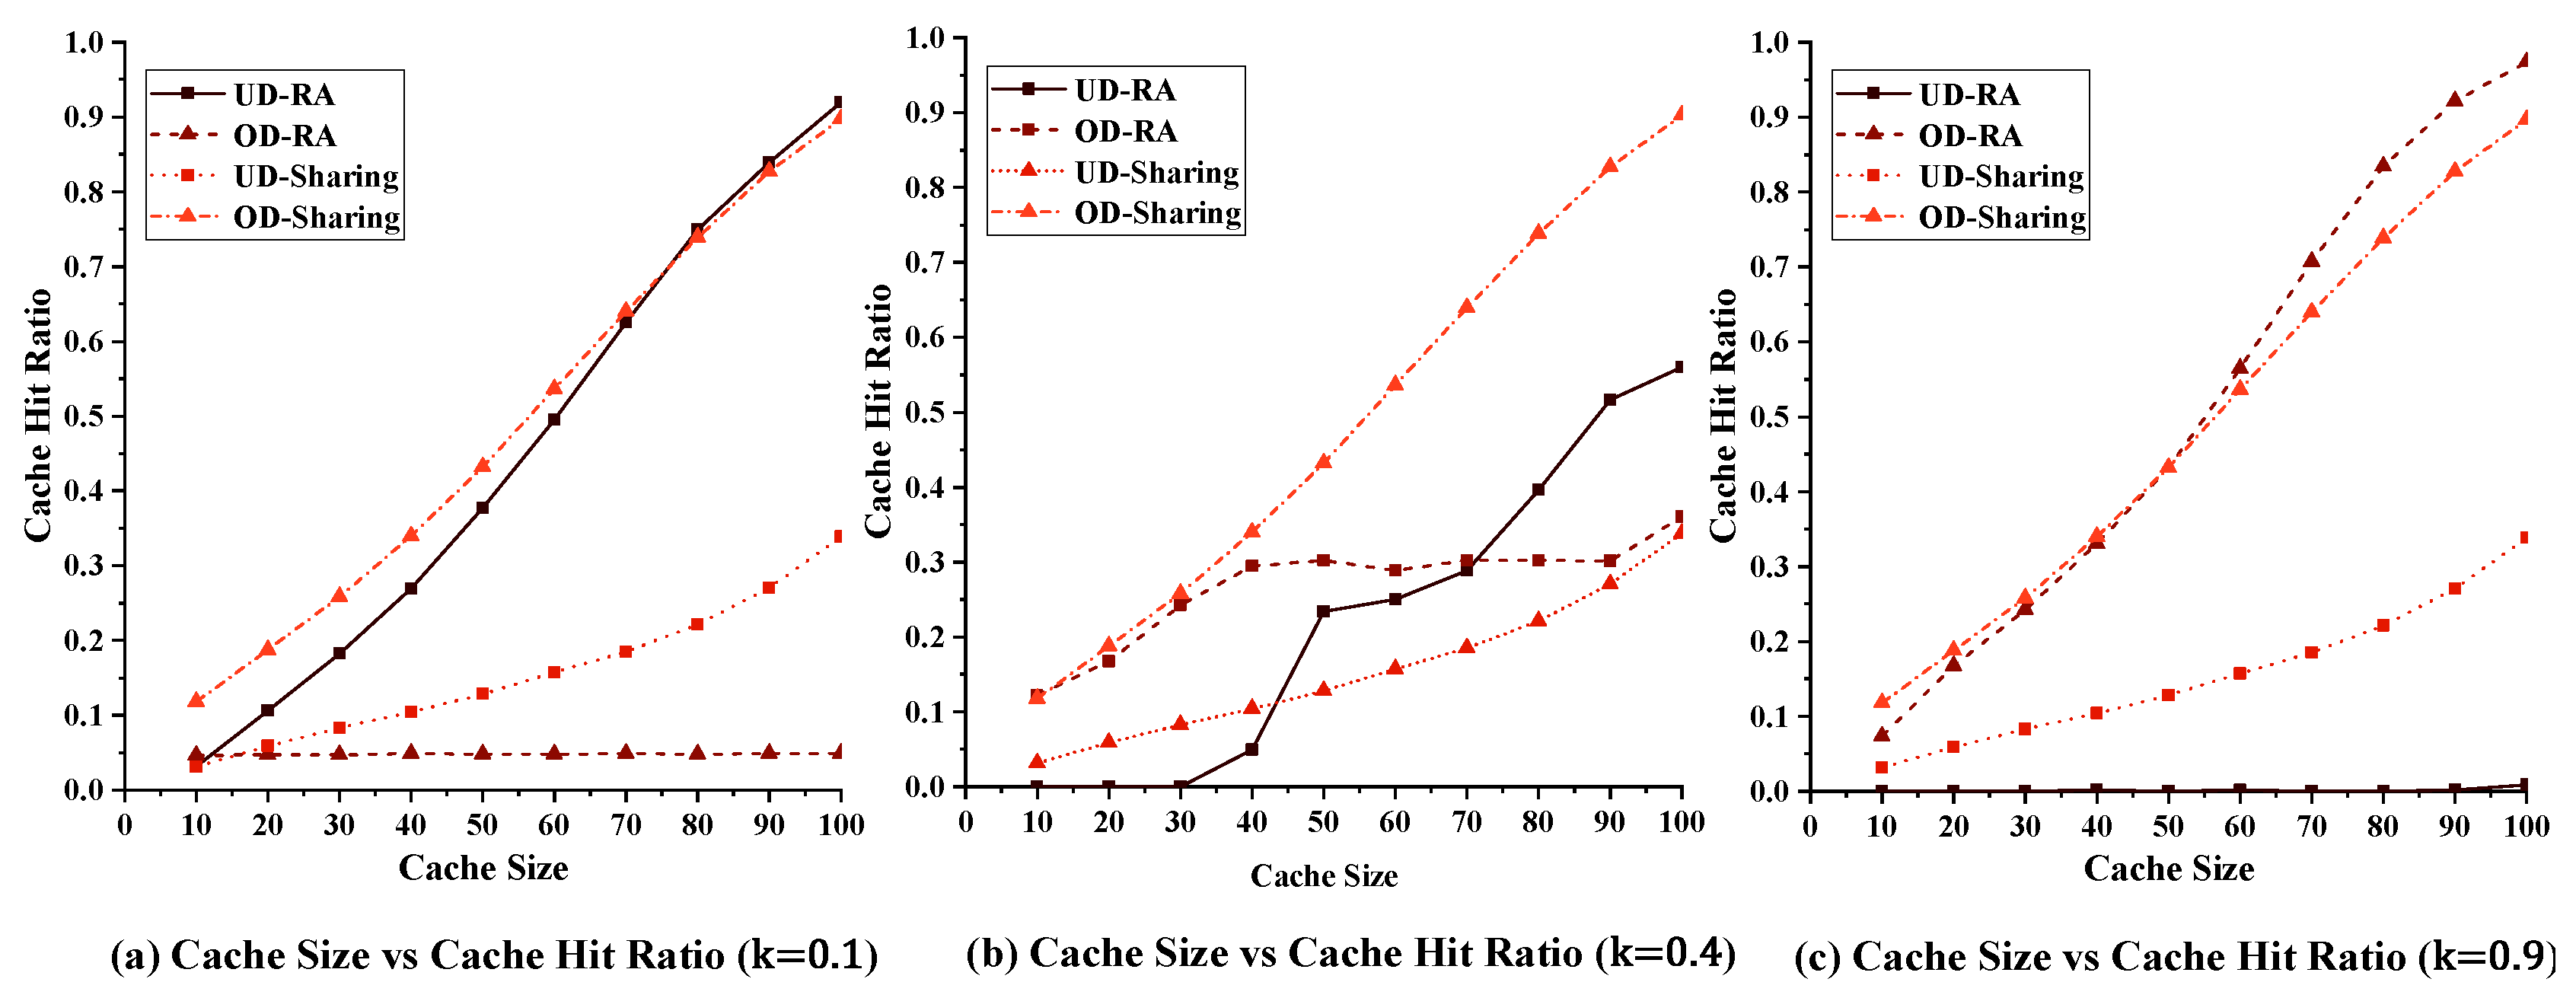
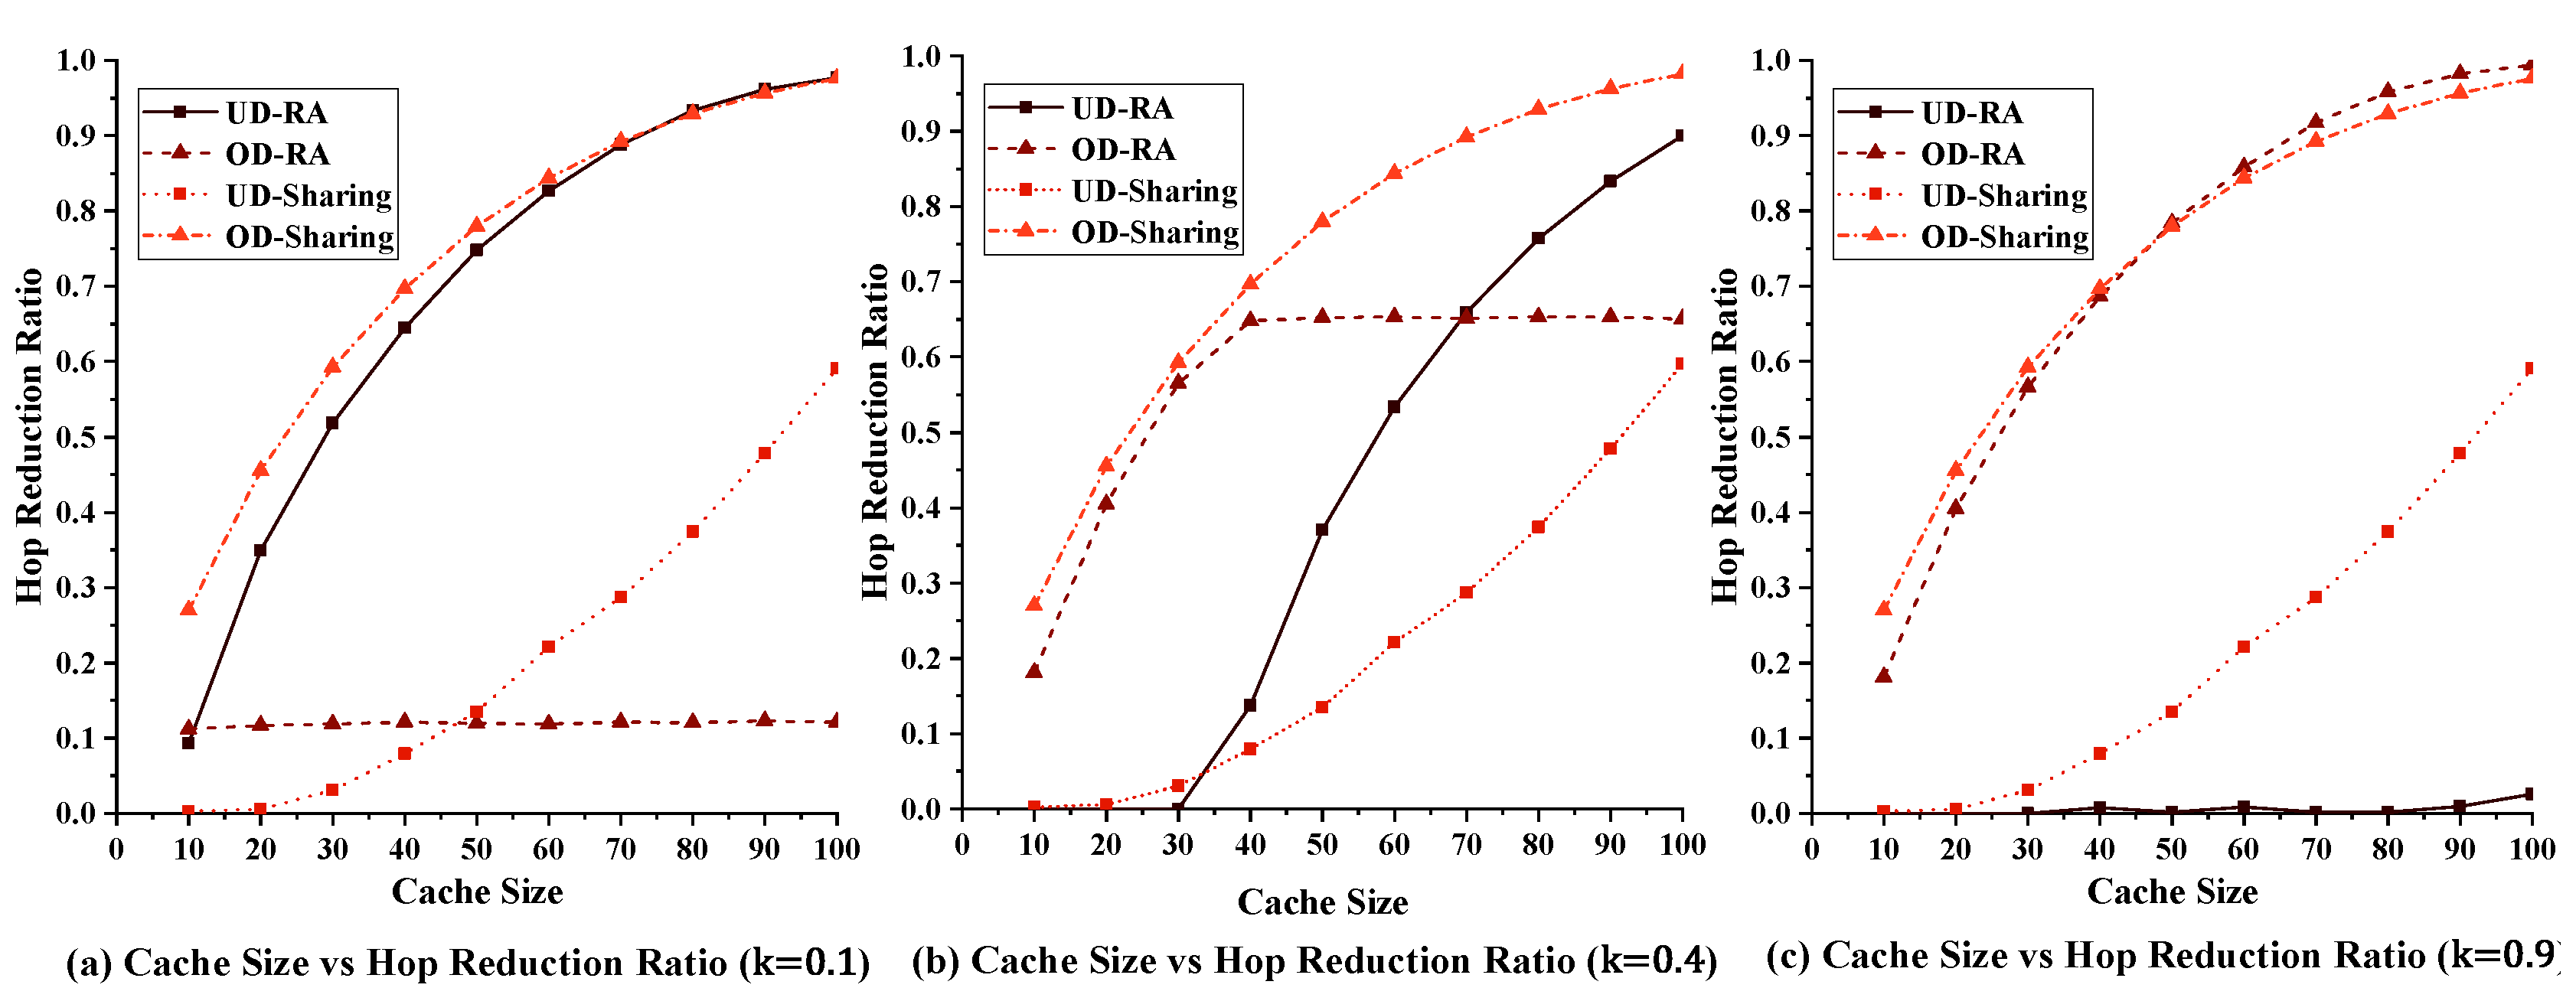
5.2.2. Impact of the Cache Size on the Performance of Our Strategy
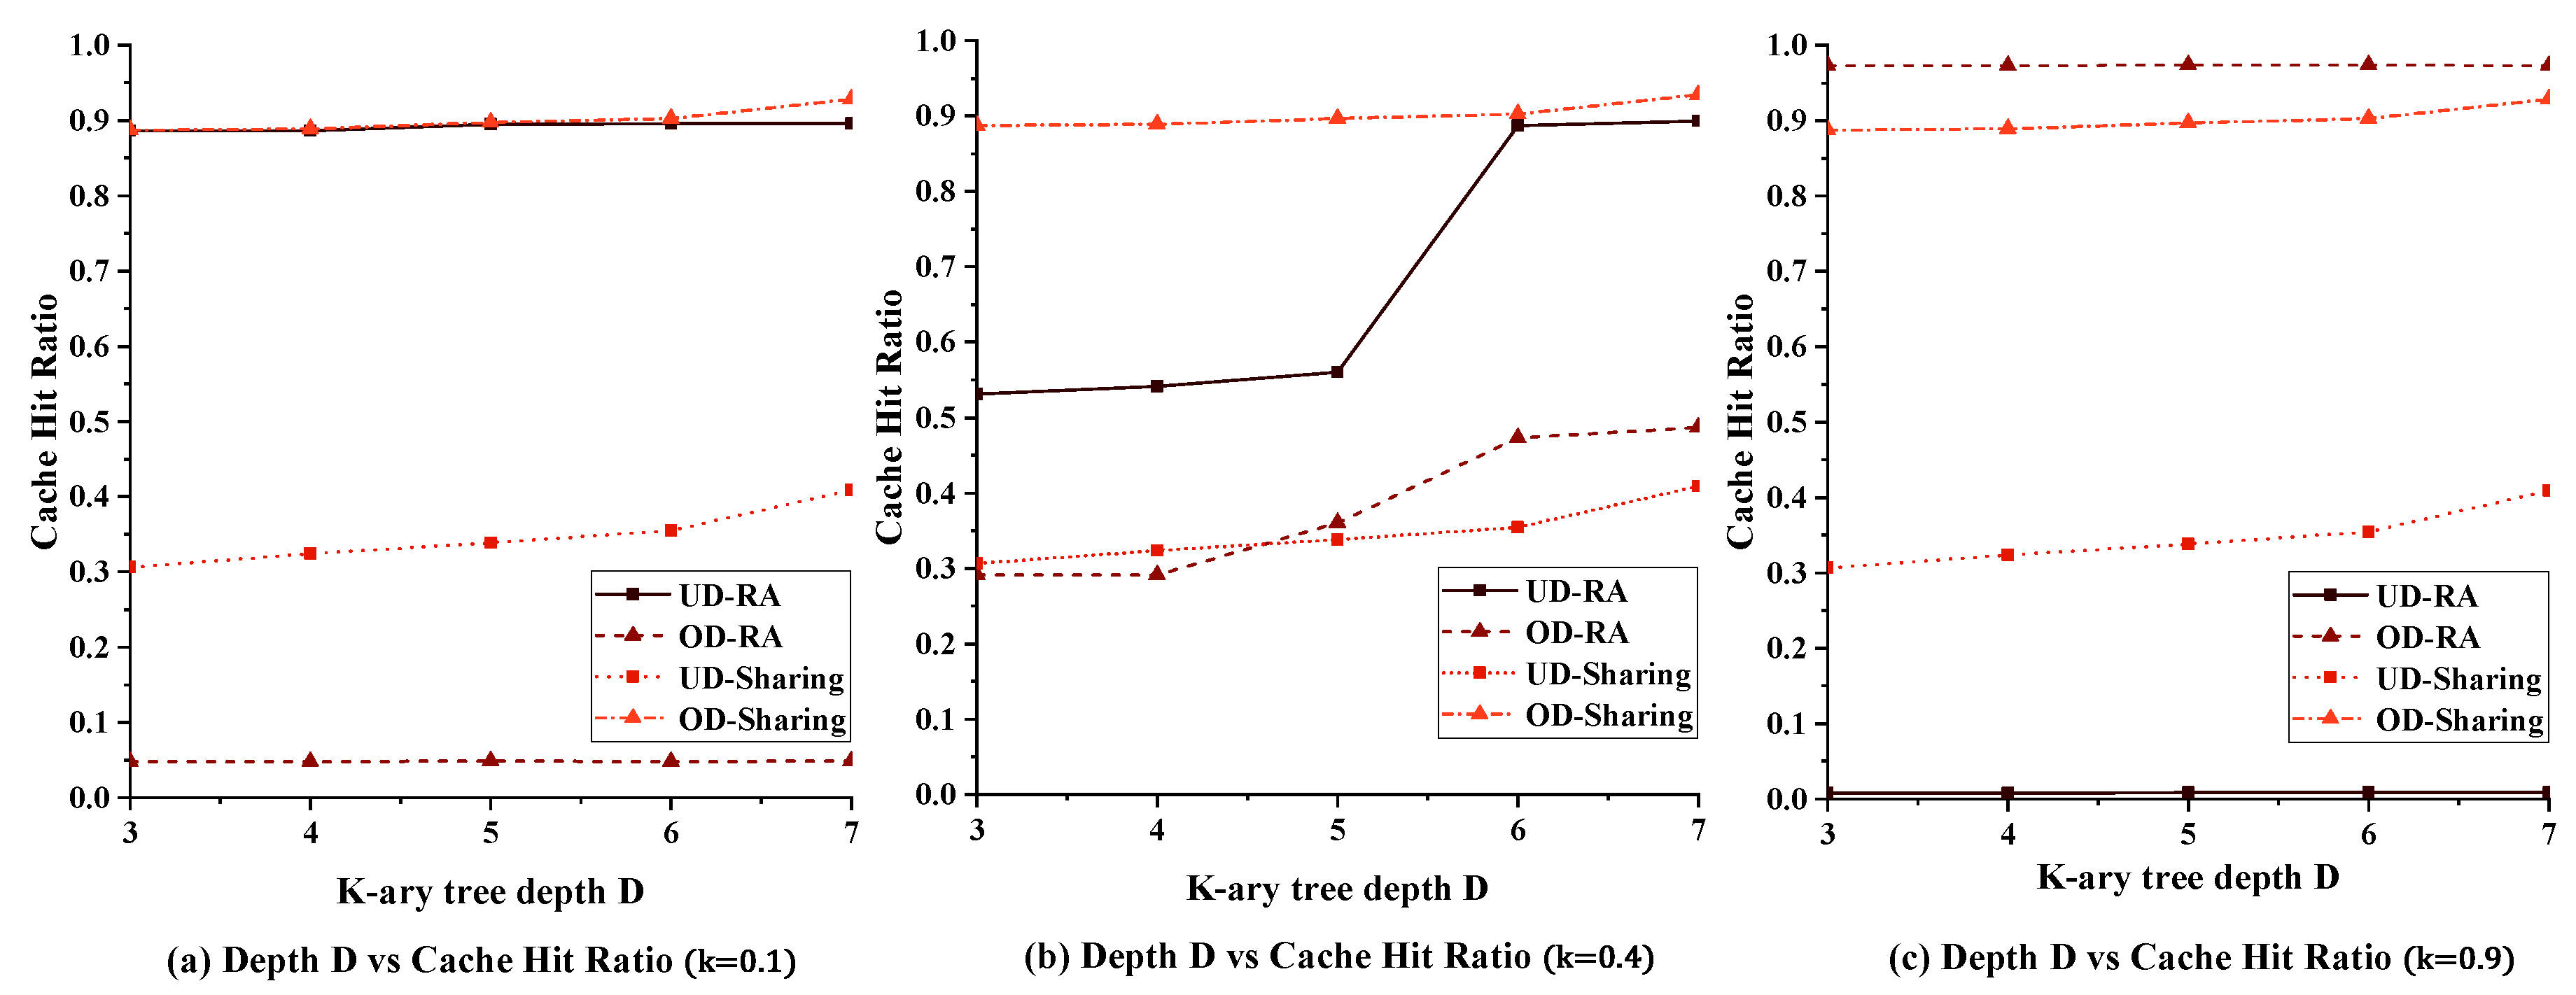
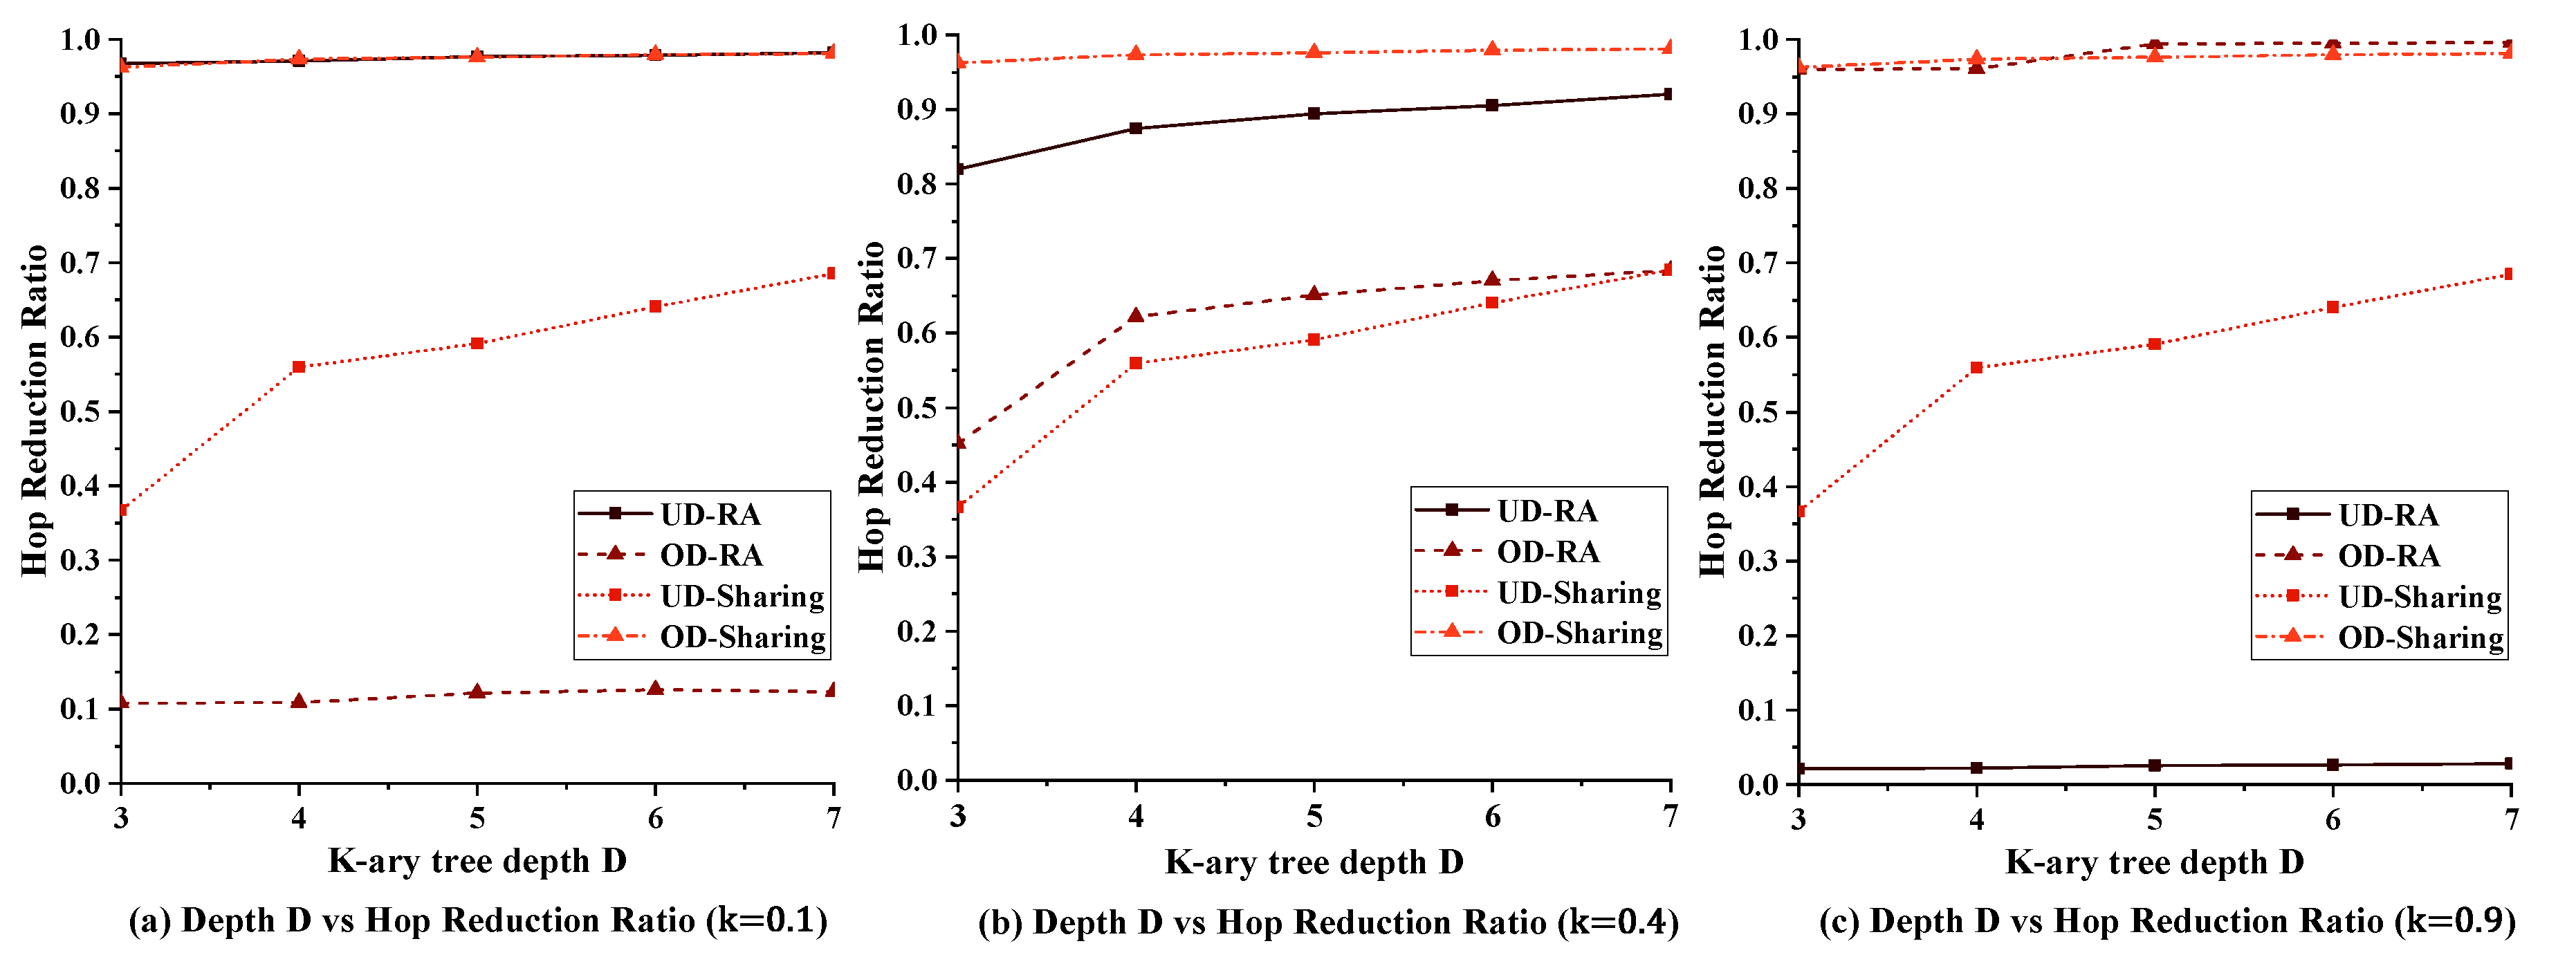
5.2.3. Impact of Tree Depth on Performance
6. Conclusions and Future Work
Author Contributions
Funding
Institutional Review Board Statement
Informed Consent Statement
Data Availability Statement
Conflicts of Interest
References
- Vasilakos, A.V.; Li, Z.; Simon, G.; You, W. Information centric network: Research challenges and opportunities. J. Netw. Comput. Appl. 2015, 52, 1–10. [Google Scholar] [CrossRef]
- Abdullahi, I.; Arif, S.; Hassan, S. Survey on caching approaches in information centric networking. J. Netw. Comput. Appl. 2015, 56, 48–59. [Google Scholar] [CrossRef]
- Zhang, L.; Afanasyev, A.; Burke, J.; Jacobson, V.; Claffy, K.; Crowley, P.; Papadopoulos, C.; Wang, L.; Zhang, B. Named data networking. ACM SIGCOMM Comput. Commun. Rev. 2014, 44, 66–73. [Google Scholar] [CrossRef]
- Ahmad, F.; Kerrache, C.A.; Kurugollu, F.; Hussain, R. Realization of blockchain in named data networking-based internet-of-vehicles. IT Prof. 2019, 21, 41–47. [Google Scholar] [CrossRef] [Green Version]
- Cisco Annual Internet Report (2018–2023) White Paper. Available online: https://www.cisco.com/c/en/us/solutions/collateral/executive-perspectives/annual-internet-report/white-paper-c11-741490.html (accessed on 12 December 2021).
- Kerrche, C.A.; Ahmad, F.; Elhoseny, M.; Adnane, A.; Ahmad, Z.; Nour, B. Internet of vehicles over named data networking: Current status and future challenges. In Emerging Technologies for Connected Internet of Vehicles and Intelligent Transportation System Networks; Springer: Cham, Switzerland, 2020; pp. 83–99. [Google Scholar]
- Psaras, I.; Chai, W.K.; Pavlou, G. In-network cache management and resource allocation for information-centric networks. IEEE Trans. Parallel Distrib. Syst. 2013, 25, 2920–2931. [Google Scholar] [CrossRef]
- Yao, J.; Yin, B.; Lu, X. A novel joint adaptive forwarding and resource allocation strategy for named data networking based on SMDP. In Proceedings of the 2016 12th IEEE International Conference on Control and Automation (ICCA), Kathmandu, Nepal, 1–3 June 2016; pp. 956–961. [Google Scholar]
- Li, C.; Xie, R.; Huang, T.; Huo, R.; Liu, J.; Liu, Y. Joint Forwarding Strategy and Resource Allocation in Information-Centric HWNs. In Proceedings of the GLOBECOM 2017-2017 IEEE Global Communications Conference, Singapore, 4–8 December 2017; pp. 1–6. [Google Scholar]
- Yuan, D.; Xu, Y.; Ran, J.; Hu, H.; Liu, Y.; Li, X. An optimal fair resource allocation strategy for a lightweight content-centric networking architecture. In Proceedings of the 2017 3rd IEEE International Conference on Computer and Communications (ICCC), Chengdu, China, 13–16 December 2017; pp. 573–577. [Google Scholar]
- Zhang, Y.; Tan, X.; Li, W. In-network cache size allocation for video streaming on named data networking. In Proceedings of the 2017 VI International Conference on Network, Communication and Computing, Kunming, China, 8–10 December 2017; pp. 18–23. [Google Scholar]
- Ehsanpour, M.; Bayat, S.; Hemmatyar, A.M.A. On Efficient and Social-Aware Object Allocation in Named Data Networks Using Matching Theory. In Proceedings of the 2018 IEEE Symposium on Computers and Communications (ISCC), Natal, Brazil, 25–28 June 2018; pp. 298–303. [Google Scholar]
- Zhang, M.; Xie, P.; Zhu, J.; Wu, Q.; Zheng, R.; Zhang, H. NCPP-based caching and NUR-based resource allocation for information-centric networking. J. Ambient. Intell. Humaniz. Comput. 2019, 10, 1739–1745. [Google Scholar] [CrossRef]
- Huo, R.; Xie, R.; Zhang, H.; Huang, T.; Liu, Y. What to cache: Differentiated caching resource allocation and management in information-centric networking. China Commun. 2016, 13, 261–276. [Google Scholar] [CrossRef]
- Yovita, L.V.; Syambas, N.R.; Edward, I.Y.M. CAPIC: Cache based on popularity and class in named data network. In Proceedings of the 2018 International Conference on Control, Electronics, Renewable Energy and Communications (ICCEREC), Bandung, Indonesia, 5–7 December 2018; pp. 24–29. [Google Scholar]
- Naeem, M.A.; Nor, S.A.; Hassan, S.; Kim, B.S. Compound popular content caching strategy in named data networking. Electronics 2019, 8, 771. [Google Scholar] [CrossRef] [Green Version]
- McCallum, A.; Nigam, K. A comparison of event models for naive bayes text classification. In Proceedings of the AAAI-98 Workshop, Madison, WI, USA, 26–27 July 1998; Volume 752, pp. 41–48. [Google Scholar]
- Dehghan, M.; Massoulie, L.; Towsley, D.; Menasche, D.S.; Tay, Y.C. A utility optimization approach to network cache design. IEEE/ACM Trans. Netw. 2019, 27, 1013–1027. [Google Scholar] [CrossRef]
- Situmorang, H.; Syambas, N.R.; Juhana, T.; Edward, I.Y.M. A Simulation of Cache Replacement Strategy on Named Data Network. In Proceedings of the 2018 12th International Conference on Telecommunication Systems, Services, and Applications (TSSA), Yogyakarta, Indonesia, 4–5 October 2018; pp. 1–4. [Google Scholar]
- Kim, J.; Ko, M.C.; Kim, J.; Shin, M.S. Route Prefix Caching Using Bloom Filters in Named Data Networking. Appl. Sci. 2020, 10, 2226. [Google Scholar] [CrossRef] [Green Version]
- Zaeem, R.N.; Barber, K.S. A Large Publicly Available Corpus of Website Privacy Policies Based on DMOZ. In Proceedings of the Eleventh ACM Conference on Data and Application Security and Privacy, Virtual, 26–28 April 2021. [Google Scholar]
- Mastorakis, S.; Afanasyev, A.; Zhang, L. On the evolution of ndnSIM: An open-source simulator for NDN experimentation. ACM SIGCOMM Comput. Commun. Rev. 2017, 47, 19–33. [Google Scholar] [CrossRef]
- Amadeo, M.; Ruggeri, G.; Campolo, C.; Molinaro, A. IoT services allocation at the edge via named data networking: From optimal bounds to practical design. IEEE Trans. Netw. Serv. Manag. 2019, 16, 661–674. [Google Scholar] [CrossRef]
- Chai, W.K.; He, D.; Psaras, I.; Pavlou, G. Cache “less for more” in information-centric networks (extended version). Comput. Commun. 2013, 36, 758–770. [Google Scholar] [CrossRef] [Green Version]
- Ren, J.; Qi, W.; Westphal, C.; Wang, J.; Lu, K.; Liu, S.; Wang, S. Magic: A distributed max-gain in-network caching strategy in information-centric networks. In Proceedings of the 2014 IEEE conference on computer communications workshops (INFOCOM WKSHPS), Toronto, ON, Canada, 27 April–2 May 2014; pp. 470–475. [Google Scholar]
- Hu, X.; Gong, J.; Cheng, G.; Fan, C. Enhancing in-network caching by coupling cache placement, replacement and location. In Proceedings of the 2015 IEEE International Conference on Communications (ICC), London, UK, 8–12 June 2015; pp. 5672–5678. [Google Scholar]


| Value | Meaning |
|---|---|
| The data in the space have an obvious importance in the network compared to the space. | |
| The data in the space have a higher importance in the network compared to the space. | |
| The data in the space have a low importance in the network compared to the space. | |
| The data in the space have the same importance in the network compared to the space. |
| Parameter | Default Value | Range |
|---|---|---|
| Tree-ary k | - | [0;5] |
| Tree depth D | 5 | [3;7] |
| node cache capacity | 100 | [10;100] |
| Priority level | 0.4 | [0.1;0.9] |
| Delay | 1 ms | - |
| Bandwidth | 10 Gbps | - |
Publisher’s Note: MDPI stays neutral with regard to jurisdictional claims in published maps and institutional affiliations. |
© 2022 by the authors. Licensee MDPI, Basel, Switzerland. This article is an open access article distributed under the terms and conditions of the Creative Commons Attribution (CC BY) license (https://creativecommons.org/licenses/by/4.0/).
Share and Cite
Herouala, A.T.; Kerrache, C.A.; Ziani, B.; Calafate, C.T.; Lagraa, N.; Tahari, A.e.K. Controlling the Trade-Off between Resource Efficiency and User Satisfaction in NDNs Based on Naïve Bayes Data Classification and Lagrange Method. Future Internet 2022, 14, 48. https://doi.org/10.3390/fi14020048
Herouala AT, Kerrache CA, Ziani B, Calafate CT, Lagraa N, Tahari AeK. Controlling the Trade-Off between Resource Efficiency and User Satisfaction in NDNs Based on Naïve Bayes Data Classification and Lagrange Method. Future Internet. 2022; 14(2):48. https://doi.org/10.3390/fi14020048
Chicago/Turabian StyleHerouala, Abdelkader Tayeb, Chaker Abdelaziz Kerrache, Benameur Ziani, Carlos T. Calafate, Nasreddine Lagraa, and Abdou el Karim Tahari. 2022. "Controlling the Trade-Off between Resource Efficiency and User Satisfaction in NDNs Based on Naïve Bayes Data Classification and Lagrange Method" Future Internet 14, no. 2: 48. https://doi.org/10.3390/fi14020048
APA StyleHerouala, A. T., Kerrache, C. A., Ziani, B., Calafate, C. T., Lagraa, N., & Tahari, A. e. K. (2022). Controlling the Trade-Off between Resource Efficiency and User Satisfaction in NDNs Based on Naïve Bayes Data Classification and Lagrange Method. Future Internet, 14(2), 48. https://doi.org/10.3390/fi14020048