1. Introduction
Presently, geographic positioning and mobility information play a key role in the field of big data analysis. Indeed, several analytical tools and methodologies have been successfully applied to these data in order to extract knowledge in many fields, such as road traffic, human mobility, and currency circulation. An example of one of these techniques, which has been adopted to estimate the typical distance traveled by an individual (or to accomplish other tasks in the context of mobility), is the Radius of Gyration (RoG) [
1,
2,
3].
Despite the above mentioned analyses enabling researchers to discover relevant insights and make contribution in several scientific domains, they, however, have been rarely applied outside the geographic realm. Indeed, we have not found many works in the literature concerning the application of mobility and geographic techniques outside such scenarios, although they, ideally, can be adopted to retrieve information also in other fields, whenever an appropriate form of a geometric space is given.
An interesting field, in which mobility techniques have never been applied, to the best of our knowledge, is the semantic realm. In this context, the usage of the so-called
word embeddings, usually based on neural networks, such as Word2vec [
4] or BERT [
5], allows encoding relevant features for text classification and mining into vectors of a multi-dimensional space. More precisely, such algorithms are fed with a corpus of sentences in order to create a model (i.e., semantic or embedding space) in which semantically related words are mapped to nearby points. In the resulting semantic space, the notion of proximity between two points (i.e., the multi-dimensional vectors) reflects a similarity relation among terms, and thus it is possible to cluster similar words into topics. For this reason, geographic techniques can be used to extract knowledge with a mobility perspective. This means that is possible to analyze how the authors virtually travel along the topics’ space. This last idea, i.e., to exploit the vector space obtained with word embedding based on neural network looking for latent trajectories, has been poorly investigated in the literature.
To address this intriguing goal, we consider the world of scientific research activities, traced by scholarly articles, as a paradigmatic case of study, since they often represent a notable and exciting raw material for data analysis. In particular, the proposed case study tracks the papers of the world’s most highly cited researchers (according to Clarivate Analytics), obtained by systematic queries on Scopus [
6], which is a well-known and vast repository of metadata related to scientific works. Moreover, we compared the embeddings obtained training the Word2vec algorithm and the ones using a pre-trained Siamese BERT called SBERT that is a modification of the pretrained BERT network that uses siamese and triplet network structures to derive semantically meaningful sentence embeddings [
7]. We used SBERT rather than a single BERT because of the computational efficiency demonstrated from this architecture to compute the embeddings. We applied the two embedding learning models to a large corpus of abstracts and keywords of scholarly articles in order to build a semantic space. In the obtained model, the semantic mobility of authors across different research topics can be estimated with analytical tools traditionally applied on geographic data.
In particular, starting from the Clarivate Analytics highly cited researchers list, we select a group of authors and a subset of their papers. For each author α and year γ in the time interval [2005, 2015], the embedding algorithms are fed with words contained in the abstract and keywords of the author’s papers published in year γ. This way, we generate a sequence of points in the semantic space, where each point is associated with one year of the proposed interval of time and represents the author “average topic” for the related year. On this basis, we perform a dynamic analysis, measuring the Radius of Gyration as an index of the mobility volume of each researcher across scientific topics. The new knowledge, which we aim to discover in this domain and with the presented assumptions, turns around a simple question: can we predict a researcher’s success, just by observing their attitude to explore new research topics? The answer can be related to the concept of mobility volume, computed in a semantic space rather than a geographic one.
As a novel contribution, this work brings to light multiple novel and insightful results, which show some intrinsic properties of the model, including: (i) the correlation between the scientific mobility in the space of the case study and the reach of scientific results, measured through the H-index; (ii) some differences in the behavior of researchers working in different countries and subjects; and (iii) some interesting similarities between mobility patterns in this semantic realm and those typically observed in the case of geographic mobility.
The rest of the paper is organized as follows. The next section discusses the main related works. Then,
Section 3 presents the algorithms and the tools adopted to extract latent knowledge from scholarly activities.
Section 4 is devoted to the description of the methodological and practical aspects of the research. In
Section 5, results and some examples of latent knowledge which can be extracted from the selected data are presented. In the last section, some concluding remarks are outlined.
2. Related Works
In this section, we propose a literature review following three main directions: Human mobility techniques, word embedding and trajectories representation learning and finally some other works related to the use case of scholars. A part of giving a comparison between our approach and others in the literature, we would like to highlight that to the best of our knowledge this work is the first that propose a methodology to combine trajectories in a semantic realm and human mobility techniques to perform directly knowledge extraction. Since data are being produced and collected at increasing volumes, automatic knowledge discovery and data mining are becoming more and more important. In particular, in the context of Big Data mining, the ability to retrieve information, insights and values from data, in its heterogeneous forms, is crucial. This task represents a challenge since decades, with the aim to find a trade-off between automatic knowledge discovery and performance of tools and techniques able to give a productive representation of knowledge. In [
8], the authors already discussed the need for computational theories and tools to assist humans in the extraction of useful information from the rapidly growing volumes of digital data. Several attempts were presented in the literature in different domains, with a particular attention on ways to extract information from text data exploiting semantic properties. For example, in [
9], the authors analyzed healthcare scientific publications to understand directly which methodologies are most used in a field and what is the status of research reached to help stakeholder to plan research funding.
Recently, two other research works highlighted the importance of exploiting neural network embedding techniques to extract new knowledge: In [
10], Tshitoyan et al. presented interesting results in terms of knowledge extraction by applying word2vec to the analysis of the materials science scientific literature. They demonstrate that embeddings capture complex materials science concepts such as the underlying structure of the periodic table and structure–property relationships in materials. Furthermore, they demonstrated that an unsupervised method can recommend materials for functional applications several years before their discovery. Finally, in [
11], the authors exploited different word embedding techniques to discover latent information in the financial reports of companies traded in the US stock market. They demonstrated that neural network embedding techniques outperform other traditional methods when applied to track document similarity and changes in their reports associated with abnormal returns in the stock exchange. Neural network embedding techniques are gaining always more attention also for their ability of encoding non-euclidean structures like networks [
12], knowledge graphs and dynamic graphs [
13] where random walks among nodes are treated as documents where the words are represented by the network’s vertices. These techniques on graphs can be applied to analyze big data collections for knowledge discovery (i.e., drug discovery [
14], protein classification [
15], finance [
16], Social Network Analysis [
17]).
At the same time, the study of human mobility in terms of trajectories has become very important for applications such as estimating migratory flows, traffic forecasting, urban planning, and epidemic modeling [
2,
3]. Mobility is often estimated using the so-called Radius of Gyration (RoG), which is a measure of mobility volume and indicates the characteristic distance traveled by an individual [
1]. In [
18], the Radius of Gyration is used to characterize human mobility patterns emerging from available GPS trajectories. In [
19], starting from nation-wide mobile phone data, authors investigate the correlations between the Radius of Gyration and external socio-economic indicators.
In light of this, the idea of combining tools from human mobility into knowledge extraction from text is a promising research direction. In [
20], RoG is used on geo-localized data from Twitter to study urban systems and human dynamics to help urban planning and policy making. However, these tools can be an appropriate choice also when a geographic or spatial reference is missing in the given domain. In this case, the definition of a geometric space depends on the task and on the available data. Recently, several works leverage word embedding spaces to get insights from text. Word embedding algorithms provide a framework where semantic distances among terms can be evaluated. These computationally efficient predictive models turn words or phrases into vectors of real numbers in a multi-dimensional space, where semantically related words are mapped to nearby points [
21,
22]. Among those algorithms, Word2Vec [
23] has reached the status of a consolidated tool. Word embedding approach has been already considered in the trajectory domain mostly for trajectory representation learning. In [
24], the authors demonstrate that a representation for spatial trajectories can be learned using Word2vec by clustering GPS coordinates and exploiting this form to see trajectories as word sentences. These embeddings are then used to predict users’ demographic information. A very similar approach is presented also in [
25] where the goal is to learn a representation from people’s trajectories with a neural network to identify and predict social lifestyles. However, all of these approaches consider always trajectories in the geographic realm.
In [
26], word embedding is used for topic modeling to analyze and explain the behavior of the CiteScore metrics for journals indexed in Scopus in 2017 and to get statistics about the impact of topics. In [
27], the authors demonstrated how the semantic space built with Word2Vec on large corpora, combined with network science tools (such as degrees, distances and clustering coefficient) can be relevant for knowledge discovery. All of this progress in knowledge extraction, human mobility and in Natural Language Processing, motivates our choice of investigating neural network embedding spaces with Radius of Gyration, to exploit the semantic space and its vector properties.
As a separate research area, several works are conducted in the field of knowledge discovery from bibliographic databases [
28,
29]. Scopus, together with Web of Science, represents one of the most authoritative bibliographic databases [
30]. In addition to the abstracts of articles, it provides access to the references included in those articles, allowing users to search both forward and backward in time [
31].
In [
32], data mining techniques are applied to gather and analyze data from the Scopus repository. A social graph of scientific authors is created, starting from citations among the articles. Moreover, using data mining techniques, some relevant research topics are inferred for each author, from the textual analysis of the abstracts of their articles. The study shows the emergence of some clusters of topics, which are studied by distinct groups of authors.
In [
33], the relation between interdisciplinarity and citation impact of individual publications is analyzed for four different scientific fields. Thus, the study does not analyze researchers’ mobility across topics, but the impact of multidisciplinary and cross-topic research. The article is relevant because it finds results that are somewhat similar to those highlighted in our own study. In general, interdisciplinarity is seen as a highly positive criterion for obtaining the most prestigious grants. However, the authors observe that, although the combination of multiple fields has a positive effect in creating new knowledge, successful research is best achieved by focusing on related fields of knowledge. Instead, interdisciplinary research in fields that are very different could have a higher chance to fail. On the other hand, those results may suggest that the scientific community is reluctant to cite heterodox articles that mix highly disparate bodies of knowledge, thus giving less credit to publications that are too innovative or stimulating. The conclusion of the article is that the practice of “proximal” interdisciplinarity pays off in quotations, while highly interdisciplinary researches are not rewarded with citation success. Similarly, our research shows that although some mobility may demonstrate some curiosity in the academic world, this does not pay in terms of a scholar’s impact factor.
A stimulating study, which analyzes the reasons for these results, is described in [
34]. The article analyzes the way in which scholars explore the scientific landscape, or choose research topics to work on. Scientific literature is seen as a partially revealed landscape, in which scholars, considered to be agents in this context, continue to reveal hidden knowledge by exploring new research themes. Through the researchers’ strategic behavior in the choice of topics to work on, the authors bring out, grow, support or decay the topics characterizing the evolution of scientific research. The proposed framework assumes that scholars have different goals, such as surviving for a long time in the academic community or achieving greater scientific significance. Eventually, the strategies they put in place can provide a balance between individual scientific success and the efficiency and diversity of the whole academic society. The article proposes four types of scholars who play different roles: experts lead scholars to topics with high research potentials, mavericks are the pioneers of novel topics, followers and conservatives embrace the wisdom of crowds. The authors concludes that the ratio of scholars adopting certain strategies has a significant impact on the health and progress of the scientific community, and could be a factor to be taken into consideration if we wish to promote multidisciplinary research and exchange of knowledge among researchers in different fields.
Thus, many research works dealing with big data are based on geographic positioning and mobility information, which are being studied with different analytical tools and methodologies. However, all those approaches rarely find an application outside of the geographic realm and virtually none tries to apply the concept of mobility in the semantic space of research topics, as shown in
Table 1. On the other hand, studies on knowledge discovery from bibliographic databases are conducted as a completely separate research area. Furthermore, among much relevant research, to our knowledge, virtually none has taken into account any semantic mobility metrics, or even the simple inclination to change the focus on different research topics during a scholar’s academic career. In fact, this is the main aim and the main scientific contribution of this research work.
Table 1, which organizes related works according to their topic and methodology, also highlights the novelty of our work with respect to the state of the art.
4. Methodology
In this section, we present the methodological steps have been followed to collect and transform data and to generate the semantic space to perform the mobility analysis.
Data Collection: We collect all the abstracts and key-words from the papers published by the authors in the considered time interval and the relevant features about each scholar. This step aims to collect the raw dataset that is likely to contain relevant patterns;
Data Preprocessing: The preprocessing phase increases the quality of the textual data and allows one to reach better results in the following steps, removing noise and incomplete data; In particular NLP techniques are applied to transform data in the necessary form required by the embedding algorithms (Tokenization, Stemming, Stop words removal).
Generation of the Semantic Space: in this step, the Word2Vec algorithm and independently SBERT are used to create the respective semantic spaces;
Evaluation of Scholars’ Locations: for each author, the scientific production is used to compute the “average topic” in the semantic space for each year. Coordinates for each year work as locations in the time in the semantic space;
Estimation of trajectories and mobility: a dynamic analysis is conducted, measuring the Radius of Gyration as an index of the mobility volume of each researcher across scientific topics. We estimated the RoG using both the Word2Vec space and the SBERT one.
At an abstract level, these phases are organized according to Algorithm 1. Each phase is described in detail in one of the following subsections.
| Algorithm 1 Pseudo-code for analyzing scholars’s trajectories and mobility (case study). |
- 1:
functionCalculatePath() - 2:
▷ Map: time → coordinates - 3:
for all do - 4:
- 5:
- 6:
for all do - 7:
▷ Get coordinates from embedding - 8:
- 9:
end for - 10:
- 11:
end for - 12:
return - 13:
end function - 14:
- 15:
functionAnalyzeScholarsMobility() - 16:
▷ Whole corpus - 17:
for all do - 18:
- 19:
end for - 20:
▷ Map: lemma → coordinates - 21:
- 22:
▷ Map: scholar → mobility - 23:
▷ Map: scholar → hIndex - 24:
▷ All scholars’ paths - 25:
for all do - 26:
- 27:
- 28:
- 29:
- 30:
- 31:
- 32:
- 33:
end for - 34:
▷ Data mining - 35:
▷ Data mining - 36:
end function
|
where:
is a scholar’s set of articles, is a set of timepoints (samples) and is a set of scholars;
is the semantic model obtained with the word embedding algorithm;
is the whole corpus of texts (used both for training the word embedding model and for data mining);
is a path, which associates each timepoint in with a point in the embedding space;
is a set of points in the embedding space, reprenting the words collected for a given timepoint;
is the publication date of the article a;
is the set of authors of the article a.
4.1. Data Collection
To investigate the correlation between the mobility in the topic space and the success in scientific research, 2998 authors were selected from the 3500 “Highly Cited Researchers” list provided by Clarivate Analytics (
https://clarivate.com/, accessed on 8 January 2022). This annual list collects leading researchers in the sciences and social sciences from around the world. Starting from this set of researchers, a data collection phase is performed from Scopus using the Elsevier developer’s API. For each author, the following information is collected:
Details of each article, such as abstract, keywords, year of publishing;
Temporal range of activity;
H-index metric;
Nationality and affiliation.
This primary data collection phase has two main purposes:
Collect textual data to train the word embedding models, in order to obtain an accurate semantic space of topics;
Collect information about researchers, which will be used in the Data Mining phase to study the hidden relation between an author’s mobility across topics and the success in scientific research.
After performing the collection phase, the data are further processed with the aim of collecting comparable information. In fact, in order to have a fair comparison among researchers’ successes, it is necessary to consider a common period of work activity. In light of this, only authors who have published for at least six years in the period between 2005 and 2015 are selected. For each author, the H-index metric is recalculated, considering only the scientific contribution in the considered period.
The resulting number of selected works is 606,605, with 113 million of non-unique words from abstracts and keywords of the collected papers.
4.2. Data Preprocessing
This phase aims to clean the data previously collected in order to increase the performance of the word embedding models. With this aim, standard Natural Language Processing (NLP) techniques are applied to the textual data. In particular, special characters and capitalization are removed. A stop words filter is applied to remove words which do not convey significant meaning (i.e., articles, prepositions). Only for Word2Vec, a stemming algorithm is used to reduce inflected words to their word stem, base, or root form. Generally, in an NLP preprocessing phase, it is also important to deal with N-grams, which are words obtained by a composition of N words, i.e., “New York” or “New York Times”. For example, in the sentence “I have bought a new car”, the word “new” has its meaning (adjective in this case). Conversely, in the sentence “I have been in New York” we should consider the word “New_York” as a whole. The aim is to preserve the words “New” and “York” when they appear separately, but also to recognize the name “New_York” as a single entity (in the model, all letters are converted into their lowercase form).
4.3. Generation of the Semantic Space
In this phase, Word2Vec and SBERT are used to extract the semantic coordinates of each topic and creating the respective semantic spaces. A main difference between the two models should be now highlighted. Word2Vec aims to learn word representations but not sentence embedding directly: to obtain the document vector it is necessary to sum or average all the words vectors that compose a sentence (document). This approach is also used in an extension of Word2Vec called Doc2Vec. On the other hand, SBERT requires fewer hyper-parameters selected for its pre-trained nature and it directly obtains sentence embeddings. For this reason, we trained Word2Vec by also selecting its parameters and we only fine-tuned SBERT with our dataset.
The most important parameters of the Word2Vec implementation in Gensim library, that have been changed from the default value, are:
size = 600;
min count = 300;
window size = 132.
We experimented systematically with different values for
min count and
size before selecting the most suitable for our model. To control this process, we have used a Python implementation of t-SNE (sklearn.manifold.TSNE (
http://scikit-learn.org/stable/modules/generated/sklearn.manifold.TSNE.html, accessed on 8 January 2022)) to visualize the Word2Vec model topics data in a 2D plot. The
window size parameter is set as the average number of words (132) contained in all the abstracts and keywords of the considered papers. With this choice, words coming from the same paper (words of abstracts and keywords) tend to be related to each other. After the creation of the model, the vocabulary contains 13187 unique words.
After the training phase, the model can express a numerical distance between two vectors, which represent two words (topics). Some examples of distances expressed as cosine similarity values are shown in the following:
care, health_care = 0.302976
volume, distribution = 0.004110
4.4. Evaluation of Scholars’ Locations
The Word2vec-obtained model holds a vocabulary of words. Each word is represented by a multi-dimensional vector of 600 coordinates. For each active year of an author, words that come from all preprocessed abstracts and keywords of their published papers are collected, if they belong to the model. Then, the geometric center (
, for the i-th year) of the coordinates of the selected words is calculated.
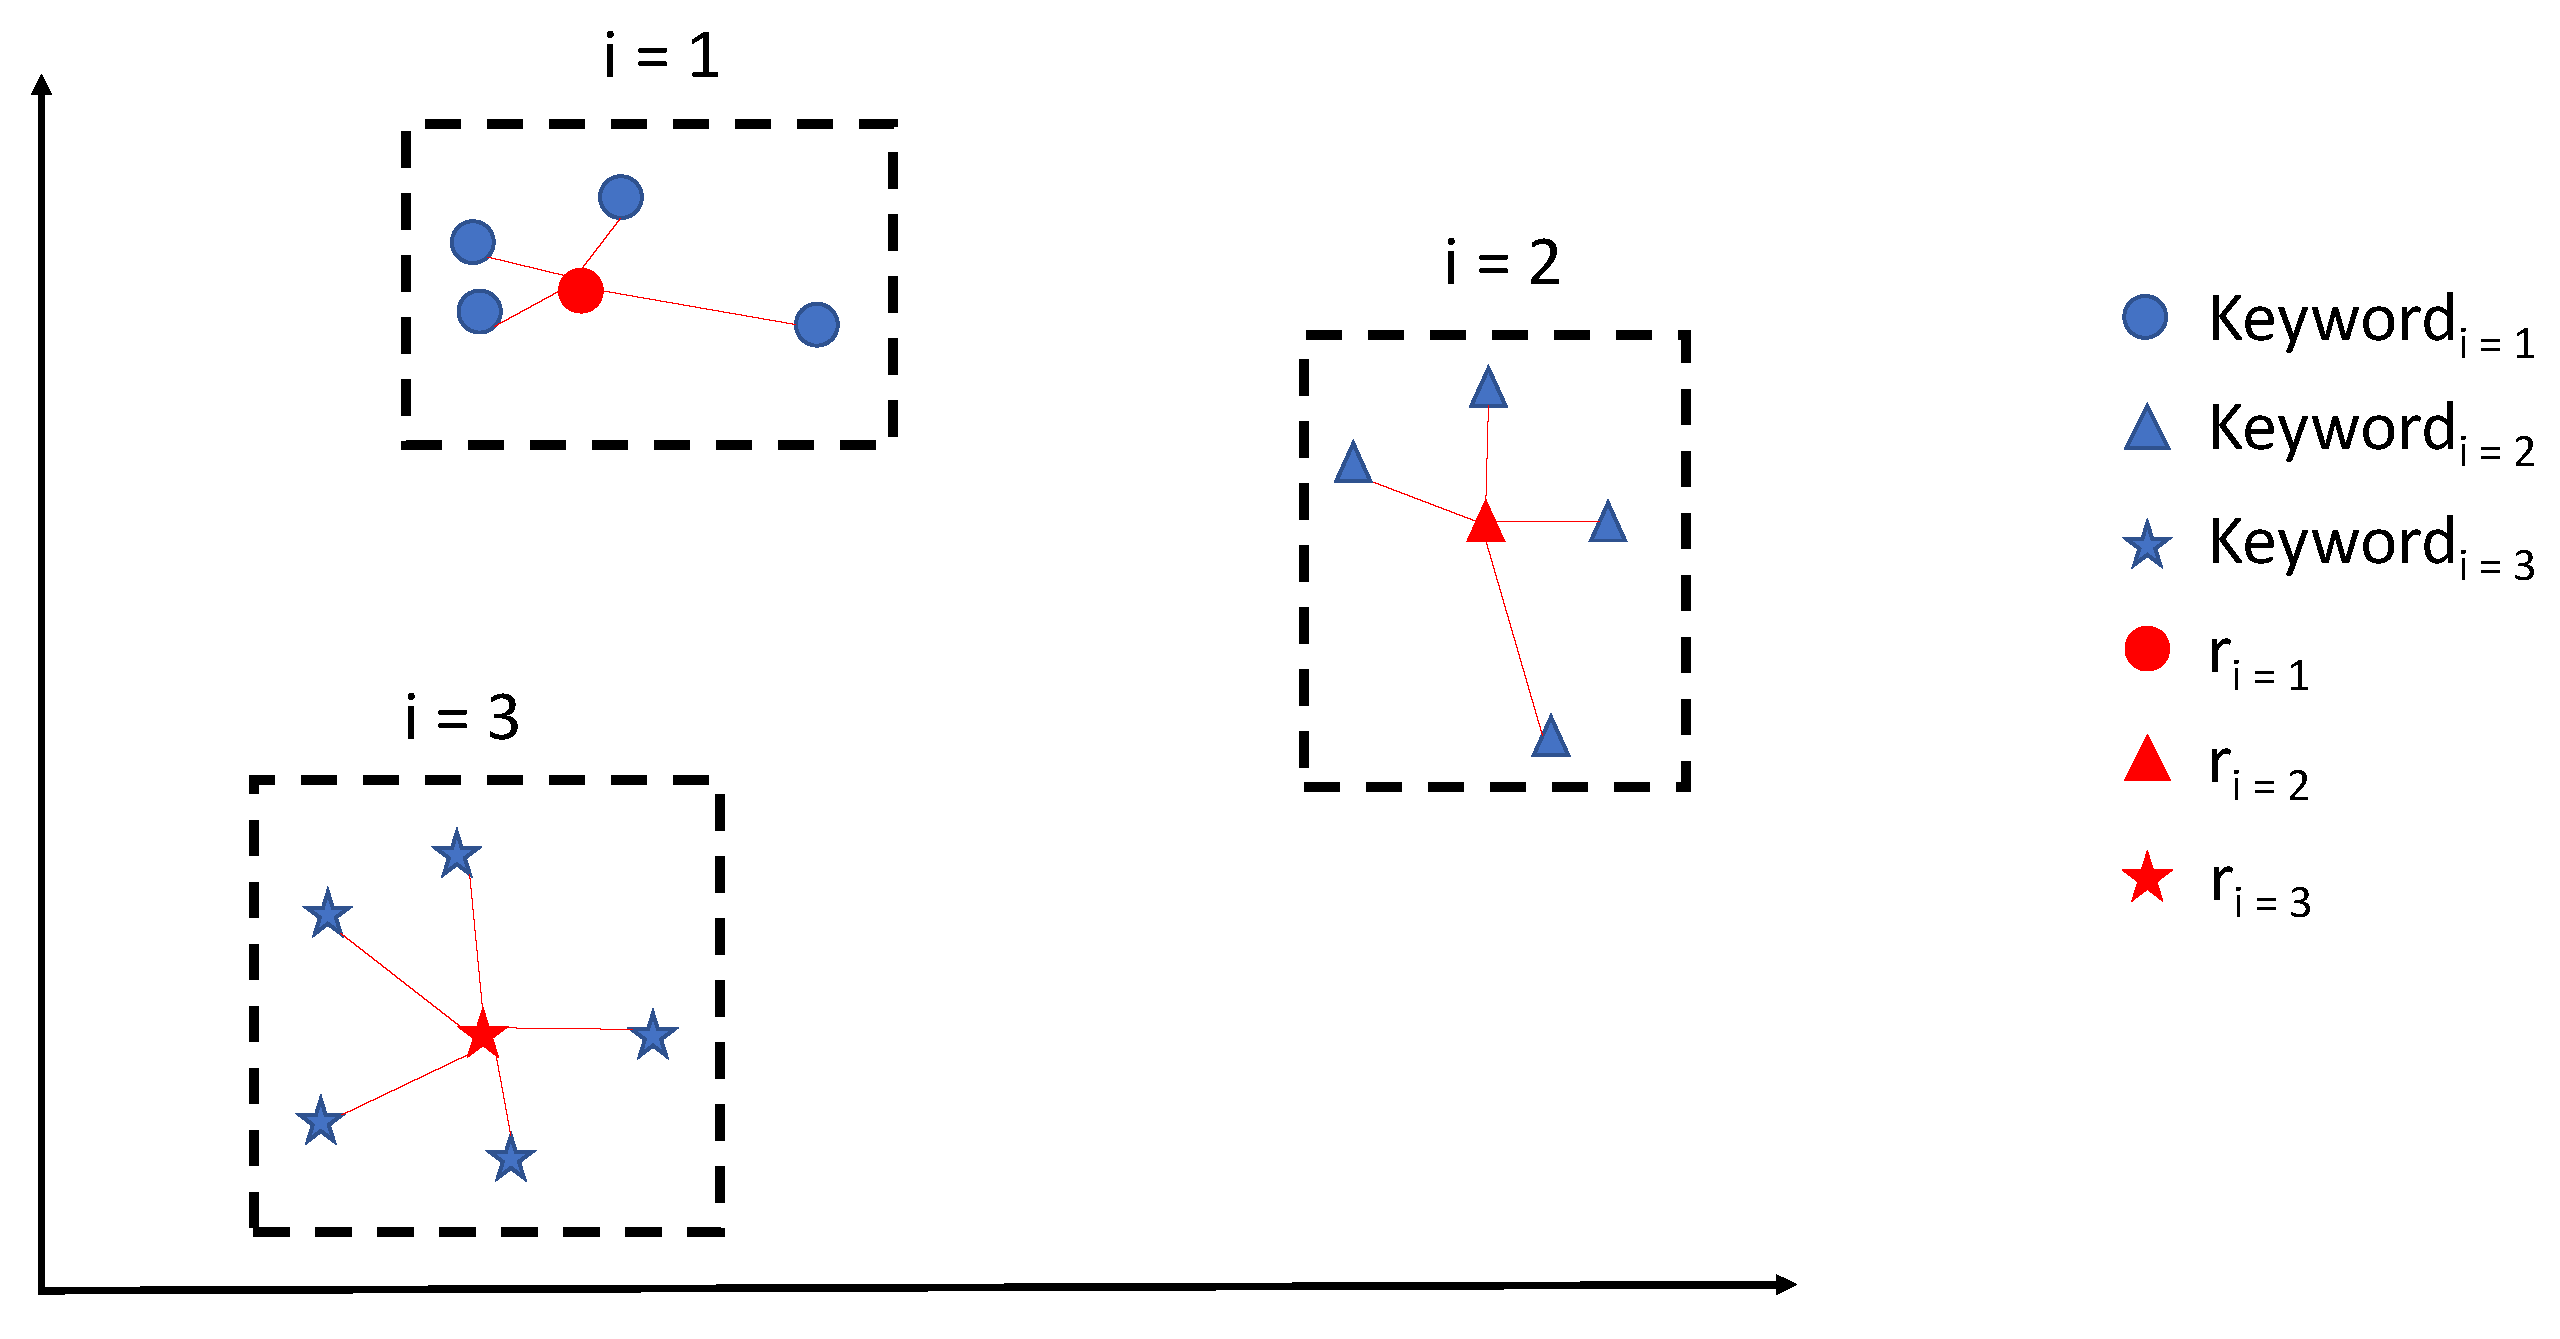
Figure 1 shows an example of mobility of an author during 3 years. For each of the 3 years, the geometric center (in red) of all the topics (words) of that year is computed (
). On the other hand, since SBERT returns directly the sentence embedding we did not have the need for averaging words and looking for the geometric center. For SBERT we merged all the documents of an author for each year in a separate document called ”year-document” and we fine-tune SBERT to directly produce the embedding of these documents that represent the location of each author for each year in its semantic space.
4.5. Estimation of Trajectories and Mobility
This phase aims to estimate the “mobility” of researchers in the semantic space created with the word embedding models (
Section 3.2).
The mobility volume can be estimated through the Radius of Gyration. In the present work, this metric is used to estimate semantic mobility across different research topics, measuring how the works of a researcher are distributed over different research topics.
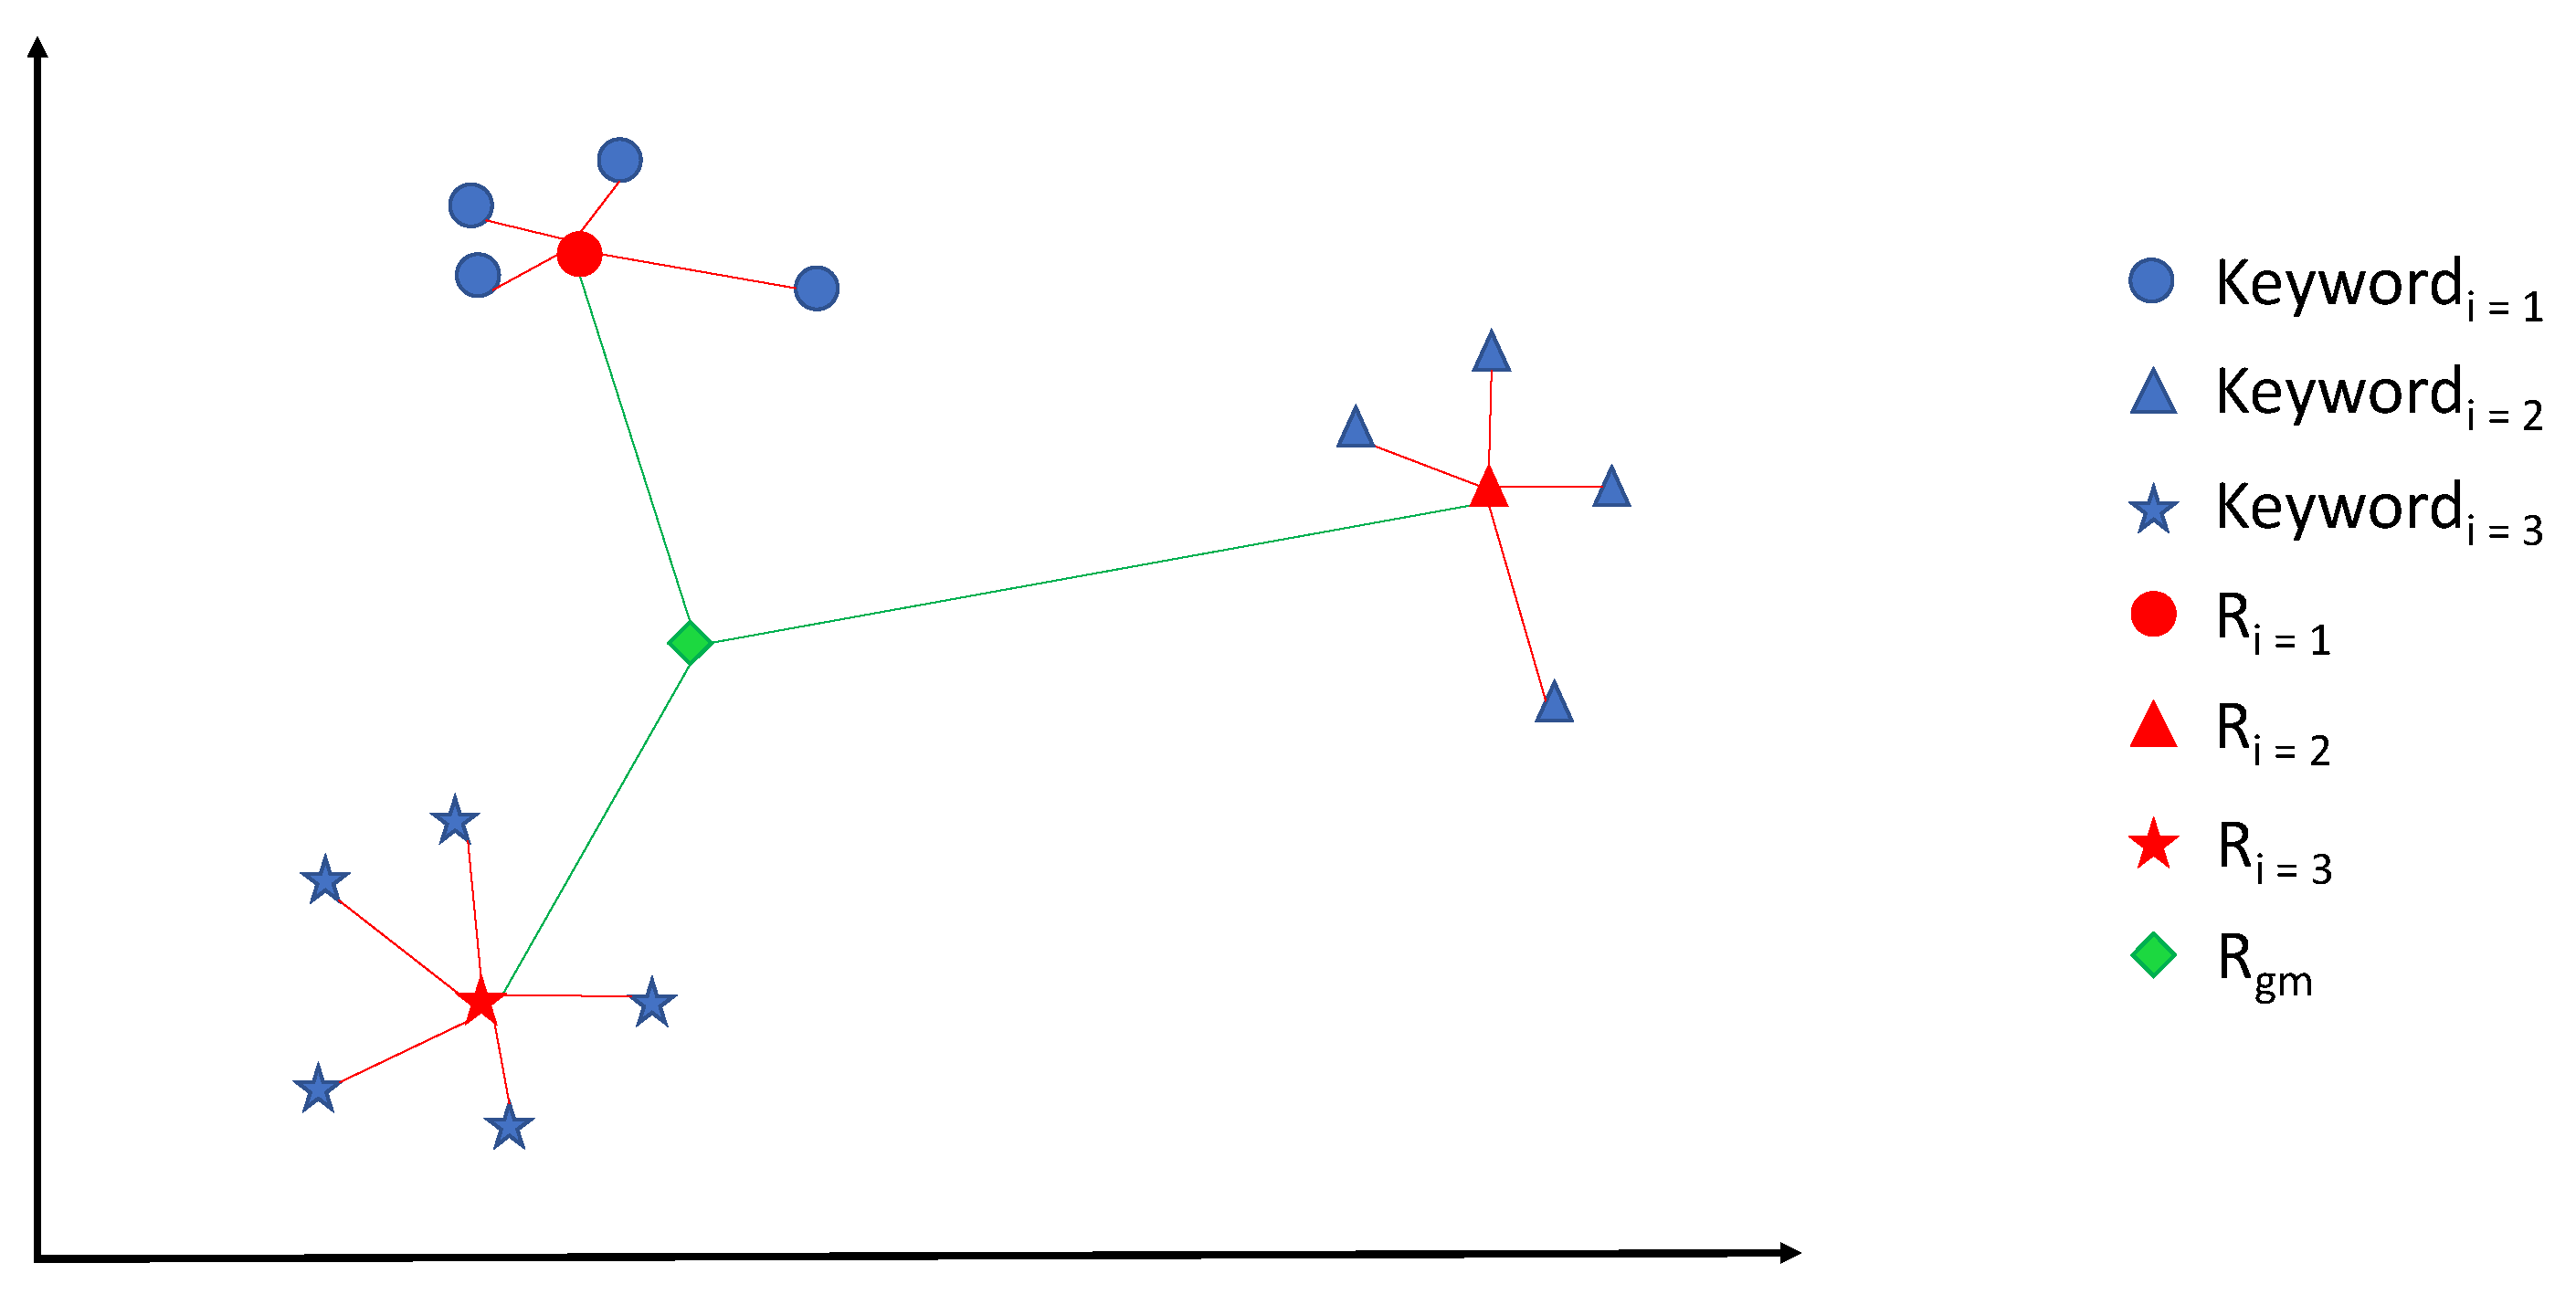
The geometric center (
) of all geometric centers (
) of an author’s active years is computed in the case of Word2Vec (
Figure 2). For SBERT the geometric center (
) is computed among the embeddings of all the year-documents of an author during the years that are represented by (
).
The Radius of Gyration corresponds to the mean squared error of the distances between each and , which is the geometric center of all geometric centers (in green).
It is also interesting to investigate the possible different behaviors of researchers working in different countries and in different research areas.
The extracted knowledge is described in detail in
Section 5.
5. Results and Discussion
Once the semantic spaces where scholars move in are generated, we further analyzed them from different points of view with the aim of extracting latent knowledge from scholars’ research trajectories. In particular, we aim to answer the following intriguing questions:
Is it possible to predict a researcher’s success just by observing their trajectory in terms of attitude to explore new research topics?
Is there any pattern in the scholars’ trajectories across topics over time?
In this section, we present the different analyses that were performed and the related results to answer these questions. The first one can be related to the concept of mobility volume (Radius of Gyration), computed in the semantic space for each researcher. Moreover, some differences in the behavior of researchers working in different countries are investigated. The second one has been investigated looking for the probability density function (PDF) that could better approximate the scholars’ mobility in the semantic space over the analyzed time.
The analyzed dataset is composed of about 3000 researchers. For each author, information about articles, country, and H-index is collected, considering only the selected reference period (
Section 4.1). We compared the semantic spaces computed with Word2Vec and SBERT in terms of who is the most performing into revealing latent trajectories for the target knowledge discovery task. This means that we looked for a correlation between the respective Radius of Gyration computed in the semantic spaces and the H-index of the researchers.
5.1. Correlation Analysis and Comparison of the Word Embedding Models
In general, the linear correlation between two variables
X and
Y is measured by the
Pearson correlation coefficient,
, which assumes a value between
and
, where
is total positive linear correlation, 0 is no linear correlation, and
is total negative linear correlation.
The considered variables for computing the linear correlations are:
The Radius of Gyration of each researcher;
The H-index of each researcher;
The H-index of each researcher, normalized for subject.
In Equation (
2) is shown the Pearson correlation where each
is the Radius of Gyration of each researcher for each time unit, the
is the average RoG and the y represents the H-Index. Since the researchers’ H-index ranges are related to their research subjects, all H-index values are grouped by subject and normalized (
) to bring all values into the range [0,1]. In this way, it is possible to make a fair comparison among researchers working in different fields.
Table 2 shows the correlation values
and
for both Word2Vec and SBERT. It is evident that the semantic space originates with the pre-trained transformers does not return any correlation since in both cases the correlation value is around 0. On the other hand, the semantic space originates from Word2Vec is able to return a negative strong correlation in both cases. We further analyzed this result with a significance analysis in the next section. In light of this first result, we performed the other analysis using only the Word2Vec semantic space.
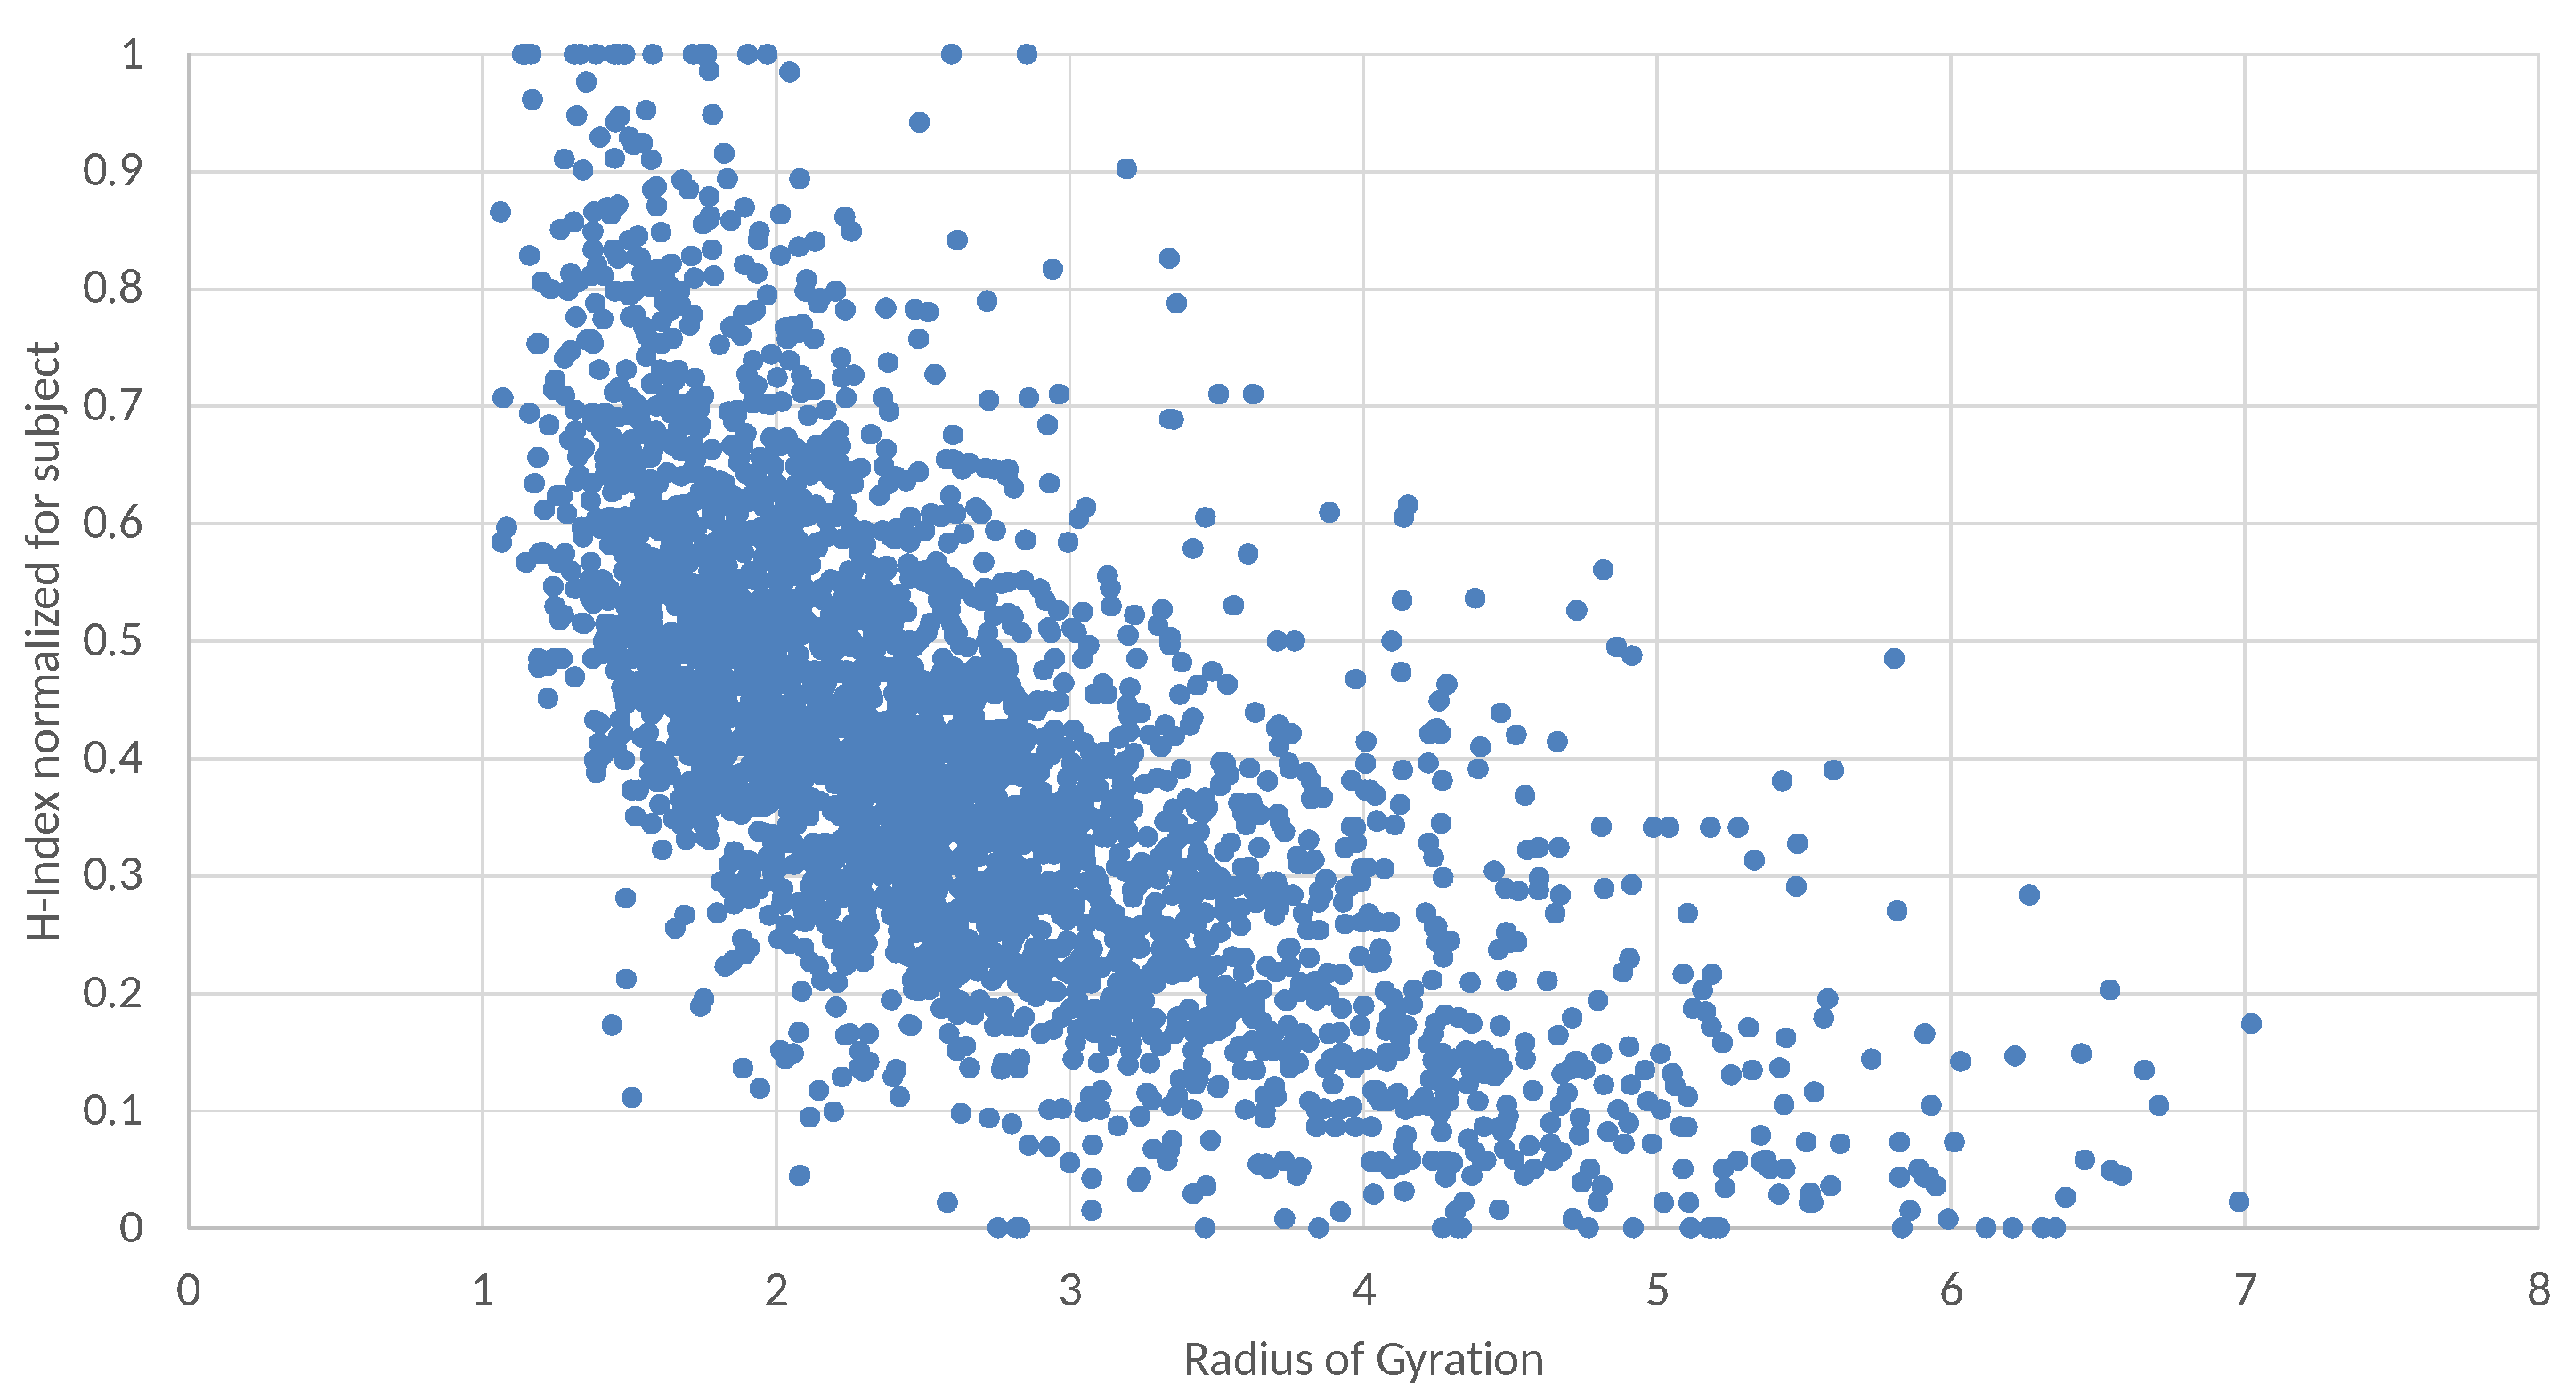
These negative correlations can also be observed in
Figure 3, which shows the distribution of the authors according to their Radius of Gyration, along the
x-axis, and their H-index, along the
y-axis. Since the statistical distribution of citations may depend on the subject area, in
Figure 4, the H-index of each scholar is normalized in the observed range of their subject area. Indeed, results show that rarely can a single researcher have a significant impact on several different research topics. Instead, the most successful researchers tend to focus on quite a narrow research area.
5.2. Significance Analysis
Statistical hypothesis testing has been used to determine if results are statistically significant. In particular, we evaluated the following significance:
Correlation, considering the results shown in
Table 2.
Two Regression Models, considering the H-index as the dependent variable for the first regression, and the H-Index normalized for the subject for the second one. Both cases use the Radius of Gyration as the independent variable.
For the correlation analysis, the p-value represents the probability that you would have found the current result if the correlation coefficient were in fact zero (null hypothesis). If this probability is lower than the conventional 5% (p < 0.05), the correlation coefficient is called statistically significant. Conventionally the 5%, 1% and 0.1% (p < 0.05, 0.01 and 0.001) levels have been used. Most authors refer to the statistically significant as p < 0.05 and statistically highly significant as p < 0.001 (less than one in a thousand chance of being wrong). In our case, we found p < 0.001, and we can therefore state that the correlation is statistically highly significant.
We also performed a significance analysis of the regression model, using the F-Test. The F-test indicates whether a linear regression model provides a better fit to the data than a model that contains no independent variables. In this case, the
p-value indicates whether there is a significant relationship described by the model, and the
(coefficient of determination) measures the degree to which the data are explained by the model. In particular,
is the proportion of the variance in the dependent variable that is predictable from the independent variable(s). The Adjusted Coefficient of Determination (
) is an adjustment for the Coefficient of Determination that takes into account the number of variables in a data set. It also penalizes you for points that do not fit the model. As in previous cases, we have considered two different scenarios, choosing the H-index as the dependent variable for the first regression, and the H-Index normalized for the subject for the second one. Results are shown in
Table 3.
For both cases, we found p < 0.001, and we can therefore state that the regression models are statistically highly significant. The results also show that the Radius of Gyration explains the 47% of the H-Index variance and the 39% of the H-Index normalized for the subject.
Even if there is a strong connection between the two variables, determination does not prove causality, and we cannot deduce a cause-and-effect relationship solely based on an observed association or correlation.
5.3. Subject Analysis
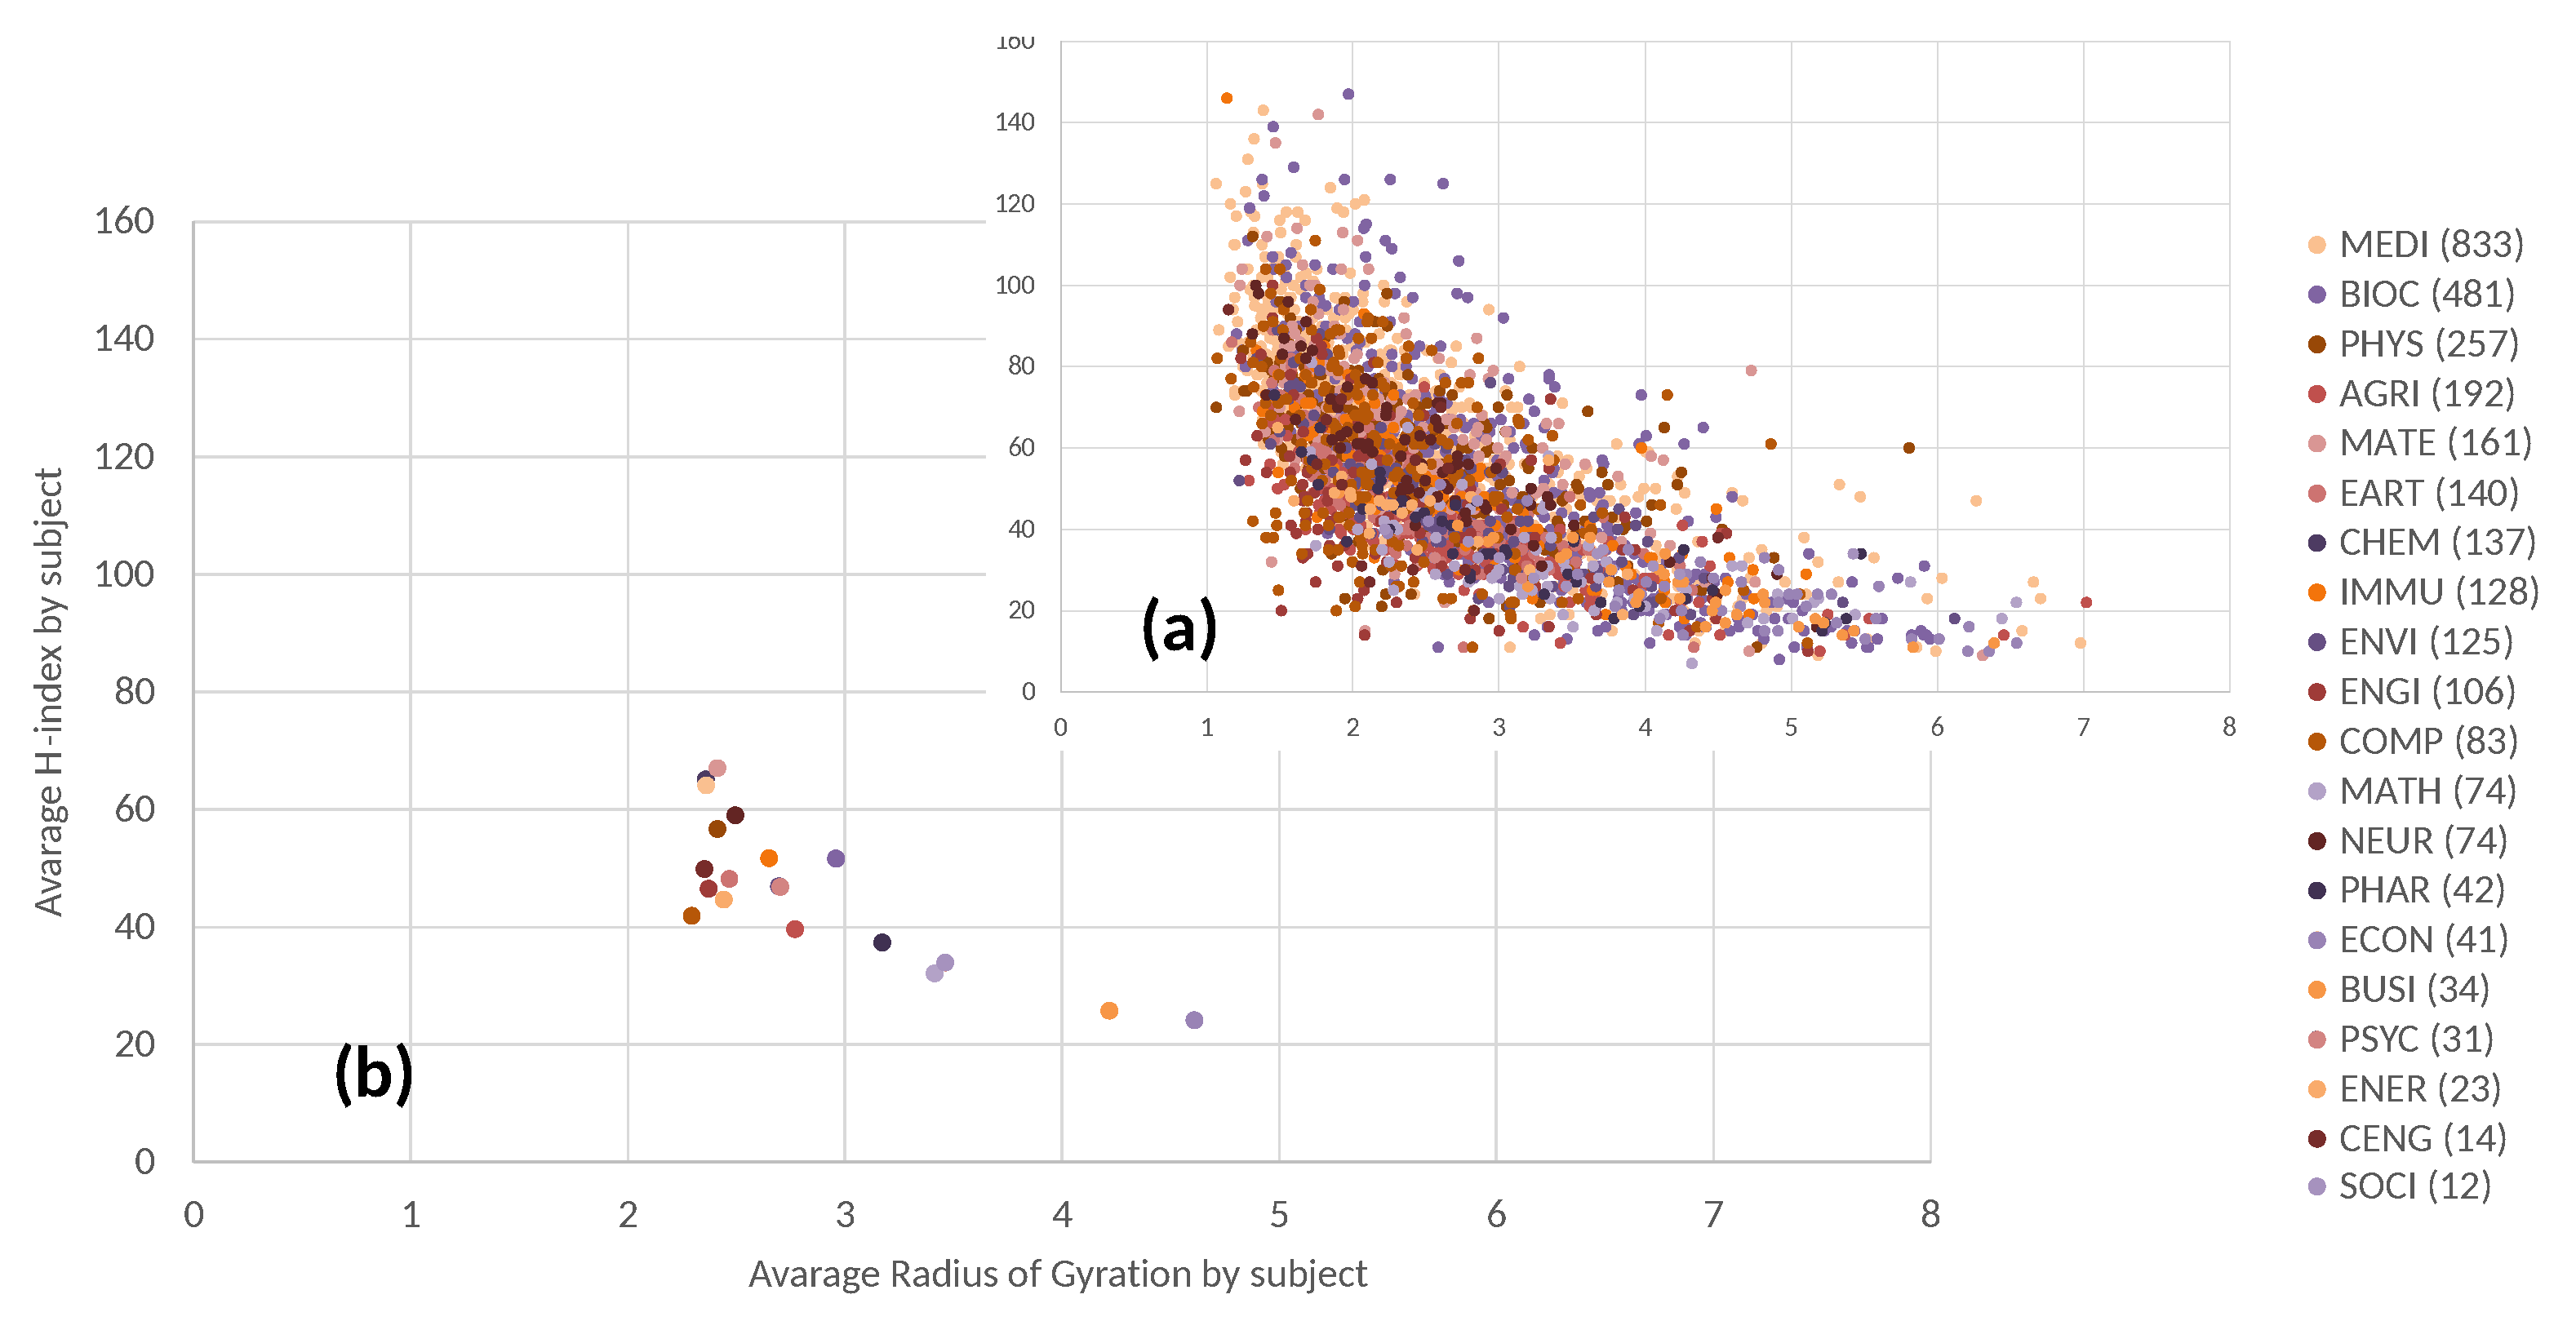
Since this analysis regards scholars working in very different subject areas, in
Figure 5 data are distinguished by the subject areas associated with scholars on Scopus. Subject codes are defined in the Scopus API (
https://dev.elsevier.com/documentation/ScopusSearchAPI.wadl, accessed on 8 January 2022). In particular, in graph (a) the analyzed scholars are colored by subject area. It can be observed that some groups of scholars of certain subject areas are represented by nearby points and, also selecting each subject area, the two considered variables are anti-correlated. In fact, considering the most represented subjects, the following important values of anti-correlation can be observed: MATH, −0.636; MEDI, −0.677; ENGI, −0.531. To better highlight some possible differences among subjects, graph (b) also shows the average values of the Radius of Gyration and the H-index, grouping scholars by subjects. According to the results, researchers of different subjects behave differently, and also these average values are scattered approximately along a line with a negative slope. The subjects with the highest values of the Radius of Gyration are Economics and Business. In [
38], it is shown that the differences among the average H-index calculated for each disciplinary field (or Scopus subject) can be largely accounted on both the career length and the average number of authors per article in the various fields.
Figure 5 shows that in correspondence with the lower average H-index in the cases of Economics and Business, the mobility across research topics measured by the Radius of Gyration is higher.
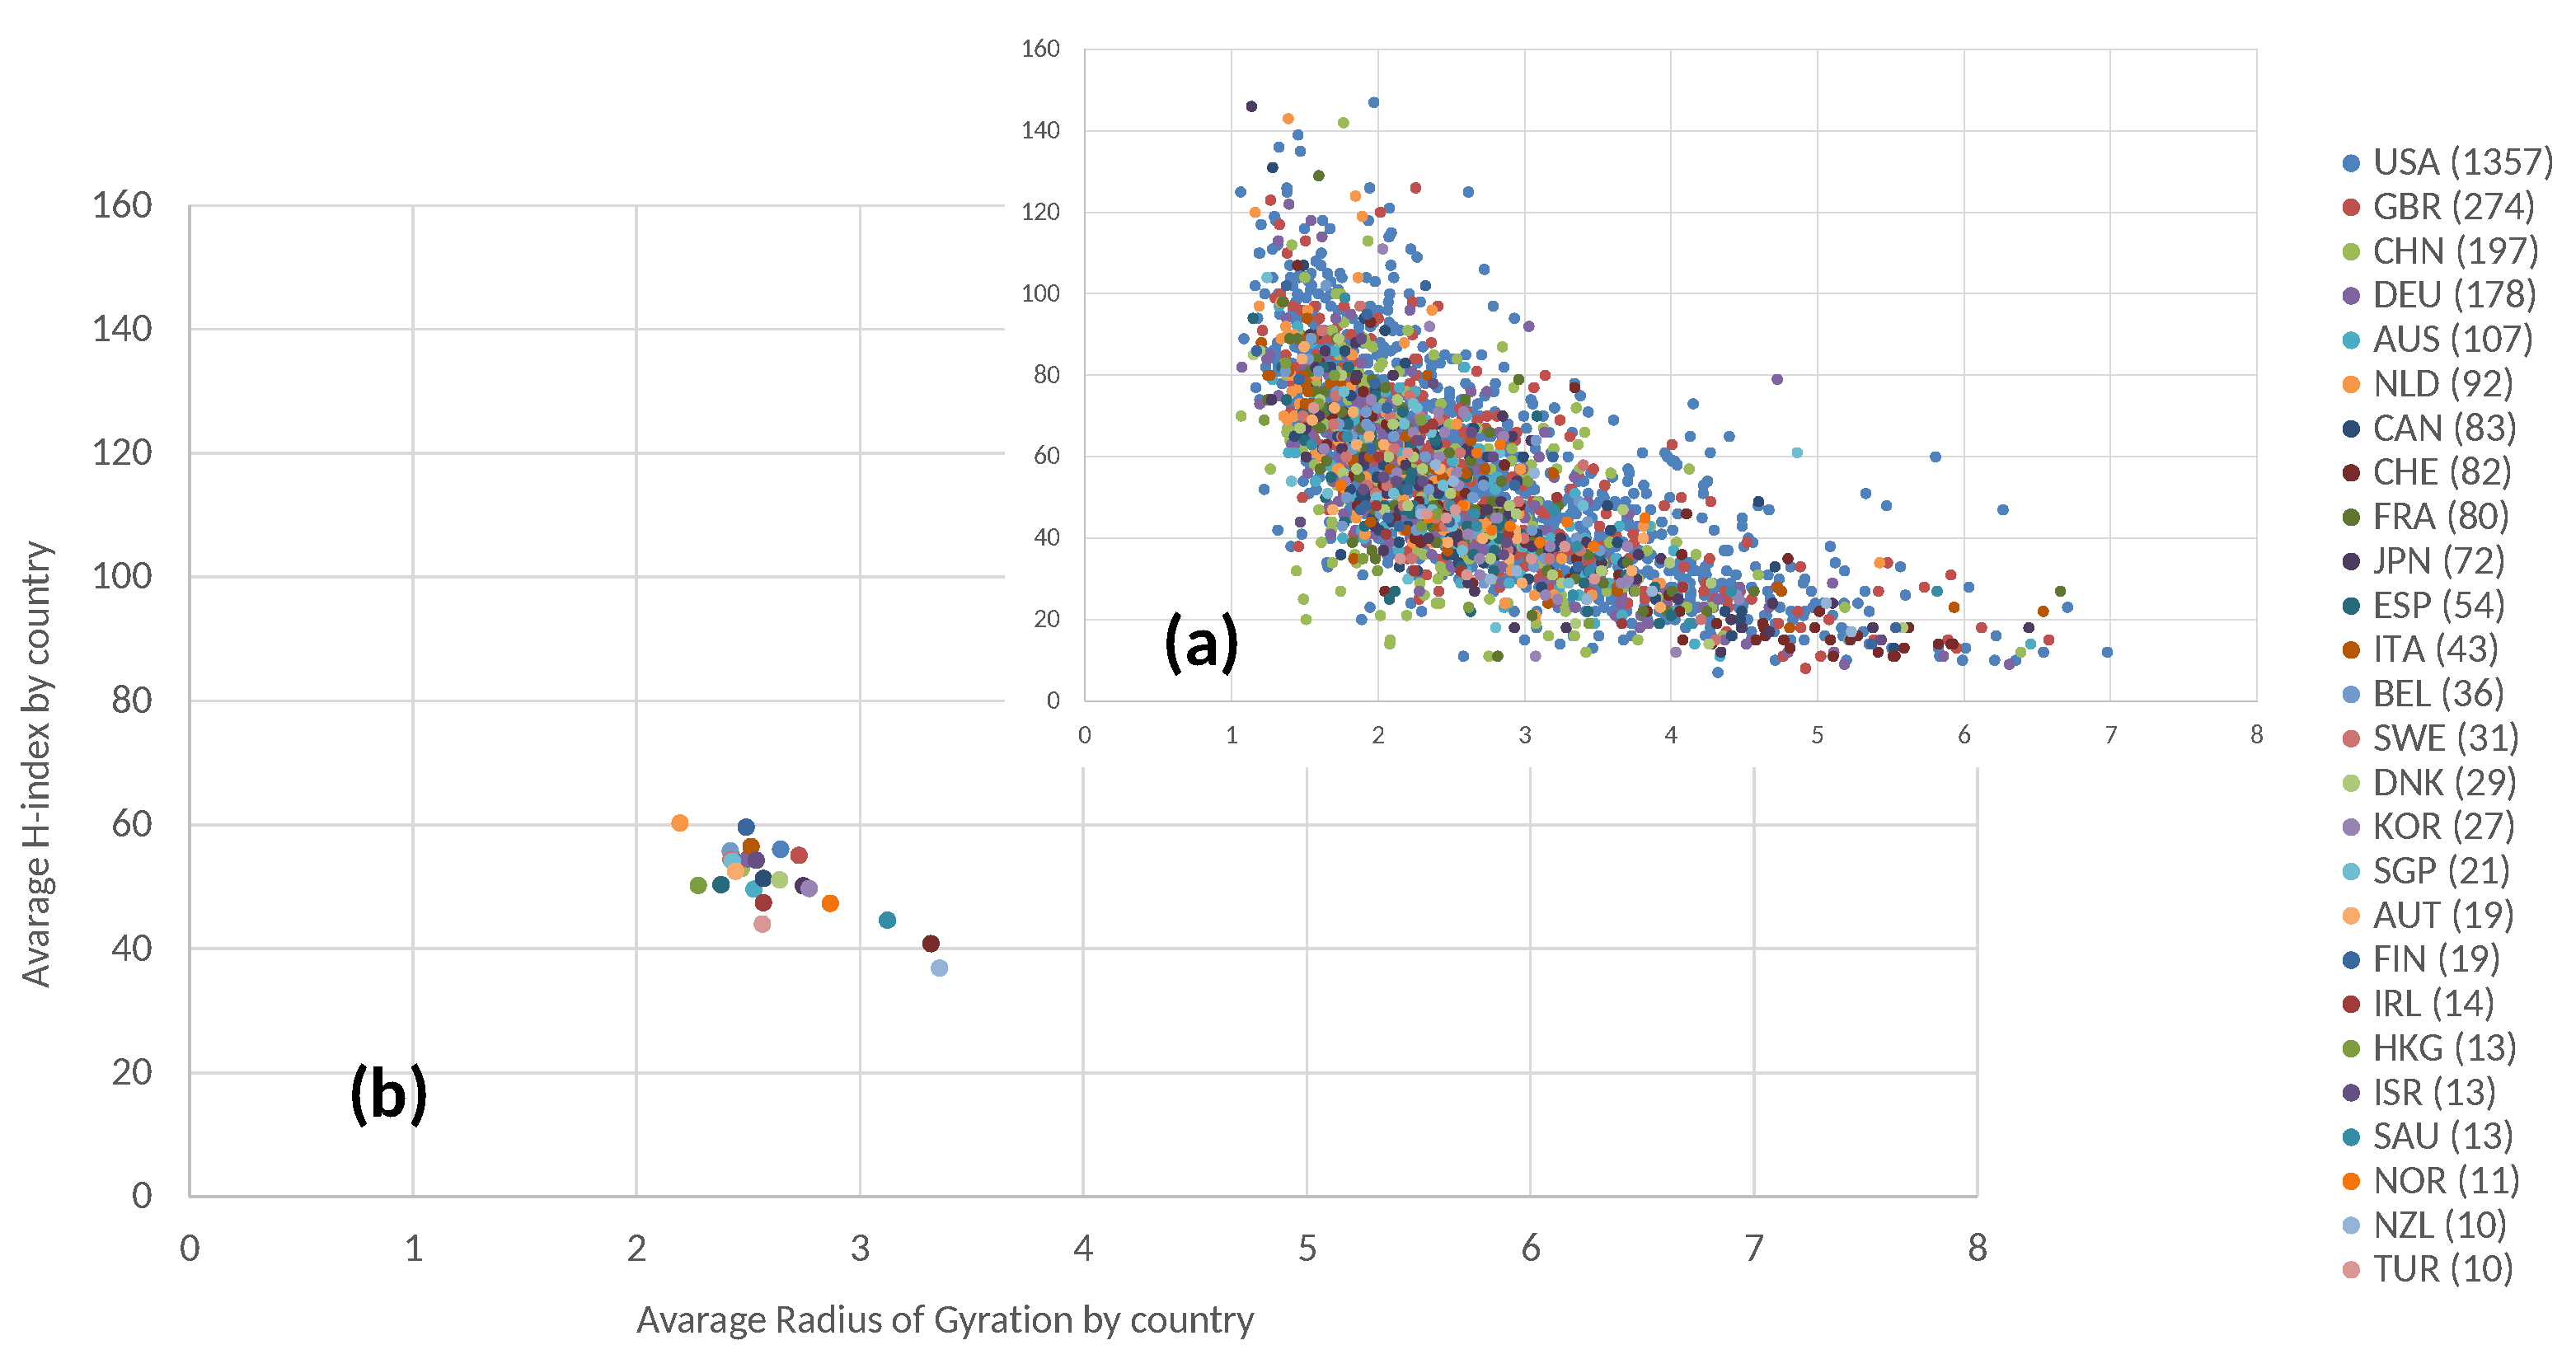
5.4. Country Analysis
Finally,
Figure 6 takes also information about countries into account. ISO-alpha3 country codes are used (
https://unstats.un.org/unsd/methodology/m49/, accessed on 8 January 2022). In particular, in graph (a) the analyzed scholars are colored by country, in fact, by the country of their affiliation institution. Furthermore, grouping data by country, dots with the same color are not uniformly distributed. Considering the most represented countries, a significant anti-correlation can be observed, similarly to the general case. Considering, for example, the most represented countries, the following important values of anti-correlation can be observed: United States, −0.6826; UK, −0.72154; China, −0.51519. Graph (b) also shows the average values of the Radius of Gyration and the H-index, grouping scholars by country. While the values are distributed over a smaller region than
Figure 5, the graph shows that slight differences also exist among countries and, also, in this case, average values are scattered approximately along a line with a negative slope.
These differences may signal the influence of geographical and cultural factors, but also of different organizational structures, national policies and research programs. For example, the Netherlands has many universities ranked among the best in the world, and thus the high impact its top research results do not come as a surprise. However, researchers in Dutch universities are also those with the lowest mobility (RoG). This may be influenced by a formal definition of strategic themes and research themes in each university, corresponding to precise groups of researchers. This kind of rigid structure often drives the assignment of local funds and benefits. One of the goals of recent reforms (2016–2017) is to create larger domains in which interdisciplinary research would be more easily accommodated (
https://www.dejongeakademie.nl/shared/resources/documents/Abeginnersguide.pdf, accessed on 8 January 2022). Switzerland is instead at the opposite side of the spectrum of mobility (RoG). The Swiss research and higher education system is characterized by a strong focus on interdisciplinarity, which facilitates mobility across research topics (
https://www.usi.ch/sites/default/files/storage/attachments/press-higher-education-and-research-switzerland-sefri.pdf, accessed on 8 January 2022). The same kind of interdisciplinary research context, favorable for mobility across research topics, characterizes large research venues, such as CERN.
5.5. Scholars’ Mobility Pattern
Modeling the authors’ research activities as travel in a semantic space enables investigating another kind of result, related to the emergent patterns in the authors’ trips in this space over the time. In particular, we looked for a mobility pattern considering the displacements between visited locations in consecutive years (
flight length) by each author. Understanding these patterns may be of interest for different stakeholders because it is possible to estimate the probability that a change of a topic occurs among the top scholars analyzed. For example, it could be considered in the evaluation criteria that occur in many different national academic systems or even to evaluate research projects or their management. Before discussing the specific findings, in this section we present the methodology that we have used and the kind of results obtained. This kind of analysis can be seen as borrowed from the Human Mobility field, where it emerges that the length of human travels can be described by a Power Law distribution in general [
1,
39] and by a Lognormal distribution if analyzed with a transport modality decomposition (walk, car, bike, train, airplane) [
18,
40]. In our analysis the scholars travel among the topics, modeled as the estimated locations. We have studied the mobility for each scholar and for each year, as discussed in
Section 4.4. The distance between two consecutive locations is measured with the Euclidean distance. The Probability Density Function (PDF) was computed over the frequency of displacements, in order to estimate which distribution can better describe the authors’ mobility across the topics. We have considered the following distributions: Power law, Truncated Power Law, Exponential, and Lognormal. The following methodology was adopted to select which distribution best fits the scholar data:
For each distribution, the specific parameters have been selected using the Maximum Likelihood Estimator (MLE) between the candidate distribution and the empirical data [
41,
42].
To quantify the goodness of each fit, the Likelihood Ratio test [
43] has been performed among each couple of distributions. As reported in the literature, this comparative test is preferable to an individual one (e.g., Kolmogorov–Smirnov test) for its robustness to noise in the data [
44]. The result of this test is the Log-Likelihood ratio
R between the two candidate distributions and a p-value. The result is considered acceptable if the
p-value < 0.1.
Once the best distribution has been selected, we have performed an individual test for the resulting distribution with the Kolmogorov–Smirnov (or KS statistic) and bootstrapping [
45] anyway. The KS returns the distance between data from the target distribution.
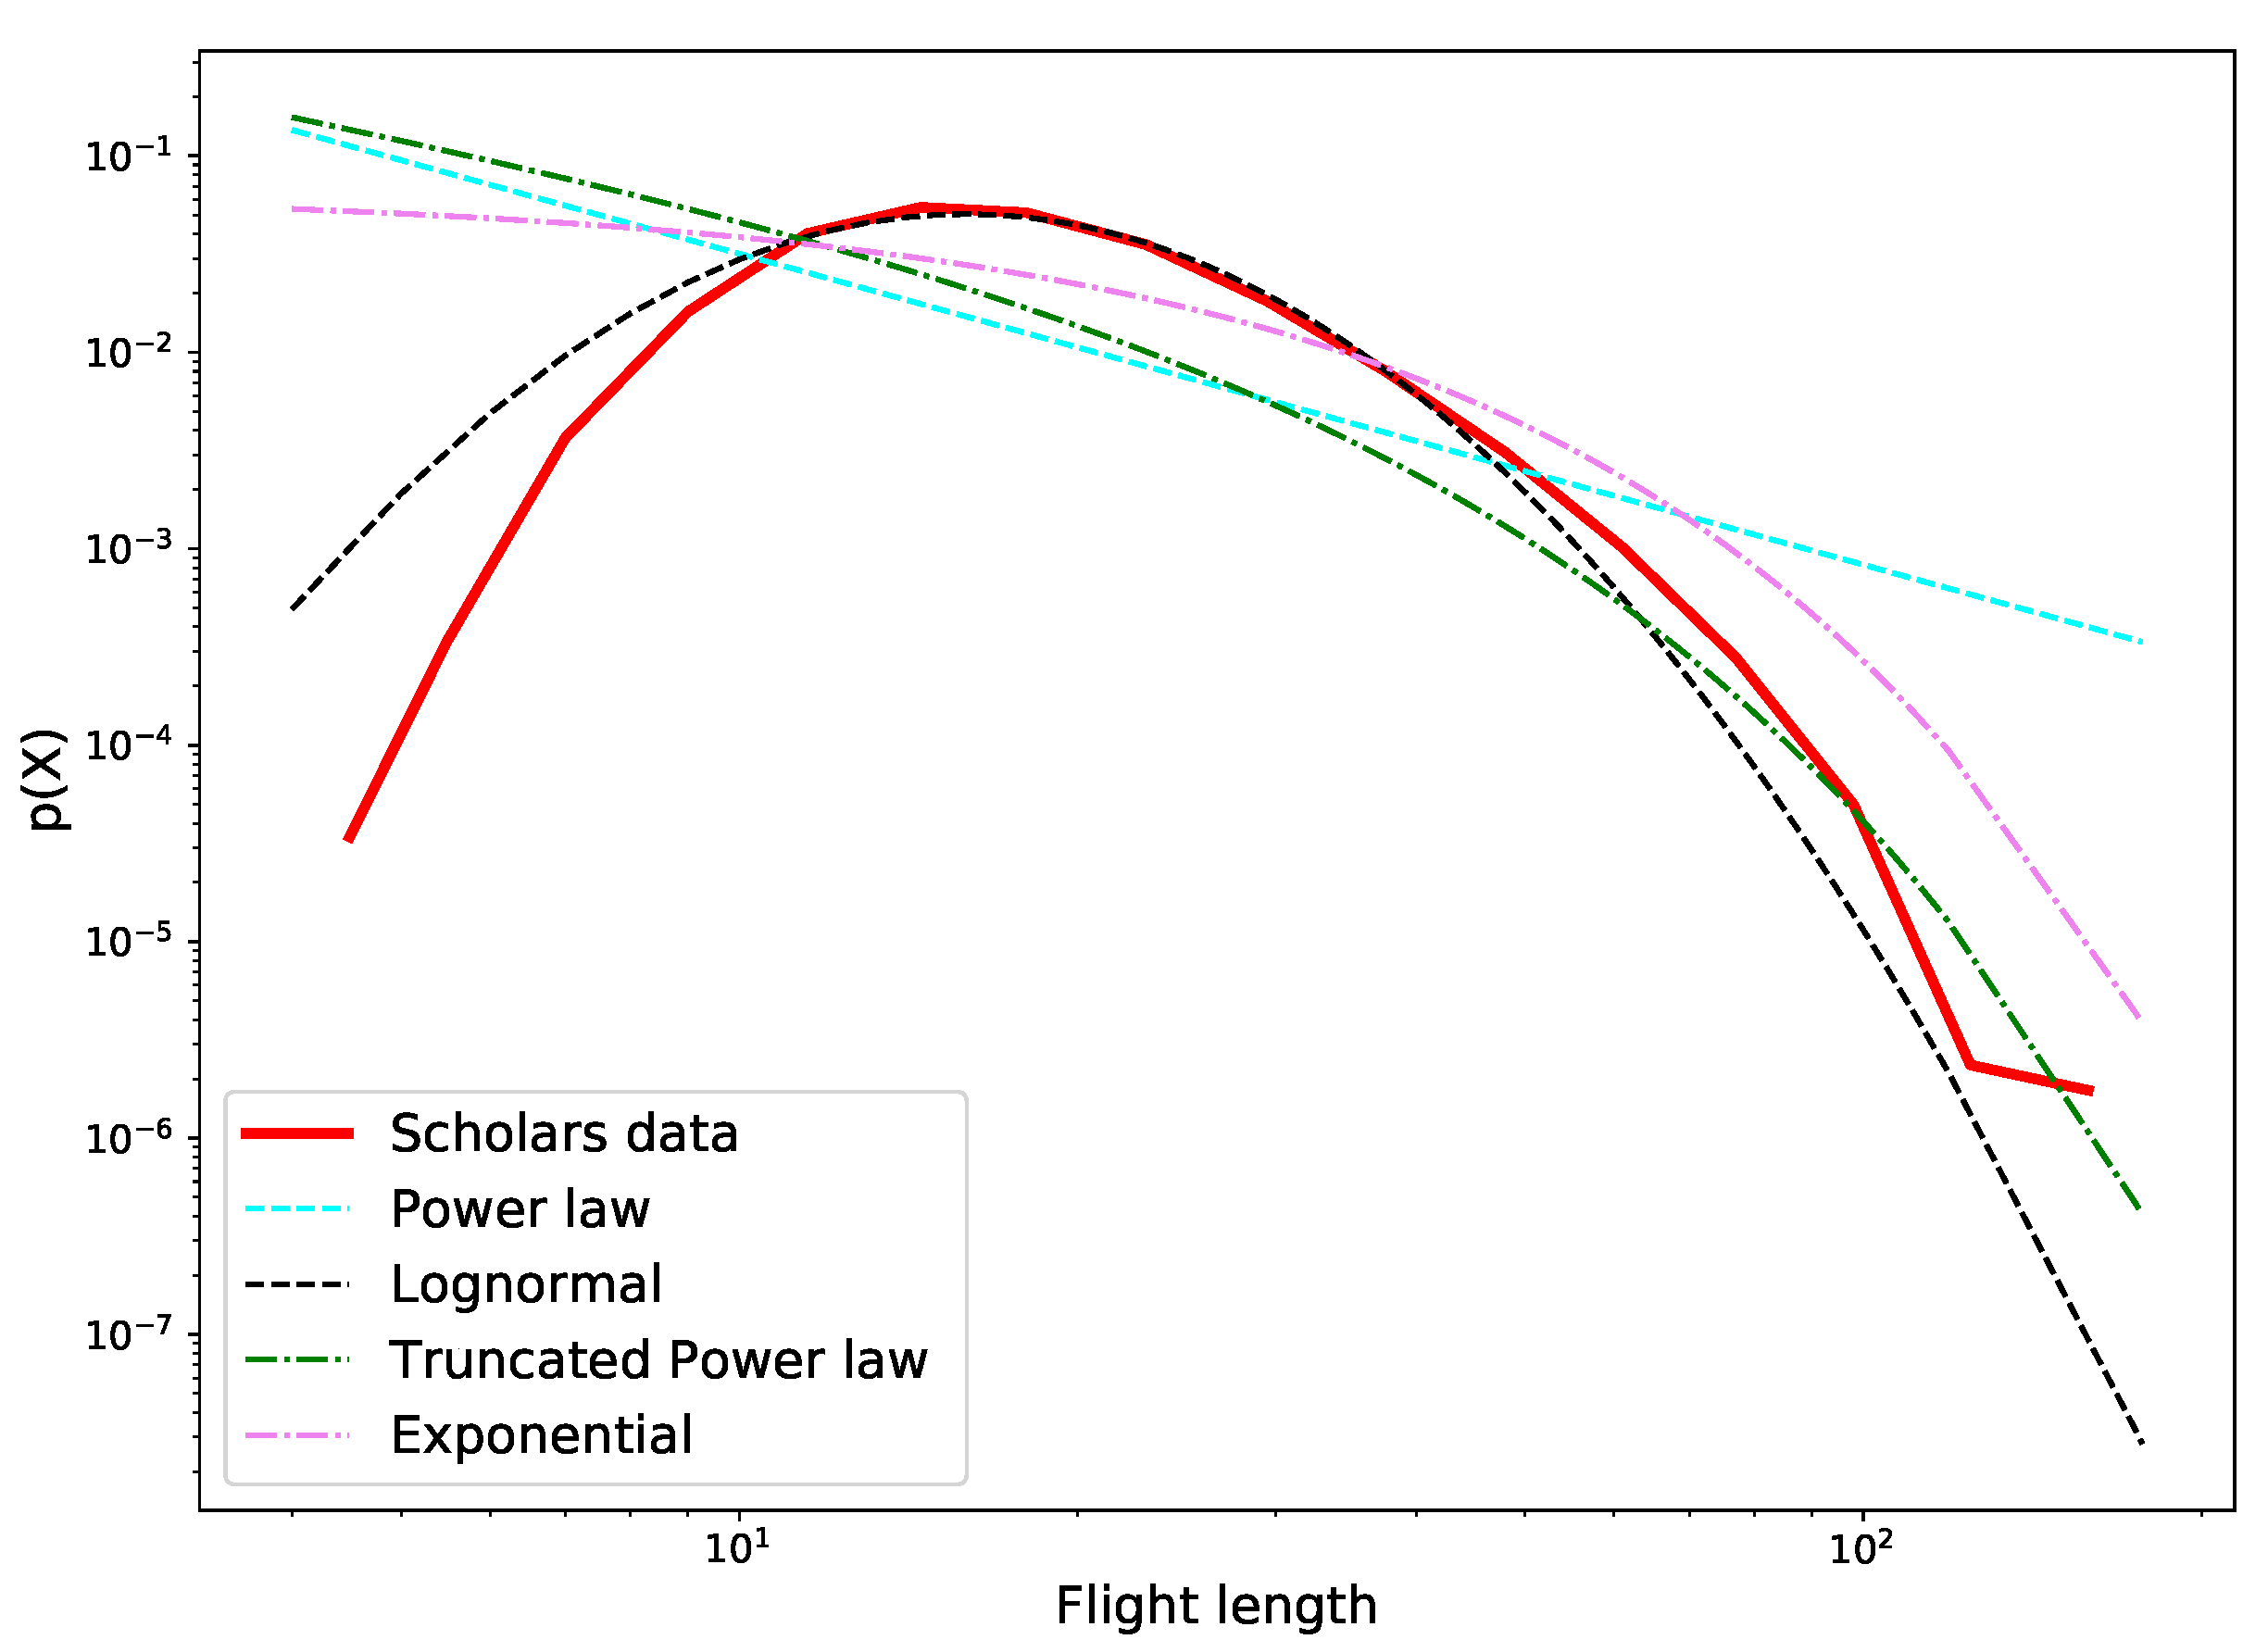
Figure 7 presents the PDFs describing the empirical data from scholars trips and the candidate distributions, whose parameters have been fitted with the MLE. It is possible to note that the black curve related to the Lognormal distribution is the one that best approximates our data. This evidence is also shown by the Log-Likelihood ratio test, whose results are presented in
Table 4 for each comparison. The Lognormal distribution parameters estimated with the MLE are
and
. The goodness of the Lognormal fit has been also evaluated for the sake of completeness with individual Kolmogorov–Smirnov tests. As presented in
Table 5, the only distribution fit that is acceptable is the Lognormal one with a
p-value = 0.03. This result is interesting also considering that several patterns related to the human mobility follow the same distribution [
18]. Once detected that scholars’ travels around research topics are well approximated by a Lognormal, we try to explain what are the implications of this result. First of all, this distribution results to be concordant with the previous results concerning the Radius of Gyration: top scholars tend to obtain better academic results by focusing on specific research areas. Lognormal distribution confirms this result and an interpretation can be resumed in this way: top scholars obtain better academic results by focusing on a specific research area but moving around within the sub topics. Most of the top scholars perform medium flight length travels each year, while it is less probable that they make important shifts in space. The same condition for the definition of Lognormal occurs with a very small shift in space.
5.6. General Applicability
Since the application of this kind of analysis to the use case of scholars provides interesting results, we believe that the method is promising for a more general application, with a few adaptations. For example, mobility could be used to analyze users of a generic social media platform and evaluate the change of trending topics. As a significant difference, in our study we used the corpus of articles of the selected scholars for both training the word embedding and the specific mobility analysis. However, in general this is not necessary. Instead, it is important to have a comprehensive and large corpus of textual data, covering most subjects to be analyzed. Thus, this step needs to be performed only once, offline with respect to the following steps of the analysis and possibly with a completely different technological stack; e.g., Python instead of Java. This is quite important, since training the word embedding system can be a time consuming and resource intensive computation. The complexity of this training phase depends largely on the abstract algorithm and also on the details of its implementation. In the case of Word2Vec, the complexity depends most on the corpus size N rather than on the numbers of unique words V. It exploits a binary-search over a vocabulary-sized array to achieve the sampling of negative examples, thus its complexity can be resumed as , where N is the total corpus size and V is the unique-words vocabulary count. However, the choose of algorithm’s parameter can affect the complexity, such as the window size and the negative sampling ratio.
For a general application of this process to a social platform, the rest of the process can remain virtually the same, as shown in Algorithm 2. To perform the process periodically, it is necessary to collect new posts published by users (and, possibly, also to update the very same set of users). Calculating the users’ paths and their mobility measure (i.e., their Radius of Gyration) can be performed in the same way as described for the case study. It is worth noticing here that the whole process can scale gracefully and quite linearly over a larger number of users
n, with complexity
. In fact, the workload to perform for each user is virtually constant (it does not depend on the number of users). Moreover, the computation to perform for each user depends only on that user’s data; i.e., it can be performed independently and possibly vectorized for parallel execution (by several Spark executors, for example). Thus, an appropriate number of workers can be chosen, for reaching the desired trade-off between global cost and execution time [
46].
| Algorithm 2 Pseudo-code for a general social media application. |
- 1:
functionAnalyzeUsersMobility() - 2:
▷ e.g., Wikipedia - 3:
▷ Map: lemma → coordinates - 4:
- 5:
▷ Map: user → mobility - 6:
for all do ▷ Periodical sampling - 7:
- 8:
do - 9:
- 10:
▷ List of points - 11:
- 12:
- 13:
end for - 14:
- 15:
end for - 16:
end function
|
where:
is a set of users;
is a set of timepoints (samples);
is a generic corpus of texts, used only for training the word embedding model;
is the semantic model obtained with the word embedding algorithm;
associates each user with their mobility index;
is a set of user’s posts;
is the same function already defined in Algorithm 1;
In particular, to calculate the Radius of Gyration, Equation (
1) has to be applied to the path, and it has a complexity which is linear with the path length, but constant with the number of users. The path length can be supposed to be constant (i.e., sampling each year, over a ten year timespan). For obtaining the path, all lemmas have to be transformed into some coordinates of the semantic space. Thus, the computation cost is linear with the number of the user’s words
m to transform, with complexity
, but constant with respect to the number of users. As a trivial optimization, it is possible to store the current path of each user, and only update it with new data for adding a new point (essentially, caching results for gaining time performance). However, the complexity would remain unchanged, since it is determined by the worst case of newly discovered users.
The transformation of each word is based on the pre-calculated word embedding, and it essentially requires accessing a dictionary, which depends on the number of lemmas
l in the original corpus, with complexity
, but is constant in all other respects. Actually, since the Radius of Gyration does not depend on the order of points in the path, also these finer grained computations are largely independent (thus, for example, they can be vectorized over of several Spark executors). Finally, we can state that Algorithm 2 has the following time complexity:
where:
n is the total number of users to analyze.
m is the number of words for each user, which all need to be converted into the semantic space coordinates.
l is the number of unique lemmas in the original corpus, used for offline computation of the word embedding space.
6. Conclusions
The main goal of this work is to build, study, and exploit semantic trajectories to extract new latent knowledge. We propose a methodology that aims to combine some analytical tools, traditionally used with geographic data, in a semantic realm obtained exploiting neural network embedding techniques. Indeed, we applied a word embedding algorithm (Word2vec) to a large corpus of abstracts of scholarly articles to get scholars’ trajectories over the time. After that, we applied the Radius of Gyration (RoG) to measure their mobility rate across scientific topics. Finally to extract knowledge we further analyzed trajectories and rog with statistical tools looking for correlation with researchers’ success. Moreover, some interesting differences have emerged in the behavior of researchers working in different countries. Finally, some interesting similarities have emerged between mobility patterns in this semantic realm and those typically observed in the case of geographic mobility.
Results show that rarely does a single researcher have a significant impact on several different research topics. Instead, the most successful researchers tend to focus on a quite narrow research area. These results are compatible with the framework proposed in [
34], in which scholars were simulated by agents with different strategies and objectives, depending on the context in which they operate and the academic age.
We believe that the main scientific contribution of this research work is methodological, demonstrating that the semantic spaces obtained through word embedding techniques are amenable to mobility measures, which are typically applied to the geographic realm. In fact, these initial results demonstrate that the proposed approach is effective for the domain of scholar data, with promising developments which may find application also in other domains.


 ,
, 


