Integrative Factors of E-Health Laboratory Adoption: A Case of Indonesia


Abstract
1. Introduction
2. Literature Review
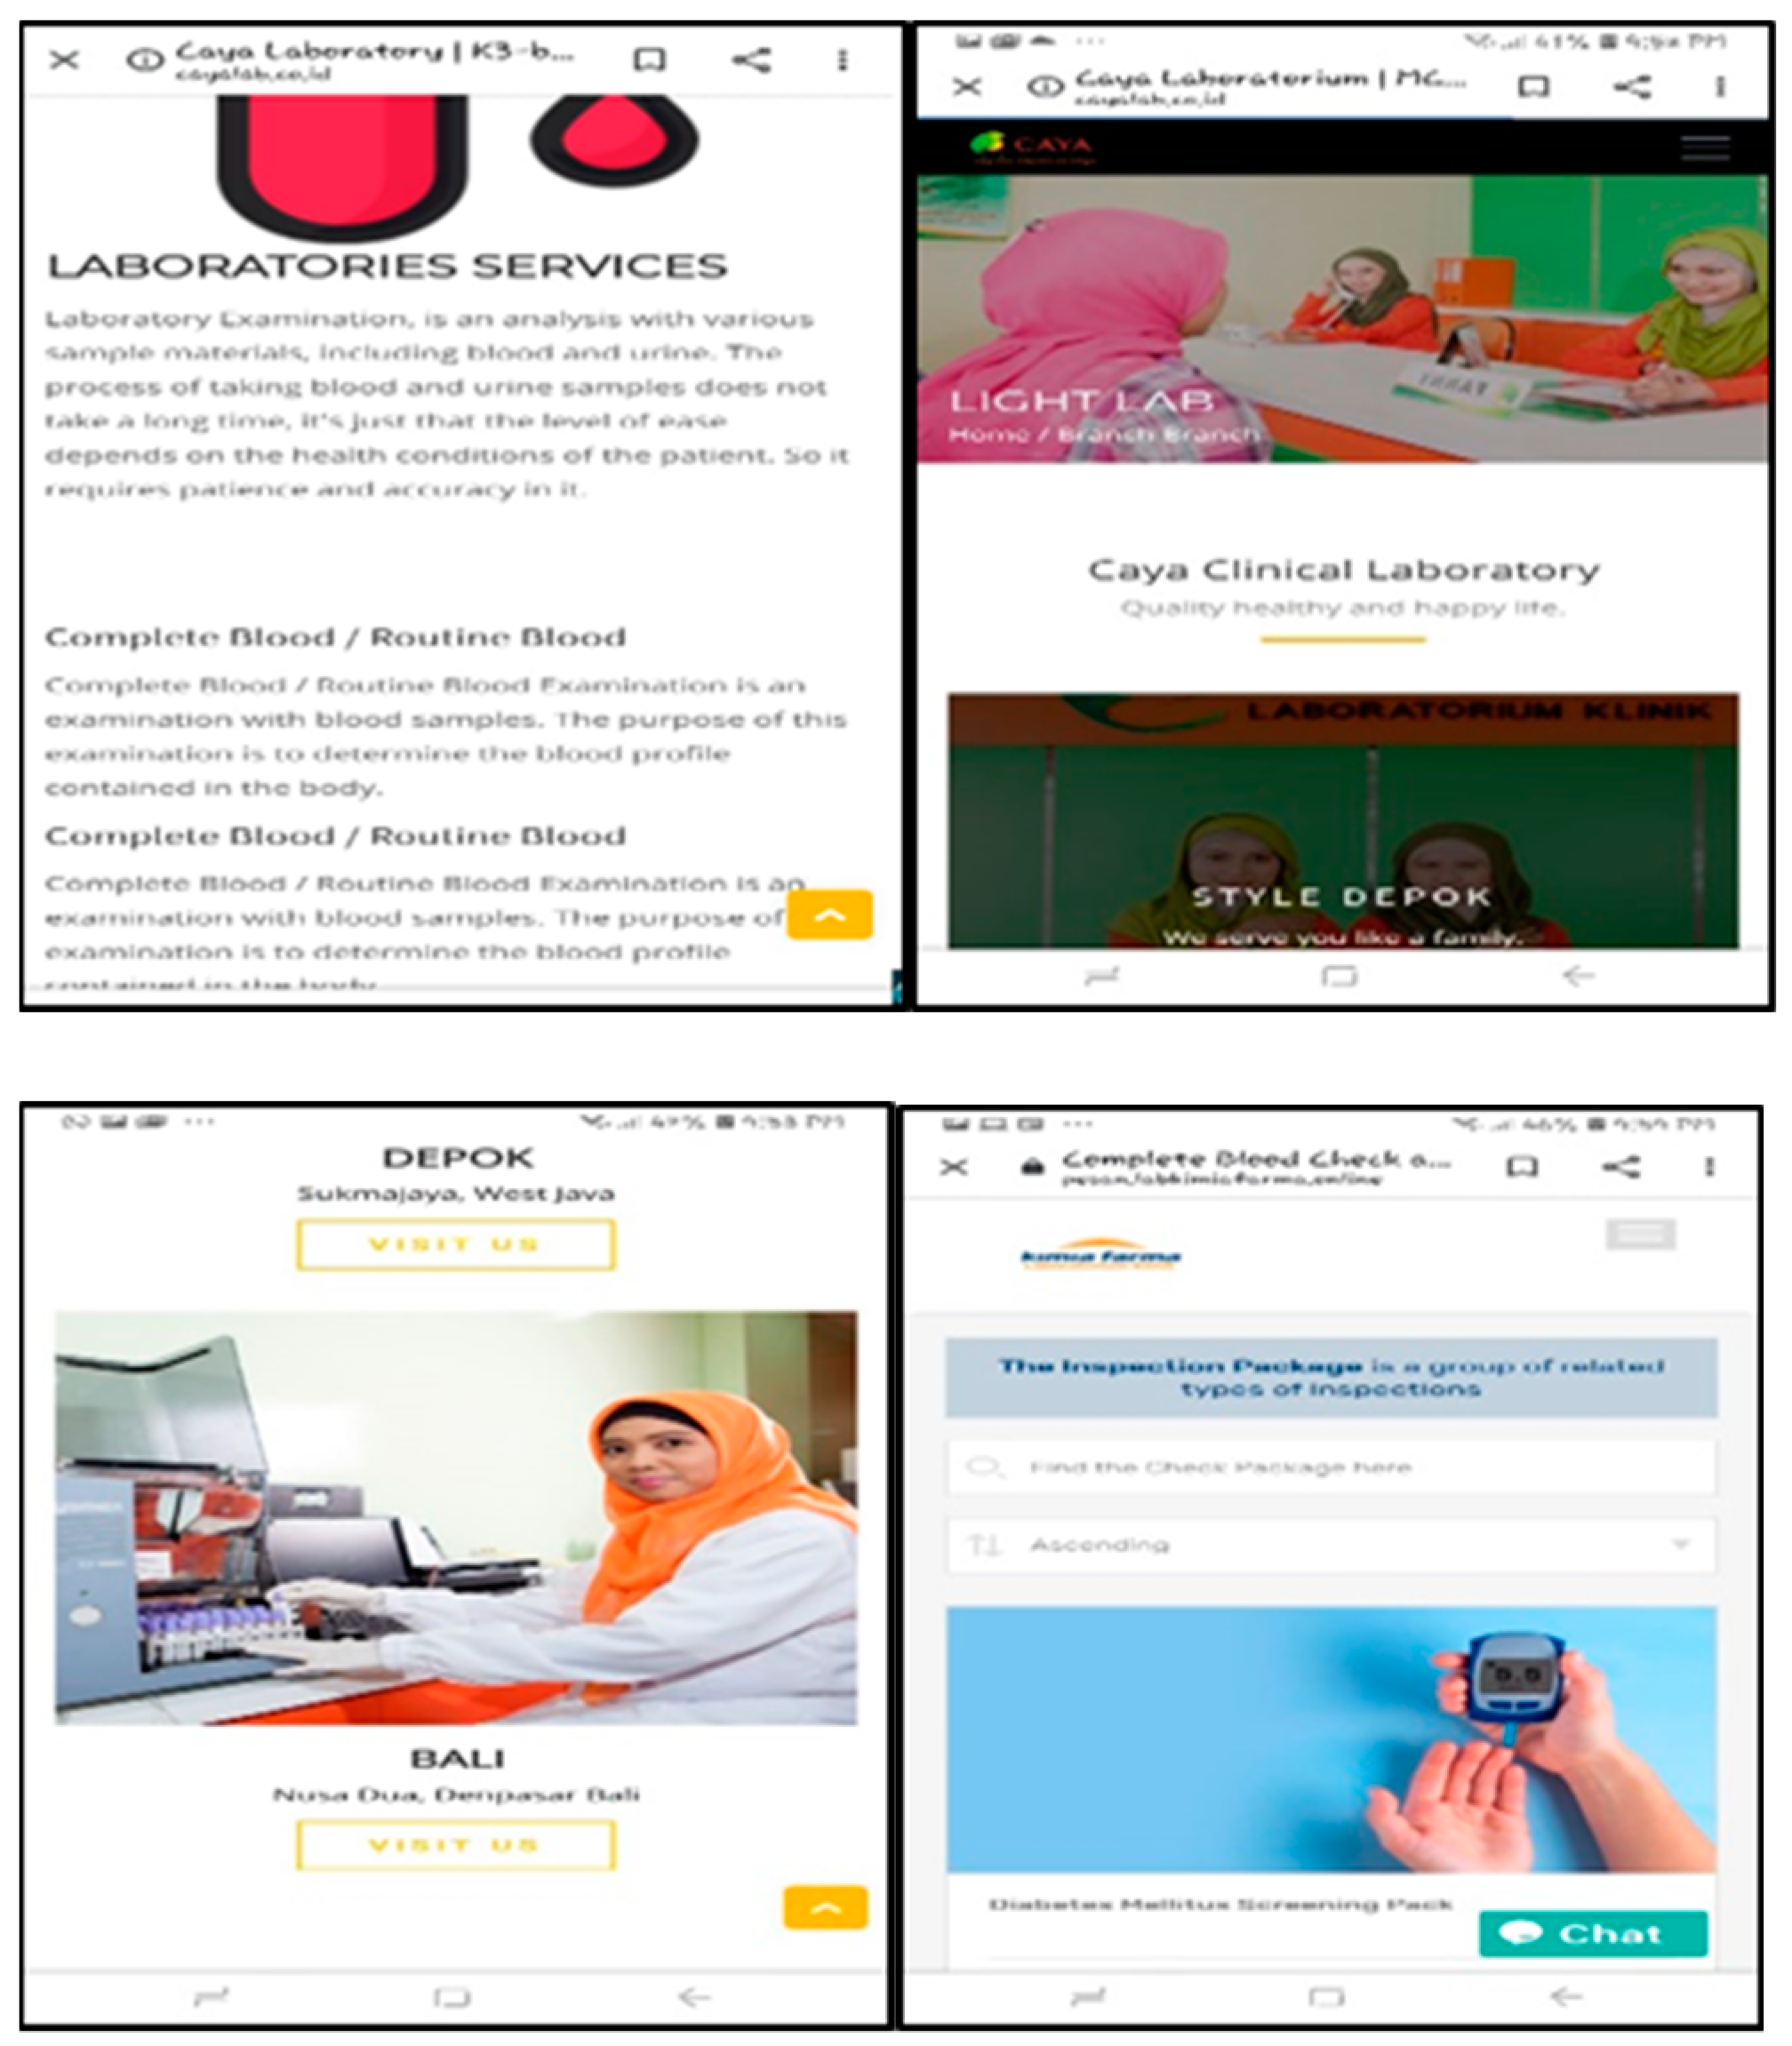
2.1. E-Health Laboratory in Indonesia
- Record standards for identification of the patient’s basic demographics and diagnose clinical information at the first visit;
- Standard update notes to correct problems and to update medicine lists, and to arrange progress notes, laboratory reports, consultations, and other documentation in the notes;
- Recording standards for major complaints, related symptoms, treatment plans, follow-up plans, provider signatures, and dates of subsequent visits;
- Preventive care planning standards including immunization and patient education; and
- Standards of care planning for follow-up referrals to hospitals and laboratory results and expert consultants.
2.2. Task–Technology Fit
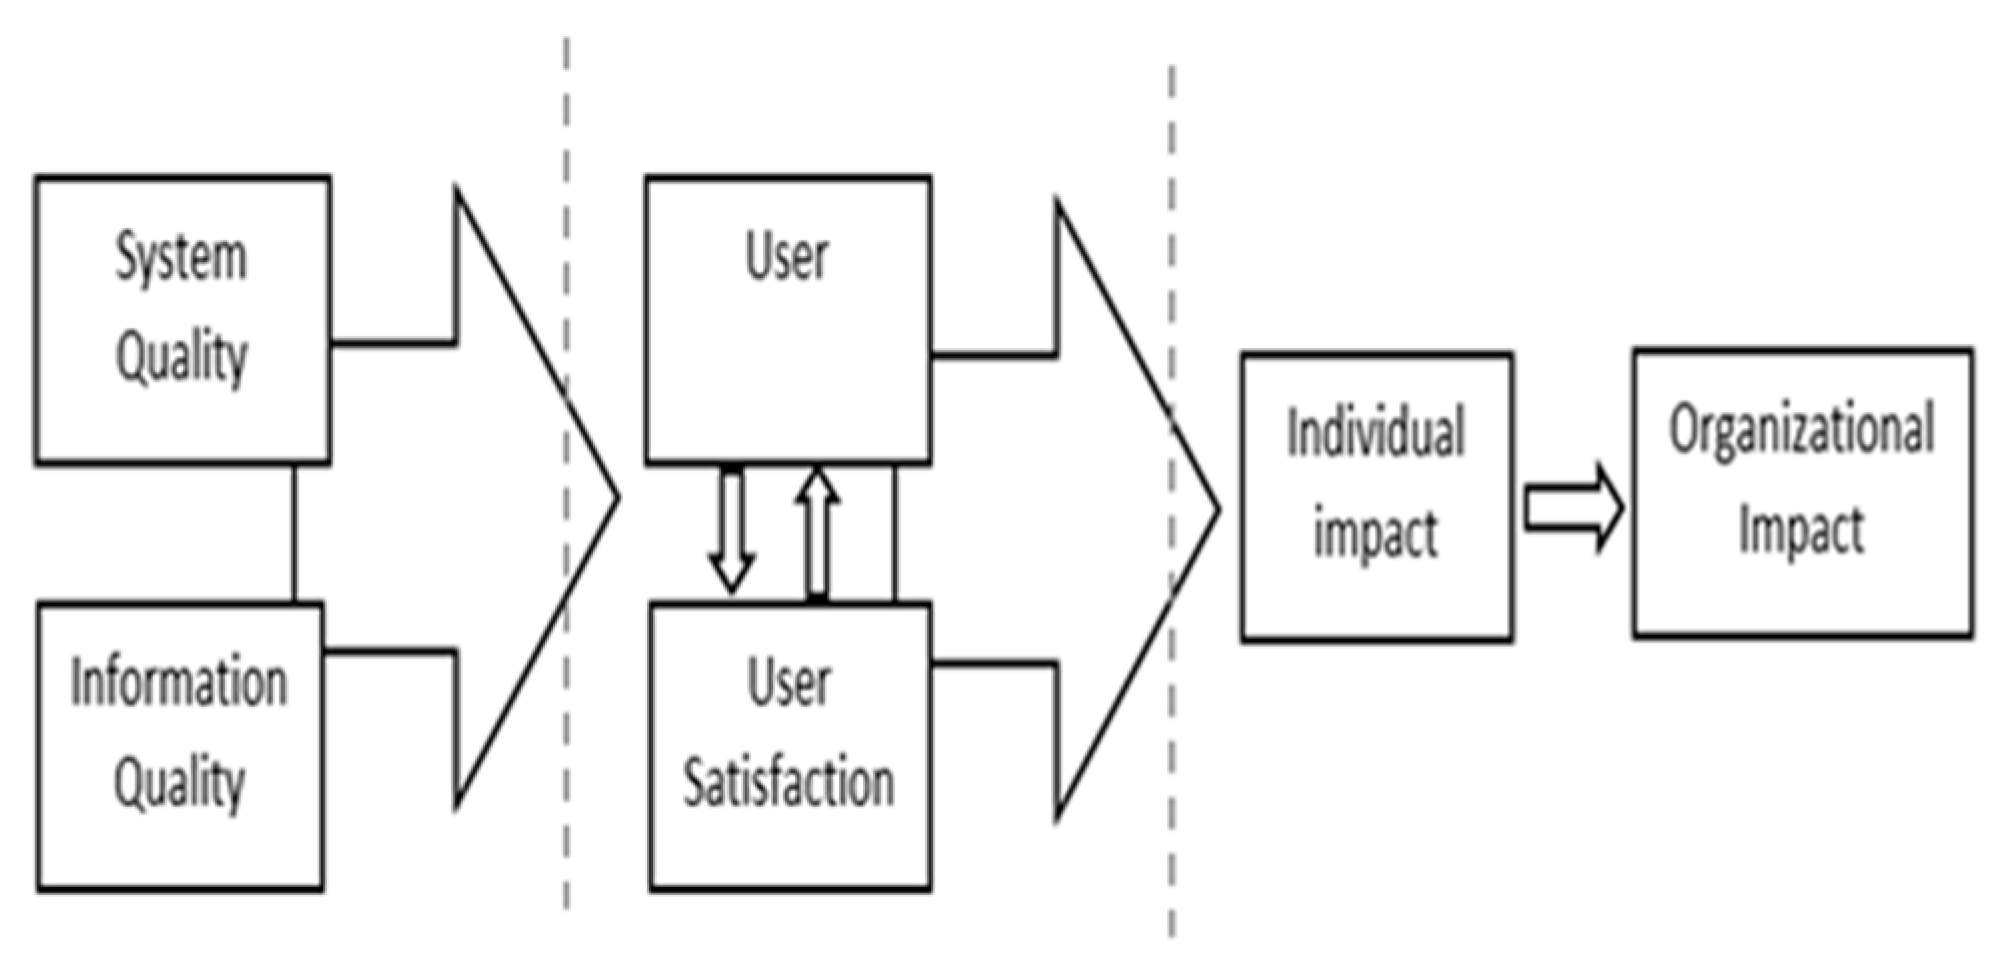
2.3. DeLone and McLean IS Success Model
2.4. Technology Readiness Index
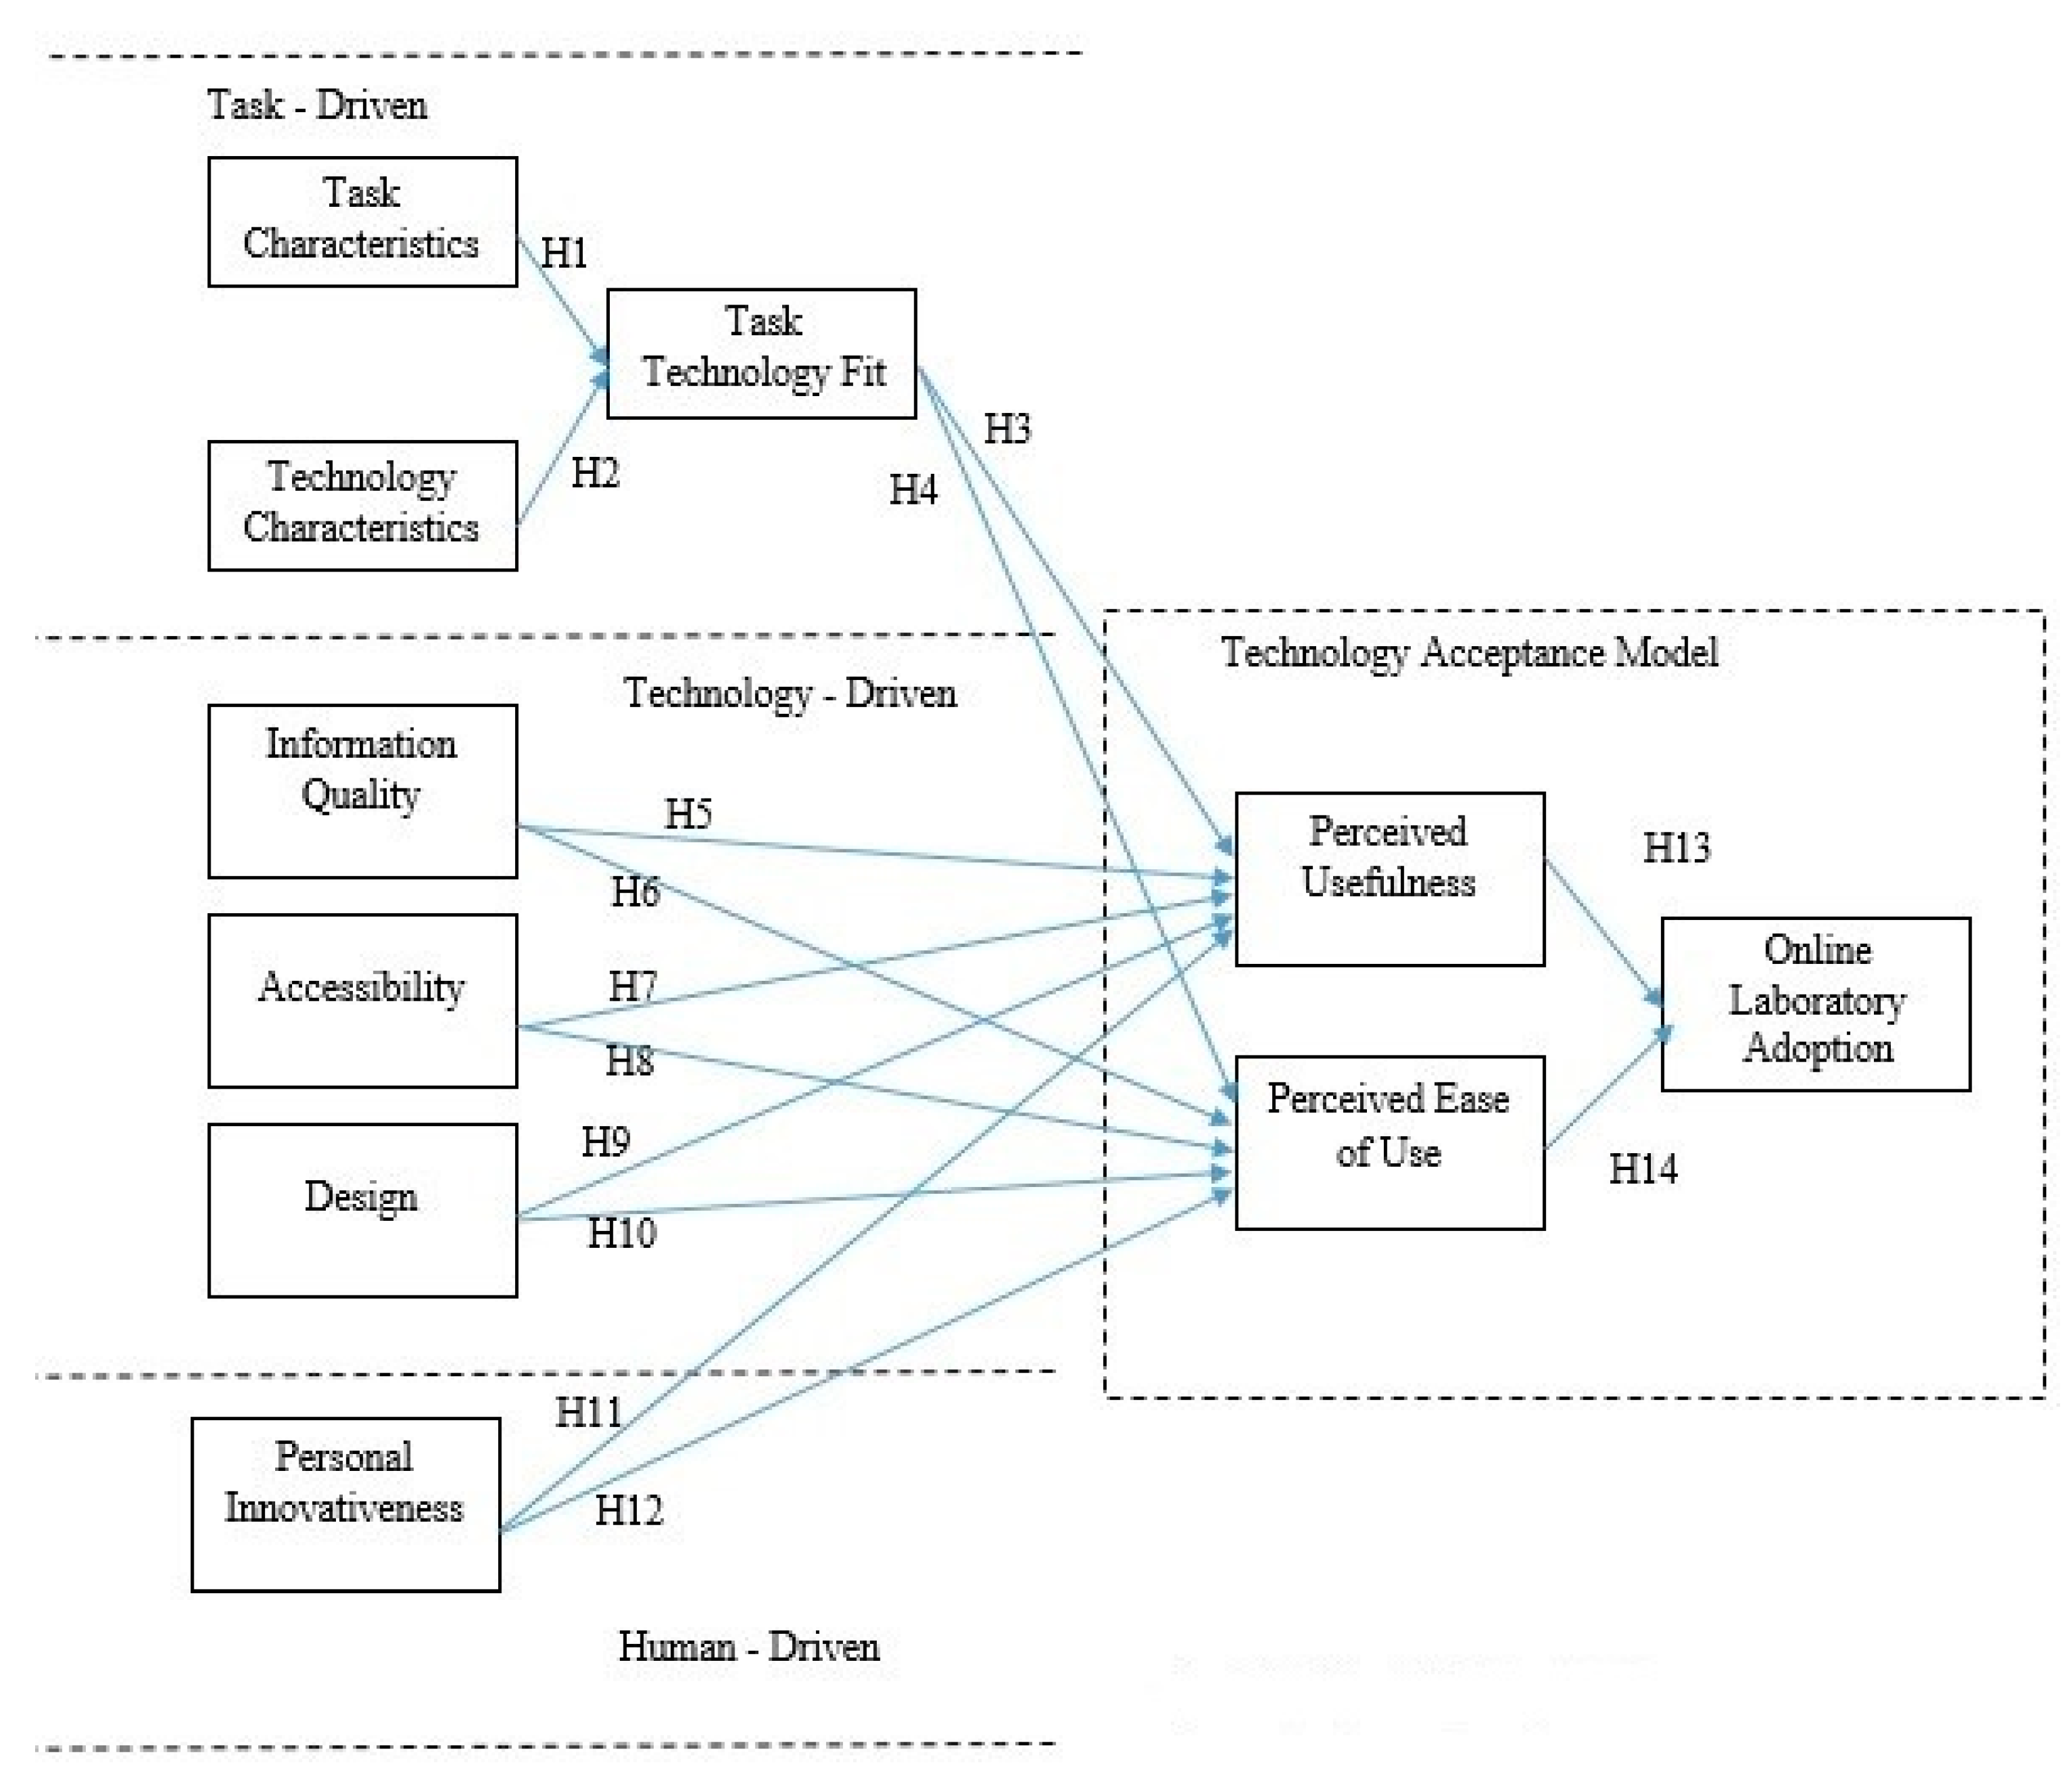
3. Research Model and Hypotheses
3.1. The Task-Driven Issue
3.2. The Technology Driven Issue
3.3. The Human-Driven Issue
3.4. The Technology Acceptance Model Issue
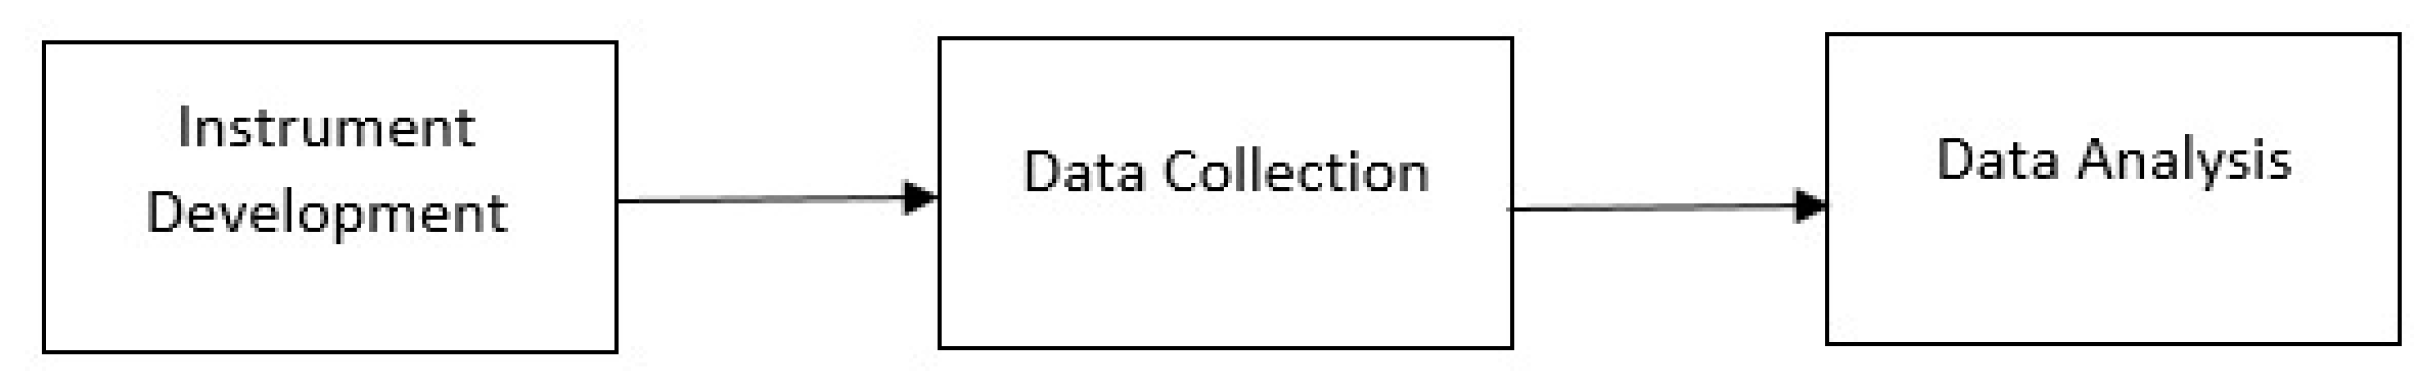
4. Methodology
4.1. Instrument Development
4.2. Data Collection
4.3. Data Analysis
5. Results and Data Analysis
5.1. Respondent Demographics
5.2. Analysis of the Measurement Model
5.3. Analysis of the Structural Model
6. Discussion
6.1. Theoretical Implications
6.2. Managerial Implications
6.3. Limitations and Future Research
7. Conclusions
Author Contributions
Funding
Data Availability Statement
Acknowledgments
Conflicts of Interest
Appendix A

| Items | Frequency | Percentage |
|---|---|---|
| Sex | ||
| Male | 72 | 44.17 |
| Female | 91 | 55.83 |
| Age | ||
| <14 | 0 | - |
| 14–20 | 5 | 3.07 |
| 21–29 | 21 | 12.88 |
| 30–35 | 36 | 22.09 |
| 36–40 | 17 | 10.43 |
| 41–55 | 79 | 48.47 |
| >56 | 5 | 3.07 |
| Education | ||
| High school | 10 | 6.13 |
| Diploma | 13 | 7.98 |
| Bachelor | 55 | 33.74 |
| Postgraduate | 85 | 52.15 |
| Student | 13 | 7.98 |
| Profession | ||
| Civil Servants | 18 | 11.04 |
| BUMN Employee | 9 | 5.52 |
| Private Employees | 51 | 31.29 |
| Entrepreneur | 16 | 9.82 |
| Lecturer | 20 | 12.27 |
| Housewife | 9 | 5.52 |
| Others | 27 | 16.56 |
| Location | ||
| Java (Jabodetabek) | 71 | 43.56 |
| Java (Non Jabodetabek) | 51 | 31.29 |
| Sumatera | 31 | 19.02 |
| Borneo | 1 | 0.61 |
| Sulawesi | 2 | 1.23 |
| Bali, NTT, NTB | 6 | 3.68 |
| Irian, Papua | 1 | 0.61 |
| Salary (IDR) | ||
| <1,000,000 (USD 68,45) | 11 | 6.75 |
| 1,000,001–5,000,000 (USD 68.45–342.24) | 50 | 30.67 |
| 5,000.001–10,000,000 (USD 342.25–684.49) | 71 | 43.56 |
| 10,000,001–15,000,000 (USD 684.50–1026.73) | 17 | 10.43 |
| 15,000,001–20,000,000 (USD 1026.74–1368.98) | 3 | 1.84 |
| >20,000,000 (USD 1368.98) | 11 | 6.75 |
Appendix B
- Task Characteristics (TC)
- TC1
- I need to manage my health information in an online laboratory anytime and anywhere.
- TC2
- I need to access my health information anytime and anywhere.
- TC3
- I must have real time control of my health information in online laboratory.
- Technology Characteristics (TCC)
- TCC1
- Online laboratories provide health information services that can be accessed anytime and anywhere.
- TCC2
- Online laboratories provide health information services in real time.
- TCC3
- Online laboratories provide fast health information services.
- TCC4
- Online laboratories provide safe health information services.
- Task Technology Fit (TTF)
- TTF1
- The online laboratory already has the features that fit my needs in managing my health information.
- TTF2
- The online laboratory is in accordance with my ways of managing my health information.
- TTF3
- It is easy for me to understand the features of an online laboratory.
- TTF5
- The online laboratory is suitable for assisting me in managing my health information.
- Information Quality (IQ)
- IQ1
- Online laboratories provide information that fits my needs.
- IQ2
- Online laboratories provide accurate information.
- IQ3
- Online laboratories provide up-to-date information.
- IQ4
- Online laboratories provide complete information.
- IQ5
- Online laboratories provide clear information in a good format.
- Accessibility (AC)
- AC1
- Online laboratories can be accessed anytime and anywhere.
- AC2
- Online laboratories can be accessed under any conditions.
- AC3
- Online laboratories can be accessed through various devices (smartphones, laptops, etc.)
- Design (DE)
- DE1
- Online laboratories have an attractive appearance.
- DE2
- Online laboratories have the features and the functions needed.
- DE3
- Online laboratories have a structured appearance.
- Personal Innovativeness (PI)
- PI1
- I will be the first to use a new technology compared to others.
- PI2
- It is great to be the first to have a new technology.
- PI3
- Being the first in using new technology is important for me.
- PI4
- I always want to use the latest technology products that are safe.
- Perceived Usefulness (PU)
- PU1
- Online laboratories increase my effectiveness in obtaining my health information.
- PU2
- Online laboratories facilitate me to retrieve my health information.
- PU3
- Online laboratories allow me to retrieve my health information faster.
- PU4
- In general, I can say that the online laboratory is very useful for me.
- Perceived Ease of Use (PE)
- PE1
- Online laboratory is easy to learn.
- PE2
- Online laboratories are easy to use because of the simple way to use.
- PE3
- Online laboratories are easy to navigate.
- Adoption Intention (AI)
- AI1
- I plan to use this online laboratory in the future.
- AI2
- I will recommend an online laboratory to my friends.
- AI3
- I intend to continue using online laboratories in the future.
References
- Miniwatts Marketing Group. Internet Usage Statistics: The Internet Big Picture World Internet Users and 2019 Population Stats. 2019. Available online: https://www.internetworldstats.com/stats.htm (accessed on 27 July 2019).
- Miniwatts Marketing Group. Indonesia Inter-Net Usage and Telecommunications Reports. 2019. Available online: https://www.internetworldstats.com/asia.htm#id (accessed on 27 July 2019).
- APJII. Hasil Survei Penetrasi dan Perilaku Pengguna Internet Indonesia 2018. 2018. Available online: https://www.apjii.or.id/content/read/39/410/Hasil-Survei-Penetrasi-dan-Perilaku-Pengguna-Internet-Indonesia-2018 (accessed on 27 July 2019).
- WHO. Global Diffusion of eHealth-Making Universal Health Coverage Achievable. 2016. Available online: https://apps.who.int/iris/bitstream/handle/10665/252529/9789241511780-eng.pdf?sequence=1#page=31 (accessed on 27 July 2019).
- Evans, R.S. Electronic Health Records: Then, Now and in the Future. Yearb. Med. Inf. 2016, 1, 48–61. [Google Scholar] [CrossRef]
- Henricks, W.H. “Meaningful use” of electronic health records and its relevance to laboratories and pathologists. J. Pathol. Inform. 2011, 2, 7. [Google Scholar] [CrossRef]
- Polityka Insight. Transforming eHealth into a Political and Economic Advantage. 2017. Available online: https://ec.europa.eu/digital-single-market/en/news/transforming-ehealth-political-and-economic-advantage (accessed on 27 July 2019).
- WHO. Directory of eHealth Policies. 2016. Available online: https://www.who.int/goe/policies/en/ (accessed on 27 July 2019).
- WHO. Electronic Health Records: Manual for Developing Countries. Manila: WHO Regional Office for the Western Pacific. 2019. Available online: https://apps.who.int/iris/handle/10665/207504 (accessed on 10 August 2019).
- McKinsey, Can eHealth Solve China’s Healthcare Challenges. 2019. Available online: https://www.slideshare.net/fle864/20150402-chic-mc-k-e-health-in-china-vf (accessed on 27 July 2019).
- Zayyad, M.A.; Toycan, M. Factors affecting sustainable adoption of e-health technology in developing countries: An exploratory survey of Nigerian hospitals from the perspective of healthcare professionals. PeerJ 2018, e4436. [Google Scholar] [CrossRef] [PubMed]
- CPC Central Committee State Council. Healthy China 2030. 2017. Available online: http://www.gov.cn/xinwen/2016-10/25/content_5124174.htm (accessed on 27 July 2019)In Chinese.
- Wong, Y. The New Chinese e-Health Revolution; Healthcare Bus. Int.: London, UK, 2018. [Google Scholar]
- WHO. Innovation to Implementation e-Health in the WHO European Region. 2016. Available online: http://www.euro.who.int/data/assets/pdf_file/0012/302331/FromInnovation-to-Implementation-eHealth-Report-EU.pdf (accessed on 27 July 2019).
- Kutia, S.; Chauhdary, S.H.; Iwendi, C.; Member, S.; Liu, L.I.N.; Yong, W.; Bashir, A.L.I.K.; Member, S. Socio-Technological Factors Affecting User’s Adoption of eHealth Functionalities: A Case Study of China and Ukraine eHealth Systems. IEEE Access 2019, 7, 90777–90788. [Google Scholar] [CrossRef]
- PesanLab.com, Pesan Tes Lab Online dari Laboratorium Klinik Pilihan Anda. 2017. Available online: https://pesanlab.com/ (accessed on 10 August 2019).
- WHO, Primary Health Care: Now More Than Ever. 2019. Available online: https://www.who.int/whr/2008/en/ (accessed on 10 August 2019).
- Mater, W.; Aldwairi, M.; Ibrahim, R. Enhanced Teamwork Communication Model for Electronic Clinical Pathways in Healthcare. Open Bioinform. J. 2018, 11, 140–163. [Google Scholar] [CrossRef]
- Rodrigues, J.J.; Compte, S.S.; De la Torre Diez, I. e-Health Systems: Theory and Technical Applications; ISTE Press Ltd.: London, UK, 2016. [Google Scholar]
- Heart, T.; Ben-assuli, O.; Shabtai, I. A review of PHR, EMR and EHR integration: A more personalized healthcare and public health policy. Health Policy Technol. 2017, 6, 20–25. [Google Scholar] [CrossRef]
- Diana, A.L.Y.; Hollingworth, S.A.; Marks, G.C. Quality of physical resources of health facilities in Indonesia: A panel study 1993–2007. Int. J. Qual. Health Care 2013, 25, 488–496. [Google Scholar] [CrossRef][Green Version]
- Wahyuni, R. Explaining acceptance of e-health services: An extension of TAM and Health Belief Model Approach. In Proceedings of the 5th International Conference on Information Technology for Cyber and IT Service Management (CITSM 2017), Kota Denpasar, Indonesia, 8–10 August 2017. [Google Scholar]
- Tan, P.J.B.; Hsu, M.-H.; Wahl, J.H. Teaching the Right Things and Teaching the Things Right: Professional Development for Mariners. Educ. Innov. Appl. 2019, 1, 535–538. [Google Scholar]
- Juinn Bing Tan, P.; Hsu, M.-H. Interactive Instructional Device. Children 2019, 3, 95–98. [Google Scholar]
- Tan, P.J.B.; Hsu, M.H. Designing a system for English evaluation and teaching devices: A PZB and TAM model analysis. Eurasia J. Math. Sci. Technol. Educ. 2018, 14, 2107–2119. [Google Scholar] [CrossRef]
- Tan, P.J.B. An empirical study of how the learning attitudes of college students toward English E-Tutoring websites affect site sustainability. Sustainability 2019, 11, 1748. [Google Scholar] [CrossRef]
- Tan, P.J.B. English e-learning in the virtual classroom and the factors that influence ESL (English as a Second Language): Taiwanese citizens’ acceptance and use of the Modular Object-Oriented Dynamic Learning Environment. Soc. Sci. Inf. 2015, 54, 211–228. [Google Scholar] [CrossRef]
- Ardian, M.; Chalidyanto, D. Implementation E-Health System on Use Behavior Customer based on Unified Theory of Acceptance and Use of Technology (Utaut). Indian J. Public Health Res. Dev. 2018, 9, 245–250. [Google Scholar]
- Tan, P.J.B. Applying the UTAUT to understand factors affecting the use of english e-learning websites in Taiwan. SAGE Open 2013, 3. [Google Scholar] [CrossRef]
- Pinem, A.A.; Sandhyaduhita, P.; Hidayanto, A.N. Barriers for Integration between Hospitals and the Ministry of Health in Indonesia. In Proceedings of the MakeLearn and TIIM Joint International Conference, Bari, Italy, 27–29 May 2015. [Google Scholar]
- Wahyuni, T.; Parasetorini, A.; Rekam, P.; Kesehatan, I.; Administrasi, P.; Sakit, R. Metode Hot Fit untuk Mengukur Tingkat Kesiapan SIM RS dalam Mendukung Implementasi E-Health. J. Manaj. Inf. Kesehat. Indones. 2019, 7, 71–75. [Google Scholar]
- Sandhyaduhita, P.; Science, C.; Indonesia, U. Hospital Service Quality from Patients Perspective: A Case of Indonesia. Int. J. E-Health Med. Commun. (IJEHMC) 2016, 7, 48–61. [Google Scholar] [CrossRef]
- Restivo, M.T.; Cardoso, A. Exploring online experimentation. Int. J. Online Eng. 2013, 9, 4–6. [Google Scholar] [CrossRef]
- Sell, R. Remote laboratory portal for robotic and embedded system experiments. Int. J. Online Eng. 2013, 9, 23–26. [Google Scholar] [CrossRef]
- Titov, I.; Titov, E. Labicom.net—Putting your laboratory online in less than five minutes with WebPager tool: Automatic generation and real-time control of a LabVIEW based laboratory server from pluginless HTML page. In Proceedings of the 2nd Experiment International Conference, Coimbra, Portugal, 18–20 September 2013; pp. 180–183. [Google Scholar]
- Restivo, M.T.; Da Silva, M.G. Portuguese Universities Sharing Remote Laboratories. Int. J. Online Eng. 2009, 5, 16–19. [Google Scholar] [CrossRef][Green Version]
- Lei, Z.; Hu, W.; Deng, Q.; Liu, Z.-W. HTML5-Based 3-D Online Control Laboratory With Virtual Interactive Wiring Practice. IEEE Trans. Ind. Inform. 2018, 14, 2473–2483. [Google Scholar] [CrossRef]
- Veteran, L.P. Home: Layanan Laboratorium Patologi Veteran. 2019. Available online: http://lab.dwiza.web.id/ (accessed on 10 August 2019).
- Cayalab.co.id. Home: Caya Laboratorium Klinik. 2019. Available online: http://cayalab.co.id/ (accessed on 10 August 2020).
- WHO, Medical Records Manual: A Guide for Developing Countries. 2019. Available online: https://apps.who.int/iris/handle/10665/208125 (accessed on 10 August 2019).
- Goldfarb, N.I. Assessing Quality of Primary Care through Medical Record Review: Lessons and Opportunities. 2019. Available online: http://jdc.jefferson.edu/cgi/viewcontent.cgi?article=1145andcontext=hpn (accessed on 10 August 2019).
- Afrizal, S.H.; Hidayanto, A.N.; Handayani, P.W.; Budiharsana, M.; Eryando, T. Narrative review for exploring barriers to readiness of electronic health record implementation in primary health care. Healthc. Inform. Res. 2019, 25, 141–152. [Google Scholar] [CrossRef] [PubMed]
- Goodhue, D.L.; Thompson, R.L.; Goodhue, B.D.L.; Thompson, R.L. Task-Technology Fit and Individual Performance. JSTOR 2014, 19, 213–236. [Google Scholar] [CrossRef]
- Lin, T.; Huang, C. Understanding knowledge management system usage antecedents: An integration of social cognitive theory and task technology fit. Inf. Manag. 2008, 45, 410–417. [Google Scholar] [CrossRef]
- Lin, W. Perceived fit and satisfaction on web learning performance: IS continuance intention and task-technology fit perspectives. J. Hum. Comput. Stud. 2012, 70, 498–507. [Google Scholar] [CrossRef]
- Yen, D.C.; Wu, C.; Cheng, F.; Huang, Y. Computers in Human Behavior Determinants of users’ intention to adopt wireless technology: An empirical study by integrating TTF with TAM. Comput. Hum. Behav. 2010, 26, 906–915. [Google Scholar] [CrossRef]
- Taylor, P.; Kuo, R.; Lee, G. Technology Knowledge management system adoption: Exploring the effects of empowering leadership, task-technology fit and compatibility. Behav. Inf. 2011, 37–41. [Google Scholar]
- D’Ambra, J.; Wilson, C.S.; Akter, S. Application of the task-technology fit model to structure and evaluate the adoption of E-books by academics. J. Am. Soc. Inf. Sci. Technol. 2013, 64, 48–64. [Google Scholar] [CrossRef]
- Larsen, T.J.; Sørebø, A.M.; Sørebø, Ø. Computers in Human Behavior The role of task-technology fit as users’ motivation to continue information system use. Comput. Hum. Behav. 2009, 25, 778–784. [Google Scholar] [CrossRef]
- Mcgill, T.J.; Klobas, J.E. A task—Technology fit view of learning management system impact. Comput. Educ. 2009, 52, 496–508. [Google Scholar] [CrossRef]
- Zhou, T.; Lu, Y.; Wang, B. Computers in Human Behavior Integrating TTF and UTAUT to explain mobile banking user adoption. Comput. Hum. Behav. 2010, 26, 760–767. [Google Scholar] [CrossRef]
- Huang, T.C.; Wu, I.; Chou, C. Investigating use continuance of data mining tools. Int. J. Inf. Manag. 2013, 33, 791–801. [Google Scholar] [CrossRef]
- Shannon, C.E.; Weaver, W. A Mathematical Model of Communication; University of Illinois Press: Chicago, IL, USA, 1949. [Google Scholar]
- Masen, R.O. Measuring Information Output: A Comunication System Approach. Inf. Manag. 1978, 1, 219–234. [Google Scholar] [CrossRef]
- Pitt, L.F.; Watson, R.T.; Kavan, C.B. Service quality: A measure of information systems effectiveness. MIS Q. Manag. Inf. Syst. 1995, 19, 173–185. [Google Scholar] [CrossRef]
- Petter, S.; Delone, W.; Mclean, E.R. Information Systems Success: The Quest for the Independent Variables. J. Manag. Inf. 2013, 29, 37–41. [Google Scholar] [CrossRef]
- Dinev, T.; Albano, V.; Xu, H.; D’Atri, A.; Hart, P. Individuals’ Attitudes towards Electronic Health Records: A Privacy Calculus Perspective. In Advances in Healthcare Informatics and Analytics; Springer: Cham, Switzerland, 2016; ISBN 9783319232942. [Google Scholar]
- Delone, W.H.; McLean, E.R. Information Systems Success Measurement; Foundations and Trends® in Information Systems 2.1: Auburn, AL, USA, 2016; ISBN 9781680831429. [Google Scholar]
- Schaupp, L.C.; Fan, W.; Belanger, F. Determining Success for Different Website Goals. In Proceedings of the 39th Annual Hawaii International Conference on System Sciences (HICSS’06), Kauai, HI, USA, 4–7 January 2006. [Google Scholar]
- Velasquez, N.F. Studying Knowledge Management System Success in System Administration. In Proceedings of the 42nd Hawaii International Conference on System Sciences, Big Island, HI, USA, 5–8 January 2009. [Google Scholar]
- Cheok, M.L. Predictors of E-Learning Satisfaction in Teaching and Learning for School Teachers: A Literature Review. Int. J. Instr. 2015, 8, 75–90. [Google Scholar] [CrossRef]
- Lin, H. Measuring Online Learning Systems Success: Applying the Updated DeLone and McLean Model. CyberPsychol. Behav. 2007, 10, 817–821. [Google Scholar] [CrossRef]
- Urbach, N.; Smolnik, S.; Riempp, G. An empirical investigation of employee portal success. J. Strateg. Inf. Syst. 2010, 19, 184–206. [Google Scholar] [CrossRef]
- Tsai, W.; Lee, P.; Shen, Y.; Lin, H. A comprehensive study of the relationship between enterprise resource planning selection criteria and enterprise resource planning system success. Inf. Manag. 2012, 49, 36–46. [Google Scholar] [CrossRef]
- Maillet, É.; Mathieu, L.; Sicotte, C. Modeling factors explaining the acceptance, actual use and satisfaction of nurses using an Electronic Patient Record in acute care settings: An extension of the UTAUT. Int. J. Med. Inform. 2014, 1–12. [Google Scholar] [CrossRef]
- Hsu, M.; Chang, C.; Chu, K.; Lee, Y. Computers in Human Behavior Determinants of repurchase intention in online group-buying: The perspectives of DeLone & McLean IS success model and trust. Comput. Hum. Behav. 2014, 36, 234–245. [Google Scholar]
- Zhou, T. An empirical examination of continuance intention of mobile payment service. Decis. Support System. 2013, 54, 1085–1091. [Google Scholar] [CrossRef]
- Bossen, C.; Groth, L.; Witt, F. Evaluation of a comprehensive EHR based on the DeLone and McLean model for IS success: Approach, results and success factors. Int. J. Med. Inform. 2013, 82, 940–953. [Google Scholar] [CrossRef] [PubMed]
- Ling, L.M.; Moi, C.M. Professional Students’ Technology Readiness, Prior Computing Experience and Acceptance of an E-Learning System. Malays. Acc. Rev. 2007, 6, 85–99. [Google Scholar]
- Al-busaidi, K.A. Learners’ Perspective on Critical Factors to LMS Success in Blended Learning: An Empirical Investigation. Commun. Assoc. Inf. Syst. 2012, 30, 10–35. [Google Scholar] [CrossRef]
- Wu, I.; Li, J.; Fu, C. The adoption of mobile healthcare by hospital’s professionals: An integrative perspective. Decis. Support Syst. 2011, 51, 587–596. [Google Scholar] [CrossRef]
- Agarwal, R.; Prasad, J. The antecedents and consequents of user perceptions in information technology adoption. Decis. Support Syst. 1998, 22, 15–29. [Google Scholar] [CrossRef]
- Karahanna, E.; Straub, D.W.; Chervany, N.L. Information technology adoption across time: A cross-sectional comparison of pre-adoption and post-adoption beliefs. MIS Q. Manag. Inf. Syst. 1999, 23, 183–213. [Google Scholar] [CrossRef]
- Legris, P.; Ingham, J.; Collerette, P. Why do people use information technology? A critical review of the technology acceptance model. Inf. Manag. 2003, 40, 191–204. [Google Scholar] [CrossRef]
- Tam, C.; Oliveira, T. Understanding the impact of m-banking on individual performance: DeLone & McLean and TTF perspective. Comput. Hum. Behav. 2016, 61, 233–244. [Google Scholar]
- Alqatan, S.; Noor, N.M.M.; Man, M.; Mohemad, R. A theoretical discussion of factors affecting the acceptance of m-commerce among SMTEs by integrating TTF with TAM. Int. J. Bus. Inf. Syst. 2017, 26, 66–111. [Google Scholar] [CrossRef]
- Chang, S. The Literature Review of Technology Acceptance Model: A Study of the Bibliometric Distributions. In Proceedings of the Taipei Pacific Asia Conference on Information System, Taipei, Taiwan, 9–12 July 2010. [Google Scholar]
- Lin, W.; Wang, C.; Lin, W.; Wang, C. Antecedences to continued intentions of adopting e-learning system in blended learning instruction: A contingency framework based on models of information system success and task-technology fit. Comput. Educ. 2018, 58, 88–99. [Google Scholar] [CrossRef]
- Kim, T.T.; Lee, G. Modelling roles of task-technology fit and self-efficacy in hotel employees’ usage behaviours of hotel information systems. Int. J. Tour. Res. 2010, 12, 709–725. [Google Scholar] [CrossRef]
- Yu, T.; Yu, T. Modelling the factors that affect individuals’ utilisation of online learning systems: An empirical study combining the task technology fit model with the theory of planned behaviour. Br. J. Educ. Technol. 2010, 41, 1003–1017. [Google Scholar] [CrossRef]
- Lu, H.; Yang, Y. Computers in Human Behavior Toward an understanding of the behavioral intention to use a social networking site: An extension of task-technology fit to social-technology fit. Comput. Hum. Behav. 2014, 34, 323–332. [Google Scholar] [CrossRef]
- Gorla, N.; Somers, T.M.; Wong, B. Organizational impact of system quality, information quality, and service quality. J. Strateg. Inf. Syst. 2010, 19, 207–228. [Google Scholar] [CrossRef]
- Bailey, J.E.; Pearson, S.W. Development of A Tool For Measuring and Analyzing Computer User Satisfaction. Manag. Sci. 1963, 29, 530–545. [Google Scholar]
- Seddon, P.B. A Respectification and Extension of the Delone and McLean Model of IS Success. Inf. Syst. Res. 1997, 8, 240–253. [Google Scholar] [CrossRef]
- Carlos, J.; Chiu, C.; Jose, F. Understanding e-learning continuance intention: An extension of the Technology Acceptance Model. Int. J. Hum.-Comput. Stud. 2006, 64, 683–696. [Google Scholar]
- Lwoga, E. Critical success factors for adoption of web-based learning management systems in Tanzania. Int. J. Educ. Dev. Using Inf. Commun. Technol. 2014, 10, 4–21. [Google Scholar]
- Cheng, Y. Effects of quality antecedents on e-learning acceptance. Internet Res. 2012, 22, 361–390. [Google Scholar] [CrossRef]
- Ahn, T.; Ryu, S.; Han, I. The impact of Web quality and playfulness on user acceptance of online retailing. Inf. Manag. 2007, 44, 263–275. [Google Scholar] [CrossRef]
- Chen, H. Computers & Education Linking employees’ e-learning system use to their overall job outcomes: An empirical study based on the IS success model. Comput. Educ. 2010, 55, 1628–1639. [Google Scholar]
- Ghazal, S.; Al-samarraie, H.; Aldowah, H. “I am Still Learning”: Modeling LMS Critical Success Factors for Promoting Students ’ Experience and Satisfaction in a Blended Learning Environment. IEEE Access 2018, 6, 77179–77201. [Google Scholar] [CrossRef]
- Tantiponganant, P.; Laksitamas, P. An Analysis of the Technology Acceptance Model in Understanding Students’ Behavioral Intention to Use University’s Social Media. In Proceedings of the 2014 IIAI 3rd International Conference on Advanced Applied Informatics, Kitakyushu, Japan, 31 August–4 September 2014; ISBN 9781479941735. [Google Scholar]
- Masrom, M.; Zainon, O.; Rahiman, R. Critical Success in E-learning: An Examination of Technological and Institutional Support Factors. Int. J. Cyber Soc. Educ. 2008, 1, 131–142. [Google Scholar]
- Poon, W.; Low, K.L.; Yong, D.G. A study of Web-based learning (WBL) environment in Malaysia. Int. J. Educ. Manag. 2004, 18, 374–385. [Google Scholar] [CrossRef]
- Park, S.Y.; Nam, M.; Cha, S. University students’ behavioral intention to use mobile learning: Evaluating the technology acceptance model. Br. J. Educ. Technol. 2011, 43, 592–605. [Google Scholar] [CrossRef]
- Lee, Y.; Hsiao, C.; Purnomo, S.H. An empirical examination of individual and system characteristics on enhancing e-learning acceptance. Australas. J. Educ. Technol. 2014, 30, 562–579. [Google Scholar] [CrossRef]
- Taylor, P.; Wu, B.; Zhang, C. Empirical study on continuance intentions towards E- Learning 2.0 systems. Behav. Inf. Technol. 2014, 33, 37–41. [Google Scholar]
- DeLone, W.; McLean, E. The DeLone and McLean Model of Information Systems Success: A Ten-Year Update. J. Manag. Inf. Syst. 2003, 19, 9–30. [Google Scholar]
- Allen, M.; Currie, L.M.; Bakken, S.; Patel, V.L.; Cimino, J.J. Heuristic evaluation of paper-based Web pages: A simplified inspection usability methodology. J. Biomed. Inform. 2006, 39, 412–423. [Google Scholar] [CrossRef][Green Version]
- Rivero, L.; Kalinowski, M. Practical Findings from Applying Innovative Design Usability Evaluation Technologies for Mockups of Web Applications. In Proceedings of the 2014 47th Hawaii International Conference on System Science Practical, Waikoloa, HI, USA, 6–9 January 2014; pp. 3054–3063. [Google Scholar]
- Liu, I.; Chang, M.; Sun, Y.S.; Wible, D.; Kuo, C. Extending the TAM model to explore the factors that affect Intention to Use an Online Learning Community. Comput. Educ. 2010, 54, 600–610. [Google Scholar] [CrossRef]
- Hsiao, K.; Chen, C. What drives smartwatch purchase intention? Perspectives from hardware, software, design and value. Telemat. Inform. 2018, 35, 103–113. [Google Scholar] [CrossRef]
- Wu, W.; Shang, D. Employee Usage Intention of Ubiquitous Learning Technology: An Integrative View of User Perception Regarding Interactivity, Software and Hardware. IEEE Access 2019, 7, 34170–34178. [Google Scholar] [CrossRef]
- Klaus, P.; Maklan, S. Towards a Better Measure of Customer Experience. Int. J. Mark. Res. 2013, 55, 227–246. [Google Scholar] [CrossRef]
- Visinescu, L.L.; Sidorova, A.; Jones, M.C.; Prybutok, V.R. The influence of website dimensionality on customer experiences, perceptions and behavioral intentions: An exploration of 2D vs. 3D web design. Inf. Manag. 2015, 52, 1–17. [Google Scholar] [CrossRef]
- Li, H.; Wu, J.; Gao, Y.; Shi, Y. Examining individuals’ adoption of healthcare wearable devices: An empirical study from privacy calculus perspective. Int. J. Med. Inform. 2020, 88, 8–17. [Google Scholar] [CrossRef]
- Taylor, P.; Kwon, O.; Choi, K.; Kim, M. User acceptance of context-aware services: Self-efficacy, user innovativeness and perceived sensitivity on contextual pressure. Behav. Inf. Technol. 2008, 26, 37–41. [Google Scholar]
- Davis, F.D.; Davis, F. Perceived Usefulness, Perceived Ease of Use and User Acceptance of Information Technology. MIS Q. 1989, 6, 319–340. [Google Scholar] [CrossRef]
- Chandra, S. Evaluating the Role of Trust in Consumer Adoption of Mobile Payment Systems: An Empirical Analysis. Commun. Assoc. Inf. Syst. 2010, 27, 561–588. [Google Scholar] [CrossRef]
- Malhotra, N.K. Marketing Research: An Applied Orientation; Pearson Education: Delhi, India, 2006; pp. 2010–2014. [Google Scholar]
- Likert, R. A technique for the measurement of attitudes. Arch. Psychol. 1932, 22, 1–54. [Google Scholar]
- Hinkin, T.R. A Review of Scale Development Practices in the Study of Organizations. J. Manag. 1995, 21, 967–988. [Google Scholar] [CrossRef]
- Stone, E. Research Methods in Organizational Behavior; Scott Foresman: Northbrook, IL, USA, 1978. [Google Scholar]
- Hair, J.F.; Ringle, C.M.; Sarstedt, M. Partial Least Squares Structural Equation Modeling: Rigorous Applications, Better Results and Higher Acceptance. Long Range Plann. 2013, 46, 1–12. [Google Scholar] [CrossRef]
- Hair, J.F.; Risher, J.J.; Sarstedt, M.; Ringle, C.M. When to use and how to report the results of PLS-SEM. Eur. Bus. Rev. 2019, 31, 2–24. [Google Scholar] [CrossRef]
- Diamantopoulos, A.; Siguaw, J.A. Formative Versus Reflective Indicators in Organizational Measure Development: A Comparison and Empirical Illustration. Br. J. Manag. 2006, 17, 263–282. [Google Scholar] [CrossRef]
- Hair, J.F.; Black, W.C.; Babin, B.J.; Anderson, R.E.; Tatham, R.L. Multivariate Data Analysis: A Global Perspective, 7th ed.; Pearson Education Inc.: Hoboken, NJ, USA, 2010. [Google Scholar]
- Chin, W.W. Issues and opinion on structural equation modeling. MIS Q. Manag. Inf. Syst. 1998, 22, 7–16. [Google Scholar]
- Dishaw, M.T.; Strong, D.M. Extending the technology acceptance model with task technology fit constructs. Inf. Manag. 1999, 36, 9–21. [Google Scholar] [CrossRef]


| Construct | Items | Factor Loading | AVE | CR | Cronbach’s Alpha |
|---|---|---|---|---|---|
| Technology Characteristics (TCC) | TCC1 | 0.84 | 0.711 | 0.945 | 0.932 |
| TCC2 | 0.858 | ||||
| TCC3 | 0.843 | ||||
| TCC4 | 0.882 | ||||
| Task Characteristics (TC) | TC1 | 0.927 | 0.887 | 0.959 | 0.936 |
| TC2 | 0.953 | ||||
| TC3 | 0.945 | ||||
| Task Technology Fit (TTF) | TTF1 | 0.866 | 0.734 | 0.943 | 0.926 |
| TTF2 | 0.894 | ||||
| TTF3 | 0.886 | ||||
| TTF4 | 0.906 | ||||
| Information Quality (IQ) | IQ1 | 0.819 | 0.764 | 0.942 | 0.922 |
| IQ2 | 0.887 | ||||
| IQ3 | 0.877 | ||||
| IQ4 | 0.886 | ||||
| IQ5 | 0.898 | ||||
| Accessibility (AC) | AC1 | 0.844 | 0.723 | 0.839 | 0.617 |
| AC2 | 0.856 | ||||
| Design (DE) | DE1 | 0.887 | 0.801 | 0.923 | 0.876 |
| DE2 | 0.912 | ||||
| DE3 | 0.886 | ||||
| Personal Innovativeness (PI) | PI1 | 0.884 | 0.718 | 0.91 | 0.868 |
| PI2 | 0.886 | ||||
| PI3 | 0.847 | ||||
| PI4 | 0.768 | ||||
| Perceived Usefulness (PU) | PU1 | 0.768 | 0.678 | 0.894 | 0.842 |
| PU2 | 0.85 | ||||
| PU3 | 0.803 | ||||
| Perceived Ease of Use (PE) | PE1 | 0.691 | 0.722 | 0.885 | 0.801 |
| PE2 | 0.924 | ||||
| PE3 | 0.914 | ||||
| Adoption Intention (AI) | AI1 | 0.897 | 0.811 | 0.928 | 0.884 |
| AI2 | 0.911 | ||||
| AI3 | 0.894 |
| Construct | AC | AI | DE | IQ | PE | PU | PI | TC | TTF | TCC |
|---|---|---|---|---|---|---|---|---|---|---|
| Accessibility (AC) | 0.85 | |||||||||
| Adoption (AI) | 0.396 | 0.901 | ||||||||
| Design (DE) | 0.448 | 0.377 | 0.895 | |||||||
| Information Quality (IQ) | 0.4 | 0.495 | 0.696 | 0.874 | ||||||
| Perceived Ease of Use (PE) | 0.546 | 0.449 | 0.763 | 0.681 | 0.85 | |||||
| Perceived Usefulness (PU) | 0.508 | 0.633 | 0.476 | 0.529 | 0.538 | 0.824 | ||||
| Personal Innovativeness (PI) | 0.353 | 0.612 | 0.46 | 0.435 | 0.469 | 0.539 | 0.8 | |||
| Task Characteristics (TC) | 0.392 | 0.337 | 0.562 | 0.631 | 0.541 | 0.412 | 0.4 | 0.942 | ||
| Task Technology Fit (TTF) | 0.251 | 0.246 | 0.292 | 0.259 | 0.233 | 0.401 | 0.3 | 0.403 | 0.857 | |
| Technology Characteristics (TCC) | 0.218 | 0.234 | 0.152 | 0.088 | 0.169 | 0.357 | 0.3 | 0.257 | 0.703 | 0.843 |
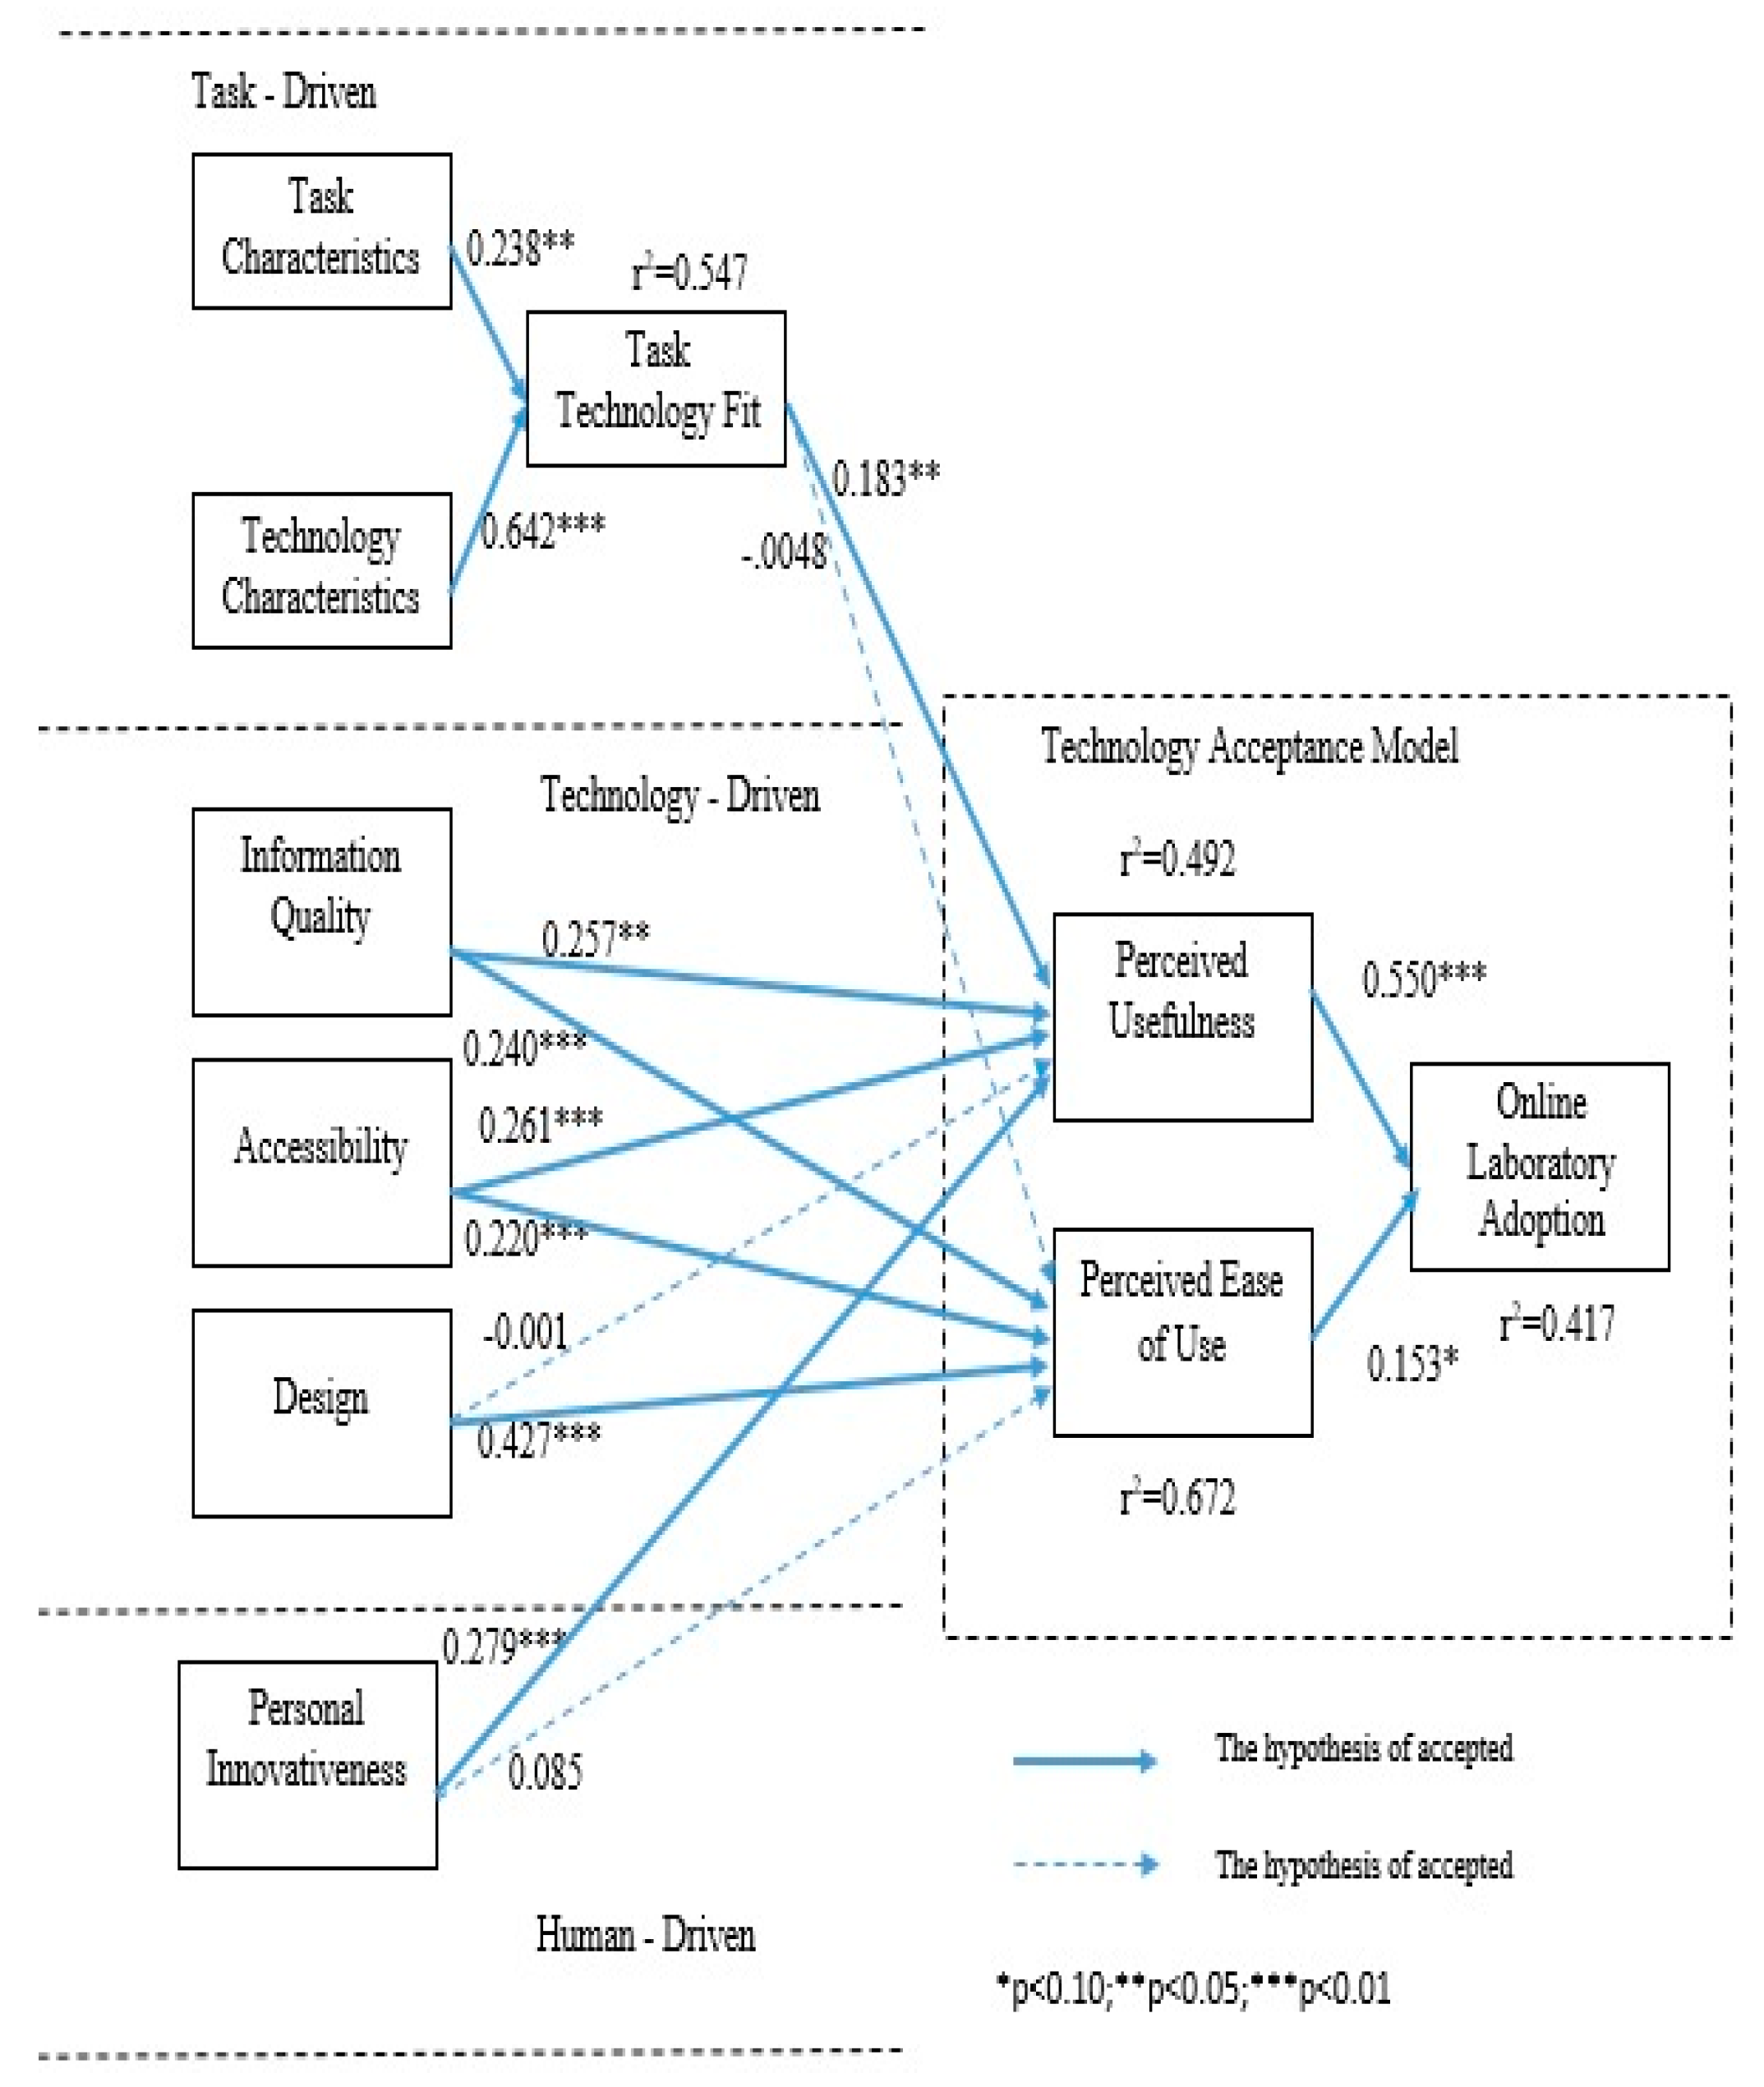
| Hypothesis | (β) | tStatistics | Conclusion | |
|---|---|---|---|---|
| H1 | Task Characteristics -> Task Technology Fit | 0.238 ** | 2.492 | Hypothesis accepted |
| H2 | Technology Characteristics -> Task Technology Fit | 0.642 *** | 6.912 | Hypothesis accepted |
| H3 | Task Technology Fit -> Perceived Usefulness | 0.183 ** | 2.872 | Hypothesis accepted |
| H4 | Task Technology Fit -> Perceived Ease of Use | −0.048 | 0.671 | Hypothesis rejected |
| H5 | Information Quality -> Perceived Usefulness | 0.257 ** | 2.79 | Hypothesis accepted |
| H6 | Information Quality -> Perceived Ease of Use | 0.240 *** | 3.785 | Hypothesis accepted |
| H7 | Accessibility -> Perceived Usefulness | 0.261 *** | 3.348 | Hypothesis accepted |
| H8 | Accessibility -> Perceived Ease of Use | 0.220 *** | 3.065 | Hypothesis accepted |
| H9 | Design -> Perceived Usefulness | −0.001 | 0.011 | Hypothesis rejected |
| H10 | Design -> Perceived Ease of Use | 0.472 *** | 5.801 | Hypothesis accepted |
| H11 | Personal Innovativeness -> Perceived Usefulness | 0.279 *** | 3.215 | Hypothesis accepted |
| H12 | Personal Innovativeness -> Perceived Ease of Use | 0.085 | 1.493 | Hypothesis rejected |
| H13 | Perceived Usefulness -> Adoption | 0.550 *** | 7.856 | Hypothesis accepted |
| H14 | Perceived Ease of Use -> Adoption | 0.153 ** | 2.14 | Hypothesis accepted |
Publisher’s Note: MDPI stays neutral with regard to jurisdictional claims in published maps and institutional affiliations. |
© 2021 by the authors. Licensee MDPI, Basel, Switzerland. This article is an open access article distributed under the terms and conditions of the Creative Commons Attribution (CC BY) license (http://creativecommons.org/licenses/by/4.0/).
Share and Cite
Riana, D.; Hidayanto, A.N.; Hadianti, S.; Napitupulu, D. Integrative Factors of E-Health Laboratory Adoption: A Case of Indonesia. Future Internet 2021, 13, 26. https://doi.org/10.3390/fi13020026
Riana D, Hidayanto AN, Hadianti S, Napitupulu D. Integrative Factors of E-Health Laboratory Adoption: A Case of Indonesia. Future Internet. 2021; 13(2):26. https://doi.org/10.3390/fi13020026
Chicago/Turabian StyleRiana, Dwiza, Achmad Nizar Hidayanto, Sri Hadianti, and Darmawan Napitupulu. 2021. "Integrative Factors of E-Health Laboratory Adoption: A Case of Indonesia" Future Internet 13, no. 2: 26. https://doi.org/10.3390/fi13020026
APA StyleRiana, D., Hidayanto, A. N., Hadianti, S., & Napitupulu, D. (2021). Integrative Factors of E-Health Laboratory Adoption: A Case of Indonesia. Future Internet, 13(2), 26. https://doi.org/10.3390/fi13020026