You are currently viewing a new version of our website. To view the old version click .
Future Internet
  • Article
  • Open Access

8 November 2021

Intelligent Planning and Research on Urban Traffic Congestion

,
,
,
,
and
1
Department of Electrical Engineering & Information Technology, Shandong University of Science and Technology, Jinan 250031, China
2
Division of Information Science and Technology, Graduate School at Shenzhen, Tsinghua University, Shenzhen 518055, China
*
Author to whom correspondence should be addressed.
This article belongs to the Special Issue Sustainable Smart City

Abstract

For large and medium-sized cities, the planning and development of urban road networks may not keep pace with the growth of urban vehicles, resulting in traffic congestion on urban roads during peak hours. Take Jinan, a mid-sized city in China’s Shandong Province, for example. In view of the daily traffic jam of the city’s road traffic, through investigation and analysis, the existing problems of the road traffic are found out. Based on real-time, daily road traffic data, combined with the existing road network and the planned road network, the application of a road intelligent transportation system is proposed. Combined with the application of a road intelligent transportation system, this paper discusses the future development of urban road traffic and puts forward improvement suggestions for road traffic planning. This paper has reference value for city development, road network construction, the application of intelligent transportation systems, and road traffic planning.

1. Introduction

At present, with the continuous advancement of China’s urbanization process, social development, and urban economy, the urban population is increasing rapidly, and the number of urban motor vehicles has also begun to grow rapidly, forming the current traffic situation that urban transportation infrastructure construction has not been able to keep up. With the rapid development of Shanghai city and the rapidly increasing traffic demand, the number of private cars in urban households has increased rapidly. Even adding new public transportation methods [1], such as subways, light rails, trams, and ships, or adding new public transportation routes, cannot fundamentally solve the transportation problems caused by urban development.
According to data from the China Transportation Bureau [
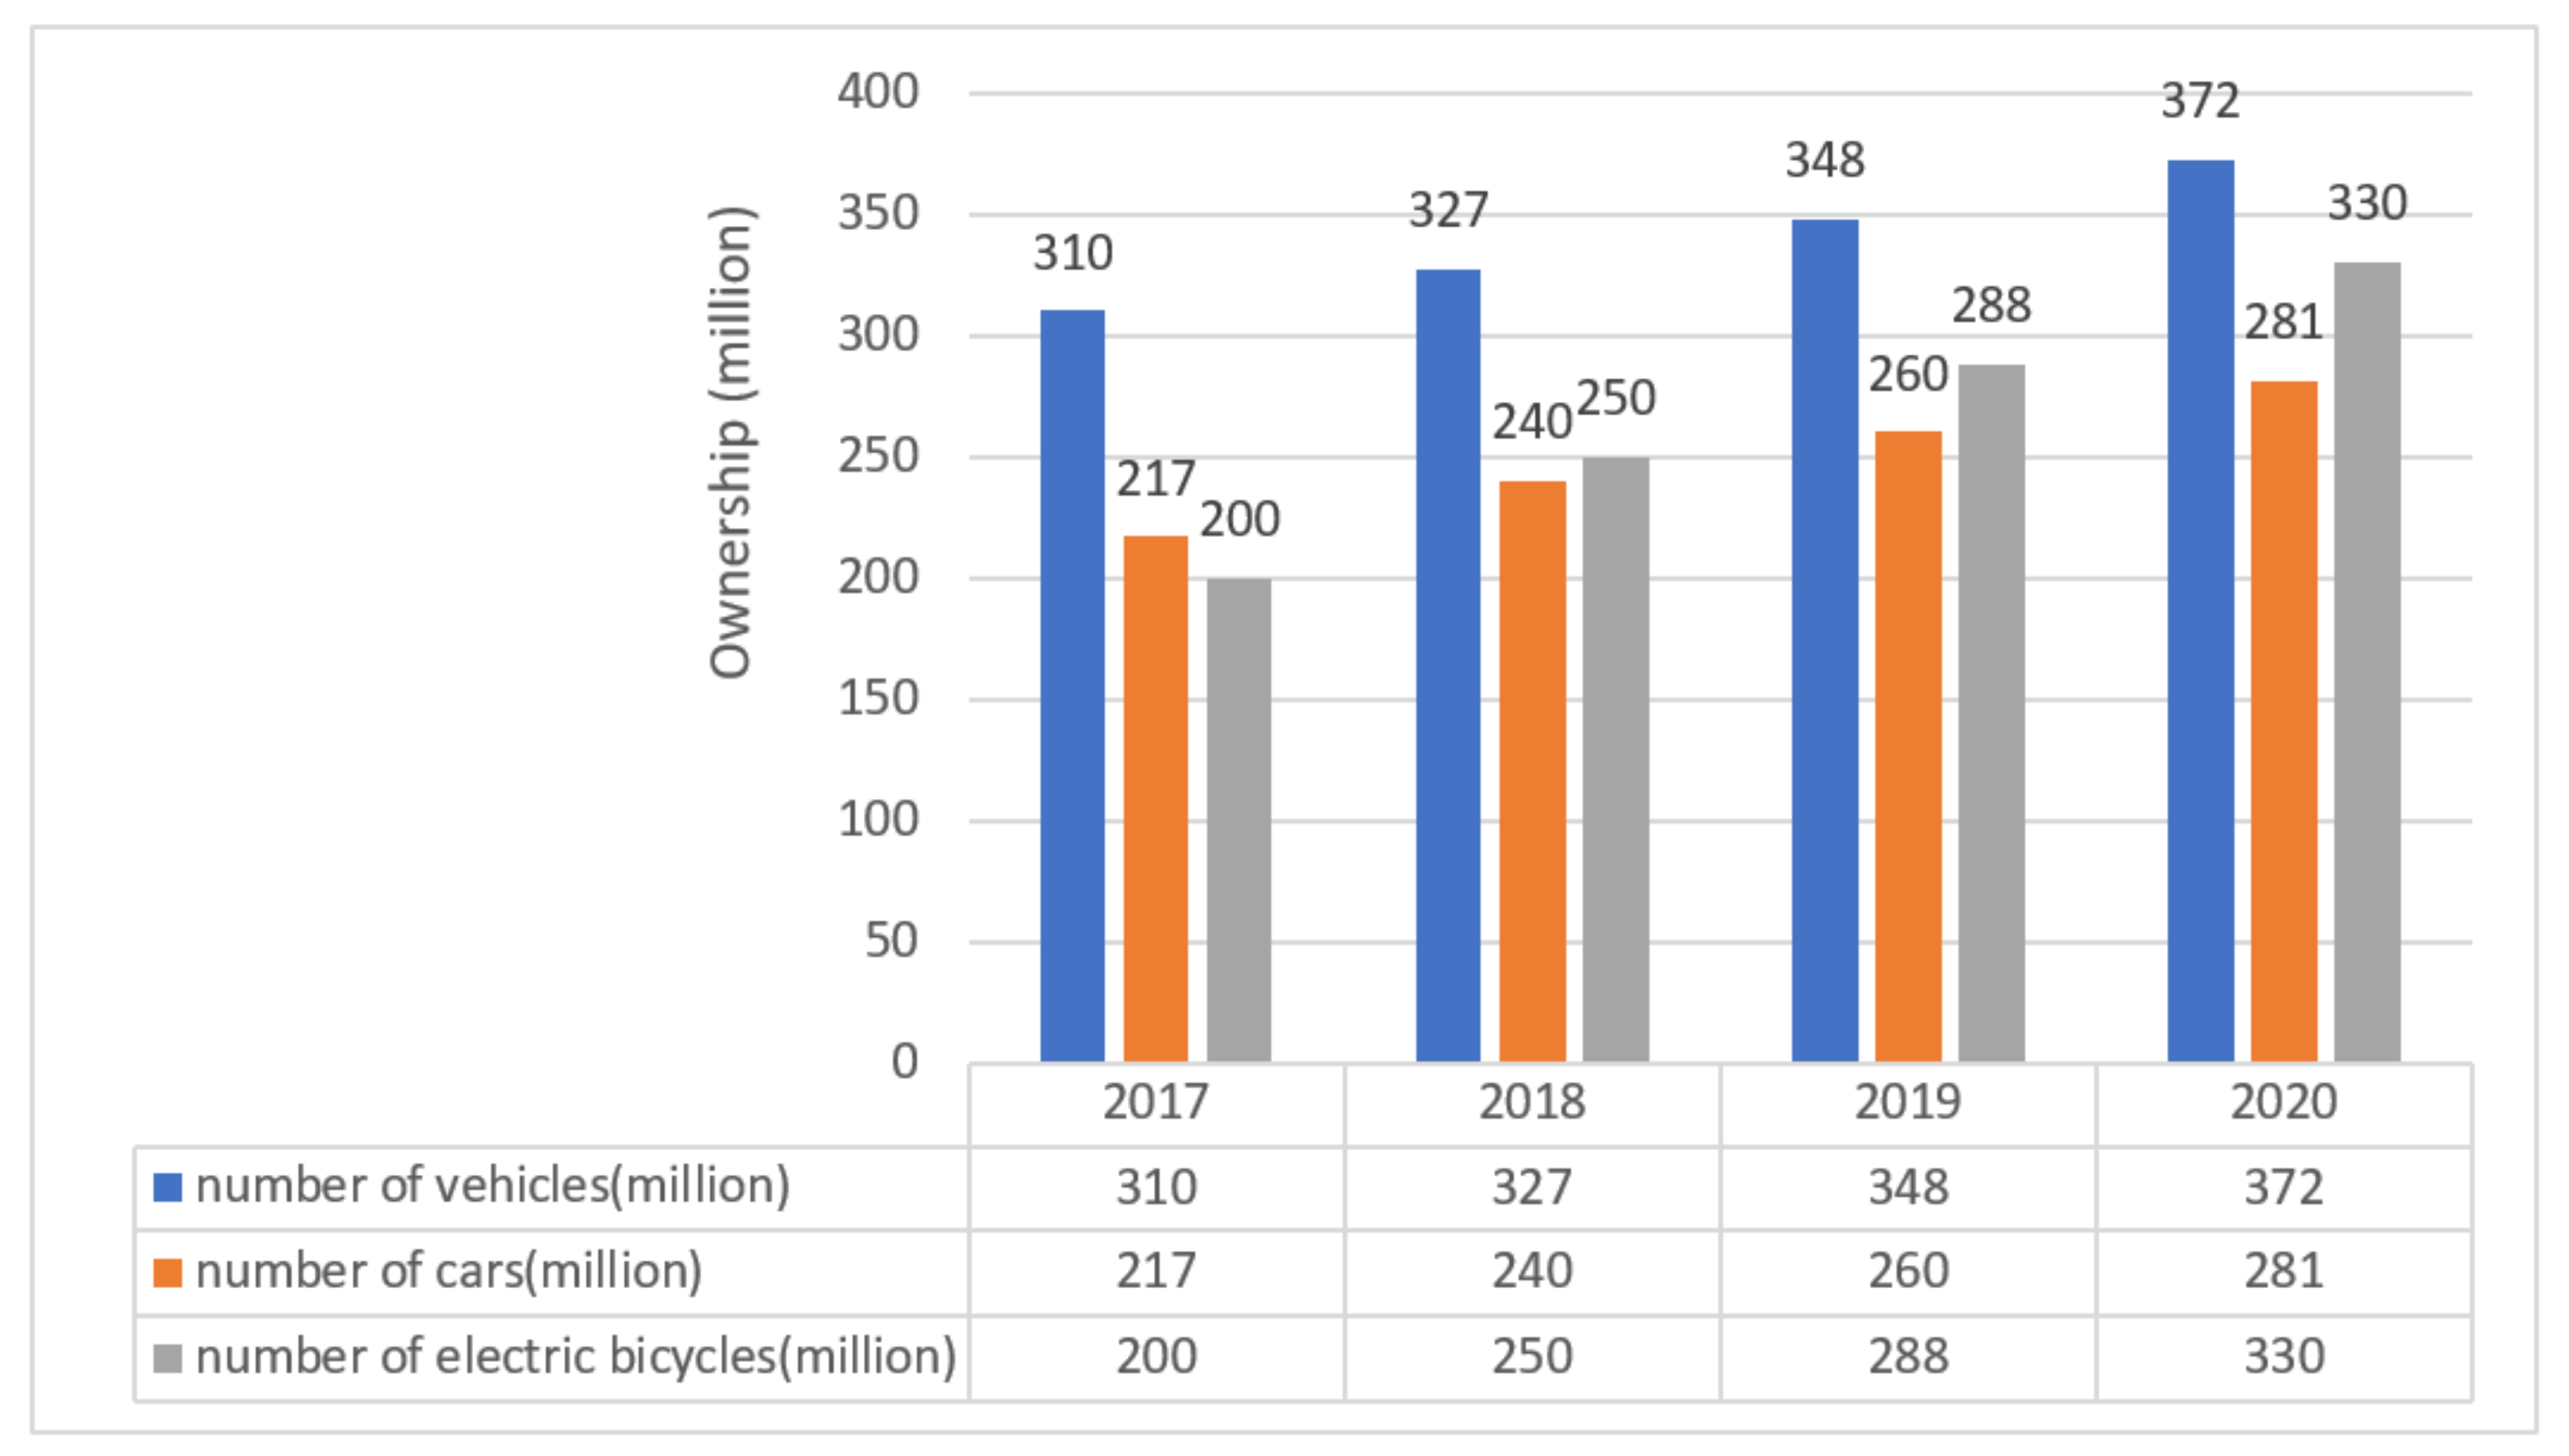
2], the number of motor vehicles in the country has increased year by year, from 310 million in 2017 to 372 million in 2020, and the growth rate is from 5% in 2018 to 6% in 2019 to 7% in 2020. The level of car ownership has increased from 217 million in 2017 to 281 million in 2020. The number of electric bicycles has increased from 200 million in 2017 to 330 million in 2020. According to the growth trend in previous years, it is estimated that the number of motor vehicles in the country is expected to reach 400 million in 2021, which is a severe test for urban traffic conditions, as shown in Figure 1.
Figure 1. The inventory of motor vehicles and electric bicycles in China from 2017 to 2020.
The mismatch between urban layout and urban traffic is also a serious problem. The city is the center of economic activity and the terminal or hub of most transportation. With the development of the economy and the construction of the city, the overall scale of the city [3] is still expanding. However, most cities have not incorporated transportation planning into their overall urban planning. This will cause the distance between people’s living area and work area to become longer due to urban expansion. A common phenomenon is that the increase in the distance people travel to work [4] has caused serious road blockages in some areas during peak hours.
The development of a city must meet the overall needs of the city [5], and the same should be true for urban transportation [6]. In recent years, domestic urban built-up areas have often paid too much attention to the expansion of the road network [7] in the planning and construction of transportation, thus ignoring the transportation needs of all traffic participants [8] in the city. The traffic demand [9] cannot be met, and merely expanding roads [10] and building new roads [11] cannot fundamentally solve urban traffic problems. Urban transportation needs need to be met by improving the service level of urban transportation, improving travel efficiency [12] as much as possible, and avoiding non-motor vehicle interference [13], as shown in Figure 2.
Figure 2. Simulation of low green traffic rate at intersection.
Non-motorized vehicles are convenient and flexible, and bicycles are easy to use. In most cities, bicycles and other non-motorized vehicles have become important means of transportation for citizens during work and travel. At present, the number of bicycles in the country is more than 400 million, of which urban residents account for more than half of the total. The number of bicycles in most cities has been saturated. Due to the poor safety of bicycles and low transportation efficiency, the originally unsatisfactory traffic conditions have become worse. This happens in particular at intersections, where the phenomenon of motor vehicles and non-motor vehicles mixing frequently occurs, especially during peak hours [14].
Therefore, traffic congestion is no longer just a problem of “urban diseases” [15] such as difficulty in driving and parking, which is unique to large cities, but has also become an inevitable obstacle to the development of small and medium-sized cities. Because of their small scale and weak economic foundation, it is impossible to invest all of the city’s construction forces on new roads. Urban traffic problems need to be solved with smarter and more efficient methods.
With the advancement of urban development and urbanization, the demand for urban road traffic continues to increase, and traffic congestion in large cities is becoming more and more serious, especially during the morning and evening peak periods of working days. To solve the various problems of urban road traffic, especially the road traffic in the old city that is prone to traffic congestion, it is necessary to increase investment in the construction of intelligent transportation systems and formulate roads that can support urban roads while rationally planning the urban road network through the transportation informatization construction framework, development plan [16], and technical standards [17] of the transportation development strategy [18]. Today, the overpass can be said to be an important part of the urban transportation system. As a modern and effective three-dimensional transportation system, it is an inevitable product of a city’s development to a certain stage. Its capacity can directly affect the traffic flow and traffic congestion on the arterial road. The function of the urban overpass is to rationally divert vehicles that are far away from their destination at the road intersection to ensure the smooth progress of traffic and avoid a large amount of traffic concentrating on the same traffic network, causing traffic congestion. The structural characteristics of the highway overpass determines that it can make the straight turns and U-turns of vehicles not cross on the same plane when the vehicles are diverted, so that each vehicle can go on its own way without interfering with each other, so as to realize the vehicle diversion function of the overpass [19]. When designing an overpass, consideration must be given to the rationality, functionality, feasibility, economy, and aesthetic characteristics of the plan. In the design and planning, if the planning is not properly designed, it may cause interference to the traffic of vehicles in the urban transportation system and form a bottleneck area of traffic flow [20]. Overpasses with different structures and ramp design methods have different capacities for passing vehicles and have different degrees of impact on the traffic road network [21].
In order to make urban traffic more convenient and faster, and to solve the traffic congestion problem of people’s travel to a certain extent, we need to set up an overpass for shunting the control of vehicles [22], so that vehicles in different planes do not interfere with each other and to ensure the intersection of vehicles onto the overpass in advance, so that the diversion of vehicles eases the flow of cars on surface roads [23]. This will ensure collisions between pedestrians, electric vehicles, bicycles, and cars are avoided at ground traffic intersections. Therefore, how to choose the construction location of an overpass and what type of overpass to build [24] will directly affect the traffic situation of the entire urban road traffic network. If the site selection is correct, it will effectively alleviate the traffic situation in the surrounding area. If the location is not correct, not only can it not achieve the original desired goal, but it will also cause a waste of resources. The road network, built at great expense, is not working as well as it should. Thus, it is very important to build overpasses in reasonable places and to give full play to the role of overpasses.
In order to realize the traffic signal adaptive control of intelligent traffic [25], it is necessary to obtain real-time traffic flow information [26] first. The intelligent traffic system will collect traffic flow data through A/D conversion [27] to send to the control center for analysis and comparison, and to obtain the ratio of traffic flow [28] size comparison. The traffic light time can be controlled according to the ratio, so the system can change according to the real-time traffic flow [29], which, coupled with the role of the overpass, can greatly improve the efficiency of the intersection [30] and improve the quality of the traffic service of the city’s overall road network.
This paper takes Jinan City, Shandong Province, China as the research object, combined with the experience of other urban road construction planning [31], and then, based on the daily traffic congestion problems in Jinan City, after research and analysis, the road traffic problems in Jinan City are found. Quantitative and qualitative analysis based on real-time, daily road traffic data of Jinan City, combined with the existing road network and planned road network of Jinan City, proposes the application of a road intelligent transportation system. Based on the use of a road intelligent transportation system, we discussed the future development of road transportation in Jinan. In addition, based on the simulation results of the model, suggestions for improving road traffic planning are put forward and verified by experiments to ensure persuasiveness.
The content discussed in the rest of this article is as follows: The second part (related work) deeply analyzes the concept of the intelligent transportation system and expands it horizontally. The third part (methods and materials) demonstrates the mathematical principles of intelligent transportation systems. The fourth part (experiment) elaborates on the specific experimental process in detail. The fifth part (discussion) makes a preliminary analysis of the causes of traffic congestion. The sixth part (conclusion) gives suggestions for improving urban traffic and uses the model to verify the theory proposed in this article.

3. Materials and Methods

3.1. Traffic Congestion Index Evaluation Strategy

As expressways and main roads are the main roads in Jinan, we focus on the evaluation criteria of these two roads. The traffic congestion model based on fuzzy comprehensive evaluation is used to analyze the congestion of each main road.

3.1.1. Determine the Evaluation Factor Set and Comment Set

Determine the evaluation factor set as U = u 1 , u 2 , u 3 , where u 1 , u 2 , and u 3 respectively, correspond to the distance passed by the traffic flow per unit time, the time difference between the actual traffic flow passing the unit mileage and the road design traffic flow passing the unit mileage, the actual road capacity and the road design capacity ratio.
Here, five levels are used to classify the traffic congestion situation, and the evaluation set is set as P = p 1 , p 2 , p 3 , p 4 , p 5 , where p 1 , p 2 , p 3 , p 4 , and p 5 correspond to the five evaluation levels of unobstructed, relatively unobstructed, relatively congested, congested, and severely congested.

3.1.2. Constructing an Average Travel Speed Evaluation Standard Table

According to the relevant theories of traffic flow model, 85% speed is usually regarded as the maximum speed limit of the observed section, 50% speed can be used as the boundary between congestion and smooth traffic, and 15% speed as the minimum speed limit.
We selected Hero Mountain Road as a sample. The traffic speed data was processed by MATLAB (Version: 2018A) software to obtain 85%, 50%, and 15% speeds of the highway. We found that the speed of 15% position is 37.21 km/h, that of 50% position is 42.57 km/h, and that of 85% position is 47.13 km/h. Therefore, the design speed error between the speed at 50% of Yingxiong Mountain Road and the traffic flow model is
e = 42.57 40.735 42.57 = 0.0431
Since the error is less than 5%, we consider the return parameters obtained from the traffic flow model to be reliable. Finally, we obtain the speed evaluation standard through the road design standard and return parameters, as shown in Table 1.
Table 1. Judgment Standard Table of Average Travel Speed of Road Section.

3.1.3. Constructing an Average Delay Evaluation Standard Table

According to traffic flow model correlation theory and average delay calculation formula
t = 3600 1 v 1 v m i d v v m i d 0 v > v m i d
where v is the current velocity and v m i d is the saturation velocity. We obtained the evaluation standard of average delay per unit mile of road section, as shown in Table 2.
Table 2. Standard Table of Average Extension of Unit Mileage.

3.1.4. Construct the Saturation Evaluation Standard Table

Determination of saturation
c = Q Q m i d
Among them, Q is the current flow, and Qmid is the design flow.
We mainly refer to the “Technical Standards for Highway Engineering” [49] to determine the road saturation evaluation standards, as shown in Table 3.
Table 3. Judgement criteria for road section saturation.

3.1.5. Determine the Weight Vector of the Evaluation Index

We mainly refer to the “Urban Road Traffic Congestion Evaluation Research Based on Fuzzy Comprehensive Evaluation” [14], and determine the weight vectors of the three indicators of the average travel speed of the road section, the average delay per unit mileage, and the saturation as
W = 0.42 , 0.30 , 0.28

3.1.6. Determine the Index Membership Degree

For the larger the better the index, the ascending half-gradient method is used. For the smaller the better the index, the descending semi-trapezoidal method is adopted. Among them, the average formation speed of the road section belongs to the larger the better index, and the other two evaluation indexes belong to the smaller the better index.
The membership function for the larger and better indicator is
r = χ ij L ij H ij L ij H ij > χ ij > L ij 0   Other
The membership function for the smaller and better indicator is
r = H ij χ ij H ij L ij H ij > χ ij > L ij 0   Other

3.1.7. Fuzzy Comprehensive Evaluation

Through the above analysis, the fuzzy evaluation matrix is determined as follows
R = v 1 v 2 v 3 v 4 v 5 t 1 t 2 t 3 t 4 t 5 c 1 c 2 c 3 c 4 c 5
where v i , t i , and c i are elements u 1 , u 2   , and u 3 in U , respectively, meaning average travel speed, average delay per mile, and saturation, respectively.
Finally, the evaluation matrix is
B = W ° D = 0.42 0.30 0.28 ° v 1 v 2 v 3 v 4 v 5 t 1 t 2 t 3 t 4 t 5 c 1 c 2 c 3 c 4 c 5 = b 1 , b 2 , b 3 , b 4 , b 5
Assign grade values to   b 1 , b 2 , b 3 , b 4 , and b 5 , respectively, as shown in Table 4.
Table 4. Assignment table.
We define b as the traffic congestion index and set
b = b 1 + 2 b 2 + 3 b 3 + 4 b 4 + 5 b 5 .  
Among them, the closer the b index is to 5, the more congested the road; otherwise, the smoother the road. The corresponding relationship between the congestion index and the degree of congestion is shown in Table 5.
Table 5. Correspondence between congestion index and congestion degree.
Through the above methods, we can calculate the congestion index of each road section. We defined severe congestion as red, smooth traffic as green, and other congestion as excessive color between red and green, so as to carry out data visualization in the experiment.

3.2. Strategies to Alleviate Traffic Congestion

We use a forced diversion strategy based on maximum flow to simulate traffic congestion mitigation. In order to simplify the problem, we assume that the flow and capacity on the expressway between gateways are the same, then this problem can be transformed into the maximum flow problem in graph theory, and its basic model is as follows
s . t . j = 1 n f s j = F j = 1 n f j t = F v j f i j v j f j i = 0 , v i s , t 0 f i j c i j , c ( v i , v j ) A
Constraints 1 and 2 indicate that the flow from the source is the same as the flow into the sink. Constraint 3 indicates that the outgoing and incoming flows at each node balance each other. Constraint 4 indicates that the flow on each arc does not exceed the capacity of that arc.
Through the maximum flow model above, we can simulate the forced shunting of traffic flow at each pass, obtain the congestion index at each pass after the forced shunting, and compare it with the congestion index before regulation, so as to achieve the improvement in traffic congestion.

4. Experiment

In this article, the first step was to use Python [50] to crawl traffic on the Gaode map development platform. The obtained data were stored in the MangoDB database [51], which was then transferred locally through Studio 3T. Through the modification and sorting of local data, various road traffic data needed were obtained, and the data were imported into arcmap [52] for data image processing, and, finally, the desired effect picture was obtained.
It was necessary to collect and save data on the road traffic in Jinan. Then, we processed the collected data to obtain the current road speed, direction, time, traffic conditions, and congestion coefficient. After several weeks of data collection, the data were collected in one-hour intervals from 7 a.m. to 8 a.m. The collected data were then saved in the database for future data processing.
Then, we carried out data reading, data preprocessing, and data feature extraction on the collected data. We performed data concatenation of the required data, split the data, extracted the required key data, and organized and saved the extracted key data. We imported the saved key data into a new database, and then performed data image processing on the imported new data in the software database to draw the required image.
The above is the general idea, the specific operation details are described as follows.

4.1. Traffic Situation Interface

Traffic Situation interface: Traffic situation is the HTTP interface of the Web service [53] provided by AmAP development platform, which can obtain road parameters in a certain area. Firstly, apply for the Key of “Web service” on AmAP API developer platform. In the second step, fill in the URL according to the HTTP requirements. Note that the Key you applied for must be filled in the corresponding area of the URL. The third step is to receive the returned data, usually in JSON [54] or XML [55] format, and then analyze the data to obtain the data information required. For example: road summary and evaluation, road congestion, road description, road name, driving speed, road coordinate set, etc.
In order to determine the area to collect information in Jinan, firstly, we used arcGIS software [56] (https://developers.arcgis.com/rest/, accessed on 4 November 2021) to create fishing nets, and then used the fishing net diagonal mark acquisition tool to obtain the diagonal marks of each fishing net, that is, the coordinates corresponding to the fixed points in the lower left and upper right corners of the rectangle.

4.2. Data Extraction Using Python

Due to the large terrain, the terrain size of the data to be climbed was limited, so we cut the whole area of Jinan into small squares, and then queried the traffic situation information in each small square.
After cutting the map, we used the Python program to extract data from the AutoNavi Map API port and return it to JSON format.
Then we extracted all the required traffic information from the JSON format data, such as name, status, direction, speed, and polyline.
When the data collection code was completed, we saved the collected data to the database for later recall. To create a database and a data file, you need to write this code before the data collection and cutting separation program.
Next, we only needed to run the general program to start capturing real-time road traffic data in Jinan.
When the code appears, the process is finished with exit code 0. This means that the program has finished running perfectly without errors, and the data have been saved in the MangoDB database. The next job is to extract the data in the MangoDB database and proceed to a certain extent.

4.3. Use Studio 3T for MangoDB to Open and Extract Data Files

To open the MangoDB database, you need to use the MangoDB database visualization tool. In this design, studio 3T is used as the visualization tool for the MangoDB database. First of all, we need to open studio 3T for MangoDB before the Python program runs, and create a database for us to receive data. When we have determined that the obtained data are what we need, and want to save the data from the MangoDB database to the local database, we enter the extraction storage location code to enter the target directory.

4.4. ArcMap Tool Is Used to Image the Collected Data

After the data are converted into the form of coordinate points through the above operations, we add the data coordinate points to the arcmap layer. After we add the coordinate point data to the layer, we need to export the coordinate point data to the local library. When the export is successful, the new table will be added to the current map.
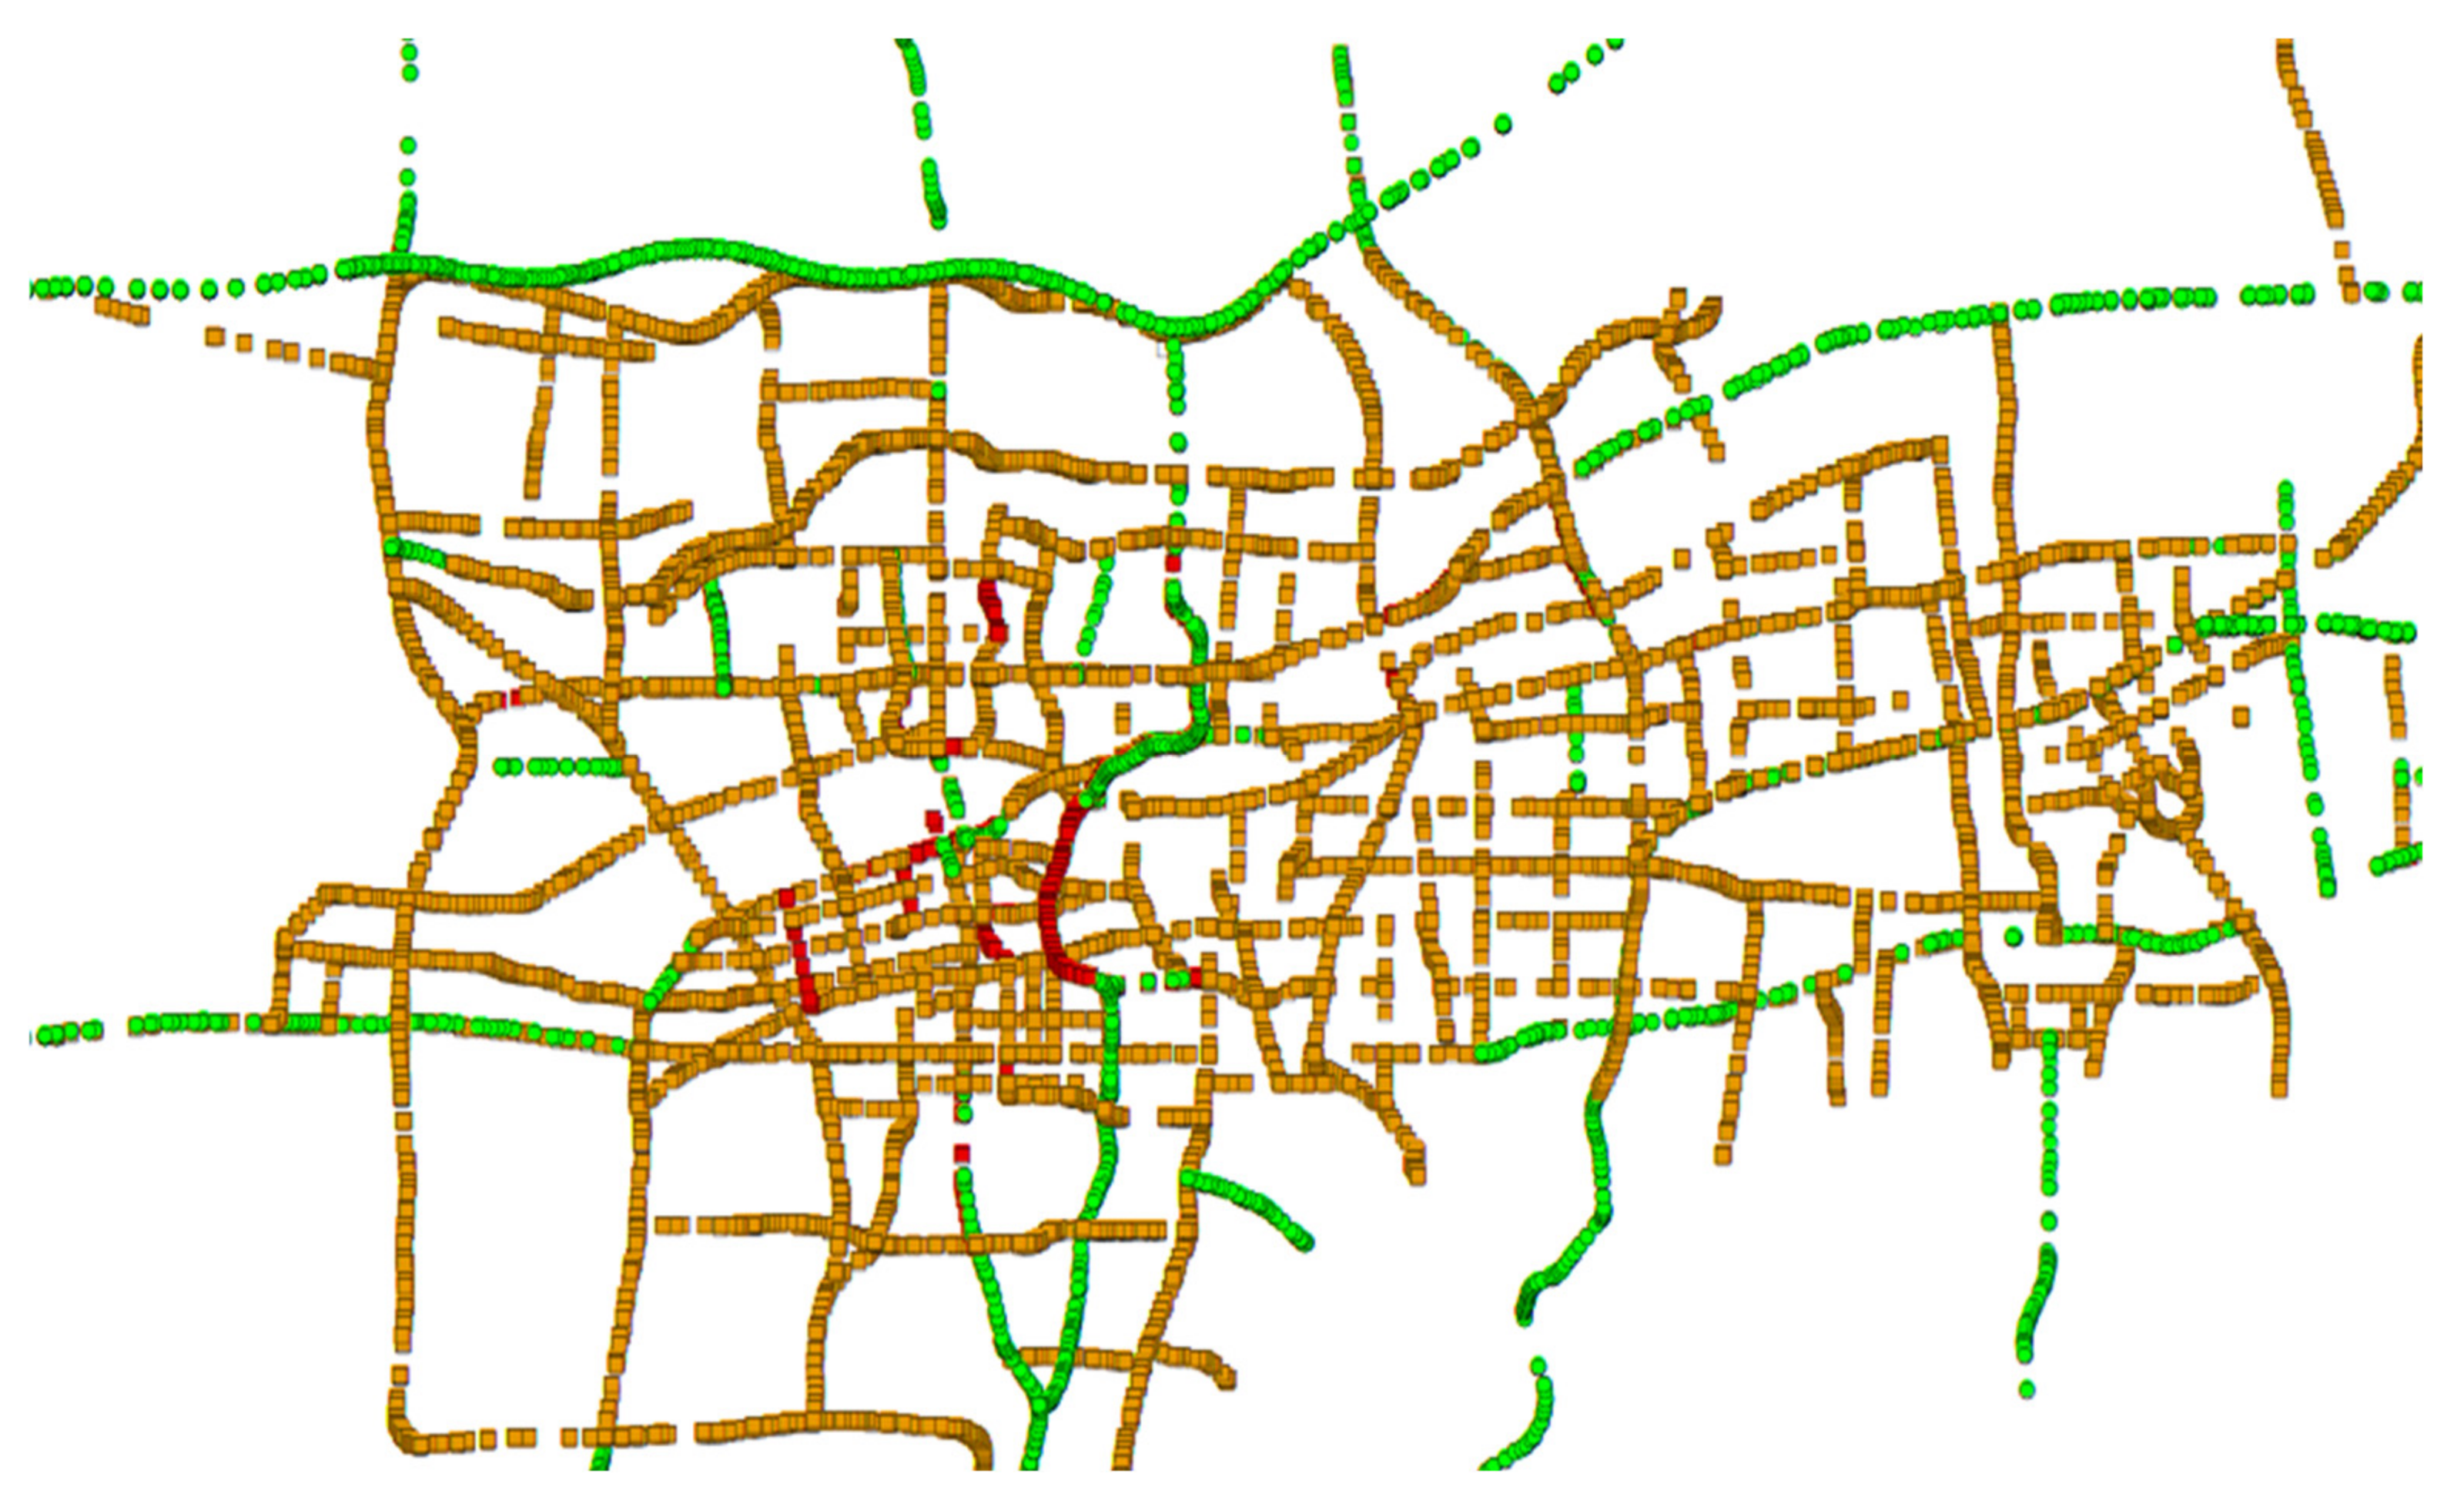
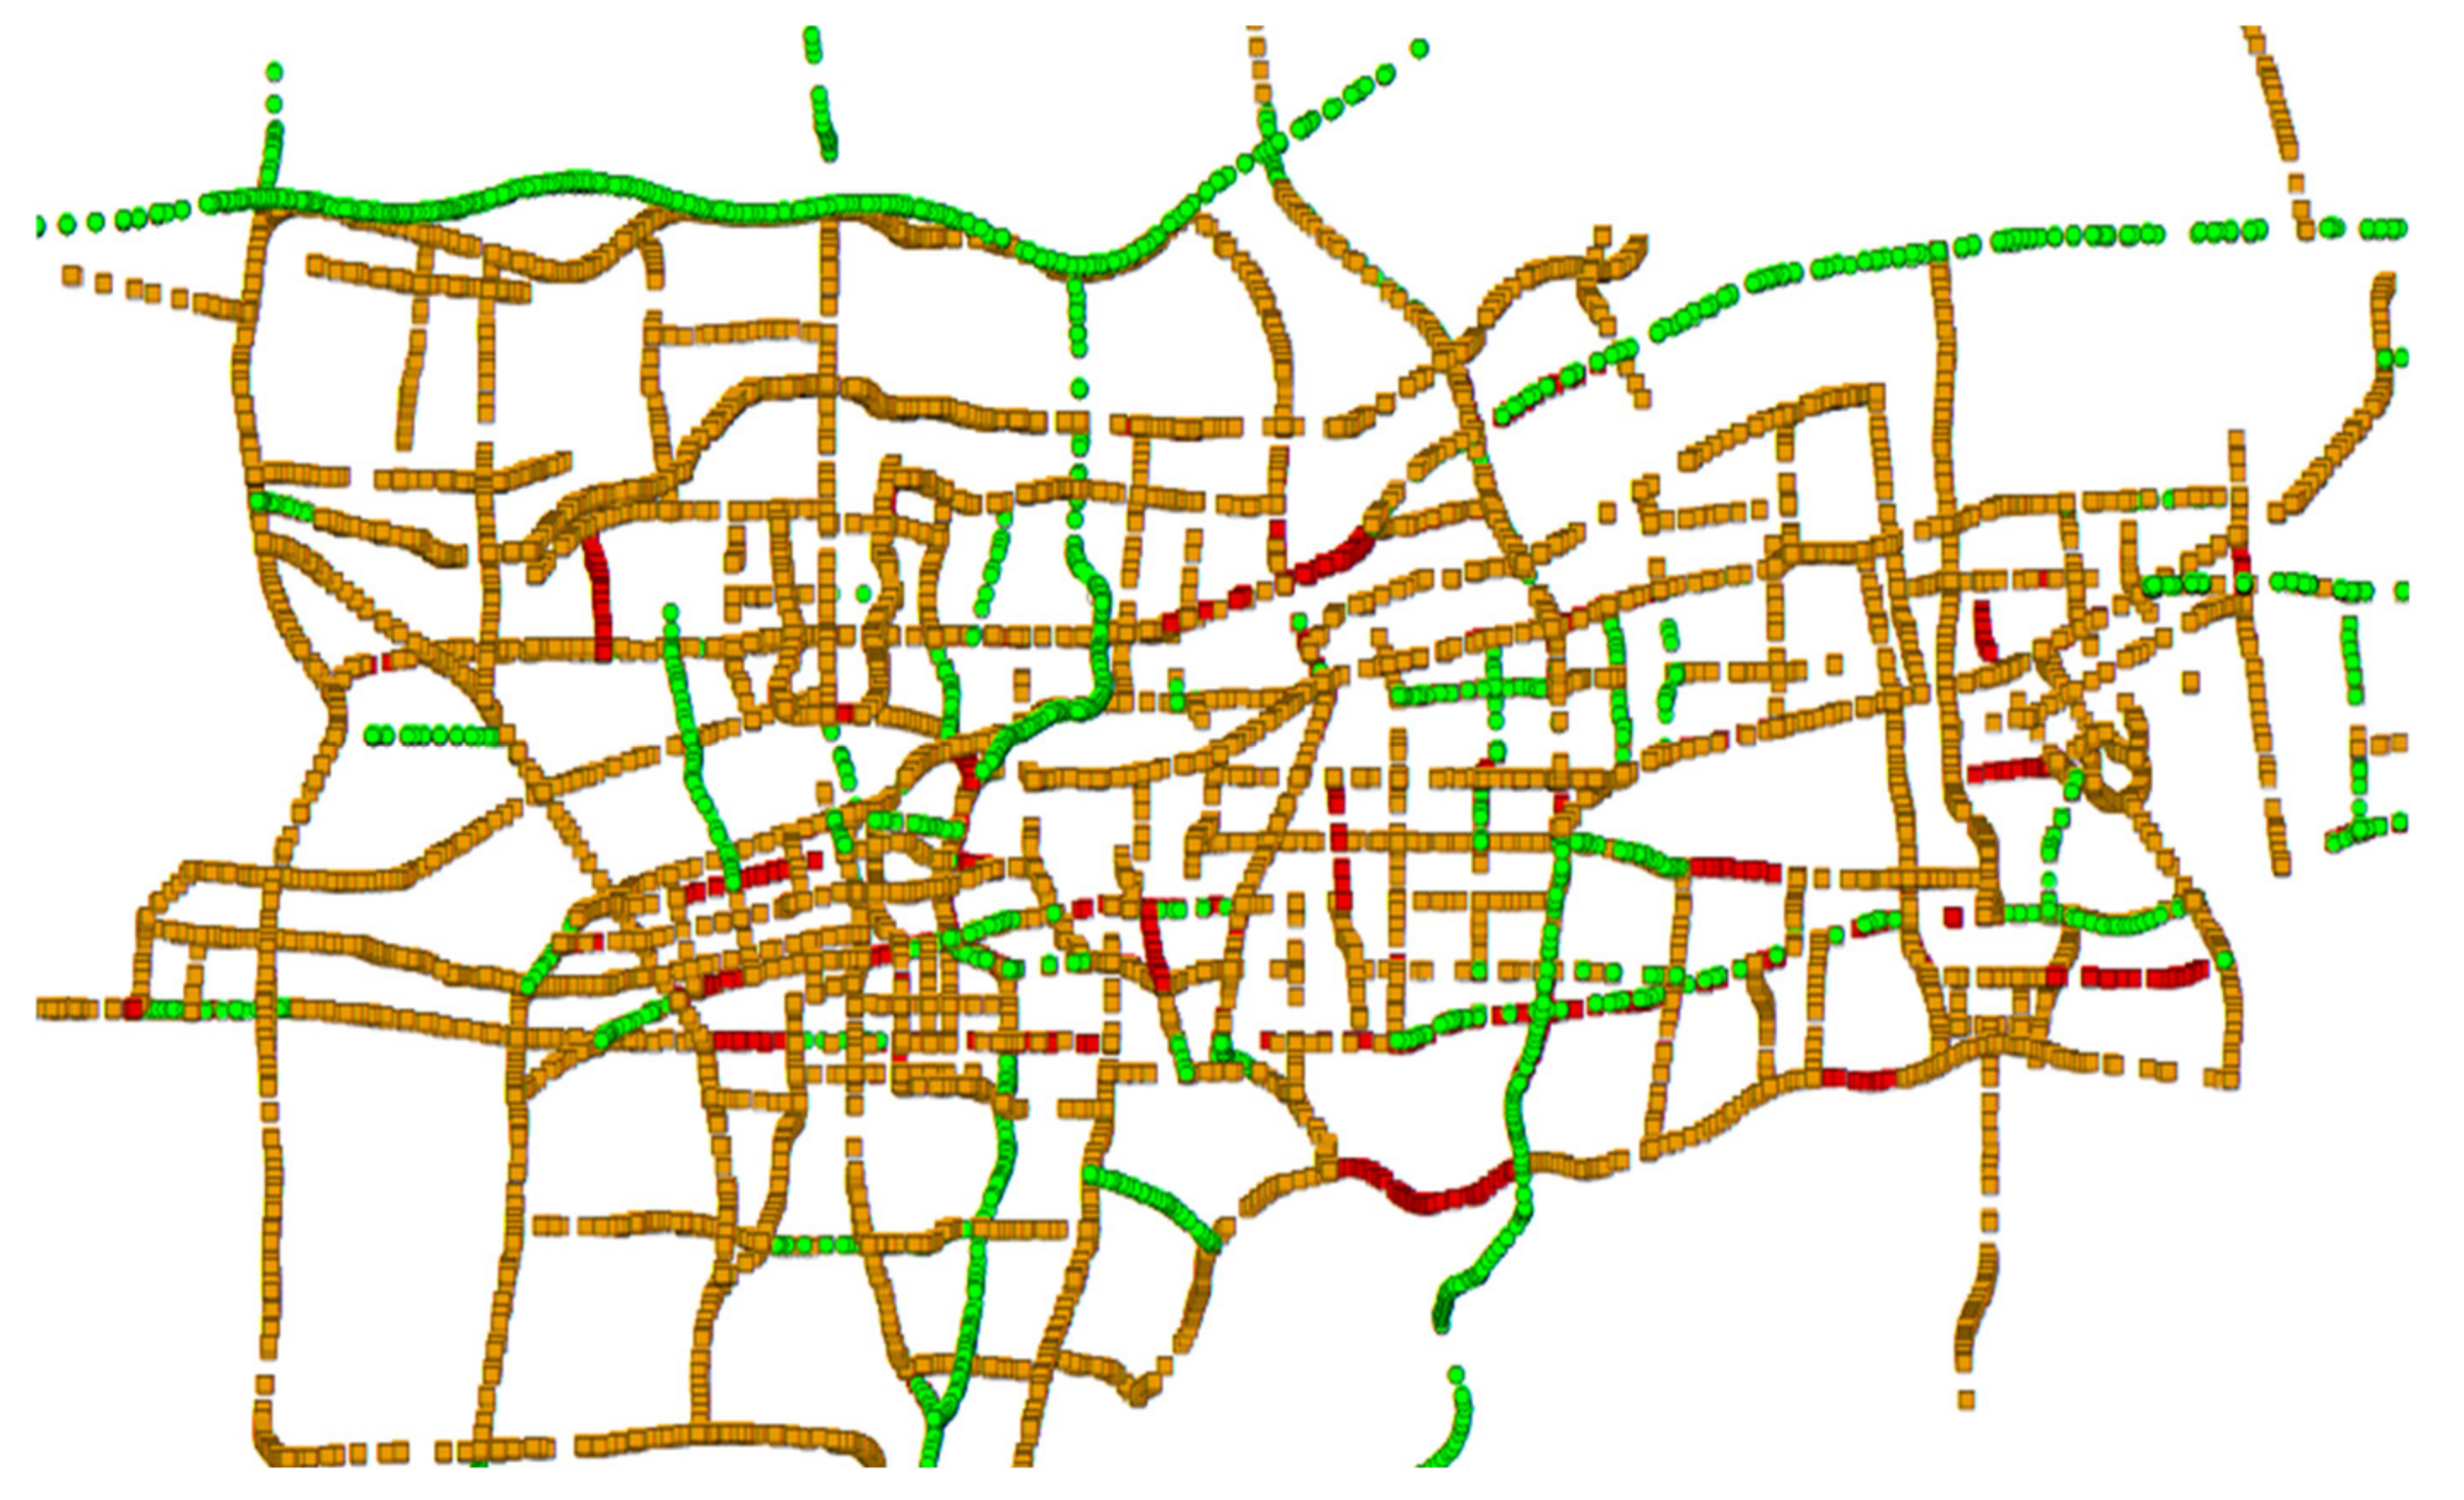
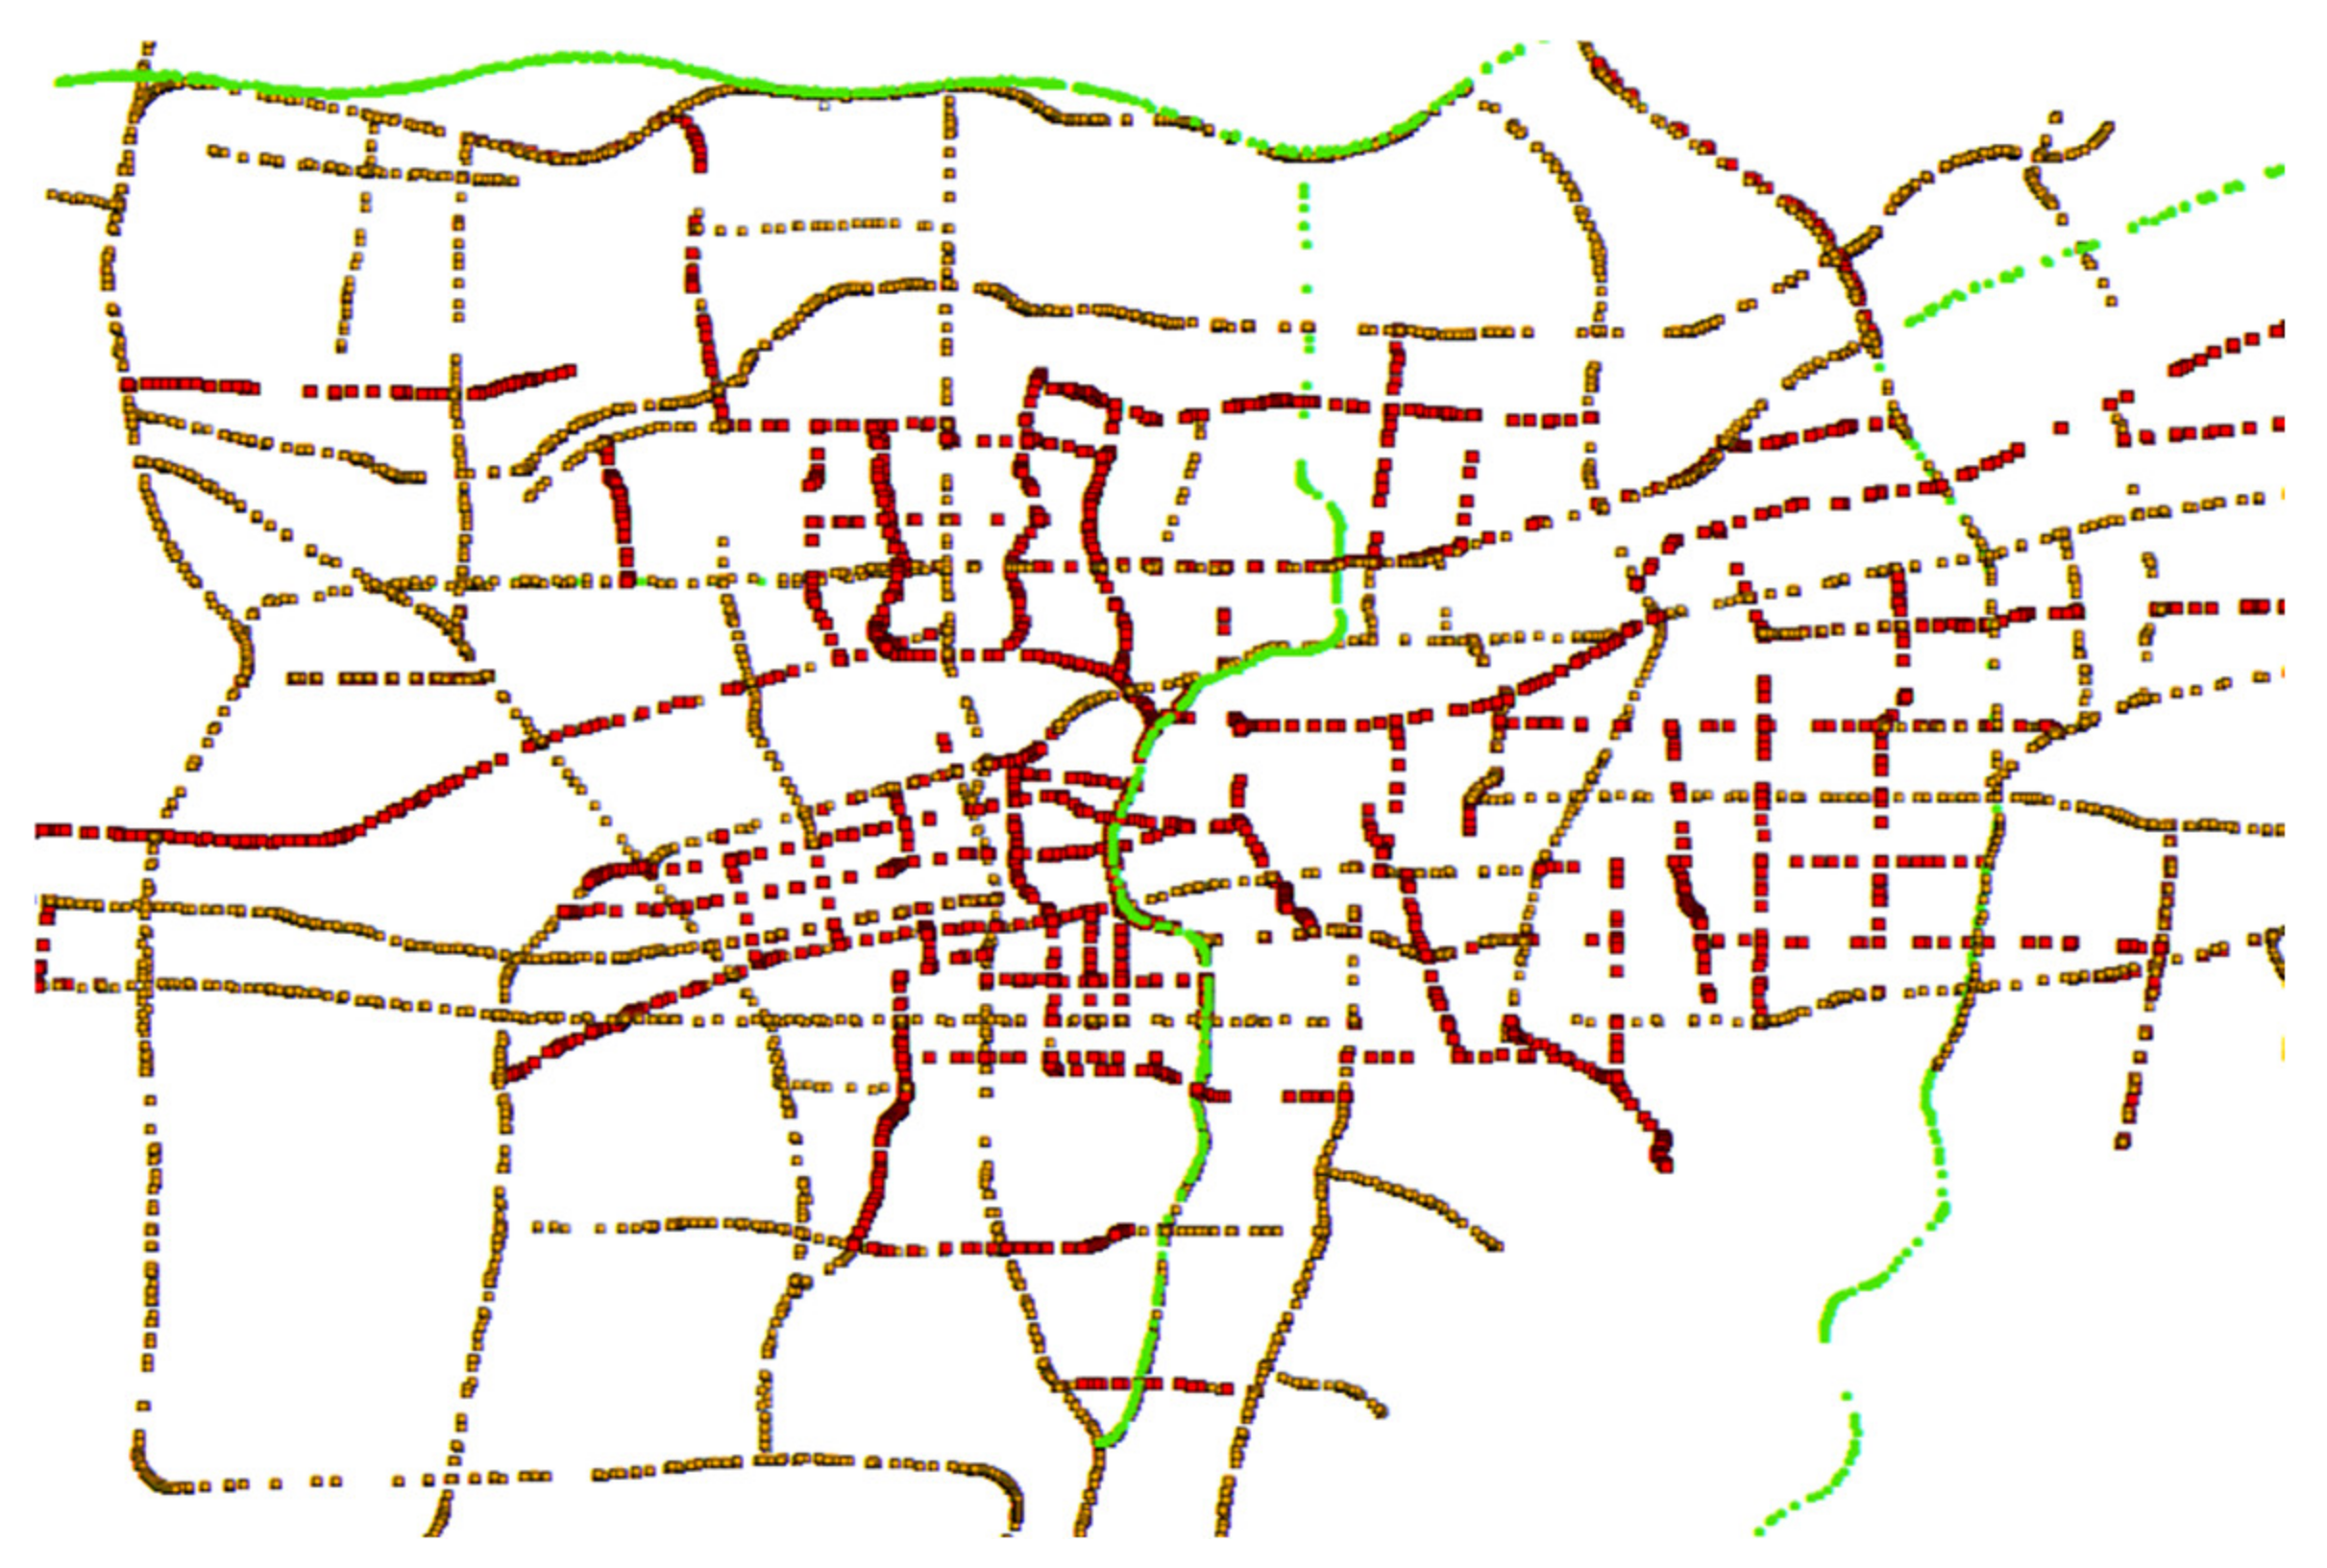
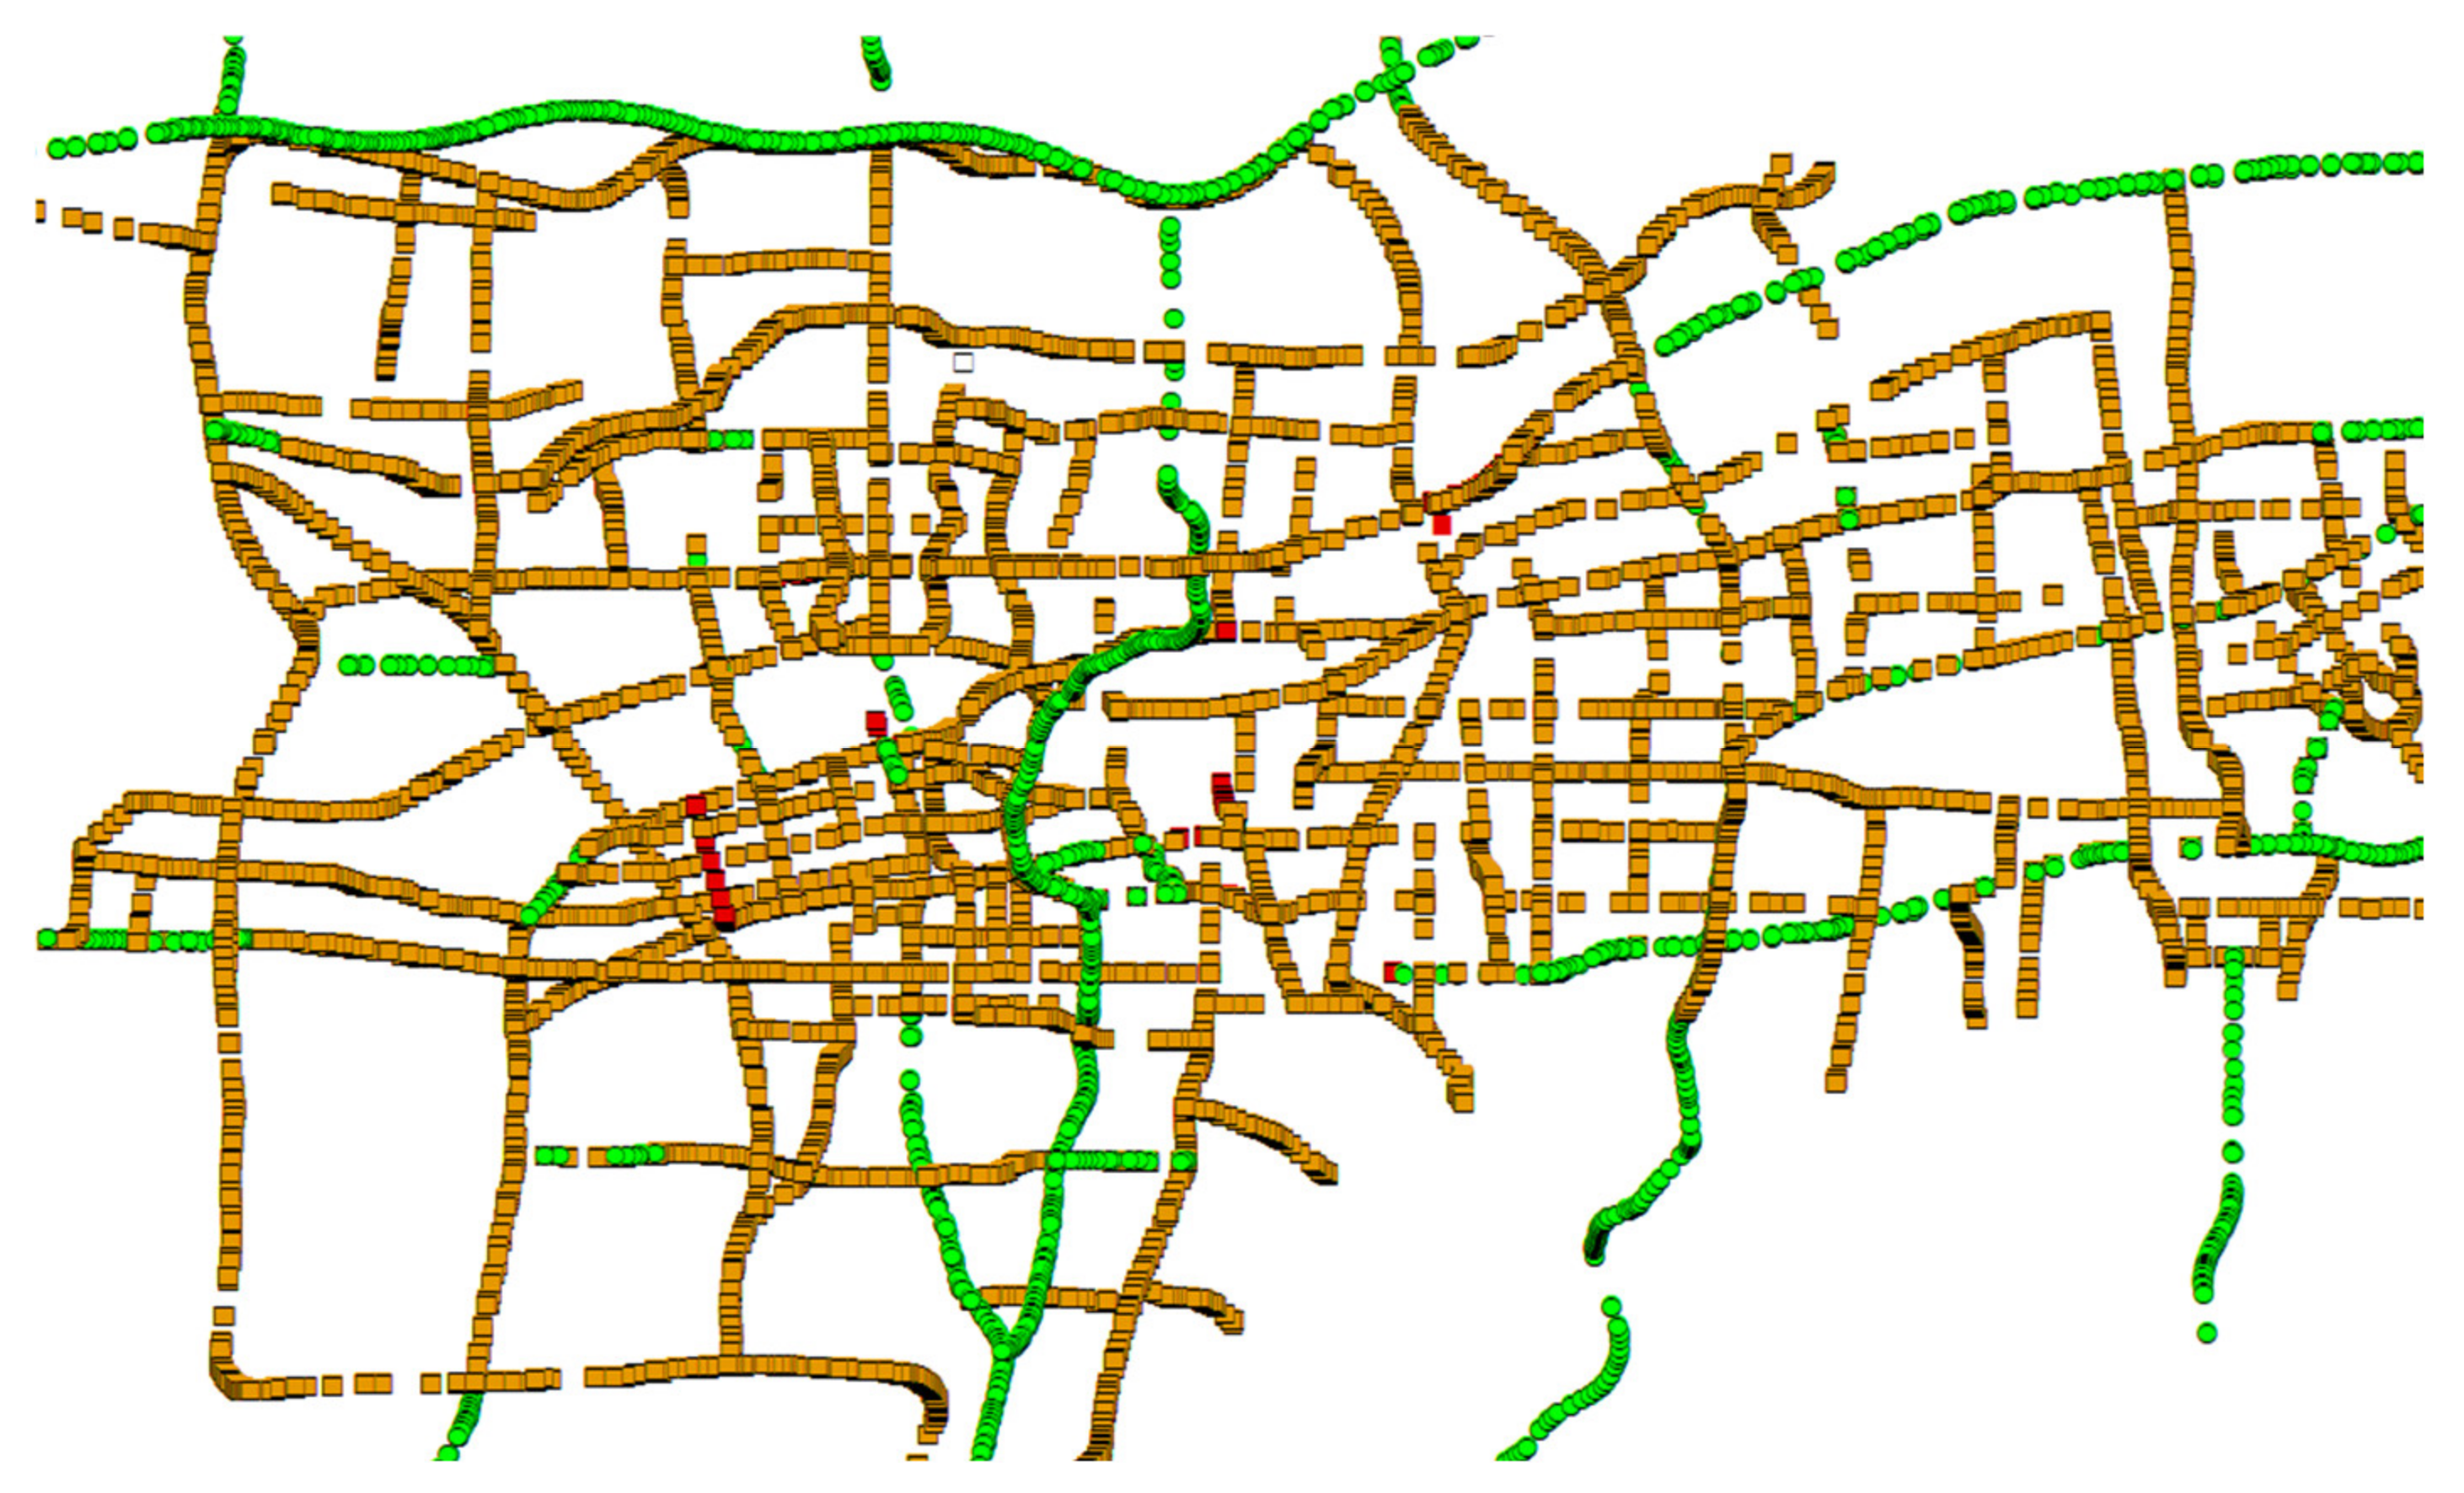
After screening, several representative images were selected from nearly a hundred data images. Among them, green means unblocked: speed > 40 km/h; yellow means slow driving: 40 km/h > speed > 20 km/h; yellow means severe congestion: speed < 20 km/h.
Figure 3 and Figure 4 were drawn according to the data in Table 6. During the morning rush hour (7:00–8:00), the overall road traffic in Jinan entered a slow-moving situation. In Jingyi Road and Shunhedong Street, the road conditions were red. The traffic network in this area was seriously congested, and the speed of vehicles was extremely slow.
Figure 3. Road condition of early morning rush hour in Jinan city. (The closer the road color is to green, the smoother the road. The closer the road color is to red, the more congested it is).
Figure 4. Road condition in the late morning rush hour in Jinan city. (The closer the road color is to green, the smoother the road. The closer the road color is to red, the more congested it is).
Table 6. Data on major road junctions during morning rush hour.
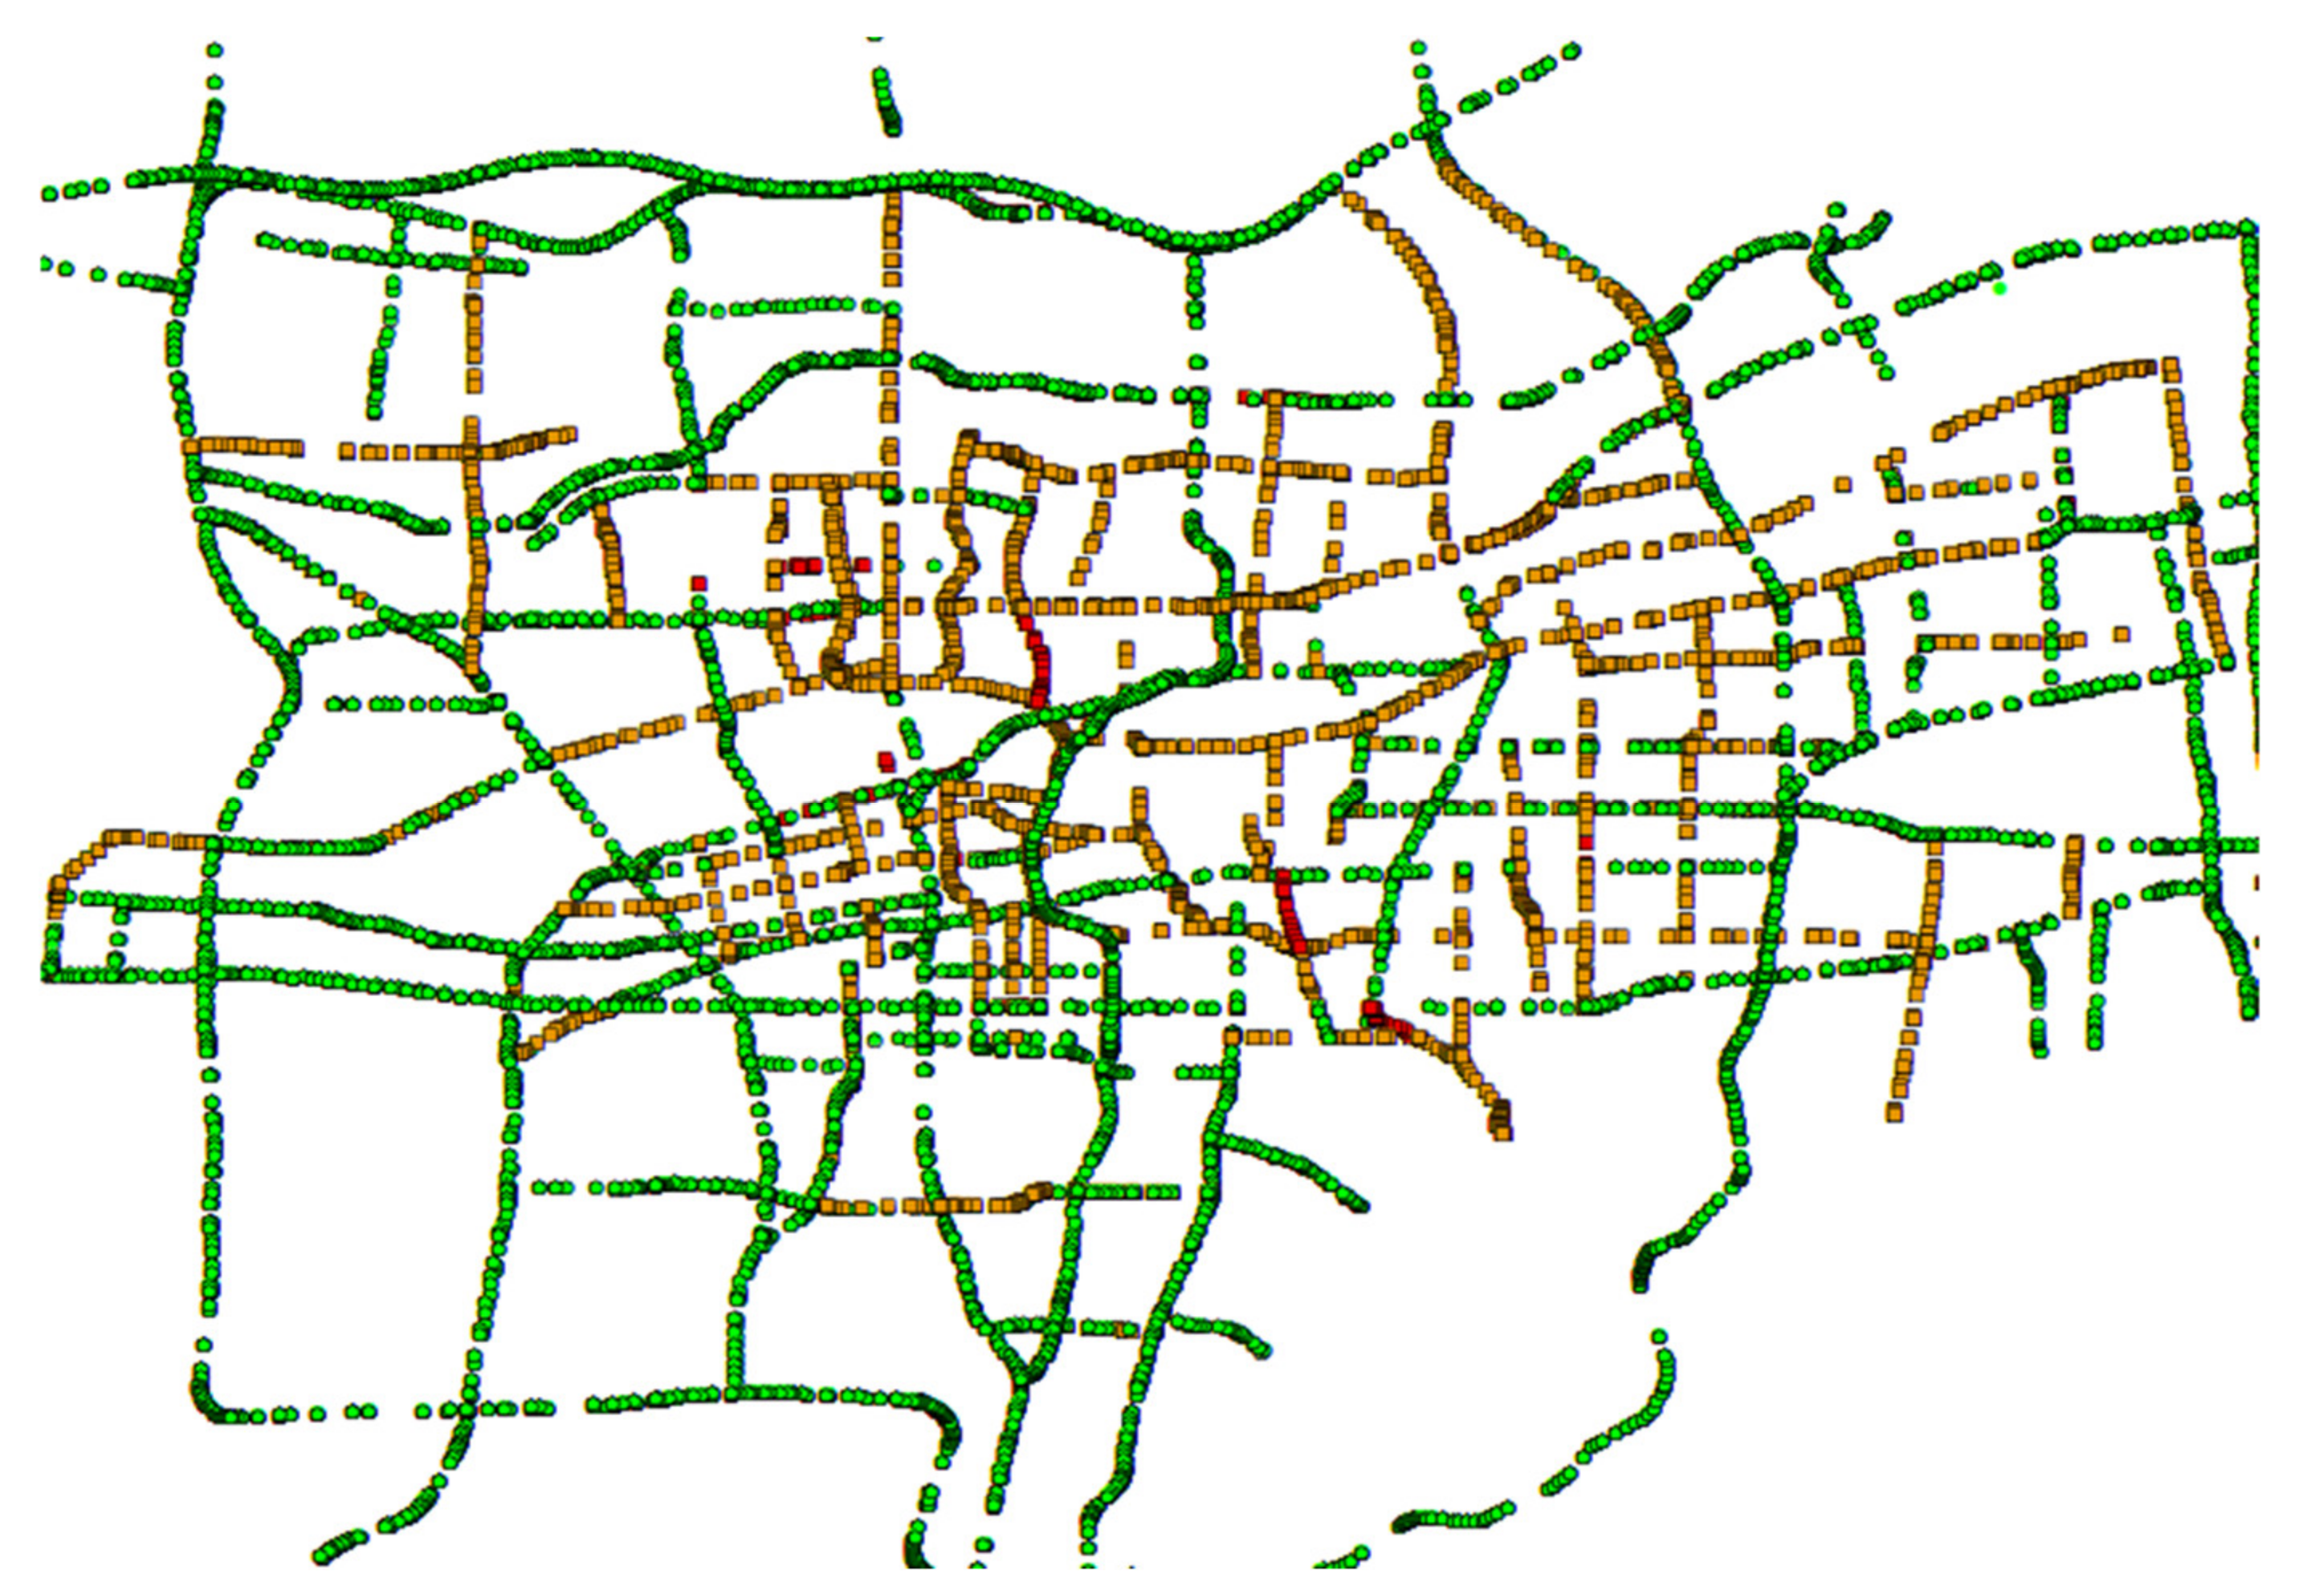
In other time periods on weekdays, most of the road network traffic in Jinan is smooth. Only in the sections from Jiluo Road to Chengfengqiao and Lishan Road, was the situation red. The traffic network in this area was seriously congested, and the vehicle speed was very slow, as shown in Figure 5.
Figure 5. Road conditions at other times of weekdays. (The closer the road color is to green, the smoother the road. The closer the road color is to red, the more congested it is).
Referring to the data shown in Table 7, at the evening peak (18:00–20:00), the road conditions in 80% of the areas in Jinan were extremely poor. Most data points on the whole map are displayed in red. There was serious congestion in many road sections and even the phenomenon of vehicles parking and waiting. Only in the direction of Shandong sports center of Beiyuan viaduct and the whole section of the Yanshan overpass, were citizens able to pass unimpeded north–south on these two viaducts, and the driving speed of vehicles was not affected, as shown in Figure 6.
Table 7. Partial data of main roads in evening rush hours.
Figure 6. Evening rush hour road conditions. (The closer the road color is to green, the smoother the road. The closer the road color is to red, the more congested it is).
Citizens mostly travel on weekends, so the overall road traffic in Jinan entered a slow-moving situation, as shown in Figure 7. Except for a few roads that were red, the regional traffic road network was seriously congested; the main road was basically in a smooth state, and other road sections could also be driven normally.
Figure 7. Schematic diagram of road conditions during the weekend. (The closer the road color is to green, the smoother the road. The closer the road color is to red, the more congested it is).
The Jinan City Traffic Management Bureau stipulates that the maximum speed of Jinan urban expressways, i.e., elevated roads, is 90 km/h, the maximum speed limit of main roads is 80 km/h, and the speed limit of secondary trunk roads and branch roads is 60 km/h. According to the above data and image display, compared with the highest design speed of roads stipulated by the Urban Transportation Administration, it was found that the roads with serious congestion in Jinan are Jingshi Road, Quancheng Road, Tourism Road, Second Ring East Road, Shunhe East Street, Wei Second Road, Beiyuan Street, and Wuyingshan Middle Road. These roads are all surface sections; they are also the main traffic roads in Jinan, and they are the first choice for citizens to travel. On the other hand, except for a short-distance of slow congestion at the upper and lower bridge entrances, as a whole, the speed of traffic flow on the overpass was consistent with the road design speed while ensuring that no traffic accidents occurred. The design and planning of various traffic interchanges in Jinan City are reasonable, and the actual operation conditions are good; there are no road conditions that are not conducive to the passage of interchange vehicles due to unreasonable planning. This realizes the improvement in the traffic conditions of the local road network in Jinan City. Among them, the Shunhe Overpass and the Yanshan Overpass Second Ring East Road section performed particularly well, with almost no traffic congestion, which shows that if there is no traffic accident, the overpass plays a huge role in the coordination and diversion of congested sections in big cities.

5. Discussions

Without considering the low peak hours and peaceful peak hours, the traffic flow in the morning and evening peak hours alone is huge on weekdays because the vast majority of citizens travel through the main road. Taking The 10th Road as an example, considering only the urban section (from The Lashan overpass to the Yanshan Overpass), the whole journey needs to travel 12 km and pass 20 red street lights without using the overpass viaduct and only driving on the ground road, which means that there will be an intersection every 600 m on average. In addition, the traffic flow in the morning and evening peak is huge, and the vehicle capacity is weak. The distance between the traffic lights is too close, and the vehicles need to start and stop for traffic lights many times, resulting in the vehicle not reaching the expected design speed of the road. Multiple branches and intersections can make more vehicles merge into the main road, but, at the same time, there are too many traffic lights because of there being too many intersections, which affects the average speed of vehicles on the main road.
Another reason for Jinan congestion is the unreasonable road network planning. In 2019, Jinan’s road network density was only 4.68 km/km2, ranking 32nd and fifth from the bottom among 36 major cities in China. The congestion in Jinan is not only because the road network structure is not close enough, but also because the hierarchical structure design of the road network is unreasonable. In large-scale urban planning, a reasonable proportion of urban main road design and planning is expressway to trunk road to secondary trunk road to branch road, approximately equal to 1:2:3:6. However, according to the data released by Jinan Municipal Administration in 2016, in Jinan, the proportion of urban expressway to main road to secondary main road to branch road is 1:1:0.59:1.2. This cannot give full play to the functions of the road network that the city should have.

6. Conclusions

In order to solve the problem that vehicles on the main road cannot reach the planned speed of the road due to multiple fork roads and multiple intersections, we can use the intelligent transportation system proposed in this paper to control the intersection traffic lights. By monitoring the traffic flow at intersections and predicting the vehicle speed and waiting time, the information can be combined with the road information at multiple intersections, so as to achieve the purpose of reasonably controlling various traffic intersections and improving the efficiency of the road network.
For “T-shaped roads” and “deformed roads” intersections, it is necessary to strictly follow the standards of the intelligent transportation system to monitor and adjust the road network traffic in real time. The goal is to reduce the commuting time of citizens in the morning and evening peak periods, thereby improving the road traffic environment of vehicles and alleviating traffic congestion.
It is also a way to solve the problem of traffic congestion to make rational use of the public transport system, accelerate the construction of BRT rapid public transport corridors, improve bus lanes, and improve the operation speed of public transport. The intelligent transportation system can control and optimize the traffic network between the elevated overpass and the ground road. It can reduce the traffic conflict point at the intersection ramp, alleviate the problem of traffic aggregation on the elevated overpass, and avoid traffic congestion on the overpass.
In order to verify the effectiveness of the above improved scheme, we used the maximum flow model to process the data before and after the modification. The result is shown in Table 8.
Table 8. Road congestion index before and after adjustment.
According to the obtained data, our strategy improves the utilization rate of roads and greatly alleviates urban traffic congestion.

Author Contributions

Conceptualization, Q.Z. and Y.L.; Data curation, Q.Z. and Y.L.; Formal analysis, Q.Z., Y.L. and M.L.; Funding acquisition, Q.Z.; Investigation, Q.Z., M.L. and G.C.; Methodology, Y.L.; Project administration, Y.L.; Resources, Q.Z., M.L. and S.Z.; Software, Q.Z.; Supervision, Q.Z. and Y.L.; Validation, M.L.; Visualization, H.M.; Writing—original draft, Q.Z., Y.L. and G.C.; Writing—review and editing, Y.L., S.Z. and H.M. All authors have read and agreed to the published version of the manuscript.

Funding

This project is funded by the Excellent Teaching Team Construction Program of Shandong University of Science and Technology, project Number: JXTD20180510.

Data Availability Statement

Not Applicable, the study does not report any data.

Acknowledgments

I would like to solemnly thank Chen Junke for buying me iced lemonade while I was writing.

Conflicts of Interest

The authors declare no conflict of interest.

References

  1. Trubia, S.; Severino, A.; Curto, S.; Arena, F.; Pau, G. Smart Roads: An Overview of What Future Mobility Will Look Like. Infrastructures 2020, 5, 107. [Google Scholar] [CrossRef]
  2. Chen, C.; Luan, T.; Guan, X.; Lu, N.; Liu, Y. Connected Vehicular Transportation: Data Analytics and Traffic-Dependent Networking. IEEE Veh. Technol. Mag. 2017, 12, 42–54. [Google Scholar] [CrossRef]
  3. Chen, B.; Liu, D.; Lu, M. City size, migration and urban inequality in China. China Econ. Rev. 2018, 51, 42–58. [Google Scholar] [CrossRef]
  4. Mitra, S.K.; Saphores, J.-D.M. Why do they live so far from work? Determinants of long-distance commuting in California. J. Transp. Geogr. 2019, 80, 102489. [Google Scholar] [CrossRef]
  5. Cortinovis, C.; Geneletti, D. A performance-based planning approach integrating supply and demand of urban ecosystem services. Landsc. Urban Plan. 2020, 201, 103842. [Google Scholar] [CrossRef]
  6. Adwani, K.; Rakesh, N. Smart City Traffic Control System. In Intelligent Communication Technologies and Virtual Mobile Networks; Springer: Cham, Switzerland, 2019. [Google Scholar]
  7. Mo, W.; Wang, Y.; Zhang, Y.; Zhuang, D. Impacts of road network expansion on landscape ecological risk in a megacity, China: A case study of Beijing. Sci. Total Environ. 2017, 574, 1000–1011. [Google Scholar] [CrossRef] [PubMed] [Green Version]
  8. Diehl, F.; Brunner, T.; Truong-Le, M.; Knoll, A. Graph Neural Networks for Modelling Traffic Participant Interaction. In 2019 IEEE Intelligent Vehicles Symposium; IEEE: Piscataway, NJ, USA, 2019; pp. 695–701. [Google Scholar]
  9. Zhao, Y.; Zhang, H.; An, L.; Liu, Q.J.C. Improving the approaches of traffic demand forecasting in the big data era. Cities 2018, 82, 19–26. [Google Scholar] [CrossRef]
  10. Riouali, Y.; Benhlima, L.; Bah, S. Petri net extension for traffic road modelling. In 2016 IEEE/ACS 13th International Conference of Computer Systems and Applications (AICCSA); IEEE: Piscataway, NJ, USA, 2016; pp. 1–6. [Google Scholar]
  11. Toh, C.K.; Sanguesa, J.A.; Cano, J.C.; Martinez, F.J. Advances in smart roads for future smart cities. Proc. R. Soc. A Math. Phys. Eng. Sci. 2020, 476, 20190439. [Google Scholar] [CrossRef]
  12. Tao, G.; Wang, S.; Li, Z. Reinforcement Learning-Based Signal Control Strategies to Improve Travel Efficiency at Urban Intersection. In International Conference on Transportation and Development 2020; American Society of Civil Engineers: Reston, VA, USA, 2020. [Google Scholar]
  13. Zhang, Y.; Ge, J. Simulation of non-motor vehicle and pedestrian mixed crossing behavior. J. Physics Conf. Ser. 2021, 1982, 012166. Available online: https://iopscience.iop.org/article/10.1088/1742-6596/1982/1/012166/meta (accessed on 4 November 2021). [CrossRef]
  14. Jia, H.; Tan, Y.; Fu, X. Study on Evaluation Method of Urban Traffic Congestion Based on Fuzzy Comprehensive Evaluation. In Proceedings of the 2012 Third International Conference on Digital Manufacturing & Automation, Guilin, China, 31 July–2 August 2012; Available online: https://ieeexplore.ieee.org/abstract/document/6298641 (accessed on 4 November 2021).
  15. Li, R.; Wu, J.; Liu, H.; Gao, Z.; Sun, H.; Ding, R.; Tang, T. Crowded urban traffic: Co-evolution among land development, population, roads and vehicle ownership. Nonlinear Dyn. 2019, 95, 2783–2795. [Google Scholar] [CrossRef]
  16. Narayanaswami, S. Urban transportation: Innovations in infrastructure planning and development. Int. J. Logist. Manag. 2017, 28, 150–171. [Google Scholar] [CrossRef]
  17. Kong, L.; Dai, Y. Discussion on “Technical Standards of Traffic Impact Analysis of Construction Projects”. Urban Transp. China 2010, 4. Available online: https://en.cnki.com.cn/Article_en/CJFDTotal-CSJT201004001.htm (accessed on 4 November 2021).
  18. Wang, L.; Zhang, L.; Zhang, L.; Li, M.; Zhang, H.; Li, K.; Xiu, W. On-line Simulation System of Urban Road Traffic Signal Control Based on Scene Driven. In 2019 IEEE 8th Data Driven Control and Learning Systems Conference (DDCLS); IEEE: Piscataway, NJ, USA, 2019; pp. 1213–1218. [Google Scholar]
  19. Sanchez, L.; Fournier, B.; Mitchell, D.; Bastien, J. Condition assessment of an ASR-affected overpass after nearly 50 years in service. Constr. Build. Mater. 2019, 236, 117554. [Google Scholar] [CrossRef]
  20. Yue, W.; Li, C.; Mao, G. Urban Traffic Bottleneck Identification Based on Congestion Propagation. In 2018 IEEE International Conference on Communications (ICC); IEEE: Piscataway, NJ, USA, 2018; pp. 1–6. [Google Scholar]
  21. Yang, J.; Han, Y.; Wang, Y.; Jiang, B.; Lv, Z.; Song, H. Optimization of real-time traffic network assignment based on IoT data using DBN and clustering model in smart city. Futur. Gener. Comput. Syst. 2020, 108, 976–986. [Google Scholar] [CrossRef]
  22. Liu, Y. The Modeling and Simulation of the Tandem Intersection Considering the Vehicle Operation Law. Acad. J. Eng. Technol. Sci. 2020, 3, 145–159. Available online: https://francis-press.com/papers/1953 (accessed on 4 November 2021).
  23. Wierbos, M.; Knoop, V.; Hänseler, F.; Hoogendoorn, S. A macroscopic flow model for mixed bicycle-car traffic. Transp. A Transp. Sci. 2020, 17, 340–355. [Google Scholar] [CrossRef] [Green Version]
  24. Zhang, C.; Zhao, Y.; Zhang, Z.; Zhu, B. Case Study of Underground Shield Tunnels in Interchange Piles Foundation Underpinning Construction. Appl. Sci. 2021, 11, 1611. [Google Scholar] [CrossRef]
  25. Veres, M.; Moussa, M. Deep Learning for Intelligent Transportation Systems: A Survey of Emerging Trends. IEEE Trans. Intell. Transp. Syst. 2020, 21, 3152–3168. [Google Scholar] [CrossRef]
  26. Ning, Z.; Huang, J.; Wang, X. Vehicular Fog Computing: Enabling Real-Time Traffic Management for Smart Cities. IEEE Wirel. Commun. 2019, 26, 87–93. [Google Scholar] [CrossRef]
  27. Nie, L.; Li, Y.; Kong, X.J. Spatio-Temporal Network Traffic Estimation and Anomaly Detection Based on Convolutional Neural Network in Vehicular Ad-Hoc Networks. IEEE Access 2018, 6, 40168–40176. [Google Scholar] [CrossRef]
  28. Kan, K.; Yang, Z.; Lyu, P.; Zheng, Y.; Shen, L.J. Numerical study of turbulent flow past a rotating axial-flow pump based on a level-set immersed boundary method. Renew. Energy 2021, 168, 960–971. [Google Scholar] [CrossRef]
  29. Kan, K.; Chen, H.; Zheng, Y.; Zhou D-q Binama, M.; Dai, J. Transient characteristics during power-off process in a shaft extension tubular pump by using a suitable numerical model. Renew. Energy 2021, 164, 109–121. [Google Scholar] [CrossRef]
  30. Liu, Y.; Zhu, Q.; Cao, F.; Chen, J.; Lu, G. High-Resolution Remote Sensing Image Segmentation Framework Based on Attention Mechanism and Adaptive Weighting. ISPRS Int. J. Geo-Inf. 2021, 10, 241. [Google Scholar] [CrossRef]
  31. Wambui, D.; Ombui, D.; Kagiri, D.A. Factors Affecting Completion of Road Construction Projects in Nairobi City County: Case Study of Kenya Urban Roads Authority (KURA). Int. J. Sci. Res. Publ. 2015, 5, 2250–3153. [Google Scholar]
  32. Liu, Y.F.; Wu, J.B.; Qiu, X. Research on video emotion analysis algorithm based on deep learning. Basic Clin. Pharmacol. Toxicol. 2021, 128, 183–184. [Google Scholar]
  33. Hamadneh, J.; Esztergár-Kiss, D. The Influence of Introducing Autonomous Vehicles on Conventional Transport Modes and Travel Time. Energies 2021, 14, 4163. [Google Scholar] [CrossRef]
  34. Kan, K.; Zheng, Y.; Chen, H.; Zhou D-q Dai, J.; Binama, M.; Yu, A. Numerical simulation of transient flow in a shaft extension tubular pump unit during runaway process caused by power failure. Renew. Energy 2020, 154, 1153–1164. [Google Scholar] [CrossRef]
  35. Piechna, J. Low Pressure Tube Transport—An Alternative to Ground Road Transport—Aerodynamic and Other Problems and Possible Solutions. Energies 2021, 14, 3766. [Google Scholar] [CrossRef]
  36. Li, L.; Coskun, S.; Wang, J.; Fan, Y.; Zhang, F.; Langari, R. Velocity Prediction Based on Vehicle Lateral Risk Assessment and Traffic Flow: A Brief Review and Application Examples. Energies 2021, 14, 3431. [Google Scholar] [CrossRef]
  37. Gołębiowski, P.; Jacyna, M.; Stańczak, A. The Assessment of Energy Efficiency versus Planning of Rail Freight Traffic. A Case Study on the Example of Poland. Energies 2021, 14, 5629. [Google Scholar]
  38. Liu, Y.; Lu, G.; Chen, J.; Zhu, Q. Exploration of Internal and External Factors of Swimmers Performance Based on Biofluid Mechanics and Computer Simulation. Int. J. Env. Res. Public Health 2021, 18, 6471. [Google Scholar] [CrossRef]
  39. Ren, Q.; Man, K.L.; Li, M.; Gao, B. Using Blockchain to Enhance and Optimize IoT-based Intelligent Traffic System. In 2019 International Conference on Platform Technology and Service (PlatCon); IEEE: Piscataway, NJ, USA, 2019; pp. 1–4. [Google Scholar]
  40. Tanimoto, J.; An, X. Improvement of traffic flux with introduction of a new lane-change protocol supported by Intelligent Traffic System. Chaos Solitons Fractals 2019, 122, 1–5. [Google Scholar] [CrossRef]
  41. Macioszek, E.; Kurek, A. The Use of a Park and Ride System—A Case Study Based on the City of Cracow (Poland). Energies 2020, 13, 3473. [Google Scholar] [CrossRef]
  42. Macioszek, E.; Kurek, A. The Analysis of the Factors Determining the Choice of Park and Ride Facility Using a Multinomial Logit Model. Energies 2021, 14, 203. [Google Scholar] [CrossRef]
  43. Ortega, J.; Tóth, J.; Péter, T. A Comprehensive Model to Study the Dynamic Accessibility of the Park & Ride System. Sustainability 2021, 13, 4064. [Google Scholar]
  44. Berg, D.B.; Nihan, N. Predictive algorithm improvements for a real-time ramp control system. In Institute of Transportation Engineers Meeting; Federal Highway Administration: Washington, DC, USA, 1990. Available online: https://trid.trb.org/view/334732 (accessed on 4 November 2021).
  45. Stephanedes, Y. Implementation of On-Line Zone Control Strategies for Optimal Ramp Metering in the Minneapolis Ring Road; IET: Stevenage, UK, 1994. [Google Scholar]
  46. Kerner, B.; Klenov, S. Probabilistic Breakdown Phenomenon at On-Ramp Bottlenecks in Three-Phase Traffic Theory. Transp. Res. Rec. 2005, 1965, 70–78. [Google Scholar] [CrossRef]
  47. Gai, S.; Zeng, X.; Wu, C.; Zhan, J. Review of Ramp Metering Methodologies for Urban Expressway. In International Symposium for Intelligent Transportation and Smart City; Springer: Cham, Switzerland, 2019. [Google Scholar]
  48. Hu, W.; Wang, H.; Qiu, Z.; Yan, L.; Nie, C.; Du, B. An urban traffic simulation model for traffic congestion predicting and avoiding. Neural Comput. Appl. 2016, 30, 1769–1781. [Google Scholar] [CrossRef]
  49. Beijing Municipal Engineering Design and Research Institute, Shanghai Municipal Engineering Design and Research Institute (Group) Co., LTD., Tianjin Municipal Engineering Design and Research Institute, Shenzhen Municipal Design and Research Institute Co., LTD., Chongqing Municipal Design Institute, Tongji University & Beijing University of Technology (Code for Urban Road Engineering Design in pp. 172P.B5 2012, Industry Standard-Urban Construction.
  50. Virtanen, P.; Gommers, R.; Oliphant, T.E.; Haberland, M.; Reddy, T.; Cournapeau, D.; Burovski, E.; Peterson, P.; Weckesser, W.; Bright, J.; et al. SciPy 1.0: Fundamental algorithms for scientific computing in Python. Nat. Methods 2020, 17, 261–272. [Google Scholar] [CrossRef] [Green Version]
  51. Zhang, T.; Pan, M.; Zhao, J.; Yu, Y.; Li, X. An Open Framework for Semantic Code Queries on Heterogeneous Repositories. In 2015 International Symposium on Theoretical Aspects of Software Engineering; IEEE: Piscataway, NJ, USA, 2015; pp. 39–46. [Google Scholar]
  52. Yu, M.; Huang, Y.; Cheng, X.; Tian, J. An ArcMap plug-in for calculating landscape metrics of vector data. Ecol. Inform. 2019, 50, 207–219. [Google Scholar] [CrossRef]
  53. Chopker, M.K. Product Discovery over HTTP Interface via Web Finger Printing. In 2018 Fourth International Conference on Computing Communication Control and Automation (ICCUBEA); IEEE: Piscataway, NJ, USA, 2018; pp. 1–3. [Google Scholar]
  54. Kellogg, G.; Champin, P.; Longley, D. JSON-LD 1.1@ A JSON-based Serialization for Linked Data. Ph.D. Thesis, W3C. 2019. Available online: https://hal.archives-ouvertes.fr/hal-02141614/ (accessed on 4 November 2021).
  55. Bray, T.; Paoli, J.; Sperberg-McQueen, C.M.; Maler, E. eXtensible Markup Language (XML. 1.0 (Second Edition). W3c Recomm. 2000, 4, 220. [Google Scholar]
  56. Guo, J.; Zhong, R.; Zeng, F. Panoramic Images Mapping Tools Integrated Within the ESRI ArcGIS Software. In IOP Conference Series: Earth and Environmental Science; IOP Publishing: Bristol, UK, 2014. [Google Scholar]
Publisher’s Note: MDPI stays neutral with regard to jurisdictional claims in published maps and institutional affiliations.

Article Metrics

Citations

Article Access Statistics

Multiple requests from the same IP address are counted as one view.