
Use of Machine Learning Methods for Indoor Temperature Forecasting


Abstract
:
1. Introduction
2. Methodology and Materials
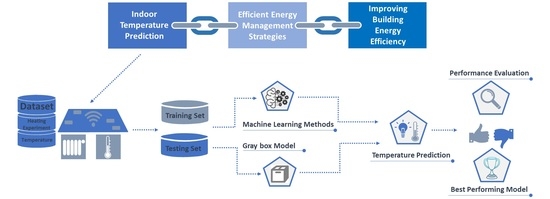
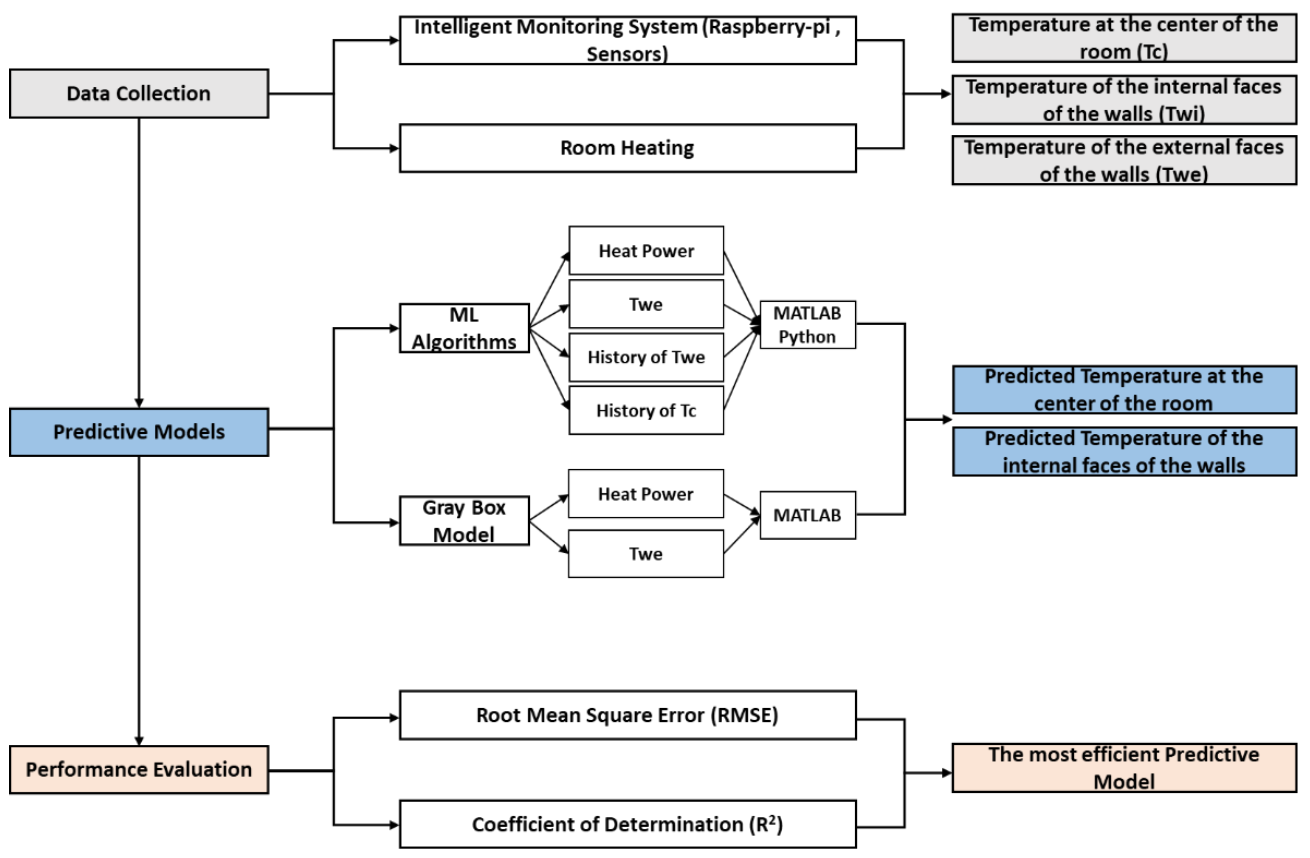
2.1. Methodology
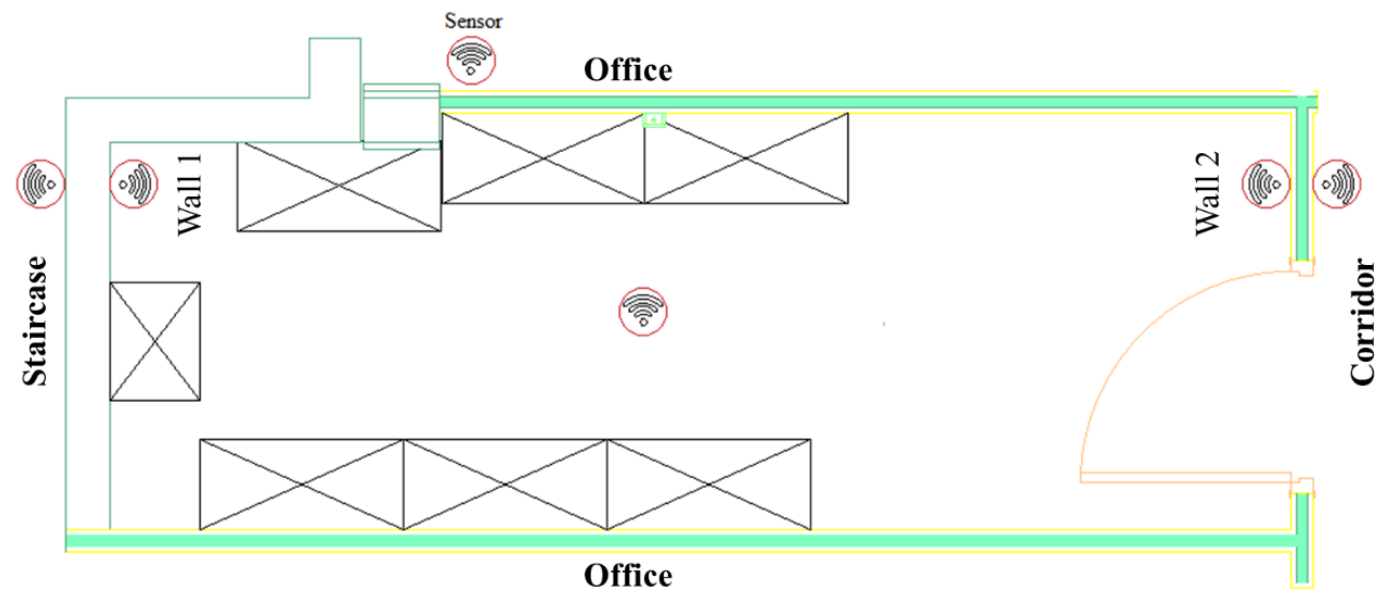
2.2. Material
2.3. Selection of Predictive Models
2.3.1. ML Methods
2.3.2. Gray Box Model (GBM)
3. Results and Discussion
4. Conclusions
Supplementary Materials
Author Contributions
Funding
Data Availability Statement
Conflicts of Interest
Appendix A

| Neurons | Epochs | RMSE | R2 |
|---|---|---|---|
| 4 | 12 | 0.274 | 0.996 |
| 16 | 0.311 | 0.99487 | |
| 18 | 0.244 | 0.9968 | |
| 22 | 0.222 | 0.99738 | |
| 26 | 0.143 | 0.99891 | |
| 29 | 0.142 | 0.99893 | |
| 32 | 0.081 | 0.99965 | |
| 37 | 0.117 | 0.99927 | |
| 43 | 0.179 | 0.99829 | |
| 54 | 0.41 | 0.9911 | |
| 59 | 0.257 | 0.99648 | |
| 62 | 0.1 | 0.99946 | |
| 82 | 0.211 | 0.9976 | |
| 94 | 0.095 | 0.99952 | |
| 139 | 0.191 | 0.9981 | |
| 5 | 9 | 0.327 | 0.99433 |
| 11 | 0.244 | 0.99685 | |
| 15 | 0.219 | 0.99745 | |
| 21 | 0.351 | 0.99349 | |
| 26 | 0.172 | 0.99843 | |
| 30 | 0.279 | 0.99587 | |
| 41 | 0.0806 | 0.99965 | |
| 57 | 0.146 | 0.99886 | |
| 61 | 0.251 | 0.99665 | |
| 87 | 0.326 | 0.99436 | |
| 6 | 11 | 0.303 | 0.99513 |
| 16 | 0.165 | 0.99854 | |
| 20 | 0.158 | 0.99866 | |
| 25 | 0.152 | 0.99878 | |
| 28 | 0.148 | 0.99883 | |
| 34 | 0.358 | 0.99317 | |
| 43 | 0.235 | 0.99705 | |
| 73 | 0.151 | 0.99879 | |
| 81 | 0.231 | 0.99714 | |
| 159 | 0.311 | 0.99487 | |
| 7 | 13 | 0.291 | 0.9955 |
| 17 | 0.085 | 0.99961 | |
| 20 | 0.206 | 0.99774 | |
| 24 | 0.317 | 0.99467 | |
| 28 | 0.175 | 0.99836 | |
| 32 | 0.181 | 0.99826 | |
| 49 | 0.218 | 0.9974 | |
| 91 | 0.121 | 0.99921 | |
| 120 | 0.11 | 0.99935 | |
| 8 | 15 | 0.278 | 0.9959 |
| 19 | 0.265 | 0.99627 | |
| 23 | 0.234 | 0.99711 | |
| 33 | 0.167 | 0.99851 | |
| 41 | 0.229 | 0.99722 | |
| 55 | 0.352 | 0.9934 | |
| 69 | 0.213 | 0.9976 | |
| 74 | 0.123 | 0.99919 | |
| 111 | 0.239 | 0.99697 | |
| 9 | 14 | 0.135 | 0.99903 |
| 19 | 0.12 | 0.99923 | |
| 25 | 0.229 | 0.99722 | |
| 28 | 0.217 | 0.9975 | |
| 38 | 0.282 | 0.99578 | |
| 43 | 0.243 | 0.99684 | |
| 55 | 0.131 | 0.9991 | |
| 73 | 0.166 | 0.99853 | |
| 10 | 12 | 0.165 | 0.99854 |
| 14 | 0.089 | 0.99957 | |
| 19 | 0.161 | 0.99831 | |
| 27 | 0.277 | 0.99591 | |
| 31 | 0.265 | 0.99627 | |
| 53 | 0.266 | 0.99623 | |
| 66 | 0.178 | 0.99831 | |
| 72 | 0.3202 | 0.99456 |
Appendix B
| 50% | 60% | 70% | 80% | |||||
|---|---|---|---|---|---|---|---|---|
| RMSE | R2 | RMSE | R2 | RMSE | R2 | RMSE | R2 | |
| ANN | 0.248 | 0.99672 | 0.235 | 0.9971 | 0.081 | 0.99965 | 0.059 | 0.99981 |
| MLR | 0.347 | 0.99359 | 0.336 | 0.99398 | 0.332 | 0.99415 | 0.331 | 0.99419 |
| DT | 0.52 | 0.98561 | 0.332 | 0.9945 | 0.268 | 0.99618 | 0.237 | 0.99702 |
| RF | 0.395 | 0.99171 | 0.353 | 0.99337 | 0.295 | 0.99539 | 0.278 | 0.99589 |
| ET | 0.198 | 0.99791 | 0.166 | 0.99852 | 0.159 | 0.99864 | 0.139 | 0.99898 |
| GB | 0.297 | 0.99531 | 0.269 | 0.99614 | 0.218 | 0.99748 | 0.191 | 0.9981 |
| XGB | 0.304 | 0.9951 | 0.282 | 0.99578 | 0.229 | 0.99721 | 0.219 | 0.99743 |
Appendix C
References
- Zamora-Martínez, F.; Romeu, P.; Botella-Rocamora, P.; Pardo, J. Online learning of indoor temperature forecasting models towards energy efficiency. Energy Build. 2014, 83, 162–172. [Google Scholar] [CrossRef]
- Zamora-Martínez, F.; Romeu, P.; Botella-Rocamora, P.; Pardo, J. Towards energy efficiency: Forecasting indoor temperature via multivariate analysis. Energies 2013, 6, 4639–4659. [Google Scholar] [CrossRef] [Green Version]
- Cui, B.; Fan, C.; Munk, J.; Mao, N.; Xiao, F.; Dong, J.; Kuruganti, T. A hybrid building thermal modeling approach for predicting temperatures in typical, detached, two-story houses. Appl. Energy 2019, 236, 101–116. [Google Scholar] [CrossRef]
- Ruano, A.E.; Crispim, E.M.; Conceição, E.Z.E.; Lúcio, M.M.J.R. Prediction of building’s temperature using neural networks models. Energy Build. 2006, 38, 682–694. [Google Scholar] [CrossRef]
- Ferreira, P.M.; Ruano, A.E.; Silva, S.; Conceição, E.Z.E. Neural networks based predictive control for thermal comfort and energy savings in public buildings. Energy Build. 2012, 55, 238–251. [Google Scholar] [CrossRef] [Green Version]
- Álvarez, J.D.; Redondo, J.L.; Camponogara, E.; Normey-Rico, J.; Berenguel, M.; Ortigosa, P.M. Optimizing building comfort temperature regulation via model predictive control. Energy Build. 2013, 57, 361–372. [Google Scholar] [CrossRef]
- Zhao, Y.; Genovese, P.V.; Li, Z. Intelligent thermal comfort controlling system for buildings based on IoT and AI. Future Internet 2020, 12, 30. [Google Scholar] [CrossRef] [Green Version]
- Li, X.; Wen, J. Review of building energy modeling for control and operation. Renew. Sustain. Energy Rev. 2014, 37, 517–537. [Google Scholar] [CrossRef]
- Ciulla, G.; D’Amico, A. Building energy performance forecasting: A multiple linear regression approach. Appl. Energy 2019, 253, 113500. [Google Scholar] [CrossRef]
- Amasyali, K.; El-Gohary, N.M. A review of data-driven building energy consumption prediction studies. Renew. Sustain. Energy Rev. 2018, 81, 1192–1205. [Google Scholar] [CrossRef]
- Jain, R.K.; Damoulas, T.; Kontokosta, C.E. Towards data-driven energy consumption of multi-family residential buildings: Feature selection via The Lasso. Comput. Civ. Build Eng. 2016, 1675–1682. [Google Scholar] [CrossRef] [Green Version]
- Ferracuti, F.; Fonti, A.; Ciabattoni, L.; Pizzuti, S.; Arteconi, A.; Helsen, L.; Comodi, G. Data-driven models for short-term thermal behaviour prediction in real buildings. Appl. Energy 2017, 204, 1375–1387. [Google Scholar] [CrossRef]
- Liu, Z.; Wu, D.; Liu, Y.; Han, Z.; Lun, L.; Gao, J.; Jin, G.; Cao, G. Accuracy analyses and model comparison of machine learning adopted in building energy consumption prediction. Energy Explor. Exploit. 2019, 37, 1426–1451. [Google Scholar] [CrossRef] [Green Version]
- Wei, Y.; Zhang, X.; Shi, Y.; Xia, L.; Pan, S.; Wu, J.; Han, M.; Zhao, X. A review of data-driven approaches for prediction and classification of building energy consumption. Renew. Sustain. Energy Rev. 2018, 82, 1027–1047. [Google Scholar] [CrossRef]
- Bourdeau, M.; Qiang Zhai, X.; Nefzaoui, E.; Guo, X.; Chatellier, P. Modeling and forecasting building energy consumption: A review of data-driven techniques. Sustain. Cities Soc. 2019, 48, 101533. [Google Scholar] [CrossRef]
- Ahmad, M.W.; Reynolds, J.; Rezgui, Y. Predictive modelling for solar thermal energy systems: A comparison of support vector regression, random forest, extra trees and regression trees. J. Clean. Prod. 2018, 203, 810–821. [Google Scholar] [CrossRef]
- Berthou, T.; Stabat, P.; Salvazet, R.; Marchio, D. Development and validation of a gray box model to predict thermal behavior of occupied office buildings. Energy Build. 2014, 74, 91–100. [Google Scholar] [CrossRef]
- Mahesh, B. Machine learning algorithms—A review. Int. J. Sci. Res. 2018, 9, 381–386. [Google Scholar] [CrossRef]
- Jordan, M.I.; Mitchell, T.M. Machine learning: Trends, perspectives, and prospects. Science 2015, 349, 255–260. [Google Scholar] [CrossRef]
- Mba, L.; Meukam, P.; Kemajou, A. Application of artificial neural network for predicting hourly indoor air temperature and relative humidity in modern building in humid region. Energy Build. 2016, 121, 32–42. [Google Scholar] [CrossRef]
- Qi, C.; Wang, W.; Wang, S. Application of indoor temperature prediction based on SVM and BPNN. In Proceedings of the 27th Chinese Control and Decision Conference CCDC 2015, Qingdao, China, 23–25 May 2015; pp. 2883–2887. [Google Scholar] [CrossRef]
- Chammas, M.; Makhoul, A.; Demerjian, J. An efficient data model for energy prediction using wireless sensors. Comput. Electr. Eng. 2019, 76, 249–257. [Google Scholar] [CrossRef] [Green Version]
- Cotrufo, N.; Saloux, E.; Hardy, J.M.; Candanedo, J.; Platon, R. A practical artificial intelligence-based approach for predictive control in commercial and institutional buildings. Energy Build. 2020, 206, 109563. [Google Scholar] [CrossRef]
- Moon, J.W. Comparative performance analysis of the artificial-intelligence-based thermal control algorithms for the double-skin building. Appl. Therm. Eng. 2015, 91, 334–344. [Google Scholar] [CrossRef]
- Sholahudin, S.; Hwataik, H. Simplified Dynamic Neural Network Model to Predict Heating Load of a Building Using Taguchi Method. Energy 2016, 115, 1672–1678. [Google Scholar] [CrossRef]
- Li, Q.; Meng, Q.; Cai, J.; Yoshino, H.; Mochida, A. Predicting hourly cooling load in the building: A comparison of support vector machine and different artificial neural networks. Energy Convers. Manag. 2009, 50, 90–96. [Google Scholar] [CrossRef]
- Li, Q.; Meng, Q.; Cai, J.; Yoshino, H.; Mochida, A. Applying support vector machine to predict hourly cooling load in the building. Appl. Energy 2009, 86, 2249–2256. [Google Scholar] [CrossRef]
- Paterakis, N.G.; Mocanu, E.; Gibescu, M.; Stappers, B.; Van Alst, W. Deep learning versus traditional machine learning methods for aggregated energy demand prediction. In Proceedings of the 2017 IEEE PES Innovation Smart Grid Technologies Conference Europe (ISGT-Europe), Turin, Italy, 26–29 September 2017; pp. 1–6. [Google Scholar] [CrossRef]
- Yu, Z.; Haghighat, F.; Fung, B.C.M.; Yoshino, H. A decision tree method for building energy demand modeling. Energy Build. 2010, 42, 1637–1646. [Google Scholar] [CrossRef] [Green Version]
- Wang, Z.; Wang, Y.; Zeng, R.; Srinivasan, R.S.; Ahrentzen, S. Random Forest based hourly building energy prediction. Energy Build. 2018, 171, 11–25. [Google Scholar] [CrossRef]
- Özbalta, T.G.; Sezer, A.; Yildiz, Y. Models for prediction of daily mean indoor temperature and relative humidity: Education building in Izmir, Turkey. Indoor Built Environ. 2012, 21, 772–781. [Google Scholar] [CrossRef] [Green Version]
- Afroz, Z.; Shafiullah, G.; Urmee, T.; Higgins, G. Prediction of Indoor Temperature in an Institutional Building. Energy Procedia 2017, 142, 21860–21866. [Google Scholar] [CrossRef]
- Potočnik, P.; Vidrih, B.; Kitanovski, A.; Govekar, E. Neural network, ARX, and extreme learning machine models for the short-term prediction of temperature in buildings. Build. Simul. 2019, 12, 1077–1093. [Google Scholar] [CrossRef]
- Mateo, F.; Carrasco, J.J.; Sellami, A.; Millan-Giraldo, M.; Dominguez, M.; Soria-Olivas, E. Machine learning methods to forecast temperature in buildings. Expert Syst. Appl. 2013, 40, 1061–1068. [Google Scholar] [CrossRef]
- Paul, D.; Chakraborty, T.; Datta, S.K.; Paul, D. IoT and machine learning based prediction of smart building indoor temperature. In Proceedings of the 2018 4th International Conference on Computer and Information Sciences ICCOINS, Kuala Lumpur, Malaysia, 13–14 August 2018. [Google Scholar] [CrossRef]
- Aguilera, J.J.; Andersen, R.K.; Toftum, J. Prediction of indoor air temperature using weather data and simple building descriptors. Int. J. Environ. Res. Public Health 2019, 16, 4349. [Google Scholar] [CrossRef] [PubMed] [Green Version]
- Foucquier, A.; Robert, S.; Suard, F.; Stéphan, L.; Jay, A. State of the art in building modelling and energy performances prediction: A review. Renew. Sustain. Energy Rev. 2013, 23, 272–288. [Google Scholar] [CrossRef] [Green Version]
- Brastein, O.M.; Sharma, R.; Skeie, N.-O. Sensor placement and parameter identifability in grey-box models of building thermal behaviour. In Proceedings of the 60th SIMS Conference on Simulation and Modelling SIMS 2019, Västerås, Sweden, 12–16 August 2019; Volume 170, pp. 51–58. [Google Scholar] [CrossRef] [Green Version]
- Ogunsola, O.T.; Song, L.; Wang, G. Development and validation of a time-series model for real-time thermal load estimation. Energy Build. 2014, 76, 440–449. [Google Scholar] [CrossRef]
- Hong, D.; Ortiz, J.; Whitehouse, K.; Culler, D. Towards automatic spatial verification of sensor placement in buildings. In Proceedings of the 5th ACM Workshop on Embedded Systems For Energy-Efficient Buildings, BuildSys 2013, Roma, Italy, 11–15 November 2013. [Google Scholar] [CrossRef]
- Yanti, R.J.; Faridah; Mustika, I.W.; Ariananda, D.D.; Utami, S.S. Analysis of Gaussian process to predict thermal sensor placement for controlling energy consumption on the educational building. AIP Conf. Proc. 2020, 2223, 50006. [Google Scholar] [CrossRef]
- Borggaard, J.; Burns, J.; Zietsman, L. On using LQG performance metrics for sensor placement. In Proceedings of the 2011 American Control Conference, San Francisco, CA, USA, 29 June–1 July 2011; pp. 2381–2386. [Google Scholar] [CrossRef]
- Campana, J.P.; Schuss, M.; Mahdavi, A.; Morini, G.L. Effects of the room temperature sensor position and radiator sizing on indoor thermal comfort and energy performances. E3S Web Conf. 2019, 111. [Google Scholar] [CrossRef]
- Borier, O.M.; Kazanci, O.B.; Olesen, B.W.; Khovalyg, D. Which sensor type at which location should offices with south orientated window choose to improve comfort and reduce energy consumption? J. Phys. Conf. Ser. 2019, 1343. [Google Scholar] [CrossRef]
- May Tzuc, O.; Livas-García, A.; Jiménez Torres, M.; Cruz May, E.; López-Manrique, L.M.; Bassam, A. Artificial Intelligence Techniques for Modeling Indoor Building Temperature under Tropical Climate Using Outdoor Environmental Monitoring. J. Energy Eng. 2020, 146. [Google Scholar] [CrossRef]
- Fan, C.; Xiao, F.; Wang, S. Development of prediction models for next-day building energy consumption and peak power demand using data mining techniques. Appl. Energy 2014, 127, 1–10. [Google Scholar] [CrossRef]
- Luo, M.; Xie, J.; Yan, Y.; Ke, Z.; Yu, P.; Wang, Z.; Zhang, J. Comparing machine learning algorithms in predicting thermal sensation using ASHRAE Comfort Database II. Energy Build. 2020, 210, 109776. [Google Scholar] [CrossRef]
- Papadopoulos, S.; Azar, E.; Woon, W.L.; Kontokosta, C.E. Evaluation of tree-based ensemble learning algorithms for building energy performance estimation. J. Build. Perform. Simul. 2018, 11, 322–332. [Google Scholar] [CrossRef]
- Ahmad, M.W.; Mourshed, M.; Rezgui, Y. Trees vs Neurons: Comparison between random forest and ANN for high-resolution prediction of building energy consumption. Energy Build. 2017, 147, 77–89. [Google Scholar] [CrossRef]
- Wang, R.; Lu, S.; Li, Q. Multi-criteria comprehensive study on predictive algorithm of hourly heating energy consumption for residential buildings. Sustain. Cities Soc. 2019, 49, 101623. [Google Scholar] [CrossRef]
- Attoue, N.; Shahrour, I.; Younes, R. Smart building: Use of the artificial neural network approach for indoor temperature forecasting. Energies 2018, 11, 395. [Google Scholar] [CrossRef] [Green Version]
- Chan, S.Y.; Chau, C.K. Development of artificial neural network models for predicting thermal comfort evaluation in urban parks in summer and winter. Build. Environ. 2019, 164, 106364. [Google Scholar] [CrossRef]
- Deng, Z.; Chen, Q. Artificial neural network models using thermal sensations and occupants’ behavior for predicting thermal comfort. Energy Build. 2018, 174, 587–602. [Google Scholar] [CrossRef]
- Mottahedi, M.; Mohammadpour, A.; Amiri, S.S.; Riley, D.; Asadi, S. Multi-linear Regression Models to Predict the Annual Energy Consumption of an Office Building with Different Shapes. Procedia Eng. 2015, 118, 622–629. [Google Scholar] [CrossRef]
- Capozzoli, A.; Grassi, D.; Causone, F. Estimation models of heating energy consumption in schools for local authorities planning. Energy Build. 2015, 105, 302–313. [Google Scholar] [CrossRef] [Green Version]
- Attanasio, A.; Piscitelli, M.S.; Chiusano, S.; Capozzoli, A.; Cerquitelli, T. Towards an automated, fast and interpretable estimation model of heating energy demand: A data-driven approach exploiting building energy certificates. Energies 2019, 12, 1273. [Google Scholar] [CrossRef] [Green Version]
- Ahmad, M.W.; Mouraud, A.; Rezgui, Y.; Mourshed, M. Deep highway networks and tree-based ensemble for predicting short-term building energy consumption. Energies 2018, 11, 3408. [Google Scholar] [CrossRef] [Green Version]
- Farhan, A.A.; Pattipati, K.; Wang, B.; Luh, P. Predicting individual thermal comfort using machine learning algorithms. In Proceedings of the IEEE International Conference on Automation Science and Engineering, Gothenburg, Sweden, 24–28 August 2015; pp. 708–713. [Google Scholar] [CrossRef]
- Liu, S.; Schiavon, S.; Das, H.P.; Jin, M.; Spanos, C.J. Personal thermal comfort models with wearable sensors. Build. Environ. 2019, 162, 106281. [Google Scholar] [CrossRef] [Green Version]
- Touzani, S.; Granderson, J.; Fernandes, S. Gradient boosting machine for modeling the energy consumption of commercial buildings. Energy Build. 2018, 158, 1533–1543. [Google Scholar] [CrossRef] [Green Version]
- Seyedzadeh, S.; Pour Rahimian, F.; Rastogi, P.; Glesk, I. Tuning machine learning models for prediction of building energy loads. Sustain. Cities Soc. 2019, 47, 101484. [Google Scholar] [CrossRef]
- Chakraborty, D.; Elzarka, H. Advanced machine learning techniques for building performance simulation: A comparative analysis. J. Build. Perform. Simul. 2019, 12, 193–207. [Google Scholar] [CrossRef]
- Chakraborty, D.; Elzarka, H. Early detection of faults in HVAC systems using an XGBoost model with a dynamic threshold. Energy Build. 2019, 185, 326–344. [Google Scholar] [CrossRef]
- Chaudhuri, T.; Soh, Y.C.; Li, H.; Xie, L. A feedforward neural network based indoor-climate control framework for thermal comfort and energy saving in buildings. Appl. Energy 2019, 248, 44–53. [Google Scholar] [CrossRef]
- Alawadi, S.; Mera, D.; Fernández-Delgado, M.; Alkhabbas, F.; Olsson, C.M.; Davidsson, P. A comparison of machine learning algorithms for forecasting indoor temperature in smart buildings. Energy Syst. 2020, 1–17. [Google Scholar] [CrossRef] [Green Version]
- Attoue, N.; Shahrour, I.; Mroueh, H.; Younes, R. Determination of the optimal order of grey-box models for short-time prediction of buildings’ thermal behavior. Buildings 2019, 9, 198. [Google Scholar] [CrossRef] [Green Version]
- Sarabi, S.; Ploix, S.; Le, M.H.; Dang, H.A.; Wurtz, F. Assessing the relevance of reduced order models for building envelop. In Proceedings of the BS 2013 13th Conference of International Building Performance Simulation Association, Chambéry, France, 26–28 August 2013; pp. 3538–3545. [Google Scholar]
- Ha, D.L.; Ploix, S.; Zamai, E.; Jacomino, M. Realtimes dynamic optimization for demand-side load management. Int. J. Manag. Sci. Eng. Manag. 2008, 3, 243–252. [Google Scholar] [CrossRef]
- Candanedo, J.A.; Dehkordi, V.R.; Lopez, P. A control-oriented simplified building modelling strategy. In Proceedings of the BS 2013 13th Conference of International Building Performance Simulation Association, Chambéry, France, 26–28 August 2013; pp. 3682–3689. [Google Scholar]
- Fumo, N.; Rafe Biswas, M.A. Regression analysis for prediction of residential energy consumption. Renew. Sustain. Energy Rev. 2015, 47, 332–343. [Google Scholar] [CrossRef]
- Xu, M.; Watanachaturaporn, P.; Varshney, P.K.; Arora, M.K. Decision tree regression for soft classification of remote sensing data. Remote Sens. Environ. 2005, 97, 322–336. [Google Scholar] [CrossRef]
- Wang, Z.; Chen, Y.; Li, Y. Development of RC model for thermal dynamic analysis of buildings through model structure simplification. Energy Build. 2019, 195, 51–67. [Google Scholar] [CrossRef]
- Belić, F.; Hocenski, Ž.; Slišković, D. Thermal modeling of buildings with RC method and parameter estimation. In Proceedings of the International Conference on Smart Systems and Technologies SST, Osijek, Croatia, 12–14 October 2016; pp. 19–25. [Google Scholar] [CrossRef]
- Steindl, G.; Kastner, W.; Stangl, V. Comparison of data-driven thermal building models for model predictive control. J. Sustain. Dev. Energy Water Environ. Syst. 2019, 7, 730–742. [Google Scholar] [CrossRef] [Green Version]
- Viot, H.; Sempey, A.; Mora, L.; Batsale, J.C.; Malvestio, J. Model predictive control of a thermally activated building system to improve energy management of an experimental building: Part II—Potential of predictive strategy. Energy Build. 2018, 172, 385–396. [Google Scholar] [CrossRef] [Green Version]
- Tsilingiris, P.T. Parametric space distribution effects of wall heat capacity and thermal resistance on the dynamic thermal behavior of walls and structures. Energy Build. 2006, 38, 1200–1211. [Google Scholar] [CrossRef]
- Attoue, N. Smart Technology for Building Heating Optimization: Indoor Temperature Forecasting; Lille University: Lille, France, 2019. [Google Scholar]
- Wang, Z.; Chen, Y. Data-driven modeling of building thermal dynamics: Methodology and state of the art. Energy Build. 2019, 203, 109405. [Google Scholar] [CrossRef]


| Reference | Predicted Variables | ML Algorithms | Input Variables | Data Source | Key Finding | Performance Evaluation |
|---|---|---|---|---|---|---|
| [9] | Building energy needs | Multiple linear regression (MLR) | Cooling and heating degree day, external temperature, shape factor, opaque surface, and surface of glazed component | Non-residential building stock | MLR is a promising alternative in the field of building energy performance | Mean absolute error (MAE), mean square error (MSE), RMSE, R2, mean absolute percentage error (MAPE) |
| [22] | Energy consumption | MLP, LR SVM, GB RF | Meteorological data, temporal data, appliances, and light energy consumption | Two story building | MLP outperforms all other models | R2, RMSE, MAE, MAPE |
| [45] | Indoor temperature | MLP, radial basis function (RBF), group method of data handling (GMDH) | Solar irradiation, environmental temperature, outdoor relative humidity, wind speed, working hours, and occupancy | Laboratory of a university | MLP achieved the highest estimations | Coefficient of correlation, RMSE |
| [46] | Next day daily peak demand and consumption | MLR, RF MLP, boosting tree (BT) SVR, K-nearest neighbors (K-NN), multivariate adaptive regression splines (MARS) autoregressive integrated moving average (ARIMA) | Building power consumption, meteorological data, time of observations, | High-class skyscraper | The ensemble model produces better generalization performance | MAPE, RMSE, MAE, R2 |
| [47] | Comfort index | LR, DT, RF, GB, naive Bayes (NB), Logistic regression (LoR) ANN, SVM K-NN adaboost (AB) | Indoor environment, meteorological data, personal factors, building information | ASHRAE global thermal database | RF model has shown better prediction accuracy | MSE, R2 accuracy |
| [48] | Heating and cooling loads | RF, ET, GB | Building features | 12 buildings typologies | Tree-based ensemble learning is able to accurately model and predict building loads | MSE, MAE, MAPE |
| [49] | Hourly HVAC energy consumption | ANN, RF | Meteorological data, time of observations, number of guests for the day, number of rooms booked | Hotel in Spain | Both models have comparable predictive power | Mean absolute percentage deviation (MAPD), median absolute deviation (MAD), MAPE, coefficient of variation of root mean square error (CV-RMSE), R 2 |
| [50] | Heating energy consumption | RF, GB SVR extreme gradient boosting (XGB) | Meteorological data, occupancy data, time of day, historical heating consumption | Residential quarter | XGB exhibits the optimal efficiency RF exhibits optimal average accuracy The robustness of RF is the highest | RMSE, MAPE MAE, CV-RMSE |
| Input Parameters | Output Parameters |
|---|---|
| Heat Power | Indoor Temperature (at the center) |
| Outdoor Temperature Wall 1 | |
| Outdoor Temperature Wall 2 | Indoor Temperature Wall 1 |
| Outdoor Temperature History Wall 1 | |
| Outdoor Temperature History Wall 2 | Indoor Temperature Wall 2 |
| Indoor Temperature History |
| ML Algorithms | RMSE | R2 |
|---|---|---|
| ANN | 0.081 | 0.99965 |
| MLR | 0.332 | 0.99415 |
| DT | 0.268 | 0.99618 |
| RF | 0.295 | 0.99539 |
| ET | 0.159 | 0.99864 |
| GB | 0.218 | 0.99748 |
| XGB | 0.229 | 0.99721 |
| GBM | 0.842 | 0.96237 |
Publisher’s Note: MDPI stays neutral with regard to jurisdictional claims in published maps and institutional affiliations. |
© 2021 by the authors. Licensee MDPI, Basel, Switzerland. This article is an open access article distributed under the terms and conditions of the Creative Commons Attribution (CC BY) license (https://creativecommons.org/licenses/by/4.0/).
Share and Cite
Ramadan, L.; Shahrour, I.; Mroueh, H.; Chehade, F.H. Use of Machine Learning Methods for Indoor Temperature Forecasting. Future Internet 2021, 13, 242. https://doi.org/10.3390/fi13100242
Ramadan L, Shahrour I, Mroueh H, Chehade FH. Use of Machine Learning Methods for Indoor Temperature Forecasting. Future Internet. 2021; 13(10):242. https://doi.org/10.3390/fi13100242
Chicago/Turabian StyleRamadan, Lara, Isam Shahrour, Hussein Mroueh, and Fadi Hage Chehade. 2021. "Use of Machine Learning Methods for Indoor Temperature Forecasting" Future Internet 13, no. 10: 242. https://doi.org/10.3390/fi13100242
APA StyleRamadan, L., Shahrour, I., Mroueh, H., & Chehade, F. H. (2021). Use of Machine Learning Methods for Indoor Temperature Forecasting. Future Internet, 13(10), 242. https://doi.org/10.3390/fi13100242